harnessing the ring of fire - … · marcos overthrown/ people power revolution . 1997. asian...
TRANSCRIPT

HARNESSING THE RING OF FIRE:
Assessing the Impacts of Development Financing on Geothermal Development in
Indonesia and the Philippines By: Kathryn Chelminski
PhD Candidate in IR– Graduate Institute, Geneva Visiting Fellow – EPRG, University of Cambridge
25 October 2016 University of Cambridge, EPRG Energy & Environment seminar

International development finance for clean energy
• Priority of sustainable energy development underlined in Sustainable Development Goals and Paris Agreement o Need for financing for developing countries – barriers to
development • Institutional landscape of development support changing in
recent years o New finance mechanisms and international organizations o Between 2007-2015, national and multilateral development
banks have invested USD 877 billion in investments in clean energy (BNEF 2015).
• Expected to exceed USD 1 trillion by 2020 o South-South flows reached all time high o Post-Paris Agreement financial architecture?

Indonesia and the Philippines: Case Selection
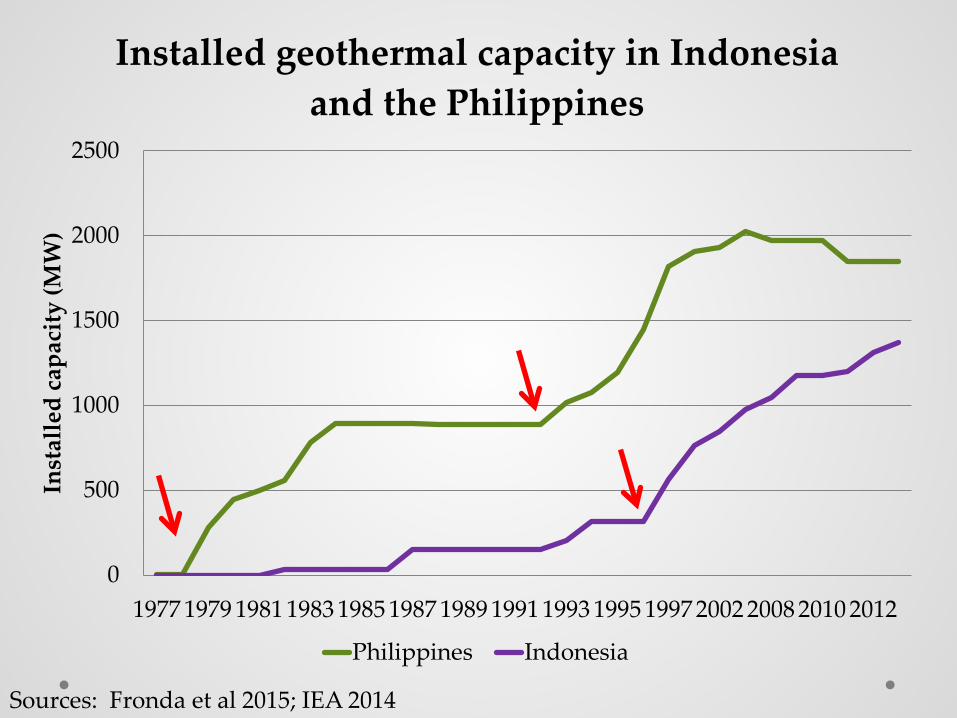
• Archipelagos in Ring of Fire resulting in geothermal abundance (2nd and 3rd largest producers) o YET, despite Indonesia’s superior geothermal reserves
(~29GW) it only developed 5% of its potential compared to the Philippines that has developed 56% of potential capacity (~4GW)
• Both engaged in clean energy governance and recipients of development assistance for renewable energy development
• Geothermal technology faces with a number of difficult barriers to development in comparison to other renewable energy technologies o High exploration risks and costs of development o Regulatory barriers o Human capacity barriers
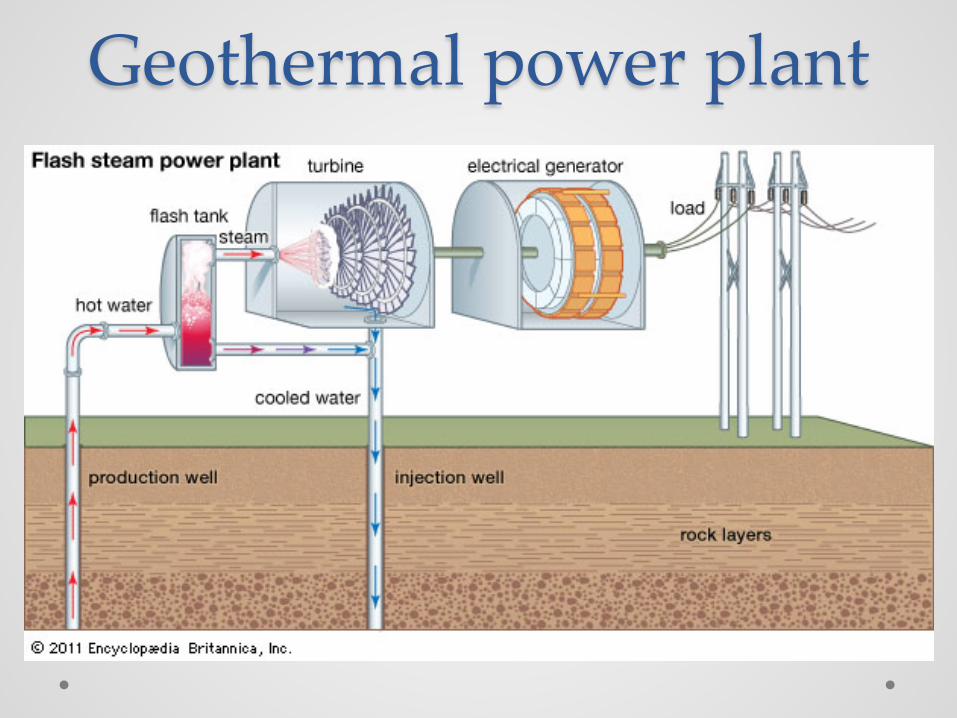
Geothermal power plant
Research questions
• Has clean energy finance impacted geothermal development in Indonesia and the Philippines?
• Can geothermal development be attributed to international financing versus domestic political interests?
Lit Review • Barriers to renewable energy development in developing
countries (Acemoglu and Zilibotti 2001; Acemoglu et al 2012; Dechezleprêtre et al 2012)
• Utility modifier? (Young and Levy 1990, Carbonnier, Brugger and Krause 2011)
• Social learning (Clark, Jager and van Eijndhoven 2001; Elkins and Simmons 2005, Dobbins et al 2007)
• Domestic political interests (Putnam 1988; Milner 1997; Milner and Keohane 1996; Frieden and Rogowski 1996)
• Counterfactual – no impact? CDM example (Chan 2015)
Research Design
• Qualitative analysis • Process tracing • Field research in Indonesia (2014 & 2015)
and the Philippines (2016) o 137 interviews at headquarter and field level
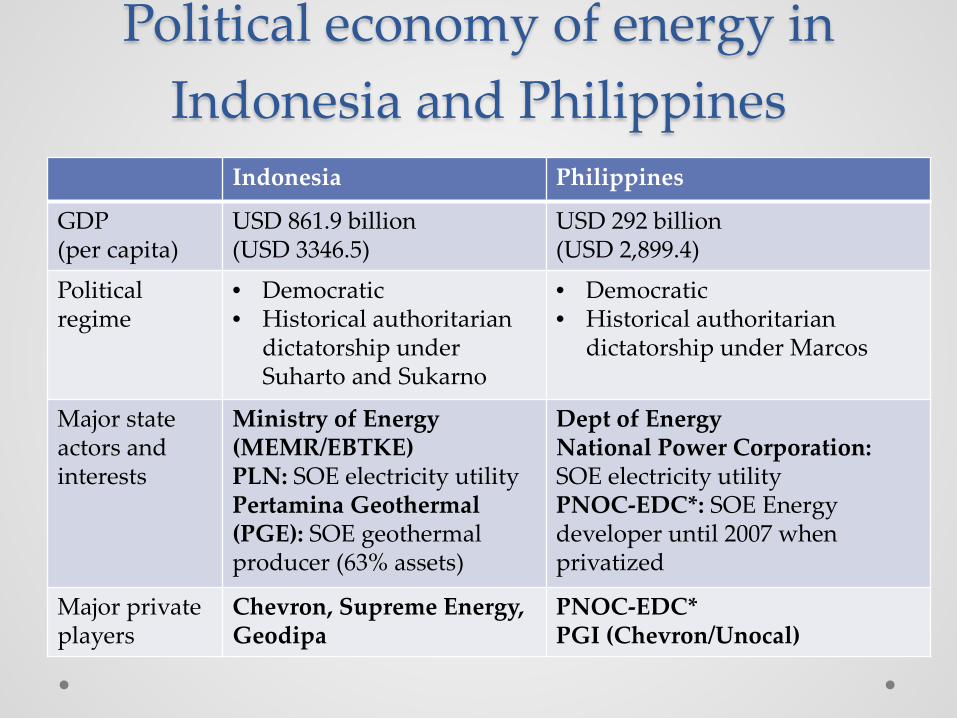
Political economy of energy in Indonesia and Philippines
Indonesia Philippines
GDP (per capita)
USD 861.9 billion (USD 3346.5)
USD 292 billion (USD 2,899.4)
Political regime
• Democratic • Historical authoritarian
dictatorship under Suharto and Sukarno
• Democratic • Historical authoritarian
dictatorship under Marcos
Major state actors and interests
Ministry of Energy (MEMR/EBTKE) PLN: SOE electricity utility Pertamina Geothermal (PGE): SOE geothermal producer (63% assets)
Dept of Energy National Power Corporation: SOE electricity utility PNOC-EDC*: SOE Energy developer until 2007 when privatized
Major private players
Chevron, Supreme Energy, Geodipa
PNOC-EDC* PGI (Chevron/Unocal)
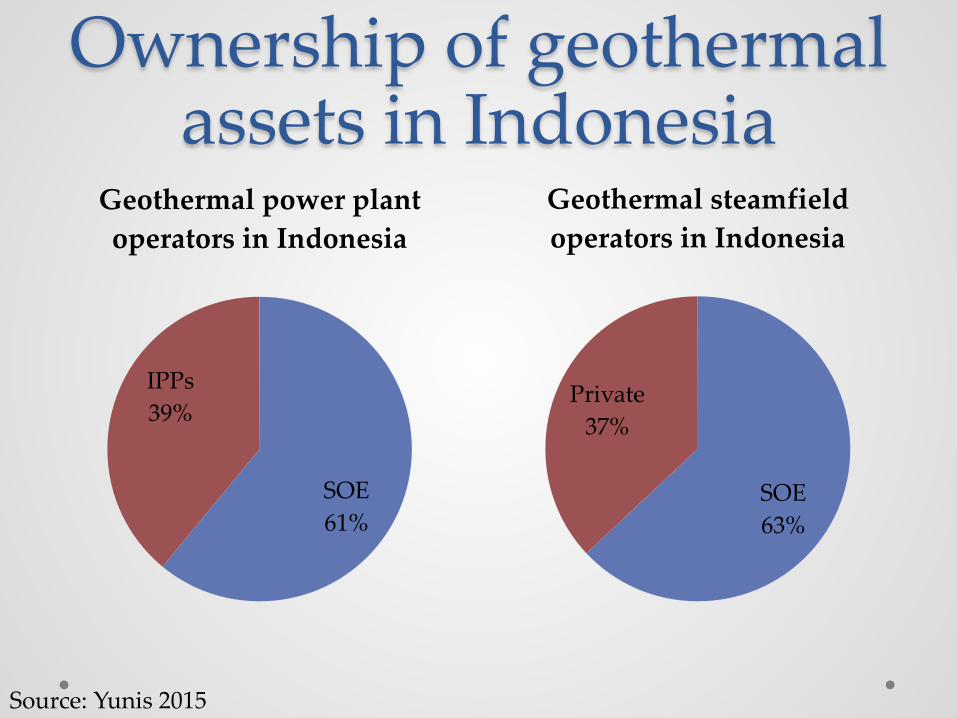
Ownership of geothermal assets in Indonesia
SOE 63%
Private 37%
Geothermal steamfield operators in Indonesia
SOE 61%
IPPs 39%
Geothermal power plant operators in Indonesia
Source: Yunis 2015
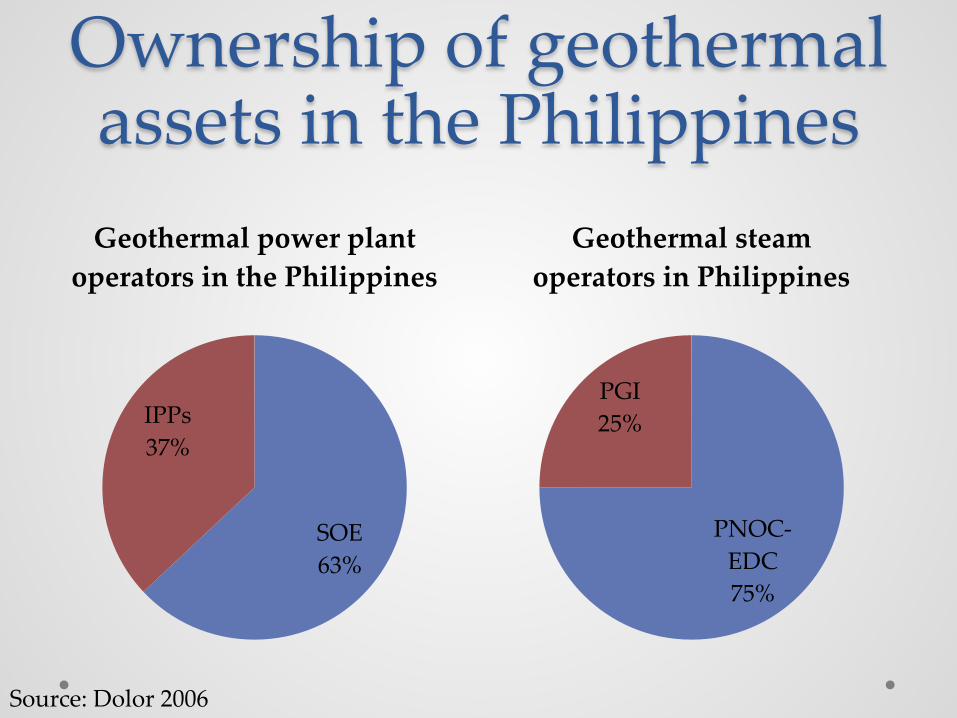
Ownership of geothermal assets in the Philippines
PNOC-EDC 75%
PGI 25%
Geothermal steam operators in Philippines
SOE 63%
IPPs 37%
Geothermal power plant operators in the Philippines
Source: Dolor 2006

National Energy Mix
Oil 19%
Hydro 19%
Geothermal 10%
Coal 32%
New RE 5%
Natural Gas 15%
Philippines Installed Generating Capacity (2015)
Source: Tharakan/ADB 2015 Source: DoE 2015
Oil 50%
Gas 20%
Coal 26%
Hydro 2%
Geothermal 1% New RE
1%
Indonesia Installed Generating Capacity (2011)
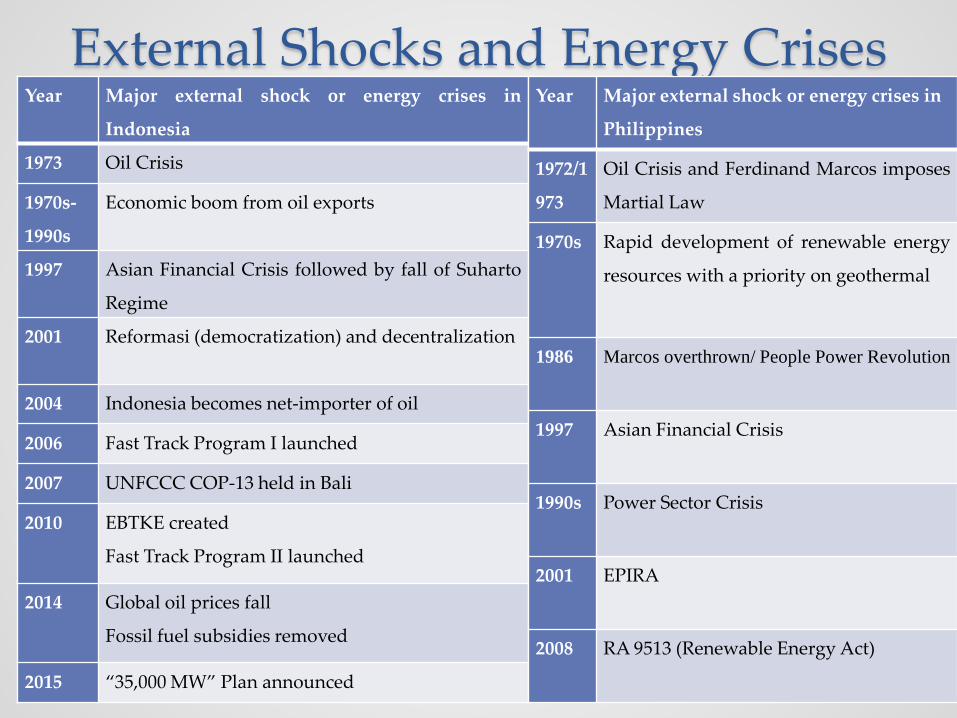
External Shocks and Energy Crises Year Major external shock or energy crises in
Indonesia
1973 Oil Crisis
1970s-
1990s
Economic boom from oil exports
1997 Asian Financial Crisis followed by fall of Suharto
Regime
2001 Reformasi (democratization) and decentralization
2004 Indonesia becomes net-importer of oil
2006 Fast Track Program I launched
2007 UNFCCC COP-13 held in Bali
2010 EBTKE created
Fast Track Program II launched
2014 Global oil prices fall
Fossil fuel subsidies removed
2015 “35,000 MW” Plan announced
Year Major external shock or energy crises in
Philippines
1972/1
973
Oil Crisis and Ferdinand Marcos imposes
Martial Law
1970s Rapid development of renewable energy
resources with a priority on geothermal
1986 Marcos overthrown/ People Power Revolution
1997 Asian Financial Crisis
1990s Power Sector Crisis
2001 EPIRA
2008 RA 9513 (Renewable Energy Act)

0
200
400
600
800
1000
1200
1400
1600
1800
200019
80
1982
1984
1986
1988
1990
1992
1994
1996
1998
2000
2002
2004
2006
2008
2010
2012
2014
(100
0 bb
l/d)
Indonesia's Crude Oil Production and Consumption
Crude Oil production Consumption
Source: EIA 2016
0
500
1000
1500
2000
2500
1977 1979 1981 1983 1985 1987 1989 1991 1993 1995 1997 2002 2008 2010 2012
Inst
alle
d ca
paci
ty (M
W)
Installed geothermal capacity in Indonesia and the Philippines
Philippines Indonesia
Sources: Fronda et al 2015; IEA 2014

Barriers to geothermal development Regulatory Barriers
Financial Barriers
Sociocultural Barriers
Human Capacity Barriers
Philippines • Protected areas and ancestral lands
• Permitting • Power sector
regime and offtake (EPIRA)
• Foreign ownership vs 40/60 clause
• Tariffs – FIT? • High costs of
development with new technology (lack of quality resources)
• Risks of no offtake
• Indigenous Peoples
• Historical* lack of technical workforce
Indonesia • Tariffs, permitting • Geothermal Law
2003 • Forestry Law • Foreign
ownership 45 (1>10 MW)/ 95 (<10 MW)
• Exploration risks
• High costs of development
• No financial mechanism
• Protests from local communities
• Energy development contestation
• Historical* lack of technical workforce
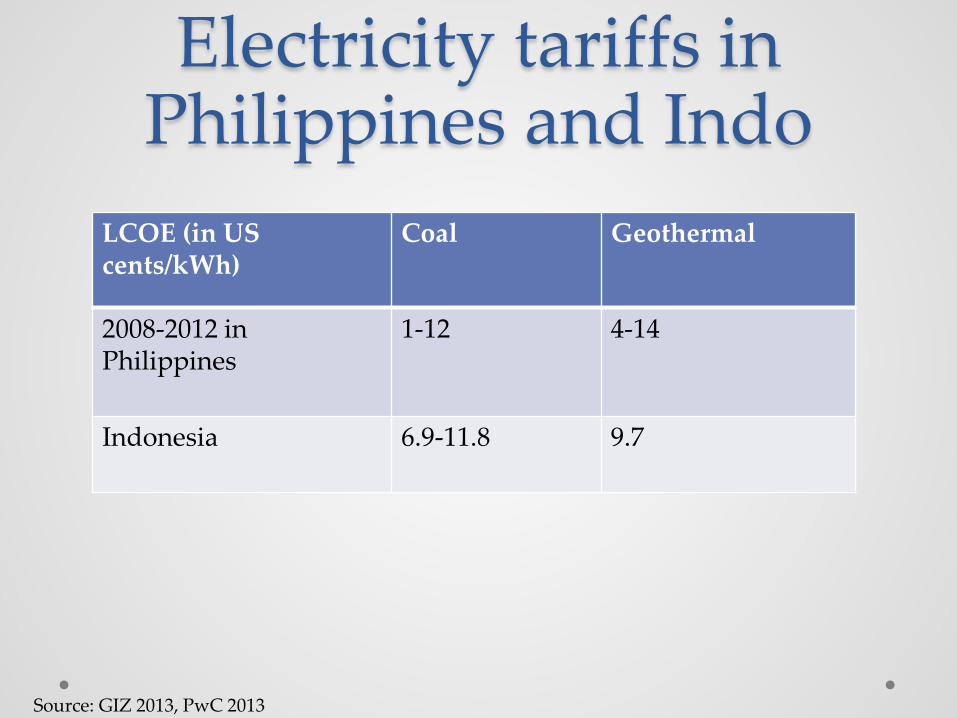
Electricity tariffs in Philippines and Indo
LCOE (in US cents/kWh)
Coal Geothermal
2008-2012 in Philippines
1-12 4-14
Indonesia 6.9-11.8 9.7
Source: GIZ 2013, PwC 2013
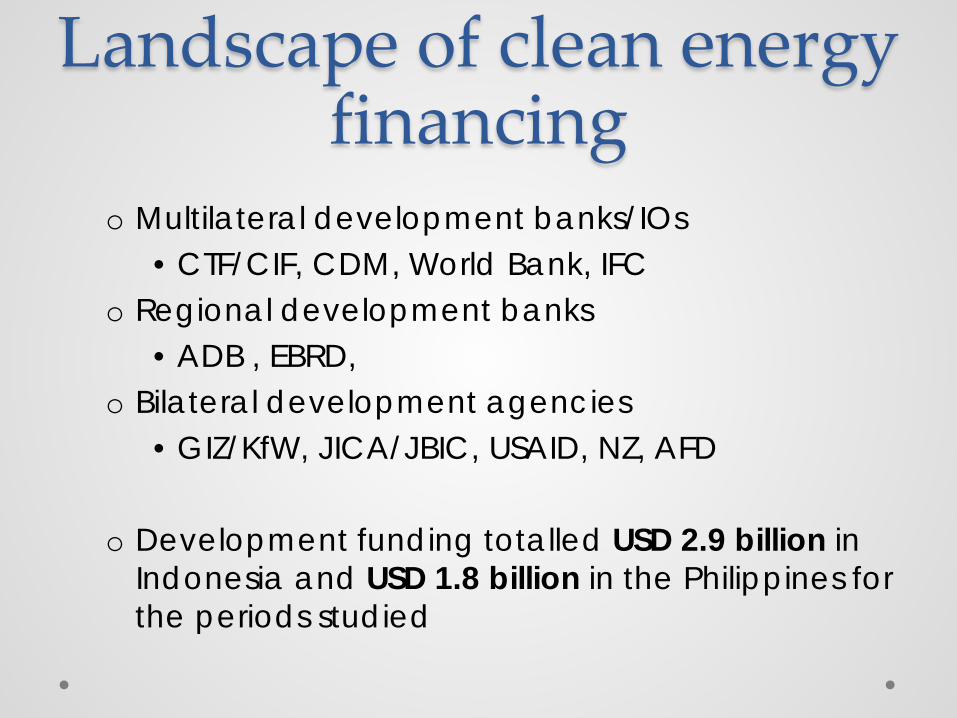
Landscape of clean energy financing
o Multilateral development banks/IOs • CTF/CIF, CDM, World Bank, IFC
o Regional development banks • ADB , EBRD,
o Bilateral development agencies • GIZ/KfW, JICA/JBIC, USAID, NZ, AFD
o Development funding totalled USD 2.9 billion in
Indonesia and USD 1.8 billion in the Philippines for the periods studied

Indonesia Geothermal Projects IRR and CDM finance
Project title IRR % excl.
CER
IRR
benchmark Investment in US$ millions
Kamojang Unit 4 Geothermal 15.31 17.10* 84.0
Wayang Windu Phase 2 Geothermal Power Project 17.62 18.96 181.4
Patuha Geothermal Project 6.73 14.71 109.7
Project Ulubelu Unit 3 – 4 15.98 19.67 271.0
Project Lumut Balai Unit 1 – 2 13.99 20.09 281.6
Gunung Rajabasa Geothermal Power Plant 12.18 17.10 682.0
Liki Pinangawan Muaralaboh Geothermal Power
Plant
11.36 17.10 794.0
Rantau Dedap Geothermal Power Plant 10.07 17.10 755.6
Project Lumut Balai Unit 3 – 4 16.08 17.92 276.4
Project Kamojang Unit 5 PT. Pertamina
Geothermal Energy
14.47 17.91 83.2
Project Karaha Unit 1 PT. Pertamina Geothermal
Energy
14.92 17.91 81.6
Lahendong Unit 5 & Unit 6 Geothermal Project 8.71 17.10 211.0
Source: UNEP DTU 2016
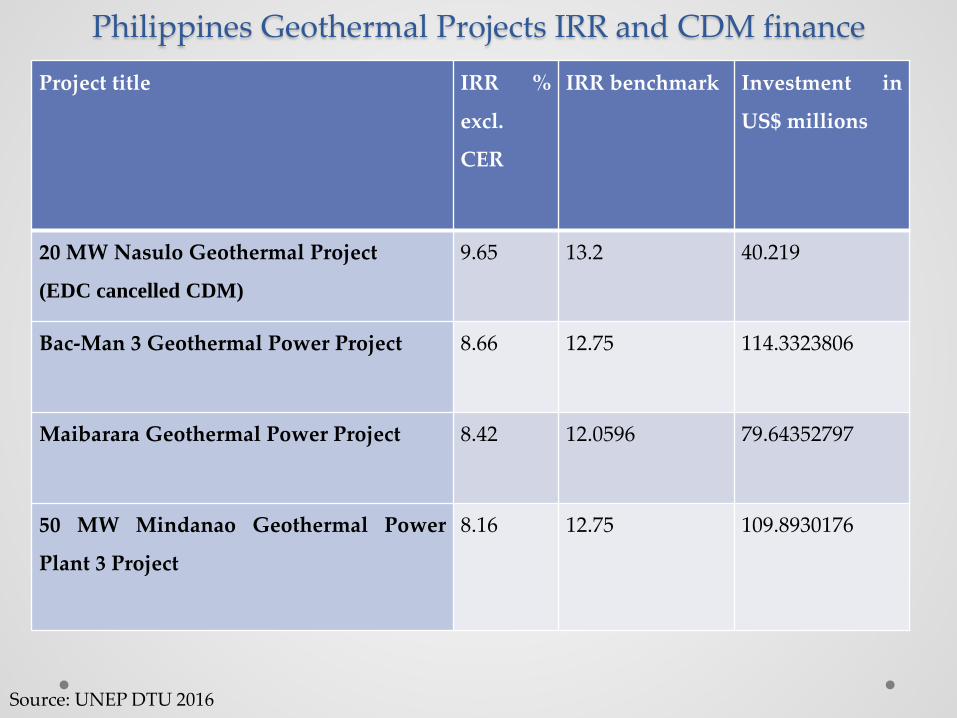
Philippines Geothermal Projects IRR and CDM finance Project title IRR %
excl.
CER
IRR benchmark Investment in
US$ millions
20 MW Nasulo Geothermal Project
(EDC cancelled CDM)
9.65 13.2 40.219
Bac-Man 3 Geothermal Power Project 8.66 12.75 114.3323806
Maibarara Geothermal Power Project 8.42 12.0596 79.64352797
50 MW Mindanao Geothermal Power
Plant 3 Project
8.16 12.75 109.8930176
Source: UNEP DTU 2016
0
200
400
600
800
1000
1200
1400
2003
2004
2005
2006
2007
2008
2009
2010
2011
2012
2013
2014
2015
Aid
in U
SD m
illio
ns
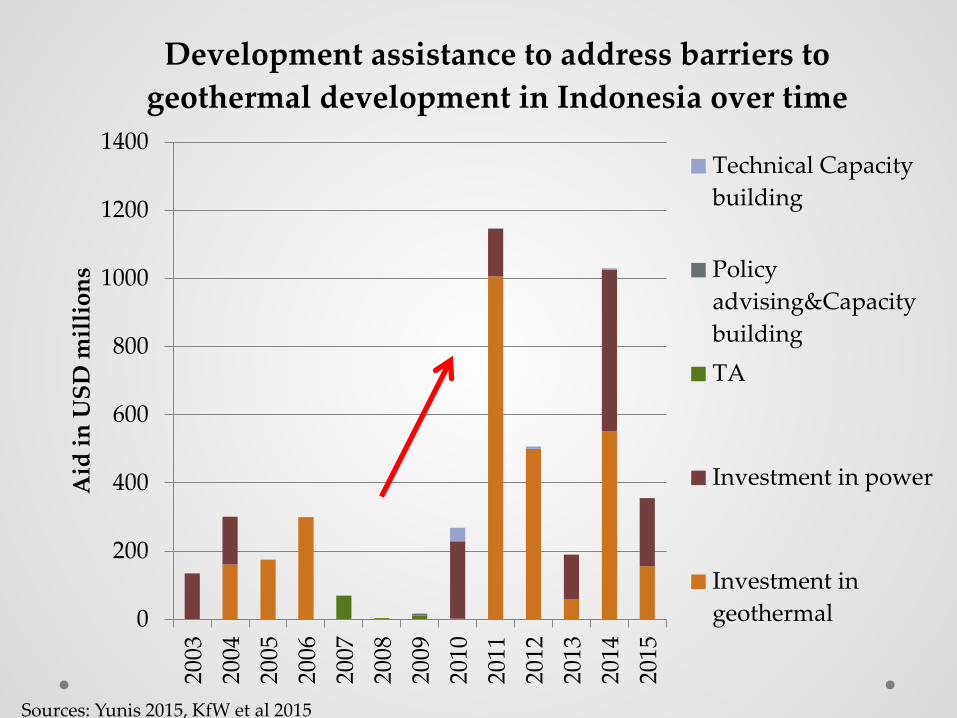
Development assistance to address barriers to geothermal development in Indonesia over time
Technical Capacitybuilding
Policyadvising&CapacitybuildingTA
Investment in power
Investment ingeothermal
Sources: Yunis 2015, KfW et al 2015
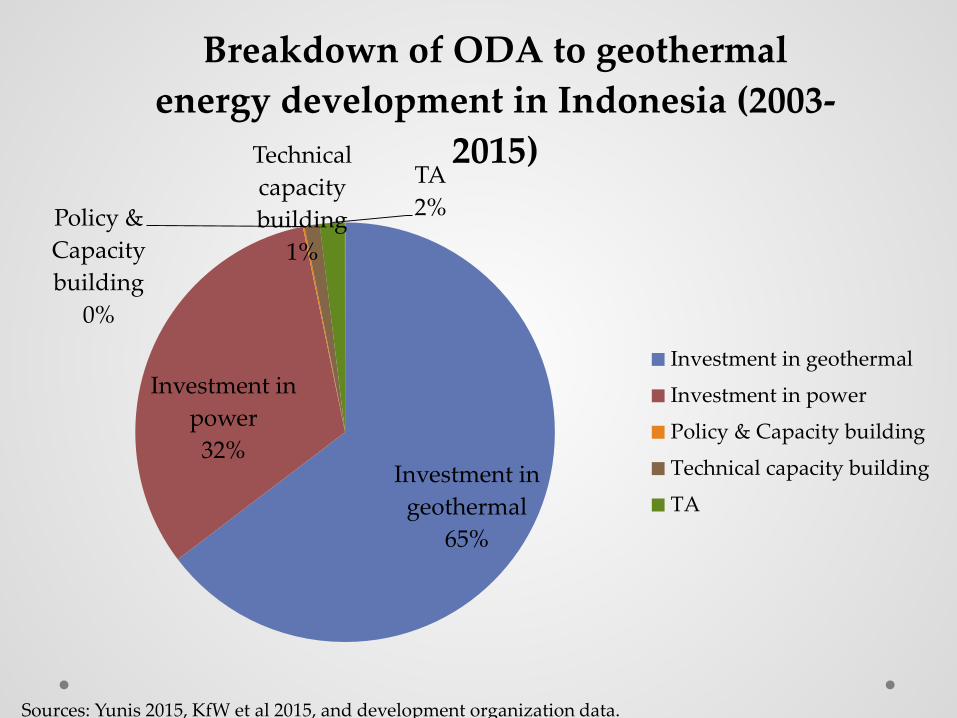
Investment in geothermal
65%
Investment in power 32%
Policy & Capacity building
0%
Technical capacity building
1%
TA 2%
Breakdown of ODA to geothermal energy development in Indonesia (2003-
2015)
Investment in geothermal
Investment in power
Policy & Capacity building
Technical capacity building
TA
Sources: Yunis 2015, KfW et al 2015, and development organization data.

0
100
200
300
400
500
600
USD
in m
illio
ns
Earmarked breakdown of ODA to geothermal development in Philippines over time
Technical capacitybuildingPolicy advising&Capacity buildingTA
Investment in powersectorInvestment ingeothermal
Sources: World Bank 2016a, ADB 2016, JICA 2016
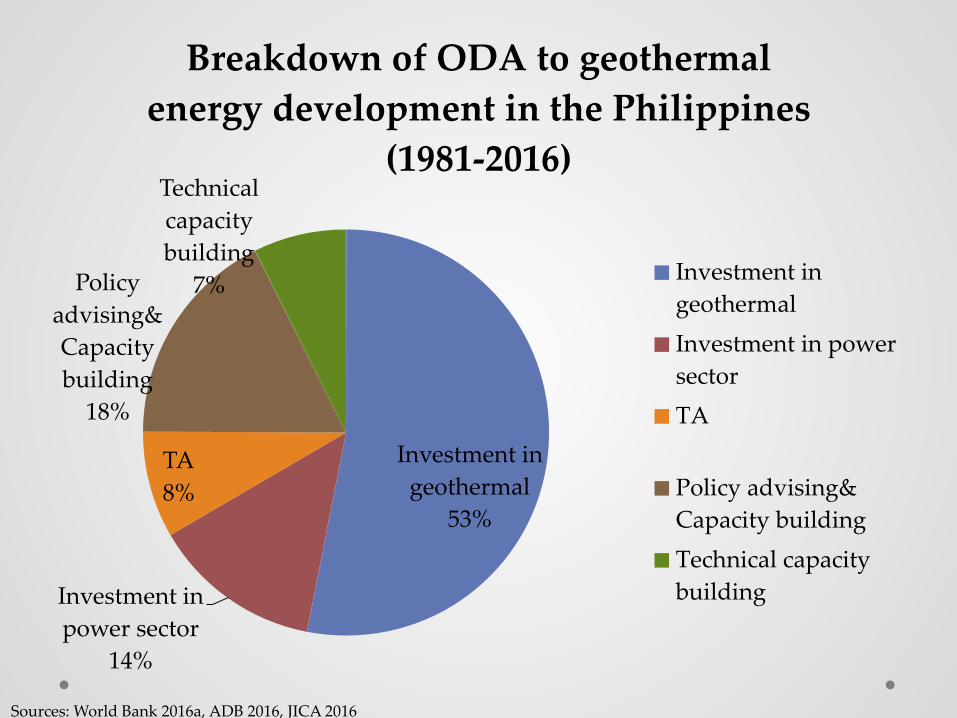
Investment in geothermal
53%
Investment in power sector
14%
TA 8%
Policy advising& Capacity building
18%
Technical capacity building
7%
Breakdown of ODA to geothermal energy development in the Philippines
(1981-2016)
Investment ingeothermalInvestment in powersectorTA
Policy advising&Capacity buildingTechnical capacitybuilding
Sources: World Bank 2016a, ADB 2016, JICA 2016
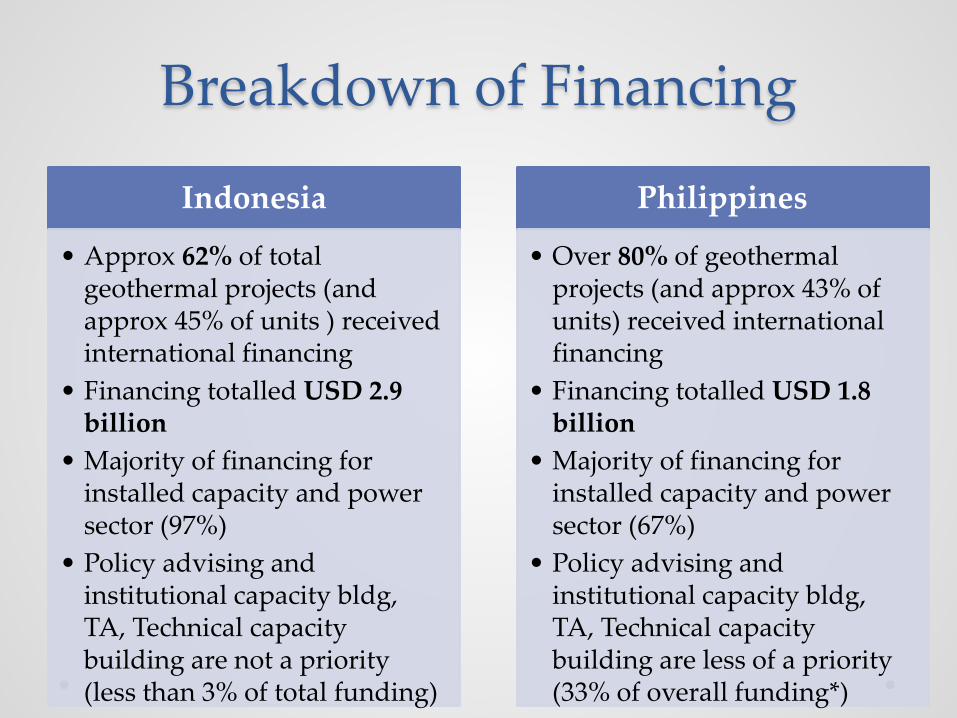
Breakdown of Financing
Indonesia
• Approx 62% of total geothermal projects (and approx 45% of units ) received international financing
• Financing totalled USD 2.9 billion
• Majority of financing for installed capacity and power sector (97%)
• Policy advising and institutional capacity bldg, TA, Technical capacity building are not a priority (less than 3% of total funding)
Philippines
• Over 80% of geothermal projects (and approx 43% of units) received international financing
• Financing totalled USD 1.8 billion
• Majority of financing for installed capacity and power sector (67%)
• Policy advising and institutional capacity bldg, TA, Technical capacity building are less of a priority (33% of overall funding*)
Discussion • Financial incentives
• Social learning aspects of financing
• Domestic political interests
• Measurable impact? Counterfactual
• Limitations with research
Thank you!
Questions?
Kathryn Chelminski PhD Candidate in International Relations – Graduate Institute, Geneva Visiting Fellow – EPRG, University of Cambridge [email protected] or [email protected]