harnessing data to empower a sustainable future
TRANSCRIPT

Harnessing data to empower a sustainable futureTechnology and emissions report

Contents
Forewords
Overview - The role of ICT sector
Section 1
Deep Dive: The ICT sector carbon footprint
DataAccessTrafficGrowth
ICT Energy Demand
ICT Carbon Emissions
Future Scenarios
Section 2
Helping other sectors reduce their carbon footprint
Electricity and Heat
Agriculture
Manufacturing
Smart Living: Buildings and Transport
Section 3
Conclusion and Reccomendations
Appendix Deep Dives
Mobile Networks
Fixed Networks
Data Centres
Methodology
References
3
5
8
17
23
25
30
338
9
11
15
26
27
2918
19
20
21
2Harnessing data to empower a sustainable futureTechnology and emissions report

Foreword
At BT, our purpose is to connect for good. Our ambition is to be the world’s most trusted connector of people, devices and machines by 2030. We will only get there if we help our customers build the bright sustainable future we all aspire to – and that means dramatically reducing emissions.
We’ve been a leader on climate and sustainability action for almost 30 years and we’ve pledged to be a net zero emissions business by 2030 for our own operations, and 2040 for our supply chain and customer emissions. BT reduced its emissions intensity by 80% between 2010 and 2016.
Five years ago, we pledged to further reduce the carbon emissions intensity of our business by 87% byMarch2031,launchingoneoftheworld’sfirst Paris-aligned science based targets. Since setting the target, we have:
• Reduced the carbon intensity of our operations by 57%
• Cut supplier emissions by 19%, against a target of 42% by March 2031
• Linked 10% of our annual bonus to goals on digital skills and carbon reduction
• Completed the switch to 100% renewable electricity worldwide
•Outlinedplanstotransitionmostofourfleet to electric vehicles by 2030
As the world looks to recover from the Covid-19 crisis, we have an opportunity to use our tech, innovation andinfluencetoputclimateactionattheheartof the economic recovery.
Never before has connectivity been so integral to so muchofourlives.BT’sfullfibrebroadbandand5Gmobile networks will underpin many of the innovative solutions needed to achieve a net zero carbon economy - supporting everything from home-working through to the development of smart cities and enabling the Internet of Things.
Asdatatrafficgrowssignificantlyoverthenextdecade,weexpecttheenergyprofilesupportingthatgrowthtostaybroadlyflat.Thisisatrendwehaveseen over the last ten years and it is expected to continue.
Our work with Accenture looks at how carbon emissions can be decoupled from growth in data traffic.ItalsostudieshowtheICTindustryisleadingthe way in terms of emissions reductions through net zero targets and renewable energy consumption, as wellasdrivingsignificantabatementinothersectors.
With a customer base of 30 million households and over a million SME customers, BT is well placed to help them and others cut their carbon footprint. Working with partners like Accenture, we’re also able to set the record straight around the ICT sector and the emissions it’s responsible for, as well as the saving it enables. Together, we can help to build back better by creating a fairer, more resilient and low carbon society.
Philip Jansen Chief Executive BT Group
3Harnessing data to empower a sustainable futureTechnology and emissions report

Foreword
At Accenture, we believe sustainability is the new digital. It is perhaps the most powerful force of change in our generation, transforming how we live and work, driving new value and growth and permeating everything we do.
Sustainability is also a promise. As a company, we see it as one of our greatest responsibilities, embedding sustainability—by design—into every aspect of what we do for ourselves and for everyone we work with. It is our Accenture Sustainability Value Promise. This includes the ambitious environmental goals and commitments we have made to the future:
• We have pledged to do our part to keep global warmingbelow1.5˚throughtheUNGlobalCompact’s Business Ambition Pledge.
• By 2025, we will achieve net-zero emissions, focusing on actual reductions in our emissions and investing in nature-based solutions that will remove carbon from the atmosphere.
• By 2025, we will reuse or recycle 100% of our e-waste are committed to eliminating single-use plastics.
• By 2025, we will develop plans to reduce the impactofflooding,droughtandwaterscarcityonour business and our people in high-risk areas.
• We are the largest professional services company to date to have a science-based target approved by the Science Based Targets initiative.
Underpinningthesecommitments,andthetransformation we all must make as industry leaders, governments, and communities, are digital technologies—particularly5G,fibreandthecloud—which we examine in this report. These technologies are key to unlocking the innovation needed to achieve theUNSustainableDevelopmentGoalsandtounleash growth as we reimagine our industries and our world to build back better.
That is why we are so proud of our ongoing work with BT, helping the company accelerate and achieve theirNetZeroambitions,includingfindingwaystoimproveenergyconsumptionsodatatrafficcancontinue to grow without harming the planet. We have put our 360º value framework at the heart of our relationship—which means thinking about and delivering value to all of BT’s stakeholders—so we can raise the bar for what we can accomplish together toward a better world for all.
Julie Sweet Chair & CEO Accenture
4Harnessing data to empower a sustainable futureTechnology and emissions report

The power to change – the role of the ICT sector
We live in a world more connected than ever, with 70% of individuals worldwide forecasted to be using the internet by 20231, as part of the United Nation’s efforts for universal connectivity by 20302.
The COVID-19 pandemic accelerated the move to more remote work and the need for always-on connectivity,asthehomebecametheoffice.By2030, we can expect to see 50 billion connected devices, twice the number in 2018.3 Mobile data usage will be 10-14 times higher by 2030, given growing data intensity with high-quality streaming and similar services.4
No surprise, then, that data traffic is predicted to grow eight-fold by 2030 (see Figure 1).
Thisappetiteformoredatacouldhaveasignificantcarbon footprint depending on the source of energy that is fuelling that data. There is good news, however. The Information Communications and Technology (ICT) sector is already acting to reduce its carbon emissions by purchasing renewable energy, setting science-based targets and by making data more
*CompanyPowerPurchasingAgreementsandRenewableEnergyCertificatestakenintoaccount
Figure 1: Forecasted ICT Operational Carbon Emissions and Access Data Traffic.
Operational Emissions Forecasted Access Data Traffic
Operational Emissions with PPAs and RECs*
ICT
Ope
ratio
nal C
arbo
n Em
issi
ons
(Mt C
O2e
)
Dat
a A
cces
s Tr
affic
(ZB)
450
400
350
300
250
200
0
25
20
15
10
5
0
2020 2021 2022 2023 2024 2025 2026 2027 2028 2029 2030
150
100
50
5Harnessing data to empower a sustainable futureTechnology and emissions report

energyefficient.So,evenasdemandfordatarisesexponentially, the amount of energy used to run that data will not rise in the same incremental way.
In fact, carbon emissions from the ICT sector are expected to drop by as much as 40 percent by 2030 (see Figure 1), duetosignificantactionsbeingtakenbythesectortoimproveenergyefficienciesacross three technology groups: mobile networks, fixednetworksanddatacentres.ThispictureisalsomirroredintheUK,wherecarbonemissionscoulddecrease by up to 68% over the next decade (see Figure 2).
What’s more, these three technologies have implications far beyond reducing the ICT sector’s carbon footprint. If adopted at scale, they can go a long way in reducing carbon emissions from other sectors as well—substantially higher than the operational emissions from the sector itself.
Figure 2: UK ICT Operational Emissions and Data Access Traffic Growth.
Operational Emissions Forecasted Access Data Traffic
Operational Emissions with PPAs and RECs*
*CompanyPowerPurchasingAgreementsandRenewableEnergyCertificatestakenintoaccount
ICT
Ope
ratio
nal E
mis
sion
s (k
t CO
2e)
Dat
a A
cces
s Tr
affic
(EB)
1800
1600
1400
1200
1000
800
0
700
0
2020 2021 2022 2023 2024 2025 2026 2027 2028 2029 2030
600
500
400
300
200
100
600
400
200
6Harnessing data to empower a sustainable futureTechnology and emissions report

As we demonstrate in this report, by harnessing these same technologies, global carbon emissions could decrease by 17% in the next decade across four emissions-intensive sectors: electricity and heat; agriculture; manufacturing; and smart living, including transportation and buildings.
To seize the full potential impact of these technologies to decarbonise the economy, the ICT sector can take a number of steps. That includes meeting ambitious carbon reduction targets, continuing to prioritise energyefficiencyacrossnetworksandoperations,migratingtothemostenergy-efficientmobilenetworks and taking advantage of new technologies suchas5Gandcloud.Atthesametime,sustainabletechnologiescansignificantlyreduceothersectors’carbon footprint, which will be more critical than ever in the next decade.
77Harnessing data to empower a sustainable futureTechnology and emissions report

Section 1 Deep dive: The ICT sector carbon footprint
To understand the carbon impact of our increasingly digital world, and the role of the ICT sector to slow that pace, in its own sector and others, let’s look at somekeyfactsondataaccesstrafficgrowth,ICTenergy demand and ICT carbon emissions.
DataAccessTrafficGrowth
By2030,wepredictglobalaccessdatatraffic,representing the amount of data consumed by individualsmovingacrossthefixedandmobileaccessnetworks(i.e.:thedatatrafficoverwifior ethernet connections, and over mobile radio connections), will reach over 22 ZB, growing over eightfold between 2020 and 2030 (see Figure 3).
This is largely driven by growth in the number of connections and devices, in addition to increases in high-quality data volume.
Figure 3: ICT Energy Demand and Access Data Traffic.
Forecasted Energy Demand Forecasted Access Data Traffic
8Harnessing data to empower a sustainable futureTechnology and emissions report
ICT
Ener
gy D
eman
d (T
Wh)
Dat
a A
cces
s Tr
affic
(ZB)
600
500
400
300
200
100
0
25
20
15
10
5
0
2020 2021 2022 2023 2024 2025 2026 2027 2028 2029 2030

ICT Energy Demand
Despitethegrowthindatatraffic,energydemandisexpectedtoonlygrowata1.3%CAGRoverthenext decade (see Figure 4), due to improvements in networkanddataprocessingefficiencies.Thisisasignificantstepforthesector,asenergydemand–inthe form of electricity – is currently responsible for the majority of ICT operational emissions.1
What growth we do see in energy demand is largely drivenbythefixednetworkanddatacentres,whichcombined are expected to make up 63% of total energy demand by 2030 (see Figure 4).
Forfixednetworks,thegrowthinenergydemandstems from the dual running of multiple networks at once, creating redundancies and limiting how the network can be optimised for the anticipated growth indata.Whilefixednetworksrepresentonly6%ofICToperational energy demand, dual running networks could potentially triple their energy demand over the decade.
YettransitioningfixedaccessdataawayfromFibretothe Cabinet (FTTC) to Fibre to the Home (FTTH), along withclosingless-efficientlegacytechnology,couldlead to a potential seven-fold improvement in energy efficiency.Historically,fixednetworkefficiencygainsdouble every two years.5
Figure 4: Forecasted ICT Operational Energy Demand.
ICT
Sect
or E
nerg
y D
eman
d (T
Wh)
600
0
2020 2021 2022 2023 2024 2025 2026 2027 2028 2029 2030
500
400
300
200
100
Mobile Network Fixed Network Data Centres
9Harnessing data to empower a sustainable futureTechnology and emissions report
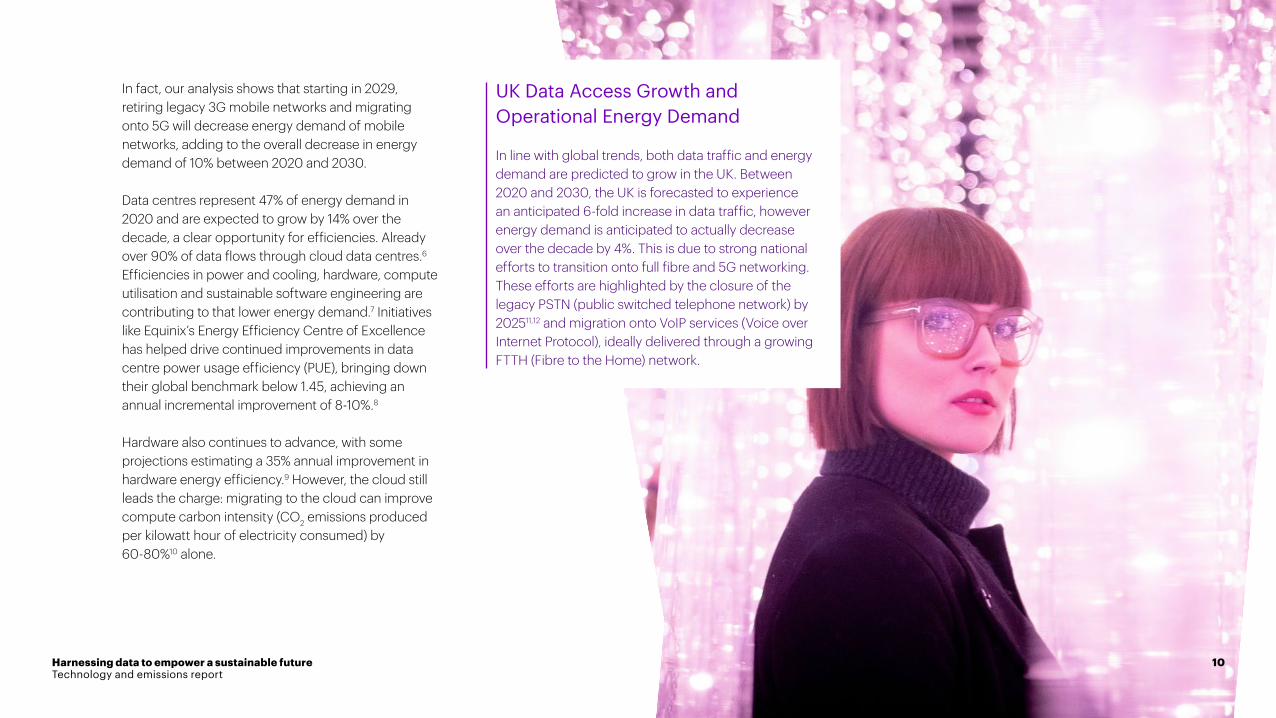
In fact, our analysis shows that starting in 2029, retiringlegacy3Gmobilenetworksandmigratingonto5Gwilldecreaseenergydemandofmobilenetworks, adding to the overall decrease in energy demand of 10% between 2020 and 2030.
Data centres represent 47% of energy demand in 2020 and are expected to grow by 14% over the decade,aclearopportunityforefficiencies.Alreadyover90%ofdataflowsthroughclouddatacentres.6 Efficienciesinpowerandcooling,hardware,computeutilisation and sustainable software engineering are contributing to that lower energy demand.7 Initiatives likeEquinix’sEnergyEfficiencyCentreofExcellencehas helped drive continued improvements in data centrepowerusageefficiency(PUE),bringingdowntheir global benchmark below 1.45, achieving an annual incremental improvement of 8-10%.8
Hardware also continues to advance, with some projections estimating a 35% annual improvement in hardwareenergyefficiency.9 However, the cloud still leads the charge: migrating to the cloud can improve compute carbon intensity (CO2 emissions produced per kilowatt hour of electricity consumed) by 60-80%10 alone.
UK Data Access Growth and Operational Energy Demand
Inlinewithglobaltrends,bothdatatrafficandenergydemandarepredictedtogrowintheUK.Between2020and2030,theUKisforecastedtoexperienceananticipated6-foldincreaseindatatraffic,howeverenergy demand is anticipated to actually decrease over the decade by 4%. This is due to strong national effortstotransitionontofullfibreand5Gnetworking.These efforts are highlighted by the closure of the legacy PSTN (public switched telephone network) by 202511,12 and migration onto VoIP services (Voice over Internet Protocol), ideally delivered through a growing FTTH (Fibre to the Home) network.
10Harnessing data to empower a sustainable futureTechnology and emissions report

ICT Carbon Emissions
Significantcommitmentstorenewablesandscience-based emissions reduction targets across the sector will contribute to decreasing carbon intensity. Targets are considered ‘science-based’ if they are in line with the conclusions of the latest climate science on what is necessary to meet the goals of the Paris Agreement – limiting global warming to well-below 2°C above pre-industrial levels and pursuing efforts to limit warming to 1.5°C.13
Over the next decade, carbon emissions from the ICT sectorareforecastedtoremainflat.That’sbecauseasdatatrafficcontinuestogrow,energyefficienciesandthe decarbonisation of the energy grid are likely to be sufficientinordertomaintain2020ICToperationalemission levels.
However, to further this analysis, and take the actions, commitments, and targets of the ICT sector into account (using a market-based approach rather than a locations-based approach – see the Methodology section for more information), we could actually see these emissions be 53 Mt CO2e lower in 2020, and decrease by 40% over the same time period. In this way, carbon emissions do not follow the same incrementalpathasincreasingdatatraffic (see Figure 5).
Figure 5: Forecasted ICT Operational Carbon Emissions and Access Data Traffic.
Operational Emissions Forecasted Access Data Traffic
Operational Emissions with PPAs and RECs*
*CompanyPowerPurchasingAgreementsandRenewableEnergyCertificatestakenintoaccount11Harnessing data to empower a sustainable future
Technology and emissions report
ICT
Ope
ratio
nal C
arbo
n Em
issi
ons
(Mt C
O2e
)
Dat
a A
cces
s Tr
affic
(ZB)
450
400
350
300
250
200
0
25
20
15
10
5
0
2020 2021 2022 2023 2024 2025 2026 2027 2028 2029 2030
150
100
50

Consider that over a third of mobile operators havealignedtotheUnitedNations“RacetoZero”campaign, and 65% of the industry has already committed to reaching their science-based emissions reductions target over the next ten years.14
Further, 13 of the top 15 cloud providers have publicly committed to being carbon neutral by or before 2035, and already operating 82% of cloud data centres (based on provider revenue) on renewable energy sources.15
These pledges have not only drastically reduced the carbon footprint of the ICT sector, but have also incentivised further progress on developing a renewable grid. Technology providers are leading the charge in global Power Purchase Agreement (PPA) volumes16, and renewable microgrids have additionally begun to appear17, with investments from major players such as Microsoft and Facebook.18 This shows a potential step away from traditional energy suppliers, along with detailed investigations to meet hourly renewable energy demand.19
Breaking down ICT emissions by our three technology groupings (see Figure 6) we begin to see further trends come to light:
12Harnessing data to empower a sustainable futureTechnology and emissions report
Figure 6: Forecasted ICT Operational Carbon Emissions by Technology.
ICT
Ope
ratio
nal C
arbo
n Em
issi
ons
(Mt C
O2 e
)
140
0
2020 2021 2022 2023 2024 2025 2026 2027 2028 2029 2030
120
100
80
60
40
20
Mobile Network Fixed Network Data Centres

• Mobile Networks: 64% of emissions will be generated from mobile networks, decreasing over the decade to 56%, largely due to transitioning fromalower-efficiencylegacynetworktoanincreasinglyenergy-efficient5Gnetwork.Fullyretiringlegacy3Gnetworkswillbecriticaltoreaching our carbon emission targets where energy is not sourced renewably.
• Fixed Networks: Only 9% of emissions will bethroughfixednetworks,increasingto25%over the next decade, largely due to the limited globalrolloutoffibre,limitingtheadoptionofthetechnology,inadditiontoconservativeefficiencyimprovements across the decade.
• Data Centres: 27% of emissions will be generated by data centres, decreasing to 20% in 2030duetothesignificanteffortsfromthesectorto reach 100% renewable electricity for their cloudplatformsanddrivecontinuedefficienciesin their data centres. Notably, leaders in the space including Amazon20,Google21, Microsoft22, and Salesforce23 already run their cloud data centres on 100% renewable electricity, setting a market standard which others are quickly adopting24,25.
13Harnessing data to empower a sustainable futureTechnology and emissions report
13

UK ICT companies are leading global trends in PPAs and RECs
Similartothegloballandscape,UKICToperationalcarbon emissions are forecasted to decrease by 68% over the next decade due to both improvements and efforts in reducing energy consumption, as well as a forecasted 67% improvement in the carbon intensityoftheUK’senergygrid(seeFigure7).UKICT operational emissions however will decline even further with renewable investments being made by UKICTcompanies.Comparedtotheglobalaverage,ahigherproportionofUKICTcompaniesarecommitted to renewable PPAs and Renewable Energy Certificates(RECs)overthedecade.Forexample,BT as a leader in the space, already source 100% of their electricity through renewables and have been investing in renewables since 2002.26 While many global players are taking measurable steps in the right direction27, more ambitious and wide-spread commitments around the globe are needed to avert the climate crisis.
Figure 7: UK ICT Operational Emissions and Data Access Traffic Growth.
Operational Emissions Forecasted Access Data Traffic
Operational Emissions with PPAs and RECs*
*CompanyPowerPurchasingAgreementsandRenewableEnergyCertificatestakenintoaccount14Harnessing data to empower a sustainable future
Technology and emissions report
ICT
Ope
ratio
nal E
mis
sion
s (k
t CO
2e)
Dat
a A
cces
s Tr
affic
(EB)
1800
1600
1400
1200
1000
800
0
700
0
2020 2021 2022 2023 2024 2025 2026 2027 2028 2029 2030
600
500
400
300
200
100
600
400
200

Future Scenarios
Although the ICT sector was recently declared a “breakthrough”28industrybytheGSMAssociation(GSMA)followingthestronginvestmentinrenewables and due to their ambitious net zero targets, more can still be done to further reduce the sector’s operational footprint.
Overall, there is further opportunity to drive an additional 50% in carbon savings through improved efficienciesandgreateradoptionofthethreetechnologies over the next 10 years. This equates to approximately 35 Mt in CO2e savings from the sector, or the equivalent of taking over 13 thousand cars off the road.
Greateradoptionofthesetechnologiesalonemay lead to a reduction of 24 Mt CO2e (34%) from forecasted emissions, in large part driven by the sensitivities in the mobile network to new, more efficienttechnologies–inparticulartheadoptionofmoreefficient5G.Greateradoptioncouldbedriven by increased efforts from the public or private sector to roll out at scale use cases to encourage 5Gadoption,orfromanimprovedarticulationofthe value of these new technologies for users. This reduction over the ten-year period can be seen in Figure8“HighAdoptionScenario”trendline.
15Harnessing data to empower a sustainable futureTechnology and emissions report
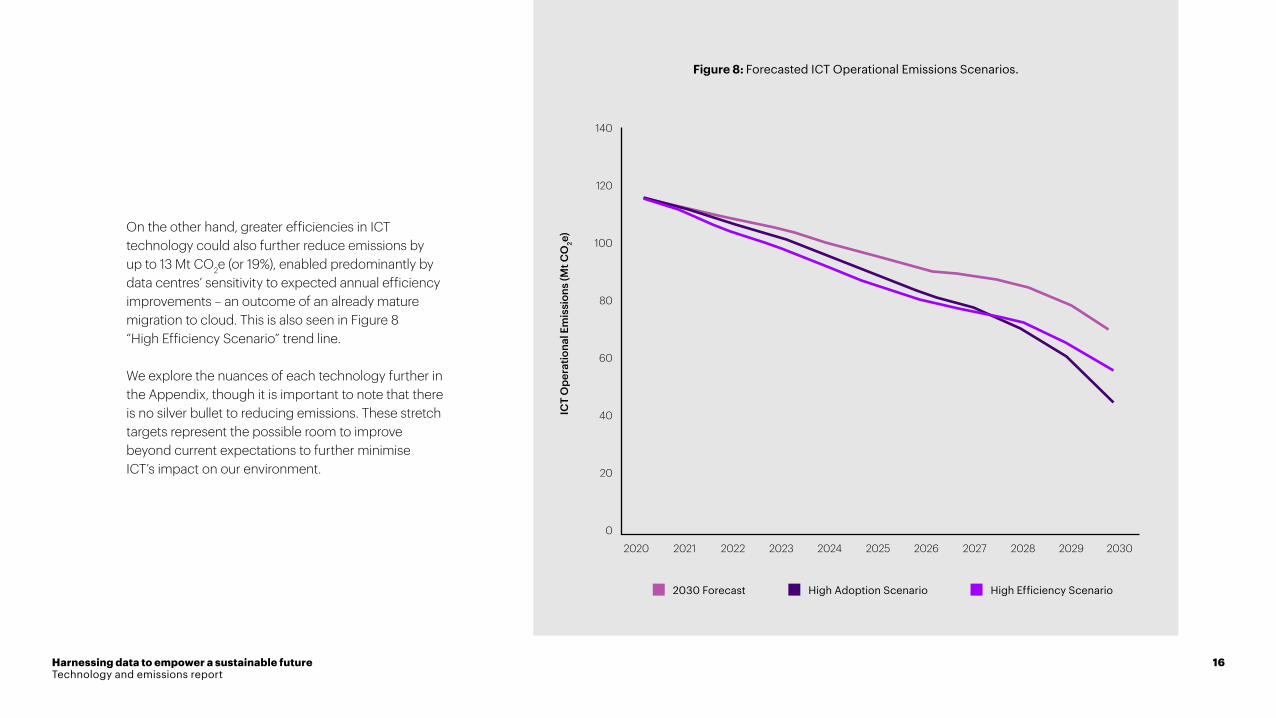
Ontheotherhand,greaterefficienciesinICTtechnology could also further reduce emissions by up to 13 Mt CO2e (or 19%), enabled predominantly by datacentres’sensitivitytoexpectedannualefficiencyimprovements – an outcome of an already mature migration to cloud. This is also seen in Figure 8 “HighEfficiencyScenario”trendline.
We explore the nuances of each technology further in the Appendix, though it is important to note that there is no silver bullet to reducing emissions. These stretch targets represent the possible room to improve beyond current expectations to further minimise ICT’s impact on our environment.
Figure 8: Forecasted ICT Operational Emissions Scenarios.
16Harnessing data to empower a sustainable futureTechnology and emissions report
High Efficiency Scenario2030 Forecast High Adoption Scenario
ICT
Ope
ratio
nal E
mis
sion
s (M
t CO
2e)
140
120
100
80
0
2020 2021 2022 2023 2024 2025 2026 2027 2028 2029 2030
60
40
20

Section 2 Harnessing ICT to help other sectors reduce their carbon footprintThereissignificantpotentialfortheICTsectortohelpother sectors on their path to reducing their carbon emissions, particularly in the highest emitting sectors globally – energy, manufacturing, agriculture and transport and buildings.
In total, by 2030, we estimate ICT can help enable anadditional8.5GtCO2e in carbon savings, through resource and material savings, increased energy efficiencies,andimprovementsinrenewableenergyadoption. These savings represent a reduction in global carbon emissions by 17% (based on 2030 forecasts),asignificantpotentialforthesector.
Additionally,therearesignificantfurtherpositive re-bound effects of these ICT use cases (meaning that human behavior considerations are taken into effect). This includes fuel savings, increased time savings and greater social outcomes through improved access to healthcare and other social services. In short, the benefitsofICTaremuchgreaterthancarbon savings alone.
In the UK alone, there is the potential to abate up to 61 Mt CO2e by 2030
WithintheUK,thereisalsosignificantpotentialforICT to lead to substantial carbon abatement across these four sectors. While each of the four sectors represents a proportionally different opportunity size basedontheUKlandscape,by2030ICTcouldhelpthese sectors reduce carbon emissions up to 61 Mt CO2e, demonstrating the sizeable opportunity at hand.
17Harnessing data to empower a sustainable futureTechnology and emissions report
17
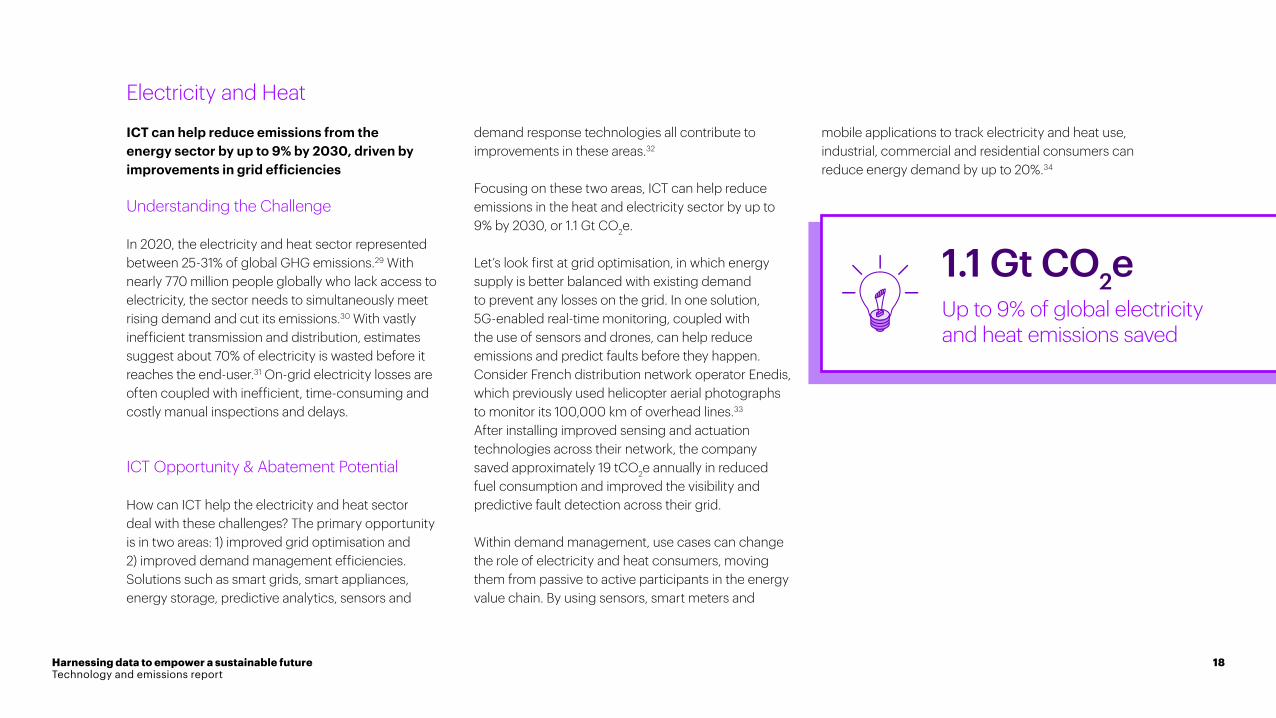
Electricity and Heat
ICT can help reduce emissions from the energy sector by up to 9% by 2030, driven by improvements in grid efficiencies
UnderstandingtheChallenge
In 2020, the electricity and heat sector represented between25-31%ofglobalGHGemissions.29 With nearly 770 million people globally who lack access to electricity, the sector needs to simultaneously meet rising demand and cut its emissions.30 With vastly inefficienttransmissionanddistribution,estimatessuggest about 70% of electricity is wasted before it reaches the end-user.31 On-grid electricity losses are oftencoupledwithinefficient,time-consumingandcostly manual inspections and delays.
ICT Opportunity & Abatement Potential
How can ICT help the electricity and heat sector deal with these challenges? The primary opportunity is in two areas: 1) improved grid optimisation and 2)improveddemandmanagementefficiencies.Solutions such as smart grids, smart appliances, energy storage, predictive analytics, sensors and
demand response technologies all contribute to improvements in these areas.32
Focusing on these two areas, ICT can help reduce emissions in the heat and electricity sector by up to 9%by2030,or1.1GtCO2e.
Let’slookfirstatgridoptimisation,inwhichenergysupply is better balanced with existing demand to prevent any losses on the grid. In one solution, 5G-enabledreal-timemonitoring,coupledwiththe use of sensors and drones, can help reduce emissions and predict faults before they happen. Consider French distribution network operator Enedis, which previously used helicopter aerial photographs to monitor its 100,000 km of overhead lines.33 After installing improved sensing and actuation technologies across their network, the company saved approximately 19 tCO2e annually in reduced fuel consumption and improved the visibility and predictive fault detection across their grid.
Within demand management, use cases can change the role of electricity and heat consumers, moving them from passive to active participants in the energy value chain. By using sensors, smart meters and
mobile applications to track electricity and heat use, industrial, commercial and residential consumers can reduce energy demand by up to 20%.34
1.1 Gt CO2eUpto9%ofglobalelectricity and heat emissions saved
18Harnessing data to empower a sustainable futureTechnology and emissions report

Agriculture
ICT can help reduce global carbon emissions from the agriculture sector by 13% by 2030, driven by reduced energy and fertilizer use
UnderstandingtheChallenge
The agriculture sector is one of the highest emitting sectors globally, responsible for 11 - 24% of global GHGemissions.35 In addition to carbon emissions, thesectoralsoproducesseveralotherGHGs,duetothe sector’s use of fertilizers and enteric fermentation, including nitrous oxide (N2O) and methane (CH4), which has a 25 times higher global warming potential for a 100-year timescale than CO2.
36 Additionally, the sectorisalsovastlyinefficientacrossitsvaluechain,as up to 50% of water used for irrigation is wasted and up to 25% of global food production lost.37
Giventhesechallenges,andourdependenceonthe sector, it is clear we must ensure the sustainable growth of the agricultural sector, helping us grow more food whilst decreasing the emissions for the sector overall.
ICT Opportunity & Abatement Potential
Within the sector, ICT has the potential to reduce sectoremissionsby1.5GtCO2e, or 13% globally, by 2030. For example, ICT can be used to help farmers reduce their fertilizer use through improved soil knowledge and understanding. And by better monitoring food quantity and quality for livestock, it can reduce emissions from enteric fermentation.
The use of sensors, alongside real-time monitoring solutionsenabledby5Gconnectivityandautomation,are crucial ICT solutions for limiting agriculture’s impact on the environment. Soil sensors can help reduce the level of fertilizers and manure used, by helping farmers better understand the condition of their soils and crops, and improve growing conditions accordingly. Sensors can also help reduce emissions from rice cultivation, as farmers can control the concentration of methanotrophs (microorganisms that are able to metabolize methane as their only source of carbon and energy) in the waterbed needed for rice cultivation. Finally, real-time monitoring of livestock can also decrease enteric fermentation, helping provide animals with the precise amount of nutrition they need, reducing waste and improving overallefficiencies.
Today, these technologies are already being used within some innovative partnerships across the sector. For example, within the frozen food industry, ICT is being used to reduce carbon emissions through improved monitoring and data collection, more efficientenergyandcoolingusageanddecreasingpeak energy demand. Lineage, a food cold chain company partnered with AT&T and Ndustrial.io to decrease its carbon footprint using ICT-based solutions. Lineage monitors its energy use and collects energy demand data to automate processes to supercool produce when energy demand and prices are low. It also uses a customised dashboard for its blast freezing process, reducing freezing time from 100 to 40 hours with energy savings up to 50%.38
1.5 Gt CO2eUpto13%ofglobalagricultureemissions could be saved
19Harnessing data to empower a sustainable futureTechnology and emissions report
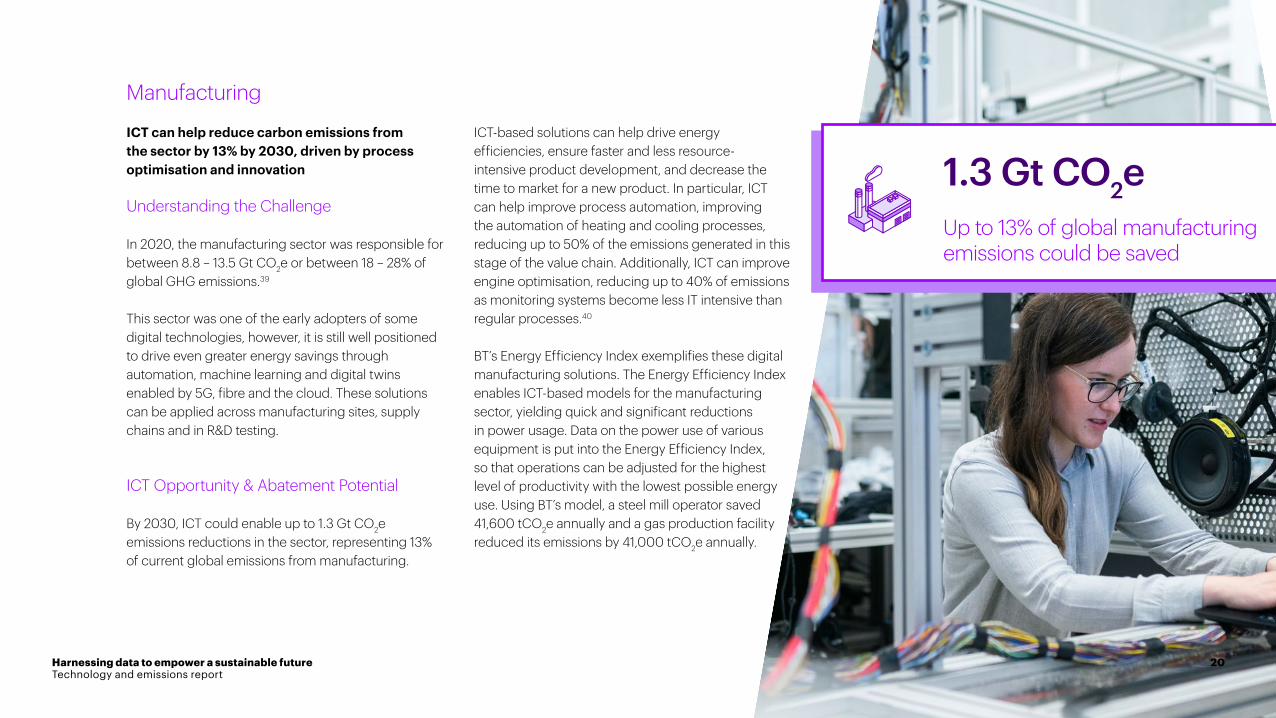
Manufacturing
ICT can help reduce carbon emissions from the sector by 13% by 2030, driven by process optimisation and innovation
UnderstandingtheChallenge
In 2020, the manufacturing sector was responsible for between8.8–13.5GtCO2e or between 18 – 28% of globalGHGemissions.39
This sector was one of the early adopters of some digital technologies, however, it is still well positioned to drive even greater energy savings through automation, machine learning and digital twins enabledby5G,fibreandthecloud.Thesesolutionscan be applied across manufacturing sites, supply chains and in R&D testing.
ICT Opportunity & Abatement Potential
By2030,ICTcouldenableupto1.3GtCO2e emissions reductions in the sector, representing 13% of current global emissions from manufacturing.
ICT-based solutions can help drive energy efficiencies,ensurefasterandlessresource-intensive product development, and decrease the time to market for a new product. In particular, ICT can help improve process automation, improving the automation of heating and cooling processes, reducing up to 50% of the emissions generated in this stage of the value chain. Additionally, ICT can improve engine optimisation, reducing up to 40% of emissions as monitoring systems become less IT intensive than regular processes.40
BT’sEnergyEfficiencyIndexexemplifiesthesedigitalmanufacturingsolutions.TheEnergyEfficiencyIndexenables ICT-based models for the manufacturing sector,yieldingquickandsignificantreductionsin power usage. Data on the power use of various equipmentisputintotheEnergyEfficiencyIndex, so that operations can be adjusted for the highest level of productivity with the lowest possible energy use.UsingBT’smodel,asteelmilloperatorsaved41,600 tCO2e annually and a gas production facility reduced its emissions by 41,000 tCO2e annually.
1.3 Gt CO2eUpto13%ofglobalmanufacturing emissions could be saved
20Harnessing data to empower a sustainable futureTechnology and emissions report
Smart Living: Buildings & Transport
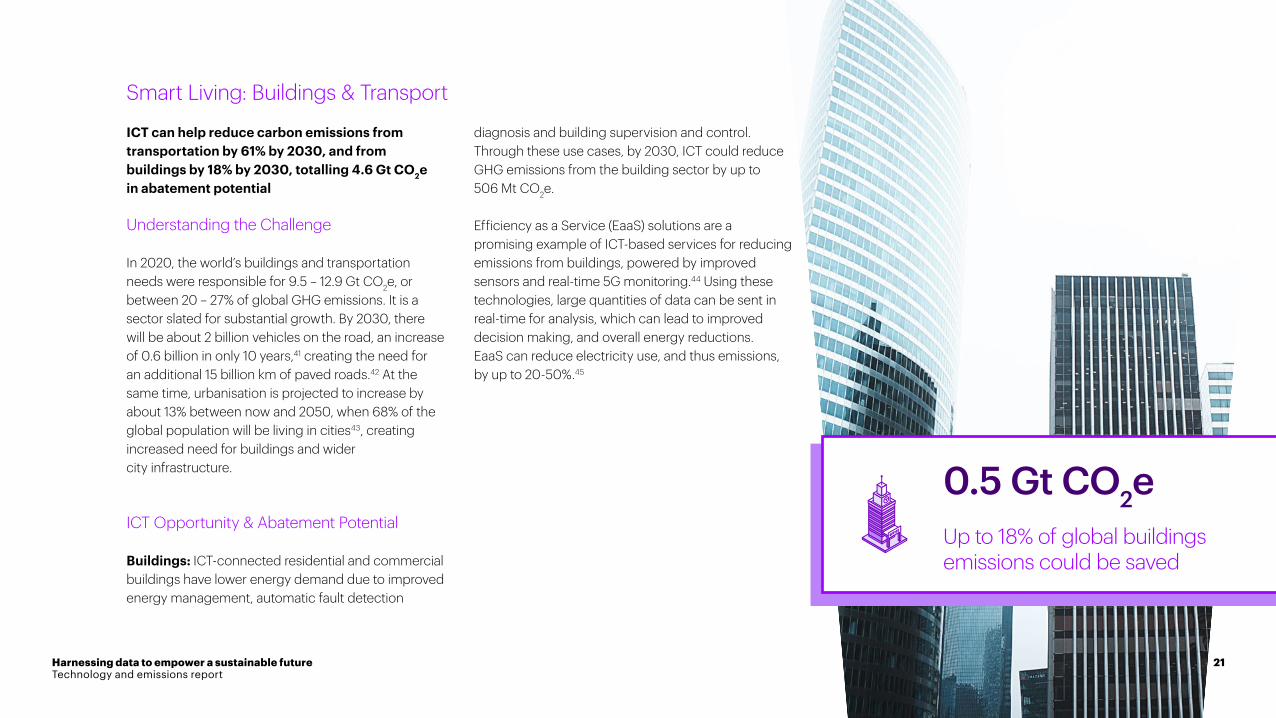
ICT can help reduce carbon emissions from transportation by 61% by 2030, and from buildings by 18% by 2030, totalling 4.6 Gt CO2e in abatement potential
UnderstandingtheChallenge
In 2020, the world’s buildings and transportation needswereresponsiblefor9.5–12.9GtCO2e, or between20–27%ofglobalGHGemissions.Itisasector slated for substantial growth. By 2030, there will be about 2 billion vehicles on the road, an increase of 0.6 billion in only 10 years,41 creating the need for an additional 15 billion km of paved roads.42 At the same time, urbanisation is projected to increase by about 13% between now and 2050, when 68% of the global population will be living in cities43, creating increased need for buildings and wider city infrastructure.
ICT Opportunity & Abatement Potential
Buildings: ICT-connected residential and commercial buildings have lower energy demand due to improved energy management, automatic fault detection
diagnosis and building supervision and control. Through these use cases, by 2030, ICT could reduce GHGemissionsfromthebuildingsectorbyupto 506 Mt CO2e.
EfficiencyasaService(EaaS)solutionsareapromising example of ICT-based services for reducing emissions from buildings, powered by improved sensorsandreal-time5Gmonitoring.44Usingthesetechnologies, large quantities of data can be sent in real-time for analysis, which can lead to improved decision making, and overall energy reductions. EaaS can reduce electricity use, and thus emissions, by up to 20-50%.45
0.5 Gt CO2eUpto18%ofglobalbuildings emissions could be saved
21Harnessing data to empower a sustainable futureTechnology and emissions report

Transportation: Carbon abatement across the transportation sector includes emissions savings due toincreasesine-commerce,logisticsefficiencies,connected private transportation use cases and improvedtrafficcontrolandoptimisationsolutions.Combined, these ICT use cases can abate as much as4.1GtCO2e by 2030.
Across these use cases, ICT can help reduce the kilometres we travel to purchase goods and services, enable improved route sharing and car-pooling services,andcanalsoproviderealtimetrafficinformation through low latency connectivity and data storage technologies. These services and technologies are fundamentally transforming the way wetravel–whetherthroughUber,Amazon,orGoogleMaps,andhavethepotentialtoenablesignificantcarbon abatement savings.
For example, using these advancements in technologies, online retailers and logistics companies are increasingly using route optimisation services to reduce kilometres travelled, and provide new services suchasusingGPStocheckifacustomerisathomebefore a parcel is delivered.
Advanced data analytics can help reduce last-mile delivery emissions by between 7 - 9% through improvedlocalorderfulfilmentanddeliveryrouteoptimisation.46 Recent Accenture projections suggest thatICT-enabledefficienciesinlast-miledeliveryinjust three cities (Chicago, London and Sydney) alone could abate 36,960 tCO2e between 2021 and 2030.47 E-Banking: Related to the advancements in transportation and e-commerce, e-Banking has become a staple in our lives. We no longer need to go to our bank’s branch to deposit a cheque, take money out of our accounts or review our loan’s interest rate. Apart from the comfort and speed of ICT-enabled banking, these services also help reduce the sector’s emissions. E-Banking alone has the potential to abate up to 3 Mt CO2e globally by 2030, based on research in the SMARTer2030 report from the ICT industry bodyGeSI.48
4.1 Gt CO2eUpto61%ofglobaltransportation emissions could be saved
22Harnessing data to empower a sustainable futureTechnology and emissions report
Section 3 Conclusion and RecommendationsTheICTsectorismakingsignificantprogresslookingat how it can reduce its carbon footprint and maintain its stable energy footprint despite exponential growth indatatrafficoverthenexttenyears.Atthesametime,thesectorisalsomakingsignificantimpactsin other sectors such as manufacturing, energy, agriculture and transport – helping these emissions-intensive sectors reduce their carbon emissions and findnewareasforgrowth.
Lookingforward,andtosecuretheefficienciesandemissionsreductionswehaveidentifiedthroughoutthisreport,wehavedevelopedfiverecommendationsfor the ICT sector to focus on:
1. Meeting, or exceeding, ambitious carbon reduction targets: By 2030, Power Purchase Agreement (PPAs) and Renewable Energy Credits (RECs) have the potential to abate over 58% (97 Mt CO2e) of operational emissions from the ICT sector. However, this potential abatement relies onorganisationssuchasBT,Googleandotherleaders in the sector reaching their stated net zero
ambitions and science-based targets. The sector will need to continue to invest and innovate in this space, through new procurement mechanisms or grid technologies in order to reduce its emissions over the next decade.
2. Investing in networks and operations to continue to improve energy efficiency: The sector should look to identify and prioritise whereandhowitcandriveefficiencies.Aripeopportunity is data centres, where continuous and discrete infrastructure updates can be more readily pushed out and implemented, without the nation-wide updates required with mobile and fixednetworks.Hardwareefficiency,computeutilisation, and sustainable software engineering canallhelpdriveincredibleefficiencygainsacrosscloudproviders.Theseefficienciesareapriority, helping cut energy demand despite data access growth.
23Harnessing data to empower a sustainable futureTechnology and emissions report
3. Retiring legacy technology where possible: Legacyfixedandmobilenetworksshouldberetired where possible to eliminate dual-running andinefficientenergydemand.Nearly90%ofenergydemandacrossthefixednetworkisexpectedtocomefromnon-fibresources,despite only 55% of the data being managed by them. Clearly, there is substantial opportunity to drivegreaterefficienciesbyretiringoldcopper-basednetworks.Similarbenefitscanbeexpectedfromtheretirementoflegacy2Gand3Gnetworksas well.
4. Incentivising and enabling the adoption of new technologies:Greateradoptionofnewtechnologies will help both encourage the retirementoflegacytechnologies(suchas3Gand Fibre to the Cabinet (FTTC)), whilst also supporting new use cases and business models emergingthrough5Gandcloudcomputing.These newer systems are built-for-purpose with sustainability in mind.
5. Developing and rolling-out cross-industry use cases for carbon enablement at scale: Consideringthesizeable8.5GtCO2e carbon emissions reductions that can be achieved across
just four emissions-intensive sectors, there is huge opportunity to scale ICT solutions amongst other sectors. This will not only help drive greater technology adoption, but also help us meet our climatetargetsandstayona1.5˚Cpath.
Realising these ambitions will take determination and effort, as we look to decrease our carbon emissions and impact on the planet over the next ten years. However, with clear and measurable commitments, investment in our future, and purpose-built technologies, we have a clear path ahead that shows our digital world can thrive in a carbon-constrained future—if we take the necessary steps now.
24Harnessing data to empower a sustainable futureTechnology and emissions report

Appendix Deep Dives
25Harnessing data to empower a sustainable futureTechnology and emissions report
Mobile Networks
Narrowing focus on mobile networks, we look at the trends across modern and legacy mobile networks whichinclude2G,3G,4G,and5Gdatanetworks.Forthepurposesofsimplificationandtoavoidconfusion,we have not included the legacy voice network, which has already been retired in multiple countries.
Specificallywithinmobilenetworks,thekeytechnologicalshift–fromlegacytechonto5G–isdrivingsignificantenergydemandreductionsandreducing carbon emissions for the sector. We have focusedonthistransition,asmobiledatatrafficisthe most rapidly growing data subset of access data traffic,with5Gsittingatthecentreofthisgrowth.
There are three key actions the sector should focus on to manage and reduce the carbon footprint of mobile networks:
1. Rapidly deploy 5G towers to enable a stand-alone 5G network that helps consumers realise the benefits of 5G. Current non-standalone5Gnetworks(i.e.networkswhichcontinuetorelyonlegacy4Gtomanageaccessontothe5Gnetwork)sufferfromtheinevitablegrowing pains. While still nascent technology in
itsdeployment,most5Gnetworksareunabletoreachthespeeds–andassociateddatatrafficcapacities–promisedduetothesparsityof5Gtowers.Broadlyspeaking,themostefficient5Gtowers operate over high frequency waves which attenuate faster than their longer wavelength counterparts, which require a denser network of sites to maintain signal strength. Real-world studiesof5Gsiteshaveshownthatthroughamore mature network, and adoption therein, operationalenergyefficienciesareupwardsof90%moreefficientthaninlegacynetworks.49
2. Drive adoption onto 5G and look to retire redundant legacy 2G and 3G networks where possible.5Gconnectivitywillenablehighervolumes of data to be shared and processed, and additional optimisations in the programming of5Gnetworksreducetheirenergydemandwhileidle;however,alowutilisationof5GisstillexpectedtoresultinlowerefficiencyperGBoftraffic.Wewillseeenergyefficiencyacross5Gnetworksimproveasmoreusersandorganisationslooktoleverage5Gintheirbusinessand at home with the result of a more energy andcarbonefficientmobilenetwork.
3. Leverage the capabilities of 5G (ultra-low latency and high-speed data) across industry to reduce industry footprints.5Gispositionedto drastically change the way we work with its ultra-low latency and high speeds that enable new business models and use cases for how we interact with our environment. We have estimated thatthepotentialof5Gisanindicative5.9GtCO2e abatement per year based on adoption of mobile solutions in 2030. There are countless high-impact ways to use this technology, not only to make our world greener through the likes of connected and automated farming, intelligent energy grids, and intelligent asset management,50 but also safer through enhanced vehicle safety and automation, and drastically improved remote healthcare and even surgery.
5Gembeddedemissions
Expectantly,withthedeploymentof5Gaswithanyprevious mobile network, there will be anticipated emissionsrelatedtobothdeploymentof5Gantennaeand the embedded emissions within the towers themselves. While the deployment will likely have minimal emissions due to the lack of any major
26Harnessing data to empower a sustainable futureTechnology and emissions report

constructiveefforts,embeddedemissionsof5Gareestimated at 0.75 tCO2e. Based on a lifetime of over 10 years, these emissions will sit below a +/-5% range of mobile network emissions as a whole, and thus are unlikely to considerably effect the mobile network trends shown in this report.
Fixed Networks
Between2020and2030,fixednetworkenergydemand is expected to increase by almost three-fold. This includes four technology groups: Full Fibre-to-the-home (FTTH), Cable, xDSL, and Other (treated conservatively as xDSL). While in 2020, across OECD countries, we see a roughly even distribution of the threemainfixednetworkmethods,therehasbeenan underlying shift off of copper-based networking (cableandxDSL)towardsfullfibre,giventheefficienciesandspeedwithwhichfibreiscapableoftransferring data.
Toreducetheemissionsfromfixednetworks,despitethe projected growth in energy demand, and almost 6-foldincreaseinfixedaccesstrafficdata,thesectorshould focus on three areas:
1. Deploy a full fibre network as efficiently as possible, to achieve faster and less carbon intensive connections. The deployment and subsequentaccesstoafull-fibrenetworkwillmitigate emissions due to an estimated 86% improvementinenergyefficiencyincomparisonwith DSL links.51Deploymentoffibrehoweverconstrains the proportion of users that can adopt the network. Our estimates put global adoption at 45% following current deployment trends, however a 93% adoption is what would be neededtoseesimilarenergydemandforfixednetworks in 2030 as with 2020. This leaves space for progress as we look to shift to a more reliable andenergyefficienttech(fullfibre)toreduceourlong-term environmental footprint.
2. Retire and consolidate legacy network infrastructure as quickly as possible. An estimated 89% of the energy consumed acrossthefixednetworkisexpectedtostemfromnon-fibresourcesby2030,despiteonly55%ofthe data being managed by them. As there are physicallimitationstohowefficientonecansenddata over these legacy copper-based network connections, it will be paramount to not only
adopt FTTH, but also retire old copper-based networks. This has been the trend, however consolidation efforts and optimised retiring will be critical to minimising dual running of networks.
3. Emphasize wired (preferably fibre) connection while efficiencies remain. With the trend of remote working taking-off and increases in the data-intensity of our digital tasks, it is important that we continue to leverage the capacity of wired connections. The core IP networkisbuiltonefficientfibreconnectionsand legacy systems have continued to improve52 overthepastdecades,resultinginfixednetworksbeing23timesmoreenergyefficientperGBofdata transferred than mobile networks in 2020. Thiscomparativeefficiencywillchangeasbothfixedandmobileaccessnetworkscontinuetoevolve, though it is important to note that from anenergyandcarbonintensityperspective,fixednetworksaremoreefficientandshouldthusbeprioritised where possible.
27Harnessing data to empower a sustainable futureTechnology and emissions report

Fibre embedded emissions
A potential area of concern for emissions is the rollout offibreconnectivity,whichisfrequentlycapturedbypolitical headlines.53 By our conservative estimates, the embedded and deployment emissions for FTTH are expected to reach a maximum of 8.5% of the emissionsfromthefixednetworkitselfglobally(equalto 1.2 Mt CO2e), however this decreases to less than 1%offixednetworkemissionsby2030(45ktCO2e)54 once the most readily available and data intensive connections have been laid.55 It is prudent to note that this remains focused on the last mile delivery of FTTH asthecoreIPnetworkisalreadyfibrebased.
Additionaltothis,fibreisamorerobustfixednetworkconnection, reducing the need for maintenance activity by an estimated 20% based on discussions, and with the opportunity to perform network switches digitally, removing the need for on-site technician visits to switch between network providers. These both mitigate fuel consumption and improve the efficiencyofnetworkproviders,loweringthelifecycleemissionsforfibrenetworks.
28Harnessing data to empower a sustainable futureTechnology and emissions report

Data Centres
For this study, data centres include on-premise centres, cloud data centres (non-hyperscale) and hyperscale data centres (with access through cloud providerssuchasGoogle,Amazon,andMicrosoft).The reason for these distinctions is to capture the shift in the market towards cloud computing, and more specifically,hyperscalecloudcomputing. This scale provides additional capacity in the data centrestoseekcomputationalefficiencies,helping to drive down emissions.56,57,58
Data centres sit behind the access network, doing the legwork of the internet in processing and storing data. Despite the high pressure placed on data centres to manage increasing demand, they have successfully managed to maintain stable operational emissions across the last decade and are operating more efficientthanever.59 We expect data centre energy demand to grow by only 14% over the decade, an indicatorofcontinuedefficiencygains,asweexpectcloud adoption rates to slow due to the already deep penetration of cloud data centres.
This leaves two key areas for data centres to maintaintheirsteadyemissionsprofile,and potentially reduce it:
1. Migrate on-premise computing to the cloud where feasible.Cloudhasmovedfrom“nicetohave”to“musthave”andhasachievedahighlevel of maturity, already handling over 90% of datacentretraffic.60 However, legacy computing through on-premise data centres still consumed over a quarter of data centre energy demand in 2020. Migrating onto the cloud can reduce this relianceonlessefficientlegacysystems,whiledelivering a double helix effect of shareholder and stakeholder value – simultaneously reducing costs and carbon emissions if it is approached from a sustainable perspective.61 Shifting from on-premise to infrastructure-as-a-service (cloud computing) can reduce carbon emissions by 84%62 alone.
2. Focus efforts on improving efficiencies across all data centres.Hardwareefficiency,compute utilisation, and sustainable software engineering, alongside the use of purpose-built facilities and peripherals (cooling) for computing havedrivenincredibleefficiencygainsacrosscloudproviders.Google,asaleadingexampleforcloudefficiencies,nowhasanaveragePUE(measurementofhowefficientlythedatacentresperipherals operate) across all data centres of 1.1.63 There is however still room to grow. Historical compute trends show a potential for the doubling
ofcomputationalenergyefficiencyevery2.3years,aCAGRof35%.However,historicalanalysisofdatacentreefficiencyimprovementslieclosertoa21%CAGR.Withhyperscalers,furtherimprovements in network optimisations, clever cooling strategies, and data compression are magnifiedbyeconomiesofscale.Itisthroughthese methods that we can look to further reduce the environmental impact of data centres.
29Harnessing data to empower a sustainable futureTechnology and emissions report
Methodology and Assumptions
30Harnessing data to empower a sustainable futureTechnology and emissions report

All data used within the report was sourced from either publicly available data, BT’s physical infrastructure, or work produced in association with Accenture. The main methodologies for each section are outlined below.
ICT Operational Emissions Analysis:
Accenture research was conducted across a variety of sources including:
• publicly available data, further referenced and cross checked by Accenture and BT subject matter advisors (SMAs);
• discussion with Accenture and BT SMAs; or
• analysis of Accenture and BT data including work products produced in association with either organisation
to provide input into the formula:
Data Traffic: Figures and trends from publicly available academic and sponsored research projectingdatatrafficwereextendedwhereprojections had already been made or projected based on SMA reviewed assumptions.
Carbon Intensity of Energy: Accenture analysis conducted based on expected adherence of national grid decarbonisation commitments across an indicative set of 14 countries, leveraging publicly available carbon intensity of energy data from multiple sources.
Energy Efficiency: Relative and absolute energy efficienciesacrosstechnologytypeswerebasedon academic and sponsored research. Where data was unavailable, historical analysis of technology energydemandanddatatrafficwereusedtocalculateindicativeenergyefficiencieswhichwerethen projected forward based on trends exhibited from academic and sponsored research as well as Accenture and BT SMA knowledge.
Where data was unavailable, Accenture reviewed assumptions were made and validated against historical trends.
Figure 9: Accenture Analysis Methodology.
Carbon Intensity of Energy
(Mt CO2e/TWh)
Data Traffic
(EB)
Energy Efficiency (TWh/EB)
Carbon Emissions (Mt CO2e)X X =
• Adoption of new technology• Retiring of legacy technology• Continuousefficiency
improvements
• Number of connected devices• Size of data packages
transmitted• Growingsizeofconnected
population• Changes in ways-of-working
• Decarbonisation of the grid• Power purchase agreements• Energy harvesting
Out of Scope31Harnessing data to empower a sustainable future
Technology and emissions report

Technologiesassessedincludedatacentres,fixednetworks, and mobile networks. The IP Core Network wasincludedwithinthefixednetwork,howeverunderseaandinternationalfibrenetworkwasomittedto focus on data transmission at national levels.
Home / Private Networking, user devices, and wireless enabled user devices were omitted due to their energy demand and subsequent emissions being a function of both data and time use, which generates additional complexities of discerning the relationship between data volume and time use across the multiplicity of future devices now and into 2030. This remains an area for further research and analysis to better understand the impact of user devices on energy demand relative to the growth trends of data.
ICT enabled abatement
Globalabatementfigureswereextrapolatedfromthe SMARTer2030 report which was produced inassociationwithAccentureandtheGlobaleSustainability Initiative. Figures and baseline data within the SMARTer2030 report were updated according to latest publicly available information, and using three indicative countries, extrapolated. ForUKspecificdata,thiswasupdatedwithintheSMARTer2030 model and used directly without further extrapolation.
Figure 10: Scope of the Analysis.
Fixed Network IP Care Network
Mobile Network
Data Centre
Scope
Wireless enabled user devicesUser Devices
Home / Private Networking
FWA
32Harnessing data to empower a sustainable futureTechnology and emissions report
References1 https://www.itu.int/en/mediacentre/backgrounders/Pages/connect-
2030-agenda.aspx
2 https://www.un.org/en/content/digital-cooperation-roadmap/
3 https://www.statista.com/statistics/802690/worldwide-connected-devices-by-access-technology/
4 https://www.cisco.com/c/en/us/solutions/collateral/executive-perspectives/annual-internet-report/white-paper-c11-741490.html
5 Accenture Analysis and Aslan et. al - https://onlinelibrary.wiley.com/doi/full/10.1111/jiec.12630
6 Cisco Global Cloud Index (2016-2021) https://virtualization.network/Resources/Whitepapers/0b75cf2e-0c53-4891-918e-b542a5d364c5_white-paper-c11-738085.pdf
7 Accenture Green behind the Cloud https://www.accenture.com/_acnmedia/PDF-135/Accenture-Strategy-Green-Behind-Cloud- POV.pdf
8 Equinix Energy Efficiency CoE https://sustainability.equinix.com/environment/energy-efficiency/
9 Accenture analysis on AMD report https://www.amd.com/en/system/files?file=documents/Supercomputing-Performance-Efficiency.pdf
10 Accenture Green behind the Cloud https://www.accenture.com/_acnmedia/PDF-135/Accenture-Strategy-Green-Behind-Cloud- POV.pdf
11 The future of fixed telephone services (ofcom.org.uk)
12 The UK’s PSTN network will switch off in 2025 | BT Business
13 What are science-based targets?, Science Based Targets Initiative, https://sciencebasedtargets.org/how-it-works, accessed July 7, 2021.
14 https://www.gsma.com/betterfuture/wp-content/uploads/2021/04/Mobile-Net-Zero-State-of-the-Industry-on-Climate-Action.pdf
15 Accenture Analysis on top 15 cloud providers as provided through https://finance.yahoo.com/news/15-biggest-cloud-computing-companies-190653918.html
16 https://www.iea.org/commentaries/data-centres-and-energy-from-global-headlines-to-local-headachesschneiderelectricnavigantresearchdatacentersandadvancedmicrogridswhitepaper102017pdf%20%283%29.pdf
17 https://datacenters.lbl.gov/sites/default/files/schneiderelectric navigantresearchdatacentersandadvancedmicrogridswhitepa per102017pdf%20%283%29.pdf
18 Facebook, Microsoft Helping to Finance Green Power Microgrids - Bloomberg
19 247-carbon-free-energy.pdf (gstatic.com)
20 https://aws.amazon.com/compliance/data-center/ environmental-layer/
21 https://www.google.com/about/datacenters/renewable/
22 https://azure.microsoft.com/en-gb/global-infrastructure/sustainability/#carbon-benefits
23 https://stakeholderimpactreport.salesforce.com/esg-metrics- and-indicators
24 https://h20195.www2.hp.com/v2/GetDocument.aspx?docname=c05179523#page=28
25 https://blog.dropbox.com/topics/company/dropbox-sets-sustainability-goals-for-2030
26 https://www.bt.com/bt-plc/assets/documents/digital-impact-and-sustainability/our-report/report-archive/2002/environment.pdf
27 https://www.gsma.com/betterfuture/wp-content/uploads/2021/04/Mobile-Net-Zero-State-of-the-Industry-on-Climate-Action.pdf
28 https://www.iea.org/commentaries/data-centres-and-energy-from-global-headlines-to-local-headaches
29 https://www.ipcc.ch/site/assets/uploads/2018/02/ipcc_wg3_ar5_full.pdf; https://www.wri.org/blog/2020/02/greenhouse-gas-emissions-by-country-sector; https://www.c2es.org/content/international-emissions/; https://www.iea.org/data-and-statistics/charts/global-co2-emissions-by-sector-2018
30 https://www.iea.org/reports/sdg7-data-and-projections/access- to-electricity
31 https://www.itu.int/dms_pub/itu-d/opb/gen/D-GEN-EUROPE.02-2018-PDF-E.pdf
32 2016: #SystemTransformation HOW DIGITAL SOLUTIONS WILL DRIVE PROGRESS TOWARDS THE SUSTAINABLE DEVELOPMENT GOALS, http://systemtransformation-sdg.gesi.org/160608_GeSI_SystemTransformation.pdf
33 https://www.esmartsystems.com/customers/enedis/, https://www.smart-energy.com/industry-sectors/policy-regulation/fast-forwarding-the-energy-transition-in-france/
34 GeSI and Accenture analysis for the needs of SMARTer 2030 Report, https://smarter2030.gesi.org/downloads/Full_report.pdf
35 https://www.ipcc.ch/site/assets/uploads/2018/02/ipcc_wg3_ar5_full.pdf; https://www.wri.org/blog/2020/02/greenhouse-gas-emissions-by-country-sector; https://www.c2es.org/content/international-emissions/; https://www.iea.org/data-and-statistics/charts/global-co2-emissions-by-sector-2018
33Harnessing data to empower a sustainable futureTechnology and emissions report

References36 The contribution of precision agriculture technologies to farm
productivity and the mitigation of greenhouse gas emissions in the EU, 2019, https://op.europa.eu/en/publication-detail/-/publication/8309c598-3b0d-11e9-8d04-01aa75ed71a1/language-en
37 https://files.wri.org/d8/s3fs-public/creating-sustainable-food-future_2.pdf
38 AT&T 10x Case Study: Energy Efficient Frozen Food – Lineage Logistics uses ndustrial.io and AT&T Internet of Things (IoT) to reduce energy use in cold food storage facilities
39 https://www.ipcc.ch/site/assets/uploads/2018/02/ipcc_wg3_ar5_full.pdf; https://www.wri.org/blog/2020/02/greenhouse-gas-emissions-by-country-sector; https://www.c2es.org/content/international-emissions/; https://www.iea.org/data-and-statistics/charts/global-co2-emissions-by-sector-2018
40 Accenture conversations with manufacturing processes experts for the purpose of SMARTer 2030 Report
41 https://naijauto.com/market-news/how-many-cars-are-there-in-the-world-7100, https://www.carsguide.com.au/car-advice/how-many-cars-are-there-in-the-world-70629#:~:text=There%20is%20an%20estimated%201.4,at%20around%2018%20per%20cent.
42 https://smarter2030.gesi.org/downloads/Full_report.pdf
43 https://ourworldindata.org/urbanization#:~:text=By%202050%2C%20more%20than%20two,of%20urbanization%20across%20the%20world.&text=By%202050%2C%20it’s%20projected%20that,from%-2054%20percent%20in%202016)
44 https://www.gsma.com/futurenetworks/wiki/att-energy-efficiency-as-a-service/
45 https://smartech-energy.co.uk/energy-efficiency-as-a-service
46 https://www.accenture.com/gb-en/insights/consulting/sustainable-last-mile-delivery
47 https://www.accenture.com/gb-en/insights/consulting/sustainable-last-mile-delivery
48 GeSI SMARTer2030, https://smarter2030.gesi.org/downloads/ Full_report.pdf
49 https://hellofuture.orange.com/en/5g-energy-efficiency-by-design/
50 https://www.accenture.com/_acnmedia/PDF-144/Accenture-5G-WP-EU-Feb26.pdf
51 Accenture Analysis on Prysmian-study-on-Energy-Consumption.pdf (europacable.eu)
52 https://onlinelibrary.wiley.com/doi/full/10.1111/jiec.12630
53 https://www.ft.com/content/665db0ae-2ec5-4785-b0b0-ec1be2345f26
54 Accenture Analysis of HW_076453.pdf (huawei.com)
55 This assessment is an extrapolation based off research on deploying fibre across an urban environment.
56 https://www.accenture.com/us-en/form-green-behind-cloud?src=PSEARCH&
57 Science Magazine (lbl.gov)
58 https://virtualization.network/Resources/Whitepapers/0b75cf2e-0c53-4891-918e-b542a5d364c5_white-paper-c11-738085.pdf
59 https://www.iea.org/data-and-statistics/charts/global-data-centre-energy-demand-by-data-centre-type-2010-2022
60 Cisco Global Cloud Index (2016-2021) https://virtualization.network/Resources/Whitepapers/0b75cf2e-0c53-4891-918e-b542a5d364c5_white-paper-c11-738085.pdf
61 Green Behind The Cloud, Accenture 2020, https://www.accenture.com/_acnmedia/PDF-135/Accenture-Strategy-Green-Behind-Cloud-POV.pdf
62 https://www.accenture.com/us-en/form-green-behind-cloud?src=PSEARCH&
63 https://www.google.com/about/datacenters/efficiency/
34Harnessing data to empower a sustainable futureTechnology and emissions report

About Accenture Accenture is a global professional services company with leading capabilities in digital, cloud and security. Combining unmatched experience and specialized skills across more than 40 industries, we offer Strategy and Consulting, Interactive, Technology and Operations services — all powered by the world’s largest network of Advanced Technology and Intelligent Operations centers. Our 624,000 people deliver on the promise of technology and human ingenuity every day, serving clients in more than 120 countries. We embrace the power of change to create value and shared success for our clients, people, shareholders, partners and communities. Visit us at www.accenture.com
About BTBT Group is the UK’s leading telecommunications and network provider and a leading provider of global communications services and solutions, serving customers in 180 countries. Its principal activities in the UK include the provision of fixed voice, mobile, broadband and TV (including Sport) and a range of products and services over converged fixed and mobile networks to consumer, business and public sector customers. For its global customers, BT provides managed services, security and network and IT infrastructure services to support their operations all over the world. BT consists of four customer-facing units: Consumer, Enterprise, Global and its wholly-owned subsidiary, Openreach, which provides access network services to over 650 communications provider customers who sell phone, broadband and Ethernet services to homes and businesses across the UK.For the year ended 31 March 2021, BT Group’s reported revenue was £21,331m with reported profit before taxation of £1,804m. British Telecommunications plc is a wholly-owned subsidiary of BT Group plc and encompasses virtually all businesses and assets of the BT Group. BT Group plc is listed on the London Stock Exchange. For more information, visit www.bt.com/about
Copyright © 2021 Accenture. All rights reserved.
Accenture and its logo are trademarks of Accenture.
This document makes descriptive reference to trademarks that may be owned by others. The use of such trademarks herein is not an assertion of ownership of such trademarks by Accenture and is not intended to represent or imply the existence of an association between Accenture and the lawful owners of such trademarks.