harmony portfolios advisor workshop november 2009
TRANSCRIPT

Harmony Portfolios
Advisor Workshop
November 2009
2
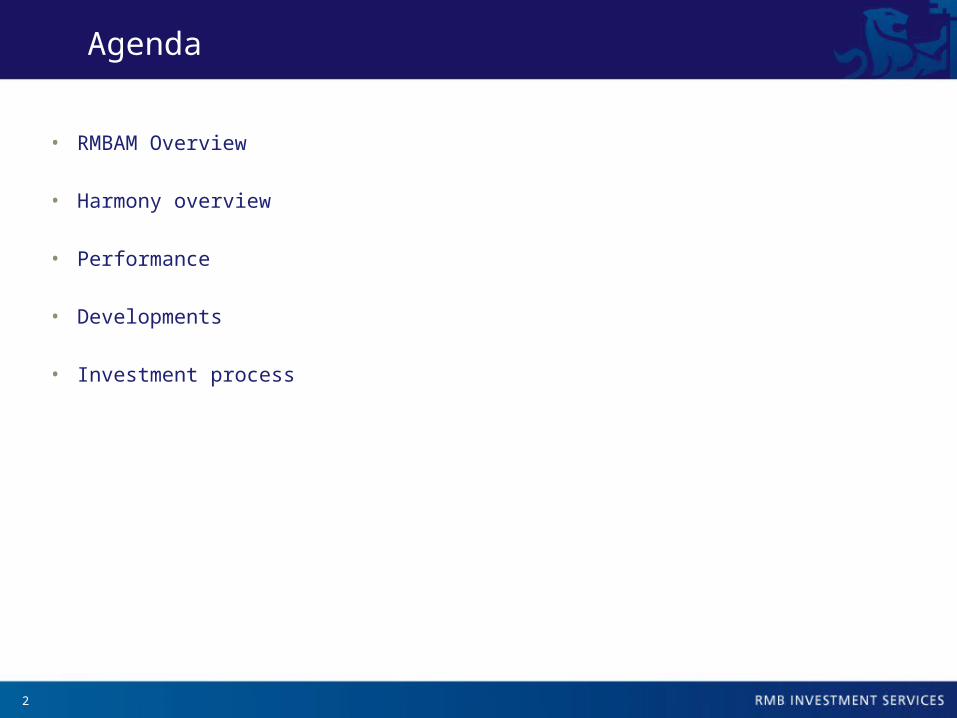
Agenda
• RMBAM Overview
• Harmony overview
• Performance
• Developments
• Investment process

3
RMB Asset Management International
• RMB Asset Management is a wholly owned subsidiary of South Africa's largest
financial services group, FirstRand
• FirstRand has USD124 billion of assets under management (June 2008) with a
market capitalisation of USD9.7 billion (December 2008)
• RMB Asset Management has USD2.1 billion assets under management as of
31 December 2008.
• From its office in London, RMB Asset Management employs over 35 staff:- Equity Desk – Long only manager of manager funds- Fixed Income desk- Alternative Desk- Multi Asset Desk - Bespoke multi asset class portfolios- Advisory services for professional clients
Source: RMB Asset Management, February 2009.

4
RMB Asset Management International
Well resourced, experienced investment team
Genuine diversification to a broad range of ‘traditional’ and ‘non-traditional’
asset classes– reducing risk and widening the opportunity set
Consistent valued ad through all market conditions
Cost-effective portfolio management
Global best of breed: It is widely accepted that no one manager is the best in all
asset classes. Our analysts carry out over 1000 research meetings a year to
uncover the world’s best managers
Disciplined and repeatable process
5
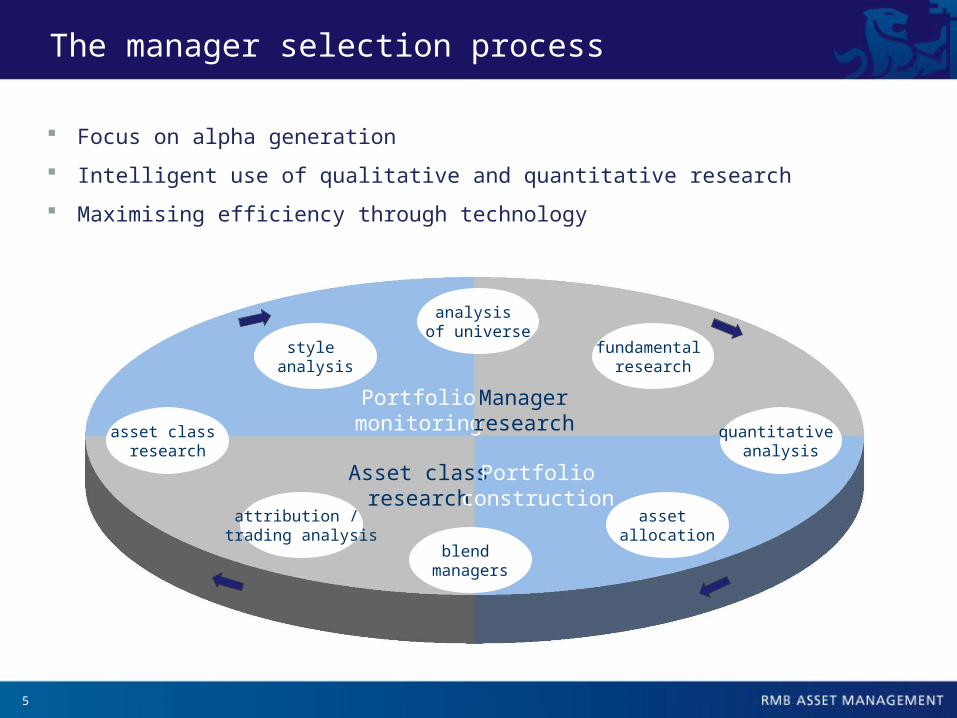
The manager selection process
Focus on alpha generation
Intelligent use of qualitative and quantitative research
Maximising efficiency through technology
Asset classresearch
Portfolio construction
Portfoliomonitoring
Manager research
analysis of universe
blend managers
quantitative analysis
asset class research
fundamental research
asset allocation
style analysis
attribution / trading analysis

6
Where active management works
Percentage of fund managers who underperform various performance hurdles
Source: PSN, Lipper Hindsight, RMB MultiManagers, * Average of US, UK and Eurozone
Asset class research
Inef
fici
ent
Index +1% +2% +4%
Eff
icie
nt Domestic Bonds* 84
Global Bonds
EM Equity
Japanese Equity
Sem
i-E
ffic
ien
t
UK Equities
US Equities
Global Equities
European Equities
Small Cap*
66 77
67 77
65 71 75
69 75 81
53 66 75
59 67 73
48 57 65 75
49 54 59 67
Efficient
Inefficient

7
Manager research and selection
Assets under management Investment style High alpha
Returns based style analysis Risk/attribution analysis
Check consistency through time
Philosophy Process People EvidenceRe-evaluation of
existing managers
Ongoing monitoring
Asset class screening / initial research
Quant analysis
Due diligence
Selection

8
Philosophy
Process
People
Evidence
Focus on skilful exponents of investment styles
Disciplined and repeatable process
Is the philosophy implemented consistently?
Skilful individuals leveraging the resources of a wider team rather than consensus based approaches
Through risk and return attributions, confirm risks being taken are consistent with the stated philosophy
Best of breed

9
RMB Global Equity Fund: incumbent managers
Tokyo:JP MorganShiozumi
London:JupiterNew StarCazenove
New York:American CenturyASBPzenaEvercore
Chicago:DriehausTimpani
Paris:Comgest
Wilmington:Marvin & Palmer
Connecticut:Lapides
Data: as at 17.10.2008
10
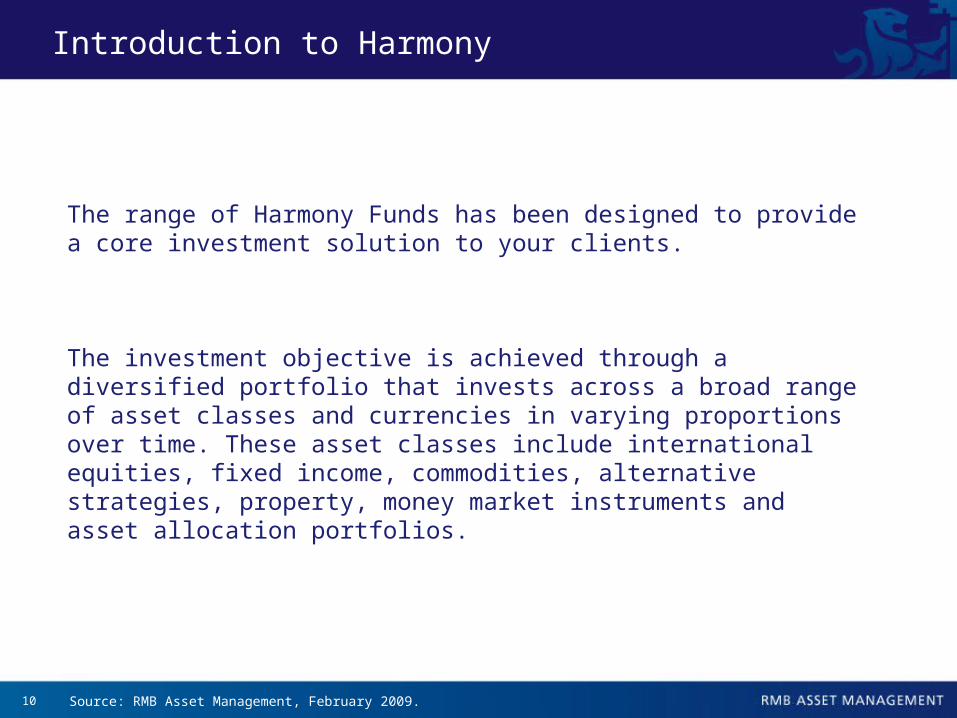
Introduction to Harmony
Source: RMB Asset Management, February 2009.
The range of Harmony Funds has been designed to provide a core investment solution to your clients.
The investment objective is achieved through a diversified portfolio that invests across a broad range of asset classes and currencies in varying proportions over time. These asset classes include international equities, fixed income, commodities, alternative strategies, property, money market instruments and asset allocation portfolios.

11
Harmony Portfolios Funds - Incorporated cells of RMBIS Mutual Fund ICCStructure
RegulatorGuernsey FinancialServices Commission
Fund Manager
RMB Investment Services Limited
Harmony PortfoliosFund Range
Asian Balanced FundAsian Growth FundEuro Balanced FundGBP Balanced FundGBP Growth FundUSD Balanced FundUSD Growth FundAUD Growth Fund
Designated ManagerRMB Investment Services Limited
Investment ManagerRMB Asset Management International Limited (London)
Distribution PartnerFinancial Partners
CustodianClose International Custody Services
AuditorsPrice Waterhouse Coopers
Harmony structure

12
Harmony fund detail
The funds are available in USD, EUR and GBP
Daily dealing
Initial Fee - 0.00%
Minimum Investment - US$25,000 (or currency equivalent)
Minimum Subsequent Investment - US$7,500 (or currency equivalent)
Minimum Redemption - not less than US$2,500 (or currency equivalent)
Dividend Policy - no dividends will be paid. All income received will be
reinvested
Source: RMB Asset Management, February 2009.

13
Harmony Class A and B fees
Fee description Class A Class B
Management fee - RMBIS 0.40% 0.90% (rebate to life companies)
Investment Management fee – RMB Asset Management International
0.25% 0.25%
Distribution Partner fee - FP 0.50% 0.50%
Underlying Asset Manager’s fee 1.00% (variable) 1.00% (variable)
ICC fees 0.05% (variable) 0.05% (variable)
Total (2) 2.20% 2.70%

14
Harmony accessibility
Friends Provident International– Lumps Sums– Regular savings products – Mirror funds– Menu products?
Skandia– Lumps Sums
Zurich, Scottish Provident, Generali– In progress
Trail fees on all
15
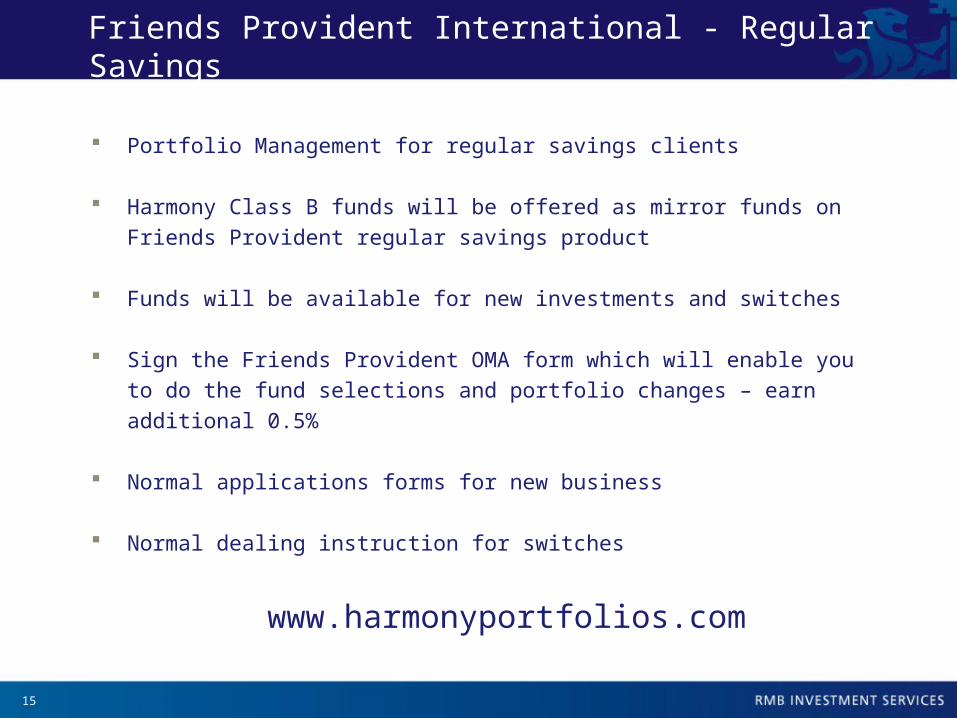
Friends Provident International - Regular Savings
Portfolio Management for regular savings clients
Harmony Class B funds will be offered as mirror funds on Friends Provident
regular savings product
Funds will be available for new investments and switches
Sign the Friends Provident OMA form which will enable you to do the fund
selections and portfolio changes – earn additional 0.5%
Normal applications forms for new business
Normal dealing instruction for switches
www.harmonyportfolios.com

16
Harmony Performance
USD Sep-09 3 Months 6 Months YTD 12 Months 24 months 36 monthsHarmony Portfolios US Dollar Growth Fund 2.6% 11.8% 22.1% 19.1% -3.3% -17.9% -5.2%Benchmark 1.9% 8.7% 18.5% 12.1% -1.7% -14.7% -3.5%Relative 0.8% 3.1% 3.6% 6.9% -1.6% -3.2% -1.7%* 45% Equity (30% S&P 500, 15% MSCI World ex USA), 15% Citigroup US WGBI, 5% JPM EMBI+, 15% Lipper Property Peer Group & 20% US Dollar 7-Day LIBID** Inception date 30 June 2005 AuM: 12 549 441
Harmony Portfolios US Dollar Balanced Fund 2.8% 10.0% 20.4% 17.4% -2.2% -15.0% -3.8%Benchmark 1.8% 6.5% 13.2% 9.2% 1.3% -6.2% 3.7%Relative 1.0% 3.6% 7.2% 8.2% -3.4% -8.7% -7.5%* 26% Equity (16% S&P 500, 10% MSCI World ex USA), 25% Citigroup US WGBI, 12% JPM EMBI+, 13% Lipper Property Peer Group & 24% US Dollar 7-Day LIBID** Inception date 30 June 2005 AuM: 6 424 231
GBP Sep-09 3 Months 6 Months YTD 12 Months 24 Months 36 MonthsHarmony Portfolios Sterling Growth Fund 3.9% 14.0% 20.9% 14.8% 9.1% -1.6% 6.5%Benchmark 3.0% 11.7% 15.7% 7.9% 6.3% -2.5% 4.4%Relative 0.9% 2.3% 5.2% 6.9% 2.8% 0.9% 2.0%* 45% Equity (% FTSE All Share, % MSCI World ex UK), 15% Citigroup GBP WGBI, 5% JPM EMBI+, 15% Lipper Property Peer Group & 20% GBP 7-Day LIBID** Inception date 30th June 2004 AuM: 4 568 899
Harmony Portfolios Sterling Balanced Fund 3.3% 11.8% 16.6% 11.4% 6.1% -1.3% 4.6%Benchmark 2.6% 8.8% 10.5% 4.7% 7.2% 4.6% 9.7%Relative 0.7% 3.0% 6.1% 6.7% -1.1% -5.9% -5.2%* 26% Equity (% FTSE All Share, % MSCI World ex UK), 25% Citigroup GBP WGBI, 12% JPM EMBI+, 13% Lipper Property Peer Group & 24% GBP 7-Day LIBID** Inception date 30th June 2004 AuM: 7 807 746

17
Harmony Performance
EUR Sep-09 3 Months 6 Months YTD 12 Months 24 Months 36 MonthsHarmony Portfolios Euro Balanced Fund 1.8% 8.9% 18.7% 14.5% -0.9% -13.6% -6.1%Benchmark 1.1% 7.3% 15.4% 11.9% 0.7% -11.4% -6.7%Relative 0.7% 1.6% 3.3% 2.6% -1.6% -2.1% 0.6%* 26% Equity (16% MSCI Europe ex UK, 10% MSCI World ex EMU), 25% Citigroup EUR WGBI, 12% JPM EMBI+, 13% Lipper Property Peer Group, 24% EUR 7-Day LIBID** Inception date 30th June 2004 AuM: 6 222 032
USD Sep-09 3 Months 6 Months YTD 12 Months 24 MonthsHarmony Asian Growth Portfolio* 2.9% 10.0% 25.2% 23.0% 1.7% -11.3%Benchmark 2.9% 8.6% 21.3% 20.1% 10.9% -4.7%Relative 0.0% 1.3% 3.9% 2.9% -9.2% -6.6%* 45% Equity (30% MSCI AC Asia ex Japan, 15% MSCI World ), 20% Citigroup US WGBI, 35% US Dollar 7-Day LIBID** Inception date 30 November 2007 AuM: 24 268 373
Harmony Asian Balanced Portfolio* 2.5% 8.0% 17.9% 14.9% -0.9% -13.0%Benchmark 1.9% 5.5% 11.7% 10.3% 8.0% 2.1%Relative 0.6% 2.6% 6.2% 4.6% -8.9% -15.1%* 26% Equity (16% MSCI AC Asia ex Japan, 10% MSCI World ), 37% Citigroup US WGBI, 37% US Dollar 7-Day LIBID** Inception date 30 November 2007 AuM: 9 364 755

18
Developments
• Mirror funds on Friends
• Bloomberg
• Harmony AUD Growth Fund– launch December 2009
• Benchmark review– 10% Property in Asian portfolios– Slightly more aggressive
• Weekly market commentary
• House view after Asset Allocation meetings

19
Benchmark review - Current
Harmony Asian Balanced
Harmony Asian Growth
Harmony Euro Balanced
Harmony Sterling Balanced
Harmony Sterling Growth
Harmony USD Balanced
Harmony USD Growth
Global Equity 10% 15% 10% 10% 15% 10% 15%
Local Equity 16% 30% 16% 16% 30% 16% 30%
26% 45% 26% 26% 45% 26% 45%
Emerging Market Debt
0% 0% 12% 12% 5% 12% 5%
Government Debt
37% 20% 25% 25% 15% 25% 15%
37% 20% 37% 37% 20% 37% 20%
Global Property
0% 0% 13% 13% 15% 13% 15%
Cash 37% 35% 24% 24% 20% 24% 20%
100% 100% 100% 100% 100% 100% 100%

20
Benchmark review – New composition
Harmony Asian Balanced
Harmony Asian Growth
Harmony Euro Balanced
Harmony Sterling Balanced
Harmony Sterling Growth
Harmony USD Balanced
Harmony USD Growth
Global Equity 12% 18% 12% 12% 18% 12% 18%
Local Equity 18% 32% 18% 18% 32% 18% 32%
30% 50% 30% 30% 50% 30% 50%
Emerging Market Debt
10% 5% 10% 10% 5% 10% 5%
Government Debt
35% 25% 35% 35% 25% 30% 25%
45% 30% 45% 45% 30% 45% 30%
Global Property
10% 10% 10% 10% 10% 10% 10%
Cash 15% 10% 15% 15% 10% 15% 10%
100% 100% 100% 100% 100% 100% 100%

21
Developments
• Mirror funds on Friends
• Bloomberg
• Harmony AUD Growth Fund– launch December 2009
• Benchmark review– 10% Property in Asian portfolios– Slightly more aggressive
• Weekly market commentary
• House view after Asset Allocation meetings

22

23
Developments
• Mirror funds on Friends
• Bloomberg
• Harmony AUD Growth Fund– launch December 2009
• Benchmark review– 10% Property in Asian portfolios– Slightly more aggressive
• Weekly market commentary
• House view after Asset Allocation meetings

24
House view

25
Investment Process
• Implementation in action

26
Recent Portfolio changes
Harmony Asian
BalancedOct
Changes
Harmony Asian
GrowthOct
Changes
Harmony Euro
BalancedOct
ChangesTotal allocationGlobal equity 7.3% 8.4% 12.3% 14.2% 7.3% 8.4%Local equity 15.6% 18.6% 26.1% 30.8% 15.6% 18.6%Global Emerging market equity 2.0% 3.0% 3.0% 4.0% 2.0% 3.0%Equities 25.0% 30.0% 41.3% 49.0% 25.0% 30.0%
High yield bonds 3.7% 3.9% 4.8% 2.2% 7.6% 3.8%Global convertible bonds 3.7% 3.9% 4.8% 2.2% 5.2% 3.8%Senior loans 3.2% 0.0% 1.5% 0.0% 2.5% 0.0%Investment grade corporate debt 16.5% 8.3% 9.6% 6.2% 11.6% 5.3%Emerging market debt 3.2% 5.3% 1.5% 3.6% 9.7% 14.5%Government bonds 24.3% 24.8% 15.6% 14.2% 19.2% 17.8%Bonds 54.5% 46.2% 37.9% 28.4% 55.7% 45.2%
Alternatives 7.9% 9.0% 10.2% 8.6% 5.9% 8.8%
Property 1.8% 4.8% 1.8% 4.8% 7.8% 10.4%
Cash 10.8% 10.0% 8.8% 9.2% 5.6% 5.6%
Total 100.0% 100.0% 100.0% 100.0% 100.0% 100.0%

27
Harmony Sterling
BalancedOct
Changes
Harmony Sterling Growth
Oct Changes
Harmony US Dollar Balanced
Oct Changes
Harmony US Dollar Growth
Oct Changes
Total allocationGlobal equity 7.3% 8.4% 12.3% 14.2% 7.3% 8.4% 12.3% 14.2%Local equity 15.6% 18.6% 26.1% 30.8% 15.6% 18.6% 26.1% 30.8%Global Emerging market equity 2.0% 3.0% 3.0% 4.0% 2.0% 3.0% 3.0% 4.0%Equities 25.0% 30.0% 41.3% 49.0% 25.0% 30.0% 41.3% 49.0%
High yield bonds 7.6% 3.8% 7.6% 3.0% 7.3% 3.8% 7.6% 3.0%Global convertible bonds 5.2% 3.8% 7.0% 3.0% 5.1% 3.8% 7.0% 3.0%Senior loans 2.3% 0.0% 1.0% 0.0% 2.2% 0.0% 1.0% 0.0%Investment grade corporate debt 12.4% 5.3% 6.0% 3.5% 11.6% 5.3% 5.4% 3.5%Emerging market debt 9.5% 14.5% 2.8% 6.5% 8.8% 14.5% 2.8% 6.5%Government bonds 19.2% 17.8% 11.4% 11.0% 19.2% 17.8% 10.8% 11.0%Bonds 56.1% 45.2% 35.9% 27.0% 54.1% 45.2% 34.7% 27.0%
Alternatives 3.9% 8.8% 8.2% 8.0% 5.9% 8.8% 10.2% 8.0%
Property 7.8% 10.4% 9.0% 12.0% 7.8% 10.4% 9.0% 12.0%
Cash 7.2% 5.6% 5.6% 4.0% 7.2% 5.6% 4.8% 4.0%
Total 100.0% 100.0% 100.0% 100.0% 100.0% 100.0% 100.0% 100.0%
Recent Portfolio changes

28
Rolling Asset Allocation – Harmony GBP Balanced
Equity, 37%
Equity, 26%
Equity, 17%Equity, 23% Equity, 25% Equity, 26%
Fixed Income, 20%
Fixed Income, 31%Fixed Income, 44%
Fixed Income, 44%
Fixed Income, 55%
Fixed Income, 37%
Alternatives, 16% Alternatives, 16%
Alternatives, 17% Alternatives, 6%
Property, 15%Property, 11% Property, 5% Property, 13%
Property, 9%
Property, 13%
Money Market, 7%
Money Market, 16% Money Market, 18%Money Market, 14%
Money Market, 10%
Money Market, 24%
Alternatives, 1%
0%
10%
20%
30%
40%
50%
60%
70%
80%
90%
100%
Jun-07 Jun-08 Dec-08 Jun-09 Sep-09 Benchmark

29
Rolling Asset Allocation – Harmony Asian Growth
Equity, 49%Equity, 45%
Equity, 31%
Equity, 45%Equity, 41%
Equity, 45%
Fixed Income, 5%Fixed Income, 19%
Fixed Income, 37%
Fixed Income, 37%Fixed Income, 38%
Fixed Income, 20%
Alternatives, 29%
Alternatives, 20% Alternatives, 10%
Alternatives, 10%Property, 12% Property, 8%
Property, 5%
Property, 1%Money Market, 8%
Money Market, 17%
Money Market, 7%Money Market, 11%
Money Market, 35%Alternatives, 10%
Property, 0%
0%
10%
20%
30%
40%
50%
60%
70%
80%
90%
100%
Jun-07 Jun-08 Dec-08 Jun-09 Sep-09 Benchmark

30
Why Harmony
• Portfolio management solution– Illustrated on fact sheets – drill down to underlying funds– Actively managed– Access to the fund managers in London– Bespoke to Financial Partners
• Monthly fact sheets, Viewpoint newsletter, Weekly Market Commentary,
Monthly House View and Comprehensive quarterly report
• Daily trading
• Prices on Bloomberg
• Accepted on most life company platforms
• Trail fees on lump sums and regulars
• Disciplined and repeatable process

Thank You

32
Important NotesRMB Asset Management is the trading name for RMB Asset Management International Limited. This document does not constitute an offer or solicitation to any person in any jurisdiction in which it is not authorised or permitted, or to anyone who would be an unlawful recipient, and is only intended for use by original recipients and addressees. The original recipient is solely responsible for any actions in further distributing this document, and should be satisfied in doing so that there is no breach of local legislation or regulation. The information is intended solely for use by our clients or prospective clients, and should not be reproduced or distributed except via original recipients acting as professional intermediaries. This document is not for distribution in the United States.
Prospective investors should inform themselves and if need be take appropriate advice regarding applicable legal, taxation and exchange control regulations in countries of their citizenship, residence or domicile which may be relevant to the acquisition, holding, transfer, redemption or disposal of any investments herein solicited.
Any opinions expressed herein are those at the date this material is issued. Data, models and other statistics are sourced from our own records, unless otherwise stated herein. We believe that the information contained is from reliable sources, but we do not guarantee the relevance, accuracy or completeness thereof. Unless provided under UK law, RMB Asset Management does not accept liability for irrelevant, inaccurate or incomplete information contained, or for the correctness of opinions expressed.
We caution that the value of investments in discretionary accounts, and the income derived, may fluctuate and it is possible that an investor may incur losses, including a loss of the principal invested. Past performance is not generally indicative of future performance. Investors whose reference currency differs from that in which the underlying assets are invested may be subject to exchange rate movements that alter the value of their investments.
Important notes

33
Important Notes (Continued)Our investment mandates in alternative strategies and hedge funds permit us to invest in unregulated funds that may be highly volatile. Although alternative strategies funds will seek to follow a wide diversification policy, these funds may be subject to sudden and/or large falls in value. The illiquid nature of the underlying funds is such that alternative strategies funds deal infrequently and require longer notice periods for redemptions. These Investments are therefore not readily realisable. If an alternative strategies fund fails to perform, it may not be possible to realise the investment without further loss in value. These unregulated funds may engage in the short selling of securities or may use a greater degree of gearing than is permitted for regulated funds (including the ability to borrow for a leverage strategy). A relatively small price movement may result in a disproportionately large movement in the investment value. The purpose of gearing is to achieve higher returns associated with larger investment exposures, but has concomitant exposure to loss if positive performance is not achieved. Reliable information about the value of an investment in an alternative strategies fund may not be available (other than at the fund’s infrequent valuation points). Under our multi-management arrangements, we selectively appoint underlying sub-investment managers and funds to actively manage underlying asset holdings in the pursuit of achieving mandated performance objectives. Annual investment management fees are payable both to the multimanager and the manager of the underlying assets at rates contained in the offering documents of the relevant portfolios (and may involve performance fees where expressly indicated therein). RMB Asset Management International Limited (Company Registration No. 3733094) is a member of the FirstRand Group, and has its registered office at Two London Bridge, London SE1 9RA. RMB Asset Management International Limited is authorised and regulated by the Financial Services Authority in the United Kingdom, and is an authorised Financial Services Provider pursuant to the Financial Advisory and Intermediary Services Act 37 of 2002 in South Africa. © RMB Asset Management International Limited 2008
Important notes (continued)