hardware performance monitoring &...
TRANSCRIPT

Share:
© 2013, SolarWinds Worldwide, LLC. All rights reserved.
Hardware Performance Monitoring & Management

Share: 2
Your Server Hardware is the Backbone It’s critical to have a close view on the performance of your hardware on which your business critical applications run. Failure of any of the server’s internal components can negatively affect application availability. More often, servers can develop critical problems without prior warning, which eventually result in service downtime.
Your server hardware is the backbone of your critical business services. To avoid any downtime and facilitate optimal performance, it’s essential to have a system in place that continually monitors the health and performance of your critical server hardware components. With proactive monitoring of key hardware availability metrics, you can get ahead of problems before they become severe.
Unplanned outages causing downtime can be costly. Source
Complexity of Hardware Monitoring The biggest complexity in effectively managing hardware is the diverse nature of the IT infrastructure which is typically comprised of equipment from multiple manufacturers. Each manufacturer provides their own solution for monitoring and managing their hardware:
• Dell™ provides OpenManageSM • IBM System x® provides the Systems Director™ • HP® provides Systems Insight Manager™
If you have multiple hardware vendors, then you have multiple monitoring user interfaces (UIs). Now add to that UIs or scripts for monitoring operating system, virtual machine, and application performance. Monitoring all these components is quite important in order for System Administrators (SysAdmins) can narrow down potential issues in the case of a service failure. Any delay in identifying server malfunctions can cause damage to your hardware, resulting in a halt of all the applications running on that specific server.
Share: 3
Monitoring Hardware using SolarWinds Server & Application Monitor SolarWinds® Server & Application Monitor (SAM) delivers comprehensive monitoring, alerting, and reporting capabilities and provides agentless performance and availability monitoring, alerting, and reporting for hundreds of applications, server types, and vital hardware statistics—all rolled into one customizable dashboard. SAM allows you to easily consolidate monitoring of your entire server environment with more than 150 ready-to-run monitors.
SAM is an easy-to-use and cost-effective hardware performance monitoring solution for your multi-vendor network. It provides expert guidance on what to monitor, why to monitor it, and customizable dashboards and reports showing trends, capacity, and performance.
Proactively Monitor Hardware Problems With proactive monitoring of key hardware availability metrics, you can get ahead of potential problems before they become severe. Sever & Application Monitor examines key health indicators of your HP ProLiant®, Dell PowerEdge™, IBM System x, and VMware® ESX/ESXi host servers leveraging SNMP, WMI, CIM, and VMware API protocols. Key metrics monitored include: • Hard drive status • Array status • Array controller status • Power supply status • Fan status • Chassis intrusion status • Chassis temperature and/or status • Chassis fan speed and/or status • CPU temperature and/or status • CPU fan speed and/or status • Memory module status • Voltage regulator status • Machine serial number
SAM monitors hardware by polling nodes and utilizing the Hardware Monitoring Agent software provided by the hardware manufacturer. Hardware monitoring is achieved by polling via SNMP or WMI, depending on the node. For SNMP and WMI nodes, hardware monitoring must be enabled manually through SAM's Web console.
Note: If you run a scheduled Network Sonar Discovery of your existing servers, SAM will automatically collect any servers that support hardware health information the next time the scheduled discovery runs.
Share: 4
Hardware Monitoring & VMware Hardware monitoring is automatically enabled for VMware ESX and ESXi servers. Monitoring of VMware servers uses the CIM protocol which should be enabled by default after the installation of ESX/ESXi hosts. If installing the Hardware Monitoring Agent software on a VMware host, hardware information will be detected by SAM and the checkbox to monitor Hardware Health of Servers will be displayed, even where hardware information might already be collected via the vCenter® using the VMware API.
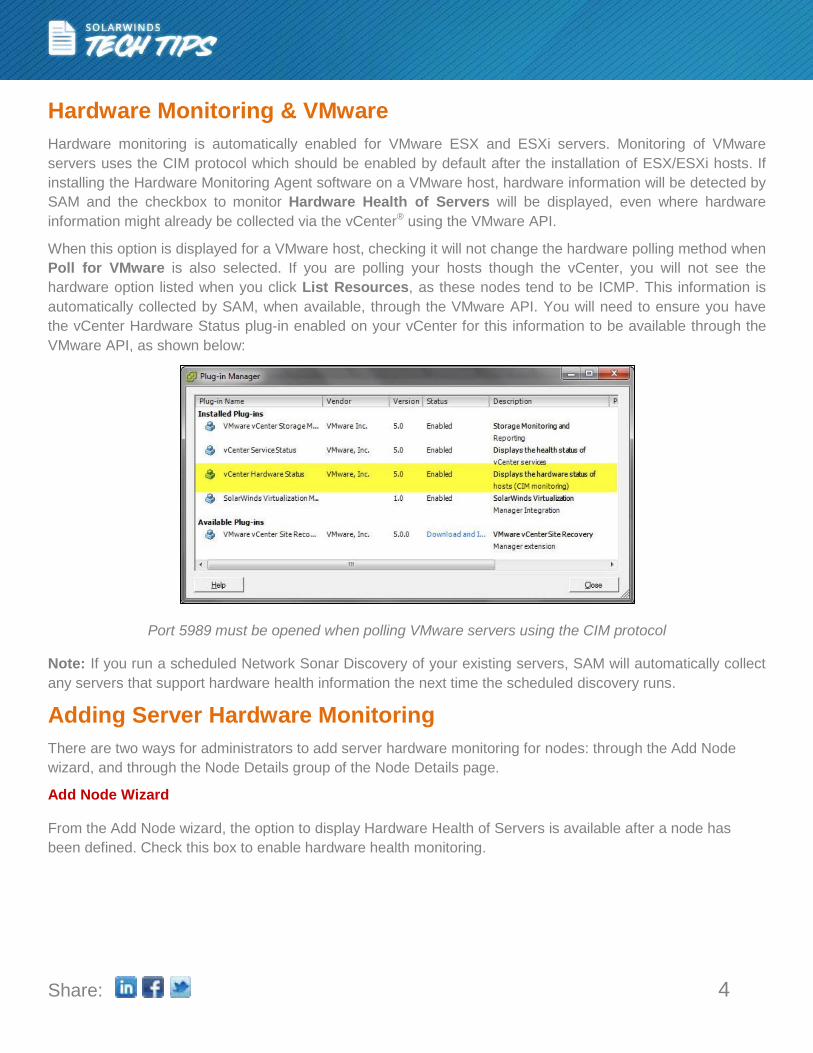
When this option is displayed for a VMware host, checking it will not change the hardware polling method when Poll for VMware is also selected. If you are polling your hosts though the vCenter, you will not see the hardware option listed when you click List Resources, as these nodes tend to be ICMP. This information is automatically collected by SAM, when available, through the VMware API. You will need to ensure you have the vCenter Hardware Status plug-in enabled on your vCenter for this information to be available through the VMware API, as shown below:
Port 5989 must be opened when polling VMware servers using the CIM protocol
Note: If you run a scheduled Network Sonar Discovery of your existing servers, SAM will automatically collect any servers that support hardware health information the next time the scheduled discovery runs.
Adding Server Hardware Monitoring There are two ways for administrators to add server hardware monitoring for nodes: through the Add Node wizard, and through the Node Details group of the Node Details page.
Add Node Wizard
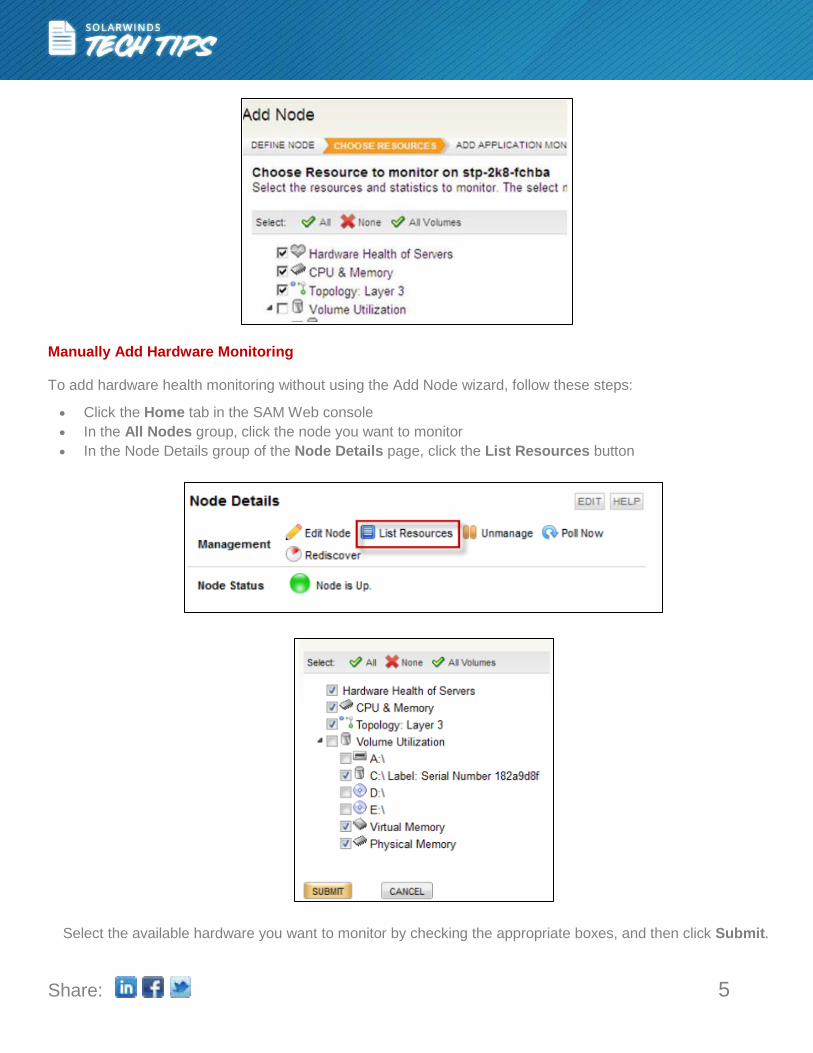
From the Add Node wizard, the option to display Hardware Health of Servers is available after a node has been defined. Check this box to enable hardware health monitoring.
Share: 5
Manually Add Hardware Monitoring
To add hardware health monitoring without using the Add Node wizard, follow these steps:
• Click the Home tab in the SAM Web console • In the All Nodes group, click the node you want to monitor • In the Node Details group of the Node Details page, click the List Resources button
Select the available hardware you want to monitor by checking the appropriate boxes, and then click Submit.

Share: 6
To disable hardware monitoring, navigate back to this screen and uncheck Hardware Health of Servers, then click Submit.
Hardware Details Once you have chosen the hardware you want to monitor, the Hardware Health Details group appears on the Node Details page, providing general information about your hardware and its status.
Note: This view will be hidden if hardware monitoring is disabled.
Current Hardware Health Status The current status of your hardware's health can be determined by the Current Hardware Health grouping. The status for most items will read Ok, Warning, or Critical, depending upon the set threshold values and the returned values. The icon colors for each item will change between green, yellow, and red, respectively. Gray icons indicate a status of Unknown, which suggests a polling failure. You can click on the [+] and [-] icons to expand and collapse a particular tree branch of hardware that is being monitored. When collapsed, the top level view (or roll-up status) of each hardware item will display the worst status of an item in that branch.
Share: 7
Note: The default temperature measurement is in degrees Fahrenheit (ᵒF). To change this to Celsius (ᵒC), from the Web console, navigate to Settings > Manage Accounts > Select Account > Edit. The Temperature Unit dropdown menu can be found under the Server & Application Monitor Settings category.
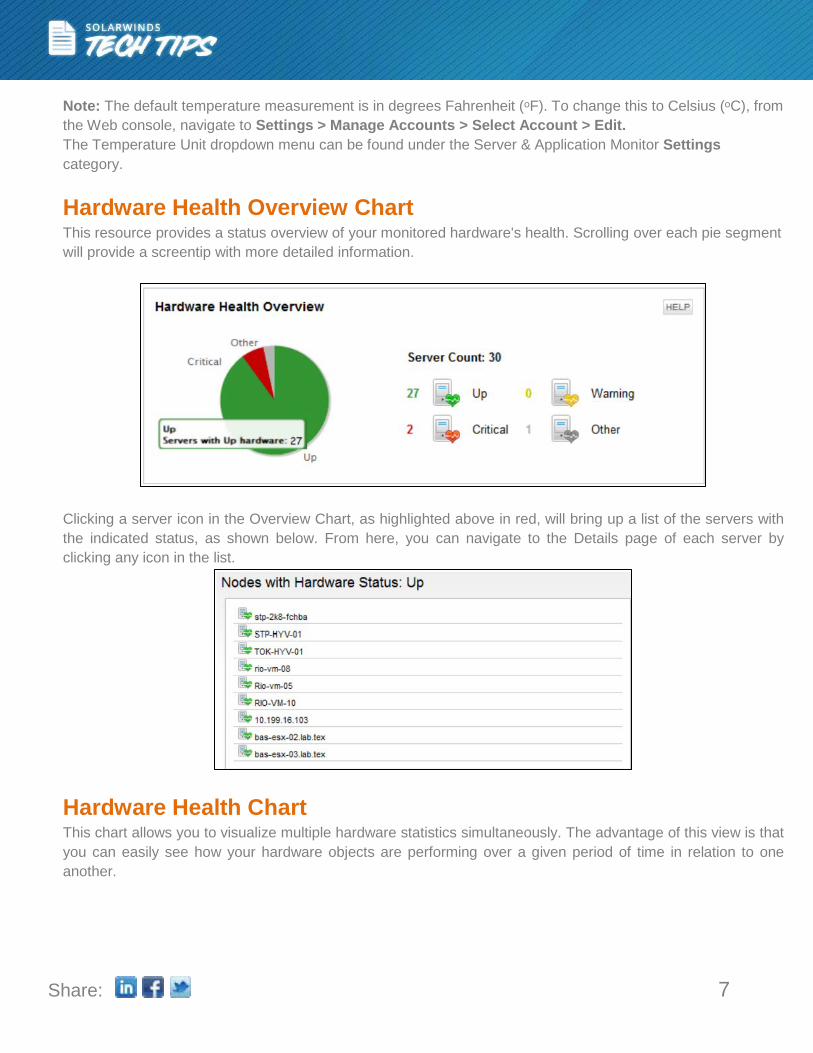
Hardware Health Overview Chart This resource provides a status overview of your monitored hardware's health. Scrolling over each pie segment will provide a screentip with more detailed information.
Clicking a server icon in the Overview Chart, as highlighted above in red, will bring up a list of the servers with the indicated status, as shown below. From here, you can navigate to the Details page of each server by clicking any icon in the list.
Hardware Health Chart This chart allows you to visualize multiple hardware statistics simultaneously. The advantage of this view is that you can easily see how your hardware objects are performing over a given period of time in relation to one another.

Share: 8
Note: This view will be hidden if hardware monitoring is disabled. Customizing the Hardware Health Chart Click Edit at the top-right of the chart to be taken to the following screen. You can customize the following user-specific aspects of the chart display: • Sample Interval – This is the interval of time that will be displayed on the chart. • Title – This will give a title to display for your chart. • Subtitle – This will give a subtitle to display for your chart. • Temperature Display – This allows you to set the temperature units. This will affect all charts that display
temperature for the current user. • Time Period for Chart – This allows you to select the span of time the chart will display. • Click Submit to save the settings.

Share: 9
Clicking the chart itself opens the following screen which allows you to edit multiple, self-explanatory settings pertaining to the Hardware Health chart.
Click Submit to save the settings. Note: The Raw Data button will deliver the chart data by downloading an Excel spreadsheet. The Chart Data button displays the data in a Web page.

Share: 10
Alerting on Hardware Health SAM has the ability to create alerts on all aspects of monitored hardware. You can access these alerts in the Advanced Alert Manager by navigating to the Trigger Condition tab, then selecting either APM: Hardware, APM: Hardware Type, or APM: Hardware Sensor from the Type of Property to Monitor dropdown menu, as shown below. Out-of-the-box alerts are set according to manufacturer best practices.
Manually Changing Alert Thresholds You can manually define alerting thresholds for any hardware sensor or category in the Advanced Alert Manager. Below is an example of how to define an alert for when a fan's speed exceeds 3600 RPM.

Share: 11
Server Environment Monitoring SysAdmins rely on other data center components working like UPS devices and Air Conditioners.
Environmental monitoring systems prevent hardware damage to server rooms, data centers, and network closets with critical condition alerts.
Environmental threats in your server room can cause more harm than hardware or software glitches. Redundant hardware, backup tapes, UPS battery arrays, generators, and other fault-tolerance measures can all be rendered useless if your server room overheats or floods. Some key server environment monitoring elements:
• Temperature: The most common environmental threat in any server room is heat. It’s essential to detect significant rises or drops in temperature, and receive notifications when heating issues occur.
• Humidity: Discovering abnormal humidity conditions is key in server environment monitoring. It’s important that appropriate humidity levels for each sensor's environment are clearly defined.
• Detecting the Presence of Water: Whether it's a tripped sprinkler system or a flash flood, a server room or wiring closet should be water proof. Receiving notifications as soon as water is detected is another critical element in efficient monitoring.
• Airflow: Good airflow is vital for both temperature and humidity control. Airflow recommendations vary depending on the size of the environment, and are expressed in volume as cubic feet per minute (cfm).
• Computer Room Air Conditioner/Handler: CRAC units must be monitored constantly. • PDU & Electrical System status: Electrical circuits within the environment should be watched continuously
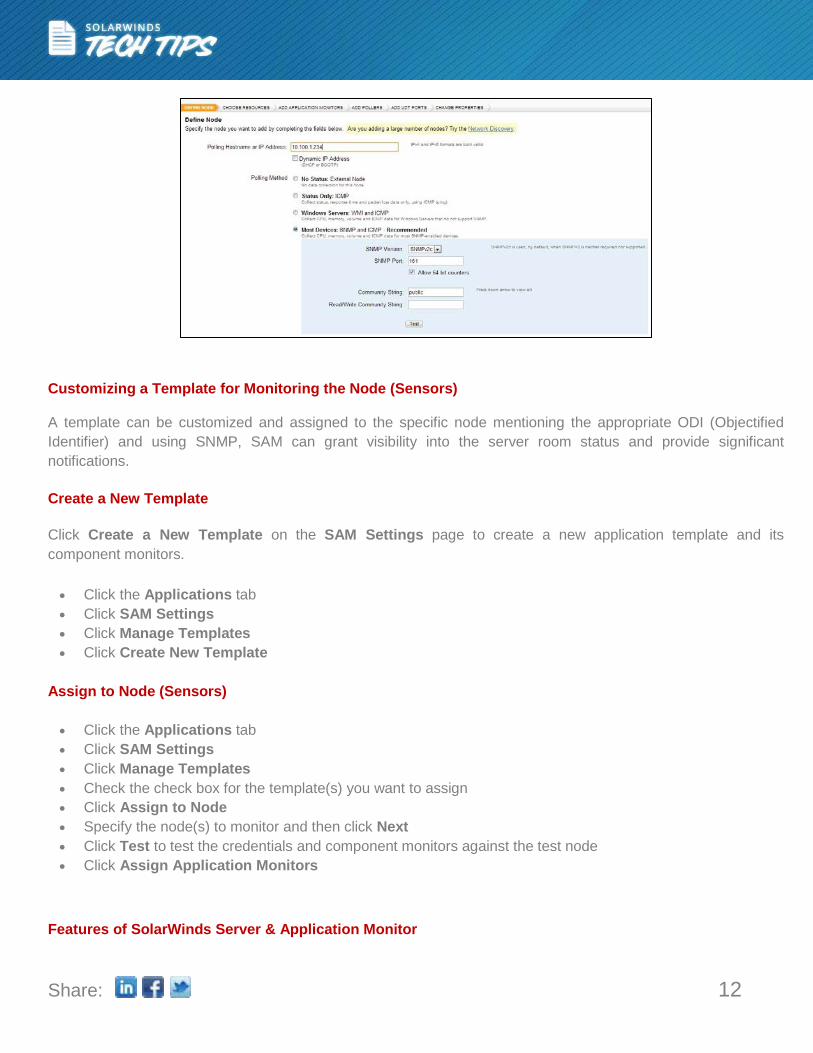
for unexpected fluctuations or disruptions. SolarWinds Server & Application Monitor can integrate with your building environmental system to monitor data center environmental conditions alongside servers and applications. Adding Nodes (Sensors) for Monitoring The following procedure details the steps required to add a device (e.g. Wall Monitor) to be monitored in the SolarWinds Web Console.
• Click Settings in the top right of the Web console. • Click Manage Nodes in the Node & Group Management grouping of the SolarWinds Website Administration
page. • Click Add Node on the Node Management toolbar. • Provide the hostname or IP Address of the node you want to add in the Hostname or IP Address field. • If the IP address of the node you are adding is dynamically assigned, check Dynamic IP Address. • If you are using SNMP to communicate with your added node, click Validate SNMP after entering all
credentials to confirm your SNMP settings. • Click Next. • Check the objects for the added node that you want SolarWinds to monitor or manage. • After you have selected objects for monitoring, click Next. • Click Ok, Add Node when you have completed properties configuration. • If you have successfully added the node, click Ok in the dialog box.
Share: 12
Customizing a Template for Monitoring the Node (Sensors) A template can be customized and assigned to the specific node mentioning the appropriate ODI (Objectified Identifier) and using SNMP, SAM can grant visibility into the server room status and provide significant notifications. Create a New Template Click Create a New Template on the SAM Settings page to create a new application template and its component monitors. • Click the Applications tab • Click SAM Settings • Click Manage Templates • Click Create New Template
Assign to Node (Sensors) • Click the Applications tab • Click SAM Settings • Click Manage Templates • Check the check box for the template(s) you want to assign • Click Assign to Node • Specify the node(s) to monitor and then click Next • Click Test to test the credentials and component monitors against the test node • Click Assign Application Monitors
Features of SolarWinds Server & Application Monitor
Share: 13
• Monitors performance and user experience for virtually any application – Microsoft Exchange, Active Directory®, IIS, any ODBC database, and more
• Monitors server hardware faults and operating systems across platforms – Windows, UNIX®, Linux®, and more
• Provides expert guidance on what to monitor, why to monitor it, and optimal thresholds • Includes customizable dashboards and reports showing trends, capacity, and performance • Downloads and deploys in less than an hour, is simple to use, and easy on your budget
SolarWinds (NYSE: SWI) provides powerful and affordable IT management software to customers worldwide - from Fortune 500 enterprises to small businesses. The company works to put its users first and remove the obstacles that have become “status quo” in traditional enterprise software. SolarWinds products are downloadable, easy to use and maintain, and provide the power, scale, and flexibility needed to address users’ management priorities. SolarWinds online user community, thwack!, is a gathering-place where tens of thousands of IT pros solve problems, share technology, and participate in product development for all of the company’s products. Learn more today at SolarWinds.
For additional information, please contact SolarWinds at 866.530.8100 or e-mail [email protected].
To locate an international reseller near you, visit http://www.solarwinds.com/partners/reseller_locator.aspx