harbor seal stocks nmml draft 2013 - southwest fisheries science
TRANSCRIPT

U.S. PACIFIC MARINE MAMMAL STOCK ASSESSMENTS (DRAFT): 2013
James V. Carretta1, Erin Oleson3, D.W. Weller1,
A.R. Lang1, Karin A. Forney2, Jason Baker3, Brad Hanson5, Karen Martien1, Marcia M. Muto4,
Tony Orr4, Harriet Huber4, Mark S. Lowry1, Jay Barlow1, Deanna Lynch6, Lilian Carswell7, Robert L. Brownell Jr.8, and David K. Mattila9
NOAA-TM-NMFS-SWFSC-XXX
U. S. DEPARTMENT OF COMMERCE National Oceanic and Atmospheric Administration
National Marine Fisheries Service Southwest Fisheries Science Center
1 - NOAA Fisheries, Southwest Fisheries Science Center, 8901 La Jolla Shores Drive, La Jolla, CA 92037 2 - NOAA Fisheries, Southwest Fisheries Science Center, 110 Shaffer Road, Santa Cruz, CA 95060. 3 - NOAA Fisheries, Pacific Islands Fisheries Science Center, 2570 Dole Street, Honolulu, HI 96822. 4 - NOAA Fisheries, NOAA Fisheries, National Marine Mammal Laboratory, 7600 Sand Point Way, N.E., Seattle, WA 98115. 5 - NOAA Fisheries, Northwest Fisheries Science Center, 2725 Montlake Boulevard, East Seattle WA 98112. 6 - U.S. Fish and Wildlife Service, Western Washington Fish and Wildlife Office, 510 Desmond Drive SE, Suite 102, Lacey, WA 98503. 7 - U.S. Fish and Wildlife Service, 2493 Portola Road, Suite B, Ventura, California, 9300 8 - NOAA Fisheries, Southwest Fisheries Science Center, 1352 Lighthouse Ave., Pacific Grove, CA 93950. 9 - NOAA Hawaiian Islands Humpback Whale National Marine Sanctuary, 6600 Kalaniana’ole Hwy, #301, Honolulu, HI 96825.

Stock assessment reports and appendices revised in 2013 are underlined; all others will be reprinted as they appear in the 2012 Pacific Region Stock Assessment Reports (Carretta et al. 2013). PINNIPEDS CALIFORNIA SEA LION (Zalophus californianus californianus): U.S. Stock .......................................................... x HARBOR SEAL (Phoca vitulina richardii): California Stock ..................................................................................... x HARBOR SEAL (Phoca vitulina richardii): Oregon & Washington Coast Stock ...................................................... 1 HARBOR SEAL (Phoca vitulina richardii): Washington Inland Waters Stocks (Hood Canal, Southern Puget Sound, and Northern Washington Inland Waters) ...................................................................................................... 10 NORTHERN ELEPHANT SEAL (Mirounga angustirostris): California Breeding Stock .......................................... x GUADALUPE FUR SEAL (Arctocephalus townsendi) ............................................................................................... x NORTHERN FUR SEAL (Callorhinus ursinus): California Stock ............................................................................ 18 HAWAIIAN MONK SEAL (Monachus schauinslandi) ............................................................................................. 25 CETACEANS - U.S. WEST COAST HARBOR PORPOISE (Phocoena phocoena vomerina): Morro Bay Stock ............................................................... 33 HARBOR PORPOISE (Phocoena phocoena vomerina): Monterey Bay Stock .......................................................... 39 HARBOR PORPOISE (Phocoena phocoena vomerina): San Francisco-Russian River Stock ................................... 44 HARBOR PORPOISE (Phocoena phocoena vomerina): Northern California/Southern Oregon Stock ..................... 49 HARBOR PORPOISE (Phocoena phocoena vomerina): Northern Oregon/Washington Coast Stock ...................... 54 HARBOR PORPOISE (Phocoena phocoena vomerina): Washington Inland Waters Stock ....................................... x DALL'S PORPOISE (Phocoenoides dalli dalli): California/Oregon/Washington Stock ............................................. x PACIFIC WHITE-SIDED DOLPHIN (Lagenorhynchus obliquidens): California/Oregon/Washington, Northern and Southern Stocks ................................................................... 60 RISSO'S DOLPHIN (Grampus griseus): California/Oregon/Washington Stock ......................................................... x COMMON BOTTLENOSE DOLPHIN (Tursiops truncatus truncatus): California Coastal Stock ............................ x COMMON BOTTLENOSE DOLPHIN (Tursiops truncatus truncatus): California/Oregon/Washington Offshore Stock .......................................................................................................... 67 STRIPED DOLPHIN (Stenella coeruleoalba): California/Oregon/Washington Stock ................................................ x SHORT-BEAKED COMMON DOLPHIN (Delphinus delphis delphis): California/Oregon/Washington Stock ....... x LONG-BEAKED COMMON DOLPHIN (Delphinus capensis capensis): California Stock ....................................... x NORTHERN RIGHT-WHALE DOLPHIN (Lissodelphis borealis): California/Oregon/Washington ........................ x KILLER WHALE (Orcinus orca): Eastern North Pacific Offshore Stock ................................................................... x KILLER WHALE (Orcinus orca): Eastern North Pacific Southern Resident Stock .................................................. 73 SHORT-FINNED PILOT WHALE (Globicephala macrorhynchus): California/Oregon/Washington ...................... x BAIRD'S BEAKED WHALE (Berardius bairdii): California/Oregon/Washington Stock ....................................... 80 MESOPLODONT BEAKED WHALES (Mesoplodon spp.): California/Oregon/Washington Stocks ...................... 86 CUVIER'S BEAKED WHALE (Ziphius cavirostris): California/Oregon/Washington Stock ................................... 93 PYGMY SPERM WHALE (Kogia breviceps): California/Oregon/Washington Stock ............................................... x DWARF SPERM WHALE (Kogia sima): California/Oregon/Washington Stock ........................................................ x SPERM WHALE (Physeter macrocephalus): California/Oregon/Washington Stock ................................................. x GRAY WHALE (Eschrichtius robustus): Eastern North Pacific Stock and Pacific Coast Feeding Group ............... 99 HUMPBACK WHALE (Megaptera novaeangliae): California/Oregon/Washington Stock .................................... 115 BLUE WHALE (Balaenoptera musculus musculus): Eastern North Pacific Stock .................................................. 126 FIN WHALE (Balaenoptera physalus physalus): California/Oregon/Washington Stock ........................................ 134 SEI WHALE (Balaenoptera borealis borealis): Eastern North Pacific Stock ............................................................. x MINKE WHALE (Balaenoptera acutorostrata scammoni): California/Oregon/Washington ...................................... x CETACEANS – HAWAII & WESTERN PACIFIC ROUGH-TOOTHED DOLPHIN (Steno bredanensis): Hawaiian Stock .................................................................. 141 ROUGH-TOOTHED DOLPHIN (Steno bredanensis): American Samoa Stock .......................................................... x RISSO'S DOLPHIN (Grampus griseus): Hawaiian Stock ........................................................................................ 145

COMMON BOTTLENOSE DOLPHIN (Tursiops truncatus truncatus): Hawaiian Islands Stock Complex (Kauai / Niihau, Oahu, 4-Island, Hawaii Island, and Hawaii Pelagic Stocks .......................................................................... 150 PANTROPICAL SPOTTED DOLPHIN (Stenella attenuata attenuata): Hawaiian Pelagic, Hawaii Island, Oahu, 4 Islands Stocks ............................................................................................................................................................ 160 SPINNER DOLPHIN (Stenella longirostris longirostris): Hawaii Pelagic, Hawaii Island, Oahu / 4 Islands, Kauai / Niihau, Kure / Midway, and Pearl and Hermes Reef Stocks ......................................................................................... x SPINNER DOLPHIN (Stenella longirostris longirostris): American Samoa Stock ..................................................... x STRIPED DOLPHIN (Stenella coeruleoalba): Hawaiian Stock ............................................................................... 169 FRASER’S DOLPHIN (Lagenodelphis hosei): Hawaiian Stock .............................................................................. 174 MELON-HEADED WHALE (Peponocephala electra): Hawaiian Islands and Kohala Resident Stocks ................ 177 PYGMY KILLER WHALE (Feresa attenuata): Hawaiian Stock ............................................................................ 184 FALSE KILLER WHALE (Pseudorca crassidens): Hawaiian Islands Stock Complex (Hawaii Pelagic, Hawaii Insular, and Northwestern Hawaiian Islands) ............................................................................................................ 188 FALSE KILLER WHALE (Pseudorca crassidens): Palmyra Atoll Stock ................................................................... x FALSE KILLER WHALE (Pseudorca crassidens): American Samoa Stock ............................................................. x KILLER WHALE (Orcinus orca): Hawaiian Stock ................................................................................................. 200 SHORT-FINNED PILOT WHALE (Globicephala macrorhynchus): Hawaiian Stock ........................................... 204 BLAINVILLE’S BEAKED WHALE (Mesoplodon densirostris): Hawaiian Stock ................................................. 212 CUVIER'S BEAKED WHALE (Ziphius cavirostris): Hawaiian Stock .................................................................... 219 LONGMAN’S BEAKED WHALE (Indopacetus pacificus): Hawaiian Stock ......................................................... 226 PYGMY SPERM WHALE (Kogia breviceps): Hawaiian Stock .............................................................................. 231 DWARF SPERM WHALE (Kogia sima): Hawaiian Stock ...................................................................................... 236 SPERM WHALE (Physeter macrocephalus): Hawaiian Stock................................................................................. 241 BLUE WHALE (Balaenoptera musculus musculus): Central North Pacific Stock .................................................. 247 FIN WHALE (Balaenoptera physalus physalus): Hawaiian Stock ........................................................................... 252 BRYDE'S WHALE (Balaenoptera edeni): Hawaiian Stock ..................................................................................... 256 SEI WHALE (Balaenoptera borealis borealis): Hawaiian Stock ............................................................................. 260 MINKE WHALE (Balaenoptera acutorostrata scammoni): Hawaiian Stock .......................................................... 264 HUMPBACK WHALE (Megaptera novaeangliae): American Samoa Stock .............................................................. x APPENDICES APPENDIX 1: Description of U.S. Commercial Fisheries ....................................................................................... 268 APPENDIX 2: Cetacean Survey Effort ......................................................................................................................... x APPENDIX 3: Summary of 2013 U.S. Pacific Marine Mammal Stock Assessment Reports .................................. 305 APPENDIX 4: Sea Otter stock assessments ................................................................................................................. x

PREFACE Under the 1994 amendments to the Marine Mammal Protection Act (MMPA), the National Marine Fisheries Service (NMFS) and the U.S. Fish and Wildlife Service (USFWS) are required to publish Stock Assessment Reports for all stocks of marine mammals within U.S. waters, to review new information every year for strategic stocks and every three years for non-strategic stocks, and to update the stock assessment reports when significant new information becomes available. Pacific region stock assessments include those studied by the Southwest Fisheries Science Center (SWFSC, La Jolla, CA), the Pacific Islands Fisheries Science Center (PIFSC, Honolulu, HI), the National Marine Mammal Laboratory (NMML, Seattle, WA), and the Northwest Fisheries Science Center (NWFSC, Seattle, WA).
The 2013 Pacific marine mammal stock assessments include revised reports for 52 Pacific marine mammal stocks under NMFS jurisdiction, including 13 “strategic” stocks: Hawaiian monk seal, Southern Resident killer whale, California/Oregon/Washington populations of mesoplodont beaked whales, California/Oregon/Washington Cuvier’s beaked whale, California/Oregon/Washington humpback whale, Eastern North Pacific blue whale, California/Oregon/Washington fin whale, Main Hawaiian Islands Insular false killer whale, Hawaii Pelagic false killer whale, Hawaii sperm whale, Central North Pacific blue whale, Hawaii fin whale, and Hawaii sei whale. New abundance estimates are available for 25 stocks in the Pacific Islands region and 13 U.S. west coast stocks in the Southwest Region. Stock Assessments for Alaska region marine mammals are published by the National Marine Mammal Laboratory (NMML) in a separate report.
Four new cetacean stocks from the Pacific Islands are introduced in this volume, based on new information about island-associated animals: 1) O’ahu spotted dolphin, 2) 4-Islands Region spotted dolphin, 3) Hawaii Island spotted dolphin, and, 4) Kohala Resident melon-headed whales. Three new prospective stocks of harbor seals in Washington inland waters are presented (Hood Canal, Southern Puget Sound, and Washington Inland Waters), based on recent genetic and pupping phenology data (Huber 2010, 2012). The San Miguel Island stock of northern fur seal has been renamed the ‘California Northern Fur Seal stock’, to reflect that in addition to San Miguel Island, this species regularly breeds at the Farallon Islands of California. The ‘Hawaiian’ stocks of Blainville’s beaked whale and Cuvier’s beaked whale have been renamed ‘Hawaii Pelagic’ stocks to distinguish them from insular animals around the Main Hawaiian Islands that may warrant separate stock designation in the future.
NMFS updated its serious injury designation and reporting process, which uses guidance from previous serious injury workshops, expert opinion, and analysis of historic injury cases to develop new criteria for distinguishing serious from non-serious injury (Angliss and DeMaster 1998, Andersen et al. 2008, NOAA 2012). NMFS defines serious injury as an “injury that is more likely than not to result in mortality”. Injury determinations for stock assessments revised in 2013 or later incorporate the new serious injury guidelines, based on the most recent 5-year period for which data are available. This is a working document and individual stock assessment reports will be updated as new information on marine mammal stocks and fisheries becomes available. Background information and guidelines for preparing stock assessment reports are reviewed in Wade and Angliss (1997). The authors solicit any new information or comments which would improve future stock assessment reports.
Draft versions of the 2013 stock assessment reports were reviewed by the Pacific Scientific Review Group at the April 2013 meeting. These Stock Assessment Reports summarize information from a wide range of original data sources and an extensive bibliography of all sources is given in each report. We strongly urge users of this document to refer to and cite original literature sources cited within the stock assessment reports rather than citing this report or previous Stock Assessment Reports. References: Andersen, M. S., K. A. Forney, T. V. N. Cole, T. Eagle, R. Angliss, K. Long, L. Barre, L. Van Atta, D. Borggaard,
T. Rowles, B. Norberg, J. Whaley, and L. Engleby. 2008. Differentiating Serious and Non-Serious Injury of Marine Mammals: Report of the Serious Injury Technical Workshop, 10-13 September 2007, Seattle, Washington. U.S. Dep. Commer., NOAA Tech. Memo. NMFS-OPR-39. 94 p.
Angliss, R.P. and D.P. DeMaster. 1998. Differentiating Serious and Non-Serious Injury of Marine Mammals Taken Incidental to Commercial Fishing Operations. NOAA Tech. Memo.NMFS-OPR-13, 48 pp.
Carretta, J.V., E. Oleson, D.W. Weller, A.R. Lang, K.A. Forney, J. Baker, B. Hanson, K. Martien, M.M. Muto, M.S. Lowry, J. Barlow, D. Lynch, L. Carswell, R. L. Brownell Jr., D. K. Mattila, and M.C. Hill. 2013. U.S.

Pacific Marine Mammal Stock Assessments: 2012. U.S. Department of Commerce, NOAA Technical Memorandum, NMFS-SWFSC-504. 378 p.
NOAA. 2012. Federal Register 77:3233. National Policy for Distinguishing Serious From Non-Serious Injuries of Marine Mammals. http://www.nmfs.noaa.gov/op/pds/documents/02/238/02-238-01.pdf
Wade, P.R. and R.P. Angliss. 1997. Guidelines for assessing marine mammal stocks: Report of the GAMMS workshop April 3-5, 1996, Seattle, Washington. NOAA Technical Memorandum NMFS-OPR-12. Available from Office of Protected Resources, National Marine Fisheries Service, Silver Spring, MD. 93p.

Revised 01/15/2011 9/24/2013
HARBOR SEAL (Phoca vitulina richardii): Oregon/Washington Coast Stock
STOCK DEFINITION AND GEOGRAPHIC RANGE Harbor seals inhabit coastal and estuarine waters off Baja California, north along the western coasts of the continental U.S., British Columbia, and Southeast Alaska, west through the Gulf of Alaska and Aleutian Islands, and in the Bering Sea north to Cape Newenham and the Pribilof Islands. They haul out on rocks, reefs, beaches, and drifting glacial ice and feed in marine, estuarine, and occasionally fresh waters. Harbor seals generally are non-migratory, with local movements associated with such factors as tides, weather, season, food availability, and reproduction (Scheffer and Slipp 1944; Fisher 1952; Bigg 1969, 1981). Harbor seals do not make extensive pelagic migrations, though some long distance movement of tagged animals in Alaska (174 900 km) and along the U.S. west coast (up to 550 km) have been recorded (Pitcher and McAllister 1981, Brown and Mate 1983, Herder 1986, Womble 2012). Harbor seals have also displayed strong fidelity to haulout sites (Pitcher and Calkins 1979, Pitcher and McAllister 1981). For management purposes Until recently, differences in mean pupping date (Temte 1986), movement patterns (Jeffries 1985, Brown 1988), pollutant loads (Calambokidis et al. 1985), and fishery interactions have led to the recognition of three separate harbor seal stocks along the west coast of the continental U.S. (Boveng 1988): 1) inland waters of Washington State (including Hood Canal, Puget Sound, and the Strait of Juan de Fuca out to Cape Flattery), 2) outer coast of Oregon and Washington, and 3) California (Fig. 1). Genetic analyses provide additional support for this stock structure (Huber et al. 1994, 2010; Burg 1996; Lamont et al. 1996). Samples from Washington, Oregon, and California demonstrate a high level of genetic diversity and indicate that the harbor seals of Washington inland waters possess unique haplotypes not found in seals from the coasts of Washington, Oregon, and California (Lamont et al. 1996). Recent genetic evidence suggests that the population of harbor seals in Washington inland waters has more structure than is currently was previously recognized (Huber et al. 2010). Studies of pupping phenology, mitochondrial DNA, and microsatellite variation of harbor seals in Washington and Canada-U.S. transboundary waters confirm the currently recognized stock boundary between the Washington Coast and Washington Inland Waters harbor seal stocks, but three genetically distinct populations of harbor seals within Washington inland waters are also evident (Huber et al. 2010, 2012). Following NMFS guidelines for assessing marine mammal stocks (NMFS 2005), three new prospective harbor seal stocks are presented: 1) Southern Puget Sound (south of the Tacoma Narrows Bridge); 2) Washington Northern Inland Waters (including Puget Sound north of the Tacoma Narrows Bridge, the San Juan Islands, and the Strait of Juan de Fuca); 3) Hood Canal; 4) Oregon/Washington Coast; and 5) California. This report considers only the Oregon/Washington Coast stock. Stock assessment reports for California harbor seals and harbor seals in Washington inland waters (including the prospective Southern Puget Sound, Washington Northern Inland Waters, and Hood Canal stocks) and California harbor seals also appear in this volume. Harbor seal stocks that occur in the inland and coastal waters of Alaska are discussed separately in the Alaska Stock Assessment Reports. Harbor seals occurring in British Columbia are not included in any of the U.S. Marine Mammal Protection Act (MMPA) stock assessment reports.
Figure 1. Approximate distribution of Prospective harbor seals stocks in the U.S. Pacific Northwest (shaded area). Stock boundaries separating the three stocks are shown.
1

POPULATION SIZE Aerial surveys of harbor seals in Oregon and Washington were conducted by personnel from the National Marine Mammal Laboratory (NMML) and the Oregon and Washington Departments of Fish and Wildlife (ODFW and WDFW) during the 1999 pupping season. Total numbers of hauled-out seals (including pups) were counted during these surveys. In 1999, the mean count of harbor seals occurring along the Washington coast was 10,430 (CV=0.14) animals (Jeffries et al. 2003). In 1999, the mean count of harbor seals occurring along the Oregon coast and in the Columbia River was 5,735 (CV=0.14) animals (Brown 1997; ODFW, unpublished data). Combining these counts results in 16,165 (CV=0.10) harbor seals in the Oregon/Washington Coast stock. Radio-tagging studies conducted at six locations (three Washington inland waters sites and three Oregon and Washington coastal sites) collected information on haulout patterns from 63 harbor seals in 1991 and 61 harbor seals in 1992. Haulout data from coastal and inland sites were not significantly different and were thus pooled, resulting in a correction factor of 1.53 (CV=0.065) to account for animals in the water which are missed during the aerial surveys (Huber et al. 2001). Using this correction factor results in a population estimate of 24,732 (16,165 x 1.53; CV=0.12) for the Oregon/Washington Coast stock of harbor seals in 1999 (Jeffries et al. 2003; ODFW, unpublished data). However, because the most recent abundance estimate is >8 years old, there is no current estimate of abundance available for this stock. Minimum Population Estimate No current information on abundance is available to obtain a minimum population estimate for the Oregon/Washington Coast stock of harbor seals. Current Population Trend Historical levels of harbor seal abundance in Oregon and Washington are unknown. The population apparently decreased during the 1940s and 1950s due to state-financed bounty programs. Approximately 17,133 harbor seals were killed in Washington by bounty hunters between 1943 and 1960 (Newby 1973). More than 3,800 harbor seals were killed in Oregon between 1925 and 1972 by bounty hunters and a state-hired seal hunter (Pearson 1968). The population remained relatively low during the 1960s but, since the termination of the harbor seal bounty program and with the protection provided by the passage of the MMPA in 1972, harbor seal counts for this stock have increased from 6,389 in 1977 to 16,165 in 1999 (Jeffries et al. 2003; ODFW, unpublished data). Based on the analyses of Jeffries et al. (2003) and Brown et al. (2005), both the Washington and Oregon portions of this stock have reached carrying capacity and are no longer increasing (Fig. 2). CURRENT AND MAXIMUM NET PRODUCTIVITY RATES The Oregon/Washington Coast harbor seal stock increased at an annual rate of 7% from 1983 to 1992 and at 4% from 1983 to 1996 (Jeffries et al. 1997). Because the population was not at a very low level by 1983, the observed rates of
Washington Coast Harbor Seals
0
2000
4000
6000
8000
10000
12000
14000
1970 1975 1980 1985 1990 1995 2000 2005
Year
Co
un
t
Oregon Harbor Seals
0
1000
2000
3000
4000
5000
6000
1970 1975 1980 1985 1990 1995 2000 2005
Year
Cou
nt
Figure 2. Generalized logistic growth curves of Washington Coast (Jeffries et al. 2003) and Oregon (Brown et al. 2005) harbor seals.
2

increase may underestimate the maximum net productivity rate (RMAX ). When a logistic model was fit to the Washington portion of the 1975-1999 abundance data, the resulting estimate of RMAX was 18.5% (95% CI = 12.9-26.8%) (Jeffries et al. 2003). When a logistic model was fit to the Oregon portion of the 1977-2003 abundance data, estimates of RMAX ranged from 6.4% (95% CI = 4.6-27%) for the south coast of Oregon to 10.1% (95% CI = 8.6-20%) for the north coast (Brown et al. 2005). Until a combined analysis for the entire stock is completed, the pinniped default maximum theoretical net productivity rate (RMAX ) of 12% will be used for this harbor seal stock (Wade and Angliss 1997). POTENTIAL BIOLOGICAL REMOVAL Because there is no current estimate of minimum abundance, a potential biological removal (PBR) cannot be calculated for this stock. HUMAN-CAUSED MORTALITY AND SERIOUS INJURY New Serious Injury Guidelines NMFS updated its serious injury designation and reporting process, which uses guidance from previous serious injury workshops, expert opinion, and analysis of historic injury cases to develop new criteria for distinguishing serious from non-serious injury (Angliss and DeMaster 1998, Andersen et al. 2008, NOAA 2012). NMFS defines serious injury as an “injury that is more likely than not to result in mortality”. Injury determinations for stock assessments revised in 2013 or later incorporate the new serious injury guidelines, based on the most recent 5-year period for which data are available. Fisheries Information Fishing effort in the northern Washington marine gillnet tribal fishery is conducted within the range of both stocks of harbor seals (the Oregon/Washington Coast and Washington Northern Inland Waters stocks of harbor seals) occurring in Washington State waters. Some movement Movement of animals between Washington’s coastal and inland waters is likely, although tagging data do not show movement of harbor seals between the two locations (Huber et al. 2001). For the purposes of this report, animals taken in waters south and west of Cape Flattery, WA, are assumed to belong to the Oregon/Washington Coast stock and Table 1 includes data only from that portion of the fishery. Fishing effort in the coastal marine set gillnet tribal fishery has declined since 2004. There was one fisher self-report of a harbor seal death in a set gillnet in coastal waters in 2004 (Makah Fisheries Management, unpublished data). A test set gillnet fishery, with 100% observer coverage, was conducted in coastal waters in 2004 and 2008 and 2010. This test fishery required the use of nets equipped with acoustic alarms, and observers reported five harbor seal deaths in 2004 and one harbor seal death in 2008 and three in 2010 (Makah Fisheries Management, unpublished data). The mean estimated annual mortality for the marine set gillnet tribal fishery in 2004-2008 2007-2011 is 1.2 0.8 (CV=0) harbor seals per year from observer data plus 0.2 seals per year from fisher self-reports. The U.S. West Coast groundfish fishery was monitored for incidental takes in 2005-2009 (Jannot et al. 2011). Washington/Oregon/California (WA/OR/CA) Harbor seal deaths were observed in the groundfish trawl fishery (Pacific hake at-sea processing component) was monitored for incidental take during 2002-2006 (NWFSC 2008), and harbor seal deaths were observed in 2005, and 2006, and 2008; the nearshore fixed gear fishery in 2006 and 2008; and the non-nearshore fixed gear (limited entry non-primary sablefish) fishery in 2009. The mean estimated annual mortality for this fishery each of these fisheries in 2002-2006 2005-2009 is 0.4 (CV=0.30) 1.0 (CV=0.24) harbor seals per year for the groundfish trawl fishery, 5.6 (CV=0.68) for the nearshore fixed gear fishery, and 0.2 for the non-nearshore fixed gear fishery.
The Washington and Oregon Lower Columbia River drift gillnet fishery was monitored during the entire year in 1991-1993 (Brown and Jeffries 1993, Matteson et al. 1993c, Matteson and Langton 1994a). Harbor seal mortality, incidental to the fishery, was observed only in the winter season and was extrapolated to estimate total harbor seal mortality. However, the structure of the fishery has changed substantially since the 1991-1992 fishing seasons, and this level of take no longer applies to the current fishery (see Appendix 1). The Oregon Department of Fish and Wildlife (ODFW) conducted test fisheries in the lower Columbia River in 2000-2002 to evaluate the use of small-mesh (3½"-6") tangle (tooth) nets in commercial, spring chinook fisheries to effectively harvest target stocks, while allowing the live release of non-target stocks and species (G. Whisler, pers. comm.). An experimental commercial permit fishery and a full-fleet commercial demonstration fishery were also conducted in 2001 and 2002, respectively, to test the small-mesh gear. Due to high steelhead bycatch in the 2002 fishery, harvest managers used in-season test fishing during the 2003 and 2004 fishing seasons to determine the optimum timing and gear requirements for each subsequent full-fleet commercial fishing period. Both large-mesh (8-9.75”) and small-mesh
3

tangle net (<4.25”) fishing periods were adopted in each year, although the 2003 season was severely curtailed to limit the catch of spring chinook stocks listed under the Endangered Species Act (ESA). With the focus on greater selectivity in winter/spring commercial salmon fisheries, levels of observer coverage were much higher in 2002-2004 than in previous years. To meet management needs, this increased level of observer coverage in test fisheries and full-fleet commercial fisheries is expected to continue into the foreseeable future (J. North and G. Whisler, pers. comm.). Data on marine mammal interactions (predation, entanglement) recorded by observers during the permit and demonstration commercial fisheries in 2001-2002 and the full-fleet commercial fisheries in 2003-2004 have not yet been summarized; however, no marine mammal deaths or serious injuries were reported to NMFS by vessel operators. Table 1. Summary of available information on the incidental mortality and serious injury of harbor seals (Oregon/Washington Coast stock) in commercial and tribal fisheries that might take this species and calculation of the mean annual mortality rate; n/a indicates that data are not available. Mean annual takes are based on 2004-2008 2007-2011 data unless otherwise noted.
Fishery name Years Data type
Percent observer coverage
Observed mortality
Estimated mortality
Mean annual takes (CV in parentheses)
Northern WA marine set gillnet (tribal test fishery in
coastal waters)
Northern WA marine set gillnet (tribal fishery in coastal
waters)
2004 2005 2006 2007 2008 2009 2010 2011
2004
observer data
fisher self-reports
100% no fishery no fishery no fishery
100% no fishery
100% no fishery
5 0 0 0 1 0 3 0 1
5 (0) 0 (0) 0 (0) 0 (0) 1 (0) 0 (0) 3 (0) 0 (0)
n/a
1.2 (0)
0.8 (0)
>0.2 (n/a)
WA/OR/CA West Coast groundfish trawl
(Pacific hake at-sea processing component)
2002 2003 2004 2005 2006 2007 2008 2009
observer data
100%1 100%1 100%1
10067%1 10083%1
73%1 76%1 79%1
0 0 0 1 1 0 2 0
0 (0) 0 (0) 0 (0)
1 (0.52) 1 (0.42)
0 3 (0.34)
0
0.4 (0.30)
1.0 (0.24)
West Coast groundfish nearshore fixed gear
2005 2006 2007 2008 2009
observer data
5%2 11%2
9%2
7%2
4%2
0 1 0 2 0
0 n/a3 0
27 (0.68) 0
5.6 (0.68)
West Coast groundfish non-nearshore fixed gear (limited entry non-primary sablefish)
2009 observer data n/a 1 n/a3 >0.2 (n/a)
WA Grays Harbor salmon drift gillnet2
1991-1993 observer data 4-5% 0, 1, 1 0, 10, 10 see text24
WA Willapa Bay drift gillnet2 1991-1993 observer data 1-3% 0, 0, 0 0, 0, 0 see text24 WA Willapa Bay drift gillnet2 1990-1993 fisherman self-
reports n/a 0, 0, 6, 8 n/a see text24
Unknown West Coast fisheries 2004-2008 2007-2011
stranding data n/a 0, 0, 0, 0, 0 0, 0, 0, 0, 3
n/a 0
>0.6 (n/a) Minimum total annual takes >1.8 (0.08)
>8.2 (0.52) 1Percent observer coverage equals percent of vessels with observers hauls observed for marine mammals.
4

2Percent observed landings of target species. 3Bycatch estimate not provided due to high CV (>80%) for estimate; minimum bycatch of one observed harbor seal is included in the calculation of mean annual take. 4This fishery has not been observed since 1993 (see text); these data are not included in the calculation of recent minimum total annual takes. The Washington Grays Harbor salmon drift gillnet fishery was also monitored in 1991-1993 (Herczeg et al. 1992a; Matteson and Molinaar 1992; Matteson et al. 1993a; Matteson and Langton 1994b, 1994c). During the 3-year period, 98, 307, and 241 sets were monitored, representing approximately 4-5% observer coverage in each year. No mortality was recorded in 1991. In 1992, observers recorded one harbor seal death incidental to the fishery, resulting in an extrapolated estimated total kill of 10 seals (CV=1.0). In 1993, observers recorded one harbor seal death incidental to the fishery, though a total kill was not extrapolated. Similar observer coverage in 1992 and 1993 (4.2% and 4.4%, respectively) suggests that 10 is also a reasonable estimate of the total kill in 1993. Thus, the mean estimated mortality for this fishery in 1991-1993 is 6.7 (CV=0.50) harbor seals per year. No observer data are available for this fishery after 1993, however, harbor seal takes are unlikely to have increased since the fishery was last observed, due to reductions in the number of participating vessels and available fishing time (see details in Appendix 1). Fishing effort and catch have declined throughout all salmon fisheries in the region due to management efforts to recover ESA-listed salmonids. The Washington Willapa Bay drift gillnet fishery was also monitored at low levels of observer coverage in 1991-1993 (Herczeg et al. 1992a, 1992b; Matteson and Molinaar 1992; Matteson et al. 1993b; Matteson and Langton 1994c, 1994d). In those years, 752, 576, and 452 sets were observed, representing approximately 2.5%, 1.4%, and 3.1% observer coverage, respectively. No harbor seal mortality was reported by observers. However, because mortality was self-reported by fishers in 1992 and 1993, the low level of observer coverage failed to document harbor seal mortality that had apparently occurred. Due to the low level of observer coverage for this fishery, the self-reported fishery mortality has been included in Table 1 and represents a minimum mortality estimate resulting from that fishery (3.5 harbor seals per year). Harbor seal takes are unlikely to have increased since the fishery was last observed in 1993, due to reductions in the number of participating vessels and available fishing time (see details in Appendix 1).
Commercial salmon drift gillnet fisheries in Washington outer coast waters (Grays Harbor, Willapa Bay) were last observed in 1993 and 1994, with observer coverage levels typically less than 10% (Erstad et al. 1996, Pierce et al. 1994, Pierce et al. 1996, NWIFC 1995). Drift gillnet fishing effort in the outer coast waters has declined considerably since 1994 because fewer vessels participate today (NMFS NW Region, unpublished data), but entanglements of harbor seals likely continue to occur. The most recent data on harbor seal mortality from commercial and tribal gillnet fisheries is included in Table 1. Combining recent estimates from commercial fisheries observer data for the northern Washington marine set tribal gillnet (1.2 from observer data + 0.2 from fisher self-reports) and WA/OR/CA West Coast groundfish trawl (0.4 1.0 from observer data) , West Coast groundfish nearshore fixed gear (5.6), and West Coast groundfish non-nearshore fixed gear (0.2) fisheries results in an estimated mean annual mortality rate of 1.8 6.8 harbor seals per year from these fisheries. An additional 0.8 harbor seals per year were taken in the northern Washington marine set gillnet tribal fishery. The Marine Mammal Authorization Program (MMAP) fisher self-reports, required of commercial vessel operators by the MMPA, are an additional source of information on the number of harbor seals killed or seriously injured incidental to commercial fishery operations. Between 2002 and 2006, there were two fisher self-reports of harbor seal deaths in the WA/OR/CA groundfish trawl (Pacific hake at-sea processing) fishery. Since this is an observed fishery, these deaths are not included in Table 1. Although these reports are considered incomplete (see details in Appendix 1), they represent a minimum mortality.
Strandings of harbor seals entangled in fishing gear or with serious injuries caused by interactions with gear are another source of fishery-related mortality. According to Northwest Marine Mammal Stranding Network records, maintained by the NMFS Northwest Region (NMFS, Northwest Regional Office, unpublished data), there were no three fishery-related deaths strandings of harbor seals from this stock reported in 2004-2008 2011 (listed as unknown West Coast fisheries in Table 1), resulting in an average mean annual mortality of zero 0.6 harbor seals in 2007-2011. Fishery interactions included two gillnet entanglements and one trawl net entanglement. Hook and line gear is used by both commercial (salmon troll) and recreational fisheries in coastal waters. Two harbor seal deaths due to ingested hooks were reported in 2007-2011, resulting in a mean annual mortality of 0.4 seals from unknown hook and line fisheries. This estimate is Estimates from stranding data are considered a minimums because not all stranded animals are found, reported, or examined for cause of death (via necropsy by trained personnel). An additional harbor seal that stranded with a serious hook injury in 2011 was treated and released with non-serious injuries (Carretta et al. 2013); therefore, it was not included in the mean annual mortality in this report.
5

Other Mortality
In 2011, one harbor seal from this stock was incidentally killed during scientific halibut longline operations, resulting in a mean annual research-related mortality of 0.2 animals from 2007 to 2011.
According to Northwest Marine Mammal Stranding Network records, maintained by the NMFS Northwest Region (NMFS, Northwest Regional Office, unpublished data), a total of 10 nine human-caused harbor seal deaths or serious injuries were reported from non-fisheries sources in 2004-2008 2007-2011. Seven Six animals were shot, two animals were struck by boats, and one animal was entangled in line killed by a dog, resulting in an estimated mean annual mortality of 2.0 1.8 harbor seals per year from this stock. This estimate is considered a minimum because not all stranded animals are found, reported, or examined for cause of death (via necropsy by trained personnel). Subsistence Harvests by Northwest Treaty Indian Tribes Tribal subsistence takes of this stock may occur, but no data on recent takes are available. STATUS OF STOCK Harbor seals are not considered to be “depleted” under the MMPA or listed as “threatened” or “endangered” under the ESA. Based on currently available data, the minimum level of human-caused mortality and serious injury is 3.8 (1.8 + 2.0) 10.6 harbor seals per year: (8.2 from fishery sources in Table 1, plus 0.4 from unknown hook and line fisheries, plus 0.2 scientific takes annually, plus 1.8 non-fishery causes annually) . A PBR cannot be calculated for this stock because there is no current abundance estimate. The previous estimate of PBR was 1,343 (Carretta et al. 2009). Human-caused mortality relative to PBR is unknown, but it is considered to be small relative to the stock size. Therefore, the Oregon/Washington Coast stock of harbor seals is not classified as a “strategic” stock. The minimum total annual commercial fishery mortality and serious injury for this stock, (based on recent observer data (1.6 6.8) and self-reported fisheries information (0.2) or stranding data (0) (0.6), where observer data were not available or failed to detect harbor seal mortality) is 1.8 7.4. Since a PBR cannot be calculated for this stock, fishery mortality relative to PBR is unknown. The stock is within its Optimum Sustainable Population (OSP) level (Jeffries et al. 2003, Brown et al. 2005). REFERENCES Andersen, M. S., K. A. Forney, T. V. N. Cole, T. Eagle, R. Angliss, K. Long, L. Barre, L. Van Atta, D. Borggaard,
T. Rowles, B. Norberg, J. Whaley, and L. Engleby. 2008. Differentiating Serious and Non-Serious Injury of Marine Mammals: Report of the Serious Injury Technical Workshop, 10-13 September 2007, Seattle, Washington. U.S. Dep. Commer., NOAA Tech. Memo. NMFS-OPR-39. 94 p.
Angliss, R.P. and D.P. DeMaster. 1998. Differentiating Serious and Non-Serious Injury of Marine Mammals Taken Incidental to Commercial Fishing Operations. NOAA Tech Memo. NMFS-OPR-13, 48 p.
Bigg, M. A. 1969. The harbour seal in British Columbia. Fish. Res. Bd. Can. Bull. 172. 33 pp. Bigg, M. A. 1981. Harbour seal, Phoca vitulina, Linnaeus, 1758 and Phoca largha, Pallas, 1811. Pp. 1-27, In:
Ridgway, S. H., and R. J. Harrison (eds.), Handbook of Marine Mammals. Vol. 2: Seals. Academic Press, New York. 359 pp.
Boveng, P. 1988. Status of the Pacific harbor seal population on the U.S. west coast. Administrative Report LJ-88-06. 43 pp. Available from Southwest Fisheries Science Center, 3333 North Torrey Pines Road, La Jolla, CA 92037.
Brown, R. F. 1988. Assessment of pinniped populations in Oregon: April 1984 to April 1985. NWAFC Processed Report 88-05. 44 pp. Available at National Marine Mammal Laboratory, 7600 Sand Point Way NE, Seattle, WA 98115.
Brown, R. F. 1997. Abundance of Pacific harbor seals (Phoca vitulina richardsi) in Oregon: 1977-1996. Oregon Dept. Fish and Wildlife, Wildlife Diversity Program, Tech. Report No. 97-6-04. 12 pp.
Brown, R. F., and S. J. Jeffries. 1993. Preliminary report on estimated marine mammal mortality in Columbia River fall and winter salmon gillnet fisheries, 1991-1992. Unpublished Report. Columbia River Area Gillnet Fishery Observer Program. 13 pp. Available at Oregon Dept. Fish and Wildlife, 2040 SE Marine Science Dr., Newport, OR 97365.
Brown, R. F., and B. R. Mate. 1983. Abundance, movements, and feeding habits of the harbor seal, Phoca vitulina, at Netarts and Tillamook Bays, Oregon. Fish. Bull. 81:291-301.
Brown, R. F., B. E. Wright, S. D. Riemer, and J. Laake. 2005. Trends in abundance and current status of harbor seals in Oregon: 1977-2003. Mar. Mammal Sci. 21(4):657-670.
6

Burg, T. M. 1996. Genetic analysis of eastern Pacific harbour seals (Phoca vitulina richardsi) from British Columbia and parts of Alaska using mitochondrial DNA and microsatellites. MS Thesis, University of British Columbia, Vancouver, BC. 77 pp.
Calambokidis, J., S. Speich, J. Peard, G. Steiger, D. M. Fry, J. Lowenstine, and J. Cubbage. 1985. Biology of Puget Sound marine mammals and marine birds: Population health and evidence of pollution effects. U.S. Dep. Commer., NOAA Tech. Memo. NOS-OMA-18. 159 pp.
Carretta, J. V., K. A. Forney, M. S. Lowry, J. Barlow, J. Baker, D. Johnston, B. Hanson, M. M. Muto, D. Lynch, and L. Carswell. 2009. U.S. Pacific marine mammal stock assessments: 2008. U.S. Dep. Commer., NOAA Tech. Memo. NMFS-SWFSC-434. 336 pp.
Carretta, J. V., S. M. Wilkin, M. M. Muto, and K. Wilkinson. 2013. Sources of human-related injury and mortality for U.S. Pacific west coast marine mammal stock assessments, 2007-2011. U.S. Dep. Commer., NOAA Tech. Memo. NMFS-SWFSC-514, 83 p.
Erstad, P., S. J. Jeffries, and D. J. Pierce. 1996. 1994 Report for the Puget Sound fishery observer program in management areas 10/11 & 12/12B: nontreaty chum gill net fishery. Final Report. Washington Dept. Fish and Wildlife, Olympia, WA. 14 pp.
Fisher, H. D. 1952. The status of the harbour seal in British Columbia, with particular reference to the Skeena River. Fish. Res. Bd. Can. Bull. 93. 58 pp.
Herczeg, K. M., A. A. Abajian, and V. M. C. Molinaar. 1992a. Summary report on the 1991 summer dip-in salmon gillnet fisheries in Willapa Bay and Grays Harbor. Unpublished Report. Pacific States Marine Fisheries Commission, Astoria, OR. 10 pp. Available at PSMFC, 205 SE Spokane Street, Suite 100, Portland, OR 97202.
Herczeg, K. M., V. M. C. Molinaar, and A. A. Abajian. 1992b. Summary report on the 1991 fall Willapa Bay salmon gillnet fishery. Unpublished Report. Pacific States Marine Fisheries Commission, Astoria, OR. 10 pp. Available at PSMFC, 205 SE Spokane Street, Suite 100, Portland, OR 97202.
Herder, M. J. 1986. Seasonal movements and hauling site fidelity of harbor seals, Phoca vitulina richardsi, tagged at the Klamath River, California. MA Thesis, Humboldt State University, Arcata, CA. 52 pp.
Huber, H., S. Jeffries, R. Brown, and R. DeLong. 1994. Harbor seal, Phoca vitulina richardsi, stock assessment in Washington and Oregon, 1993. 1993 Annual Report to the MMPA Assessment Program, Office of Protected Resources, NMFS, NOAA, 1335 East-West Highway, Silver Spring, MD 20910. Available at National Marine Mammal Laboratory, 7600 Sand Point Way NE, Seattle, WA 98115.
Huber, H. R., S. J. Jeffries, R. F. Brown, R. L. DeLong, and G. VanBlaricom. 2001. Correcting aerial survey counts of harbor seals (Phoca vitulina richardsi) in Washington and Oregon. Mar. Mammal Sci. 17(2):276-293.
Huber, H. R., S. J. Jeffries, D. M. Lambourn, and B. R. Dickerson. 2010. Population substructure of harbor seals (Phoca vitulina richardsi) in Washington State using mtDNA. Can. J. Zool. 88:280-288.
Huber, H. R., B. R. Dickerson, S. J. Jeffries, and D. M. Lambourn. 2012. Genetic analysis of Washington State harbor seals (Phoca vitulina richardii) using microsatellites. Can. J. Zool. 90(12):1361-1369. DOI: 10.1139/cjz-2012-0047.
Jannot, J., E. Heery, M. A. Bellman, and J. Majewski. 2011. Estimated bycatch of marine mammals, seabirds, and sea turtles in the US west coast commercial groundfish fishery, 2002-2009. West Coast Groundfish Observer Program. Unpublished Report. 104 pp. Available at http://www.nwfsc.noaa.gov/research/divisions/fram/observer/pdf/mmsbt_report02-09.pdf.
Jeffries, S. J. 1985. Occurrence and distribution patterns of marine mammals in the Columbia River and adjacent coastal waters of northern Oregon and Washington. Pp. 15-50, In: Beach, R. J., A. C. Geiger, S. J. Jeffries, S. D. Treacy, and B. L. Troutman, Marine mammals and their interactions with fisheries of the Columbia River and adjacent waters, 1980-1982. NWAFC Processed Report 85-04. 316 pp. Available at National Marine Mammal Laboratory, 7600 Sand Point Way NE, Seattle, WA 98115.
Jeffries, S. J., R. F. Brown, H. R. Huber, and R. L. DeLong. 1997. Assessment of harbor seals in Washington and Oregon, 1996. Pp. 83-94, In: Hill, P. S., and D. P. DeMaster (eds.), MMPA and ESA Implementation Program, 1996. AFSC Processed Report 97-10. 255 pp. Available at National Marine Mammal Laboratory, 7600 Sand Point Way NE, Seattle, WA 98115.
Jeffries, S., H. Huber, J. Calambokidis, and J. Laake. 2003. Trends and status of harbor seals in Washington State: 1978-1999. J. Wildl. Manage. 67(1):208-219.
Lamont, M. M., J. T. Vida, J. T. Harvey, S. Jeffries, R. Brown, H. H. Huber, R. DeLong, and W. K. Thomas. 1996. Genetic substructure of the Pacific harbor seal (Phoca vitulina richardsi) off Washington, Oregon, and California. Mar. Mammal Sci. 12(3):402-413.
7

Makah Fisheries Management, P.O. Box 115, Neah Bay, WA 98357. Matteson, K. M., and J. A. Langton. 1994a. Summary report on the 1993 fall Columbia River salmon gillnet
fishery. Unpublished Report. Pacific States Marine Fisheries Commission, Astoria, OR. 19 pp. Available at PSMFC, 205 SE Spokane Street, Suite 100, Portland, OR 97202.
Matteson, K. M., and J. A. Langton. 1994b. Summary report on the 1993 fall Grays Harbor salmon gillnet fishery. Unpublished Report. Pacific States Marine Fisheries Commission, Astoria, OR. 18 pp. Available at PSMFC, 205 SE Spokane Street, Suite 100, Portland, OR 97202.
Matteson, K. M., and J. A. Langton. 1994c. Summary report on the 1993 summer dip-in salmon gillnet fisheries in Willapa Bay and Grays Harbor. Unpublished Report. Pacific States Marine Fisheries Commission, Astoria, OR. 22 pp. Available at PSMFC, 205 SE Spokane Street, Suite 100, Portland, OR 97202.
Matteson, K. M., and J. A. Langton. 1994d. Summary report on the 1993 fall Willapa Bay salmon gillnet fishery. Unpublished Report. Pacific States Marine Fisheries Commission, Astoria, OR. 18 pp. Available at PSMFC, 205 SE Spokane Street, Suite 100, Portland, OR 97202.
Matteson, K. M., and V. M. C. Molinaar. 1992. Summary report on the 1992 summer dip-in salmon gillnet fisheries in Willapa Bay and Grays Harbor. Unpublished Report. Pacific States Marine Fisheries Commission, Astoria, OR. 13 pp. Available at PSMFC, 205 SE Spokane Street, Suite 100, Portland, OR 97202.
Matteson, K. M., W. B. Barnett, and J. A. Langton. 1993a. Summary report on the 1992 fall Grays Harbor salmon gillnet fishery. Unpublished Report. Pacific States Marine Fisheries Commission, Astoria, OR. 17 pp. Available at PSMFC, 205 SE Spokane Street, Suite 100, Portland, OR 97202.
Matteson, K. M., W. B. Barnett, and J. A. Langton. 1993b. Summary report on the 1992 fall Willapa Bay salmon gillnet fishery. Unpublished Report. Pacific States Marine Fisheries Commission, Astoria, OR. 17 pp. Available at PSMFC, 205 SE Spokane Street, Suite 100, Portland, OR 97202.
Matteson, K. M., J. A. Langton, and R. L. Hadley. 1993c. Summary report on the 1993 winter Columbia River salmon gillnet fishery. Unpublished Report. Pacific States Marine Fisheries Commission, Astoria, OR. 29 pp. Available at PSMFC, 205 SE Spokane Street, Suite 100, Portland, OR 97202.
National Marine Fisheries Service (NMFS), Northwest Regional Office, 7600 Sand Point Way NE, Seattle, WA 98115.
National Marine Fisheries Service (NMFS). 2005. Revisions to Guidelines for Assessing Marine Mammal Stocks. 24 pp. Available at http://www.nmfs.noaa.gov/pr/pdfs/sars/gamms2005.pdf.
NOAA. 2012. Federal Register 77:3233. National Policy for Distinguishing Serious From Non-Serious Injuries of Marine Mammals. http://www.nmfs.noaa.gov/op/pds/documents/02/238/02-238-01.pdf
Newby, T. C. 1973. Changes in Washington State harbor seal population, 1942-1972. Murrelet 54:5-6. North, J. Ocean Salmon and Columbia River Program, Oregon Department of Fish and Wildlife, 17330 SE Evelyn
Street, Clackamas, OR 97015. Northwest Fisheries Science Center (NWFSC). 2008. Report on the bycatch of marine mammals and seabirds by
the U.S. West Coast groundfish fleet. At-sea Hake Observer Program, West Coast Groundfish Observer Program, Northwest Fisheries Science Center, NOAA Fisheries. Unpublished Report. 34 pp. Available at http://www.nwfsc.noaa.gov/research/divisions/fram/observer/datareport/index.cfm.
Oregon Department of Fish and Wildlife (ODFW), 2040 SE Marine Science Dr., Newport, OR 97365. Pearson, J. P. 1968. The abundance and distribution of harbor seals and Steller sea lions in Oregon. MS Thesis,
Oregon State University, Corvallis, OR. 23 pp. Pitcher, K. W., and D. G. Calkins. 1979. Biology of the harbor seal (Phoca vitulina richardsi) in the Gulf of
Alaska. U.S. Dep. Commer., NOAA, OCSEAP Final Report 19(1983):231-310. Pitcher, K. W., and D. C. McAllister. 1981. Movements and haul out behavior of radio-tagged harbor seals, Phoca
vitulina. Can. Field Nat. 95:292-297. Scheffer, V. B., and J. W. Slipp. 1944. The harbor seal in Washington State. Amer. Midl. Nat. 32:373-416. Temte, J. L. 1986. Photoperiod and the timing of pupping in the Pacific harbor seal (Phoca vitulina richardsi) with
notes on reproduction in northern fur seals and Dall porpoises. MS Thesis, Oregon State University, Corvallis, OR. 147 pp.
Wade, P. R., and R. P. Angliss. 1997. Guidelines for assessing marine mammal stocks: report of the GAMMS workshop April 3-5, 1996, Seattle, Washington. U.S. Dep. Commer., NOAA Tech. Memo. NMFS-OPR-12. 93 pp.
Whisler, G. Ocean Salmon and Columbia River Program, Oregon Department of Fish and Wildlife, 17330 SE Evelyn Street, Clackamas, OR 97015.
8

Womble, J. N. 2012. Foraging ecology, diving behavior, and migration patterns of harbor seals (Phoca vitulina richardii) from a glacial fjord in Alaska in relation to prey availability and oceanographic features. Ph.D. Thesis, Oregon State University, Corvallis, OR.
9

Revised 01/15/2011 9/24/2013
HARBOR SEAL (Phoca vitulina richardii): Washington Inland Waters Stocks:
(Hood Canal, Southern Puget Sound, Washington Northern Inland Waters)
STOCK DEFINITION AND GEOGRAPHIC RANGE Harbor seals inhabit coastal and estuarine waters off Baja California, north along the western coasts of the continental U.S., British Columbia, and Southeast Alaska, west through the Gulf of Alaska and Aleutian Islands, and in the Bering Sea north to Cape Newenham and the Pribilof Islands. They haul out on rocks, reefs, beaches, and drifting glacial ice and feed in marine, estuarine, and occasionally fresh waters. Harbor seals generally are non-migratory, with local movements associated with such factors as tides, weather, season, food availability, and reproduction (Scheffer and Slipp 1944; Fisher 1952; Bigg 1969, 1981). Harbor seals do not make extensive pelagic migrations, though some long distance movement of tagged animals in Alaska (174 900 km) and along the U.S. west coast (up to 550 km) have been recorded (Pitcher and McAllister 1981, Brown and Mate 1983, Herder 1986, Womble 2012). Harbor seals have also displayed strong fidelity for haulout sites (Pitcher and Calkins 1979, Pitcher and McAllister 1981). For management purposes Until recently, differences in mean pupping date (Temte 1986), movement patterns (Jeffries 1985, Brown 1988), pollutant loads (Calambokidis et al. 1985), and fishery interactions have led to the recognition of three separate harbor seal stocks along the west coast of the continental U.S. (Boveng 1988): 1) inland waters of Washington State (including Hood Canal, Puget Sound, and the Strait of Juan de Fuca out to Cape Flattery), 2) outer coast of Oregon and Washington, and 3) California (Fig. 1). Genetic analyses provide additional support for this stock structure (Huber et al. 1994, 2010; Burg 1996; Lamont et al. 1996). Samples from Washington, Oregon, and California demonstrate a high level of genetic diversity and indicate that the harbor seals of Washington inland waters possess unique haplotypes not found in seals from the coasts of Washington, Oregon, and California (Lamont et al. 1996). Recent genetic evidence suggests that the population of harbor seals in Washington inland waters has more structure than is currently was previously recognized (Huber et al. 2010). Studies of pupping phenology, mitochondrial DNA, and microsatellite variation of harbor seals in Washington and Canada-U.S. transboundary waters confirm the currently recognized stock boundary between the Washington Coast and Washington Inland Waters harbor seal stocks, but three genetically distinct populations of harbor seals within Washington inland waters are also evident (Huber et al. 2010, 2012). Following NMFS guidelines for assessing marine mammal stocks (NMFS 2005), three new prospective harbor seal stocks are presented: 1) Southern Puget Sound (south of the Tacoma Narrows Bridge); 2) Washington Northern Inland Waters (including Puget Sound north of the Tacoma Narrows Bridge, the San Juan Islands, and the Strait of Juan de Fuca); 3) Hood Canal; 4) Oregon/Washington Coast; and 5) California. In this report, This report includes only the stocks in Washington’s inland waters. Inland Waters stock is addressed. Stock assessment reports for Oregon/Washington Coast and California harbor seals also appear in this volume. Harbor seal stocks that occur in the inland and coastal waters of Alaska are discussed separately in the Alaska Stock Assessment Reports. Harbor seals occurring in British Columbia are not included in any of the U.S. Marine Mammal Protection Act (MMPA) stock assessment reports.
Figure 1. Approximate distribution of prospectiveharbor seals stocks in the U.S. Pacific Northwest (shaded area). Stock boundaries separating the three stocks are shown.
10

POPULATION SIZE Aerial surveys of harbor seals in Washington were conducted during the pupping season in 1999, during which time the total numbers of hauled-out seals (including pups) were counted. In 1999, the mean count of harbor seals occurring in Washington’s inland waters was 7,213 (CV=0.14) in Washington Northern Inland Waters, 711 (CV=0.14) in Hood Canal, and 1,025 (CV=0.14) in Southern Puget Sound 9,550 (CV=0.14) animals (Jeffries et al. 2003). Radio-tagging studies conducted at six locations (three Washington inland waters sites and three Oregon and Washington coastal sites) collected information on haulout patterns from 63 harbor seals in 1991 and 61 harbor seals in 1992. Data from coastal and inland sites were not significantly different and were thus pooled, resulting in a correction factor of 1.53 (CV=0.065) to account for animals in the water which are missed during the aerial surveys (Huber et al. 2001). Using this correction factor results in a population estimates of 14,612 (9,550 x 1.53; CV=0.15) 11,036 (7,213 x 1.53; CV=0.15) for the Washington Northern Inland Waters stock; 1,088 (711 x 1.53; CV=0.15) for the Hood Canal stock; and 1,568 (1,025 x 1.53; CV=0.15) for the Southern Puget Sound stock of harbor seals (Jeffries et al. 2003). However, because the most recent abundance estimates are is >8 years old, there is are no current estimates of abundance for these stocks. Surveys of harbor seals in Washington inland waters are planned for 2013. Minimum Population Estimate No current information on abundance is available to obtain a minimum population estimate for the Washington Inland Waters stock of harbor seals. Current Population Trend Historical levels of harbor seal abundance in Washington are unknown. The population apparently decreased during the 1940s and 1950s due to a state-financed bounty program. Approximately 17,133 harbor seals were killed in Washington by bounty hunters between 1943 and 1960 (Newby 1973). The population remained relatively low during the 1970s but, since the termination of the harbor seal bounty program in 1960 and with the protection provided by the passage of the Marine Mammal Protection Act (MMPA) in 1972, harbor seal numbers in Washington have increased (Jeffries 1985). Between 1983 and 1996, the annual rate of increase for this stock was 6% (Jeffries et al. 1997). The peak count occurred in 1996 and, based on a fitted generalized logistic model (Fig. 2), the population is thought to be stable (Jeffries et al. 2003). CURRENT AND MAXIMUM NET PRODUCTIVITY RATES From 1991 to 1996, counts of harbor seals in Washington State have increased at an annual rate of 10% (Jeffries et al. 1997). Because the population was not at a very low level by 1991, the observed rate of increase may underestimate the maximum net productivity rate (RMAX ). When a logistic model was fit to the 1978-1999 abundance data, the resulting estimate of RMAX was 12.6% (95% CI = 9.4-18.7%) (Jeffries et al. 2003). This value of RMAX is very close to the default pinniped maximum theoretical net productivity rate of 12% (RMAX ), therefore, 12% will be employed for this harbor seal stock (Wade and Angliss 1997).
0
2000
4000
6000
8000
10000
12000
14000
1975 1980 1985 1990 1995 2000
YearT
otal
cou
nt
Figure 2. Generalized logistic population growth curve for the Washington Inland Waters stock of harbor seals, 1978-1999 (Jeffries et al. 2003).
11

POTENTIAL BIOLOGICAL REMOVAL Because there is no current estimate of minimum abundance, a potential biological removal (PBR) cannot be calculated for this stock. HUMAN-CAUSED MORTALITY AND SERIOUS INJURY New Serious Injury Guidelines NMFS updated its serious injury designation and reporting process, which uses guidance from previous serious injury workshops, expert opinion, and analysis of historic injury cases to develop new criteria for distinguishing serious from non-serious injury (Angliss and DeMaster 1998, Andersen et al. 2008, NOAA 2012). NMFS defines serious injury as an “injury that is more likely than not to result in mortality”. Injury determinations for stock assessments revised in 2013 or later incorporate the new serious injury guidelines, based on the most recent 5-year period for which data are available. Fisheries Information Fishing effort in the northern Washington marine gillnet tribal fishery is conducted within the range of both stocks of harbor seals (the Oregon/Washington Coast and Washington Northern Inland Waters ) occurring in Washington State waters stocks of harbor seals. Some movement of animals between Washington’s coastal and inland waters is likely, although data from tagging studies have not shown movement of harbor seals between the two locations (Huber et al. 2001). For the purposes of this stock assessment report, the animals taken in waters east of Cape Flattery, WA, are assumed to have belonged to the Washington Northern Inland Waters stock, and Table 1 includes data only from that portion of the fishery. There was no observer coverage in the northern Washington marine set gillnet tribal fishery in inland waters in 2004-2008 2007-2011; however, there were two fisherman self-reports of harbor seal deaths in this fishery in 2008 and five in 2009 (Makah Fisheries Management, unpublished data). The mean estimated annual mortality for this fishery in 2004-2008 2007-2011 is 0.4 1.4 harbor seals per year from fisherman self-reports. Fishing effort in the northern Washington marine drift gillnet tribal fishery in inland waters is also conducted within the range of the Washington Northern Inland Waters stock of harbor seals. This fishery is not observed; however, there was one fisherman self-report of a harbor seal death in 2008 (Makah Fisheries Management, unpublished data). The mean estimated annual mortality for this fishery in 2004-2008 2007-2011 is 0.2 harbor seals per year from fisherman self-reports.
Commercial salmon drift gillnet fisheries in Washington inland waters were last observed in 1993 and 1994, with observer coverage levels typically less than 10% (Erstad et al. 1996, Pierce et al. 1994, Pierce et al. 1996, NWIFC 1995). Drift gillnet fishing effort in the inland waters has declined considerably since 1994 because far fewer vessels participate today (NMFS NW Region, unpublished data), but entanglements of harbor seals likely continue to occur. The most recent data on harbor seal mortality from commercial gillnet fisheries is included in Table 1. In 1993, as a pilot for future observer programs, NMFS, in conjunction with the Washington Department of Fish and Wildlife (WDFW) monitored all non-treaty components of the Washington Puget Sound Region salmon gillnet fishery (Pierce et al. 1994). Observer coverage was 1.3% overall, ranging from 0.9% to 7.3% for the various components of the fishery. Two harbor seal deaths were reported. Pierce et al. (1994) cautioned against extrapolating this mortality to the entire Puget Sound fishery due to the low observer coverage and potential biases inherent in the data. The area 7/7A sockeye landings represented the majority of the non-treaty salmon landings in 1993, approximately 67%. Results of this pilot study were used to design the 1994 observer programs discussed below. In 1994, NMFS, in conjunction with WDFW conducted an observer program during the Puget Sound non-treaty chum salmon gillnet fishery (areas 10/11 and 12/12B). A total of 230 sets were observed during 54 boat trips, representing approximately 11% observer coverage of the 500 fishing boat trips comprising the total effort in this fishery, as estimated from fish ticket landings (Erstad et al. 1996). One harbor seal was taken in the fishery, resulting in an entanglement rate of 0.02 harbor seals per trip (0.004 harbor seals per set), which extrapolated to approximately 10 deaths for the entire fishery. The Puget Sound treaty chum salmon gillnet fishery in Hood Canal (areas 12, 12B, and 12C) and the Puget Sound treaty sockeye/chum gillnet fishery in the Strait of Juan de Fuca (areas 4B, 5, and 6C) were also monitored in 1994 (NWIFC 1995). No harbor seal mortality was reported in the observer programs covering these treaty salmon gillnet fisheries, where observer coverage was estimated at 2.2% (based on % of total catch observed) and approximately 7.5% (based on % of observed trips to total landings), respectively.
Also in 1994, NMFS, in conjunction with WDFW and the Tribes, monitored the Puget Sound treaty and non-treaty sockeye salmon gillnet fishery (areas 7 and 7A). During this fishery, observers monitored
12
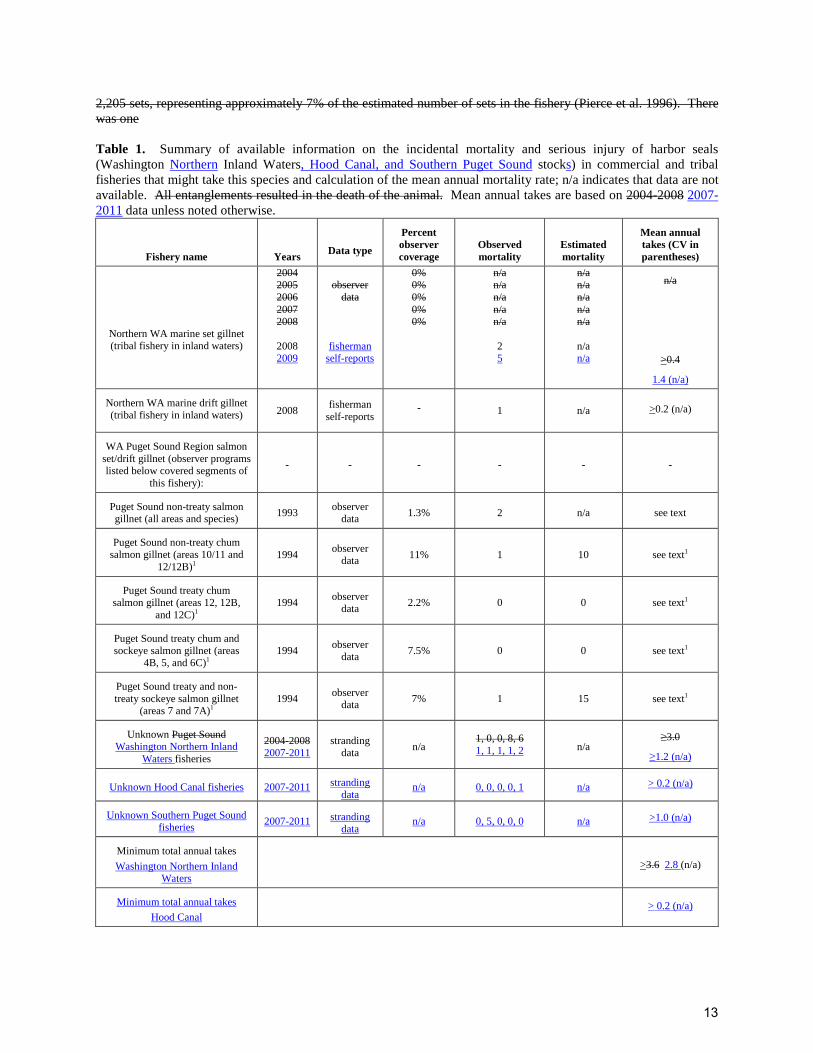
2,205 sets, representing approximately 7% of the estimated number of sets in the fishery (Pierce et al. 1996). There was one Table 1. Summary of available information on the incidental mortality and serious injury of harbor seals (Washington Northern Inland Waters, Hood Canal, and Southern Puget Sound stocks) in commercial and tribal fisheries that might take this species and calculation of the mean annual mortality rate; n/a indicates that data are not available. All entanglements resulted in the death of the animal. Mean annual takes are based on 2004-2008 2007-2011 data unless noted otherwise.
Fishery name
Years
Data type Percent observer coverage
Observed mortality
Estimated mortality
Mean annual takes (CV in parentheses)
Northern WA marine set gillnet (tribal fishery in inland waters)
2004 2005 2006 2007 2008
2008 2009
observer
data fisherman
self-reports
0% 0% 0% 0% 0%
n/a n/a n/a n/a n/a
2 5
n/a n/a n/a n/a n/a
n/a n/a
n/a
>0.4
1.4 (n/a)
Northern WA marine drift gillnet (tribal fishery in inland waters) 2008
fisherman self-reports
-
1 n/a >0.2 (n/a)
WA Puget Sound Region salmon set/drift gillnet (observer programs listed below covered segments of
this fishery): - - - - - -
Puget Sound non-treaty salmon gillnet (all areas and species) 1993 observer
data 1.3% 2 n/a see text
Puget Sound non-treaty chum salmon gillnet (areas 10/11 and
12/12B)1 1994 observer
data 11% 1 10 see text1
Puget Sound treaty chum salmon gillnet (areas 12, 12B,
and 12C)1 1994 observer
data 2.2% 0 0 see text1
Puget Sound treaty chum and sockeye salmon gillnet (areas
4B, 5, and 6C)1 1994 observer
data 7.5% 0 0 see text1
Puget Sound treaty and non- treaty sockeye salmon gillnet
(areas 7 and 7A)1 1994 observer
data 7% 1 15 see text1
Unknown Puget Sound Washington Northern Inland
Waters fisheries 2004-2008 2007-2011
stranding data n/a 1, 0, 0, 8, 6
1, 1, 1, 1, 2 n/a ≥3.0
≥1.2 (n/a)
Unknown Hood Canal fisheries 2007-2011 stranding data
n/a 0, 0, 0, 0, 1 n/a > 0.2 (n/a)
Unknown Southern Puget Sound fisheries
2007-2011 stranding data
n/a 0, 5, 0, 0, 0 n/a >1.0 (n/a)
Minimum total annual takes
Washington Northern Inland Waters
>3.6 2.8 (n/a)
Minimum total annual takes
Hood Canal > 0.2 (n/a)
13

Fishery name
Years
Data type Percent observer coverage
Observed mortality
Estimated mortality
Mean annual takes (CV in parentheses)
Minimum total annual takes
Southern Puget Sound >1.0 (n/a)
1This fishery has not been observed since 1994 (see text); these data are not included in the calculation of recent minimum total annual takes.
observed harbor seal death (two others were entangled and released unharmed), resulting in a mortality rate of 0.00045 harbor seals per set, which was extrapolated to 15 deaths (CV=1.0) for the entire fishery.
It should be noted that the 1994 observer programs did not sample all segments of the Washington Puget Sound Region salmon set/drift gillnet fishery and, further, the extrapolations of total kill did not include effort for the unobserved segments of this fishery. The percentage of the overall Washington Puget Sound Region salmon set/drift gillnet fishery effort that was observed in 1994 was not quantified. However, the areas having the highest salmon catches and in which a majority of the vessels operated in 1994 were covered by the 1994 observer programs (Joe Scordino, pers. comm.). Harbor seal takes in the Washington Puget Sound Region salmon drift gillnet fishery are unlikely to have increased since the fishery was last observed in 1994, due to reductions in the number of participating vessels and available fishing time (see details in Appendix 1). Fishing effort and catch have declined throughout all salmon fisheries in the region due to management efforts to recover ESA-listed salmonids. In 1996, Washington Sea Grant Program conducted a test fishery in the non-treaty sockeye salmon gillnet fishery (area 7) to compare entanglement rates of seabirds and marine mammals and catch rates of salmon using three experimental gears and a control (monofilament mesh net). The experimental nets incorporated highly visible mesh in the upper quarter (50 mesh gear) or upper eighth (20 mesh gear) of the net or had low-frequency sound emitters attached to the corkline (Melvin et al. 1997). In 642 sets during 17 vessel trips, there were two harbor seal deaths (one other was released alive with no apparent injuries). Combining the estimates from the northern Washington marine set gillnet tribal fishery (0.4) and the northern Washington marine drift gillnet tribal fishery (0.2), results in an estimated mean annual mortality rate of 0.6 harbor seals from this stock. One harbor seal also entangled in a tribal drift gillnet test fishery in area 8-2 in 2006, resulting in an annual mortality of 0.2 harbor seals for this fishery. The Marine Mammal Authorization Program (MMAP) fisher self-reports, required of commercial vessel operators by the MMPA, are an additional source of information on the number of harbor seals killed or seriously injured incidental to commercial fishery operations. Between 2004 and 2008, there were no fisher self-reports of harbor seal deaths from the Washington Puget Sound Region salmon set/drift gillnet fishery. Unlike the 1994 observer program data, the self-reported fishery data cover the entire fishery (including treaty and non-treaty components). Although these reports are considered incomplete (see details in Appendix 1), they represent a minimum mortality. Strandings of harbor seals entangled in fishing gear or with serious injuries caused by interactions with gear are a final source of fishery-related mortality information. As these strandings could not be attributed to a particular fishery, they have been included in Table 1 as occurring in unknown Washington inland waters fisheries. According to Northwest Marine Mammal Stranding Network records, maintained by the NMFS Northwest Region (NMFS, Northwest Regional Office, unpublished data), there were 15 12 fishery-related strandings harbor seal deaths and serious injuries of harbor seals from this stock were reported in Washington inland waters in 2004-2008 2007-2011, resulting in an average annual mortality of 3.0 harbor seals: six from the Washington Northern Inland Waters stock, one from the Hood Canal stock, and five from the Southern Puget Sound stock, resulting in mean annual takes of 1.2 harbor seals in Washington Northern Inland Waters, 0.2 in Hood Canal, and 1.0 in Southern Puget Sound. Evidence of f Fishery interactions included two gaff injuries, two gillnet entanglements, in one fishing nets (10) entanglement, and one entanglements in fishing gear (three) hook injuries (one); and ingested hooks (one) in Washington Northern Inland Waters; one gillnet entanglement in Hood Canal; and five gillnet entanglements in Southern Puget Sound. As the strandings could not be attributed to a particular fishery, they have been included in Table 1 as occurring in unknown Puget Sound fisheries. Harbor seal deaths caused by interactions with recreational hook and line fishing gear were also reported in 2007-2011: two seals had hook injuries and one ingested a hook in Washington Northern Inland Waters and two seals ingested hooks in Southern Puget Sound, resulting in mean annual mortalities of 0.6 and 0.4, respectively, from these two stocks. This e Estimates from stranding data are is considered a minimums because not all stranded animals are found, reported, or examined for cause of death (via necropsy by trained personnel). Two additional harbor seals that stranded with serious hook injuries from recreational hook and line gear in Washington Northern Inland Waters in 2007-2011 were treated and released with
14

non-serious injuries (Carretta et al. 2013); therefore, they were not included in the mean annual mortality in this report. Other Mortality According to Northwest Marine Mammal Stranding Network records, maintained by the NMFS Northwest Region (NMFS, Northwest Regional Office, unpublished data), a total of 46 32human-caused harbor seal deaths or serious injuries were reported from non-fisheries sources in 2004-2008 2007-2011 for the Washington Northern Inland Waters stock. Twenty-four Eight animals were shot, 13 nine were struck by boats, two died in oil spills, three two were killed by dogs, one was beaten by a fisherman, one was caught in the Ballard Locks, one entangled in wire, and one 13 were entangled in a scientific research capture net marine debris, resulting in an estimated mean annual mortality of 9.2 6.4 harbor seals per year from this stock. During the same time period, 10 human-caused deaths or serious injuries were reported for the Southern Puget Sound stock: one animal entangled in marine debris, six were shot, one was killed by a dog, one entangled in a buoy line, and one entangled in a scientific research net, resulting in a mean annual mortality of 2.0 harbor seals. This estimate is These are considered a minimum estimates because not all stranded animals are found, reported, or examined for cause of death (via necropsy by trained personnel). An additional seriously injured harbor seal was disentangled from marine debris and released with non-serious injuries in Washington Northern Inland Waters in 2007 (Carretta et al. 2013); therefore, it was not included in the mean annual mortality in this report. Subsistence Harvests by Northwest Treaty Indian Tribes Tribal subsistence takes of this stock may occur, but no data on recent takes are available. STATUS OF STOCK Harbor seals are not considered to be “depleted” under the MMPA or listed as “threatened” or “endangered” under the Endangered Species Act. Based on currently available data, the minimum level of human-caused mortality and serious injury is 13.0 (3.8 + 9.2) 9.8 harbor seals per year for the Washington Northern Inland Waters stock (2.8 from fishery sources in Table 1 + 0.6 from recreational hook and line fisheries + 6.4 from non-fishery sources). Annual human-caused serious injury and mortality for the Hood Canal stock is 0.2 from unknown fishery sources. Annual human-caused serious injury and mortality for the Southern Puget Sound stock is 3.4, including 1.0 from fishery sources listed in Table 1, 0.4 from recreational hook and line fisheries, and 2.0 from non-fishery sources. A PBRs cannot be calculated for this these stocks because there is are no current abundance estimates. The previous estimate of PBR was 771 (Carretta et al. 2009). Human-caused mortality relative to PBR is unknown for these stocks, but it is considered to be small relative to the stock size. Therefore, the Washington Northern Inland Waters, Hood Canal, and Southern Puget Sound stocks of harbor seals is are not classified as a “strategic” stocks. At present, the minimum estimated annual fishery mortality and serious injury for this these stock s (based on stranding data) is are 3.8 1.2 (based on recent observer data (0) and self-reported fisheries information (0.8) or stranding data (3.0) where observer data were not available or failed to detect harbor seal mortality) for the Washington Northern Inland Waters stock, 0.2 for the Hood Canal stock, and 1.0 for the Southern Puget Sound stock. Since a PBRs cannot be calculated for this these stocks, fishery mortality relative to PBR is unknown. The stock is within its Optimum Sustainable Population (OSP) level (Jeffries et al. 2003). REFERENCES Andersen, M. S., K. A. Forney, T. V. N. Cole, T. Eagle, R. Angliss, K. Long, L. Barre, L. Van Atta, D. Borggaard,
T. Rowles, B. Norberg, J. Whaley, and L. Engleby. 2008. Differentiating Serious and Non-Serious Injury of Marine Mammals: Report of the Serious Injury Technical Workshop, 10-13 September 2007, Seattle, Washington. U.S. Dep. Commer., NOAA Tech. Memo. NMFS-OPR-39. 94 p.
Angliss, R.P. and D.P. DeMaster. 1998. Differentiating Serious and Non-Serious Injury of Marine Mammals Taken Incidental to Commercial Fishing Operations. NOAA Tech Memo. NMFS-OPR-13, 48 p.
Bigg, M. A. 1969. The harbour seal in British Columbia. Fish. Res. Bd. Can. Bull. 172. 33 pp. Bigg, M. A. 1981. Harbour seal, Phoca vitulina, Linnaeus, 1758 and Phoca largha, Pallas, 1811. Pp. 1-27, In:
Ridgway, S. H., and R. J. Harrison (eds.), Handbook of Marine Mammals. Vol. 2: Seals. Academic Press, New York.
Boveng, P. 1988. Status of the Pacific harbor seal population on the U.S. west coast. Administrative Report LJ-88-06. 43 pp. Available from Southwest Fisheries Science Center, 3333 North Torrey Pines Road, La Jolla, CA 92037.
15

Brown, R. F. 1988. Assessment of pinniped populations in Oregon: April 1984 to April 1985. NWAFC Processed Report 88-05. 44 pp. Available at National Marine Mammal Laboratory, 7600 Sand Point Way NE, Seattle, WA 98115.
Brown, R. F., and B. R. Mate. 1983. Abundance, movements, and feeding habits of the harbor seal, Phoca vitulina, at Netarts and Tillamook Bays, Oregon. Fish. Bull. 81:291-301.
Burg, T. M. 1996. Genetic analysis of eastern Pacific harbor seals (Phoca vitulina richardsi) from British Columbia and parts of Alaska using mitochondrial DNA and microsatellites. MS Thesis, University of British Columbia, Vancouver, BC. 77 pp.
Calambokidis, J., S. Speich, J. Peard, G. Steiger, D. M. Fry, J. Lowenstine, and J. Cubbage. 1985. Biology of Puget Sound marine mammals and marine birds: population health and evidence of pollution effects. U.S. Dep. Commer., NOAA Tech. Memo. NOS-OMA-18. 159 pp.
Carretta, J. V., K. A. Forney, M. S. Lowry, J. Barlow, J. Baker, D. Johnston, B. Hanson, M. M. Muto, D. Lynch, and L. Carswell. 2009. U.S. Pacific marine mammal stock assessments: 2008. U.S. Dep. Commer., NOAA Tech. Memo. NMFS-SWFSC-434. 336 pp.
Carretta, J. V., S. M. Wilkin, M. M. Muto, and K. Wilkinson. 2013. Sources of human-related injury and mortality for U.S. Pacific west coast marine mammal stock assessments, 2007-2011. U.S. Dep. Commer., NOAA Tech. Memo. NMFS-SWFSC-514, 83 p.
Erstad, P., S. J. Jeffries, and D. J. Pierce. 1996. 1994 Report for the Puget Sound fishery observer program in management areas 10/11 & 12/12B: nontreaty chum gill net fishery. Final Report. Washington Dept. Fish and Wildlife, Olympia, WA. 14 pp.
Fisher, H. D. 1952. The status of the harbour seal in British Columbia, with particular reference to the Skeena River. Fish. Res. Bd. Can. Bull. 93. 58 pp.
Herder, M. J. 1986. Seasonal movements and hauling site fidelity of harbor seals, Phoca vitulina richardsi, tagged at the Russian River, California. MS Thesis, Humbolt State University, Humbolt, CA. 52 pp.
Huber, H., S. Jeffries, R. Brown, and R. DeLong. 1994. Harbor seal, Phoca vitulina richardsi, stock assessment in Washington and Oregon, 1993. 1993 Annual Report to the MMPA Assessment Program, Office of Protected Resources, NMFS, NOAA, 1335 East-West Highway, Silver Spring, MD 20910. Available at National Marine Mammal Laboratory, 7600 Sand Point Way NE, Seattle, WA 98115.
Huber, H. R., S. J. Jeffries, R. F. Brown, R. L. DeLong, and G. VanBlaricom. 2001. Correcting aerial survey counts of harbor seals (Phoca vitulina richardsi) in Washington and Oregon. Mar. Mammal Sci. 17(2):276-293.
Huber, H. R., S. J. Jeffries, D. M. Lambourn, and B. R. Dickerson. 2010. Population substructure of harbor seals (Phoca vitulina richardsi) in Washington State using mtDNA. Can. J. Zool. 88:280-288.
Huber, H. R., B. R. Dickerson, S. J. Jeffries, and D. M. Lambourn. 2012. Genetic analysis of Washington State harbor seals (Phoca vitulina richardii) using microsatellites. Can. J. Zool. 90(12):1361-1369. DOI: 10.1139/cjz-2012-0047.
Jeffries, S. J. 1985. Occurrence and distribution patterns of marine mammals in the Columbia River and adjacent coastal waters of northern Oregon and Washington. Pp. 15-50, In: Beach, R. J., A. C. Geiger, S. J. Jeffries, S. D. Treacy, and B. L. Troutman, Marine mammals and their interactions with fisheries of the Columbia River and adjacent waters, 1980-1982. NWAFC Processed Report 85-04. 316 pp. Available at National Marine Mammal Laboratory, 7600 Sand Point Way NE, Seattle, WA 98115.
Jeffries, S. J., R. F. Brown, H. R. Huber, and R. L. DeLong. 1997. Assessment of harbor seals in Washington and Oregon, 1996. Pp. 83-94, In: Hill, P. S., and D. P. DeMaster (eds.), MMPA and ESA Implementation Program, 1996. AFSC Processed Report 97-10. 255 pp. Available at National Marine Mammal Laboratory, 7600 Sand Point Way NE, Seattle, WA 98115.
Jeffries, S., H. Huber, J. Calambokidis, and J. Laake. 2003. Trends and status of harbor seals in Washington State: 1978-1999. J. Wildl. Manage. 67(1):208-219.
Lamont, M. M., J. T. Vida, J. T. Harvey, S. Jeffries, R. Brown, H. H. Huber, R. DeLong, and W. K. Thomas. 1996. Genetic substructure of the Pacific harbor seal (Phoca vitulina richardsi) off Washington, Oregon, and California. Mar. Mammal Sci. 12(3):402-413.
Makah Fisheries Management, P.O. Box 115, Neah Bay, WA 98357. Melvin, E. F., L. L. Conquest, and J. K. Parrish. 1997. Seabird bycatch reduction: new tools for Puget Sound drift
gillnet salmon fisheries. 1996 Sockeye and 1995 Chum Salmon Test Fisheries Final Report. Washington Sea Grant Program, Seattle, WA. 48 pp.
National Marine Fisheries Service (NMFS), Northwest Regional Office, 7600 Sand Point Way NE, Seattle, WA 98115.
16

National Marine Fisheries Service (NMFS). 2005. Revisions to Guidelines for Assessing Marine Mammal Stocks. 24 pp. Available at http://www.nmfs.noaa.gov/pr/pdfs/sars/gamms2005.pdf.
Newby, T. C. 1973. Changes in Washington State harbor seal population, 1942-1972. Murrelet 54:5-6. NOAA. 2012. Federal Register 77:3233. National Policy for Distinguishing Serious From Non-Serious Injuries of
Marine Mammals. http://www.nmfs.noaa.gov/op/pds/documents/02/238/02-238-01.pdf Northwest Indian Fisheries Commission (NWIFC). 1995. Monitoring of marbled murrelet and marine mammal
interactions with 1994 tribal gillnet fisheries in northern Puget Sound, Hood Canal, and the Strait of Juan de Fuca. Final Report to NMFS (Contract No. 52ABNF400087) and U.S. Fish and Wildlife Service. Unpublished Report. 41 pp. Available at NWIFC, 6730 Martin Way E, Olympia, WA 98516.
Pierce, D. J., W. P. Ritchie, and R. Kreuziger. 1994. Preliminary findings of seabird interactions with the non-treaty salmon gill net fishery: Puget Sound and Hood Canal Washington. Unpublished Report. Washington Dept. Fish and Wildlife, Olympia, WA. 39 pp. Available at WDFW, 600 Capitol Way N, Olympia, WA 98501.
Pierce, D. J., M. Alexandersdottir, S. J. Jeffries, P. Erstad, W. Beattie, and A. Chapman. 1996. Interactions of marbled murrelets and marine mammals with the 1994 Puget Sound sockeye gill net fishery. Final Report. Washington Dept. Fish and Wildlife, Olympia, WA. 21 pp.
Pitcher, K. W., and D. G. Calkins. 1979. Biology of the harbor seal (Phoca vitulina richardsi) in the Gulf of Alaska. U.S. Dep. Commer., NOAA, OCSEAP Final Report 19(1983):231-310.
Pitcher, K. W., and D. C. McAllister. 1981. Movements and haul out behavior of radio-tagged harbor seals, Phoca vitulina. Can. Field Nat. 95:292-297.
Scheffer, V. B., and J. W. Slipp. 1944. The harbor seal in Washington State. Amer. Midl. Nat. 32:373-416. Scordino, Joe. National Marine Fisheries Service, Northwest Regional Office, 7600 Sand Point Way NE, Seattle,
WA 98115. Temte, J. L. 1986. Photoperiod and the timing of pupping in the Pacific harbor seal (Phoca vitulina richardsi) with
notes on reproduction in northern fur seals and Dall porpoises. MS Thesis, Oregon State University, Corvallis, OR.
Wade, P. R., and R. Angliss. 1997. Guidelines for assessing marine mammal stocks: report of the GAMMS workshop April 3-5, 1996, Seattle, Washington. U.S. Dep. Commer., NOAA Tech. Memo. NMFS-OPR-12. 93 pp.
Womble, J. N. 2012. Foraging ecology, diving behavior, and migration patterns of harbor seals (Phoca vitulina richardii) from a glacial fjord in Alaska in relation to prey availability and oceanographic features. Ph.D. Thesis, Oregon State University, Corvallis, OR.
17

Revised 01/15/20119/24/2013 NORTHERN FUR SEAL (Callorhinus ursinus): San Miguel Island
California Stock
STOCK DEFINITION AND GEOGRAPHIC RANGE Northern fur seals occur from southern California north to the Bering Sea and west to the Okhotsk Sea and Honshu Island, Japan (Fig. 1). During the breeding season, approximately 74% of the worldwide population is found on the Pribilof Islands in the southern Bering Sea, with the remaining animals spread throughout the North Pacific Ocean (Lander and Kajimura 1982). Of the seals in U.S. waters outside of the Pribilofs, approximately 1% of the population is found on Bogoslof Island in the southern Bering Sea, and San Miguel Island off southern California (NMFS 2007), and the Farallon Islands off central California. Northern fur seals may temporarily haul out on land at other sites in Alaska, British Columbia, and on islets along the coast of the continental United States, but generally this occurs outside of the breeding season (Fiscus 1983). Due to differing requirements during the annual reproductive season, adult males and females typically occur ashore at different, though overlapping, times. Adult males usually occur on ashore and defend reproductive terroritories during the 4 a 3-month period from May- June through August, though some may be present until November (well after giving up their territories). Adult females are found ashore for as long as 6 months (June-November). After their respective times ashore, fur seals of both sexes spend the next 7 to 8 months at sea (Roppel 1984). Adult females and pups from the Pribilof Islands migrate through the Aleutian Islands into the North Pacific Ocean, often to waters off Washington, Oregon, and California offshore waters. Many pups may remain at sea for 22 months before returning to their natal rookery of birth. Adult males from the Pribilof Islands generally migrate only as far south as the Gulf of Alaska (Kajimura 1984). There is considerable interchange of individuals between rookeries. The following information was considered in classifying stock structure based on the Dizon et al. (1992) phylogeographic approach: 1) Distributional data: continuous geographic distribution during feeding, geographic separation during the breeding season, and high natal site fidelity (DeLong 1982); 2) Population response data: substantial differences in population dynamics between the Pribilofs and San Miguel Island (DeLong 1982, DeLong and Antonelis 1991, NMFS 2007); 3) Phenotypic data: unknown; and 4) Genotypic data: little evidence of genetic differentiation among breeding islands (Ream 2002). Based on this information, two separate stocks of northern fur seals are recognized within U.S. waters: an Eastern Pacific stock and a San Miguel Island California stock (including San Miguel Island and the Farallon Islands). The Eastern Pacific stock is reported separately in the Stock Assessment Reports for the Alaska Region.
Figure 1. Approximate distribution of northern fur seals in the North Pacific (shaded area).
18

POPULATION SIZE The population estimate for the San Miguel Island stock of northern fur seals on San Miguel Island is calculated as the estimated number of pups at rookeries multiplied by an expansion factor. Based on research conducted on the Eastern Pacific stock of northern fur seals, Lander’s (1981) life table analysis was used to estimate the number of yearlings, two-year-olds, three-year-olds, and animals at least four years old. The resulting population estimate was equal to the pup count multiplied by 4.475. The expansion factors are based on a sex and age distribution estimated after the commercial harvest of juvenile males was terminated in 1984. A more appropriate expansion factor for the San Miguel Island stock is 4.0, because immigration of recruitment-aged females is occurring in the population (DeLong 1982), as well as mortality and possible emigration of adults associated with the El Niño Southern Oscillation events in 1982-1983 and 1997-1998 (Melin et al. 2008). A 1998 pup count resulted in an 80% decrease from the 1997 count (Melin et al. 2005). In 1999, the population began to recover, and by 2007 in 2010 the highest total pup count was 2,492 of 3,574 was recorded (Melin et al. 2008 Orr et al. 2012). During 2011, the total pup count decreased 13.5% from 2010 levels to 3,092. Based on the 2007 2011 count and the expansion factor, the most recent population estimate of the northern fur seals at San Miguel Island stock is 9,968 12,368 (2,492 3,092 x 4.0) northern fur seals. Currently, a coefficient of variation (CV) for the expansion factor is unavailable. The population estimate for northern fur seals on the Farallon Islands is calculated as the highest number of pups, juveniles, and adults counted at the rookery. The long-term population estimate at the Farallon Islands should be regarded an index of abundance rather than a precise indicator of population size for several reasons: 1) Population censuses are incomplete because researchers do not enter rookery areas until the end of the breeding/pupping season in order to reduce human disturbance to other breeding pinnipeds and nesting seabirds; 2) mortality occurring early in the season is not accounted for; and 3) estimates of the number of pups is compromised because by the time counts are conducted, many pups have learned to swim and may not be present at the rookery. Additionally, yearlings may be present at rookeries and misidentified as pups. Keeping these factors in mind, the peak counts of northern fur seals increased steadily from 1995 to 2006 and have increased exponentially from 2008 to 2011 (Tietz 2012). Based solely on the count, the most recent population estimate of northern fur seals at the Farallon Islands is 476. Incorporating estimates of numbers from San Miguel Island and the Farallon Islands, the most recent population estimate of the California stock is 12,844. Minimum Population Estimate Minimum population size is calculated as the sum of the minimum number of animals at San Miguel Island and the Farallon Islands in 2011 (Orr et al. 2012, Tietz 2012). The minimum number of animals at San Miguel Island is twice the pup count (3,092 x 2 = 6,184), to account for pups and mothers, plus the number of males (247) counted the same year, or 6,431 animals. The minimum number at the Farallon Islands is twice the pup count (122 x 2 = 244), plus the number of males (47), or 291 animals. The total minimum population size is the sum of minimum population sizes at San Miguel Island (6,431) and Farallon Island (291) in 2011, or 6,722. The survey technique utilized for estimating the abundance of northern fur seals within the San Miguel Island stock is a direct count, with no associated CV, as sites are surveyed only once. Additional estimates of the overall population size (i.e., NBEST) and associated CV are also unavailable. Therefore, the minimum population size for this stock cannot be estimated by calculating the lower 20th percentile of the log-normal distribution of the population estimate. Rather, the minimum population size is estimated as twice the maximum number of pups born in 2007 (to account for the pups and their mothers) plus the maximum number of adult (147) and sub-adult (264) males counted for the 2007 season (Melin et al. 2008), which results in an estimate of 5,395 ((2,492 x 2) + 411). This method provides a very conservative estimate of the northern fur seals population at San Miguel Island. Current Population Trend The population of n Northern fur seals were extirpated on San Miguel Island and the Farallon Islands during the late 1700s and early 1800s. Immigrants originated from the Pribilof Islands and Russian populations recolonized San Miguel Island during the late 1950s or early 1960s (DeLong 1982). The colony has increased steadily, since its discovery in 1968, except for severe declines in 1983 and 1998 associated with El Niño Southern Oscillation events in 1982-1983 and 1997-1998 (DeLong and Antonelis 1991, Melin et al. 2005). El Niño events, which occur periodically along the California coast, impact population growth of northern fur seals at San Miguel Island and are an important regulatory mechanism for this population (DeLong and Antonelis 1991; Melin and DeLong 1994, 2000; Melin et al. 1996, 2005, 2008; Orr et al. 2012).
19

Specifically, live Live pup counts increased about 24% annually from 1972 through 1982 (Fig. 2), an increase due, in part, to immigration of females from the Bering Sea and the western North Pacific Ocean (DeLong 1982). The 1982-1983 El Niño event resulted in a 60.3% decline in the northern fur seal population at San Miguel Island (DeLong and Antonelis 1991). It took the population 7 years to recover from this decline, because adult female mortality or emigration occurred in addition to pup mortality (Melin and DeLong 1994). The 1992-1993 El Niño conditions resulted in reduced pup production in 1992, but the population recovered in 1993 and increased in during during 1994 (Melin et al. 1996). From July 1997 through May 1998, the most severe El Niño event in recorded history affected California coastal waters (Lynn et al. 1998). In 1997, total fur seal pup production was the highest recorded since the colony has been monitored. However, it appears that up to 87% of the pups born in 1997 died before weaning, and total production in 1998 declined 80% from 1997 (Melin et al. 2005). Although total Total production increased to 2,492 3,574 in 2007 2010 but decreased to 3,092 in 2011 (Melin et al. 2008 Orr et al. 2012),. It appears that the population has not yet recovered. Recovery from the 1998 decline has been slowed by the adult female mortality or emigration which occurred in addition to the high pup mortality in 1997 and 1998 (Melin et al. 2008).
Compared to San Miguel Island, less information is known about the population of northern fur seals on the Farallon Islands. Based on tag-resight data, it appears that the population originated from emigrants from San Miguel Island. The first pup was observed on the Farallon Islands in 1996 (Pyle et al. 2001). After this discovery, annual ground surveys were conducted in early fall to document population trends of the colony (Tietz 2012). The colony increased steadily from 1996 to the early 2000s. However, the population has grown exponentially during the past several years, with an occasional decline (Tietz 2012). Because counts are conducted during the fall after the breeding season, population trends and demographic information is less clear than for San Miguel Island. CURRENT AND MAXIMUM NET PRODUCTIVITY RATES Currently, productivity rates for northern fur seals on the Farallon Islands are unavailable. A growth rate of 20% was calculated for northern fur seals on San Miguel Island in 1972-1982 by linear regression of the natural logarithm of pup count against year. However, it is clear that this rate of increase was due in part to immigration of females from Russian and Pribilof Islands populations (DeLong 1982). In the absence of a reliable estimate of the maximum net productivity rate for the San Miguel Island California stock of northern fur seals, the pinniped default maximum theoretical net productivity rate (RMAX) of 12% (Wade and Angliss 1997) is used as a conservative estimate of RMAX. POTENTIAL BIOLOGICAL REMOVAL The potential biological removal (PBR) level for this stock is calculated as the minimum population estimate (5,395 6,722) times one-half the default maximum net growth rate (½ of 12%) times a recovery factor of 1.0 (for stocks of unknown status that are increasing in size: Wade and Angliss 1997), resulting in a PBR of 324 403 San Miguel Island northern fur seals from the California stock per year. HUMAN-CAUSED MORTALITY AND SERIOUS INJURY New Serious Injury Guidelines NMFS updated its serious injury designation and reporting process, which uses guidance from previous serious injury workshops, expert opinion, and analysis of historic injury cases to develop new criteria for distinguishing serious from non-serious injury (Angliss and DeMaster 1998, Andersen et al. 2008, NOAA 2012).
Figure 2. Number of live Total production of northern fur seal pups counted on San Miguel Island (including the mainland and the offshore islet Castle Rock), 1972-20072011.
0
500
1000
1500
2000
2500
3000
3500
4000
1972 1977 1982 1987 1992 1997 2002 2007
Tot
al P
up P
rodu
ctio
n
Year
San Miguel Island - mainland Castle Rock
20

NMFS defines serious injury as an “injury that is more likely than not to result in mortality”. Injury determinations for stock assessments revised in 2013 or later incorporate the new serious injury guidelines, based on the most recent 5-year period for which data are available. Fisheries Information Northern fur seals taken during the winter/spring along the west coast of the continental U.S. could be from the Eastern Pacific stock. However, it is the intention of NMFS to considers any takes of northern fur seals by commercial fisheries in waters off California, Oregon, and Washington as being from the San Miguel Island California stock. Information concerning observed fisheries that may have interacted with northern fur seals is listed in Table 1. There were no observer reports of northern fur seal deaths in any observed fishery along the west coast of the continental U.S. in 2004-2008 2007-2011 (Table 1; Carretta et al. 2005; Carretta and Enriquez 2006, 2007, 2009a, 2009b, 2010, 2012a, 2012b; NWFSC 2008 Jannot et al. 2011). The estimated mean mortality rate in observed fisheries is zero northern fur seals per year from this stock. Table 1. Summary of available information on the incidental mortality and serious injury of northern fur seals (San Miguel Island California stock) in commercial fisheries that might take this species and calculation of the mean annual mortality rate; n/a indicates that data are not available. Mean annual takes are based on 2004-2008 2007-2011 data unless noted otherwise.
Fishery name
Years
Data type Percent observer coverage
Observed mortality
Estimated mortality
Mean annual takes (CV in
parentheses)
CA/OR thresher shark/ swordfish drift gillnet
2004 2005 2006 2007 2008
observer data
20.6% 20.9% 18.5% 16.4% 13.5%
0 0 0 0 0
0 0 0 0 0
0 (n/a)
CA halibut/white seabass and other species large mesh (>3.5
in) set gillnet
2003 2004 2005 2006 2007
observer data
0% 0% 0% 0%
17.8%
n/a n/a n/a n/a 0
n/a n/a n/a n/a 0
0 (n/a)
WA/OR/CA groundfish trawl (Pacific hake at-sea processing
component)
2002 2003 2004 2005 2006
observer data
100%1
100%1
100%1 100%1 100%1
0 0 0 0 0
0 (0) 0 (0) 0 (0) 0 (0) 0 (0)
0 (0)
Unknown West Coast fisheries 2007-2011 stranding
data n/a 0, 0, 1, 0, 1 n/a >0.4 (n/a)
Minimum total annual takes 0 (n/a) >0.4 (n/a)
1Percent observer coverage equals percent of vessels with observers. The Marine Mammal Authorization Program (MMAP) fisher self-reports, required of commercial vessel operators by the MMPA, are an additional source of information on the number of northern fur seals killed or seriously injured incidental to commercial fishery operations. There were no fisher self-reports of northern fur seal deaths in any MMAP-listed fishery operating in waters off California, Oregon, or Washington between 2004 and 2008. Although these reports are considered incomplete (see details in Appendix 1), they represent a minimum mortality. Strandings of northern fur seals entangled in fishing gear or with serious injuries caused by interactions with gear are a final source of fishery-related mortality information. According to Marine Mammal Stranding Network records, maintained for California by the NMFS Southwest Region (NMFS, Southwest Regional Office, unpublished data) and for Oregon and Washington by the NMFS Northwest Region (NMFS, Northwest Regional Office, unpublished data), no two fishery-related deaths (net entanglements) strandings were reported between 2004 and 2008 2007 and 2011 (Table 1), resulting in a mean annual mortality of 0.4 northern fur seals. This estimate is considered a minimum because not all stranded animals are found, reported, or examined for cause of death (via necropsy by trained personnel). One northern fur seal stranded in 2008 with serious injuries related to a hook and line fishery interaction and was treated and released with non-serious injuries (Carretta et al. 2013). Other Mortality
21

In 2007 and 2008, four northern fur seals were incidentally killed in California waters during scientific sardine trawling operations conducted by NMFS (NMFS, Southwest Regional Office, unpublished data): one death occurred in 2007 and three in 2008. After marine mammal deaths, including one northern fur seal, occurred in April 2008 trawls, NMFS scientists met to discuss and implement a mitigation plan to avoid future mortality. The initial mitigation plan included use of 162 dB acoustic pingers, a marine mammal watch, and scheduling trawls to occur when the ship first arrived on station to avoid attracting animals to a stationary vessel. Two additional northern fur seals were killed in subsequent 2008 trawls, including one in July and one in August. In 2009, a marine mammal excluder device was added to the trawls and no additional deaths were observed during 42 trawls. However, one northern fur seal was killed in a scientific rockfish trawling operation conducted by NMFS (NMFS, Southwest Regional Office, unpublished data) in California waters in 2009. The average mean annual research-related mortality of northern fur seals from 2004 to 2008 2007 to 2011 is 0.8 1.0 animals. According to the Marine Mammal Stranding Network records maintained by the NMFS Southwest (NMFS, Southwest Regional Office, unpublished data) and Northwest (NMFS, Northwest Regional Office, unpublished data) Regions, two six human-caused northern fur seal deaths were reported from non-fisheries sources in California in 2004-2008 2007-2011. One animal was shot (in 2007) and one was five were entangled in marine debris (1 in 2008, 3 in 2009, and 1 in 2011), resulting in an estimated mean annual mortality of 0.4 1.2 animals from this stock between 2004 and 2008 2007 and 2011. This estimate is considered a minimum because not all stranded animals are found, reported, or examined for cause of death (via necropsy by trained personnel). Two additional northern fur seals were disentangled from marine debris in 2008, treated at a rehabilitation facilities, and released with non-serious injuries (Carretta et al. 2013). STATUS OF STOCK The San Miguel Island California northern fur seal stock is not considered to be “depleted” under the MMPA or listed as “threatened” or “endangered” under the Endangered Species Act. Based on currently available data, the estimated minimum annual level of total human-caused mortality and serious injury (1.2 2.6) does not exceed the PBR (324 403). Therefore, the San Miguel Island California stock of northern fur seals is not classified as a “strategic” stock. The minimum annual total fishery mortality and serious injury for this stock (0 0.4) is not known to exceed 10% of the calculated PBR (32.4 40.3) and, therefore, appears to be insignificant and approaching zero mortality and serious injury rate. The stock (based on San Miguel Island data) decreased 80% from 1997 to 1998, began to recover in 1999, and is currently at 77% 96% of the 1997 level. The status of this stock relative to its Optimum Sustainable Population (OSP) level is unknown, unlike the Eastern Pacific northern fur seal stock which is formally listed as “depleted” under the MMPA. REFERENCES Carretta, J. V., and L. Enriquez. 2006. Marine mammal bycatch and estimated mortality in California commercial
fisheries during 2005. Administrative Report LJ-06-07. 14 pp. Available from Southwest Fisheries Science Center, 3333 North Torrey Pines Road, La Jolla, CA 92037.
Carretta, J. V., and L. Enriquez. 2007. Marine mammal and sea turtle bycatch in the California/Oregon thresher shark and swordfish drift gillnet fishery in 2006. Administrative Report LJ-07-06. 9 pp. Available from Southwest Fisheries Science Center, 3333 North Torrey Pines Road, La Jolla, CA 92037.
Carretta, J. V., and L. Enriquez. 2009a. Marine mammal and seabird bycatch in observed California commercial fisheries in 2007. Administrative Report LJ-09-01. 12 pp. Available from Southwest Fisheries Science Center, 3333 North Torrey Pines Road, La Jolla, CA 92037.
Carretta, J. V., and L. Enriquez. 2009b. Marine mammal bycatch in the California/Oregon swordfish and thresher shark drift gillnet fishery in 2008. Administrative Report LJ-09-03. 10 pp. Available from Southwest Fisheries Science Center, 3333 North Torrey Pines Road, La Jolla, CA 92037.
Carretta, J. V., and L. Enriquez. 2010. Marine mammal and sea turtle bycatch in the California/Oregon swordfish and thresher shark drift gillnet fishery in 2009. Southwest Fisheries Science Center Administrative Report LJ-10-03. 11 pp. Available from Southwest Fisheries Science Center, 3333 North Torrey Pines Road, La Jolla, CA 92037.
Carretta, J. V., and L. Enriquez. 2012a. Marine mammal and seabird bycatch in California gillnet fisheries in 2010. Southwest Fisheries Science Center Administrative Report LJ-12-01. 14 pp. Available from Southwest Fisheries Science Center, 3333 North Torrey Pines Road, La Jolla, CA 92037.
Carretta, J. V., and L. Enriquez. 2012b. Marine mammal and seabird bycatch in California gillnet fisheries in 2011. NOAA Technical Memorandum NMFS-SWFSC-500. 14 pp. Available from Southwest Fisheries Science Center, 3333 North Torrey Pines Road, La Jolla, CA 92037.
22

Carretta, J. V., S. J. Chivers, and K. Danil. 2005. Preliminary estimates of marine mammal bycatch, mortality, and biological sampling of cetaceans in California gillnet fisheries for 2004. Administrative Report LJ-05-10. 17 pp. Available from Southwest Fisheries Science Center, 3333 North Torrey Pines Road, La Jolla, CA 92037.
Carretta, J. V., S. M. Wilkin, M. M. Muto, and K. Wilkinson. 2013. Sources of human-related injury and mortality for U.S. Pacific west coast marine mammal stock assessments, 2007-2011. U.S. Dep. Commer., NOAA Tech. Memo. NMFS-SWFSC-514, 83 p.
DeLong, R. L. 1982. Population biology of northern fur seals at San Miguel Island, California. Ph.D. Thesis, University of California, Berkeley, CA. 185 pp.
DeLong, R. L., and G. A. Antonelis. 1991. Impacts of the 1982-1983 El Niño on the northern fur seal population at San Miguel Island, California. Pp. 75-83, In: Trillmich, F., and K. Ono (eds.), Pinnipeds and El Niño: Responses to Environmental Stress. Springer-Verlag, New York. 293 pp.
Dizon, A. E., C. Lockyer, W. F. Perrin, D. P. DeMaster, and J. Sisson. 1992. Rethinking the stock concept: a phylogeographic approach. Conserv. Biol. 6:24-36.
Fiscus, C. H. 1983. Fur seals and islands. In: Background papers submitted by the United States to the 26th meeting of the Standing Scientific Committee of the North Pacific Fur Seal Commission, Washington, D.C., March 28-April 5, 1983. Available at National Marine Mammal Laboratory, 7600 Sand Point Way NE, Seattle, WA 98115.
Jannot, J., E. Heery, M. A. Bellman, and J. Majewski. 2011. Estimated bycatch of marine mammals, seabirds, and sea turtles in the US west coast commercial groundfish fishery, 2002-2009. West Coast Groundfish Observer Program. Unpublished Report. 104 pp. Available at: http://www.nwfsc.noaa.gov/research/divisions/fram/observer/pdf/mmsbt_report02-09.pdf.
Kajimura, H. 1984. Opportunistic feeding of the northern fur seal, Callorhinus ursinus, in the eastern North Pacific Ocean and eastern Bering Sea. U.S. Dep. Commer., NOAA Tech. Report NMFS-SSRF-779. 49 pp.
Lander, R. H. 1981. A life table and biomass estimate for Alaskan fur seals. Fisheries Research (Amsterdam) 1:55-70.
Lander, R. H., and H. Kajimura. 1982. Status of northern fur seals. FAO Fisheries Series 5:319-345. Lynn, R. J., T. Baumgartner, J. Garcia, C. A. Collins, T. L. Hayward, K. D. Hyrenbach, A. W. Mantyla, T.
Murphree, A. Shankle, F. B. Schwing, K. M. Sakuma, and M. J. Tegner. 1998. The state of the California Current, 1997-1998: transition to El Niño conditions. CalCOFI Report 39:25-49.
Melin, S. R., and R. L. DeLong. 1994. Population monitoring of northern fur seals on San Miguel Island, California. Pp. 137-141, In: Sinclair, E. H. (ed.), Fur seal investigations, 1992. U.S. Dep. Commer., NOAA Tech. Memo. NMFS-AFSC-45. 190 pp.
Melin, S. R., and R. L. DeLong. 2000. Population monitoring studies of northern fur seals at San Miguel Island, California. Pp. 41-51, In: Robson, B. W. (ed.), Fur seal investigations, 1998. U.S. Dep. Commer., NOAA Tech. Memo. NMFS-AFSC-113. 101 pp.
Melin, S. R., R. L. DeLong, and J. R. Thomason. 1996. Population monitoring studies of northern fur seals at San Miguel Island, California. Pp. 87-102, In: Sinclair, E. H. (ed.), Fur seal investigations, 1994. U.S. Dep. Commer., NOAA Tech. Memo. NMFS-AFSC-69. 144 pp.
Melin, S. R., R. L. DeLong, and A. J. Orr. 2005. The status of the northern fur seal population at San Miguel Island, California, 2002-2003. Pp. 44-52, In: Testa, J. W. (ed.), Fur seal investigations, 2002-2003. U.S. Dep. Commer., NOAA Tech. Memo. NMFS-AFSC-151. 72 pp.
Melin, S. R., A. J. Orr, and R. L. DeLong. 2008. The status of the northern fur seal population at San Miguel Island, California, 2006 and 2007. Pp. 41-54, In: Testa, J. W. (ed.), Fur seal investigations, 2006-2007. U.S. Dep. Commer., NOAA Tech. Memo. NMFS-AFSC-188. 76 pp.
National Marine Fisheries Service (NMFS). 2007. Conservation plan for the Eastern Pacific stock of northern fur seal (Callorhinus ursinus). National Marine Fisheries Service, Juneau, AK. Available at http://www.fakr.noaa.gov/protectedresources/seals/fur.htm.
National Marine Fisheries Service (NMFS), Northwest Regional Office, 7600 Sand Point Way NE, Seattle, WA 98115.
National Marine Fisheries Service (NMFS), Southwest Regional Office, 501 West Ocean Blvd., Long Beach, CA 90802.
Northwest Fisheries Science Center (NWFSC). 2008. Report on the bycatch of marine mammals and seabirds by the U.S. West Coast groundfish fleet. At-sea Hake Observer Program, West Coast Groundfish Observer Program, Northwest Fisheries Science Center, NOAA Fisheries. Unpublished Report. 34 pp. Available at http://www.nwfsc.noaa.gov/research/divisions/fram/observer/datareport/index.cfm.
23
Orr, A. J., S. R. Melin, and R. L. DeLong. 2012. Status of the northern fur seal population at San Miguel Island, California during 2010 and 2011. Pp. 41-58, In: Testa, J. W. (ed.), Fur seal investigations, 2010-2011. U.S. Dep. Commer., NOAA Tech. Memo. NMFS-AFSC-241. 77 pp.
Pyle, P., D. J. Long, J. Schonewald, R. E. Jones, and J. Roletto. 2001. Historical and recent colonization of the South Farallon Islands, California, by northern fur seals (Callorhinus ursinus). Mar. Mammal Sci. 17:397-402.
Ream, R. R. 2002. Molecular ecology of North Pacific otariids: genetic assessment of northern fur seal and Steller sea lion distributions. Ph.D. Thesis, University of Washington, Seattle, WA. 134 pp.
Roppel, A. Y. 1984. Management of northern fur seals on the Pribilof Islands, Alaska, 1786-1981. U.S. Dep. Commer., NOAA Tech. Report NMFS-4. 32 pp.
Tietz, J. R. 2012. Pinniped surveys on West End Island, Farallon National Wildlife Refuge 2011. Unpublished Report to the U.S. Fish and Wildlife Service. PRBO Conservation Science, Petaluma, California. PRBO Contribution Number 1853.
Wade, P. R., and R. Angliss. 1997. Guidelines for assessing marine mammal stocks: report of the GAMMS workshop April 3-5, 1996, Seattle, Washington. U.S. Dep. Commer., NOAA Tech. Memo. NMFS-OPR-12. 93 pp.
24

Revised 12/04/2012 9/24/2013 HAWAIIAN MONK SEAL (Monachus schauinslandi)
STOCK DEFINITION AND GEOGRAPHIC RANGE Hawaiian monk seals are distributed throughout the Northwestern Hawaiian Islands (NWHI), with subpopulations at French Frigate Shoals, Laysan Island, Lisianski Island, Pearl and Hermes Reef, Midway Atoll, Kure Atoll, and Necker and Nihoa Islands. They also occur throughout the main Hawaiian Islands (MHI). Genetic variation among monk seals is extremely low and may reflect a long-term history at low population levels and more recent human influences (Kretzmann et al. 1997, 2001, Schultz et al. 2009). On average, 10-15% of the seals migrate among the NWHI subpopulations (Johnson and Kridler 1983; Harting 2002). Thus, the NWHI subpopulations are not isolated, though different island subpopulations have exhibited considerable demographic independence. Observed interchange of individuals among the NWHI and MHI regions is uncommon, but genetic stock structure analysis (Schultz et al. 2011) supports management of the species as a single stock. POPULATION SIZE The best estimate of the total population size is 1,212 1,209. This estimate is the sum of estimated abundance at the six main Northwestern Hawaiian Islands subpopulations, an extrapolation of counts at Necker and Nihoa Islands, and an estimate of minimum abundance in the main Hawaiian Islands. The number of individual seals identified was used as the population estimate at NWHI sites where total enumeration was achieved, according to the criteria established by Baker et al. (2006). Where total enumeration was not achieved, capture-recapture estimates from Program CAPTURE were used (Baker 2004; Otis et al. 1978, Rexstad & Burnham 1991, White et al. 1982). When no reliable estimator was obtainable in Program CAPTURE (i.e., the model selection criterion was < 0.75, following Otis et al. 1978), the total number of seals identified was the best available estimate. Finally, sometimes capture-recapture estimates are less than the known minimum abundance (Baker 2004), and in these cases the total number of seals actually identified was used. In 2010 2011, total enumeration was achieved at Laysan Island, Lisianski Island, Pearl and Hermes Reef and Kure Atoll, and Midway Atoll based on analysis of discovery curves (Baker et al. 2006). Minimum abundance was used for French Frigate Shoals and Midway Atoll. Capture-recapture estimates larger than known minimum abundance were available for Lisianski Island and Pearl and Hermes Reef. Thus, abundance at the six main NWHI subpopulations was estimated to be 909 893 (including 141147 pups). Counts at Necker and Nihoa Islands are conducted from zero to a few times in a single year. Abundance is estimated by correcting the mean of all beach counts accrued over the past five years. The mean (±SD) of all counts (excluding pups) conducted between 2007 2006 and 2011 2010 was 17.0 ± 5.4 16.0 ±6.6 at Necker Island and 31.5 ± 7.2 32.1 (±6.6) at Nihoa Island. The relationship between mean counts and total abundance at the reproductive sites indicates that total abundance can be estimated by multiplying the mean count by a correction factor of 2.89 (NMFS unpubl. data). Resulting estimates (plus the average number of pups known to have been born during 2006-2010 are 52.3 ± 15.6 49.2 (±19.1) at Necker Island and 101.6 ± 20.8 102.4 (±19.1) at Nihoa Island. Complete, systematic surveys for monk seals in the MHI were conducted in 2000 and 2001 (Baker and Johanos 2004). NMFS continues to collect information on seal sightings reported by a variety of sources, including a volunteer network, reports from the public and directed NMFS observation effort. The total number of individually identifiable seals documented in 2011 2010 was 146 153, the current best minimum abundance estimate for the MHI. Minimum Population Estimate The total number of seals (909 893) identified at the six main NWHI reproductive sites is the best estimate of minimum population size at those sites. Minimum population sizes for Necker and Nihoa Islands (based on the formula provided by Wade and Angliss (1997)) are 41 36 and 86 88, respectively. The minimum abundance estimate for the main Hawaiian Islands in 2011 is 146 153 seals. The minimum population size for the entire stock (species) is the sum of these estimates, or 1,182 1,170 seals. Current Population Trend Current population trend is based solely on the six NWHI subpopulations because these sites have historically comprised virtually the entire species, while information on the remaining smaller seal aggregations has been inadequate to reliably evaluate abundance or trends. The total of mean non-pup beach counts at the six main reproductive NWHI subpopulations in 2011 2010 is 69% 71% lower than in 1958. The trend in total abundance at the six main NWHI subpopulations estimated as described above is shown in Figure 1. A log-linear regression of
25

estimated abundance on year for the past 10 years ( 2002-2011 2001-2010) estimates that abundance declined -3.4% 4.0% yr-1 (95% CI = -4.3% -4.7% to -2.5% -3.2% yr-1). The MHI monk seal population appears to be increasing with an intrinsic population growth rate estimated at 6.5% per year based on simulation modeling (Baker et al. 2011). Likewise, sporadic beach counts at Necker and especially Nihoa Islands, suggest positive growth. While these sites have historically comprised a small fraction of the total species abundance, the decline of the six main NWHI subpopulations, coupled with growth at Necker, Nihoa and the MHI may mean that these latter three sites now substantially influence the total abundance trend. The MHI, Necker and Nihoa Islands estimates, uncertain as they are, comprised 25% of the stock’s estimated total abundance in 2011 2010. Unfortunately, because of a lack reliable abundance estimates for these areas, their influence cannot currently be determined. NMFS is experimenting with remote camera systems that may improve data collection at Necker and Nihoa Islands. A remote camera system is slated for installation on Nihoa Island, which should result in improved abundance information at this site. CURRENT AND MAXIMUM NET PRODUCTIVITY RATES Trends in abundance vary considerably among subpopulations. Mean non-pup beach counts are used as a long-term index of abundance for years when data are insufficient to estimate total abundance as described above. Prior to 1999, beach count increases of up to 7% yr-1 were observed at Pearl and Hermes Reef, and this is the highest estimate of the maximum net productivity rate (Rmax) observed for this species. POTENTIAL BIOLOGICAL REMOVAL Potential biological removal (PBR) is designed to allow stocks to recover to, or remain above, the maximum net productivity level (MNPL) (Wade 1998). An underlying assumption in the application of the PBR equation is that marine mammal stocks exhibit certain dynamics. Specifically, it is assumed that a depleted stock will naturally grow toward OSP (Optimum Sustainable Population), and that some surplus growth could be removed while still allowing recovery. The Hawaiian monk seal population is far below historical levels and has on average, declined 3.4% 4.0% a year since 2002 2000. Thus, the stock’s dynamics do not conform to the underlying model for calculating PBR such that PBR for the Hawaiian monk seal is undetermined. HUMAN-CAUSED MORTALITY AND SERIOUS INJURY NMFS updated its serious injury designation and reporting process, which uses guidance from previous serious injury workshops, expert opinion, and analysis of historic injury cases to develop new criteria for distinguishing serious from non-serious injury (Angliss and DeMaster 1998, Andersen et al. 2008, NOAA 2012). NMFS defines serious injury as an “injury that is more likely than not to result in mortality”. Injury determinations for stock assessments revised in 2013 or later incorporate the new serious injury guidelines, based on the most recent 5-year period for which data are available. Human-related mortality has caused two major declines of the Hawaiian monk seal (Ragen 1999). In the 1800s, this species was decimated by sealers, crews of wrecked vessels, and guano and feather hunters (Dill and Bryan 1912; Wetmore 1925; Bailey 1952; Clapp and Woodward 1972). Following a period of at least partial recovery in the first half of the 20th century (Rice 1960), most subpopulations again declined. This second decline has not been fully explained, but long-term trends at several sites appear to have been driven both by variable oceanic productivity (represented by the Pacific Decadal Oscillation) and by human disturbance from military or U.S. Coast Guard activities (Baker et al. 2012, Ragen 1999;
Figure 1. Trend in abundance of monk seals at the six main Northwestern Hawaiian Islands subpopulations, based on a combination of total enumeration and capture–recapture estimates. Error bars indicate ±2 s.e. (from variances of capture-recapture estimates). Fitted log-linear regression line is shown.
26

Kenyon 1972; Gerrodette and Gilmartin 1990). Currently, human activities in the NWHI are limited and human disturbance is relatively rare, but human-seal interactions, have become an important issue in the MHI. Intentional killing of seals in the MHI is a relatively new and alarming trend. In 2009, three seals (including a pregnant female) were shot and killed in the MHI (Baker et al. 2010). This level of intentional killing is unprecedented in recent decades and represents a disturbing new threat to the species. In 2010, a juvenile female seal was found dead died on Kauai due to multiple skull fractures caused by blunt force trauma. Whether this was an intentional killing or an accidental occurrence (e.g., boat strike) is not known. In 2011, two seals were found on the same general area of Molokai dead with skull fractures from blunt force trauma.The intentional killing of monk seals in the MHI is well-documented and it It is extremely unlikely that all carcasses of intentionally killed monk seals are discovered and reported. Studies of the recovery rates of carcasses for other marine mammal species have shown that the probability of detecting and documenting most deaths (whether from human or natural causes) is quite low (Peltier et al. 2012; Williams et al. 2011; Perrin et al. 2011; Punt and Wade 2010).
Fishery Information Fishery interactions with monk seals can include direct interaction with gear (hooking or entanglement), seal consumption of discarded catch, and competition for prey. Entanglement of monk seals in derelict fishing gear, which is believed to originate outside the Hawaiian archipelago, is described in a separate section.
Table 1. Summary of mortality and serious injury of Hawaiian monk seals due to fisheries and calculation of annual mortality rate. n/a indicates that sufficient data are not available.
Fishery interactions are a serious concern in the MHI, especially involving nearshore fisheries managed by the State of Hawaii. Nearshore gillnets have become a more common source of mortality recently. Three Four seals have been confirmed dead in nearshore these gillnets (in 1994, 2006, 2007, and 2010), and one additional seal in 2010 may have also died in similar circumstances but the carcass was not recovered. A seal was also found dead in 1995 with a hook lodged in its esophagus. A total of 75 seals have been Numerous cases of seals with embedded hooks are observed each year with embedded hooks in the MHI. during 1989-2011 2010 (including 11 in 2010, In 2009, 2
Observer coverage for deep and shallow-set components of the fishery, respectively. 2 Data for MHI bottomfish and nearshore fisheries are based upon incidental observations (i.e., hooked seals and those entangled in active gear). All hookings not clearly attributable to either fishery with certainty were attributed to the bottomfish fishery, and hookings which resulted in injury of unknown severity were classified as serious. Includes seals entangled/drowned in nearshore gillnets, recognizing that it is not possible to determine whether
the nets involved were being used for commercial purposes.
Fishery Name Year DataType
% Obs.coverage
Observed/ReportedMortality/Serious Injury
EstimatedMortality/
Serious Injury
MeanTakes (CV)
Pelagic Longline
200620072008200920102011
observerobserverobserverobserverobserverobserver
22.1% & 100%1
20.1% & 100%1
21.7% & 100%1
20.6% & 100%1
21.1% & 100%1
20.3% & 100%1
000000
000000
0 (0)
NWHI Bottomfish
200420052006
observerobserverobserver
18.3%25.0%3.9%
000
000
0 (0)
MHIBottomfish2
200620072008200920102011
Incidental observations of
seals
none
000000
n/a n/a
Nearshore3
200620072008200920102011
Incidental observations of
sealsnone
22
3 04 0
10
n/a n/a≥0.6
Minimum total annual
takes≥0.6
27

seals were observed hooked, none of which constituted serious injuries. Several incidents including the dead hooked seal mentioned above, involved hooks used to catch ulua (jacks, Caranx spp.). Most reported hookings and gillnet entanglements have occurred since 2000 (NMFS unpubl. data). The MHI monk seal population appears to have been increasing in abundance during this period (Baker et al. 2011). No mortality or serious injuries have been attributed to the MHI bottomfish handline fishery (Table 1). Published studies on monk seal prey selection based upon scat/spew analysis and video from seal-mounted cameras revealed evidence that monk seals fed on families of bottomfish which contain commercial species (many prey items recovered from scats and spews were identified only to the level of family; Goodman-Lowe 1998, Longenecker et al. 2006, Parrish et al. 2000). Recent quantitative fatty acid signature analysis (QFASA) results support previous studies illustrating that monk seals consume a wide range of species (Iverson et al. 2011). However, deepwater-slope species, including two commercially targeted bottomfishes and other species not caught in the fishery, were estimated to comprise a large portion of the diet for some individuals. Similar species were estimated to be consumed by seals regardless of location, age or gender, but the relative importance of each species varied. Diets differed considerably between individual seals. These results highlight the need to better understand potential ecological interactions with the MHI bottomfish handline fishery. There are no fisheries operating in or near the NWHI. In the past, interactions between the Hawaii-based domestic pelagic longline fishery and monk seals were documented (NMFS 2002). This fishery targets swordfish and tunas and does not compete with Hawaiian monk seals for prey. In October 1991, in response to 13 unusual seal wounds thought to have resulted from interactions with this fishery, NMFS established a Protected Species Zone extending 50 nautical miles around the NWHI and the corridors between the islands. Subsequently, no additional monk seal interactions with the swordfish or tuna components of the longline fishery have been observed. Possible reduction of monk seal prey by the NWHI lobster fishery has also been raised as a concern, though whether the fishery indirectly affected monk seals is unknown. However, the NWHI lobster fishery closed in 2000. In 2006, the Northwestern Hawaiian Islands (later renamed Papahanaumokuokea) Marine National Monument was established. Subsequent regulations prohibited commercial fishing in the Monument, except for the bottomfish fishery (and associated pelagic species catch), which had potential to continue until 2011 (U.S. Department of Commerce and Department of the Interior, 2006). However, in 2009 the remaining permit holders surrendered their permits to NMFS in exchange for compensation from the Federal Government and the fishery closed. Fishery Mortality Rate Total fishery mortality and serious injury is not considered to be insignificant and approaching a rate of zero. Monk seals are being hooked and entangled in the MHI at a rate that has not been reliably assessed but is certainly greater than zero. The information above represents only reported direct interactions, and without purpose-designed observation effort the true interaction rate cannot be estimated. Monk seals also die from entanglement in fishing gear and other debris throughout their range (likely originating from various countries sources outside of Hawaii), and NMFS along with partner agencies is pursuing a program to mitigate entanglement (see below). Indirect interactions (i.e., involving competition for prey or consumption of discards) remain a topic of ongoing investigation. Entanglement in Marine Debris Hawaiian monk seals become entangled in fishing and other marine debris at rates higher than reported for other pinnipeds (Henderson 2001). A total of 323 311 cases of seals entangled in fishing gear or other debris have been observed from 1982 to 2011 2010 (Henderson 2001; NMFS, unpubl. data), including eight documented deaths resulting from entanglement in marine debris (Henderson 1990, 2001; NMFS, unpubl. data). The fishing gear fouling the reefs and beaches of the NWHI and entangling monk seals only rarely includes types used in Hawaii fisheries. For example, trawl net and monofilament gillnet accounted for approximately 35% and 34%, respectively, of the debris removed from reefs in the NWHI by weight, and trawl net alone accounted for 88% of the debris by frequency (Donohue et al. 2001). Yet, trawl fisheries have been prohibited in Hawaii since the 1980s. The NMFS and partner agencies continue to mitigate impacts of marine debris on monk seals as well as turtles, coral reefs and other wildlife. Marine debris is removed from beaches and seals are disentangled during annual population assessment activities at the main reproductive sites. Since 1996, annual debris survey and removal efforts in the NWHI coral reef habitat have been ongoing (Donohue et al. 2000, Donohue et al. 2001, Dameron et al. 2007). Other Mortality In the past 10 years (2002-2011) two monk seals died during enhancement activities (in 2005 and 2006) and one died during research in 2007. Enhancement activities includes deworming, translocation, hazing and
28

removal of aggressive adult male seals that harm or kill other seals, disentangling, dehooking, treating injured seals in the wild, behavioral modification, vaccination, and supplemental feeding of post-release rehabilitated seals (see http://www.nmfs.noaa.gov/pr/permits/monkseal16632.htm). From 1982 to 2010, 23 seals (many of which were in poor health when brought into captivity) died during rehabilitation efforts, two died in captivity, two died when captured for translocation, one was euthanized (an aggressive male known to cause mortality), four died during captive research and four died during field research (Baker and Johanos 2002; NMFS unpubl. data). Other Sources of mortality that impede recovery include food limitation (see Habitat Issues), single and multiple-male intra-species aggression (mobbing), shark predation, and disease/parasitism. Multiple-male Male seal aggression has caused episodes of mortality and injury. primarily been identified as a problem at Laysan and Lisianski Islands, though it has also been documented at other subpopulations. Past removals of adult males from Laysan Island effectively reduced, but did not entirely eliminate male-aggression caused mortality at this site Past interventions to remove aggressive males greatly mitigated, but have not eliminated, this source of mortality (Johanos et al. 2010). Attacks by single adult male seals have resulted in several monk seal deaths, most notably at French Frigate Shoals in 1997, where at least 8 pups died from this cause. Many more pups likely were killed in the same way but the cause of their deaths could not be confirmed. Two males that killed pups in 1997 were translocated to Johnston Atoll, 870 km to the southwest. Subsequently, mounting injury to pups has decreased. Shark-related injury and mortality incidents appeared to have increased in the late 1980s and early 1990s at French Frigate Shoals, but such mortality was probably not the primary cause of the decline at this site (Ragen 1993). However, shark predation has accounted for a significant portion of pup mortality in recent years. At French Frigate Shoals in 1999, 17 pups were observed injured by large sharks, and at least 3 were confirmed to have died from shark predation (Johanos and Baker 2001). As many as 22 pups of a total 92 born at French Frigate Shoals in 1999 were likely killed by sharks. After 1999, losses of pups to shark predation declined, but this source of mortality remains a serious concern. Galapagos shark predation on monk seal pups has been a chronic and significant source of mortality at French Frigate Shoals since the late 1990s, despite Various mitigation efforts have been undertaken by NMFS (Gobush 2010), yet shark predation remains a serious problem at French Frigate Shoals. While disease effects on monk seal demographic trends are uncertain, there is concern that diseases of livestock, feral animals, pets or humans could be transferred to naïve monk seals in the MHI and potentially spread to the core population in the NWHI. In 2003 and 2004, two deaths of free-ranging monk seals were attributable to diseases not previously found in the species: leptospirosis and toxoplasmosis (R. Braun, pers. comm.). Leptospira bacteria are found in many of Hawaii's streams and estuaries and are associated with livestock and rodents. Cats, domestic and feral, are a common source of toxoplasma.
Habitat Issues Poor juvenile survival rates and variability in the relationship between weaning size and survival suggest that prey availability is likely limiting recovery of NWHI monk seals (Baker and Thompson 2007, Baker et al. 2007, Baker 2008). Multiple strategies for improving juvenile survival are being considered and will be developed through an experimental approach in coming years (Baker and Littnan 2008). NMFS has produced a draft Programmatic Environmental Impact Statement on current and future anticipated research and enhancement activities1. A major habitat issue involves loss of terrestrial habitat at French Frigate Shoals, where pupping and resting islets have shrunk or virtually disappeared (Antonelis et al. 2006). Projected increases in global average sea level may further significantly reduce terrestrial habitat for monk seals in the NWHI (Baker et al. 2006, Reynolds et al. 2012). Goodman-Lowe (1998) provided information on prey selection using hard parts in scats and spewings. Information on at-sea movement and diving is available for seals at all six main subpopulations in the NWHI using satellite telemetry (Stewart et al. 2006). Cahoon (2011) described diet and foraging behavior of MHI monk seals, and found no striking difference in prey selection between the NWHI and MHI. Degradation Remains of the seawall at Tern Island, French Frigate Shoals, is an entrapment hazard for seals. and other wildlife and raised concerns about the potential release of toxic wastes into the ocean. The USFWS began construction on the Tern Island sea wall in 2004 to reduce entrapment hazards and protect the island shoreline. Vessel groundings pose a continuing threat to monk seals and their habitat, through potential physical damage to reefs, oil spills, and release of debris into habitats. Monk seal abundance is increasing in the main Hawaiian Islands (Baker et al. 2011). Further, the excellent condition of pups weaned on these islands suggests that there may be ample prey resources available, perhaps in part due to fishing pressure that has reduced monk seal competition with large fish predators (sharks and jacks) (Baker and Johanos 2004). If the monk seal population continues to expand in the MHI, it may bode well for the species’
http://www.nmfs.noaa.gov/pr/permits/eis/hawaiianmonksealeis.htm
29
recovery and long-term persistence. In contrast, there are many challenges that may limit the potential for growth in this region. The human population in the MHI is approximately 1.2 1.4 million compared to fewer than 100 in the NWHI, so that the potential impact of disturbance in the MHI is great. Intentional killing of seals (noted above) poses a very serious new concern. Also, the same fishing pressure that may have reduced the monk seal’s competitors, is a source of injury and mortality. Finally, vessel traffic in the populated islands carries the potential for collision with seals and impacts from oil spills. The causes of two recent non-serious injuries (in 2010 and 2011) to seals were attributed to boat propellers. Thus, issues surrounding monk seals in the main Hawaiian Islands will likely become an increasing focus for management and recovery of this species. STATUS OF STOCK In 1976, the Hawaiian monk seal was designated depleted under the Marine Mammal Protection Act of 1972 and as endangered under the Endangered Species Act of 1973. The species is well below its optimum sustainable population (OSP) and has not recovered from past declines. Therefore, the Hawaiian monk seal is a strategic stock. Annual human-caused mortality for the most recent 5 year period (2007-2011) was at least 1.8 animals, including nearshore gillnets (>=0.6 / yr, Table 1), shooting-related deaths (>=0.6 / yr), and blunt-force trauma deaths of unknown origin (>=0.6 / yr). REFERENCES Antonelis, G. A., J. D. Baker, T. C. Johanos, R. C. Braun, and A. L. Harting. 2006. Hawaiian monk seal (Monachus
schauinslandi): Status and Conservation Issues.Atoll Res. Bull. 543:75-101.Bailey, A. M. 1952. The Hawaiian monk seal. Museum Pictorial, Denver Museum of Natural History 7:1-32.
Baker, J. D. 2004. Evaluation of closed capture-recapture methods to estimate abundance of Hawaiian monk seals, Monachus schauinslandi. Ecological Applications 14:987-998.
Baker J.D. 2008. Variation in the relationship between offspring size and survival provides insight into causes of mortality in Hawaiian monk seals. Endangered Species Research 5:55-64.
Baker, J.D., A.L. Harting, and T.C. Johanos. 2006. Use of discovery curves to assess abundance of Hawaiian monk seals. Marine Mammal Science 22:847-861.
Baker J.D., A. L. Harting, T. A. Wurth, and T. C, Johanos. 2011. Dramatic shifts in Hawaiian monk seal distribution predicted from divergent regional trends. Marine Mammal Science 27(1): 78–93.
Baker, J.D. and T. C. Johanos. 2004. Abundance of Hawaiian monk seals in the main Hawaiian Islands. Biological Conservation 116:103-110.
Baker, J.D. and T. C. Johanos. 2002. Effects of research handling on the endangered Hawaiian monk seal. Mar. Mamm. Sci. 18:500-512.
Baker J.D., and Littnan C.L. 2008. Report of the Hawaiian Monk Seal Captive Care Workshop, Honolulu, Hawaii, June 11–13, 2007. Pacific Islands Fish. Sci. Cent., Natl. Mar. Fish. Serv., NOAA, Honolulu, HI 96822-2396. Pacific Islands Fish. Sci. Cent. Admin. Rep. H-08-02, 42 p.
Baker J.D., E.A. Howell, and J.J. Polovina. 2012. Relative influence of climate variability and direct anthropogenic impact on a sub-tropical Pacific top predator, the Hawaiian monk seal. Mar. Ecol. Prog. Ser. 469:175-189.
Baker J.D., C. L. Littnan, and D. W. Johnston. 2006. Potential effects of sea-level rise on the terrestrial habitats of endangered and endemic megafauna in the Northwestern Hawaiian Islands. Endangered Species Research 4:1-10.
Baker, J.D., J.J. Polovina, and E.A. Howell. 2007. Effect of variable oceanic productivity on the survival of an upper trophic predator, the Hawaiian monk seal, Monachus schauinslandi. Marine Ecology Progress Series 346:277-283.
Baker J.D. and P.M. Thompson. 2007. Temporal and spatial variation in age-specific survival rates of a long-lived mammal, the Hawaiian monk seal. Proceedings of the Royal Society B 274:407-415.
Cahoon, M.K. 2011. The foraging ecology of monk seals in the main Hawaiian Islands. MSc thesis, University of Hawaii, 172 p.
Clapp, R. B., and P. W. Woodward. 1972. The natural history of Kure Atoll, Northwestern Hawaiian Islands, Atoll Res. Bull. 164:303-304.
Dameron OJ, Parke M, Albins M, Brainard R. 2007. Marine debris accumulation in the Northwestern Hawaiian
Islands: An examination of rates and processes. Marine Pollution Bulletin 54(4): 423-433.
Dill, H. R., and W. A. Bryan. 1912. Report on an expedition to Laysan Island in 1911. U.S. Dept. of Agric. Surv. Bull. 42:1-30.
Donohue, M. J., R. Brainard, M. Parke, and D. Foley. 2000. Mitigation of environmental impacts of derelict fishing gear through debris removal and environmental monitoring. In Hawaiian Islands Humpback Whale
30
National Marine Sanctuary, Proceedings of the International Marine Debris Conference on Derelict Fishing Gear and the Ocean Environment, 6-11 August 2000, Honolulu, Hawaii. p. 383-402. http://hawaiihumpbackwhale.noaa.gov/special_offerings/sp_off/proceedings.html.
Donohue, M.J., R.C. Boland, C.M. Sramek, and G.A. Antonelis. 2001. Derelict fishing gear in the Northwestern Hawaiian Islands: diving surveys and debris removal in 1999 confirm threat to coral reef ecosystems. Marine Pollution Bulletin 42(12):1301_1312.
Gerrodette, T. M., and W. G. Gilmartin. 1990. Demographic consequences of changed pupping and hauling sites of the Hawaiian monk seal. Conserv. Biol. 4:423-430.
Gobush, K. S. 2010. Shark predation on Hawaiian monk seals: Workshop II & post-workshop developments, November 5-6, 2008. U.S. Dep. Commer., NOAA Tech. Memo., NOAA-TM-NMFS-PIFSC-21, 43 p. + Appendices.
Goodman-Lowe, G. D. 1998. Diet of the Hawaiian monk seal (Monachus schauinslandi) from the northwestern Hawaiian islands during 1991 to 1994. Marine Biology 132:535-546.
Harting, A.L. 2002. Stochastic simulation model for the Hawaiian monk seal. PhD thesis, Montana State University, 328 p.
Henderson, J. R. 1990. Recent entanglements of Hawaiian monk seals in marine debris. In R. S. Shomura and M. L. Godfrey (eds.), Proceedings of the Second International Conference on Marine Debris, April 2-7, 1989, Honolulu, Hawaii, p. 540-553. U.S. Dep. Commer., NOAA, Tech. Memo. NMFS-SWFSC-154.
Henderson, J.R. 2001. A Pre_ and Post_MARPOL Annex V Summary of Hawaiian Monk Seal Entanglements and Marine Debris Accumulation in the Northwestern Hawaiian Islands, 1982_1998. Marine Pollution Bulletin 42:584-589.
Iverson, S., J. Piché, and W. Blanchard. 2011. Hawaiian monk seals and their prey: assessing characteristics of prey species fatty acid signatures and consequences for estimating monk seal diets using Quantitative Fatty Acid Signature Analysis. U.S. Dep. Commer., NOAA Tech. Memo., NOAA-TM-NMFS-PIFSC-23, 114 p. + Appendices.
Johanos, T. C. and J. D. Baker (editors). 2001. The Hawaiian monk seal in the Northwestern Hawaiian Islands, 1999. U.S. Dep. Commer., NOAA Tech. Memo. NOAA-TM-NMFS-SWFSC-310, 130 p.
Johanos T. C., B. L. Becker, J. D. Baker, T. C. Ragen, W. G. Gilmartin, and T. Gerrodette. 2010. Impacts of sex ratio reduction on male aggression in the critically endangered Hawaiian monk seal Monachus schauinslandi. Endangered Species Research 11: 123–132.
Johnson, A. M., and E. Kridler. 1983. Interisland movement of Hawaiian monk seals. 'Elepaio 44(5):43-45. Kenyon, K. W. 1972. Man versus the monk seal. J. Mammal. 53(4):687-696. Kretzmann, M. B., W. G. Gilmartin, A. Meyer, G. P. Zegers, S. R. Fain, B. F. Taylor, and D. P. Costa. 1997. Low
genetic variability in the Hawaiian monk seal. Conserv. Biol. 11(2):482-490. Kretzmann, M. B., N. J. Gemmell, and A. Meyer. 2001. Microsatellite analysis of population structure in the
endangered Hawaiian monk seal. Conserv. Biol. 15(2):457-466. Otis, D. L., K. P. Burnham, G. C. White, and D. R. Anderson. 1978. Statistical inference from capture data on
closed animal populations. Wildl. Monogr. 62:1-135. Punt, A. E., and P. R. Wade. 2010. Population status of the eastern North Pacific stock of gray whales in 2009. U.S.
Dep. Commer. NOAA Tech. Memo. NMFS-AFSC-207, 43 p. Parrish, F. A., M. P. Craig, T. J. Ragen, G. J. Marshall, and B. M. Buhleier. 2000. Identifying diurnal foraging
habitat of endangered Hawaiian monk seals using a seal-mounted video camera. Mar. Mamm. Sci. 16:392-412.
Peltier, H., W. Dabin, P. Daniel, O. Van Canneyt, G. Dorémus, M. Huon, and V. Ridoux. 2012. The significance of stranding data as indicators of cetacean populations at sea: Modelling the drift of cetacean carcasses. Ecological Indicators 18:278-290.
Perrin, W.F., J.L. Thieleking, W.A. Walker, F.I. Archer, and K.M. Robertson. 2011. Common bottlenose dolphins (Tursiops truncatus) in California waters: Cranial differentiation of coastal and offshore ecotypes. Marine Mammal Science 27(4):769-792.
Ragen, T. J. 1993. Status of the Hawaiian monk seal in 1992. Admin. Rep. H-93-05. Southwest Fisheries Science Center, National Marine Fisheries Service, 2570 Dole St., Honolulu, HI 96822-2396. 79 pp.
Ragen, T.J. 1999. Human activities affecting the population trends of the Hawaiian monk seal. Pages 183-194 in J.A. Musick, ed. Life in the slow lane: Ecology and conservation of long-lived marine animals. American Fisheries Society Symposium 23, American Fisheries Society, Bethesda, MD.
Reynolds, M.H., P. Berkowitz, K.N. Courtot, and C.M. Krause, eds. 2012. Predicting sea-level rise vulnerability of terrestrial habitat and wildlife of the Northwestern Hawaiian Islands: U.S. Geological Survey Open-File
31

Report 2012–1182, 139 p. Rexstad, E. A., and K. P. Burnham. 1991. User's manual for interactive Program CAPTURE. Colorado
Cooperative Fish and Wildlife Research Unit, Colorado State University, Fort Collins, CO. 29 pp. Rice, D. W. 1960. Population dynamics of the Hawaiian monk seal. J. Mammal. 41:376-385. Schultz JK, Baker JD, Toonen RJ, Bowen BW. 2009. Extremely low genetic diversity in the endangered Hawaiian
monk seal (Monachus schauinslandi). Journal of Heredity 100:25-33. Schultz J.K., Baker J.D., Toonen RJ, Harting AL, Bowen BW. 2011. Range-wide genetic connectivity of the
Hawaiian monk seal and implications for translocation. Conservation Biology 25:124-132. Stewart B. S., G. A. Antonelis, J. D. Baker, and P.Y.Yochem. 2006. Foraging biogeography of the Hawaiian monk
seal in the Northwestern Hawaiian Islands. Atoll Res Bull 543:131-145. U.S. Department of Commerce and Department of the Interior. 2006. Northwestern Hawaiian Islands Marine
National Monument. Federal Register 71:51,134-51,142. Wade, P. R. and R. P. Angliss. 1997. Guidelines for Assessing Marine Mammal Stocks: Report of the GAMMS
Workshop April 3-5, 1996, Seattle, Washington. U. S. Dep. Commer., NOAA Tech. Memo. NMFS-OPR-12. 93 pp.
Wade, P. R. 1998. Calculating limits to the allowable human-caused mortality of cetaceans and pinnipeds. Marine Mammal Science 14:1-37.
Wetmore, A. 1925. Bird life among lava rock and coral sand. The Natl. Geograp. Mag. 48:77-108. White, G. C., D. R. Anderson, K. P. Burnham, and L. Otis. 1982. Capture-recapture and removal methods for
sampling closed populations. Los Alamos National Laboratory, Los Alamos, New Mexico. Williams, R., S. Gero, L. Bejder, J. Calambokidis, S.D. Kraus, D. Lusseau, A.J. Read, and J. Robbins.
Underestimating the damage: interpreting cetacean carcass recoveries in the context of the Deepwater Horizon/BP incident. Conservation Letters 4:228-233.
32

Revised 10/15/2009 9/24/2013
HARBOR PORPOISE (Phocoena phocoena): Morro Bay Stock STOCK DEFINITION AND GEOGRAPHIC RANGE In the Pacific, harbor porpoise are found in coastal and inland waters from Point Conception, California to Alaska and across to Kamchatka and Japan (Gaskin 1984). Harbor porpoise appear to have more restricted movements along the western coast of the continental U.S. than along the eastern coast. Regional differences in pollutant residues in harbor porpoise indicate that they do not move extensively between California, Oregon, and Washington (Calambokidis and Barlow 1991). That study also showed some regional differences within California (although the sample size was small). This pattern stands as a sharp contrast to the eastern coast of the U.S. and Canada where harbor porpoise are believed to migrate seasonally from as far south as the Carolinas to the Gulf of Maine and Bay of Fundy (Polacheck et al. 1995). A phylogeographic analysis of genetic data from northeast Pacific harbor porpoise did not show complete concordance between DNA sequence types and geographic location (Rosel 1992). However, an analysis of molecular variance (AMOVA) of the same data with additional samples found significant genetic differences for four of the six pair-wise comparisons between the four areas investigated: California, Washington, British Columbia, and Alaska (Rosel et al. 1995). These results demonstrate that harbor porpoise along the west coast of North America are not panmictic or migratory, and movement is sufficiently restricted that genetic differences have evolved. Recent preliminary Subsequent genetic analyses of samples ranging from Monterey Bay, California to Vancouver Island, British Columbia indicate that there is small-scale subdivision within the U.S. portion of this range (Chivers et al., 2002, 2007). In their assessment of harbor porpoise, Barlow and Hanan (1995) recommended that the animals inhabiting central California (defined to be from Point Conception to the Russian River) be treated as a separate stock. Their justifications for this were: 1) fishery mortality of harbor porpoise is was limited to central California, 2) movement of individual animals appears to be restricted within California, and consequently 3) fishery mortality could cause the local depletion of harbor porpoise if central California is not managed separately. Although geographic structure exists along an almost continuous distribution of harbor porpoise from California to Alaska, stock boundaries are difficult to draw because any rigid line is (to a greater or lesser extent) arbitrary from a biological perspective. Nonetheless, failure to recognize geographic structure by defining management stocks can lead to depletion of local populations. Based on more recent genetic findings (Chivers et al., 2002, 2007), California coast stocks were re-evaluated, and significant genetic differences were found among 4 identified sampling sites. Revised stock boundaries are presented here based on these genetic data and density discontinuities identified from aerial surveys,
Figure 1. Stock boundaries and distributional range of harbor porpoise along the California and southern Oregon coasts. Dashed line represents harbor porpoise habitat (0-200 m) in this region.
33

resulting in six California/Oregon/Washington stocks where previously there had been four (Carretta et al. 2001a). The stock boundaries for animals that occur in California/southern Oregon waters are shown in Figure 1. For the 2009 Marine Mammal Protection Act (MMPA) Stock Assessment Reports, other Pacific coast harbor porpoise stocks include: 1) a Monterey Bay stock, 2) a San Francisco-Russian River stock, 3) a northern California/southern Oregon stock, 4) an a northern Oregon/Washington coast stock, 5) an Inland Washington stock, 6) a Southeast Alaska stock, 7) a Gulf of Alaska stock, and 8) a Bering Sea stock. Stock assessment reports for Morro Bay, San Francisco-Russian River, northern California/southern Oregon, Oregon/Washington coast, and Inland Washington waters harbor porpoise harbor porpoise stocks within waters of California, Oregon, and Washington appear in this volume. The three Alaska harbor porpoise stocks are reported separately in the Stock Assessment Reports for the Alaska Region. POPULATION SIZE Previous estimates of abundance for California harbor porpoise were based on aerial surveys conducted between the coast and the 50-fm isobath during 1988-95 (Barlow and Forney 1994, Forney 1999a). These estimates did not include an unknown number of animals found in deeper waters. Barlow (1988) found that the vast majority of harbor porpoise in California were within the 0-50-fm depth range; however, Green et al. (1992) found that 24% of harbor porpoise seen during aerial surveys of Oregon and Washington were between the 100m and 200m isobaths (55 to 109 fathoms). A systematic ship survey of depth strata out to 90 m in northern California showed that porpoise abundance declined significantly in waters deeper than 60 m (Carretta et al. 2001b). A recent analysis of harbor porpoise trends including oceanographic data suggests that the proportion of California harbor porpoise in deeper waters may vary between years (Forney 1999b). Since 1999, aerial surveys have extended farther offshore (to the 200m depth contour or a minimum of 10 nmi from shore in the region of the Morro Bay stock) to provide a more complete abundance estimate. Based on 2002-2007 aerial surveys conducted under good survey conditions (Beaufort 2, cloud cover 25%) the estimate of abundance for this stock is 2,044 animals (CV = 0.40) (Carretta et al., 2009.) The most recent estimate of abundance for the Morro Bay stock, based on 2012 aerial surveys conducted in good survey conditions (Beaufort sea states 2, cloud cover 25%), is 2,917 (CV=0.41) harbor porpoises (Forney et al. 2013). This estimate includes a correction factor of 3.42 (1/g(0); g(0)=0.292, CV=0.366) (Laake et al. 1997), to adjust for groups missed by aerial observers. Minimum Population Estimate The minimum population estimate for the Morro Bay harbor porpoise stock is taken as the lower 20th percentile of the log-normal distribution of the abundance estimated from the 2002-2007 2012 aerial surveys, or 1,478 2,102 animals.
Current Population Trend There has been an increasing trend in porpoise abundance in the Morro Bay stock since 1988, which is statistically significant (p < 0.002), Figure 2. The observed increase in abundance estimates for this stock since 1988 implies an annual population growth rate of approximately 13%, which is consistent with the median growth rate of 10% reported by Caswell et al. (1998) for Atlantic harbor porpoise and high reproductive rates reported for this species by Read and Hohn (1995). It is possible that some of the observed growth of the Morro Bay stock is partly due to emigration of animals from the Monterey Bay stock. The latest abundance estimate is greater than previous estimates dating back to 1988, which were less than 2,100 harbor porpoises (see previous stock assessment reports), but confidence limits are wide. Further analyses will be required to estimate population trends from the available abundance estimates, particularly because the abundance estimates are derived using common parameters and some shared survey data. CURRENT AND MAXIMUM NET PRODUCTIVITY RATES Based on what are argued to be biological limits of the species (i.e. females give birth first at age 4 and produce one calf per year until death), the theoretical, maximum-conceivable growth rate of a closed harbor porpoise population was estimated as 9.4% per year (Barlow and Boveng 1991). This maximum theoretical rate may not be achievable for any real population. [Woodley and Read (1991) calculate a maximum growth rate of approximately 5% per year, but their argument for this being a maximum (i.e. that porpoise survival rates cannot exceed those of Himalayan thar) is not well justified.] Population growth
34
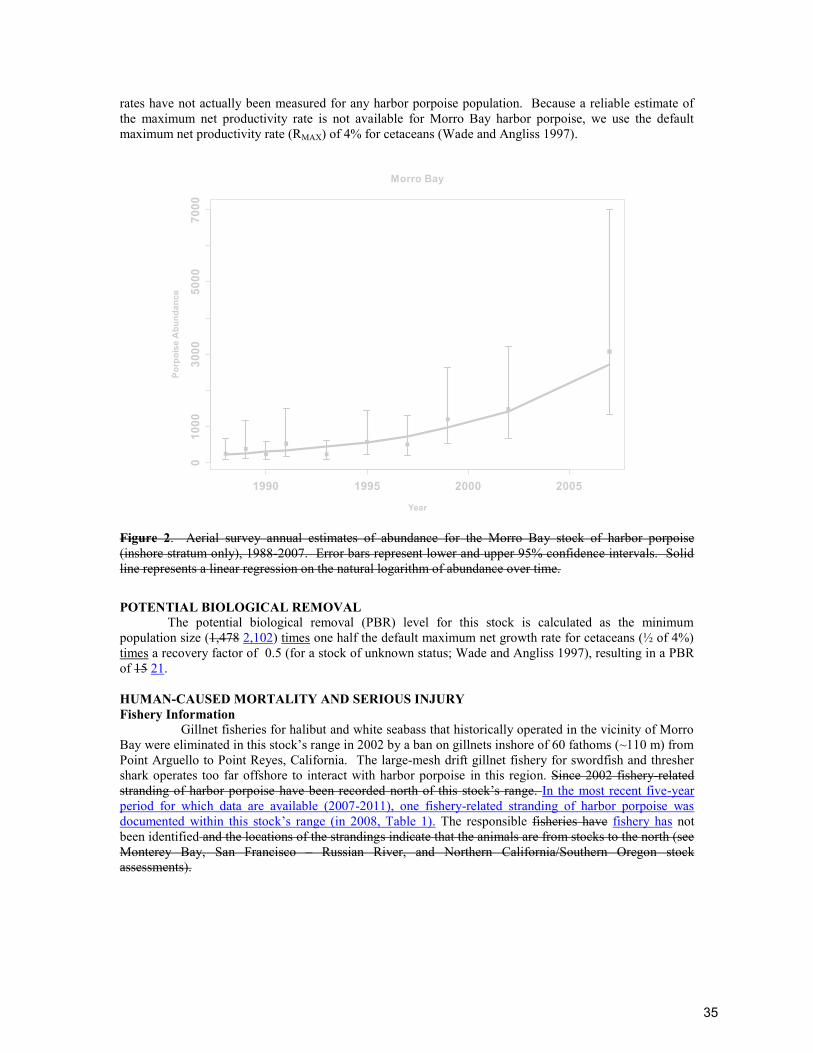
rates have not actually been measured for any harbor porpoise population. Because a reliable estimate of the maximum net productivity rate is not available for Morro Bay harbor porpoise, we use the default maximum net productivity rate (RMAX) of 4% for cetaceans (Wade and Angliss 1997).
1990 1995 2000 2005
010
0030
0050
0070
00Morro Bay
Year
Porp
oise
Abu
ndan
ce
Figure 2. Aerial survey annual estimates of abundance for the Morro Bay stock of harbor porpoise (inshore stratum only), 1988-2007. Error bars represent lower and upper 95% confidence intervals. Solid line represents a linear regression on the natural logarithm of abundance over time.
POTENTIAL BIOLOGICAL REMOVAL The potential biological removal (PBR) level for this stock is calculated as the minimum population size (1,478 2,102) times one half the default maximum net growth rate for cetaceans (½ of 4%) times a recovery factor of 0.5 (for a stock of unknown status; Wade and Angliss 1997), resulting in a PBR of 15 21. HUMAN-CAUSED MORTALITY AND SERIOUS INJURY Fishery Information Gillnet fisheries for halibut and white seabass that historically operated in the vicinity of Morro Bay were eliminated in this stock’s range in 2002 by a ban on gillnets inshore of 60 fathoms (~110 m) from Point Arguello to Point Reyes, California. The large-mesh drift gillnet fishery for swordfish and thresher shark operates too far offshore to interact with harbor porpoise in this region. Since 2002 fishery-related stranding of harbor porpoise have been recorded north of this stock’s range. In the most recent five-year period for which data are available (2007-2011), one fishery-related stranding of harbor porpoise was documented within this stock’s range (in 2008, Table 1). The responsible fisheries have fishery has not been identified and the locations of the strandings indicate that the animals are from stocks to the north (see Monterey Bay, San Francisco – Russian River, and Northern California/Southern Oregon stock assessments).
35

Table 1. Summary of available on incidental mortality and serious injury of Morro Bay Stock harbor porpoise in commercial fisheries that might take this species. Mean annual takes are based on 2007-2011 data. n/a indicates that data are not available.
Fishery Name
Year(s)
Data Type
Percent Observer Coverage
Observed Mortality
Kill/Day
Estimated Mortality
(CV in parentheses)
Mean Annual Takes (CV in parentheses)
Unidentified gillnet fishery 2007-2011 Stranding n/a 1 n/a
≥1
≥ 0.2 (n/a)
Minimum total annual takes ≥ 0.2 (n/a) STATUS OF STOCK
Harbor porpoise in California are not listed as threatened or endangered under the Endangered Species Act nor as depleted under the Marine Mammal Protection Act. Barlow and Hanan (1995) calculate the status of harbor porpoise relative to historic carrying capacity (K) using a technique called back- projection. They calculate that the central California population (including Morro Bay, Monterey Bay, and San Francisco-Russian River stocks) could have been reduced to between 30% and 97% of K by incidental fishing mortality, depending on the choice of input parameters. They conclude that there is no practical way to reduce the range of this estimate. New information does not change this conclusion, and the status of central California harbor porpoise populations relative to their Optimum Sustainable Population (OSP) levels must be treated as unknown. No fishery-related mortality of harbor porpoise has been documented within this stock’s range between 2003 and 2007. Current fishery mortality is zero and can be considered insignificant and approaching zero mortality rate. The stock is considered non-strategic and the population appears to have grown at approximately 11% annually since surveys began in the late 1980s. There are no known habitat issues that are of particular concern for this stock. Fishery-related mortality of harbor porpoises is occasionally documented through strandings within this stock’s range, although the total bycatch levels and responsible fisheries are unknown. Because the overall level of fishery mortality is unknown relative to the PBR it cannot be considered to be insignificant and approaching zero mortality and injury rate. Although there is uncertainty regarding the observed levels of fishery-related mortality for this stock, documented mortality is much less than the PBR, and thus this stock is not considered “strategic” under the MMPA. There are no known habitat issues that are presently of concern for this stock, although harbor porpoise are sensitive to disturbance by anthropogenic sound sources, such as those generated during the installation and operation of marine renewable energy facilities (Teilmann and Carstensen 2012). REFERENCES Barlow, J. 1988. Harbor porpoise (Phocoena phocoena) abundance estimation in California, Oregon and
Washington: I. Ship surveys. Fish. Bull. 86:417-432. Barlow, J. and P. Boveng. 1991. Modeling age-specific mortality for marine mammal populations. Mar.
Mamm. Sci. 7(1):84-119. Barlow, J. and K. A. Forney. 1994. An assessment of the 1994 status of harbor porpoise in California.
U.S. Dep. Commer., NOAA Tech. Memo. NMFS-SWFSC-205. 17 pp. Barlow, J. and D. Hanan. 1995. An assessment of the status of harbor porpoise in central California.
Rept. Int. Whal., Special Issue 16:123-140. Calambokidis, J. and J. Barlow. 1991. Chlorinated hydrocarbon concentrations and their use for
describing population discreteness in harbor porpoises from Washington, Oregon, and California. pp. 101-110 In: J. E. Reynolds III and D. K. Odell (eds.) Marine mammal strandings in the United States. NOAA Tech. Rep. NMFS 98.
Carretta, J.V., K.A. Forney, and S.R. Benson. 2009. Preliminary estimates of harbor porpoise abundance in California waters from 2002 to 2007. NOAA Technical Memorandum, NOAA-TM-NMFS-SWFSC-435. 10 p.
36

Carretta, J.V. 2001. Preliminary estimates of cetacean mortality in California gillnet fisheries for 2000. Paper SC/53/SM9 presented to the International Whaling Commission (unpublished). 21pp.
Carretta, J.V., J. Barlow, K.A. Forney, M.M. Muto, and J. Baker. 2001a. U.S. Pacific Marine Mammal Stock Assessments: 2001. U.S. Dep. Commer. NOAA Technical Memorandum NMFS-SWFSC-317. 280pp.
Carretta, J.V., B.L. Taylor, and S.J. Chivers. 2001b. Abundance and depth distribution of harbor porpoise (Phocoena phocoena) in northern California determined from a 1995 ship survey. U.S. Fishery Bulletin 99:29-39.
Carretta, J.V. 2002. Preliminary estimates of cetacean mortality in California gillnet fisheries for 2001. Paper SC/54/SM12 presented to the International Whaling Commission (unpublished). 22pp.
Carretta, J.V. 2003. Preliminary estimates of harbor porpoise abundance in California from 1997 and 1999 aerial surveys. Southwest Fisheries Science Center Administrative Report LJ-03-04. 12 p.
Carretta, J.V. and S.J. Chivers. 2003. Preliminary estimates of marine mammal mortality and biological sampling of cetaceans in California gillnet fisheries for 2002. Paper SC/55/SM3 presented to the International Whaling Commission (unpublished). 21pp.
Carretta, J.V. and K.A. Forney. 2004. Preliminary estimates of harbor porpoise abundance in California from 1999 and 2002 aerial surveys. SWFSC Administrative Report LJ-04-01, available from Southwest Fisheries Science Center, 8604 La Jolla Shores Drive, La Jolla, CA, USA. 13pp.
Caswell, H., S. Brault, A. Read, and T. Smith. 1998. Harbor porpoise and fisheries: an uncertainty analysis of incidental mortality. Ecological Applications 84(4):1226-1238.
Chivers, S.J., A.E. Dizon, P.J. Gearin, and K.M. Robertson. 2002. Small-scale population structure of eastern North Pacific harbour porpoises, (Phocoena phocoena), indicated by molecular genetic analyses. Journal of Cetacean Research and Management 4(2):111-122.
Chivers, S.J., B. Hanson, J. Laake, P. Gearin, M.M. Muto, J. Calambokidis, D. Duffield, T. McGuire, J. Hodder, D. Greig, E. Wheeler, J. Harvey, K.M. Robertson, and B. Hancock. 2007. Additional genetic evidence for population structure of Phocoena phocoena off the coasts of California, Oregon, and Washington. Southwest Fisheries Science Center Administrative Report LJ-07-08. 16pp.
Forney, K. A. 1999a. The abundance of California harbor porpoise estimated from 1993-97 aerial line-transect surveys. Admin. Rep. LJ-99-02. Southwest Fisheries Center, National Marine Fisheries Service, P.O. Box 271, La Jolla, CA 92038. 16 pp.
Forney, K. A. 1999b. Trends in harbor porpoise abundance off central California, 1986-95: Evidence for interannual changes in distribution? J. Cetacean Res. Manage. 1:73-80.
Forney, K. A., J. V. Carretta, and S. R. Benson. 2013. Preliminary estimates of harbor porpoise abundance in Pacific Coast waters of California, Oregon and Washington, 2007-2012. Draft Document PSRG-2013-10 submitted to the Pacific Scientific Review Group, 2-4 April 2013, San Diego, CA.
Gaskin, D. E. 1984. The harbour porpoise (Phocoena phocoena L.): regional populations, status, and information on direct and indirect catches. Rep. int. Whal. Commn 34:569_586.
Green, G. A., J. J. Brueggeman, R. A. Grotefendt, C. E. Bowlby, M. L. Bonnell, and K. C. Balcomb, III. 1992. Cetacean distribution and abundance off Oregon and Washington, 1989-1990. Ch. 1 In: J. J. Brueggeman (ed.). Oregon and Washington Marine Mammal and Seabird Surveys. Minerals Management Service Contract Report 14-12-0001-30426 prepared for the Pacific OCS Region.
Julian, F. and M. Beeson. 1998. Estimates of mammal, turtle, and bird mortality for two California gillnet fisheries: 1990-1995. U.S. Fishery Bulletin 96:271-284.
Laake, J. L., J. C. Calambokidis, S. D. Osmek, and D. J. Rugh. 1997. Probability of detecting harbor porpoise from aerial surveys: estimating g(0). J. Wildl. Manag. 61:63-75.
NMFS, Southwest Fisheries Science Center, P.O. Box 271, La Jolla, CA 92038-0271. NMFS, Southwest Region, 501 West Ocean Blvd, Long Beach, CA 90802_4213. Norris, K.S. and J.H. Prescott. 1961. Observations on Pacific cetaceans of Californian and Mexican
waters. Univ. Calif. Publ. Zool. 63(4):291-402. Polacheck, T., F. W. Wenzel, and G. Early. 1995. What do stranding data say about harbor porpoise
(Phocoena phocoena). Rep. Int. Whal. Comm., Special Issue 16:169-179. Read, A.J. and A.A. Hohn. 1995. Life in the fast lane: the life history of harbor porpoises from the Gulf
of Maine. Marine Mammal Science 11(4):423-440.
37

Rosel, P. E. 1992. Genetic population structure and systematic relationships of some small cetaceans inferred from mitochondrial DNA sequence variation. Ph.D. Dissertation, Univ. Calif. San Diego. 191pp.
Rosel, P. E., A. E. Dizon, and M. G. Haygood. 1995. Variability of the mitochondrial control region in populations of the harbour porpoise, Phocoena phocoena, on inter-oceanic and regional scales. Can. J. Fish. and Aquat. Sci. 52:1210-1219.
Teilmann, J. and J. Carstensen. 2012. Negative long term effects on harbour porpoises from a large scale offshore wind farm in the Baltic—evidence of slow recovery. Environ. Res. Lett. 7 (2012) 045101, doi:10.1088/1748-9326/7/4/045101.
Wade, P. R. and R. P. Angliss. 1997. Guidelines for Assessing Marine Mammal Stocks: Report of the GAMMS Workshop April 3-5, 1996, Seattle, Washington. U. S. Dep. Commer., NOAA Tech. Memo. NMFS-OPR-12. 93 pp.
Woodley, T. H. and A. J. Read. 1991. Potential rates of increase of a harbour porpoise (Phocoena phocoena) population subjected to incidental mortality in commercial fisheries. Can. J. Fish. Aquat. Sci. 48:2429-2435.
38

Revised 10/15/2009 9/24/2013
HARBOR PORPOISE (Phocoena phocoena): Monterey Bay Stock STOCK DEFINITION AND GEOGRAPHIC RANGE In the Pacific, harbor porpoise are found in coastal and inland waters from Point Conception, California to Alaska and across to Kamchatka and Japan (Gaskin 1984). Harbor porpoise appear to have more restricted movements along the western coast of the continental U.S. than along the eastern coast. Regional differences in pollutant residues in harbor porpoise indicate that they do not move extensively between California, Oregon, and Washington (Calambokidis and Barlow 1991). That study also showed some regional differences within California (although the sample size was small). This pattern stands as a sharp contrast to the eastern coast of the U.S. and Canada where harbor porpoise are believed to migrate seasonally from as far south as the Carolinas to the Gulf of Maine and Bay of Fundy (Polacheck et al. 1995). A phylogeographic analysis of genetic data from northeast Pacific harbor porpoise did not show complete concordance between DNA sequence types and geographic location (Rosel 1992). However, an analysis of molecular variance (AMOVA) of the same data with additional samples found significant genetic differences for four of the six pair-wise comparisons between the four areas investigated: California, Washington, British Columbia, and Alaska (Rosel et al. 1995). These results demonstrate that harbor porpoise along the west coast of North America are not panmictic or migratory, and movement is sufficiently restricted that genetic differences have evolved. Recent preliminary Subsequent genetic analyses of samples ranging from Monterey Bay, California to Vancouver Island, British Columbia indicate that there is small-scale subdivision within the U.S. portion of this range (Chivers et al., 2002, 2007). In their assessment of harbor porpoise, Barlow and Hanan (1995) recommended that the animals inhabiting central California (defined to be from Point Conception to the Russian River) be treated as a separate stock. Their justifications for this were: 1) fishery mortality of harbor porpoise is was limited to central California, 2) movement of individual animals appears to be restricted within California, and consequently 3) fishery mortality could cause the local depletion of harbor porpoise if central California is not managed separately. Although geographic structure exists along an almost continuous distribution of harbor porpoise from California to Alaska, stock boundaries are difficult to draw because any rigid line is (to a greater or lesser extent) arbitrary from a biological perspective. Nonetheless, failure to recognize geographic structure by defining management stocks can lead to depletion of local populations. Based on more recent genetic findings (Chivers et al., 2002, 2007), California coast stocks were re-evaluated, and significant genetic differences were found among 4 identified sampling sites. Revised stock boundaries are presented here based on these genetic data and density discontinuities identified from aerial surveys,
Figure 1. Stock boundaries and distributional range of harbor porpoise along the California/southern Oregon coast. Dashed line represents harbor porpoise habitat (0-200 m) along the U.S. west coast.
39

resulting in six California/Oregon/Washington stocks where previously there had been four (Carretta et al. 2001a). The stock boundaries for animals that occur in California/southern Oregon waters are shown in Figure 1. For the 2009 Marine Mammal Protection Act (MMPA) Stock Assessment Reports, other Pacific coast harbor porpoise stocks include: 1) a Monterey Bay stock, 2) a San Francisco-Russian River stock, 3) a northern California/southern Oregon stock, 4) an a northern Oregon/Washington coast stock, 5) an Inland Washington stock, 6) a Southeast Alaska stock, 7) a Gulf of Alaska stock, and 8) a Bering Sea stock. Stock assessment reports for Morro Bay, San Francisco-Russian River, northern California/southern Oregon, Oregon/Washington coast, and Inland Washington waters harbor porpoise harbor porpoise stocks within waters of California, Oregon, and Washington appear in this volume. The three Alaska harbor porpoise stocks are reported separately in the Stock Assessment Reports for the Alaska Region. POPULATION SIZE Previous estimates of abundance for California harbor porpoise were based on aerial surveys conducted between the coast and the 50-fm isobath during 1988-95 (Barlow and Forney 1994, Forney 1999a). These estimates did not include an unknown number of animals found in deeper waters. Barlow (1988) found that the vast majority of harbor porpoise in California were within the 0-50-fm depth range; however, Green et al. (1992) found that 24% of harbor porpoise seen during aerial surveys of Oregon and Washington were between the 100m and 200m isobaths (55 to 109 fathoms). A systematic ship survey of depth strata out to 90 m in northern California showed that porpoise abundance declined significantly in waters deeper than 60 m (Carretta et al. 2001b). A recent analysis of harbor porpoise trends including oceanographic data suggests that the proportion of California harbor porpoise in deeper waters may vary between years (Forney 1999b). Starting in 1999, aerial surveys extended farther offshore (to the 200m depth contour or a minimum of 15 nmi from shore in the region of the Monterey Bay stock) to provide a more complete abundance estimate. Based on 2002-2007 aerial surveys under good survey conditions (Beaufort 2, cloud cover 25%) the estimate of abundance for this stock is 1,492 animals (CV=0.40) (Carretta et al., 2009). The most recent estimate of abundance for the Monterey Bay stock, based on 2011 aerial surveys conducted in good survey conditions (Beaufort sea states 2, cloud cover 25%), is 3,715 (CV=0.51) harbor porpoises (Forney et al. 2013). This estimate includes a correction factor of 3.42 (1/g(0); g(0)=0.292, CV=0.366) (Laake et al. 1997a), to adjust for groups missed by aerial observers. Minimum Population Estimate The minimum population estimate for the Monterey Bay harbor porpoise stock is taken as the lower 20th percentile of the log-normal distribution of the abundance estimated from the 2002-2007 2011 aerial surveys, or 1,079 2,480 animals. Current Population Trend Abundance estimates from aerial surveys conducted between 1988 and 2007 show evidence of a declining trend, though this decline is not statistically significant and it should be noted that survey effort in 2007 was sparse compared to previous years (Figure 2). The latest abundance estimate is markedly greater than previous estimates dating back to 1988, which were less than 1,500-2,000 harbor porpoises (see previous stock assessment reports), but confidence limits are wide. Further analyses will be required to estimate population trends from the available abundance estimates, particularly because the abundance estimates are derived using common parameters and some shared survey data. CURRENT AND MAXIMUM NET PRODUCTIVITY RATES Based on what are argued to be biological limits of the species (i.e. females give birth first at age 4 and produce one calf per year until death), the theoretical, maximum-conceivable growth rate of a closed harbor porpoise population was estimated as 9.4% per year (Barlow and Boveng 1991). This maximum theoretical rate may not be achievable for any real population. [Woodley and Read (1991) calculate a maximum growth rate of approximately 5% per year, but their argument for this being a maximum (i.e. that porpoise survival rates cannot exceed those of Himalayan thar) is not well justified.] Population growth rates have not actually been measured for any harbor porpoise population. Because a reliable estimate of the maximum net productivity rate is not available for Monterey Bay harbor porpoise, we use the default maximum net productivity rate (RMAX) of 4% for cetaceans (Wade and Angliss 1997).
40

POTENTIAL BIOLOGICAL REMOVAL The potential biological removal (PBR) level for this stock is calculated as the minimum population size (1,079 2,480) times one half the default maximum net growth rate for cetaceans (½ of 4%) times a recovery factor of 0.45 0.50(for a stock of unknown status with known fishery mortality and unknown fishery mortality CV; Wade and Angliss 1997), resulting in a PBR of 10 25.
1990 1995 2000 2005
010
0020
0030
0040
0050
00
Monterey Bay
Year
Porp
oise
Abu
ndan
ce
Figure 2. Aerial survey annual estimates of abundance for the Monterey Bay stock of harbor porpoise, 1988- 2007 (inshore stratum only). Error bars represent lower and upper 95% confidence intervals. Solid line represents a linear regression of the natural logarithm of abundance over time. The slope of this regression is not statistically significant (p = 0.08, r2 = 0.24).
HUMAN-CAUSED MORTALITY AND SERIOUS INJURY Fishery Information A 2002 ban on gillnets inshore of the 60 fathom (110 m) isobath was thought to eliminate the potential for harbor porpoise mortality to near zero in this stock’s range. However, there have been five observed harbor porpoise strandings in this stock’s range between 2003 and 2007 (three in 2004 and two in 2005) that showed evidence of fishery interactions, such as gillnet-like markings on the carcass or fishing line and hooks wrapped around the body. The responsible fisheries are unknown. Gillnet fisheries for halibut and white seabass that historically operated in the vicinity of Monterey Bay were eliminated in this stock’s range in 2002 by a ban on gillnets inshore of 60 fathoms (~110 m) from Point Arguello to Point Reyes, California. The large-mesh drift gillnet fishery for swordfish and thresher shark operates too far offshore to interact with harbor porpoise in this region. In the most recent five-year period for which data are available (2007-2011), no fishery-related mortality or injury of harbor porpoise within the range of the Monterey Bay stock has been documented.
41

Table 1. Summary of available on incidental mortality and injury of harbor porpoise in commercial fisheries that might take this species. Mean annual takes are based on 2003-2007 2007-2011 data. n/a indicates that data are not available.
Fishery Name
Year(s)
Data Type
Percent Observer Coverage
Observed Mortality
Kill/Day
Estimated Mortality
(CV in parentheses)
Mean Annual Takes (CV in parentheses)
Unidentified fisheries 2003-2007 2007-2011 Stranding n/a 5
none n/a
≥5
n/a
≥ 1.0 (n/a) 0 (n/a)
Minimum total annual takes ≥ 1.0 0 (n/a) STATUS OF STOCK Harbor porpoise in California are not listed as threatened or endangered under the Endangered Species Act nor as depleted under the Marine Mammal Protection Act. Barlow and Hanan (1995) calculate the status of harbor porpoise relative to historic carrying capacity (K) using a technique called back-projection. They calculate that the central California population could have been reduced to between 30% and 97% of K by incidental fishing mortality, depending on the choice of input parameters. They conclude that there is no practical way to reduce the range of this estimate. New information does not change this conclusion, and the status of harbor porpoise relative to their Optimum Sustainable Population (OSP) levels in central California must be treated as unknown. Fishery-related mortality of harbor porpoise still occurs in this stock’s range, though the bycatch levels and responsible fisheries are unknown. Because the overall level of fishery mortality is unknown relative to the PBR it cannot be considered to be insignificant and approaching zero mortality and injury rate. Although there is uncertainty regarding the observed levels of fishery-related mortality for this stock, documented mortality is less than the PBR, thus this No fishery-related mortality of harbor porpoise has been documented within this stock’s range during 2007-2011, and fishery mortality can be considered insignificant and approaching zero mortality rate. The Monterey Bay harbor porpoise stock is not considered “strategic” under the MMPA. Research activities will continue to monitor the population size and to investigate population trends. There are no known habitat issues that are of particular concern for this stock, although harbor porpoise are sensitive to disturbance by anthropogenic sound sources, such as those generated during the installation and operation of marine renewable energy facilities (Teilmann and Carstensen 2012). REFERENCES Barlow, J. 1988. Harbor porpoise (Phocoena phocoena) abundance estimation in California, Oregon and
Washington: I. Ship surveys. Fish. Bull. 86:417-432. Barlow, J. and P. Boveng. 1991. Modeling age-specific mortality for marine mammal populations. Mar.
Mamm. Sci. 7(1):84-119. Barlow, J. and K. A. Forney. 1994. An assessment of the 1994 status of harbor porpoise in California.
U.S. Dep. Commer., NOAA Tech. Memo. NMFS-SWFSC-205. 17 pp. Barlow, J. and D. Hanan. 1995. An assessment of the status of harbor porpoise in central California.
Rept. Int. Whal., Special Issue 16:123-140. Calambokidis, J. and J. Barlow. 1991. Chlorinated hydrocarbon concentrations and their use for
describing population discreteness in harbor porpoises from Washington, Oregon, and California. pp. 101-110 In: J. E. Reynolds III and D. K. Odell (eds.) Marine mammal strandings in the United States. NOAA Tech. Rep. NMFS 98.
Carretta, J.V., K.A. Forney, and S.R. Benson. 2009. . Preliminary estimates of harbor porpoise abundance in California waters from 2002 to 2007. NOAA Technical Memorandum, NOAA-TM-NMFS-SWFSC-435. 10 p.
Carretta, J.V. 2001. Preliminary estimates of cetacean mortality in California gillnet fisheries for 2000. Paper SC/53/SM9 presented to the International Whaling Commission (unpublished). 21 pp.
42

Carretta, J.V. 2002. Preliminary estimates of cetacean mortality in California gillnet fisheries for 2001. Paper SC/54/SM12 presented to the International WhalingCommission(unpublished). 22pp.
Carretta, J.V. and S.J. Chivers. 2003. Preliminary estimates of marine mammal mortality and biological sampling of cetaceans in California gillnet fisheries for 2002. Paper SC/55/SM3 presented to the International Whaling Commission (unpublished). 21pp.
Carretta, J.V., Barlow, J., K.A. Forney, M.M. Muto, and J. Baker. 2001a. U.S. Pacific Marine Mammal Stock Assessments: 2001. U.S. Dep. Commer. NOAA Technical Memorandum NMFS-SWFSC-317. 280pp.
Carretta, J.V., B.L. Taylor, and S.J. Chivers. 2001b. Abundance and depth distribution of harbor porpoise (Phocoena phocoena) in northern California determined from a 1995 ship survey. U.S. Fishery Bulletin 99:29-39.
Carretta, J.V. 2003. Preliminary estimates of harbor porpoise abundance in California from 1997 and 1999 aerial surveys. Southwest Fisheries Science Center Administrative Report LJ-03-04. 12 p.
Carretta, J.V. and K.A. Forney. 2004. Preliminary estimates of harbor porpoise abundance in California from 1999 and 2002 aerial surveys. SWFSC Administrative Report LJ-04-01, available from Southwest Fisheries Science Center, 8604 La Jolla Shores Drive, La Jolla, CA, USA. 13pp.
Chivers, S.J., A.E. Dizon, P.J. Gearin, and K.M. Robertson. 2002. Small-scale population structure of eastern North Pacific harbour porpoises, (Phocoena phocoena), indicated by molecular genetic analyses. Journal of Cetacean Research and Management 4(2):111-122.
Forney, K. A. 1999a. The abundance of California harbor porpoise estimated from 1993-97 aerial line-transect surveys. Admin. Rep. LJ-99-02. Southwest Fisheries Center, National Marine Fisheries Service, P.O. Box 271, La Jolla, CA 92038. 16 pp.
Forney, K. A. 1999b. Trends in harbor porpoise abundance off central California, 1986-95: Evidence for interannual changes in distribution? J. Cetacean Res. Manage. 1:73-80.
Forney, K. A., J. V. Carretta, and S. R. Benson. 2013. Preliminary estimates of harbor porpoise abundance in Pacific Coast waters of California, Oregon and Washington, 2007-2012. Draft Document PSRG-2013-10 submitted to the Pacific Scientific Review Group, 2-4 April 2013, San Diego, CA.
Gaskin, D. E. 1984. The harbour porpoise (Phocoena phocoena L.): regional populations, status, and information on direct and indirect catches. Rep. int. Whal. Commn 34:569_586.
Green, G. A., J. J. Brueggeman, R. A. Grotefendt, C. E. Bowlby, M. L. Bonnell, and K. C. Balcomb, III. 1992. Cetacean distribution and abundance off Oregon and Washington, 1989-1990. Ch. 1 In: J. J. Brueggeman (ed.). Oregon and Washington Marine Mammal and Seabird Surveys. Minerals Management Service Contract Report 14-12-0001-30426 prepared for the Pacific OCS Region.
Laake, J. L., J. C. Calambokidis, S. D. Osmek, and D. J. Rugh. 1997. Probability of detecting harbor porpoise from aerial surveys: estimating g(0). J. Wildl. Manag. 61:63-75.
NMFS, Southwest Fisheries Science Center, P.O. Box 271, La Jolla, CA 92038-0271 NMFS, Southwest Region, 501 West Ocean Blvd, Long Beach, CA 90802_4213 Polacheck, T., F. W. Wenzel, and G. Early. 1995. What do stranding data say about harbor porpoise
(Phocoena phocoena). Rep. Int. Whal. Comm., Special Issue 16:169-179. Rosel, P. E. 1992. Genetic population structure and systematic relationships of some small cetaceans
inferred from mitochondrial DNA sequence variation. Ph.D. Dissertation, Univ. Calif. San Diego. 191pp.
Rosel, P. E., A. E. Dizon, and M. G. Haygood. 1995. Variability of the mitochondrial control region in populations of the harbour porpoise, Phocoena phocoena, on inter-oceanic and regional scales. Can. J. Fish. and Aquat. Sci. 52:1210-1219.
Teilmann, J. and J. Carstensen. 2012. Negative long term effects on harbour porpoises from a large scale offshore wind farm in the Baltic—evidence of slow recovery. Environ. Res. Lett. 7 (2012) 045101, doi:10.1088/1748-9326/7/4/045101.
Wade, P. R. and R. P. Angliss. 1997. Guidelines for Assessing Marine Mammal Stocks: Report of the GAMMS Workshop April 3-5, 1996, Seattle, Washington. U. S. Dep. Commer., NOAA Tech. Memo. NMFS-OPR-12. 93 pp.
Woodley, T. H. and A. J. Read. 1991. Potential rates of increase of a harbour porpoise (Phocoena phocoena) population subjected to incidental mortality in commercial fisheries. Can. J. Fish. Aquat. Sci. 48:2429-2435.
43

Revised 10/15/2009 9/24/20136/26/2013
HARBOR PORPOISE (Phocoena phocoena): San Francisco-Russian River Stock
STOCK DEFINITION AND GEOGRAPHIC RANGE In the Pacific, harbor porpoise are found in coastal and inland waters from Point Conception, California to Alaska and across to Kamchatka and Japan (Gaskin 1984). Harbor porpoise appear to have more restricted movements along the western coast of the continental U.S. than along the eastern coast. Regional differences in pollutant residues in harbor porpoise indicate that they do not move extensively between California, Oregon, and Washington (Calambokidis and Barlow 1991). That study also showed some regional differences within California (although the sample size was small). This pattern stands as a sharp contrast to the eastern coast of the U.S. and Canada where harbor porpoise are believed to migrate seasonally from as far south as the Carolinas to the Gulf of Maine and Bay of Fundy (Polacheck et al. 1995). A phylogeographic analysis of genetic data from northeast Pacific harbor porpoise did not show complete concordance between DNA sequence types and geographic location (Rosel 1992). However, an analysis of molecular variance (AMOVA) of the same data with additional samples found significant genetic differences for four of the six pair-wise comparisons between the four areas investigated: California, Washington, British Columbia, and Alaska (Rosel et al. 1995). These results demonstrate that harbor porpoise along the west coast of North America are not panmictic or migratory, and movement is sufficiently restricted that genetic differences have evolved. Recent preliminary Subsequent genetic analyses of samples ranging from Monterey Bay, California to Vancouver Island, British Columbia indicate that there is small-scale subdivision within the U.S. portion of this range (Chivers et al., 2002, 2007). In their assessment of harbor porpoise, Barlow and Hanan (1995) recommended that the animals inhabiting central California (defined to be from Point Conception to the Russian River) be treated as a separate stock. Their justifications for this were: 1) fishery mortality of harbor porpoise is was limited to central California, 2) movement of individual animals appears to be restricted within California, and consequently 3) fishery mortality could cause the local depletion of harbor porpoise if central California is not managed separately. Although geographic structure exists along an almost continuous distribution of harbor porpoise from California to Alaska, stock boundaries are difficult to draw because any rigid line is (to a greater or lesser extent) arbitrary from a biological perspective. Nonetheless, failure to recognize geographic structure by defining management stocks can lead to depletion of local populations. Based on more recent genetic findings (Chivers et al., 2002, 2007), California coast stocks were re-evaluated, and significant genetic differences were found among 4 identified sampling sites. Revised stock boundaries are presented here based on these genetic data and density discontinuities identified from aerial surveys, resulting in six California/Oregon/Washington stocks where previously there had been four (Carretta et al. 2001a). The stock boundaries for animals that occur in California/southern Oregon waters are shown in
Figure 1. Stock boundaries and distributional range of harbor porpoise along the California and southern Oregon coasts. Dashed line represents harbor porpoise habitat (0-200 m) along the U.S. west coast.
44

Figure 1. For the 2002 Marine Mammal Protection Act (MMPA) Stock Assessment Reports, other Pacific coast harbor porpoise stocks include: 1) a Morro Bay stock, 2) a Monterey Bay stock, 3) a northern California/southern Oregon stock, 4) an a northern Oregon/Washington coast stock, 5) an Inland Washington stock, 6) a Southeast Alaska stock, 7) a Gulf of Alaska stock, and 8) a Bering Sea stock. Stock assessment reports for Morro Bay, San Francisco-Russian River, northern California/southern Oregon, Oregon/Washington coast, and Inland Washington waters harbor porpoise harbor porpoise stocks within waters of California, Oregon, and Washington appear in this volume. The three Alaska harbor porpoise stocks are reported separately in the Stock Assessment Reports for the Alaska Region. POPULATION SIZE Previous estimates of abundance for California harbor porpoise were based on aerial surveys conducted between the coast and the 50-fm isobath during 1988-95 (Barlow and Forney 1994, Forney 1999a). These estimates did not include an unknown number of animals found in deeper waters. Barlow (1988) found that the vast majority of harbor porpoise in California were within the 0-50-fm depth range; however, Green et al. (1992) found that 24% of harbor porpoise seen during aerial surveys of Oregon and Washington were between the 100m and 200m isobaths (55 to 109 fathoms). A systematic ship survey of depth strata out to 90 m in northern California showed that porpoise abundance declined significantly in waters deeper than 60 m (Carretta et al. 2001b). A recent analysis of harbor porpoise trends including oceanographic data suggests that the proportion of California harbor porpoise in deeper waters may vary between years (Forney 1999b). Since 1999, aerial surveys extended farther offshore (to the 200m depth contour or a minimum of 15 nmi from shore in the region of the San Francisco-Russian River stock) to provide a more complete abundance estimate. Based on 2002-2007 aerial surveys under good survey conditions (Beaufort 2, cloud cover 25%) the estimate of abundance for this stock is 9,189 animals (CV= 0.38) (Carretta et al., 2009 ). The most recent estimate of abundance for the San Francisco-Russian River stock, based on 2007-2011 aerial surveys conducted in good survey conditions (Beaufort sea states 2, cloud cover 25%), is 9,886 (CV=0.51) harbor porpoises (Forney et al. 2013). This estimate includes a correction factor of 3.42 (1/g(0); g(0)=0.292, CV=0.366) (Laake et al. 1997a), to adjust for groups missed by aerial observers. Minimum Population Estimate
The minimum population estimate for the San Francisco-Russian River harbor porpoise stock is taken as the lower 20th percentile of the log-normal distribution of the abundance estimated from 2002-2007 2007-2011 aerial surveys, or 6,745 6,625 animals. Current Population Trend Abundance of the San Francisco - Russian River harbor porpoise stock appeared to be stable or declining between 1988-1991 and has steadily increased since 1993, however the slope of the linear regression on the natural logarithm of abundance over time is not statistically significant (p = 0.14, Figure 2). The latest abundance estimate is very similar to the previous 2002-2007 estimate of 9,189 harbor porpoises (see previous stock assessment reports), and no recent trend is apparent. Further analyses will be required to estimate long-term population trends from the available abundance estimates, particularly because the abundance estimates are derived using common parameters and some shared survey data. CURRENT AND MAXIMUM NET PRODUCTIVITY RATES Based on what are argued to be biological limits of the species (i.e. females give birth first at age 4 and produce one calf per year until death), the theoretical, maximum-conceivable growth rate of a closed harbor porpoise population was estimated as 9.4% per year (Barlow and Boveng 1991). This maximum theoretical rate may not be achievable for any real population. [Woodley and Read (1991) calculate a maximum growth rate of approximately 5% per year, but their argument for this being a maximum (i.e. that porpoise survival rates cannot exceed those of Himalayan thar) is not well justified.] Population growth rates have not actually been measured for any harbor porpoise population. Because a reliable estimate of the maximum net productivity rate is not available for northern California harbor porpoise, we use the default maximum net productivity rate (RMAX) of 4% for cetaceans (Wade and Angliss 1997). POTENTIAL BIOLOGICAL REMOVAL
45

The potential biological removal (PBR) level for this stock is calculated as the minimum population size (6,745 6,625) times one half the default maximum net growth rate for cetaceans (½ of 4%) times a recovery factor of 0.5 (for a species stock of unknown status; Wade and Angliss 1997), resulting in a PBR of 67 66.
1990 1995 2000 2005
050
0010
000
1500
020
000
San Francisco - Russian River
Year
Porp
oise
Abu
ndan
ce
Figure 2. Aerial survey annual estimates of abundance for the San Francisco – Russian River stock of harbor porpoise (inshore stratum only), 1988- 2007. Error bars represent lower and upper 95% confidence intervals. Solid line represents a linear regression of the natural logarithim of abundance over time. The slope of this regression line is not statistically significant (p = 0.24, r2=0.17)
HUMAN-CAUSED MORTALITY AND SERIOUS INJURY Fishery Information Although coastal gillnets are prohibited throughout this stock’s range, there have been fishery-related strandings in past years. No fishery-related strandings occurred during the most recent five-year period (2003-2007) but did occur to the north and south of this stock’s range. It is possible that some of the fishery-related strandings recorded in the Monterey Bay area during the most recent five-year period were killed in the San Francisco – Russian River stratum and drifted south to their observed stranding locations. In the most recent five-year period for which data are available (2007-2011), no fishery-related mortality or injury of harbor porpoise within the range of the San Francisco-Russian River stock has been documented. Table 1. Summary of available information on incidental mortality and injury of harbor porpoise (San Francisco-Russian River stock) in commercial fisheries that might take this species. No fishery takes or fishery-related strandings were reported in this region between 2003 and 2007 and 2011. n/a indicates that data are not available.
Fishery Name Year(s) Data Type
Percent Observer Coverage
Observed Mortality
Kill/Day Estimated Mortality (CV in parentheses)
Mean Annual Takes (CV in parentheses)
Unknown fishery
2003-2007 2007-2011 stranding n/a none n/a n/a 0 (n/a)
Minimum total annual takes 0 (n/a)
46

STATUS OF STOCK Harbor porpoise in California are not listed as threatened or endangered under the Endangered Species Act nor as depleted under the Marine Mammal Protection Act. Barlow and Hanan (1995) calculate the status of harbor porpoise relative to historic carrying capacity (K) using a technique called back-projection. They calculate that the central California population (including Morro Bay, Monterey Bay, and San Francisco-Russian River stocks) could have been reduced to between 30% and 97% of K by incidental fishing mortality, depending on the choice of input parameters. They conclude that there is no practical way to reduce the range of this estimate. New information does not change this conclusion, and the status of central California harbor porpoise populations relative to their Optimum Sustainable Population (OSP) levels must be treated as unknown. There are no known habitat issues that are of particular concern for this stock. Because the known human-caused mortality or serious injury (zero harbor porpoise per year) is less than the PBR (67 66), this stock is not considered a "strategic" stock under the MMPA, and average annual fishery mortality is less than 10% of the PBR, the fishery mortality can be considered insignificant and approaching zero mortality and serious injury rate. There are no known habitat issues that are presently of concern for this stock, although harbor porpoise are sensitive to disturbance by anthropogenic sound sources, such as those generated during the installation and operation of marine renewable energy facilities (Teilmann and Carstensen 2012). REFERENCES Barlow, J. 1988. Harbor porpoise (Phocoena phocoena) abundance estimation in California, Oregon and
Washington: I. Ship surveys. Fish. Bull. 86:417-432. Barlow, J. and P. Boveng. 1991. Modeling age-specific mortality for marine mammal populations. Mar.
Mamm. Sci. 7(1):84-119. Barlow, J. and K. A. Forney. 1994. An assessment of the 1994 status of harbor porpoise in California.
U.S. Dep. Commer., NOAA Tech. Memo. NMFS-SWFSC-205. 17 pp. Barlow, J. and D. Hanan. 1995. An assessment of the status of harbor porpoise in central California.
Rept. Int. Whal., Special Issue 16:123-140. Calambokidis, J. and J. Barlow. 1991. Chlorinated hydrocarbon concentrations and their use for
describing population discreteness in harbor porpoises from Washington, Oregon, and California. pp. 101-110 In: J. E. Reynolds III and D. K. Odell (eds.) Marine mammal strandings in the United States. NOAA Tech. Rep. NMFS 98.
Carretta, J.V., K.A. Forney, and S.R. Benson. 2009. Preliminary estimates of harbor porpoise abundance in California waters from 2002 to 2007. NOAA Technical Memorandum, NOAA-TM-NMFS-SWFSC-435. 10 p.
Carretta, J.V., J. Barlow, K.A. Forney, M.M. Muto, and J. Baker. 2001a. U.S. Pacific Marine Mammal Stock Assessments: 2001. U.S. Dep. Commer. NOAA Technical Memorandum, NOAA-TM-NMFS-SWFSC-317. 280 p.
Carretta, J.V., B.L. Taylor, and S.J. Chivers. 2001b. Abundance and depth distribution of harbor porpoise (Phocoena phocoena) in northern California determined from a 1995 ship survey. U.S. Fishery Bulletin 99:29-39.
Carretta, J.V. 2003. Preliminary estimates of harbor porpoise abundance in California from 1997 and 1999 aerial surveys. Southwest Fisheries Science Center Administrative Report LJ-03-04. 12 p.
Carretta, J.V. and K.A. Forney. 2004. Preliminary estimates of harbor porpoise abundance in California from 1999 and 2002 aerial surveys. SWFSC Administrative Report LJ-04-01, available from Southwest Fisheries Science Center, 8604 La Jolla Shores Drive, La Jolla, CA, USA. 13pp.
Chivers, S.J., A.E. Dizon, P.J. Gearin, and K.M. Robertson. 2002. Small-scale population structure of eastern North Pacific harbour porpoises, (Phocoena phocoena), indicated by molecular genetic analyses. Journal of Cetacean Research and Management 4(2):111-122.
Chivers, S.J., B. Hanson, J. Laake, P. Gearin, M.M. Muto, J. Calambokidis, D. Duffield, T. McGuire, J. Hodder, D. Greig, E. Wheeler, J. Harvey, K.M. Robertson, and B. Hancock. 2007. Additional genetic evidence for population structure of Phocoena phocoena off the coasts of California, Oregon, and Washington. Southwest Fisheries Science Center Administrative Report LJ-07-08. 16pp.
47

Forney, K. A. 1999a. The abundance of California harbor porpoise estimated from 1993-97 aerial line-transect surveys. Admin. Rep. LJ-99-02. Southwest Fisheries Center, National Marine Fisheries Service, P.O. Box 271, La Jolla, CA 92038. 16 pp.
Forney, K. A. 1999b. Trends in harbor porpoise abundance off central California, 1986-95: Evidence for interannual changes in distribution? J. Cetacean Res. Manage. 1:73-80.
Forney, K. A., J. V. Carretta, and S. R. Benson. 2013. Preliminary estimates of harbor porpoise abundance in Pacific Coast waters of California, Oregon and Washington, 2007-2012. Draft Document PSRG-2013-10 submitted to the Pacific Scientific Review Group, 2-4 April 2013, San Diego, CA.
Gaskin, D. E. 1984. The harbour porpoise (Phocoena phocoena L.): regional populations, status, and information on direct and indirect catches. Rep. int. Whal. Commn 34:569_586.
Green, G. A., J. J. Brueggeman, R. A. Grotefendt, C. E. Bowlby, M. L. Bonnell, and K. C. Balcomb, III. 1992. Cetacean distribution and abundance off Oregon and Washington, 1989-1990. Ch. 1 In: J. J. Brueggeman (ed.). Oregon and Washington Marine Mammal and Seabird Surveys. Minerals Management Service Contract Report 14-12-0001-30426 prepared for the Pacific OCS Region.
Laake, J. L., J. C. Calambokidis, S. D. Osmek, and D. J. Rugh. 1997. Probability of detecting harbor porpoise from aerial surveys: estimating g(0). J. Wildl. Manag. 61:63-75.
NMFS, Southwest Fisheries Science Center, P.O. Box 271, La Jolla, CA 92038-0271. NMFS, Southwest Region, 501 West Ocean Blvd, Long Beach, CA 90802-4213 Polacheck, T., F. W. Wenzel, and G. Early. 1995. What do stranding data say about harbor porpoise
(Phocoena phocoena). Rep. Int. Whal. Comm., Special Issue 16:169-179. Rosel, P. E. 1992. Genetic population structure and systematic relationships of some small cetaceans
inferred from mitochondrial DNA sequence variation. Ph.D. Dissertation, Univ. Calif. San Diego. 191pp.
Rosel, P. E., A. E. Dizon, and M. G. Haygood. 1995. Variability of the mitochondrial control region in populations of the harbour porpoise, Phocoena phocoena, on inter-oceanic and regional scales. Can. J. Fish. and Aquat. Sci. 52:1210-1219.
Teilmann, J. and J. Carstensen. 2012. Negative long term effects on harbour porpoises from a large scale offshore wind farm in the Baltic—evidence of slow recovery. Environ. Res. Lett. 7 (2012) 045101, doi:10.1088/1748-9326/7/4/045101.
Wade, P. R. and R. P. Angliss. 1997. Guidelines for Assessing Marine Mammal Stocks: Report of the GAMMS Workshop April 3-5, 1996, Seattle, Washington. U. S. Dep. Commer., NOAA Tech. Memo. NMFS-OPR-12. 93 pp.
Woodley, T. H. and A. J. Read. 1991. Potential rates of increase of a harbour porpoise (Phocoena phocoena) population subjected to incidental mortality in commercial fisheries. Can. J. Fish. Aquat. Sci. 48:2429-2435.
48

Revised 10/15/2009 9/24/20136/26/2013
HARBOR PORPOISE (Phocoena phocoena): Northern California/Southern Oregon Stock
STOCK DEFINITION AND GEOGRAPHIC RANGE In the Pacific, harbor porpoise are found in coastal and inland waters from Point Conception, California to Alaska and across to Kamchatka and Japan (Gaskin 1984). Harbor porpoise appear to have more restricted movements along the western coast of the continental U.S. than along the eastern coast. Regional differences in pollutant residues in harbor porpoise indicate that they do not move extensively between California, Oregon, and Washington (Calambokidis and Barlow 1991). That study also showed some regional differences within California (although the sample size was small). This pattern stands as a sharp contrast to the eastern coast of the U.S. and Canada where harbor porpoise are believed to migrate seasonally from as far south as the Carolinas to the Gulf of Maine and Bay of Fundy (Polacheck et al. 1995). A phylogeographic analysis of genetic data from northeast Pacific harbor porpoise did not show complete concordance between DNA sequence types and geographic location (Rosel 1992). However, an analysis of molecular variance (AMOVA) of the same data with additional samples found significant genetic differences for four of the six pair-wise comparisons between the four areas investigated: California, Washington, British Columbia, and Alaska (Rosel et al. 1995). These results demonstrate that harbor porpoise along the west coast of North America are not panmictic or migratory, and movement is sufficiently restricted that genetic differences have evolved. Recent preliminary Subsequent genetic analyses of samples ranging from Monterey Bay, California to Vancouver Island, British Columbia indicate that there is small-scale subdivision within the U.S. portion of this range Chivers et al., 2002, 2007). In their assessment of harbor porpoise, Barlow and Hanan (1995) recommended that the animals inhabiting central California (defined to be from Point Conception to the Russian River) be treated as a separate stock. Their justifications for this were: 1) fishery mortality of harbor porpoise is was limited to central California, 2) movement of individual animals appears to be restricted within California, and consequently 3) fishery mortality could cause the local depletion of harbor porpoise if central California is not managed separately. Although geographic structure exists along an almost continuous distribution of harbor porpoise from California to Alaska, stock boundaries are difficult to draw because any rigid line is (to a greater or lesser extent) arbitrary from a biological perspective. Nonetheless, failure to recognize geographic structure by defining management stocks can lead to depletion of local populations. Based on more recent genetic findings (Chivers et al., 2002, 2007), California coast stocks were re-evaluated and significant genetic differences were found among four identified sampling sites. Revised stock boundaries are presented here were identified based on these genetic data and density discontinuities identified from aerial surveys (Figure 1)., resulting in six west coast stocks where previously there had been four (Carretta
Figure 1. Stock boundaries and distributional range of harbor porpoise along the California/southern Oregon coasts. Dashed line represents harbor porpoise habitat (0-200 m) along the U.S. west coast.
49

et al. 2001a). These new stock boundaries are shown in Figure 1. The northern boundary of the Northern California/Southern Oregon stock of harbor porpoise has been moved north to approximately the latitude of Lincoln City, Oregon, based on additional genetic analyses and a recommendation from the Pacific Regional Scientific Review Group to revise the boundary. For the 2002 Marine Mammal Protection Act (MMPA) Stock Assessment Reports, other Pacific coast harbor porpoise stocks include: 1) a Morro Bay stock, 2) a Monterey Bay stock, 3) a San Francisco-Russian River stock, 4) an a northern Oregon/Washington coast stock, 5) an Inland Washington stock, 6) a Southeast Alaska stock, 7) a Gulf of Alaska stock, and 8) a Bering Sea stock. The stock assessment reports for Morro Bay, San Francisco-Russian River, northern California/southern Oregon, Oregon/Washington coast, and Inland Washington waters harbor porpoise harbor porpoise stocks within waters of California, Oregon, and Washington appear in this volume. The three Alaska harbor porpoise stocks are reported separately in the Stock Assessment Reports for the Alaska Region. POPULATION SIZE Previous estimates of abundance for California harbor porpoise were based on aerial surveys conducted between the coast and the 50-fm isobath during 1988-95 (Barlow and Forney 1994, Forney 1999a). These estimates did not include an unknown number of animals found in deeper waters. Barlow (1988) found that the vast majority of harbor porpoise in California were within the 0-50-fm depth range; however, Green et al. (1992) found that 24% of harbor porpoise seen during aerial surveys of Oregon and Washington were between the 100m and 200m isobaths (55 to 109 fathoms). A systematic ship survey of depth strata out to 90 m in northern California showed that porpoise abundance declined significantly in waters deeper than 60 m (Carretta et al. 2001b). A recent analysis of harbor porpoise trends including oceanographic data suggests that the proportion of California harbor porpoise in deeper waters may vary between years (Forney 1999b; see Current Population Trend below). Since 1999, aerial surveys extended farther offshore (to the 200m depth contour or 15 nmi distance, whichever is farther) to provide a more complete abundance estimate. Based on pooled 2002-2007 aerial survey data including data from both inshore and offshore areas, an updated estimate of abundance for the northern California/southern Oregon harbor porpoise stock is 39,581 harbor porpoise (CV=0.39). This estimate represents a combined estimate of aerial surveys completed between 2002-2007 by SWFSC (Carretta et al.2009) and unpublished data from the National Marine Mammal Laboratory. The most recent estimate of abundance for the northern California/southern Oregon stock, based on 2007-2011 aerial surveys conducted in good survey conditions (Beaufort sea states 2, cloud cover 25%), is 35,769 (CV=0.52) harbor porpoises (Forney et al. 2013). This estimate includes a correction factor of 3.42 (1/g(0); g(0)=0.292, CV=0.366) (Laake et al. 1997a), to adjust for groups missed by aerial observers. Minimum Population Estimate The minimum population estimate for harbor porpoise in northern California/southern Oregon is taken as the lower 20th percentile of the log-normal distribution of the abundance estimate obtained from 2002-2007 2007-2011 aerial surveys, or 28,833 23,749 animals. This estimate includes harbor porpoise within an area extending to the 200m isobath or 15 nmi, whichever is farther from shore. Current Population Trend Because the northern boundary of this stock has changed two times in recent years, trends in abundance have been examined only for the northern California portion of this stock. A possible increasing trend in abundance is apparent from surveys conducted between 1989 and 2007, but the trend is not statistically significant (Figure 2). The latest abundance estimate is similar to the previous 2002-2007 estimate of 39,581 harbor porpoises (see previous stock assessment reports), and no recent trend is apparent. Further analyses will be required to estimate long-term population trends from the available abundance estimates, particularly because the abundance estimates are derived using common parameters and some shared survey data. CURRENT AND MAXIMUM NET PRODUCTIVITY RATES Based on what are argued to be biological limits of the species (i.e. females give birth first at age 4 and produce one calf per year until death), the theoretical, maximum-conceivable growth rate of a closed harbor porpoise population was estimated as 9.4% per year (Barlow and Boveng 1991). This maximum
50

theoretical rate may not be achievable for any real population. [Woodley and Read (1991) calculate a maximum growth rate of approximately 5% per year, but their argument for this being a maximum (i.e. that porpoise survival rates cannot exceed those of Himalayan thar) is not well justified.] Population growth rates have not actually been measured for any harbor porpoise population. Because a reliable estimate of the maximum net productivity rate is not available for northern California harbor porpoise, we use the default maximum net productivity rate (RMAX) of 4% for cetaceans (Wade and Angliss 1997). POTENTIAL BIOLOGICAL REMOVAL The potential biological removal (PBR) level for this stock is calculated as the minimum population size (28,833 23,749) times one half the default maximum net growth rate for cetaceans (½ of 4%) times a recovery factor of 1.0 (for a species within its Optimal Sustainable Population; Wade and Angliss 1997), resulting in a PBR of 577 475.
1990 1995 2000 2005
010
000
2000
030
000
4000
0
Northern California
Year
Porp
oise
Abu
ndan
ce
Figure 4. Aerial survey annual estimates of harbor porpoise abundance for the northern California inshore stratum, 1989-2007. Solid line represents a linear regression on the natural logarithim of abundance over time. The slope of this regression is not statistically significant (p = 0.21, r2=0.22).
HUMAN-CAUSED MORTALITY Fishery Information There were four three harbor porpoise strandings in this stock’s range that showed evidence of interactions with entangling net fisheries between 2003 and during 2007. At least two Two of these were reported to be entangled in lost river salmon gillnet gear, while the third was an unidentified fishery interaction. . There has been documented harbor porpoise mortality in the Klamath River tribal salmon gillnet fisheries as recently as 1995. It is possible that recent gillnet-related strandings in this area are attributable to that fishery.
51

Table 1. Summary of available information on incidental mortality and injury of harbor porpoise (northern CA California/southern Oregon stock) in commercial fisheries that might take this species during 2007-2011. n/a indicates that data are not available.
Fishery Name Year(s) Data Type Percent Observer Coverage
Observed Mortality
Estimated Mortality (CV in parentheses)
Mean Annual Takes (CV in parentheses)
Unknown fishery 2003-2007
2007-2011 Stranding n/a
4
3 n/a ≥0.8 ≥0.6 (n/a)
Minimum total annual takes ≥0.8 ≥0.6 (n/a)
STATUS OF STOCK Harbor porpoise in northern California/southern Oregon are not listed as threatened or endangered under the Endangered Species Act nor as depleted under the Marine Mammal Protection Act. There are no known habitat issues that are of particular concern for this stock. Because of the lack of recent or historical sources of human-caused mortality, the harbor porpoise stock in northern California has been concluded to The northern California portion of this harbor porpoise stock was determined to be within their Optimum Sustainable Population (OSP) level in the mid-1990s (Barlow and Forney 1994), based on a lack of significant anthropogenic mortality. While some fishery-related strandings have occurred, the amount of anthropogenic mortality appears to be negligible compared with the population size and the stock is still considered to be within the range of OSP. Because the known human-caused mortality or serious injury (≥0.8 ≥0.6 harbor porpoise per year) is less than the PBR (577 475), this stock is not considered a "strategic" stock under the MMPA. Because average annual fishery mortality is less than 10% of the PBR, the fishery mortality can be considered insignificant and approaching zero mortality and serious injury rate. There are no known habitat issues that are presently of concern for this stock, although harbor porpoise are sensitive to disturbance by anthropogenic sound sources, such as those generated during the installation and operation of marine renewable energy facilities (Teilmann and Carstensen 2012). REFERENCES Barlow, J. 1988. Harbor porpoise (Phocoena phocoena) abundance estimation in California, Oregon and
Washington: I. Ship surveys. Fish. Bull. 86:417-432. Barlow, J. and P. Boveng. 1991. Modeling age-specific mortality for marine mammal populations. Mar.
Mamm. Sci. 7(1):84-119. Barlow, J. and K. A. Forney. 1994. An assessment of the 1994 status of harbor porpoise in California.
U.S. Dep. Commer., NOAA Tech. Memo. NMFS-SWFSC-205. 17 pp. Barlow, J. and D. Hanan. 1995. An assessment of the status of harbor porpoise in central California.
Rept. Int. Whal., Special Issue 16:123-140. Carretta, J.V., K.A. Forney, and S.R. Benson. 2009. Preliminary estimates of harbor porpoise abundance
in California waters from 2002 to 2007. NOAA Technical Memorandum, NOAA-TM-NMFS-SWFSC-435. 10 p.
Carretta, J.V. J. Barlow, K.A. Forney, M.M. Muto, and J. Baker. 2001a. U.S. Pacific Marine Mammal Stock Assessments: 2001. U.S. Dep. Commer. NOAA Technical Memorandum, NOAA-TM-NMFS-SWFSC-317. 280p.
Carretta, J.V., B.L. Taylor, and S.J. Chivers. 2001b. Abundance and depth distribution of harbor porpoise (Phocoena phocoena) in northern California determined from a 1995 ship survey. U.S. Fishery Bulletin 99:29-39.
Calambokidis, J. and J. Barlow. 1991. Chlorinated hydrocarbon concentrations and their use for describing population discreteness in harbor porpoises from Washington, Oregon, and California. pp. 101-110 In: J. E. Reynolds III and D. K. Odell (eds.) Marine mammal strandings in the United States. NOAA Tech. Rep. NMFS 98.
Chivers, S.J., A.E. Dizon, P.J. Gearin, and K.M. Robertson. 2002. Small-scale population structure of eastern North Pacific harbour porpoises, (Phocoena phocoena), indicated by molecular genetic analyses. Journal of Cetacean Research and Management 4(2):111-122.
Chivers, S.J., B. Hanson, J. Laake, P. Gearin, M.M. Muto, J. Calambokidis, D. Duffield, T. McGuire, J. Hodder, D. Greig, E. Wheeler, J. Harvey, K.M. Robertson, and B. Hancock. 2007. Additional
52

genetic evidence for population structure of Phocoena phocoena off the coasts of California, Oregon, and Washington. Southwest Fisheries Science Center Administrative Report LJ-07-08. 16pp.
Forney, K. A. 1999a. The abundance of California harbor porpoise estimated from 1993-97 aerial line-transect surveys. Admin. Rep. LJ-99-02. Southwest Fisheries Center, National Marine Fisheries Service, P.O. Box 271, La Jolla, CA 92038. 16 pp.
Forney, K. A. 1999b. Trends in harbor porpoise abundance off central California, 1986-95: Evidence for interannual changes in distribution? J. Cetacean Res. Manage. 1:73-80.
Forney, K. A., J. V. Carretta, and S. R. Benson. 2013. Preliminary estimates of harbor porpoise abundance in Pacific Coast waters of California, Oregon and Washington, 2007-2012. Draft Document PSRG-2013-10 submitted to the Pacific Scientific Review Group, 2-4 April 2013, San Diego, CA.
Gaskin, D. E. 1984. The harbour porpoise (Phocoena phocoena L.): regional populations, status, and information on direct and indirect catches. Rep. int. Whal. Commn 34:569_586.
Green, G. A., J. J. Brueggeman, R. A. Grotefendt, C. E. Bowlby, M. L. Bonnell, and K. C. Balcomb, III. 1992. Cetacean distribution and abundance off Oregon and Washington, 1989-1990. Ch. 1 In: J. J. Brueggeman (ed.). Oregon and Washington Marine Mammal and Seabird Surveys. Minerals Management Service Contract Report 14-12-0001-30426 prepared for the Pacific OCS Region.
Laake, J. L., J. C. Calambokidis, S. D. Osmek, and D. J. Rugh. 1997. Probability of detecting harbor porpoise from aerial surveys: estimating g(0). J. Wildl. Manag. 61:63-75.
Laake, J., J. Calambokidis, S. Osmek. 1998. Survey report for the 1997 aerial surveys for harbor porpoise and other marine mammals of Oregon, Washington, and British Columbia outside waters. Alaska Fisheries Science Center Processed Report 98-10. pp. 77-97.
NMFS, Southwest Fisheries Science Center, P.O. Box 271, La Jolla, CA 92038-0271 NMFS, Southwest Region, 501 West Ocean Blvd, Long Beach, CA 90802_4213 Polacheck, T., F. W. Wenzel, and G. Early. 1995. What do stranding data say about harbor porpoise
(Phocoena phocoena). Rep. Int. Whal. Comm., Special Issue 16:169-179. Rosel, P. E. 1992. Genetic population structure and systematic relationships of some small cetaceans
inferred from mitochondrial DNA sequence variation. Ph.D. Dissertation, Univ. Calif. San Diego. 191pp.
Rosel, P. E., A. E. Dizon, and M. G. Haygood. 1995. Variability of the mitochondrial control region in populations of the harbour porpoise, Phocoena phocoena, on inter-oceanic and regional scales. Can. J. Fish. and Aquat. Sci. 52:1210-1219.
Teilmann, J. and J. Carstensen. 2012. Negative long term effects on harbour porpoises from a large scale offshore wind farm in the Baltic—evidence of slow recovery. Environ. Res. Lett. 7 (2012) 045101, doi:10.1088/1748-9326/7/4/045101.
Wade, P. R. and R. P. Angliss. 1997. Guidelines for Assessing Marine Mammal Stocks: Report of the GAMMS Workshop April 3-5, 1996, Seattle, Washington. U. S. Dep. Commer., NOAA Tech. Memo. NMFS-OPR-12. 93 pp.
Woodley, T. H. and A. J. Read. 1991. Potential rates of increase of a harbour porpoise (Phocoena phocoena) population subjected to incidental mortality in commercial fisheries. Can. J. Fish. Aquat. Sci. 48:2429-2435.
53

Revised 12/15/2011 9/24/20136/26/2013
HARBOR PORPOISE (Phocoena phocoena vomerina): Northern Oregon/Washington Coast Stock
STOCK DEFINITION AND GEOGRAPHIC RANGE In the eastern North Pacific Ocean, harbor porpoise are found in coastal and inland waters from Point Barrow, along the Alaskan coast, and down the west coast of North America to Point Conception, California (Gaskin 1984). Harbor porpoise are known to occur year-round in the inland trans-boundary waters of Washington and British Columbia, Canada (Osborne et al. 1988) and along the Oregon/Washington coast (Barlow 1988, Barlow et al. 1988, Green et al. 1992). Aerial survey data from coastal Oregon and Washington, collected during all seasons, suggest that harbor porpoise distribution varies by depth (Green et al. 1992). Although distinct seasonal changes in abundance along the west coast have been noted, and attributed to possible shifts in distribution to deeper offshore waters during late winter (Dohl et al. 1983, Barlow 1988), seasonal movement patterns are not fully understood. Investigation of pollutant loads in harbor porpoise ranging from California to the Canadian border suggests restricted harbor porpoise movements (Calambokidis and Barlow 1991). Stock discreteness in the eastern North Pacific was analyzed using mitochondrial DNA from samples collected along the west coast (Rosel 1992) and is summarized in Osmek et al. (1994). Two distinct mtDNA groupings or clades exist. One clade is present in California, Washington, British Columbia, and Alaska (no samples were available from Oregon), while the other is found only in California and Washington. Although these two clades are not geographically distinct by latitude, the results may indicate a low mixing rate for harbor porpoise along the west coast of North America. Further genetic testing of the same data, along with additional samples, found significant genetic differences for four of the six pair-wise comparisons between the four areas investigated: California, Washington, British Columbia, and Alaska (Rosel et al. 1995). These results demonstrate that harbor porpoise along the west coast of North America are not panmictic or migratory and that movement is sufficiently restricted that genetic differences have evolved. Recent preliminary genetic analyses of samples ranging from Monterey Bay, California, to Vancouver Island, British Columbia, indicate that there is small-scale subdivision within the U.S. portion of this range (Chivers et al. 2002, 2007). This is consistent with low movement suggested by genetic analysis of harbor porpoise specimens from the North Atlantic, where numerous stocks have been delineated with clinal differences over areas as small as the waters surrounding the British Isles. Using the 1990-1991 aerial survey data of Calambokidis et al. (1993) for water depths <50 fathoms, Osmek et al. (1996) found significant differences in harbor porpoise mean densities (Z=6.9, P<0.001) between the waters of coastal Oregon/Washington and inland Washington/southern British Columbia, Canada (i.e., Strait of Juan de Fuca/San Juan Islands). Following a risk-averse management strategy, two stocks were recognized in the waters of Oregon and Washington, with a boundary at Cape Flattery, Washington. Based on recent genetic evidence, which suggests that the population of eastern
Figure 1. Stock boundaries (dashed lines) and approximate distribution (shaded areas) of harbor porpoise along the coasts of Washington and northern Oregon.
Oregon
Washington
Lincoln City
NorthernOregon/
WashingtonCoast stock
WashingtonInland Waters
stock
CapeFlattery
!
126°W
126°W
124°W 122°W 120°W42°N
44°N
46°N
48°N
54

North Pacific harbor porpoise is more finely structured (Chivers et al. 2002, 2007), stock boundaries on the Oregon/Washington coast have been revised, resulting in three stocks in Oregon/Washington waters: a Northern California/Southern Oregon stock (Point Arena, CA, to Lincoln City, OR), a Northern Oregon/Washington Coast stock (Lincoln City, OR, to Cape Flattery, WA), and the Washington Inland Waters stock (in waters east of Cape Flattery). Additional analyses are needed to determine whether to adjust the stock boundaries for harbor porpoise in Washington inland waters (Chivers et al. 2007). In their assessment of California harbor porpoise, Barlow and Hanan (1995) recommended two stocks be recognized in California, with the stock boundary at the Russian River. Based on recent genetic findings (Chivers et al. 2002, 2007), California coast stocks were re-evaluated and significant genetic differences were found among four identified sampling sites. Revised stock boundaries, based on these genetic data and density discontinuities identified from aerial surveys, resulted in six California/Oregon/Washington stocks where previously there had been four (e.g., Carretta et al. 2001): 1) the Washington Inland Waters stock, 2) the Northern Oregon/Washington Coast stock, 3) the Northern California/Southern Oregon stock, 4) the San Francisco-Russian River stock, 5) the Monterey Bay stock, and 6) the Morro Bay stock. The stock boundaries for animals that occur in northern Oregon/Washington waters are shown in Figure 1. This report considers only the Northern Oregon/Washington Coast stock. Stock assessment reports for Washington Inland Waters, Northern California/Southern Oregon, San Francisco-Russian River, Monterey Bay, and Morro Bay harbor porpoise also appear in this volume. Stock assessment reports for the three harbor porpoise stocks in the inland and coastal waters of Alaska, including 1) the Southeast Alaska stock, 2) the Gulf of Alaska stock, and 3) the Bering Sea stock, are reported separately in the Stock Assessment Reports for the Alaska Region. The harbor porpoise occurring in British Columbia have not been included in any of the U.S. stock assessment reports. POPULATION SIZE In August and September 2002, an aerial survey of Oregon, Washington, and southern British Columbia coastal waters, from shore to 200 m depth, resulted in an uncorrected abundance estimate of 4,583 (CV=0.145) harbor porpoise in U.S. waters between Lincoln City, Oregon, and Cape Flattery, Washington (J. Laake, unpublished data). Using a correction factor of 3.42 (1/g(0); g(0)=0.292, CV=0.366) (Laake et al. 1997a), to adjust for groups missed by aerial observers, the corrected estimate of abundance for harbor porpoise in the coastal waters of northern Oregon (north of Lincoln City) and Washington in 2002 is 15,674 (CV=0.394). However, because the most recent abundance estimate is >8 years old, there is no current estimate of abundance available for this stock. Two separate aerial surveys for leatherback turtles were conducted during 2010 and 2011 from the coast approximately to the 2,000 m isobath between Cape Blanco, Oregon, and Cape Flattery, Washington. Some additional adaptive surveys were conducted in areas of special interest for leatherback turtles; although these transects were not included in the analysis, the corresponding harbor porpoise sightings were included for estimation of the detection function in this study. Using a correction factor of 3.42 (1/g(0); g(0)=0.292, CV=0.366) (Laake et al. 1997a), to adjust for groups missed by aerial observers, the corrected estimate of abundance for harbor porpoise in the coastal waters of northern Oregon (north of Lincoln City) and Washington in 2010-2011 is 21,487 (CV = 0.44) (Forney et al. 2013). Minimum Population Estimate No current information on abundance is available to obtain a minimum population estimate for the Northern Oregon/Washington Coast stock of harbor porpoise. The minimum population estimate for this stock is calculated as the lower 20th percentile of the log-normal distribution (Wade and Angliss 1997) of the 2010-2011 population estimate of 21,487, which is 15,123 harbor porpoise. Current Population Trend There are no reliable data on population trends of harbor porpoise for coastal Oregon, Washington, or British Columbia waters; however, the uncorrected estimates of abundance for the Northern Oregon/Washington Coast stock in 1997 (6,406; SE=826.5) and 2002 (4,583) were not significantly different (Z=-1.73, P=0.08), although the survey area in 1997 (Regions I-S through III) was slightly larger than in 2002 (Strata D-G) (Laake et al. 1998a; J. Laake, unpublished data). The 2010-2011 Northern Oregon/Washington Coast stock estimate (21,487, CV = 0.44) is greater than the previous 2002 estimate of 15,674 (CV = 0.39), but the previous estimate is within the confidence limit of the current abundance estimate (Forney et al. 2013).
55

CURRENT AND MAXIMUM NET PRODUCTIVITY RATES A reliable estimate of the maximum net productivity rate is not available for harbor porpoise. Therefore, until additional data become available, it is recommended that the cetacean maximum theoretical net productivity rate (RMAX) of 4% (Wade and Angliss 1997) be employed for the Northern Oregon/Washington Coast harbor porpoise stock. POTENTIAL BIOLOGICAL REMOVAL Because there is no current estimate of minimum abundance, a potential biological removal (PBR) cannot be calculated for this stock. The potential biological removal (PBR) level for this stock is calculated as the minimum population size (15,123) times one-half the default maximum net growth rate for cetaceans (½ of 4%) times a recovery factor of 0.5 (for a stock of unknown status, Wade and Angliss 1997), resulting in a PBR of 151 harbor porpoise per year. HUMAN-CAUSED MORTALITY AND SERIOUS INJURY Fisheries Information Within the EEZ boundaries of the coastal waters of northern Oregon and Washington, harbor porpoise deaths are known to occur in the northern Washington marine set gillnet tribal fishery. Total fishing effort in this fishery is conducted within the range of both harbor porpoise stocks (Northern Oregon/Washington Coast and Washington Inland Waters) occurring in Washington State waters (Gearin et al 1994). Some movement of harbor porpoise between Washington’s coastal and inland waters is likely, but it is currently not possible to quantify the extent of such movements. For the purposes of this stock assessment report, the animals taken in waters south and west of Cape Flattery, WA, are assumed to have belonged to the Northern Oregon/Washington Coast stock, and Table 1 includes data only from that portion of the fishery. Fishing effort in the coastal marine set gillnet tribal fishery has declined since 2004. A test set gillnet fishery, with 100% observer coverage, was conducted in coastal waters in 2008 and 2011. This test fishery required the use of nets equipped with acoustic alarms, and no harbor porpoise deaths were reported (Makah Fisheries Management, unpublished data). The mean estimated mortality for this fishery in 2005-2009 2007-2011 is 0 (CV=0) harbor porpoise per year from observer data. Table 1. Summary of incidental mortality and serious injury of harbor porpoise (Northern Oregon/Washington Coast stock) in commercial and tribal fisheries that might take this species and calculation of the mean annual mortality rate; n/a indicates that data are not available. Mean annual takes are based on 2005-2009 2007-2011 data unless noted otherwise.
Fishery name
Years
Data type Percent observer coverage
Observed mortality
Estimated mortality
Mean annual takes (CV in parentheses)
Northern WA marine set gillnet (tribal test fishery in coastal
waters)1
2005 2006 2007 2008 2009 2010 2011
observer data
no fishery no fishery no fishery
100% no fishery
100% no fishery
0 0 0 0 0 0 0
0 (0) 0 (0) 0 (0) 0 (0) 0 (0) 0 (0) 0 (0)
0 (0)
Grays Harbor/Chehalis River tribal steelhead gillnet fishery1
2006 fisherman self-report
1 n/a >0.2 (n/a)
Unknown West Coast fisheries 2005-2009 2007-2011
stranding data
0, 0, 2, 2, 3 2, 1, 3, 3, 6 n/a >1.4 (n/a)
>3.0 (n/a)
Minimum total annual takes >1.6 (n/a)
>3.0 (n/a) 1This is a tribal fishery; therefore, it is not listed in the NMFS list of commercial fisheries. In 1995-1997, data were collected for the coastal portions (areas 4 and 4A) of the northern Washington marine set gillnet fishery as part of an experiment, conducted in cooperation with the Makah
56

Tribe, designed to explore the merits of using acoustic alarms to reduce bycatch of harbor porpoise in salmon gillnets. Results in 1995-1996 indicated that the nets equipped with acoustic alarms had significantly lower entanglement rates, as only 2 of the 49 deaths occurred in alarmed nets (Gearin et al. 1996, 2000; Laake et al. 1997b). In 1997, 96% of the sets were equipped with acoustic alarms and 13 deaths were observed (Gearin et al. 2000; P. Gearin, unpublished data). Harbor porpoise were displaced by an acoustic buffer around the alarmed nets, but it is unclear whether the porpoise or their prey were repelled by the alarms (Kraus et al. 1997, Laake et al. 1998b). However, the acoustic alarms did not appear to affect the target catch (chinook salmon and sturgeon) in the fishery (Gearin et al. 2000). For the past decade, Makah tribal regulations have required nets set in coastal waters (areas 4 and 4A) to be equipped with acoustic alarms. A harbor porpoise death was reported in a Grays Harbor/Chehalis River tribal steelhead gillnet fishery in 2006 (NMFS, Northwest Regional Office, unpublished data), resulting in an average annual mortality of 0.2 harbor porpoise for this fishery. According to Northwest Marine Mammal Stranding Network records, maintained by the NMFS Northwest Region (NMFS, Northwest Regional Office, unpublished data), there were seven 15 fishery-related strandings of harbor porpoise from this stock reported on the northern Oregon/Washington coast in 2005-2009 2007-2011 (2 in 2007, 2 1 in 2008, and 3 in 2009, 3 in 2010, and 6 in 2011), resulting in an average mean annual mortality of 1.4 3.0 harbor porpoise in 2005-2009 2007-2011. Evidence of fishery interactions included net marks, rope marks, and knife cuts (Carretta et al. 2013). Since these deaths could not be attributed to a particular fishery, and were the only confirmed fishery-related deaths in this area in 2005-2009 2007-2011, they are listed in Table 1 as occurring in unknown West Coast fisheries. Six Seven additional strandings reported in 2005-2009 2007-2011 (1 in 2006, 3 2 in 2007, and 1 in 2008, 2 1 in 2009 , and 3 in 2011) were considered possible fishery-related strandings but were not included in the estimate of average mean annual mortality. This estimate is considered a minimum because not all stranded animals are found, reported, or examined for cause of death (via necropsy by trained personnel). Other Mortality
A significant increase in the number of harbor porpoise strandings reported throughout Oregon and Washington in 2006 prompted the Working Group on Marine Mammal Unusual Mortality Events to declare an Unusual Mortality Event (UME) on 3 November 2006 (Huggins 2008). A total of 114 harbor porpoise strandings were reported and confirmed throughout Oregon/Washington coast and Washington inland waters in 2006 and 2007 (Huggins 2008). The cause of the UME has not been determined, and several factors, including contaminants, genetics, and environmental conditions, are still being investigated. Cause of death, determined for 48 of 81 porpoise that were examined in detail, was attributed mainly to trauma and infectious disease. Suspected or confirmed fishery interactions were the primary cause of adult/subadult traumatic injuries, while birth-related trauma was responsible for the neonate deaths. Although six of the Northern Oregon/Washington Coast harbor porpoise deaths examined as part of the UME were suspected to have been caused by fishery interactions, only two could be confirmed as fishery-related deaths; these two deaths are listed in Table 1 as occurring in unknown West Coast fisheries in 2007. STATUS OF STOCK Harbor porpoise are not listed as “depleted” under the MMPA or listed as “threatened” or “endangered” under the Endangered Species Act. Based on currently available data, the total minimum annual level of total human-caused mortality and serious injury is 1.6 (3.0 harbor porpoise per year) does not exceed the PBR (151). A PBR cannot be calculated for this stock because there is no current abundance estimate. The previous estimate of PBR was 114 (Carretta et al. 2009). Human-caused mortality relative to PBR is unknown, but it is considered to be small relative to the stock size. Therefore, the Northern Oregon/Washington Coast stock of harbor porpoise is not classified as “strategic.” The total minimum annual fishery mortality and serious injury for this stock (3.0) is not known to exceed 10% of the calculated PBR (15.1) and, therefore, can be considered to be insignificant and approaching zero mortality and serious injury rate (based on recent observer data (0) and self-reported fisheries information (0.2) and stranding data (1.4) where observer data were not available or failed to detect harbor porpoise deaths) is 1.6 harbor porpoise per year. Since a PBR cannot be calculated for this stock, fishery mortality relative to PBR is unknown. The status of this stock relative to its Optimum Sustainable Population (OSP) level and population trends is unknown.
57

REFERENCES Barlow, J. 1988. Harbor porpoise, Phocoena phocoena, abundance estimation for California, Oregon, and
Washington: I. Ship surveys. Fish. Bull. 86:417-432. Barlow, J., and D. Hanan. 1995. An assessment of the status of harbor porpoise in central California. Rep.
Int. Whal. Commn. Special Issue 16:123-140. Barlow, J., C. W. Oliver, T. D. Jackson, and B. L. Taylor. 1988. Harbor porpoise, Phocoena phocoena,
abundance estimation for California, Oregon, and Washington: II. Aerial surveys. Fish. Bull. 86:433-444.
Calambokidis, J., and J. Barlow. 1991. Chlorinated hydrocarbon concentrations and their use for describing population discreteness in harbor porpoises from Washington, Oregon, and California. Pp. 101-110, In: Reynolds, J. E., III, and D. K. Odell (eds.), Proceedings of the second marine mammal stranding workshop: 3-5 December 1987, Miami, Florida. U.S. Dep. Commer., NOAA Tech. Rep. NMFS 98.
Calambokidis, J., J. C. Cubbage, J. R. Evenson, S. D. Osmek, J. L. Laake, P. J. Gearin, B. J. Turnock, S. J. Jeffries, and R. F. Brown. 1993. Abundance estimates of harbor porpoise in Washington and Oregon waters. Final Report by Cascadia Research, Olympia, WA, to National Marine Mammal Laboratory, AFSC, NMFS, Seattle, WA. 55 pp.
Carretta, J. V., J. Barlow, K. A. Forney, M. M. Muto, and J. Baker. 2001. U.S. Pacific marine mammal stock assessments: 2001. U.S. Dep. Commer., NOAA Tech. Memo. NMFS-SWFSC-317. 280 pp.
Carretta, J. V., K. A. Forney, M. S. Lowry, J. Barlow, J. Baker, D. Johnston, B. Hanson, M. M. Muto, D. Lynch, and L. Carswell. 2009. U.S. Pacific marine mammal stock assessments: 2008. U.S. Dep. Commer., NOAA Tech. Memo. NMFS-SWFSC-434. 336 pp.
Carretta, J. V., S. M. Wilkin, M. M. Muto, and K. Wilkinson. 2013. Sources of human-related injury and mortality for U.S. Pacific west coast marine mammal stock assessments, 2007-2011. U.S. Dep. Commer., NOAA Tech. Memo. NMFS-SWFSC-514, 83 p.
Chivers, S. J., A. E. Dizon, P. J. Gearin, and K. M. Robertson. 2002. Small-scale population structure of eastern North Pacific harbour porpoises (Phocoena phocoena) indicated by molecular genetic analyses. J. Cetacean Res. Manage. 4(2):111-122.
Chivers, S. J., B. Hanson, J. Laake, P. Gearin, M. M. Muto, J. Calambokidis, D. Duffield, T. McGuire, J. Hodder, D. Greig, E. Wheeler, J. Harvey, K. M. Robertson, and B. Hancock. 2007. Additional genetic evidence for population structure of Phocoena phocoena off the coasts of California, Oregon, and Washington. Southwest Fisheries Science Center Administrative Report LJ-07-08. 14 pp. Available at SWFSC, NMFS, 3333 North Torrey Pines Road, La Jolla, CA 92037.
Dohl, T.P., R. C. Guess, M. L. Duman, and R. C. Helm. 1983. Cetaceans of central and northern California, 1980-1983: status, abundance, and distribution. OCS Study MMS 84-0045. Pacific OCS Region Minerals Management Service, 1340 Sixth Street, Los Angeles, CA 90014. 284 pp.
Forney, K. A., J.V. Carretta, and S. R. Benson. 2013. Preliminary estimates of harbor porpoise abundance in Pacific Coast waters of California, Oregon and Washington, 2007-2012. Draft Document PSRG-2013-10 submitted to the Pacific Scientific Review Group, 2-4 April 2013, San Diego, CA.
Gaskin, D. E. 1984. The harbour porpoise Phocoena phocoena (L.): regional populations, status, and information on direct and indirect catches. Rep. Int. Whal. Commn. 34:569-586.
Gearin, P. J. National Marine Mammal Laboratory, AFSC, NMFS, 7600 Sand Point Way NE, Seattle, WA 98115.
Gearin, P. J., S. R. Melin, R. L. DeLong, H. Kajimura, and M. A. Johnson. 1994. Harbor porpoise interactions with a chinook salmon set-net fishery in Washington State. Rep. Int. Whal. Commn. Special Issue 15:427-438.
Gearin, P. J., M. E. Gosho, L. Cooke, R. DeLong, and J. Laake. 1996. Acoustic alarm experiment in the 1995 northern Washington marine setnet fishery: methods to reduce by-catch of harbor porpoise. Paper SC/48/SM10 presented to the International Whaling Commission, June 1996 (unpublished). 15 pp. Available at National Marine Mammal Laboratory, 7600 Sand Point Way NE, Seattle, WA 98115.
Gearin, P. J., M. E. Gosho, J. L. Laake, L. Cooke, R. L. DeLong, and K. M. Hughes. 2000. Experimental testing of acoustic alarms (pingers) to reduce bycatch of harbour porpoise, Phocoena phocoena, in the state of Washington. J. Cetacean Res. Manage. 2(1):1-9.
Green, G.A., J.J. Brueggeman, R.A. Grotefendt, C.E. Bowlby, M. L. Bonnel, and K. C. Balcomb, III. 1992. Cetacean distribution and abundance off Oregon and Washington, 1989-1990. Ch. 1, In:
58

Brueggeman, J. J. (ed.), Oregon and Washington marine mammal and seabird surveys. Final Report, OCS Study MMS 91-0093, Minerals Management Service, U.S. Dept. of Interior, Los Angeles, CA.
Huggins, J. 2008. Request for event closure: 2006-2007 Northwest harbor porpoise unusual mortality event. Unpublished Report by Cascadia Research Collective to NMFS, Northwest Regional Office. 11 pp. Available at NMFS, Northwest Regional Office, 7600 Sand Point Way NE, Seattle, WA 98115.
Kraus, S. D., A. J. Read, A. Solow, K. Baldwin, T. Spradlin, E. Anderson, and J. Williamson. 1997. Acoustic alarms reduce porpoise mortality. Nature 388:525.
Laake, J.L. National Marine Mammal Laboratory, AFSC, NMFS, 7600 Sand Point Way NE, Seattle, WA 98115.
Laake, J.L., J. Calambokidis, S. D. Osmek, and D. J. Rugh. 1997a. Probability of detecting harbor porpoise from aerial surveys: estimating g(0). J. Wildl. Manage. 61(1):63-75.
Laake, J.L., P.J. Gearin, M.E. Gosho, and R.L. DeLong. 1997b. Evaluation of effectiveness of pingers to reduce incidental entanglement of harbor porpoise in a set gillnet fishery. Pp. 75-81, In: Hill, P. S., and D. P. DeMaster (eds.), MMPA and ESA implementation program, 1996. AFSC Processed Report 97-10. 255 pp. Available at National Marine Mammal Laboratory, 7600 Sand Point Way NE, Seattle, WA 98115.
Laake, J.L., J. Calambokidis, and S. Osmek. 1998a. Survey report for the 1997 aerial surveys for harbor porpoise and other marine mammals of Oregon, Washington and British Columbia outside waters. Pp. 77-97, In: Hill, P. S., and D. P. DeMaster (eds.), MMPA and ESA implementation program, 1997. AFSC Processed Report 98-10. 246 pp. Available at National Marine Mammal Laboratory, 7600 Sand Point Way NE, Seattle, WA 98115.
Laake, J.L., D.J. Rugh, and L.S. Baraff. 1998b. Observations of harbor porpoise in the vicinity of acoustic alarms on a set gillnet. U.S. Dep. Commer., NOAA Tech. Memo. NMFS-AFSC-84. 40 pp.
Makah Fisheries Management, P.O. Box 115, Neah Bay, WA 98357. National Marine Fisheries Service (NMFS), Northwest Regional Office, 7600 Sand Point Way NE, Seattle,
WA 98115. Osborne, R., J. Calambokidis, and E. M. Dorsey. 1988. A Guide to Marine Mammals of Greater Puget
Sound. Island Publishers, Anacortes, WA. 191 pp. Osmek, S., P. Rosel, A. Dizon, and R. DeLong. 1994. Harbor porpoise, Phocoena phocoena, population
assessment in Oregon and Washington, 1993. Pp. 1-14, In: Braham, H. W., and D. P. DeMaster (eds.), Marine mammal assessment program: status of stocks and impacts of incidental take, 1993. National Marine Mammal Laboratory – MMPA Studies of 1993, NMML, AFSC, NMFS, NOAA. 153 pp. Available at National Marine Mammal Laboratory, 7600 Sand Point Way NE, Seattle, WA 98115.
Osmek, S., J. Calambokidis, J. Laake, P. Gearin, R. DeLong, J. Scordino, S. Jeffries, and R. Brown. 1996. Assessment of the status of harbor porpoise, Phocoena phocoena, in Oregon and Washington waters. U.S. Dep. Commer., NOAA Tech. Memo. NMFS-AFSC-76. 46 pp.
Rosel, P.E. 1992. Genetic population structure and systematic relationships of some small cetaceans inferred from mitochondrial DNA sequence variation. Ph.D. Thesis, University of California - San Diego, La Jolla, CA. 191 pp.
Rosel, P.E., A. E. Dizon, and M. G. Haygood. 1995. Variability of the mitochondrial control region in populations of the harbour porpoise, Phocoena phocoena, on inter-oceanic and regional scales. Can. J. Fish. Aquat. Sci. 52:1210-1219.
Wade, P.R., and R. P. Angliss. 1997. Guidelines for assessing marine mammal stocks: report of the GAMMS workshop April 3-5, 1996, Seattle, Washington. U.S. Dep. Commer., NOAA Tech. Memo. NMFS-OPR-12. 93 pp.
59

Revised 01/15/2011 9/24/2013 PACIFIC WHITE-SIDED DOLPHIN (Lagenorhynchus obliquidens): California/Oregon/Washington, Northern and Southern Stocks STOCK DEFINITION AND GEOGRAPHIC RANGE Pacific white-sided dolphins are endemic to temperate waters of the North Pacific Ocean, and are common both on the high seas and along the continental margins. Off the U.S. west coast, Pacific white-sided dolphins have been seen occur primarily in shelf and slope waters (Figure 1). Sighting patterns from recent aerial and shipboard surveys conducted in California, Oregon and Washington (Green et al. 1992; 1993; Barlow 1995; Forney et al. 1995) suggest seasonal north-south movements, with animals found primarily off California during the colder water months and shifting northward into Oregon and Washington as water temperatures increase in late spring and summer (Green et al. 1992; Forney 1994). Stock structure throughout the North Pacific is poorly understood, but based on morphological evidence, two forms are known to occur off the California coast (Walker et al. 1986; Chivers et al. 1993). Specimens belonging to the northern form were collected from north of about 33oN, (Southern California to Alaska), and southern specimens were obtained from about 36oN southward along the coasts of California and Baja California. Samples of both forms have been collected in the Southern California Bight, but it is unclear whether this indicates sympatry in this region or whether they may occur there at different times (seasonally or interannually). Recent genetic Genetic analyses have confirmed the distinctness of animals found off Baja California from animals occurring in U.S. waters north of Point Conception, California and in the high seas of the North Pacific (Lux et al. 1997). Based on these genetic data, an area of mixing between the two forms appears to be located off Southern California (Lux et al. 1997). Although there is clear evidence that two forms of Pacific white-sided dolphins occur along the U.S. west coast, there are no known differences in color pattern, and it is not currently possible to distinguish animals without genetic or morphometric analyses. Geographic stock boundaries appear dynamic and are poorly understood, and therefore cannot be used to differentiate the two forms. Until means of differentiating the two forms for abundance and mortality estimation are developed, these two stocks must be managed as a single unit; however, this is an undesirable management situation. Furthermore, Pacific white-sided dolphins are not restricted to U.S. territorial waters, but cooperative management agreements with Mexico exist only for the tuna purse seine fishery and not for other fisheries
Figure 1. Pacific white-sided dolphin sightings based on aerial and shipboard surveys off California, Oregon, and Washington, 1991-2008 (see Appendix 2 for data sources and information on timing and location of survey effort). Dashed line represents the U.S. EEZ, thin lines indicate completed transect effort of all surveys combined. Key: ●= summer/autumn ship-based sightings; ▲ = winter/spring aerial-based sightings.
60

which may take this species (e.g. gillnet fisheries). Additional means of differentiating the two types must be found, and cooperative management with Mexico is particularly important for this species, given the apparently dynamic nature of geographical stock boundaries. Until these goals are accomplished, the management stock includes animals of both forms. For the Marine Mammal Protection Act (MMPA) stock assessment reports, Pacific white-sided dolphins within the Pacific U.S. Exclusive Economic Zone are divided into two discrete, non-contiguous areas: 1) waters off California, Oregon and Washington (this report), and 2) Alaskan waters. POPULATION SIZE The most recent estimates of abundance for Pacific white-sided dolphins are based on two summer/autumn shipboard surveys conducted within 300 nmi of the coasts of California, Oregon, and Washington in 2005 (Forney 2007) and 2008 (Barlow 2010). The distribution of Pacific white-sided dolphins throughout this region is highly variable, apparently in response to oceanographic changes on both seasonal and interannual time scales (Forney and Barlow 1998). As oceanographic conditions vary, Pacific white-sided dolphins may spend time outside the U.S. Exclusive Economic Zone, and therefore a multi-year average abundance estimate including California, Oregon and Washington is the most appropriate for management within U.S. waters. The 2005-2008 geometric mean abundance estimate for California, Oregon and Washington waters based on the two most recent ship surveys is 26,930 (CV=0.28) Pacific white-sided dolphins (Forney 2007, Barlow, 2010). Minimum Population Estimate The log-normal 20th percentile of the 2005-2008 average abundance estimate is 21,406 Pacific white-sided dolphins. Current Population Trend No long-term trends in the abundance of Pacific white-sided dolphins in California, Oregon and Washington are suggested based on historical and recent surveys (Dohl et al. 1980; 1983; Green et al. 1992; 1993; Barlow 1995; Forney et al. 1995, Barlow and Forney 2007, Forney 2007, Barlow 2010). CURRENT AND MAXIMUM NET PRODUCTIVITY RATES No information on current or maximum net productivity rates is available for Pacific white-sided dolphins off the U.S. west coast. POTENTIAL BIOLOGICAL REMOVAL The potential biological removal (PBR) level for this stock is calculated as the minimum population size (21,406) times one half the default maximum net growth rate for cetaceans (½ of 4%) times a recovery factor of 0.45 0.40 (for a species of unknown status with a mortality rate CV > 0.80 0.60 and ≤0.80; Wade and Angliss 1997), resulting in a PBR of 193 171 Pacific white-sided dolphins per year. HUMAN-CAUSED MORTALITY AND SERIOUS INJURY New Serious Injury Guidelines NMFS updated its serious injury designation and reporting process, which uses guidance from previous serious injury workshops, expert opinion, and analysis of historic injury cases to develop new criteria for distinguishing serious from non-serious injury (Angliss and DeMaster 1998, Andersen et al. 2008, NOAA 2012). NMFS defines serious injury as an “injury that is more likely than not to result in mortality”. Injury determinations for stock assessments revised in 2013 or later incorporate the new serious injury guidelines, based on the most recent 5-year period for which data are available. Fishery Information A summary of recent fishery mortality and injury for this stock of Pacific white-sided dolphin is shown in Table 1. More detailed information on these fisheries is provided in Appendix 1. Including mortality from drift gillnet, groundfish trawl, and unknown fisheries, the average annual fishery-related mortality of Pacific white-sided dolphins is 10.5 (CV=0.65) 11.8 (CV=0.88) animals. Mortality estimates for the California swordfish drift gillnet fishery are included for the five most recent years of monitoring,
61

2004-2008 2007-2011 (Carretta et al. 2005 Carretta and Enriquez 2006, 2007, 2009a, 2009b, 2010, 2012a, 2012b). Acoustic pinger use in the swordfish drift gillnet fishery appears to reduce bycatch rates of Pacific white-sided dolphins, but the reduction is not statistically significant, given the rarity of bycatch of this species (Carretta and Barlow 2011). Bycatch estimates for the U.S. west coast groundfish fleet are summarized by Jannot et al. (2011). Gillnets have been documented to entangle marine mammals off Baja California (Sosa-Nishizaki et al. 1993), but no recent bycatch data from Mexico are available. After the 1997 implementation of a Take Reduction Plan, which included skipper education workshops and required the use of pingers and minimum 6-fathom extenders, overall cetacean entanglement rates in the drift gillnet fishery dropped considerably (Barlow and Cameron 2003). However, because of interannual variability in entanglement rates and the relative rarity of Pacific white-sided dolphin entanglements, additional years of data will be required to fully evaluate the effectiveness of pingers for reducing mortality of this particular species. Drift gillnet fisheries for swordfish and sharks exist along the entire Pacific coast of Baja California, Mexico and may take animals from this population. Quantitative data are available only for the Mexican swordfish drift gillnet fishery, which uses vessels, gear, and operational procedures similar to those in the U.S. drift gillnet fishery, although nets may be up to 4.5 km long (Holts and Sosa-Nishizaki 1998). The fleet increased from two vessels in 1986 to 31 vessels in 1993 (Holts and Sosa-Nishizaki 1998). The total number of sets in this fishery in 1992 can be estimated from data provided by these authors to be approximately 2700, with an observed rate of marine mammal bycatch of 0.13 animals per set (10 marine mammals in 77 observed sets; Sosa-Nishizaki et al. 1993). This overall mortality rate is similar to that observed in California driftnet fisheries during 1990-95 (0.14 marine mammals per set; Julian and Beeson, 1998), but species-specific information is not available for the Mexican fisheries. Previous efforts to convert the Mexican swordfish driftnet fishery to a longline fishery have resulted in a mixed-fishery, with 20 vessels alternately using longlines or driftnets, 23 using driftnets only, 22 using longlines only, and seven with unknown gear type (Berdegué 2002). Table 1. Summary of available information on the incidental mortality and injury of Pacific white-sided dolphins (California/ Oregon/Washington Stock) in commercial fisheries that might take this species. All observed entanglements of Pacific white-sided dolphins resulted in the death of the animal. Coefficients of variation for mortality estimates are provided in parentheses; n/a = not available. Mean annual takes are based on 2004-2008 2007-2011 data unless noted otherwise.
Fishery Name
Data Type
Year(s)
Percent Observer Coverage
Observed Mortality
Estimated Annual Mortality
Mean Annual Takes (CV in parentheses)
CA/OR thresher shark/swordfish drift
gillnet fishery
observer
2004 2005 2006 2007 2008 2009 2010 2011
20.6% 20.9% 18.5% 16.4% 13.5% 13.0% 11.9% 19.5%
0 0 0 1 5 2 0 0
0 0 0
6 (1.00) 37 (0.70) 15 (1.02)
0 0
8.6 (0.77)
11.6 (0.88)
WA/OR/CA domestic groundfish trawl (At-sea processing Pacific hake
fishery).
observer
2002 2003 2004 2005 2006 2007 2008 2009
100% 100% 100% 100%
100% 98% 99% 99%
100%
0 1 0 0 0 0 0 0
0 1 (n/a)
0 0 0 0 0 0
0.2 n/a)
0
West Coast limited entry bottom trawl fishery observer
2002 2003 2004 2005 2006 2007 2008 2009
10-33%, varies by reporting area
18 – 23%
1 in 2003
0
7.5 (0.93)
0
1.9 (0.93)
0
62

Fishery Name
Data Type
Year(s)
Percent Observer Coverage
Observed Mortality
Estimated Annual Mortality
Mean Annual Takes (CV in parentheses)
Unknown fishery stranding
2004 2005 2006 2007 2008 2009 2010 2011
1 0 0 1 0 0 0 0
n/a 0.2 (n/a)
Minimum total annual takes 10.5 (0.65)
11.8 (0.88)
Low levels of mortality for Pacific white-sided dolphins have also been documented in the California/Oregon/Washington domestic groundfish trawl fisheries (Perez and Loughlin 1991; Northwest Fisheries Science Center 2008). Between 2004-2008, with 100% of the fishing effort observed, one Pacific white-sided dolphin was reported killed in the at-sea processing portion of the Pacific whiting trawl fishery (NMFS,unpublished data). One white-sided dolphin death was reported in the limited entry bottom trawl fishery in 2003, resulting in a bycatch estimate of 7.5 animals (Table 1). Other removals In 2008, fifteen Pacific white-sided dolphin were incidentally killed in California waters during scientific sardine trawling operations conducted by NMFS (Southwest Regional Office Stranding Program, unpublished data). Three mortality events occurred in April trawls, after which NMFS scientists met to discuss & implement a mitigation plan to avoid future mortality events. The initial mitigation plan included use of 162 dB acoustic pingers, a marine mammal watch, and scheduling trawls to occur when the ship first arrived on station to avoid attracting animals to a stationary vessel. During August 2008 trawls, twelve additional Pacific white-sided dolphin were killed. One trawl caught 11 Pacific white-sided dolphins and six northern right whale dolphins. In 2009, a marine mammal excluder device was added to the trawls. In 2009, no additional mortality was observed during 42 trawls. However, a group of three Pacific white-sided dolphin became entangled in the trawl during retrieval. Two animals were brought aboard alive and immediately released, while a third animal escaped through the excluder device. Eight additional Pacific white-sided dolphins were killed in research surface trawls between 2005 and 2006 (NMFS Northwest Region, unpublished data). Pacific white-sided dolphins have been seriously injured and killed in scientific research trawls for sardines and rockfish. From 2007 through 2011, there were 26 deaths and 4 serious injuries of Pacific white-sided dolphins in scientific research trawls (Carretta et al. 2013). The average annual research-related mortality of Pacific white-sided dolphin from 2004 to 2008 2007-2011 is 4.6 6.0 animals. Additional removals of Pacific white-sided dolphins from the wild have occurred in live-capture fisheries off California. Brownell et al. (1999) estimate a minimum total live capture of 128 Pacific white-sided dolphins between the late 1950s and 1993. The most recent capture was in November 1993, when three animals were taken for public display (Forney 1994). No MMPA permits are currently active for live-captures of Pacific white-sided dolphins. STATUS OF STOCK The status of Pacific white-sided dolphins in California, Oregon and Washington relative to OSP is not known, and there is no indication of a trend in abundance for this stock. No habitat issues are known to be of concern for this species. They are not listed as "threatened" or "endangered" under the Endangered Species Act nor as "depleted" under the MMPA. Including commercial fishery (10.5/yr) (11.8/yr) and research-related mortality (4.6/yr 6.0/yr), the average annual mortality for the 5-year period 2004-2008 2007-2011is 15.1 17.8animals. The average annual human-caused mortality in 2004-2008 2007-2011 (15.1 17.8animals) is estimated to be less than the PBR (193 171), and therefore they are not classified as a "strategic" stock under the MMPA. The total commercial fishery mortality and serious injury for this stock (11.8/yr) is less than 10% of the calculated PBR and, therefore, can be is considered to be insignificant and approaching zero mortality and serious injury rate. Including research-related takes, annual mortality of
63

this stock (17.8/yr) exceeds 10% of the calculated PBR, but under Section 118 of the MMPA, only commercial takes are evaluated against the zero mortality rate goal (ZMRG). REFERENCES Andersen, M. S., K. A. Forney, T. V. N. Cole, T. Eagle, R. Angliss, K. Long, L. Barre, L. Van Atta, D.
Borggaard, T. Rowles, B. Norberg, J. Whaley, and L. Engleby. 2008. Differentiating Serious and Non-Serious Injury of Marine Mammals: Report of the Serious Injury Technical Workshop, 10-13 September 2007, Seattle, Washington. U.S. Dep. Commer., NOAA Tech. Memo. NMFS-OPR-39. 94 p.
Angliss, R.P. and D.P. DeMaster. 1998. Differentiating Serious and Non-Serious Injury of Marine Mammals Taken Incidental to Commercial Fishing Operations. NOAA Tech Memo. NMFS-OPR-13, 48 p.
Barlow, J. 2010. Cetacean abundance in the California Current from a 2008 ship-based line-transect survey. NOAA Technical Memorandum, NMFS, NOAA-TM-NMFS-SWFSC-456.
Barlow, J. 1995. The abundance of cetaceans in California waters. Part I: Ship surveys in summer and fall of 1991. Fish. Bull. 93:1-14.
Barlow, J. and G. A. Cameron. 2003. Field experiments show that acoustic pingers reduce marine mammal bycatch in the California drift gillnet fishery. Marine Mammal Science 19(2):265-283.
Barlow, J. and K.A. Forney. 2007. Abundance and population density of cetaceans in the California Current ecosystem. Fishery Bulletin 105:509-526.
Berdegué, J. 2002. Depredación de las especies pelágicas reservadas a la pesca deportiva y especies en peligro de extinción con uso indiscriminado de artes de pesca no selectivas (palangres, FAD's, trampas para peces y redes de agallar fijas y a la deriva) por la flota palangrera Mexicana. Fundación para la conservación de los picudos. A.C. Mazatlán, Sinaloa, 21 de septiembre.
Brownell, R. L., Jr., W. A. Walker and K. A. Forney. 1999. Pacific white-sided dolphin, Lagenorhynchus obliquidens Gill, 1865. Pages 57-84 In: Ridgway, S. H. and R. Harrison (eds.), Handbook of Marine Mammals, Vol. 6. Academic Press, San Diego.
Carretta, J.V. and L. Enriquez. 2009a. Marine mammal and seabird bycatch observed in California commercial fisheries in 2007. Administrative Report LJ-09-01, available from Southwest Fisheries Science Center, 3333 North Torrey Pines Rd., La Jolla, CA 92037. 12 p.
Carretta, J.V. and L. Enriquez. 2009b. Marine mammal bycatch observed in the California/Oregon swordfish and thresher shark drift gillnet fishery in 2008. Administrative Report LJ-09-03, available from Southwest Fisheries Science Center, 3333 North Torrey Pines Rd., La Jolla, CA 92037. 10p.
Carretta, J.V. and L. Enriquez. 2010. Marine Mammal and Sea Turtle Bycatch in the California/Oregon Sworfish and Thresher Shark Drift Gillnet Fishery in 2009. Southwest Fisheries Science Center, NOAA Fisheries Administrative Report LJ-10-03. 11p.
Carretta, J.V. and J. Barlow. 2011. Long-term effectiveness, failure rates, and “dinner bell” properties of acoustic pingers in a gillnet fishery. Marine Technology Society Journal 45:7-19.
Carretta, J.V. and L. Enriquez. 2012a. Marine mammal and seabird bycatch in California gillnet fisheries in 2010. Southwest Fisheries Science Center Administrative Report LJ-12-01. 14p.
Carretta, J.V. and L. Enriquez. 2012b. Marine mammal and seabird bycatch in California gillnet fisheries in 2011. NOAA Technical Memorandum NOAA-TM-NMFS-SWFSC-500. 14 p.
Carretta, J. V., S. M. Wilkin, M. M. Muto, and K. Wilkinson. 2013. Sources of human-related injury and mortality for U.S. Pacific west coast marine mammal stock assessments, 2007-2011. U.S. Dep. Commer., NOAA Tech. Memo. NMFS-SWFSC-514, 83 p.
Carretta, J.V. and L. Enriquez. 2007. Marine mammal and sea turtle bycatch in the California/Oregon thresher shark and swordfish drift gillnet fishery in 2006. Administrative Report LJ-07-06, available from Southwest Fisheries Science Center, 8604 La Jolla Shores Drive, La Jolla, CA 92037. 9p.
Carretta, J.V. and L. Enriquez. 2006. Marine mammal bycatch and estimated mortality in California commercial fisheries during 2005. Administrative Report LJ-06-07, available from Southwest Fisheries Science Center, 8604 La Jolla Shores Drive, La Jolla, CA 92037. 14p.
Carretta, J.V., S.J. Chivers, and K. Danil. 2005. Preliminary estimates of marine mammal bycatch, mortality, and biological sampling of cetaceans in California gillnet fisheries for 2004.
64

Administrative Report LJ-05-10, available from Southwest Fisheries Science Center, 8604 La Jolla Shores Drive, La Jolla, California, 92037. 17 p.
Chivers, S. J., K. M. Peltier, W. T. Norman, P. A. Akin, and J. Heyning. 1993. Population structure of cetaceans in California coastal waters. Paper SOCCS9 presented at the Status of California Cetacean Stocks Workshop, held in La Jolla, California, March 31-April 2, 1993. 49p.
Dohl, T. P., R. C. Guess, M. L. Duman, and R. C. Helm. 1983. Cetaceans of central and northern California, 1980-1983: Status, abundance and distribution. OCS Study MMS 84-0045. Minerals Management Service Contract # 14-12-0001-29090. 284p.
Dohl, T. P., K. S. Norris, R. C. Guess, J. D. Bryant, and M. W. Honig. 1980. Summary of marine mammal and seabird surveys of the Southern California Bight area, 1975-1978. Part II. Cetacea of the Southern California Bight. Final Report to the Bureau of Land Management, NTIS Rep. No. PB81248189. 414p.
Forney, K. A. 1994. Recent information on the status of odontocetes in Californian waters. U.S. Dep. Commer., NOAA Tech. Memo. NMFS-SWFSC-202. 87 pp.
Forney, K. A. 1997. Patterns of variability and environmental models of relative abundance for California cetaceans. Ph.D. dissertation, Scripps Institution of Oceanography, University of California, San Diego.
Forney, K. A. and J. Barlow. 1998. Seasonal patterns in the abundance and distribution of California cetaceans, 1991-92. Mar. Mamm. Sci. 14:460-489.
Forney, K. A., J. Barlow and J. V. Carretta. 1995. The abundance of cetaceans in California waters. Part II: Aerial surveys in winter and spring of 1991 and 1992. Fish. Bull. 93:15-26.
Forney, K.A. 2007. Preliminary estimates of cetacean abundance along the U.S. west coast and within four National Marine Sanctuaries during 2005. U.S. Department of Commerce, NOAA Technical Memorandum NMFS-SWFSC-406. 27p.
Green, G., J. J. Brueggeman, R. A. Grotefendt, C. E. Bowlby, M. L. Bonnell, and K. C. Balcomb, III. 1992. Cetacean distribution and abundance off Oregon and Washington. Ch. 1. In: Oregon and Washington Marine Mammal and Seabird Surveys. OCS Study 91-0093. Final Report prepared for Pacific OCS Region, Minerals Management Service, U.S. Department of the Interior, Los Angeles, California.
Green, G., R. A. Grotefendt, M. A. Smultea, C. E. Bowlby, and R. A. Rowlett. 1993. Delphinid aerial surveys in Oregon and Washington waters. Final Report prepared for NMFS, National Marine Mammal Laboratory, 7600 Sand Point Way, NE, Seattle, Washington, 98115, Contract #50ABNF200058.
Holts, D. and O. Sosa-Nishizaki. 1998. Swordfish, Xiphias gladius, fisheries of the eastern North Pacific Ocean. In: I. Barrett, O. Sosa-Nishizaki and N. Bartoo (eds.). Biology and fisheries of swordfish, Xiphias gladius. Papers from the International Symposium on Pacific Swordfish, Ensenada Mexico, 11-14 December 1994. U.S. Dep. Commer., NOAA Tech. Rep. NMFS 142. 276 pp.
Julian, F. and M. Beeson. 1998. Estimates of mammal, turtle and bird mortality for two California gillnet fisheries: 1990-1995. Fish. Bull. 96:271-284.
Jannot, J., Heery, E., Bellman, M.A., and J. Majewski. 2011. Estimated bycatch of marine mammals, seabirds, and sea turtles in the US west coast commercial groundfish fishery, 2002-2009. West Coast Groundfish Observer Program. National Marine Fisheries Service, NWFSC, 2725 Montlake Blvd E., Seattle, WA 98112.
Lux, C. A., A. S. Costa, and A. E. Dizon. 1997. Mitochondrial DNA population structure of the Pacific white-sided dolphin. Rep. Int. Whaling. Commn. 47:645-652.
NMFS. 2005. Revisions to Guidelines for Assessing Marine Mammal Stocks. 24 pp. Available at: http://www.nmfs.noaa.gov/pr/pdfs/sars/gamms2005.pdf
NOAA. 2012. Federal Register 77:3233. National Policy for Distinguishing Serious From Non-Serious Injuries of Marine Mammals. http://www.nmfs.noaa.gov/op/pds/documents/02/238/02-238-01.pdf
Northwest Fisheries Science Center, NOAA Fisheries. 2008. Report on the bycatch of marine mammals and seabirds by the U.S. West Coast Groundfish Fleet. Northwest Fisheries Science Center, At-sea Hake Observer Program, West Coast Groundfish Observer Program. 34p.
Perez, M. A. and T. R. Loughlin. 1991. Incidental catch of marine mammals by foreign and joint venture trawl vessels in the U.S. EEZ of the North Pacific, 1973-88. NOAA Tech. Rep. NMFS 104. 57 pp.
65

Perez, M. A. (in prep). Summary of marine mammal incidental catch data for domestic and joint venture groundfish fisheries in the U.S. EEZ of the North Pacific, 1989-2001. NOAA Tech. Memo.
Sosa-Nishizaki, O., R. De la Rosa Pacheco, R. Castro Longoria, M. Grijalva Chon, and J. De la Rosa Velez. 1993. Estudio biologico pesquero del pez (Xiphias gladius) y otras especies de picudos (marlins y pez vela). Rep. Int. CICESE, CTECT9306.
Wade, P. R. and R. P. Angliss. 1997. Guidelines for Assessing Marine Mammal Stocks: Report of the GAMMS Workshop April 3-5, 1996, Seattle, Washington. U. S. Dep. Commer., NOAA Tech. Memo. NMFS-OPR-12. 93 pp.
Walker, W. A., S. Leatherwood, K. R. Goodrich, W. F. Perrin and R. K. Stroud. 1986. Geographical variation and biology of the Pacific white-sided dolphin, Lagenorhynchus obliquidens, in the north-eastern Pacific. In: Bryden, M. M. and R. Harrison (eds.), Research on Dolphins, p. 441-465. Clarendon Press, Oxford.
66

Revised 01/15/2011 9/24/2013 COMMON BOTTLENOSE DOLPHIN (Tursiops truncatus truncatus):
California/Oregon/Washington Offshore Stock STOCK DEFINITION AND GEOGRAPHIC RANGE
Bottlenose dolphins are distributed world-wide in tropical and warm-temperate waters. In many regions, including California, separate coastal and offshore populations are known (Walker 1981; Ross and Cockcroft 1990; Van Waerebeek et al. 1990; Lowther 2006; Lowther et al. in prep.). On surveys conducted off California, offshore bottlenose dolphins have been found at distances greater than a few kilometers from the mainland and throughout the Southern California Bight. They have also been documented in offshore waters as far north as about 41oN (Figure 1), and they may range into Oregon and Washington waters during warm-water periods. Sighting records off California and Baja California (Lee 1993; Mangels and Gerrodette 1994) suggest that offshore bottlenose dolphins have a continuous distribution in these two regions. Based on aerial surveys conducted during winter/spring 1991-92 (Forney et al. 1995) and shipboard surveys conducted in summer/fall 1991 (Barlow 1995), no seasonality in distribution is apparent (Forney and Barlow 1998). Offshore bottlenose dolphins are not restricted to U.S. waters, but cooperative management agreements with Mexico exist only for the tuna purse seine fishery and not for other fisheries which may take this species (e.g. gillnet fisheries). Therefore, the management stock includes only animals found within U.S. waters. For the Marine Mammal Protection Act (MMPA) stock assessment reports, bottlenose dolphins within the Pacific U.S. Exclusive Economic Zone are divided into three stocks: 1) California coastal stock, 2) California, Oregon and Washington offshore stock (this report), and 3) Hawaiian stock. POPULATION SIZE The most recent shipboard surveys conducted within 300 nmi of the coasts of California, Oregon, and Washington were in 2005 (Forney 2007) and 2008 (Barlow 2010). Because the distribution of bottlenose dolphins appears to vary interannually and they may spend time outside the U.S. Exclusive Economic Zone, a multi-year average abundance estimate is the most appropriate for management within U.S. waters. The most comprehensive multi-year average abundance is the geometric mean abundance estimate for California, Oregon and Washington waters based on the 2005 and 2008 ship surveys, or 1,006 (CV=0.48) offshore bottlenose dolphins (Forney 2007, Barlow 2010).
Figure 1. Offshore bottlenose dolphin sightings based on shipboard surveys off California, Oregon, and Washington, 1991-2008 (see Appendix 2 for data sources and information on timing and location of survey effort). Dashed line represents the U.S. EEZ, thin lines indicate completed transect effort of all surveys combined.
67

Minimum Population Estimate The log-normal 20th percentile of the 2005-2008 average abundance estimate is 684 offshore bottlenose dolphins. Current Population Trend No information on trends in abundance of offshore bottlenose dolphins is available. CURRENT AND MAXIMUM NET PRODUCTIVITY RATES No information on current or maximum net productivity rates is available for this population of offshore bottlenose dolphins. POTENTIAL BIOLOGICAL REMOVAL The potential biological removal (PBR) level for this stock is calculated as the minimum population size (684) times one half the default maximum net growth rate for cetaceans (½ of 4%) times a recovery factor of 0.40 (for a species of unknown status with an unknown fishery mortality CV>0.80; Wade and Angliss 1997), resulting in a PBR of 5.5 offshore bottlenose dolphins per year. HUMAN-CAUSED MORTALITY AND SERIOUS INJURY New Serious Injury Guidelines NMFS updated its serious injury designation and reporting process, which uses guidance from previous serious injury workshops, expert opinion, and analysis of historic injury cases to develop new criteria for distinguishing serious from non-serious injury (Angliss and DeMaster 1998, Andersen et al. 2008, NOAA 2012). NMFS defines serious injury as an “injury that is more likely than not to result in mortality”. Injury determinations for stock assessments revised in 2013 or later incorporate the new serious injury guidelines, based on the most recent 5-year period for which data are available. Fishery Information A summary of known fishery mortality and serious injury for this stock of bottlenose dolphin is shown in Table 1. During 2007-2011, two offshore stock bottlenose dolphins were seriously injured in commercial fishing gear (Jannot et al. 2011, Carretta et al. 2013) and one was killed in commercial fishing gear (Carretta and Enriquez 2012). The fisheries involved included sablefish fixed longline gear (Jannot et al. 2011), the California swordfish drift gillnet fishery (Carretta and Enriquez 2012), and a stranding record from an unknown fishery interaction (Carretta et al. 2013). Bottlenose dolphins are rarely observed entangled in the California swordfish drift gillnet fishery and potential reductions in bycatch resulting from acoustic pinger use in this fishery are unknown, due to small sample sizes (Barlow and Cameron 2003, Carretta and Barlow 2011). The average annual fishery-related serious injury and mortality of offshore stock bottlenose dolphins for the period 2007-2011 is ≥ 2.0 animals/yr (Table 1). More detailed information on these fisheries is provided in Appendix 1. Mortality estimates for the California drift gillnet fishery are included for the five most recent years of monitoring, 2004-2008 (Carretta et al. 2005, Carretta and Enriquez 2006, 2007, 2009a, 2009b). After the 1997 implementation of a Take Reduction Plan, which included skipper education workshops and required the use of pingers and minimum 6-fathom extenders, overall cetacean entanglement rates in the drift gillnet fishery dropped considerably (Barlow and Cameron 2003). However, because of interannual variability in entanglement rates and the rarity of bottlenose dolphin entanglements, additional years of data will be required to fully evaluate the effectiveness of pingers for reducing mortality of this particular species. In 2004, a bottlenose dolphin stranded dead near Newport Beach, California, with its flukes cut off, suggestive of an interaction with an entangling net fishery. The haplotype of this animal matched those of known offshore bottlenose dolphins (Lowther 2006, Lowther et al., in prep). Mean annual takes in Table 1 are based on 2004-2008 data. This results in an average estimate of 0.2 offshore bottlenose dolphins taken annually.
Drift gillnet fisheries for swordfish and sharks exist along the entire Pacific coast of Baja California, Mexico and may take animals from this population. Quantitative data are available only for the Mexican swordfish drift gillnet fishery, which uses vessels, gear, and operational procedures similar to those in the U.S. drift gillnet fishery, although nets may be up to 4.5 km long (Holts and Sosa-Nishizaki 1998). The fleet increased from two vessels in 1986 to 31 vessels in 1993 (Holts and Sosa-Nishizaki 1998). The total number of sets in this fishery in 1992 can be estimated from data provided by these authors to be
68

approximately 2700, with an observed rate of marine mammal bycatch of 0.13 animals per set (10 marine mammals in 77 observed sets; Sosa-Nishizaki et al. 1993). This overall mortality rate is similar to that observed in California driftnet fisheries during 1990-95 (0.14 marine mammals per set; Julian and Beeson, 1998), but species-specific information is not available for the Mexican fisheries. Previous efforts to convert the Mexican swordfish driftnet fishery to a longline fishery have resulted in a mixed-fishery, with 20 vessels alternately using longlines or driftnets, 23 using driftnets only, 22 using longlines only, and seven with unknown gear type (Berdegué 2002). Gillnets have been documented to entangle marine mammals off Baja California (Sosa-Nishizaki et al. 1993), but no recent bycatch data from Mexico are available. Table 1. Summary of available information on the incidental mortality and injury of bottlenose dolphins (California/ Oregon/Washington Offshore Stock) in commercial fisheries that might take this species. Mean annual takes are based on 2004-2008 2007-2011 data unless noted otherwise (Carretta and Enriquez 2009a, 2009b, 2010, 2012a, 2012b, Jannot et al. 2011).
Fishery Name
Data Type
Year(s)
Percent Observer Coverage
Observed Mortality (and
Serious Injury)
Estimated Annual Mortality and
Serious Injury (CV)
Mean Annual Takes (CV in parentheses)
CA/OR thresher shark/swordfish drift
gillnet fishery
observer
2004 2005 2006 2007 2008 2009 2010 2011
20.6% 20.9% 18.5% 16.4% 13.5% 13.3% 11.9% 18.8%
0 0 0 0 0 0 1 0
0 0 0 0 0 0
8 (0.96) 0
0
1.6 (0.96)
California halibut and white seabass set gillnet
observer 2007 2010 2011
17.8% 12.5%
8%
0 0 0
0 0
California yellowtail, barracuda, and white seabass drift gillnet
fishery
observer
2010 2011
5.0% 3.3%
0 0
0
0
CA lobster trap/pot At-sea
disentanglement 2008 n/a 0 (1) 1 (n/a) 0.2 (n/a)
Sablefish offshore fixed gear
At-sea disentanglement
2005 2006 2007 2008 2009
0.5% 1.5% 3.4% 1.5% 2.4%
0 0 0 0
0 (1)
1 (n/a)* 0.2 (n/a)
Unknown fishery strandings 2004-2008 1 ≥1 ≥0.2 (n/a)
Minimum total annual takes ≥0.2 (n/a)
≥2.0 (0.96)
*No estimate of bycatch was derived from the one observation of a bottlenose dolphin released injured from sablefish gear (Jannot et al. 2009). Offshore bottlenose dolphins are often associated with Risso's dolphins and pilot whales, for which mortality has been documented in the squid purse seine fishery off Southern California (Heyning et al. 1994). Based on this association, offshore bottlenose dolphins may also have experienced some mortality in this fishery. However these would probably represent animals killed intentionally to protect catch or gear, rather than incidental kills, and such intentional takes are now illegal under the 1994 Amendment to the MMPA. Other removals Twenty-seven bottlenose dolphins were captured off California between 1966 and 1982 (Walker 1975; Reeves and Leatherwood 1984). Based on the locations of capture activities, these animals probably were offshore bottlenose dolphins (Walker 1975). No additional captures of bottlenose dolphins off
69

California have been documented since 1982, and no MMPA live-capture permits are currently active for this species. STATUS OF STOCK The status of offshore bottlenose dolphins in California relative to OSP is not known, and there are insufficient data to evaluate trends in abundance. No habitat issues are known to be of concern for this species. They are not listed as "threatened" or "endangered" under the Endangered Species Act nor as "depleted" under the MMPA. Because average annual fishery takes (0.2/year 2.0/yr) are less than the calculated PBR (5.5), offshore bottlenose dolphins are not classified as a "strategic" stock under the MMPA. The total fishery mortality and serious injury for this stock is less greater than 10% of the PBR and thus can cannot be considered to be insignificant and approaching zero. REFERENCES Andersen, M. S., K. A. Forney, T. V. N. Cole, T. Eagle, R. Angliss, K. Long, L. Barre, L. Van Atta, D.
Borggaard, T. Rowles, B. Norberg, J. Whaley, and L. Engleby. 2008. Differentiating Serious and Non-Serious Injury of Marine Mammals: Report of the Serious Injury Technical Workshop, 10-13 September 2007, Seattle, Washington. U.S. Dep. Commer., NOAA Tech. Memo. NMFS-OPR-39. 94 p.
Angliss, R.P. and D.P. DeMaster. 1998. Differentiating Serious and Non-Serious Injury of Marine Mammals Taken Incidental to Commercial Fishing Operations. NOAA Tech Memo. NMFS-OPR-13, 48 p.
Barlow, J. 2010. Cetacean abundance in the California Current from a 2008 ship-based line-transect survey. NOAA Technical Memorandum, NMFS, NOAA-TM-NMFS-SWFSC-456. 19 p.
Barlow, J. 1995. The abundance of cetaceans in California waters. Part I: Ship surveys in summer and fall of 1991. Fish. Bull. 93:1-14.
Barlow, J. and G. A. Cameron. 2003. Field experiments show that acoustic pingers reduce marine mammal bycatch in the California drift gillnet fishery. Marine Mammal Science 19(2):265-283.
Berdegué, J. 2002. Depredación de las especies pelágicas reservadas a la pesca deportiva y especies en peligro de extinción con uso indiscriminado de artes de pesca no selectivas (palangres, FAD's, trampas para peces y redes de agallar fijas y a la deriva) por la flota palangrera Mexicana. Fundación para la conservación de los picudos. A.C. Mazatlán, Sinaloa, 21 de septiembre.
Carretta, J. V., S. M. Wilkin, M. M. Muto, and K. Wilkinson. 2013. Sources of human-related injury and mortality for U.S. Pacific west coast marine mammal stock assessments, 2007-2011. U.S. Dep. Commer., NOAA Tech. Memo. NMFS-SWFSC-514, 83 p.
Carretta, J.V. and L. Enriquez. 2012a. Marine mammal and seabird bycatch in California gillnet fisheries in 2010. Southwest Fisheries Science Center Administrative Report LJ-12-01. 14p.
Carretta, J.V. and L. Enriquez. 2012b. Marine mammal and seabird bycatch in California gillnet fisheries in 2011. NOAA Technical Memorandum NOAA-TM-NMFS-SWFSC-500. 14 p.
Carretta, J.V. and J. Barlow. 2011. Long-term effectiveness, failure rates, and “dinner bell” properties of acoustic pingers in a gillnet fishery. Marine Technology Society Journal 45:7-19.
Carretta, J.V. and L. Enriquez. 2010. Marine Mammal and Sea Turtle Bycatch in the California/Oregon Sworfish and Thresher Shark Drift Gillnet Fishery in 2009. Southwest Fisheries Science Center, NOAA Fisheries Administrative Report LJ-10-03. 11p.
Carretta, J.V. and L. Enriquez. 2009a. Marine mammal and seabird bycatch observed in California commercial fisheries in 2007. Administrative Report LJ-09-01, available from Southwest Fisheries Science Center, 3333 North Torrey Pines Rd., La Jolla, CA 92037. 12 p.
Carretta, J.V. and L. Enriquez. 2009b. Marine mammal bycatch observed in the California/Oregon swordfish and thresher shark drift gillnet fishery in 2008. Administrative Report LJ-09-03, available from Southwest Fisheries Science Center, 3333 North Torrey Pines Rd., La Jolla, CA 92037. 10 p.
Carretta, J.V. and L. Enriquez. 2007. Marine mammal and sea turtle bycatch in the California/Oregon thresher shark and swordfish drift gillnet fishery in 2006. Administrative Report LJ-07-06, available from Southwest Fisheries Science Center, 8604 La Jolla Shores Drive, La Jolla, CA 92037. 9p.
70

Carretta, J.V. and L. Enriquez. 2006. Marine mammal bycatch and estimated mortality in California commercial fisheries during 2005. Administrative Report LJ-06-07, available from Southwest Fisheries Science Center, 8604 La Jolla Shores Drive, La Jolla, CA 92037. 14p.
Carretta, J.V., S.J. Chivers, and K. Danil. 2005. Preliminary estimates of marine mammal bycatch, mortality, and biological sampling of cetaceans in California gillnet fisheries for 2004. Administrative Report LJ-05-10, available from Southwest Fisheries Science Center, 8604 La Jolla Shores Drive, La Jolla, California, 92037. 17 p.
Forney, K. A., J. Barlow and J. V. Carretta. 1995. The abundance of cetaceans in California waters. Part II: Aerial surveys in winter and spring of 1991 and 1992. Fish. Bull. 93:15-26.
Forney, K.A. 2007. Preliminary estimates of cetacean abundance along the U.S. west coast and within four National Marine Sanctuaries during 2005. U.S. Department of Commerce, NOAA Technical Memorandum NMFS-SWFSC-406. 27 p.
Heyning, J. E., T. D. Lewis and C. D. Woodhouse. 1994. A note on odontocete mortality from fishing gear entanglements off Southern California. Rep. Int. Whal. Commn. Special Issue 15:439-442.
Holts, D. and O. Sosa-Nishizaki. 1998. Swordfish, Xiphias gladius, fisheries of the eastern North Pacific Ocean. In: I. Barrett, O. Sosa-Nishizaki and N. Bartoo (eds.). Biology and fisheries of swordfish, Xiphias gladius. Papers from the International Symposium on Pacific Swordfish, Ensenada Mexico, 11-14 December 1994. U.S. Dep. Commer., NOAA Tech. Rep. NMFS 142, 276 p.
Jannot, J., Heery, E., Bellman, M.A., and J. Majewski. 2011. Estimated bycatch of marine mammals, seabirds, and sea turtles in the US west coast commercial groundfish fishery, 2002-2009. West Coast Groundfish Observer Program. National Marine Fisheries Service, NWFSC, 2725 Montlake Blvd E., Seattle, WA 98112.
Julian, F. 1997. Cetacean mortality in California gill net fisheries: Preliminary estimates for 1996. Paper SC/49/SM02 presented to the International Whaling Commission, September 1997 (unpublished). 13 pp.
Julian, F. and M. Beeson. 1998. Estimates of mammal, turtle and bird mortality for two California gillnet fisheries: 1990-1995. Fish. Bull. 96:271-284.
Lee, T. 1993. Summary of cetacean survey data collected between the years of 1974 and 1985. U.S. Dep. Commer., NOAA Tech. Memo. NMFS-SWFSC-181. 184 pp.
Lowther, J. 2006. Genetic variation of coastal and offshore bottlenose dolphins, Tursiops truncatus, in the eastern North Pacific Ocean. M.S. Thesis, University of San Diego, San Diego, California, USA. 126 p.
Lowther, J.L., F.I. Archer, and D.W. Weller. Manuscript in preparation. Genetic variation of coastal and offshore bottlenose dolphins, Tursiops truncatus, in the eastern North Pacific Ocean.
Mangels, K. F. and Gerrodette, T. 1994. Report of cetacean sightings during a marine mammal survey in the eastern Pacific Ocean and Gulf of California aboard the NOAA ships McARTHUR and DAVID STARR JORDAN July 28 - November 6, 1993. NOAA Tech. Memo. NMFS, NMFS-SWFSC-211. 88 pp.
NOAA. 2012. Federal Register 77:3233. National Policy for Distinguishing Serious From Non-Serious Injuries of Marine Mammals. http://www.nmfs.noaa.gov/op/pds/documents/02/238/02-238-01.pdf
Reeves, R. R. and S. Leatherwood. 1984. Live-capture fisheries for cetaceans in USA and Canadian waters, 1973-1982. Rep. Int. Whal. Commn. 34:497-507.
Ross, G. J. B. and V. G. Cockcroft. 1990. Comments on Australian bottlenose dolphins and the taxonomic status of Tursiops aduncus (Ehrenberg, 1832). In: The Bottlenose Dolphin (eds. S. Leatherwood and R. R. Reeves). pp. 101-128. Academic Press, 653pp.
Sosa-Nishizaki, O., R. De la Rosa Pacheco, R. Castro Longoria, M. Grijalva Chon, and J. De la Rosa Velez. 1993. Estudio biologico pesquero del pez (Xiphias gladius) y otras especies de picudos (marlins y pez vela). Rep. Int. CICESE, CTECT9306.
Van Waerebeek, K., J. C. Reyes, A. J. Read, and J. S. McKinnon. 1990. Preliminary observations of bottlenose dolphins from the Pacific coast of South America. In: The Bottlenose Dolphin (eds. S. Leatherwood and R. R. Reeves). pp. 143-154 Academic Press, 653 pp.
Walker, W. A. 1975. Review of the live-capture fishery for smaller cetaceans taken in Southern California waters for public display, 1966-77. J. Fish. Res. Board. Can. 32:1197-1211.
Walker, W. A. 1981. Geographical variation in morphology and biology of bottlenose dolphins (Tursiops) in the eastern North Pacific. Admin. Rep. LJ-81-03C. Southwest Fisheries Science Center, National Marine Fisheries Service, La Jolla, CA 92038. 52p.
71

Wade, P. R. and R. P. Angliss. 1997. Guidelines for Assessing Marine Mammal Stocks: Report of the GAMMS Workshop April 3-5, 1996, Seattle, Washington. U. S. Dep. Commer., NOAA Tech. Memo. NMFS-OPR-12. 93 pp.
72

Revised 12/10/2012 9/24/2013 KILLER WHALE (Orcinus orca):
Eastern North Pacific Southern Resident Stock STOCK DEFINITION AND GEOGRAPHIC RANGE Killer whales have been observed in all oceans and seas of the world (Leatherwood and Dahlheim 1978). Although reported from tropical and offshore waters, killer whales prefer colder waters of both hemispheres, with greatest abundances found within 800 km of major continents (Mitchell 1975). Killer whales have a cosmopolitan distribution, ranging from equatorial waters to polar regions, with highest densities found in coastal temperate waters (Forney and Wade 2006). Along the west coast of North America, killer whales occur along the entire Alaskan coast as far north as Barrow (George et al. 1994, Lowry et al. 1987, Clarke et al. 2013), in British Columbia and Washington inland waterways (Bigg et al. 1990), and along the outer coasts of Washington, Oregon, and California (Green et al. 1992; Barlow 1995, 1997; Forney et al. 1995 Barlow and Forney 2007). Seasonal and year-round occurrence has been noted for killer whales throughout Alaska (Braham and Dahlheim 1982) and in the intra-coastal waterways of British Columbia and Washington State, where pods have been labeled as ‘resident,’ ‘transient,’ and ‘offshore’ (Bigg et al. 1990, Ford et al. 1994) based on aspects of morphology, ecology, genetics, and behavior (Ford and Fisher 1982, Baird and Stacey 1988, Baird et al. 1992, Hoelzel et al. 1998). Through examination of photographs of recognizable individuals and pods, movements of whales between geographical areas have been documented. For example, whales identified in Prince William Sound and Kodiak Island have been observed near Kodiak Island (Matkin et al. 1999) and whales identified in Southeast Alaska have been observed in Prince William Sound, British Columbia, and Puget Sound (Leatherwood et al. 1990, Dahlheim et al. 1997). Studies on mtDNA restriction patterns Genetic studies provide evidence that the ‘resident’ and ‘transient’ types are genetically distinct (Stevens et al. 1989, Hoelzel 1991, Hoelzel and Dover 1991, Hoelzel et al. 1998, Morin et al. 2010). Analyses of complete mitochondrial genomes indicates that transient killer whales should be recognized as a separate species, and that, pending additional data, resident killer whales should be recognized as a separate subspecies (Morin et al. 2010). The genetic data results support previous line of evidence for separation of the transient and resident ecotypes, including differences in 1) acoustic dialects; 2) skull features; 3) morphology; 4) feeding specializations; and 5) a lack of interbreeding between the two sympatric ecotypes (Krahn et al. 2004). Analysis of 73 samples collected from eastern North Pacific killer whales from California to Alaska has demonstrated significant genetic differences among ‘transient’ whales from California through Alaska, ‘resident’ whales from the inland waters of Washington, and ‘resident’ whales ranging from British Columbia to the Aleutian Islands and Bering Sea (Hoelzel et al. 1998). However, low genetic diversity throughout this species world-wide distribution has hampered efforts to clarify its taxonomy. At an international symposium in cetacean systematics in May 2004, a workshop was held to review the taxonomy of killer whales. A majority of invited experts felt that the Resident- and Transient-type whales in the eastern North Pacific probably merited species or subspecies status (Reeves et al. 2004). Krahn et al. (2004) summarized additional lines of evidence supporting subspecies status of resident and transient killer whales in the North Pacific, including differences in 1) acoustic dialects; 2) skull features; 3) morphology; 4) feeding specializations; and 5) a lack of intermingling between the two sympatric ecotypes.
Figure 1. Approximate April - October distribution of the Eastern North Pacific Southern Resident killer whale stock (shaded area) and range of sightings (diagonal lines).
73

Most sightings of the Eastern North Pacific Southern Resident stock of killer whales have occurred in the summer in inland waters of Washington and southern British Columbia. However, pods belonging to this stock have also been sighted in coastal waters off southern Vancouver Island and Washington (Bigg et al. 1990, Ford et al. 2000, NWFSC unpubl. data). The complete winter range of this stock is uncertain. Of the three pods comprising this stock, one (J1) is commonly sighted in inshore waters in winter, while the other two (K1 and L1) apparently spend more time offshore (Ford et al. 2000). These latter two pods have been sighted as far south as Monterey Bay and central California in recent years (N. Black, pers. comm., K. Balcomb, pers. comm.) They sometimes have also been seen entering the inland waters of Vancouver Island from the north through Johnstone Strait in the spring (Ford et al. 2000), suggesting that they may spend time along the entire outer coast of Vancouver Island during the winter. In June 2007, whales from L-pod were sighted off Chatham Strait, Alaska, the farthest north they have ever been documented (J. Ford, pers. comm.). Based on data regarding association patterns, acoustics, movements, genetic differences and potential fishery interactions, eight killer whale stocks are recognized within the Pacific U.S. EEZ: 1) the Eastern North Pacific Alaska Resident stock - occurring from Southeast Alaska to the Bering Sea, 2) the Eastern North Pacific Northern Resident stock - occurring from British Columbia through Alaska, 3) the Eastern North Pacific Southern Resident stock - occurring mainly within the inland waters of Washington State and southern British Columbia but extending from central California into southern Southeast Alaska (see Fig. 1), 4) the Eastern North Pacific Transient stock - occurring from Alaska through California, 5) the Gulf of Alaska, Aleutian Islands, and Bering Sea Transient stock - occurring from southeast Alaska to the Bering Sea, 6) the AT1 Stock – found only in Prince William Sound, 7) the Eastern North Pacific Offshore stock - occurring from Southeast Alaska through California, 8) the Hawaiian stock. The Stock Assessment Reports for the Alaska Region contain information concerning the Eastern North Pacific Alaska Resident, Eastern North Pacific Northern Resident and the Gulf of Alaska, Aleutian Islands, and Bering Sea, AT1, and Eastern North Pacific Transient stocks. POPULATION SIZE The Eastern North Pacific Southern Resident stock is a trans-boundary stock including killer whales in inland Washington and southern British Columbia waters. Photo-identification of individual whales through the years has advanced knowledge of this stock’s structure, behaviors, and movements. In 1993, the three pods comprising this stock totaled 96 killer whales (Ford et al. 1994). The population increased to 99 whales in 1995, then declined to 79 whales in 2001, and most recently numbered 87 85 whales in 2011 2012 (Fig. 2; Ford et al. 2000; Center for Whale Research, unpubl. data). The 2001-2005 counts included a whale born in 1999 (L-98) that was listed as missing during the annual census in May and June 2001 but was subsequently discovered alone in an inlet off the west coast of Vancouver Island (J. Ford, pers. comm.). L-98 remained separate from L pod until 10 March 2006 when he died due to injuries associated with a vessel interaction in Nootka Sound. L-98 has been subtracted from the official 2006 and subsequent population censuses. The most recent census spanning 1 July 2010 2011 through 1 July 2011 2012 includes four two new calves and the deaths of a two post-reproductive adult females, a subadult male juvenile female, and an young adult male. It does not include a stillborn calf observed in September 2010 December 2011 that did not survive six months (Center for Whale Research, unpubl. data). Minimum Population Estimate The abundance estimate for this stock of killer whales is a direct count of individually identifiable animals. It is thought that the entire population is censused every year. This estimate therefore serves as both a best estimate of abundance and a minimum estimate of abundance. Thus, the minimum population estimate (Nmin) for the Eastern North Pacific Southern Resident stock of killer whales is 87 85 animals. Current Population Trend During the live-capture fishery that existed from 1967 to 1973, it is estimated that 47 killer
5060708090
100
1974
1976
1978
1980
1982
1984
1986
1988
1990
1992
1994
1996
1998
2000
2002
2004
2006
2008
2010
2012
Tota
l pop
ulat
ion
Year
Figure 2. Population of Eastern North Pacific Southern Resident stock of killer whales, 1974-20112012. Each year’s count includes animals first seen and first missed; a whale is considered first missed the year after it was last seen alive (Ford et al. 2000; Center for Whale Research, unpubl. data).
74

whales, mostly immature, were taken out of this stock (Ford et al. 1994). Since the first complete census of this stock in 1974 when 71 animals were identified, the number of southern resident killer whales has fluctuated annually. Between 1974 and 1993 the Southern Resident stock increased approximately 35%, from 71 to 96 individuals (Ford et al. 1994), representing a net annual growth rate of 1.8% during those years. Following the peak census count of 99 animals in 1995, the population size has fluctuated and currently stands at 87 85 animals as of the 2011 2012 census (Ford et al. 2000; Center for Whale Research, unpubl. data). CURRENT AND MAXIMUM NET PRODUCTIVITY RATES A reliable estimate of the maximum net productivity rate is currently unavailable for this stock of killer whales. Studies of ‘resident’ killer whale pods in British Columbia and Washington waters resulted in estimated population growth rates of 2.92% and 2.54% over the period from 1973 to 1987 (Olesiuk et al. 1990, Brault and Caswell 1993). For southern resident killer whales, estimates of the population growth rate have been made during the three periods when the population has been documented increasing since monitoring began in 1974. From 1974 to 1980 the population increased at a rate of 2.6%/year, 2.3%/year from 1985 to 1996, and 3.6%/year from 2002 to 2005 (Center for Whale Research, unpubl. data). A recent analysis of the long-term trend of southern resident population growth (1979-2011) indicated that there was a 5% probability of the maximum growth (Rmax) exceeding 2.8% and a 1% chance of it exceeding 3.2% (Ward 2012). Hence, Rmax is estimated to be 3.2% for southern resident killer whales and this value will be used for this stock. POTENTIAL BIOLOGICAL REMOVAL The potential biological removal (PBR) level for this stock is calculated as the minimum population size (87 85) times one-half the default maximum net growth rate for cetaceans (½ of 3.2%) times a recovery factor of 0.1 (for an endangered stock, Wade and Angliss 1997), resulting in a PBR of 0.14 whales per year. HUMAN-CAUSED MORTALITY AND SERIOUS INJURY New Serious Injury Guidelines NMFS updated its serious injury designation and reporting process, which uses guidance from previous serious injury workshops, expert opinion, and analysis of historic injury cases to develop new criteria for distinguishing serious from non-serious injury (Angliss and DeMaster 1998, Andersen et al. 2008, NOAA 2012). NMFS defines serious injury as an “injury that is more likely than not to result in mortality”. Injury determinations for stock assessments revised in 2013 or later incorporate the new serious injury guidelines, based on the most recent 5-year period for which data are available. Fisheries Information
Salmon drift gillnet fisheries in Washington inland waters were last observed in 1993 and 1994 and no killer whale entanglements were documented, though observer coverage levels were typically less than 10% (Erstad et al. 1996, Pierce et al. 1994, Pierce et al. 1996, NWIFC 1995). Fishing effort in the inland waters drift gillnet fishery has declined considerably since 1994 because far fewer vessels participate today (NMFS NW Region, unpublished data). Past marine mammal entanglements in this fishery included harbor porpoise, Dall’s porpoise, and harbor seals. Coastal marine tribal set gillnets also occur along the outer Washington coast and no killer whale interactions have been reported in this fishery since the inception of the observer program in 1988, though the fishery is not active every year (Gearin et al. 1994, Gearin et al. 2000, Makah Fisheries Management, unpublished data). A fishery experiment with 100% observer coverage and acoustic alarms on all set gillnets was conducted in 2008 and 2011. No killer whale bycatch was documented (Makah Fisheries Management, unpublished data). NMFS observers have monitored the northern Washington marine set gillnet fishery since 1988 (Gearin et al. 1994, 2000; P. Gearin, unpubl. data). Observer coverage ranged from approximately 40 to 83% in the entire fishery (coastal + inland waters) between 1998 and 2002. There was no observer coverage in this fishery from 1999 to 2003. However, the total fishing effort was 4, 46, 4.5 and 7 net days (respectively) in those years, it occurred only in inland waters, and no killer whale takes were reported. No killer whale mortality has been recorded in this fishery since the inception of the observer program. In 1993, as a pilot for future observer programs, NMFS in conjunction with the Washington Department of Fish and Wildlife (WDFW) monitored all non-treaty components of the Washington Puget Sound Region salmon gillnet fishery (Pierce et al. 1994). Observer coverage was 1.3% overall, ranging from 0.9% to 7.3% for the various components of the fishery. Encounters (whales within 10 m of a net) with killer whales were reported, but not quantified, though no entanglements occurred.
75

In 1994, NMFS and WDFW conducted an observer program during the Puget Sound non-treaty chum salmon gillnet fishery (areas 10/11 and 12/12B). A total of 230 sets were observed during 54 boat trips, representing approximately 11% observer coverage of the 500 fishing boat trips comprising the total effort in this fishery, as estimated from fish ticket landings (Erstad et al. 1996). No interactions with killer whales were observed during this fishery. The Puget Sound treaty chum salmon gillnet fishery in Hood Canal (areas 12, 12B, and 12C) and the Puget Sound treaty sockeye/chum gillnet fishery in the Strait of Juan de Fuca (areas 4B, 5, and 6C) were also monitored in 1994 at 2.2% (based on % of total catch observed) and approximately 7.5% (based on % of observed trips to total landings) observer coverage, respectively (NWIFC 1995). No interactions resulting in killer whale mortality was reported in either treaty salmon gillnet fishery. Also in 1994, NMFS, WDFW, and the Tribes conducted an observer program to examine seabird and marine mammal interactions with the Puget Sound treaty and non-treaty sockeye salmon gillnet fishery (areas 7 and 7A). During this fishery, observers monitored 2,205 sets, representing approximately 7% of the estimated number of sets in the fishery (Pierce et al. 1996). Killer whales were observed within 10 m of the gear during 10 observed sets (32 animals in all), though none were observed to have been entangled. Killer whale takes in the Washington Puget Sound Region salmon drift gillnet fishery are unlikely to have increased since the fishery was last observed in 1994, due to reductions in the number of participating vessels and available fishing time (see details in Appendix 1). Fishing effort and catch have declined throughout all salmon fisheries in the region due to management efforts to recover ESA-listed salmonids. An additional source of information on the number of killer whales killed or injured incidental to commercial fishery operations is the self-reported fisheries information required of vessel operators by the MMPA. No self-report records of killer whale mortality have been reported. During the period between 1994 and 2004, there were no fisher self-reports of killer whale mortality in any fisheries operating within the range of this stock. However, because logbook records (fisher self-reports required during 1990-94) are most likely negatively biased (Credle et al. 1994), these are considered to be minimum estimates. Logbook data are available for part of 1989-1994, after which incidental mortality reporting requirements were modified. Under the new system, logbooks are no longer required; instead, fishers provide self-reports. Data for the 1994-1995 phase-in period are fragmentary. After 1995, the level of reporting dropped dramatically, such that the records are considered incomplete and estimates of mortality based on them represent minimums (Angliss and Lodge 2002). Due to a lack of observer programs, there are few data concerning the mortality of marine mammals incidental to Canadian commercial fisheries. Since 1990, there have been no reported fishery-related strandings of killer whales in Canadian waters. However, in 1994 one killer whale was reported to have contacted a salmon gillnet but did not entangle (Guenther et al. 1995). Data regarding the level of killer whale mortality related to commercial fisheries in Canadian waters are not available. During the 1990s there were no reported takes from this stock incidental to commercial fishing operations (D. Ellifrit, pers. comm.), between killer whales and longline operations (as occurs in Alaskan waters; see Yano and Dahlheim 1995), no reports of stranded animals with net marks, and no photographs of individual whales carrying fishing gear. The known total fishery mortality and serious injury for this stock is zero. Other Mortality According to Northwest Marine Mammal Stranding Network records, maintained by the NMFS Northwest Region, no human-caused killer whale mortality or serious injuries were reported from non-fisheries sources in 1998-2004 2007-2011 (Carretta et al. 2013). There was documentation of a whale-boat collision in Haro Strait in 2005 which resulted in a minor injury to a whale. In 2006, whale L98 was killed during a vessel interaction. It is important to note that L98 had become habituated to regularly interacting with vessels during its isolation in Nootka Sound. The annual level of non-fishery human-caused mortality for this stock over the past five years (2007-2011) is 0.2 zero animals per year (reflecting the vessel strike death of animal L98 in 2006). STATUS OF STOCK Southern Resident killer whales were listed as endangered under the ESA in 2005. Total annual fishery mortality and serious injury for this stock (0) is not known to exceed 10% of the calculated PBR (0.14) and, therefore, appears to be insignificant and approaching zero mortality and serious injury rate. The estimated annual level of human-caused mortality and serious injury of 0.2 zero animals per year does not exceeds the PBR (0.14). Southern Resident killer whales are formally listed as “endangered” under the ESA and consequently the stock is automatically considered as a “strategic” stock under the MMPA. This stock was considered “depleted” prior to its 2005 listing under the ESA. Habitat Issues
76

Several of the potential risk factors identified for this population have habitat implications. The summer range of this population, the inland waters of Washington and British Columbia, is the home to a large commercial whale watch industry as well as high levels of recreational boating and commercial shipping. There continues to be concern about potential for masking effects by noise generated from these activities on the whales’ communication and foraging. In 2011 vessel approach regulations were implemented to restrict vessel from approaching closer than 200m. This population appears to be Chinook salmon specialists (Ford and Ellis 2006, Hanson et al. 2010), although other species, particularly chum, appear to be important in the fall (NWFSC unpubl. data). There is evidence that changes in coast–wide Chinook abundance have affected this population (Ford et al. 2009, Ward et al. 2009). In addition, the high trophic level and longevity of the animals has predisposed them to accumulate levels of contaminants that are high enough to cause potential health impacts. In particular, there is recent evidence of extremely high levels of flame retardants in young animals (Krahn et al. 2007, 2009). REFERENCES Angliss, R. P., and K. L. Lodge. 2002. Alaska marine mammal stock assessments, 2002. U.S. Dep. Commer.,
NOAA Technical Memorandum NMFS-AFSC-133. 224 pp. Baird, R. W., and P. J. Stacey. 1988. Variation in saddle patch pigmentation in populations of killer whales
(Orcinus orca) from British Columbia, Alaska, and Washington State. Canadian Journal of Zoology 66:2582-2585.
Baird, R. W., P. A. Abrams, and L. M. Dill. 1992. Possible indirect interactions between transient and resident killer whales: implications for the evolution of foraging specializations in the genus Orcinus. Oecologia 89:125-132.
Barlow, J. 1995. The abundance of cetaceans in California waters. Part I: Ship surveys in summer and fall of 1991. Fishery Bulletin 93:1-14.
Barlow, J. 1997. Preliminary estimates of cetacean abundance off California, Oregon and Washington based on a 1996 ship survey and comparisons of passing and closing modes. Administrative Report LJ-97-11, Southwest Fisheries Science Center, National Marine Fisheries Service, P.O. Box 271, La Jolla, CA 92038. 25 pp.
Barlow, J. and K.A. Forney. 2007. Abundance and population density of cetaceans in the California Current ecosystem. Fishery Bulletin 105:509-526.
Bigg, M. A., P. F. Olesiuk, G. M. Ellis, J. K. B. Ford, and K. C. Balcomb III. 1990. Social organization and genealogy of resident killer whales (Orcinus orca) in the coastal waters of British Columbia and Washington State. Pp. 386-406, In: Hammond, P. S., S. A. Mizroch, and G. P. Donovan (eds.), Individual Recognition of Cetaceans: Use of Photo-identification and Other Techniques to Estimate Population Parameters. Rep. Int. Whal. Commn. Special Issue 12.
Black, N. A. P.O. Box 52001, Pacific Grove, CA 93950. Braham, H. W., and M. E. Dahlheim. 1982. Killer whales in Alaska documented in the Platforms of Opportunity
Program. Rep. Int. Whal. Commn. 32:643-646. Brault, S., and H. Caswell. 1993. Pod-specific demography of killer whales (Orcinus orca). Ecology 74(5):1444-
1454. Carretta, J. V., S. M. Wilkin, M. M. Muto, and K. Wilkinson. 2013. Sources of human-related injury and mortality
for U.S. Pacific west coast marine mammal stock assessments, 2007-2011. U.S. Dep. Commer., NOAA Tech. Memo. NMFS-SWFSC-514, 83 p.
Center for Whale Research, 1359 Smugglers Cove Rd., Friday Harbor, WA 98250. Clarke, J.T., C.L. Christman, A.A. Brower, and M.C. Ferguson. 2013. Distribution and Relative Abundance of
Marine Mammals in the Northeastern Chukchi and Western Beaufort Seas, 2012. Annual Report, OCS Study BOEM 2013-00117. National Marine Mammal Laboratory, Alaska Fisheries Science Center, NMFS, NOAA, 7600 Sand Point Way NE, F/AKC3, Seattle, WA 98115-6349.
Credle, V. R., D. P. DeMaster, M. M. Merklein, M. B. Hanson, W. A. Karp, and S. M. Fitzgerald (eds.). 1994. NMFS observer programs: minutes and recommendations from a workshop held in Galveston, Texas, November 10-11, 1993. U.S. Dep. Commer., NOAA Tech. Memo. NMFS-OPR-94-1. 96 pp.
Dahlheim, M. E., D. K. Ellifrit, and J. D. Swenson. 1997. Killer whales of Southeast Alaska: a catalogue of photoidentified individuals. National Marine Mammal Laboratory, AFSC, NMFS, NOAA, 7600 Sand Point Way NE, Seattle, WA 98115. 79 pp.
Ellifrit, D. Center for Whale Research, 1359 Smugglers Cove Rd., Friday Harbor, WA 98250. Erstad, P., S. J. Jeffries, and D. J. Pierce. 1996. 1994 Report for the Puget Sound fishery observer program in
management areas 10/11 & 12/12B: nontreaty chum gill net fishery. Final Report, Washington Dept. Fish and Wildlife, Olympia, WA. 14 pp.
77

Ford, J.K.B. Pacific Biological Station, Department of Fisheries and Oceans, Nanaimo, BC V9R 5K6. Ford, J.K.B., and H. D. Fisher. 1982. Killer whale (Orcinus orca) dialects as an indicator of stocks in British
Columbia. Rep. Int. Whal. Commn. 32:671-679. Ford, J.K.B., G. M. Ellis, and K. C. Balcomb. 1994. Killer Whales: The Natural History and Genealogy of Orcinus
orca in British Columbia and Washington State. University of British Columbia Press, Vancouver, BC, and University of Washington Press, Seattle. 102 pp.
Ford, J.K.B., G. M. Ellis, and K. C. Balcomb. 2000. Killer Whales: The Natural History and Genealogy of Orcinus orca in British Columbia and Washington. 2nd edition. University of British Columbia Press, Vancouver, BC, and University of Washington Press, Seattle. 104 pp.
Ford, J.K.B., and G.M. Ellis. 2006. Selective foraging by fish-eating killer whales Orcinus orca in British Columbia. Marine Ecology Progress Series, 316: 185–199.
Ford, J.K.B., G.M. Ellis, P.F. Olesiuk, and K.C. Balcomb. 2009. Linking killer whale survival and prey abundance: food limitation in the oceans' apex predator? Biol. Lett. published online before print September 15, 2009, doi:10.1098/rsbl.2009.0468
Forney, K. A., J. Barlow, and J. V. Carretta. 1995. The abundance of cetaceans in California waters. Part II: Aerial surveys in winter and spring of 1991 and 1992. Fish. Bull. 93:15_26.
Forney, K.A. and P. Wade. 2006. Worldwide distribution and abundance of killer whales. Pages 145-162 In: "Whales, whaling and ocean ecosystems", J.A. Estes, R.L. Brownell, Jr., D.P DeMaster, D.F. Doak, and T.M. Williams (eds), University of California Press. 418p.
Gearin, P. J. National Marine Mammal Laboratory, AFSC, NMFS, 7600 Sand Point Way NE, Seattle, WA 98115. Gearin, P. J., S. R. Melin, R. L. DeLong, H. Kajimura, and M. A. Johnson. 1994. Harbor porpoise interactions with
a chinook salmon set-net fishery in Washington State. Rep. Int. Whal. Commn. Special Issue 15:427-438. Gearin, P. J., M. E. Gosho, J. L. Laake, L. Cooke, R. L. DeLong, and K. M. Hughes. 2000. Experimental testing of
acoustic alarms (pingers) to reduce bycatch of harbour porpoise, Phocoena phocoena, in the state of Washington. J. Cetacean Res. Manage. 2(1):1-9.
George, J.C., L.M. Philo, K. Hazard, D. Withrow, G.M. Carroll and R. Suydam. 1994. Frequency of killer whale (Orcinus orca) attacks and ship collisions based on scarring on bowhead whales (Balaena mysticetus) of the Bering-Chukchi-Beaufort seas stock. Arctic 47(3): 246-255.
Green, G. A., J. J. Brueggeman, R. A. Grotefendt, C. E. Bowlby, M. L. Bonnel, and K. C. Balcomb. 1992. Cetacean distribution and abundance off Oregon and Washington, 1989-1990. Pp. 1-100, In: Brueggeman, J. J. (ed.), Oregon and Washington marine mammal and seabird surveys. Final Rep. OCS Study MMS 91-0093.
Guenther, T. J., R. W. Baird, R. L. Bates, P. M. Willis, R. L. Hahn, and S. G. Wischniowski. 1995. Strandings and fishing gear entanglements of cetaceans on the west coast of Canada in 1994. Paper SC/47/O6 presented to the International Whaling Commission, May 1995 (unpublished). 7 pp.
Hanson, M.B., R.W. Baird, J.K.B. Ford, J. Hempelmann-Halos, D. M.Van Doornik, J.R. Candy, C. K. Emmons, G. S. Schorr, B. Gisborne, K. L. Ayres, S. K. Wasser, K. C. Balcomb, K. Balcomb-Bartok, J. G. Sneva, and M. J. Ford. 2010. Species and stock identification of prey consumed by endangered “southern resident” killer whales in their summer range. Endangered Species Research 11: 69–82.
Hoelzel, A. R. 1991. Analysis of regional mitochondrial DNA variation in the killer whale; implications for cetacean conservation. Rep. Int. Whal. Commn. Special Issue 13:225-233.
Hoelzel, A. R., and G. A. Dover. 1991. Genetic differentiation between sympatric killer whale populations. Heredity 66:191-195.
Hoelzel, A. R., M. E. Dahlheim, and S. J. Stern. 1998. Low genetic variation among killer whales (Orcinus orca) in the Eastern North Pacific, and genetic differentiation between foraging specialists. J. Heredity 89:121-128.
Krahn, M. M.,, M. J. Ford, W. F. Perrin, P. R. Wade, R. P. Angliss, M. B. Hanson, B. L. Taylor, G. Ylitalo, M. E. Dahlheim, J. E. Stein, and R. S. Waples. 2004. 2004 Status review of Southern Resident killer whales (Orcinus orca) under the Endangered Species Act. U.S. Dep. Commer., NOAA Tech. Memo NMFS-NWFSC-62. 73 pp.
Krahn,, M.M., M.B. Hanson, R.W. Baird, R.H. Boyer, D.G. Burrows, C.K. Emmons, J. K.B. Ford, L. L. Jones, D. P. Noren, P. S. Ross, G. S. Schorr, T.K. Collier. 2007. Persistent organic pollutants and stable isotopes in biopsy samples (2004/2006) from Southern Resident killer whales. Mar. Poll. Bull. 54 (2007) 1903–1911.
Krahn, Margaret M, M. Bradley Hanson, Gregory S. Schorr, Candice K. Emmons, Douglas G. Burrows, Jennie L. Bolton, Robin W. Baird, Gina M. Ylitalo. 2009. Effects of age, sex and reproductive status on persistent organic pollutant concentrations in "Southern Resident" killer whales. Marine Pollution Bulletin 58: 1522–1529.
78
Leatherwood, J. S., and M. E. Dahlheim. 1978. Worldwide distribution of pilot whales and killer whales. Naval Ocean Systems Center, Tech. Rep. 443:1-39.
Leatherwood, S., C. O. Matkin, J. D. Hall, and G. M. Ellis. 1990. Killer whales, Orcinus orca, photo_identified in Prince William Sound, Alaska 1976 to 1987. Can. Field Nat. 104:362-371.
Lowry, L.F., R.R. Nelson, and K.J. Frost. 1987. Observations of killer whales, Orcinus orca, in western Alaska: Sightings, strandings, and predation on other marine mammals. The Canadian Field Naturalist 101:6-12.
Matkin, C., G. Ellis, E. Saulitis, L. Barrett-Lennard, and D. Matkin. 1999. Killer Whales of Southern Alaska. North Gulf Oceanic Society. 96 pp.
Mitchell, E. D. 1975. Report on the meeting on small cetaceans, Montreal, April 1-11, 1974. J. Fish. Res. Bd. Can. 32:914-916.
Morin P. A., F. I. Archer, A. D. Foote, J. Vilstrup, E. E. Allen, P. R. Wade, J. W. Durban, K. M. Parsons, R. Pitman, L. Li, P. Bouffard, S. C. Abel Nielsen, M. Rasmussen, E. Willerslev, M. T. P. Gilbert, T. Harkins. 2010. Complete mitochondrial genome phylogeographic analysis of killer whales (Orcinus orca) indicates multiple species. Genome Research, 20:908-916.
Northwest Indian Fisheries Commission (NWIFC). 1995. Monitoring of marbled murrelet and marine mammal interactions with 1994 tribal gillnet fisheries in northern Puget Sound, Hood Canal, and the Strait of Juan de Fuca. Final Report to NMFS, Contract No. 52ABNF400087, and U.S. Fish and Wildlife Service. Unpubl. report. 41 pp. Available at NWIFC, 6730 Martin Way E, Olympia, WA 98516.
Olesiuk, P. F., M. A. Bigg, and G. M. Ellis. 1990. Life history and population dynamics of resident killer whales (Orcinus orca) in the coastal waters of British Columbia and Washington State. Rep. Int. Whal. Commn. Special Issue 12:209-242.
Pierce, D. J., W. P. Ritchie, and R. Kreuziger. 1994. Preliminary findings of seabird interactions with the non-treaty salmon gill net fishery: Puget Sound and Hood Canal Washington. Unpubl. report. Washington Dept. Fish and Wildlife, Olympia, WA. 39 pp. Available at WDFW, 600 Capitol Way N, Olympia, WA 98501.
Pierce, D. J., M. Alexandersdottir, S. J. Jeffries, P. Erstad, W. Beattie, and A. Chapman. 1996. Interactions of marbled murrelets and marine mammals with the 1994 Puget Sound sockeye gill net fishery. Final Report, Washington Dept. Fish and Wildlife, Olympia, WA. 21 pp.
Reeves, R.R., W.F. Perrin, B.L. Taylor, C.S. Baker, and S.L. Mesnick. 2004. Report of the workshop on shortcomings of cetacean taxonomy in relation to needs of conservation and management, April 30 – May 2, 2004, La Jolla, California. U.S. Department of Commerce NOAA Technical Memorandum NOAA-TM-NMFS-SWFSC-363. 94pp. Available from Southwest Fisheries Science Center, 8604 La Jolla Shores Drive, La Jolla, CA. 92037.
Stevens, T. A., D. Duffield, E. Asper, K. Hewlett, A. Bolz, L. Gage, and G. Bossart. 1989. Preliminary findings of restriction fragment differences in mitochondrial DNA among killer whales (Orcinus orca). Can. J. Zool. 67:2592-2595.
Wade, P.R., and R. P. Angliss. 1997. Guidelines for assessing marine mammal stocks: report of the GAMMS workshop April 3-5, 1996, Seattle, Washington. U.S. Dep. Commer., NOAA Tech. Memo. NMFS-OPR-12. 93 pp.
Ward, E.J., E.E. Holmes, and K.C. Balcomb. 2009. Quantifying the effects of prey abundance on killer whale reproduction. Journal of Applied Ecology, 46(3):632-640.
Ward, E.J. 2012. Comparison of Southern Resident Killer Whale and Northern Resident Killer Whale population dynamics. Presentation made at the 2nd workshop on “The effects of salmon fisheries on Southern resident killer whales”, 13-15 March 2012, Vancouver, BC.
Yano, K., and M. E. Dahlheim. 1995. Killer whale, Orcinus orca, depredation on longline catches of bottomfish in the southeastern Bering Sea and adjacent waters. Fish. Bull. 93:355-372.
79

Revised 01/15/2011 9/24/2013
BAIRD'S BEAKED WHALE (Berardius bairdii): California/Oregon/Washington Stock
STOCK DEFINITION AND GEOGRAPHIC RANGE Baird's beaked whales are distributed throughout deep waters and along the continental slopes of the North Pacific Ocean (Balcomb 1989, Macleod et al. 2006). They have been harvested and studied in Japanese waters, but little is known about this species elsewhere (Balcomb 1989). Along the U.S. west coast, Baird's beaked whales have been seen primarily along the continental slope (Figure 1) from late spring to early fall. They have been seen less frequently and are presumed to be farther offshore during the colder water months of November through April. For the Marine Mammal Protection Act (MMPA) stock assessment reports, Baird's beaked whales within the Pacific U.S. Exclusive Economic Zone are divided into two discrete, non-contiguous areas: 1) waters off California, Oregon and Washington (this report), and 2) Alaskan waters. POPULATION SIZE Two summer/fall shipboard surveys were conducted within 300 nmi of the coasts of California, Oregon and Washington 2005 (Forney 2007) and 2008 (Barlow 2010). Because the distribution of Baird’s beaked whale varies and animals probably spend time outside the U.S. Exclusive Economic Zone, a multi-year average abundance estimate is the most appropriate for management within U.S. waters. The 2005-2008 A geometric mean abundance estimate for California, Oregon and Washington waters based on the above two ship surveys from 2005 and 2008 was is 907 (CV=0.49) Baird’s beaked whales (Forney 2007, Barlow 2010). This abundance estimate included correction factors for the proportion of animals missed, based on a model of their diving behavior, detection distances, and the searching behavior of observers (Barlow 1999). About 96% of all trackline groups are estimated to be seen. A trend-based analysis of line-transect data from surveys conducted between 1991 and 2008 yielded new estimates of abundance (Moore and Barlow 2013). Based on this analysis and a lack of a detected trend in abundance, a multi-year average of the 2005 and 2008 trend estimates is the most appropriate estimate for this stock. The geometric mean of the best (50th percentile) estimates of abundance for Baird’s beaked whales in 2005 (767, CV=1.29) and 2008 (937, CV=1.34) in waters off California, Oregon and Washington is 847 (CV=0.81).
Figure 1. Baird’s beaked whale sightings based on shipboard surveys off California, Oregon and Washington, 1991-2008 (see Appendix 2 for data sources and information on timing and location of survey effort). Dashed line represents the U.S. EEZ, thin lines indicate completed transect effort of all surveys combined.
80

Minimum Population Estimate The log-normal 20th percentile of the 2005-2008 geometric mean abundance estimate is 466 615 Baird’s beaked whales. Current Population Trend Due to the rarity of sightings of this species on surveys along the U.S. West coast, no information exists regarding trends in abundance of this population. Future studies of trends must take the apparent seasonality of the distribution of Baird's beaked whales into account. The analysis by Moore and Barlow (2013) did not suggest evidence of an abundance trend during 1991–2008 for Baird’s beaked whale in waters off the U.S. west coast (Figure 2). CURRENT AND MAXIMUM NET PRODUCTIVITY RATES No information on current or maximum net productivity rates is available for this species. POTENTIAL BIOLOGICAL REMOVAL The potential biological removal (PBR) level for this stock is calculated as the minimum population size (615 466) times one half the default maximum net growth rate for cetaceans (½ of 4%) times a recovery factor of 0.50 (for a species of unknown status with no fishery mortality; Wade and Angliss 1997), resulting in a PBR of 6.2 4.7 Baird’s beaked whales per year. HUMAN-CAUSED MORTALITY AND SERIOUS INJURY Fishery Information The California large mesh drift gillnet fishery has been the only fishery known to interact with this stock. One Baird’s beaked whale was incidentally killed in this fishery in 1994 (Julian and Beeson 1998), before acoustic pingers were first used in the fishery in 1996 (Barlow and Cameron 2003). Since 1996, no beaked whale of any species have been observed entangled or killed in this fishery (Carretta et al. 2008, Carretta and Enriquez 2009a, 2009b, Carretta and Barlow 2011, Carretta and Enriquez 2012a, 2012b). Mean annual takes in Table 1 are based on 2004-2008 2007-2011 data. This results in an average estimated annual mortality of zero Baird’s beaked whales. Gillnets have been documented to entangle marine mammals off Baja California (Sosa-Nishizaki et al. 1993), but no recent bycatch data from Mexico are available. Drift gillnet fisheries for swordfish and sharks exist along the entire Pacific coast of Baja California, Mexico and may take animals from this population. Quantitative data are available only for the Mexican swordfish drift gillnet fishery, which uses vessels, gear, and operational procedures similar to those in the U.S. drift gillnet fishery, although nets may be up to 4.5 km long (Holts and Sosa-Nishizaki 1998). The fleet increased from two vessels in 1986 to 31 vessels in 1993 (Holts and Sosa-Nishizaki 1998). The total number of sets in this fishery in 1992 can be estimated from data provided by these authors to be approximately 2700, with an observed rate of marine mammal bycatch of 0.13 animals per set (10 marine mammals in 77 observed sets; Sosa-Nishizaki et al. 1993). This overall mortality rate is similar to that observed in California driftnet fisheries during 1990-95 (0.14 marine mammals per set; Julian and Beeson, 1998), but species-specific information is not available for the Mexican fisheries. Previous efforts to convert the Mexican swordfish driftnet fishery to a longline fishery have resulted in a mixed-fishery, with 20 vessels alternately using longlines or driftnets, 23 using driftnets only, 22 using longlines only, and seven with unknown gear type (Berdegué 2002).
Figure 2. Abundance and trend estimates for Baird’s beaked whales in the California Current, 1991-2008 (Moore and Barlow 2013). For each year, the Bayesian posterior median (●), mean (x) and mode (*) abundance estimates are shown, along with 90% CRIs.
81

Table 1. Summary of available information on the incidental mortality and injury of Baird's beaked whales (California/Oregon/Washington Stock) in commercial fisheries that might take this species. The single observed entanglement resulted in the death of the animal. Coefficients of variation for mortality estimates are provided in parentheses. Mean annual takes are based on 2004-2008 2007-2011 data unless noted otherwise.
Fishery Name
Data Type
Year(s)
Percent
Observer Coverage
Observed Mortality
Estimated Annual Mortality
Mean Annual Takes
(CV in parentheses)
CA/OR thresher shark/swordfish drift
gillnet fishery
observer data
2004 2005 2006 2007 2008 2009 2010 2011
20.6% 20.9% 18.5% 16.4% 13.5% 13.3% 11.9% 19.5%
0 0 0 0 0 0 0 0
0 0 0 0 0 0 0 0
0
Minimum total annual takes 0 Other mortality California coastal whaling operations killed 15 Baird's beaked whales between 1956 and 1970, and 29 additional Baird's beaked whales were taken by whalers in British Columbian waters (Rice 1974). One Baird’s beaked whale stranded in Washington state in 2003 and the cause of death was attributed to a ship strike. No other human-caused mortality has been reported for this stock for the period 2004-2008 2007-2011.
Anthropogenic sound sources, such as military sonar and seismic testing have been implicated in the mass strandings of beaked whales, including atypical events involving multiple beaked whale species (Simmonds and Lopez-Jurado 1991, Frantiz 1998, Anon. 2001, Jepson et al. 2003, Cox et al. 2006). While D’Amico et al. (2009) note that most mass strandings of beaked whales are unassociated with documented sonar activities, lethal or sub-lethal effects of such activities would rarely be documented, due to the remote nature of such activities and the low probability that an injured or dead beaked whale would strand. Filadelpho et al. (2009) reported statistically significant correlations between military sonar use and mass strandings of beaked whales in the Mediterranean and Caribbean Seas, but not in Japanese and Southern California waters, and hypothesized that regions with steep bathymetry adjacent to coastlines are more conducive to stranding events in the presence of sonar use. In Hawaiian waters, Faerber & Baird (2010) suggest that the probability of stranding is lower than in some other regions due to nearshore currents carrying animals away from beaches, and that stranded animals are less likely to be detected due to low human population density near many of Hawaii’s beaches. Actual and simulated sonar are known to interrupt the foraging dives and echolocation activities of tagged beaked whales (Tyack et al. 2011). Blainville’s beaked whale presence was monitored on hydrophone arrays before, during, and after sonar activities on a Caribbean military range, with evidence of avoidance behavior: whales were detected throughout the range prior to sonar exposure, not detected in the center of the range coincident with highest sonar use, and gradually returned to the range center after the cessation of sonar activity (Tyack et al. 2011). Fernández et al. (2013) report that there have been no mass strandings of beaked whales in the Canary Islands following a 2004 ban on sonar activities in that region. The absence of beaked whale bycatch in California drift gillnets following the introduction of acoustic pingers into the fishery implies additional sensitivity of beaked whales to anthropogenic sound (Carretta et al. 2008, Carretta and Barlow 2011). Additional, unknown levels of injury and mortality of Baird’s beaked whales may occur as a result of anthropogenic sound, such as military sonars (U.S. Dept. of Commerce and Secretary of the Navy 2001) or other commercial and scientific activities involving the use of air guns. Such injury or mortality would rarely be documented, due to the remote nature of many of these activities and the low probability that an injured or dead beaked whale would strand.
82

STATUS OF STOCK The status of Baird's beaked whales in California, Oregon and Washington waters relative to OSP is not known, and there are insufficient data to evaluate trends in abundance, and no abundance trend is evident. No habitat issues are known to be of concern for this species, but in recent years questions have been raised regarding potential effects of human-made sounds on deep-diving cetacean species such as beaked whales (Richardson et al. 1995). In particular, active sonar has been implicated in the mass stranding of beaked whales in the Mediterranean Sea (Frantzis 1998) and more recently in the Caribbean (U.S. Dept. of Commerce and Secretary of the Navy 2001). They are not listed as "threatened" or "endangered" under the Endangered Species Act nor as "depleted" under the MMPA. The average annual human-caused mortality during 2004-2008 2007-2011 is zero animals/year. Because recent fishery and human-caused mortality is less than the PBR (6.2 4.7), Baird’s beaked whales are not classified as a "strategic" stock under the MMPA. The total fishery mortality and serious injury for this stock is zero and can be considered to be insignificant and approaching zero. The impacts of anthropogenic sound on beaked whales remains a concern (Barlow and Gisiner 2006, Cox et al. 2006, Hildebrand et al. 2005, Weilgart 2007). REFERENCES Anon. 2001. Joint interim report on the Bahamas marine mammal stranding event of 15-16 March 2000
(December 2001). NOAA unpublished report. 59pp. [Available at http://www.nmfs.noaa.gov/pr/pdfs/health/stranding_bahamas2000.pdf].
Barlow, J. and R. Gisiner. 2006. Mitigating, monitoring, and assessing the effects of anthropogenic sound on beaked whales. J. Cet. Res. Manage. 7(3):239-249.
Balcomb, K. C., III. 1989. Baird's beaked whale Berardius bairdii Stejneger, 1883: Arnoux's beaked whale Berardius arnuxii Duvernoy, 1851. In: Ridgway, S. H. and Harrison, R. (eds.), Handbook of Marine Mammals, Vol. 4. p. 261-288. Academic Press Limited.
Barlow, J. 2010. Cetacean abundance in the California Current from a 2008 ship-based line-transect survey. NOAA Technical Memorandum, NMFS, NOAA-TM-NMFS-SWFSC-456. 19 p.
Barlow, J. and T. Gerrodette. 1996. Abundance of cetaceans in California waters based on 1991 and 1993 ship surveys. U.S. Dep. Commer., NOAA Tech. Memo. NMFS-SWFSC-233.Barlow, J. 1999. Trackline detection probability for long-diving whales. p. 209-224 In: G. W. Garner, S. C. Amstrup, J. L. Laake, B. F. J. Manly, L. L. McDonald, and D. G. Robertson (eds.) Marine Mammal Survey and Assessment Methods. A. A. Balkema, Rotterdam. 287 pp.
Barlow, J. and G.A. Cameron. 2003. Field experiments show that acoustic pingers reduce marine mammal bycatch in the California drift gillnet fishery. Marine Mammal Science 19(2):265-283.
Barlow, J. and K.A. Forney. 2007. Abundance and population density of cetaceans in the California Current ecosystem. Fishery Bulletin 105:509-526.
Berdegué, J. 2002. Depredación de las especies pelágicas reservadas a la pesca deportiva y especies en peligro de extinción con uso indiscriminado de artes de pesca no selectivas (palangres, FAD's, trampas para peces y redes de agallar fijas y a la deriva) por la flota palangrera Mexicana. Fundación para la conservación de los picudos. A.C. Mazatlán, Sinaloa, 21 de septiembre.
Carretta, J.V. and L. Enriquez. 2012a. Marine mammal and seabird bycatch in California gillnet fisheries in 2010. Southwest Fisheries Science Center Administrative Report LJ-12-01. 14p.
Carretta, J.V. and L. Enriquez. 2012b. Marine mammal and seabird bycatch in California gillnet fisheries in 2011. NOAA Technical Memorandum NOAA-TM-NMFS-SWFSC-500. 14 p.
Carretta, J.V. and J. Barlow. 2011. Long-term effectiveness, failure rates, and “dinner bell” properties of acoustic pingers in a gillnet fishery. Marine Technology Society Journal 45:7-19.
Carretta, J.V. and L. Enriquez. 2009a. Marine mammal and seabird bycatch observed in California commercial fisheries in 2007. Administrative Report LJ-09-01, available from Southwest Fisheries Science Center, 3333 North Torrey Pines Rd., La Jolla, CA 92037. 12 p.
Carretta, J.V. and L. Enriquez. 2009b. Marine mammal bycatch observed in the California/Oregon swordfish and thresher shark drift gillnet fishery in 2008. Administrative Report LJ-09-03, available from Southwest Fisheries Science Center, 3333 North Torrey Pines Rd., La Jolla, CA 92037. 10 p .
Carretta, J.V., J. Barlow, and L. Enriquez. 2008. Acoustic pingers eliminate beaked whale bycatch in a gill net fishery. Marine Mammal Science 24(4):956-961.
83

Cox, T. M., T. J. Ragen, A. J. Read, E. Vos, R. W. Baird, K. Balcomb, J. Barlow, J. Caldwell, T. Cranford, L. Crum, A. D’amico, G. D’spain, A. Fernandez, J. Finneran, R. Gentry,W. Gerth, F. Gulland, J. Hildebrand, D. Houser, T. Hullar, P. D. Jepson, D. Ketten, C. D. Macleod, P. Miller, S. Moore, D. C. Mountain, D. Palka, P. Ponganis, S. Rommel, T. Rowles, B. Taylor, P. Tyack, D. Wartzok, R. Gisiner, J. Mead and L. Benner. 2006. Understanding the impacts of anthropogenic Sound on beaked whales. Journal of cetacean research and management 7:177–187.
D’Amico A., Gisiner R.C., Ketten D.R., Hammock J.A., Johnson C., et al. 2009. Beaked whale strandings and naval exercises. Aquat. Mamm. 34: 452–472.
Frantzis, A. 1998. Does acoustic testing strand whales? Nature 392(5):29. Fernández, A., Arbelo, M. and Martín, V. 2013. No mass strandings since sonar ban. Nature 497:317. Filadelfo R., Mintz J., Michlovich E., D’Amico A., Tyack P.L. 2009. Correlating military sonar use with
beaked whale mass strandings: what do the historical data show? Aquat Mamm 34: 435–444. Forney, K.A. 2007. Preliminary estimates of cetacean abundance along the U.S. west coast and within
four National Marine Sanctuaries during 2005. U.S. Department of Commerce, NOAA Technical Memorandum NMFS-SWFSC-406. 27p.
Hildebrand, J.A. (2005) Impacts of anthropogenic sound. In: Reynolds III JE, Perrin WF, Reeves RR, Montgomery S, Ragen TJ, editors. Marine mammal research: conservation beyond crisis. Baltimore: Johns Hopkins University. pp. 101 – 123.
Holts, D. and O. Sosa-Nishizaki. 1998. Swordfish, Xiphias gladius, fisheries of the eastern North Pacific Ocean. In: I. Barrett, O. Sosa-Nishizaki and N. Bartoo (eds.). Biology and fisheries of swordfish, Xiphias gladius. Papers from the International Symposium on Pacific Swordfish, Ensenada Mexico, 11-14 December 1994. U.S. Dep. Commer., NOAA Tech. Rep. NMFS 142, 276 p.
Jepson, P.D., Arbelo, M., Deaville, R., Patterson, I.A.P., Castro, P., Baker, J.R., Degollada, E., Ross, H.M., Herraez, P., Pocknell, A.M., Rodriguez, F., Howiell, F.E., Espinosa, A., Reid, R.J., Jaber, J.R., Martin, V., Cunningham, A.A. and Fernández, A. 2003. Gas-bubble lesions in stranded animals: Was sonar responsible for a spate of whale deaths after an Atlantic military exercise? Nature 425(6958):575-76.
Julian, F. and M. Beeson. 1998. Estimates of mammal, turtle and bird mortality for two California gillnet fisheries: 1990-1995. Fish. Bull. 96:271-284.
MacLeod CD, Perrin WF, Pitman R, Barlow J, Ballance L, D’Amico A, Gerrodette T, Joyce G, Mullin KD, Palka DL, Waring GT. 2006. Known and inferred distributions of beaked whale species (Cetacea: Ziphiidae). Journal of Cetacean Research and Management 7:271-286.
Moore J.E., Barlow J.P. 2013. Declining Abundance of Beaked Whales (Family Ziphiidae) in the California Current Large Marine Ecosystem. PLoS ONE 8(1): e52770. doi:10.1371/journal.pone.0052770
NMFS. 2005. Revisions to Guidelines for Assessing Marine Mammal Stocks. 24 pp. Available at: http://www.nmfs.noaa.gov/pr/pdfs/sars/gamms2005.pdf
Rice, D. W. 1974. Whales and whale research in eastern North Pacific. p. 170-195 In: W. E. Schevill (ed.), The Whale Problem - A Status Report. Harvard University Press, Cambridge, MA.
Richardson, W. J., C. R. Greene, Jr., C. I. Malme, and D. H. Thompson. 1995. Marine Mammals and Noise. Academic Press, San Diego. 576 p.
Simmonds, M.P., and Lopez-Jurado, L.F. 1991. Whales and the military. Nature (London), 351:448. doi:10.1038/351448a0.
Sosa-Nishizaki, O., R. De la Rosa-Pacheco, R. Castro-Longoria, M. Grijalva Chon, and J. De la Rosa Velez. 1993. Estudio biologico pesquero del pez (Xiphias gladius) y otras especies de picudos (marlins y pez vela). Rep. Int. CICESE, CTECT9306.
U.S. Department of Commerce and Secretary of the Navy. 2001. Joint Interim Report, Bahamas Marine Mammal Stranding Event of 15_16 March 2000. Available from NOAA, NMFS, Office of Protected Resources, Silver Spring, MD.
Tyack P.L., Zimmer W.M.X., Moretti D., Southall B.L., Claridge D.E., et al. (2011) Beaked Whales Respond to Simulated and Actual Navy Sonar. PLoS ONE 6(3):e17009. doi:10.1371/journal.pone.0017009
Wade, P. R. and R. P. Angliss. 1997. Guidelines for Assessing Marine Mammal Stocks: Report of the GAMMS Workshop April 3-5, 1996, Seattle, Washington. U. S. Dep. Commer., NOAA Tech. Memo. NMFS-OPR-12. 93 pp.
84

Weilgart, L.S. (2007) The impacts of anthropogenic ocean noise on cetaceans and implications for management. Canadian Journal of Zoology 85:1091-1116.
85

Revised 01/15/2011 9/24/2013
MESOPLODONT BEAKED WHALES (Mesoplodon spp.): California/Oregon/Washington Stocks
STOCK DEFINITION AND GEOGRAPHIC RANGE Mesoplodont beaked whales are distributed throughout deep waters and along the continental slopes of the North Pacific Ocean. At least 5 species in this genus have been recorded off the U.S. west coast, but due to the rarity of records and the difficulty in identifying these animals in the field, virtually no species-specific information is available (Mead 1989). The six species known to occur in this region are: Blainville's beaked whale (M. densirostris), Perrin’s beaked whale (M. perrini), Lesser beaked whale (M. peruvianus), Stejneger's beaked whale (M. stejnegeri), Gingko-toothed beaked whale (M. gingkodens), and Hubbs' beaked whale (M. carlhubbsi) (Mead 1989, Henshaw et al. 1997, Dalebout et al. 2002, MacLeod et al. 2006). Based on bycatch and stranding records in this region, it appears that Hubb’s beaked whale is most commonly encountered (Carretta et al. 2008, Moore and Barlow 2013). Insufficient sighting records exist off the U.S. west coast (Figure 1) to determine any possible spatial or seasonal patterns in the distribution of mesoplodont beaked whales. Until methods of distinguishing these six species at-sea are developed, the management unit must be defined to include all Mesoplodon stocks in this region. However, in the future, species-level management is desirable, and a high priority should be placed on finding means to obtain species-specific abundance information. For the Marine Mammal Protection Act (MMPA) stock assessment reports, three Mesoplodon stocks are defined: 1) all Mesoplodon species off California, Oregon and Washington (this report), 2) M. stejnegeri in Alaskan waters, and 3) M. densirostris in Hawaiian waters. POPULATION SIZE Although mesoplodont beaked whales have been sighted along the U.S. west coast on several line transect surveys utilizing both aerial and shipboard platforms, the rarity of sightings has historically precluded reliable population estimates. Previous Early abundance estimates have been are imprecise and biased downward low by an unknown amount because of the large proportion of time this species spends submerged, and because the ship surveys on which they were based before 1996 covered only California waters, and thus could not observe did not include animals off Oregon/Washington. Furthermore, survey data include there were a large number of unidentified beaked whale sightings, which that are were
Figure 1. Mesoplodon beaked whale sightings based on shipboard surveys off California, Oregon and Washington, 1991-2008 (see Appendix 2 for data sources and information on timing and location of survey effort). Key: = Mesoplodon spp.; ▲= identified Mesoplodon densirostris; ■ = identified Mesoplodon carlhubbsi. Dashed line represents the U.S. EEZ, thin lines indicate completed transect effort of all surveys combined.
86

probably either Mesoplodon sp. or Cuvier's beaked whales (Ziphius cavirostris). An abundance estimate of 1,024 (CV = 0.77) for all species of Mesoplodon beaked whales in the California Current was obtained based on combining data from the two most recent surveys (2005, 2008) conducted within 300 nmi of the coasts of California, Oregon and Washington (Forney 2007, Barlow and Forney 2007, Barlow 2010). This estimate was based in part on a correction factor to account for the proportion of animals on the survey trackline that were likely to missed by observers (0.55), calculated from a model of beaked whale diving behavior, detection distances and searching behavior by the observers (Barlow 1999). Updated analyses are based on 1) combining data from two surveys conducted within 300 nmi of the coasts of California, Oregon and Washington in 2005 (Forney 2007) and 2008 (Barlow 2010), 2) whenever possible, assigning unidentified beaked whale sightings to Mesoplodon spp. or Ziphius cavirostris based on written descriptions, size estimates, and ‘most probable identifications’ made by the observers at the time of the sightings, and 3) estimating a correction factor for animals missed, based on a model of their diving behavior, detection distances, and the searching behavior of observers (Barlow 1999). About 45% of all trackline groups are estimated to be seen. Of the 5 sightings of Mesoplodon made during 2005-2008 surveys [all 5 sightings were made during the 2005 survey] two were identified to the ‘probable’ species level (one Mesoplodon densirostris and one Mesoplodon carlhubbsi). The current An estimate of Blainville’s beaked whale abundance (603, CV = 1.16) is was based on this one probable sighting, while the Hubb’s beaked whale sighting was not recorded during standard survey effort, and thus, there is no estimate of abundance. An updated estimate of abundance for unidentified mesoplodont beaked whales is also presented, based on 2005-2008 survey effort and sightings. Because their distribution varies and animals probably spend time outside the U.S. Exclusive Economic Zone, a multi-year average abundance estimate is the most appropriate for management within U.S. waters. The abundance of Blainville’s beaked whales for California, Oregon, and Washington, based on 2005-2008 surveys is 603 (CV=1.16). The abundance estimate for mesoplodont beaked whales of unknown species, based on the same 2005-2008 surveys is was 421 (CV=0.88). The combined estimate of abundance for all species of Mesoplodon beaked whales in California, Oregon, and Washington waters out to 300 nmi is 1,024 (CV=0.77) animals. This estimate does not include sightings of ‘unidentified beaked whales’ made during 2005 and 2008, some of which may have included beaked whales of the genus Mesoplodon (Forney 2007, Barlow 2010). A trend-based analysis of line-transect data from surveys conducted between 1991 and 2008 yielded new estimates of Mesoplodon species abundance (Moore and Barlow 2013). The new estimate accounts for the proportion of unidentified beaked whale sightings likely to be Mesoplodon beaked whales and uses a correction factor for missed animals adjusted to account for the fact that the proportion of animals on the trackline missed by observers increases in rough observing conditions. The trend-model analysis incorporates information from the entire 1991-2008 time series for each annual estimate of abundance, and given the strong evidence of a decreasing abundance trend over that time (Moore and Barlow 2013), the best estimate of abundance is represented by the model-averaged estimate for 2008. Based on this analysis, the best (50th percentile) estimate of abundance for all species of Mesoplodon species combined in 2008 in waters off California, Oregon and Washington is 694 (CV=0.65). Minimum Population Estimate The minimum population estimate (defined as the log-normal 20th percentile of the abundance estimate) for mesoplodont beaked whales in California, Oregon, and Washington is 576 389 animals. Current Population Trend
There is strong evidence, based on line-transect survey data and the historical stranding record off the U.S. west coast, that the abundance of Mesoplodon beaked whales has recently declined in waters off California, Oregon and Washington (Moore and Barlow 2013, Figure 2). Statistical analysis of line-transect survey data from 1991 - 2008 indicates a 0.96 probability of decline during this period, with the mean annual rate of population change estimated to have been −7.0% per year (95% CRI: −16.7% to +1.0%). Patterns in the historical stranding record alone provide limited information about beaked whale abundance trends, but the stranding record appears generally consistent rather than at-odds with results of the line-transect survey analysis. Regional stranding networks along the Pacific coast of the U.S. and Canada originated during the 1980s, and beach coverage and reporting rates are thought to have increased throughout the 1990s and in to the early 2000s. Therefore, for a stable or increasing population, an overall increasing trend in stranding reports between the 1980s and 2000s would be expected. In contrast, reported
87

strandings for M. carlhubbsi and M. stejnegeri in the California Current region have declined monotonically since the 1980s. CURRENT AND MAXIMUM NET PRODUCTIVITY RATES No information on current or maximum net productivity rates is available for mesoplodont beaked whales. POTENTIAL BIOLOGICAL REMOVAL The potential biological removal (PBR) level for this stock is calculated as the minimum population size (576 389) times one half the default maximum net growth rate for cetaceans (½ of 4%) times a recovery factor of 0.50 (for a species of unknown status with no known recent fishery mortality; Wade and Angliss 1997), resulting in a PBR of 5.8 3.9 mesoplodont beaked whales per year. HUMAN-CAUSED MORTALITY AND SERIOUS INJURY Fishery Information The California large mesh drift gillnet fishery has been the only fishery historically known to interact with Mesoplodon beaked whales in this region. Between 1990 and 1995, a total of eight Mesoplodon beaked whales (5 Hubb’s beaked whales (Mesoplodon carlhubbsi), one Stejneger’s beaked whale (Mesoplodon stejnegeri), and two unidentified whales of the genus Mesoplodon were observed entangled in approximately 3,300 sets (Julian and Beeson 1998, Carretta et al. 2008). Following the introduction of acoustic pingers into this fishery (Barlow and Cameron 2003), no beaked whales of any species have been observed entangled in over 4,000 observed sets (Carretta et al. 2008, Carretta and Enriquez 2009a, 2009b, 2010, 2012a, 2012b, Carretta and Barlow 2011). Mean annual takes in Table 1 are based on 2004-2008 2007-2011 data. This results in an average estimated annual mortality of zero mesoplodont beaked whales. Gillnets have been documented to entangle marine mammals off Baja California (Sosa-Nishizaki et al. 1993), but no recent bycatch data from Mexico are available. Drift gillnet fisheries for swordfish and sharks exist along the entire Pacific coast of Baja California, Mexico and may take animals from this population. Quantitative data are available only for the Mexican swordfish drift gillnet fishery, which uses vessels, gear, and operational procedures similar to those in the U.S. drift gillnet fishery, although nets may be up to 4.5 km long (Holts and Sosa-Nishizaki 1998). The fleet increased from two vessels in 1986 to 31 vessels in 1993 (Holts and Sosa-Nishizaki 1998). The total number of sets in this fishery in 1992 can be estimated from data provided by these authors to be approximately 2700, with an observed rate of marine mammal bycatch of 0.13 animals per set (10 marine mammals in 77 observed sets; Sosa-Nishizaki et al. 1993). This overall mortality rate is similar to that observed in California driftnet fisheries during 1990-95 (0.14 marine mammals per set; Julian and Beeson, 1998), but species-specific information is not available for the Mexican fisheries. Previous efforts to convert the Mexican swordfish driftnet fishery to a longline fishery have resulted in a mixed-fishery, with 20 vessels alternately using longlines or driftnets, 23 using driftnets only, 22 using longlines only, and seven with unknown gear type (Berdegué 2002). Table 1. Summary of available information on the incidental mortality and injury of Mesoplodon beaked whales (California/Oregon/Washington Stocks) in commercial fisheries that might take these species. Mean annual takes are based on 2004-2008 2007-2011 data unless noted otherwise.
Figure 2. Abundance and trend estimates for mesoplodont beaked whales in the California Current, 1991-2008 (Moore and Barlow 2013). For each year, the Bayesian posterior median (●), mean (x) and mode (*) abundance estimates are shown, along with 90% CRIs.
88

Fishery Name
Data Type
Year
Percent Observer Coverage
Observed Mortality
Estimated Annual
Mortality
Mean Annual Takes
(CV in parentheses)
CA/OR thresher shark/swordfish drift gillnet
fishery observer
2004 2005 2006 2007 2008 2009 2010 2011
20.6% 20.9% 18.5% 16.4% 13.5% 13.3% 11.9% 19.5%
0 0 0 0 0
0 0 0 0 0
0
Minimum total annual takes of Mesoplodon beaked whales 0 Other mortality
Anthropogenic sound sources, such as military sonar and seismic testing have been implicated in the mass strandings of beaked whales, including atypical events involving multiple beaked whale species (Simmonds and Lopez-Jurado 1991, Frantiz 1998, Anon. 2001, Jepson et al. 2003, Cox et al. 2006). While D’Amico et al. (2009) note that most mass strandings of beaked whales are unassociated with documented sonar activities, lethal or sub-lethal effects of such activities would rarely be documented, due to the remote nature of such activities and the low probability that an injured or dead beaked whale would strand. Filadelpho et al. (2009) reported statistically significant correlations between military sonar use and mass strandings of beaked whales in the Mediterranean and Caribbean Seas, but not in Japanese and Southern California waters, and hypothesized that regions with steep bathymetry adjacent to coastlines are more conducive to stranding events in the presence of sonar use. In Hawaiian waters, Faerber & Baird (2010) suggest that the probability of stranding is lower than in some other regions due to nearshore currents carrying animals away from beaches, and that stranded animals are less likely to be detected due to low human population density near many of Hawaii’s beaches. Actual and simulated sonar are known to interrupt the foraging dives and echolocation activities of tagged beaked whales (Tyack et al. 2011, DeRuiter et al. 2013). Cuvier’s beaked whales tagged and tracked during simulated mid-frequency sonar exposure showed avoidance reactions, including prolonged diving, cessation of echolocation click production associated with foraging, and directional travel away from the simulated sonar source (DeRuiter et al. 2013). Blainville’s beaked whale presence was monitored on hydrophone arrays before, during, and after sonar activities on a Caribbean military range, with evidence of avoidance behavior: whales were detected throughout the range prior to sonar exposure, not detected in the center of the range coincident with highest sonar use, and gradually returned to the range center after the cessation of sonar activity (Tyack et al. 2011). Fernández et al. (2013) report that there have been no mass strandings of beaked whales in the Canary Islands following a 2004 ban on sonar activities in that region. The absence of beaked whale bycatch in California drift gillnets following the introduction of acoustic pingers into the fishery implies additional sensitivity of beaked whales to anthropogenic sound (Carretta et al. 2008, Carretta and Barlow 2011). Additional, unknown levels of injuries and mortality of mesoplodont beaked whales may occur as a result of anthropogenic sound, such as military sonars (U.S. Dept. of Commerce and Secretary of the Navy 2001) or other commercial and scientific activities involving the use of air guns. Such injuries or mortality would rarely be documented, due to the remote nature of many of these activities and the low probability that an injured or dead beaked whale would strand. STATUS OF STOCKS The status of mesoplodont beaked whales in California, Oregon and Washington waters relative to OSP is not known, and there are insufficient data to evaluate trends in abundance but evidence suggests a high likelihood of population decline in the California Current since the early 1990s, at a mean rate of −7.0% per year, which corresponds to trend-fitted abundance levels in 2008 (most recent survey) being at approximately 30% of 1991 levels. No habitat issues are known to be of concern for this species, but in recent years questions have been raised regarding potential effects of human-made sounds on deep-diving cetacean species, such as mesoplodont beaked whales (Richardson et al. 1995). Moore and Barlow (2013) ruled out bycatch as a cause of the decline in mesoplodont beaked whale abundance and suggest that impacts from anthropogenic sound such as naval sonar and deepwater ecosystem changes within the
89

California Current are plausible hypotheses warranting further investigation.In particular, active sonar has been implicated in the mass stranding of beaked whales in the Mediterranean Sea (Frantzis 1998) and more recently in the Caribbean (U.S. Dept. of Commerce and Secretary of the Navy 2001). None of the six species is listed as "threatened" or "endangered" under the Endangered Species Act, nor considered "depleted" under the MMPA. but given the long-term decline in mesoplodont beaked whale abundance in the California Current reported by Moore and Barlow (2013), these stocks are considered strategic. The degree of decline (trend-fitted 2008 abundance at approximately 30% of 1991 levels) also suggests that these stocks are likely well below their carrying capacity and may be depleted.The average annual known human-caused fishery mortality in 2004-2008 between 2007 and 2011 is zero. Because recent mortality is zero, mesoplodont beaked whales are not classified as a "strategic" stock under the MMPA, and the total fishery mortality and serious injury for this stock can be considered to be insignificant and approaching zero. It is likely that the difficulty in identifying these animals in the field will remain a critical obstacle to obtaining species-specific abundance estimates and stock assessments in the future. The impacts of anthropogenic sound on beaked whales remains a concern (Barlow and Gisiner 2006, Cox et al. 2006, Hildebrand et al. 2005, Weilgart 2007). REFERENCES Anon. 2001. Joint Interim Report, Bahamas Marine Mammal Stranding Event of 15_16 March 2000.
Available from NOAA, NMFS, Office of Protected Resources, Silver Spring, MD. Barlow, J. 2010. Cetacean abundance in the California Current from a 2008 ship-based line-transect
survey. NOAA Technical Memorandum, NMFS, NOAA-TM-NMFS-SWFSC-456. Barlow, J. 1999. Trackline detection probability for long-diving whales. p. 209-224 In: G. W. Garner, S.
C. Amstrup, J. L. Laake, B. F. J. Manly, L. L. McDonald, and D. G. Robertson (eds.) Marine Mammal Survey and Assessment Methods. A. A. Balkema, Rotterdam. 287 pp.
Barlow, J. and G. A. Cameron. 2003. Field experiments show that acoustic pingers reduce marine mammal bycatch in the California drift gillnet fishery. Marine Mammal Science 19(2):265-283.
Barlow, J. and K.A. Forney. 2007. Abundance and population density of cetaceans in the California Current ecosystem. Fishery Bulletin 105:509-526.
Barlow, J. and R. Gisiner. 2006. Mitigating, monitoring, and assessing the effects of anthropogenic sound on beaked whales. J. Cet. Res. Manage. 7(3):239-249.
Berdegué, J. 2002. Depredación de las especies pelágicas reservadas a la pesca deportiva y especies en peligro de extinción con uso indiscriminado de artes de pesca no selectivas (palangres, FAD's, trampas para peces y redes de agallar fijas y a la deriva) por la flota palangrera Mexicana. Fundación para la conservación de los picudos. A.C. Mazatlán, Sinaloa, 21 de septiembre.
Carretta, J.V., J. Barlow, and L. Enriquez. 2008. Acoustic pingers eliminate beaked whale bycatch in a gillnet fishery. Marine Mammal Science 24(4): 956–961.
Carretta, J.V. and L. Enriquez. 2009a. Marine mammal and seabird bycatch observed in California commercial fisheries in 2007. Administrative Report LJ-09-01, available from Southwest Fisheries Science Center, 3333 North Torrey Pines Rd., La Jolla, CA 92037. 12 p.
Carretta, J.V. and L. Enriquez. 2009b. Marine mammal bycatch observed in the California/Oregon swordfish and thresher shark drift gillnet fishery in 2008. Administrative Report LJ-09-03, available from Southwest Fisheries Science Center, 3333 North Torrey Pines Rd., La Jolla, CA 92037. 10 p.
Carretta, J.V. and L. Enriquez. 2010. Marine Mammal and Sea Turtle Bycatch in the California/Oregon Swordfish and Thresher Shark Drift Gillnet Fishery in 2009. Southwest Fisheries Science Center, NOAA Fisheries Administrative Report LJ-10-03. 11p.
Carretta, J.V. and L. Enriquez. 2012b. Marine mammal and seabird bycatch in California gillnet fisheries in 2011. NOAA Technical Memorandum NOAA-TM-NMFS-SWFSC-504. 14 p.
Carretta, J.V. and L. Enriquez. 2012a. Marine mammal and seabird bycatch in California gillnet fisheries in 2010. Southwest Fisheries Science Center Administrative Report LJ-12-01. 14p.
Carretta, J.V. and J. Barlow. 2011. Long-term effectiveness, failure rates, and “dinner bell” properties of acoustic pingers in a gillnet fishery. Marine Technology Society Journal 45:7-19.
Cox, T. M., T. J. Ragen, A. J. Read, E. Vos, R. W. Baird, K. Balcomb, J. Barlow, J. Caldwell, T. Cranford, L. Crum, A. D’amico, G. D’spain, A. Fernandez, J. Finneran, R. Gentry,W. Gerth, F. Gulland, J. Hildebrand, D. Houser, T. Hullar, P. D. Jepson, D. Ketten, C. D. Macleod, P. Miller, S. Moore, D. C. Mountain, D. Palka, P. Ponganis, S. Rommel, T. Rowles, B. Taylor, P. Tyack, D. Wartzok, R.
90
Gisiner, J. Mead and L. Benner. 2006. Understanding the impacts of anthropogenic Sound on beaked whales. Journal of cetacean research and management 7:177–187.
D’Amico A., Gisiner R.C., Ketten D.R., Hammock J.A., Johnson C., et al. 2009. Beaked whale strandings
and naval exercises. Aquat. Mamm. 34: 452–472. Dalebout, M. L., J. G. Mead, C. Scott Baker, A. N. Baker and A. L. van Helden. (2002). A new species of
beaked whale Mesoplodon perrini sp. n. (Cetacea: Ziphiidae) discovered through phylogenetic analyses of mitochondrial DNA sequences. Marine Mammal Science 18:577-608.
DeRuiter, S.L., Southall B.L.,Calambokidis J., Zimmer W.M.X., Sadykova D., Falcone E.A., Friedlaender A.S., Joseph J.E., Moretti D., Schorr G.S., Thomas L., Tyack P.L. 2013. First direct measurements of behavioural responses by Cuvier’s beaked whales to mid-frequency active sonar. Biol Lett 9: 20130223. http://dx.doi.org/10.1098/rsbl.2013.0223
Fernández, A., Arbelo, M. and Martín, V. 2013. No mass strandings since sonar ban. Nature 497:317. Filadelfo R., Mintz J., Michlovich E., D’Amico A., Tyack P.L. 2009. Correlating military sonar use with
beaked whale mass strandings: what do the historical data show? Aquat Mamm 34: 435–444. Frantzis, A. 1998. Does acoustic testing strand whales? Nature 392(5):29. Forney, K.A. 2007. Preliminary estimates of cetacean abundance along the U.S. west coast and within
four National Marine Sanctuaries during 2005. U.S. Department of Commerce, NOAA Technical Memorandum NMFS-SWFSC-406. 27p.
Henshaw, M.D., R.G. LeDuc, S.J. Chivers, and A.E. Dizon. 1997. Identifying beaked whales (Family Ziphiidae) using mtDNA sequences. Marine Mammal Science 13(3):487-495.
Hildebrand, J.A. 2005. Impacts of anthropogenic sound. In: Reynolds III JE, Perrin WF, Reeves RR, Montgomery S, Ragen TJ, editors. Marine mammal research: conservation beyond crisis. Baltimore: Johns Hopkins University. pp. 101–123.
Holts, D. and O. Sosa-Nishizaki. 1998. Swordfish, Xiphias gladius, fisheries of the eastern North Pacific Ocean. In: I. Barrett, O. Sosa-Nishizaki and N. Bartoo (eds.). Biology and fisheries of swordfish, Xiphias gladius. Papers from the International Symposium on Pacific Swordfish, Ensenada Mexico, 11-14 December 1994. U.S. Dep. Commer., NOAA Tech. Rep. NMFS 142, 276 p.
Jepson, P.D., Arbelo, M., Deaville, R., Patterson, I.A.P., Castro, P., Baker, J.R., Degollada, E., Ross, H.M., Herraez, P., Pocknell, A.M., Rodriguez, F., Howiell, F.E., Espinosa, A., Reid, R.J., Jaber, J.R., Martin, V., Cunningham, A.A. and Fernández, A. 2003. Gas-bubble lesions in stranded animals: Was sonar responsible for a spate of whale deaths after an Atlantic military exercise? Nature 425(6958):575-76.
Julian, F. and M. Beeson. 1998. Estimates of mammal, turtle and bird mortality for two California gillnet fisheries: 1990-1995. Fishery Bulletin 96:271-284.
Mead, J. G. 1989. Beaked whales of the genus Mesoplodon. In: Ridgway, S. H. and Harrison, R. (eds.), Handbook of Marine Mammals, Vol. 4., p. 349-430. Academic Press Limited.
MacLeod C.D., Perrin W.F., Pitman R., Barlow J., Ballance L., D’Amico, A., Gerrodette, T., Joyce, G., Mullin, K.D., Palka, D.L., and Waring, G.T. 2006. Known and inferred distributions of beaked whale species (Cetacea: Ziphiidae). Journal of Cetacean Research and Management 7:271–286.
Moore, J.E., Barlow J.P. 2013. Declining abundance of beaked whales (family Ziphiidae) in the California Current large marine ecosystem. PLoS ONE 8(1):e52770. doi:10.1371/journal.pone.0052770
National Marine Fisheries Service, Southwest Fisheries Science Center. Unpublished data. Richardson, W. J., C. R. Greene, Jr., C. I. Malme, and D. H. Thompson. 1995. Marine Mammals and
Noise. Academic Press, San Diego. 576 p. Simmonds, M.P., and Lopez-Jurado, L.F. 1991. Whales and the military. Nature (London), 351:448.
doi:10.1038/351448a0. Sosa-Nishizaki, O., R. De la Rosa-Pacheco, R. Castro-Longoria, M. Grijalva Chon, and J. De la Rosa
Velez. 1993. Estudio biologico pesquero del pez (Xiphias gladius) y otras especies de picudos (marlins y pez vela). Rep. Int. CICESE, CTECT9306.
U.S. Department of Commerce and Secretary of the Navy. 2001. Joint Interim Report, Bahamas Marine Mammal Stranding Event of 15_16 March 2000. Available from NOAA, NMFS, Office of Protected Resources, Silver Spring, MD.
Tyack P.L., Zimmer W.M.X., Moretti D., Southall B.L., Claridge D.E., et al. (2011) Beaked Whales Respond to Simulated and Actual Navy Sonar. PLoS ONE 6(3):e17009. doi:10.1371/journal.pone.0017009.
91

Wade, P. R. and R. P. Angliss. 1997. Guidelines for Assessing Marine Mammal Stocks: Report of the GAMMS Workshop April 3-5, 1996, Seattle, Washington. U. S. Dep. Commer., NOAA Tech. Memo. NMFS-OPR-12. 93 pp.
Weilgart, L.S. 2007. The impacts of anthropogenic ocean noise on cetaceans and implications for management. Canadian Journal of Zoology 85:1091-1116.
92

Revised 01/15/2011 9/24/2013
CUVIER'S BEAKED WHALE (Ziphius cavirostris): California/Oregon/Washington Stock
STOCK DEFINITION AND GEOGRAPHIC RANGE Cuvier's beaked whales are distributed widely throughout deep waters of all oceans (Heyning 1989 MacLeod et al. 2006). Off the U.S. west coast, this species is the most commonly encountered beaked whale (Figure 1). No seasonal changes in distribution are apparent from stranding records, and morphological evidence is consistent with the existence of a single eastern North Pacific population from Alaska to Baja California, Mexico (Mitchell 1968). However, there are currently no international agreements for cooperative management of this species. For the Marine Mammal Protection Act (MMPA) stock assessment reports, Cuvier's beaked whales within the Pacific U.S. Exclusive Economic Zone are divided into three discrete, non-contiguous areas: 1) waters off California, Oregon and Washington (this report), 2) Alaskan waters, and 3) Hawaiian waters. POPULATION SIZE Although Cuvier's beaked whales have been sighted along the U.S. west coast on several line transect surveys utilizing both aerial and shipboard platforms, sightings have been too rare to produce reliable population estimates the rarity of sightings has historically precluded reliable population estimates. Previous Early abundance estimates have been were imprecise and biased downward low by an unknown amount because of the large proportion of time this species spends submerged, and because the ship surveys on which they were based before 1996 covered only California waters, and thus could not observe did not include animals off Oregon/Washington. Furthermore, survey data include there were a large number of unidentified beaked whale sightings, which that are were probably either Mesoplodon sp. or Cuvier's beaked whales (Ziphius cavirostris). An abundance estimate of 2,143 (CV = 0.65) was obtained based on combining data from the two most recent surveys (2005, 2008) conducted within 300 nmi of the coasts of California, Oregon and Washington (Forney 2007, Barlow and Forney 2007, Barlow 2010). This estimate was based in part on a correction factor to account for the proportion of animals on the survey trackline that were likely to missed by observers (0.67), calculated from a model of Cuvier’s beaked whale diving behavior, detection distances and searching behavior by the observers (Barlow 1999). Updated analyses are based on 1) combining data from two surveys conducted within 300 nmi of the coasts of California, Oregon and Washington in 2005 (Forney 2007) and 2008 (Barlow 2010), 2) whenever possible, assigning unidentified beaked whale sightings to Mesoplodon spp. or Ziphius cavirostris based on written descriptions, size estimates, and ‘most probable identifications’ made
Figure 1. Cuvier’s beaked whale sightings based on shipboard surveys off California, Oregon and Washington, 1991-2008 (see Appendix 2, for data sources and information on timing and location of survey effort). Dashed line represents the U.S. EEZ, thin lines indicate completed transect effort of all surveys combined.
93

by the observers at the time of the sightings, and 3) estimating a correction factor for animals missed, based on a model of their diving behavior, detection distances, and the searching behavior of observers (Barlow 1999). An estimated 23% of trackline groups on the trackline are estimated to be seen. Because animals probably spend time outside the U.S. Exclusive Economic Zone, a multi-year average abundance estimate is the most appropriate for management within U.S. waters. The 2005-2008 geometric mean abundance estimate for California, Oregon and Washington waters based on the above analyses is 2,143 (0.65) Cuvier’s beaked whales. A trend-based analysis of line-transect data from surveys conducted between 1991 and 2008 yielded new estimates of Cuvier’s beaked whale abundance (Moore and Barlow 2013). The new estimate is substantially higher than previous estimates in part because it accounts for the proportion of unidentified beaked whale sightings likely to be Cuvier’s beaked whales and because the correction factor for missed animals was adjusted to account for the fact that the proportion of animals on the trackline missed by observers increases in rough observing conditions. The trend-model analysis incorporates information from the entire 1991-2008 time series for each annual estimate of abundance, and given the strong evidence of a decreasing abundance trend over that time (Moore and Barlow 2013), the best estimate of abundance is represented by the model-averaged estimate for 2008. Based on this analysis, the best (50th percentile) estimate of abundance for Cuvier’s beaked whales in 2008 in waters off California, Oregon and Washington was 6,590 (CV=0.55). Minimum Population Estimate Based on the above abundance estimate and CV analysis by Moore and Barlow (2013), the minimum population estimate (defined as the log-normal 20th percentile of the abundance estimate) for Cuvier's beaked whales in California, Oregon, and Washington is 1,298 4,481 animals. Current Population Trend Due to the rarity of sightings of this species on surveys along the U.S. West coast, no information exists regarding trends in abundance of this population. There is substantial evidence, based on line-transect survey data and the historical stranding record off the U.S. west coast, that the abundance of Cuvier’s beaked whales has recently declined in waters off California, Oregon and Washington (Moore and Barlow 2013, Figure 2). Statistical analysis of line-transect survey data from 1991 - 2008 indicates a 0.84 probability of decline during this period, with the mean annual rate of population change estimated to have been −2.9% per year (95% CRI: −8.8% to +3.3%). Patterns in the historical stranding record alone provide limited information about beaked whale abundance trends, but the stranding record appears generally consistent rather than at-odds with results of the line-transect survey analysis. Regional stranding networks along the Pacific coast of the U.S. and Canada originated during the 1980s, and beach coverage and reporting rates are thought to have increased throughout the 1990s and in to the early 2000s. Therefore, for a stable or increasing population, an overall increasing trend in stranding reports between the 1980s and 2000s would be expected. Patterns of Cuvier’s beaked whale strandings data are highly variable across stranding network regions, but an overall increasing trend from the 1980s through 2000s is not evident within the California Current area, contrary to patterns for Baird’s beaked whales (Moore and Barlow 2013) and for cetaceans in general (e.g., Norman et al. 2004, Danil et al. 2010).
Figure 2. Abundance and trend estimates for Cuvier’s beaked whales in the California Current, 1991-2008 (Moore and Barlow 2013). For each year, the Bayesian posterior median (●), mean (x) and mode (*) abundance estimates are shown, along with 90% CRIs.
94

CURRENT AND MAXIMUM NET PRODUCTIVITY RATES No information on current or maximum net productivity rates is available for this species. POTENTIAL BIOLOGICAL REMOVAL The potential biological removal (PBR) level for this stock is calculated as the minimum population size (1,298 4,481) times one half the default maximum net growth rate for cetaceans (½ of 4%) times a recovery factor of 0.50 (for a species of unknown status with no known fishery mortality; Wade and Angliss 1997), resulting in a PBR of 13 45 Cuvier’s beaked whales per year. HUMAN-CAUSED MORTALITY AND SERIOUS INJURY Fishery Information A summary of recent fishery mortality and injury for Cuvier’s beaked whales in this region is shown in Table 1. The California large mesh drift gillnet fishery has been the only fishery historically known to interact with this stock. There have been no Cuvier’s beaked whales observed entangled in over 4,000 drift gillnet fishery sets since acoustic pingers were first used in this fishery in 1996 (Barlow and Cameron 2003, Carretta et al. 2008, Carretta and Enriquez 2009a, 2009b, 2010, 2012a, 2012b, Carretta and Barlow 2011). Prior to 1996, there were a total of 21 Cuvier’s beaked whales entangled in approximately 3,300 drift gillnet fishery sets: 1992 (six animals), 1993 (three), 1994 (six) and 1995 (six) (Julian and Beeson 1998). Mean annual takes in Table 1 are based only on 2004-2008 2007-2011 data. This results in an average estimated annual mortality of zero Cuvier’s beaked whales. Table 1. Summary of available information on the incidental mortality and injury of Cuvier's beaked whales (California/ Oregon/Washington Stock) in commercial fisheries that might take this species. Mean annual takes are based on 2004-2008 2007-2011 data unless noted otherwise.
Fishery Name
Data Type
Year(s)
Percent
Observer Coverage
Observed Mortality +
ReleasedAlive Estimated Annual
Mortality / Mortality + Entanglements
Mean Annual Takes
(CV in parentheses)
CA/OR thresher shark/swordfish drift
gillnet fishery observer
data
2004 2005 2006 2007 2008 2009 2010 2011
20.6% 20.9% 18.5% 16.4% 13.5% 13.3% 11.9% 19.5%
0 0 0 0 0
0 0 0 0 0
0
Minimum total annual takes 0 Gillnets have been documented to entangle marine mammals off Baja California (Sosa-Nishizaki et al. 1993), but no recent bycatch data from Mexico are available. Drift gillnet fisheries for swordfish and sharks exist along the entire Pacific coast of Baja California, Mexico and may take animals from this population. Quantitative data are available only for the Mexican swordfish drift gillnet fishery, which uses vessels, gear, and operational procedures similar to those in the U.S. drift gillnet fishery, although nets may be up to 4.5 km long (Holts and Sosa-Nishizaki 1998). The fleet increased from two vessels in 1986 to 31 vessels in 1993 (Holts and Sosa-Nishizaki 1998). The total number of sets in this fishery in 1992 can be estimated from data provided by these authors to be approximately 2700, with an observed rate of marine mammal bycatch of 0.13 animals per set (10 marine mammals in 77 observed sets; Sosa-Nishizaki et al. 1993). This overall mortality rate is similar to that observed in California driftnet fisheries during 1990-95 (0.14 marine mammals per set; Julian and Beeson, 1998), but species-specific information is not available for the Mexican fisheries. Previous efforts to convert the Mexican swordfish driftnet fishery to a longline fishery have resulted in a mixed-fishery, with 20 vessels alternately using longlines or driftnets, 23 using driftnets only, 22 using longlines only, and seven with unknown gear type (Berdegué 2002). Other mortality
95

Anthropogenic sound sources, such as military sonar and seismic testing have been implicated in the mass strandings of beaked whales, including atypical events involving multiple beaked whale species (Simmonds and Lopez-Jurado 1991, Frantiz 1998, Anon. 2001, Jepson et al. 2003, Cox et al. 2006). While D’Amico et al. (2009) note that most mass strandings of beaked whales are unassociated with documented sonar activities, lethal or sub-lethal effects of such activities would rarely be documented, due to the remote nature of such activities and the low probability that an injured or dead beaked whale would strand. Filadelpho et al. (2009) reported statistically significant correlations between military sonar use and mass strandings of beaked whales in the Mediterranean and Caribbean Seas, but not in Japanese and Southern California waters, and hypothesized that regions with steep bathymetry adjacent to coastlines are more conducive to stranding events in the presence of sonar use. In Hawaiian waters, Faerber & Baird (2010) suggest that the probability of stranding is lower than in some other regions due to nearshore currents carrying animals away from beaches, and that stranded animals are less likely to be detected due to low human population density near many of Hawaii’s beaches. Actual and simulated sonar are known to interrupt the foraging dives and echolocation activities of tagged beaked whales (Tyack et al. 2011, DeRuiter et al. 2013). Cuvier’s beaked whales tagged and tracked during simulated mid-frequency sonar exposure showed avoidance reactions, including prolonged diving, cessation of echolocation click production associated with foraging, and directional travel away from the simulated sonar source (DeRuiter et al. 2013). Blainville’s beaked whale presence was monitored on hydrophone arrays before, during, and after sonar activities on a Caribbean military range, with evidence of avoidance behavior: whales were detected throughout the range prior to sonar exposure, not detected in the center of the range coincident with highest sonar use, and gradually returned to the range center after the cessation of sonar activity (Tyack et al. 2011). Fernández et al. (2013) report that there have been no mass strandings of beaked whales in the Canary Islands following a 2004 ban on sonar activities in that region. The absence of beaked whale bycatch in California drift gillnets following the introduction of acoustic pingers into the fishery implies additional sensitivity of beaked whales to anthropogenic sound (Carretta et al. 2008, Carretta and Barlow 2011). Additional, unknown levels of injuries and mortality of Cuvier’s beaked whales may occur as a result of anthropogenic sound, such as military sonars (U.S. Dept. of Commerce and Secretary of the Navy 2001) or other commercial and scientific activities involving the use of air guns. Such injuries or mortality would rarely be documented, due to the remote nature of many of these activities and the low probability that an injured or dead beaked whale would strand. STATUS OF STOCK The status of Cuvier's beaked whales in California, Oregon and Washington waters relative to OSP is not known, and there are insufficient data to evaluate trends in abundance but evidence suggests a substantial likelihood of population decline in the California Current since the early 1990s, at a mean rate of -2.9% per year, which corresponds to trend-fitted abundance levels in 2008 (most recent survey) being at 61% of 1991 levels. No habitat issues are known to be of concern for this species, but in recent years questions have been raised regarding potential effects of human-made sounds on deep-diving cetacean species such as Cuvier’s beaked whales (Richardson et al. 1995,). In particular, active sonar has been implicated in the mass stranding of beaked whales in the Mediterranean Sea (Frantzis 1998) and more recently in the Caribbean (U.S. Dept. of Commerce and Secretary of the Navy 2001). They are not listed as "threatened" or "endangered" under the Endangered Species Act nor as "depleted" under the MMPA, but given the long-term decline in Cuvier’s beaked whale abundance in the California Current reported by Moore and Barlow (2013), this stock is considered strategic. The degree of decline (trend-fitted 2008 abundance at approximately 61% of 1991 levels) also suggests that this stock is likely below its carrying capacity and may be depleted. Moore and Barlow (2013) ruled out bycatch as a cause of the decline in Cuvier’s beaked whale abundance and suggest that impacts from anthropogenic sounds such as naval sonar and deepwater ecosystem changes within the California Current are plausible hypotheses warranting further investigation. The average annual known human-caused mortality in 2004-2008 between 2007 and 2011 is zero. Because recent human-caused mortality is less than the PBR, Cuvier’s beaked whales are not classified as a "strategic" stock under the MMPA. The total fishery mortality and serious injury for this stock is less than 10% of the PBR and thus can be considered to be insignificant and approaching zero. The impacts of anthropogenic sound on beaked whales remains a concern (Barlow and Gisiner 2006, Cox et al. 2006, Hildebrand et al. 2005, Weilgart 2007). REFERENCES
96

Barlow, J. 2010. Cetacean abundance in the California Current from a 2008 ship-based line-transect survey. NOAA Technical Memorandum, NMFS, NOAA-TM-NMFS-SWFSC-456.
Barlow, J. 1999. Trackline detection probability for long-diving whales. p. 209-224 In: G. W. Garner, S. C. Amstrup, J. L. Laake, B. F. J. Manly, L. L. McDonald, and D. G. Robertson (eds.) Marine Mammal Survey and Assessment Methods. A. A. Balkema, Rotterdam. 287 pp.
Barlow, J. and G. A. Cameron. 2003. Field experiments show that acoustic pingers reduce marine mammal bycatch in the California drift gillnet fishery. Marine Mammal Science 19(2):265-283.
Barlow, J. and R. Gisiner. 2006. Mitigating, monitoring, and assessing the effects of anthropogenic sound on beaked whales. J. Cet. Res. Manage. 7(3):239-249.
Barlow, J. and K.A. Forney. 2007. Abundance and population density of cetaceans in the California Current ecosystem. Fishery Bulletin 105:509-526.
Berdegué, J. 2002. Depredación de las especies pelágicas reservadas a la pesca deportiva y especies en peligro de extinción con uso indiscriminado de artes de pesca no selectivas (palangres, FAD's, trampas para peces y redes de agallar fijas y a la deriva) por la flota palangrera Mexicana. Fundación para la conservación de los picudos. A.C. Mazatlán, Sinaloa, 21 de septiembre.
Carretta, J.V. and L. Enriquez. 2012a. Marine mammal and seabird bycatch in California gillnet fisheries in 2010. Southwest Fisheries Science Center Administrative Report LJ-12-01. 14p.
Carretta, J.V. and L. Enriquez. 2012b. Marine mammal and seabird bycatch in California gillnet fisheries in 2011. NOAA Technical Memorandum NOAA-TM-NMFS-SWFSC-504. 14 p.
Carretta, J.V. and J. Barlow. 2011. Long-term effectiveness, failure rates, and “dinner bell” properties of acoustic pingers in a gillnet fishery. Marine Technology Society Journal 45:7-19.
Carretta, J.V. and L. Enriquez. 2010. Marine Mammal and Sea Turtle Bycatch in the California/Oregon Swordfish and Thresher Shark Drift Gillnet Fishery in 2009. Southwest Fisheries Science Center, NOAA Fisheries Administrative Report LJ-10-03. 11p.
Carretta, J.V. and L. Enriquez. 2009a. Marine mammal and seabird bycatch observed in California commercial fisheries in 2007. Administrative Report LJ-09-01, available from Southwest Fisheries Science Center, 3333 North Torrey Pines Rd., La Jolla, CA 92037. 12 p.
Carretta, J.V. and L. Enriquez. 2009b. Marine mammal bycatch observed in the California/Oregon swordfish and thresher shark drift gillnet fishery in 2008. Administrative Report LJ-09-03, available from Southwest Fisheries Science Center, 3333 North Torrey Pines Rd., La Jolla, CA 92037. 10 p.
Carretta, J.V., J. Barlow, and L. Enriquez. 2008. Acoustic pingers eliminate beaked whale bycatch in a gill net fishery. Marine Mammal Science 24(4):956-961.
Cox T.M., Ragen T.J., Read A.J., Vos E., Baird R.W., et al. 2006. Understanding the impacts of anthropogenic sound on beaked whales. Journal of Cetacean Research and Management 7:177-187.
Danil K., Chivers S.J., Henshaw M.D., Thieleking J.L., Daniels R., et al. 2010. Cetacean strandings in San Diego County, California, USA: 1851–2008. Journal of Cetacean Research and Management 11:163–184.
DeRuiter, S.L., Southall B.L.,Calambokidis J., Zimmer W.M.X., Sadykova D., Falcone E.A., Friedlaender A.S., Joseph J.E., Moretti D., Schorr G.S., Thomas L., Tyack P.L. 2013. First direct measurements of behavioural responses by Cuvier’s beaked whales to mid-frequency active sonar. Biol Lett 9: 20130223. http://dx.doi.org/10.1098/rsbl.2013.0223
Fernández, A., Arbelo, M. and Martín, V. 2013. No mass strandings since sonar ban. Nature 497:317. Forney, K.A. 2007. Preliminary estimates of cetacean abundance along the U.S. west coast and within
four National Marine Sanctuaries during 2005. U.S. Department of Commerce, NOAA Technical Memorandum NMFS-SWFSC-406. 27p.
Heyning, J. E. 1989. Cuvier’s beaked whale Ziphius cavirostris G. Cuvier, 1823. pp. 289-308 In: Ridgway, S. H. and R. Harrison (eds.), Handbook of Marine Mammals, Vol. 4. Academic Press.
Hildebrand J.A. 2005. Impacts of anthropogenic sound. In: Reynolds III JE, Perrin WF, Reeves RR, Montgomery S, Ragen TJ, editors. Marine mammal research: conservation beyond crisis. Baltimore: Johns Hopkins University. pp. 101 – 123.
Holts, D. and O. Sosa-Nishizaki. 1998. Swordfish, Xiphias gladius, fisheries of the eastern North Pacific Ocean. In: I. Barrett, O. Sosa-Nishizaki and N. Bartoo (eds.). Biology and fisheries of swordfish, Xiphias gladius. Papers from the International Symposium on Pacific Swordfish, Ensenada Mexico, 11-14 December 1994. U.S. Dep. Commer., NOAA Tech. Rep. NMFS 142, 276 p.
97

Julian, F. and M. Beeson. 1998. Estimates of mammal, turtle and bird mortality for two California gillnet fisheries: 1990-1995. Fish. Bull. 96:271-284.
MacLeod CD, Perrin WF, Pitman R, Barlow J, Ballance L, D’Amico A, Gerrodette T, Joyce G, Mullin KD, Palka DL, Waring GT. 2006. Known and inferred distributions of beaked whale species (Cetacea: Ziphiidae). Journal of Cetacean Research and Management 7:271-286.
Mitchell, E. 1968. Northeast Pacific stranding distribution and seasonality of Cuvier's beaked whale, Ziphius cavirostris. Can. J. Zool. 46:265-279.
Moore J.E. and Barlow J.P. 2013. Declining Abundance of Beaked Whales (Family Ziphiidae) in the
California Current Large Marine Ecosystem. PLoS ONE 8(1):e52770. doi:10.1371/journal.pone.0052770
Norman S.A., Bowlby C.E., Brancato M.S., Calambokidis J., Duffield D., et al. (2004) Cetacean strandings in Oregon and Washington between 1930 and 2002. Journal of Cetacean Research and Management 6:87-99.
Richardson, W. J., C. R. Greene, Jr., C. I. Malme, and D. H. Thompson. 1995. Marine Mammals and Noise. Academic Press, San Diego. 576 p.
Sosa-Nishizaki, O., R. De la Rosa-Pacheco, R. Castro-Longoria, M. Grijalva Chon, and J. De la Rosa Velez. 1993. Estudio biologico pesquero del pez (Xiphias gladius) y otras especies de picudos (marlins y pez vela). Rep. Int. CICESE, CTECT9306.
U.S. Department of Commerce and Secretary of the Navy. 2001. Joint Interim Report, Bahamas Marine Mammal Stranding Event of 15_16 March 2000. Available from NOAA, NMFS, Office of Protected Resources, Silver Spring, MD.
Wade, P. R. and R. P. Angliss. 1997. Guidelines for Assessing Marine Mammal Stocks: Report of the GAMMS Workshop April 3-5, 1996, Seattle, Washington. U. S. Dep. Commer., NOAA Tech. Memo. NMFS-OPR-12. 93 pp.
Weilgart, L.S. 2007. The impacts of anthropogenic ocean noise on cetaceans and implications for management. Canadian Journal of Zoology 85:1091-1116.
98

Revised12/18/2012 9/24/2013
GRAY WHALE (Eschrichtius robustus): Eastern North Pacific Stock STOCK DEFINITION AND GEOGRAPHIC RANGE
Once common throughout the Northern Hemisphere, the gray whale became extinct in the Atlantic by the early 1700s (Fraser 1970; Mead and Mitchell 1984), though one anomalous sighting occurred in the Mediterranean Sea in 2010 (Scheinin et al. 2011). Gray whales are now only found in the North Pacific where two extant populations are currently recognized (Reilly et al. 2008). Recent g Genetic comparisons suggest indicate that these there are distinct two stocks, called the “Eastern North Pacific” (ENP) and “Western North Pacific” (WNP) population stocks s, are distinct, with differentiation in both mtDNA haplotype and microsatellite allele frequencies (LeDuc et al. 2002; Lang et al. 2011a, Weller et al. 2013).
During summer and fall, most whales in the ENP population feed in the Chukchi, Beaufort and northwestern Bering Seas (Fig. 1). An exception to this generality is the relatively small number (100s) of whales (approximately 200) that summer and feed along the Pacific coast between Kodiak Island, Alaska and northern California (Darling 1984, Gosho et al. 2011, Calambokidis et al. 2002; 2010 2012), also known as the “Pacific Coast Feeding Group” (PCFG). By late November, the southbound migration is underway as whales beginto travel from summer feeding areas to wintercalving areas off the west coast of Baja California, Mexico ., and the southeastern Gulf of California (Rugh et al. 2001; Swartz et al. 2006). The the southbound migration is segregated by age, sex and reproductive condition (Rice and Wolman 1971). The northbound migration begins about mid-February and is also segregated by age, sex and reproductive condition.
Gray whale breeding and calving are seasonal and closely synchronized with migratory timing. Sexual maturity is attained between 6 and 12 years of age (Rice 1990; Rice and Wolman 1971). Gestation is estimated to be 13 months, with calving beginning in late December and continuing to early February (Rice and Wolman 1971). Some calves are born during the southbound migration while others are born near or on the wintering grounds (Sheldon et al. 2004). Females produce a single calf, on average, every 2 years (Jones 1990). Calves are weaned and become independent by six to eight months of age while on the summer feeding ground (Rice and Wolman 1971). Three primary calving wintering lagoons in the ENP are utilized during winter, and some females are known to make repeated returns to specific lagoons (Jones 1990). Genetic studies suggest that some substructuring substructure may occur on the wintering grounds , with is indicated by significant differences in mtDNA haplotype frequencies found between females (mothers with calves) utilizing using two of the primary calving lagoons and females sampled in other areas (Goerlitz et al. 2003). Other research utilizing both mtDNA and microsatellites identified a small but significant departure from panmixia between two of the lagoons using nuclear data, although no significant differences were identified using mtDNA (Alter et al. 2009).
The distribution and migration patterns of gray whales in the WNP are less clear. The main feeding ground is in the Okhotsk Sea off the northeastern coast of Sakhalin Island, Russia, but some animals occur off eastern Kamchatka and in other coastal waters of the northern Okhotsk Sea (Weller et al. 2002; Vertyankin et al. 2004; Tyurneva et al. 2010). Some WNP whales migrate south in autumn, but the migration route(s) and winter breeding ground(s) are poorly known. Information collected over the past century indicates that whales migrate along the coasts of Japan and South Korea (Andrews 1914; Mizue 1951; Omura 1984) to wintering areas somewhere in the South China Sea, possibly near Hainan Island (Wang 1984). No sightings off South Korea have been reported in over a decade, however. Results from photo-identification (Weller et al. 2011), genetic (Lang 2010; Lang et al. 2011a) and telemetry studies (Mate et al. 2011) have documented mixing between the WNP and ENP, including observations of six whales photographically matched from Sakhalin Island to southern Vancouver Island, and two
Figure 1. Approximate distribution of the Eastern North Pacific stock of gray whales (shaded area).
99

whales genetically matched from Sakhalin to Santa Barbara, California. Combined results from photo-ID and genetics studies reveal that a total of 8gray whales have been observed in both the WNP and ENP (Weller et al. 2011; International Whaling Commission (IWC) 2011a). Despite this level of mixing, significant mtDNA and nuclear genetic differences are found between whales in the WNP and those summering in the ENP.
Results from photo-identification (Urbán et al. 2012, Weller et al. 2012), genetic (Lang 2010), and telemetry studies (Mate et al. 2011) have documented spatial and temporal overlap between WNP and ENP gray whales. Observations include: (1) six whales photo-matched from Sakhalin Island to southern Vancouver Island, (2) two whales genetically matched from Sakhalin to Santa Barbara, California, (3) 13 whales photo-matched from Sakhalin Island to San Ignacio Lagoon, Mexico, and (4) two satellite-tagged whales that migrated from Sakhalin Island to the west coast of North America. Despite this overlap, significant mtDNA and nDNA differences are found between whales in the WNP and those summering in the ENP (Lang et al. 2011a). Although it is clear that some whales feeding in the WNP during the summer/fall migrate to the west coast of North America during the winter/spring, past and present observations of gray whales in the WNP off Japan, Korea and China during the winter/spring suggest that not all gray whales in the WNP share a common wintering ground (Weller and Brownell 2012).
Population structure within the ENP is unclear. Recent studies provide new information on gray whale stock structure within the ENP , with emphasis on whales that feed during summer/fall off the Pacific coast between northern California and southeastern Alaska, occasionally as far north as Kodiak Island, Alaska (Gosho et al. 2011) . These whales, collectively known as the “Pacific Coast Feeding Group” (PCFG), are a trans-boundary population with the U.S. and Canada and are defined by the IWC as follows: gray whales observed between 1 June to 30 November within the region between northern California and northern Vancouver Island (from 41°N to 52°N) and photo-identified within this area during two or more years (IWC 2011a; IWC 2011b; IWC 2011c). In 2010, the IWC Standing Working Group on Aboriginal Whaling Management Procedure noted that different names had been used to refer to gray whales feeding along the Pacific coast, and agreed to designate animals that spend the summer and autumn feeding in coastal waters of the Pacific coast of North America from California to southeast Alaska as the “Pacific Coast Feeding Group” or PCFG (IWC 2010, Annex E2012). Laake (2011) refined thisThis definition was further refined for purposes of abundance estimation, limiting the geographic range to the area from northern California to northern British Columbia (from 41°N to 52°N), limiting the temporal range to the period from June 1 to November 30, and counting only those whales seen in more than one year within this geographic and temporal range (IWC 2012). The IWC adopted this definition in 2011, but noted that “not all whales seen within the PCFG area at this time will be PCFG whales and some PCFG whales will be found outside of the PCFG area at various times during the year.” (IWC 2011a2012).
Photo-identification studies from 1998 to 2008 between northern California and northern British Columbia provide data on the abundance and population structure of PCFG whales (Calambokidis et al. 2010 2012). Gray whales using the Pacific Northwest during summer and autumn include two components: 1) whales that frequently return to the area, display a high degree of intra-seasonal “residency” and account for a majority of the sightings between 1 June and 30 November. Despite movement and interchange among sub-regions of the study area, some whales are more likely to return to the same sub-region where they were observed in previous years. 2)“visitors” from the northbound migration that are sighted only in one year, tend to be seen for shorter time periods in that year, and are encountered in more limited areas. Photo-identification (Gosho et al. 2011; Calambokidis et al. 2012) and satellite tagging (Mate et al. 2010, Ford et al. 2012) studies have documented some PCFG whales off Kodiak Island, the Gulf of Alaska, and Barrow, Alaska, all well to the north of the pre-defined 41°N to 52°N boundaries used in some PCFG-related analyses (e.g. abundance estimation). Satellite tagging studies between 3 September and 4 December 2009 off Oregon and California provide movement data for whales considered to be part of the PCFG (Mate et al. 2010). Duration of tag attachment differed between individuals, with some whales remaining in relatively small areas within the larger PCFG seasonal range and others traveling more widely. All six individuals whose tags continued to transmit through the southbound migration utilized the wintering area within and adjacent to Laguna Ojo de Liebre (Scammon´s lagoon). Three whales were tracked north from Ojo de Liebre: one traveled at least as far as Icy Bay, Alaska, while the other two were tracked to coastal waters off Washington (Olympic Peninsula) and California (Cape Mendocino). In addition to satellite tag data, photographic evidence has shown that some presumed PCFG whales move at least as far north as Kodiak Island, Alaska (Calambokidis et al.2010; Gosho et al. 2011). The satellite tag and photo-ID Photo-identification (Gosho et al. 2011; Calambokidis et al. 2012) and satellite tagging (Mate et al. 2010) have documented some known PCFG whales indicate that the range of the some PCFG may, at least for some individuals, exceed well to the north of the pre-defined 41°N to 52°N boundaries that have been used in some PCFG-related analyses (e.g. abundance estimation).
100

Previous genetic studies of PCFG whales have focused on evaluating recruitment patterns, with simulations indicating detectable mtDNA genetic differentiation would result if the PCFG originated from a single colonization event in the past 40 to 100 years, without subsequent external recruitment (Ramakrishnan and Taylor, 2001). Subsequent empirical analysis, however, failed to detect differences when 16 samples collected from known PCFG whales utilizing Clayoquot Sound, British Columbia, were compared with samples (n=41) collected from individuals presumably feeding farther north (Steeves et al. 2001). Additional genetic analysis with an extended set of samples (n=45) collected from whales within the PCFG range indicated that genetic diversity and the number of mtDNA haplotypes were greater than expected (based on simulations) if recruitment into the PCFG were exclusively internal (Ramakrishnan et al. 2001). However, both simulation-based studies focused on evaluating only the hypothesis of founding by a single and recent colonization event and did not evaluate alternative scenarios, such as recruitment of whales from other areas into the PCFG (Ramakrishnan and Taylor 2001; Ramakrishnan et al. 2001). More recently,
Frasier et al. (2011) found significant differences in mtDNA haplotype distributions between PCFG and ENP gray whale sequences, in addition to differences in long-term effective population size, . compared mtDNA sequence data from 40 individuals within the seasonal range of the PCFG with published sequences generated from 105 samples collected from ENP gray whales, most of which stranded along the migratory route (LeDuc et al., 2002). The mtDNA haplotype diversity found among samples of the PCFG was high and similar to the larger ENP samples, but significant differences in mtDNA haplotype distribution and in estimates of long-term effective population size were found. Based on these results, Frasier et al. (2011) and concluded that the PCFG qualifies as a separate management unit under the criteria of Moritz (1994) and Palsbøll et al. (2007). The authors noted that the PCFG whales likely probably mates with the rest of the ENP population and that their findings were the result of maternally-directed site fidelity of whales to different feeding grounds.
A subsequent study by Lang et al. (2011b) assessed stock structure of ENP whales utilizing from different feeding grounds in the ENP using both mtDNA and eight microsatellite markers. Significant mtDNA differentiation was found when samples from individuals (n=71) sighted over two or more years within the seasonal range of the PCFG were compared to samples from whales feeding north of the Aleutians (n=103), as well as and when the PCFG samples were compared to the subset of samples collected off Chukotka, Russia (n=71). No significant differences were found when these same comparisons were made using microsatellite data. The authors concluded that (1) the significant differences in mtDNA haplotype frequencies between the PCFG and whales sampled in the northern areas indicates that the utilization of some feeding areas is being influenced by internal recruitment (e.g., matrilineal fidelity), and (2) the lack of significance in nuclear comparisons suggests that individuals from different feeding grounds may interbreed. The level of mtDNA differentiation identified, while statistically significant, was low and the mtDNA haplotype diversity found within the PCFG was similar to that found in the northern strata. Lang et al. (2011b) suggested that these findings this could be indicative of indicate relatively recent colonization of the PCFG but could also be consistent with a scenario in which external recruitment into the PCFG is occurring. An additional comparison of whales sampled off Vancouver Island, British Columbia (representing the PCFG) and whales sampled at the calving lagoon at San Ignacio also found no significant differences in microsatellite allele frequencies, providing further support for interbreeding between the PCFG and the rest of the ENP stock (D’Intino et al. 2012). Lang and Martien (2012) investigated how much immigration into the PCFG could occur using simulations and produced results consistent with the empirical (mtDNA) analyses of Lang et al. (2011b). Results indicated that immigration of >1 and <10 animals per year into the PCFG was plausible, and that annual immigration of 4 animals/year produced results that were most consistent with those of the empirical study. While the PCFG is recognized as a distinct feeding aggregation (Calambokidis et al. 2012, Mate et al. 2010, Frasier et al. 2011, Lang et al. 2011b, IWC 2012), the status of the PCFG as a population stock remains unresolved (Weller et al. 2013). A NMFS gray whale stock identification workshop held in 2012 included a review of available photo-identification, genetic, and satellite tag data and participants noted that “there remains a substantial level of uncertainty in the strength of the lines of evidence supporting demographic independence of the PCFG.” (Weller et al. 2013). The NMFS task force, charged with evaluating stock status of the PCFG further , noted that “both the photo-identification and genetics data indicate that the levels of internal versus external recruitment are comparable, but these are not quantified well enough to determine if the population dynamics of the PCFG are more a consequence of births and deaths within the group (internal dynamics) rather than related to immigration and/or emigration (external dynamics).” Future research efforts to better identify recruitment levels into the PCFG will be necessary to further assess the stock status of PCFG whales (Weller et al. 2013). In contrast, the task force noted that WNP gray whales should be recognized as a population stock under the MMPA, and NMFS intends on preparing a separate SAR for WNP gray whales in 2014. After reviewing results from photo-identification, telemetry, and genetic studies available in 2010 (i.e. Calambokidis et al. 2010; Mate et al. 2010;
101

Figure 2. Estimated abundance of Eastern North Pacific gray whales from NMFS counts of migrating whales past Granite Canyon, California. Error bars indicated 90% probability intervals. The solid line represents the estimated trend of the population with 90% intervals as dashed lines (after Punt and Wade 2010 2012).
0
50
100
150
200
250
300
350
400
Frasier et al. 2011), the IWC agreed that the hypothesis of the PCFG being a demographically distinct feeding group was plausible and warranted further investigation (IWC 2012a). Recent research by Lang et al. (2011b) provided further support for recognition of the PCFG as a distinct feeding aggregation. Because the PCFG appears to be a distinct feeding aggregation and may warrant consideration as a distinct stock in the future, separate PBRs are calculated for the PCFG within this report. Calculation of a PBR for this feeding aggregation allows NMFS to assess whether levels of human-caused mortality are likely to cause local depletion within this population. POPULATION SIZE Systematic counts of gray whales migrating south along the central California coast have been conducted by shore-based observers at Granite Canyon most years since 1967 (Fig. 2). The most recent southbound counts were made during the 2007/2008, 2009/2010, and 2010/2011 surveys, from which abundance estimates are not yet available.
The most recent estimate of abundance is from the 2006/2007 southbound survey, or is 19,126 (CV=7.1%) whales (Laake et al. 2009 2012). Because of observed interannual differences in correction factors used to correct for bias in estimating pod size (Rugh et al. 2008), the time series of abundance estimates dating back to 1967 was reanalyzed. Laake et al. (2009) developed a more consistent approach to abundance estimation that used a better model for pod size bias and applied their estimation approach to re-estimate abundance for all 23 surveys. The new abundance estimates between 1967 and 1987 were generally larger than previous abundance estimates; differences by year between the new abundance estimate and the old estimate range from -2.5% to 21%. However, the opposite was the case for survey years 1992 to 2006, with estimates smaller (-4.9% to -29%) than previous estimates. This is largely explained by differences in the correction for pod size bias, because the pod sizes in the calibration data were positively-biased. Re-evaluation of the correction for pod size bias and the other changes made to the estimation procedure yielded a somewhat different trajectory for population growth. The estimates still show the population increased steadily from the 1960s until the 1980s. Previously, the peak abundance estimate was in 1998 followed by a large drop in numbers (Rugh et al. 2008). Now the peak estimate is a decade earlier in 1987/88. The revised estimates for the most recent years are 16,369 (CV=6.1%) in 2000/01, 16,033 (CV=6.9%) in 2001/02, and 19,126 (CV=7.1%) in 2006/07. Revised
Figure 3. Number of stranded gray whales recorded along the west coast of North America between 1990 and 2006 (data from Brownell et al. 2007).
102

estimates from the three years prior are 20,103 (CV=5.6%) in 1993-94, 20,944 (CV=6.1%) in 1995-96, and 21,135 (CV=6.8%) in 1997-98 (Laake et al. 2009). Gray whale counting methods were updated with a new counting technique during the 2006/2007 migration where two observers and a computer are used to log and track individual pods (Durban et al. 2010). This replaces a long-used method of a single observer recording sightings on paper forms. The two-observer method allows for a higher frequency of observations of each whale pod, because one observer is dedicated solely to observing pods, while a second observer’s primary role is data recording and software tracking of pods. Evaluations of both counting techniques during simultaneous (2006/2007 and 2007/2008) and independent (2006/2007, 2007/2008, 2009/2010, and 2010/2011) trials have been completed (Durban et al. 2010, 2011) and correction factors for the new approach two-observer method are presently being estimated (Durban et al. 2011).
Photographic mark-recapture abundance estimates for PCFG gray whales between 1998 and 20082010, including estimates for a number of smaller geographic areas within the more broadly IWC-defined PCFG region (41°N to 52°N), are reported in Calambokidis et al. (2010 2012). These estimates were further refined during an inter-sessional workshop of the IWC (IWC 2011b). The 2008 2010 abundance estimate for the defined range of the PCFG between 41°N to 52°N is 194 188 (SE = 17.0 CV=0.10) whales. Eastern North Pacific gray whales experienced an unusual mortality event (UME) in 1999 and 2000, when large numbers of emaciated animals stranded along the west coast of North America (Moore et al., 2001; Gulland et al., 2005). Over 60% of the dead whales were adults, and more adults and subadults stranded in 1999 and 2000 relative to years prior to the mortality event (1996-98), compared with previous years when calf strandings were more common. Many stranded whales were emaciated and aerial photogrammetry documented that gray whales were thinner in 1999 relative to previous years (Perryman and Lynn, 2002). Several factors following this UME suggest that the high mortality rate observed was a short-term, acute event and not a chronic situation or trend: 1) in 2001 and 2002, strandings of gray whales along the coast decreased to levels that were below their pre-1999 UME levels (Gulland et al., 2005); 2) average calf production in 2002-2004 returned to levels seen before 1999; and 3) in 2001, living whales no longer appeared to be emaciated. A Working Group on Marine Mammal Unusual Mortality Events (Gulland et al., 2005) concluded that the emaciated condition of many stranded whales supported the idea that starvation could have been a significant contributing factor to the higher number of strandings in 1999 and 2000. Unusual oceanographic conditions in 1997 may also have decreased productivity in the Bering Sea (Minobe 2002). Regardless of the mechanism, visibly emaciated whales (LeBoeuf et al. 2000; Moore et al. 2001) suggest a decline in available food resources, and it is clear that ENP gray whales were substantially affected in those years; whales were skinnier, they had a lower survival rate (particularly of adults), and calf production was dramatically lower. A modeling analysis estimates that 15.3% of the non-calf population died in each of the years of the mortality event, compared to about 2% in a normal year (Punt and Wade 2010). The most recent abundance estimate from 2006/07 suggests the population has nearly increased back to levels seen in the 1990s before the mortality event in 1999 and 2000 (Figure 2). Oceanographic factors that limited food availability for gray whales were identified as likely causes of the UME (LeBouef et al. 2000, Moore et al. 2001, Minobe 2002, Gulland et al. 2005), with resulting declines in survival rates of adults during this period (Punt and Wade 2012). The population has recovered to levels seen prior to the UME of 1999-2000 (Figure 2). Gray whale calves were have been counted from Piedras Blancas, a shore site in central California, in 1980-81 (Poole 1984a) and each year since from 1994 to 2012 (Perryman et al. 2002, 2004, 2011, Perryman and Weller 2012). In 1980 and 1981, calves passing this site comprised 4.7% to 5.2% of the population (Poole 1984b). Estimates for the total number of northbound calves in from 2001 to 2010 2012 ranged between 254 in 2010 and 1,528 in 2004, with high interannual variability were 256, 842, 774, 1528, 945, 1020, 404, 553, 312 and 254, respectively (Perryman et al. 2011and Weller 2012). These calf estimates were highly variable between years. Calf production indices, as calculated by dividing the northbound calf estimates of northbound calves by estimates of population abundance for the population (Laake et al. 2009 2012), ranged between 1.3 - 8.8% with a mean of (mean=4.2% 4.1%) during 1994-2012 the 17-year time series (1994-2010). Annual indices of calf production include impacts of early postnatal mortality but may overestimate recruitment because they exclude possibly significant levels of killer whale predation on gray whale calves north of the survey site (Barrett-Lennard et al. 2011). The relatively low reproductive output reported is consistent with reports of little or no population growth over the same time period (Laake et al. 2009 2012; Punt and Wade 2010 2012). Comparisons of sea ice cover in the Bering Sea with estimates of northbound calves revealed that average ice cover in the Bering Sea explains roughly 70% of the inter-annual variability in estimates of northbound calves the following spring (Perryman et al. 2011). In other words, a late retreat of seasonal ice may impact access to prey for pregnant females and reduce the probability that existing pregnancies will be carried to term .
103

Gray whale calves have also been counted from shore stations along the California coast during the southbound migration (Shelden et al. 2004). Those results have indicated significant increases in average annual calf counts near San Diego in the mid- to late-1970s compared to the 1950s and 1960s, and near Carmel in the mid-1980s through 2002 compared to late-1960s through 1980 (Shelden et al. 2004). This increase may be related to a trend toward later migrations over the observation period (Rugh et al. 2001, Buckland and Breiwick 2002), or it may be due to an increase in spatial and temporal distribution of calving as the population increased (Shelden et al. 2004). Minimum Population Estimate The minimum population estimate (NMIN) for the ENP stock is calculated from Equation 1 from the PBR Guidelines (Wade and Angliss 1997): NMIN = N/exp(0.842×[ln(1 +[CV(N)]2)]½). Using the 2006/07 abundance estimate of 19,126 and its associated CV of 0.071, NMIN for this stock is 18,017.
The minimum population estimate for PCFG gray whales is calculated as the lower 20th percentile of the log-normal distribution of the 2008 2010 mark-recapture estimate given above, or 180 173 animals. Current Population Trend The population size of the ENP gray whale stock has been increasing increased over the past several decades despite an unusual mortality event UME in 1999 and 2000. The estimated annual rate of increase, based on the unrevised abundance estimates between 1967 and 1988, is 3.3% with a standard error of 0.44% (Buckland et al. 1993). Using the revised the abundance time series from Laake et al. (2009 2012) leads to an annual rate of increase for that same period of is 3.2% with a standard error of 0.5% (Punt and Wade 2010 2012). Abundance estimates of PCFG gray whales reported by Calambokidis et al. (2010) from 1998-2010 indicate a stable population size over multiple spatial scales. No statistical analysis of trends in abundance is currently available for this population. Abundance estimates of PCFG gray whales reported by Calambokidis et al. (2012) show a high rate of increase in the late 1990s and early 2000s, but have been relatively stable since 2003. CURRENT AND MAXIMUM NET PRODUCTIVITY RATES The abundance time-series has been revised (Laake et al. 2009), so estimates of productivity rates must be based on the revised time-series. Using abundance data through 2006/07, an analysis of the ENP gray whale population led to an estimate of Rmax of 0.062, with a 90% probability the value was between 0.032 and 0.088 (Punt and Wade 2010 2012). This estimate came from the best fitting age- and sex-structured model, which was a density-dependent Leslie model including an additional variance term, with females and males modeled separately, that accounted for the mortality event in 1999-2000. During review of a draft of this stock assessment report, the Pacific Scientific Review Group recommended using the Rmax value of 0.062 reported by Punt and Wade (2010), instead of the lower 10thpercentile of this estimate. This value of Rmax is also applied to PCFG gray whales, as it is currently the best estimate of Rmax available for gray whales in the ENPEastern North Pacific. POTENTIAL BIOLOGICAL REMOVAL The potential biological removal (PBR) level for the ENP stock of gray whales is calculated as the minimum population size (18,017), times one-half of the maximum theoretical net population growth rate (½ x 6.2% = 3.1%), times a recovery factor of 1.0 for a stock above MNPL (Punt and Wade 2010 2012), or 558 559 animals. The potential biological removal (PBR) level for PCFG gray whales is calculated as the minimum population size (180 173 animals), times one half the maximum theoretical net population growth rate (½ x 6.2% = 3.1%), times a recovery factor of 0.5 (for a population of unknown status), resulting in a PBR of 2.8 2.7 animals. Use of the recovery factor of 0.5 for PCFG gray whales, rather than 1.0 used for ENP gray whales, is based on uncertainty regarding stock structure and guidelines for preparing marine mammal stock assessments which state that “Recovery factors of 1.0 for stocks of unknown status should be reserved for cases where there is assurance that Nmin, Rmax, and the kill are unbiased and where the stock structure is unequivocal” (NMFS 2005). Given uncertainties in the levels of external versus internal recruitment of PCFG whales described above, the equivocal nature of the stock structure, and the small estimated population size of the PCFG, NMFS will continue to use the default recovery factor of 0.5 until more data on this population becomes available. ANNUAL HUMAN-CAUSED MORTALITY AND SERIOUS INJURY New Serious Injury Guidelines
104

NMFS updated its serious injury designation and reporting process, which uses guidance from previous serious injury workshops, expert opinion, and analysis of historic injury cases to develop new criteria for distinguishing serious from non-serious injury (Angliss and DeMaster 1998, Andersen et al. 2008, NOAA 2012). NMFS defines serious injury as an “injury that is more likely than not to result in mortality”. Injury determinations for stock assessments revised in 2013 or later incorporate the new serious injury guidelines, based on the most recent 5-year period for which data are available. Fisheries Information NMFS observers monitored the California/Oregon thresher shark/swordfish drift gillnet fishery from2006 to 2010 and the California set gillnet halibut fishery in 2006, 2007, and 2010: no No gray whales were observed entangled in California gillnet fisheries between 2007 and 2011 (Carretta and Enriquez 2007, 2009a, 2009b, 2010, 2012 2009a, 2009b, 2010, 2012a, 2012b), but previous mortality in the swordfish drift gillnet fishery has been observed (Carretta et al. 2004) and there have been recent sightings of free-swimming gray whales entangled in gillnets (Table 1). Observers have not been assigned to most Alaska gillnet fisheries largely lack observer programs, including those in Bristol Bay known to interact with gray whales. Due to a lack of observer programs, mortality data from Canadian commercial fisheries is not available. Most data on human-caused mortality and serious injury of gray whales is from strandings, including at-sea reports of entangled animals alive or dead (Carretta et al. 2013). Strandings represent only a fraction of actual gray whale deaths (natural or human-caused), as reported by Punt and Wade (2010 2012), who estimated that only 3.9% to 13.0% of gray whales that die in a given year end up stranding and being reported. A summary of human-caused mortality and serious injury resulting from unknown fishery sources (predominantly mainly pot/trap or net fisheries) is given in Table 1 for the most recent 5-year period of 2006 to 2010 2007 to 2011. Total observed human-caused fishery mortality and serious injury for ENP gray whales for the period 2006 to 2010 2007 to 2011 is 15 11.75 animals (5 serious injuries, 3.75 prorated serious injuries, and 3 deaths), or 3.0 2.4whales per year (Table 1). Total observed human-caused fishery mortality and serious injury for PCFG gray whales for the period 2006 to 2010 2007 to 2011 is one animal 1.75 animals (1 serious injury and 0.75 prorated serious injuries), or 0.2 0.4 whales per year (Table 1). Table 1. Human-caused deaths and serious injuries (SI) of gray whales from fishery-related sources for the period 2006 to 2010 2007 to 2011 as recorded by NMFS stranding networks and observer programs .
Date of observation Location
PCFG range N 41- N 52
AND season?
Description Determination (SI Prorate value)
25-Aug-2011 Petersburg, AK No
Entangled in 50 lbs. Heavy monofilament webbing, cork line, and lead line, as well as over 200 lbs. Of bull kelp attached to gear; completely disentangled; leading edge of flukes had significant cuts and abrasions; overall body condition was poor; massive infestation of whale lice and barnacles; animal very emaciated and lacked any visible signs of recent feeding; observed the day after disentanglement swimming very slowly. Apparent health decline due to constricting and weighted entanglement.
SI
12-Sep-2010 Central Bering Sea No Bering Sea / Aleutian Islands flatfish trawl fishery: 12 m animal
caught in gear. Photos taken. Dead
11-May-2010 Orange County CA No
Free-swimming animal entangled in gillnet; animal first observed inside Dana Point Harbor on 5/11/10; animal successfully disentangled on 5/12/10 & swam out of harbor; animal observed alive in surf zone for several hours on 5/14/10 off Doheny State Beach before washing up dead on beach
Dead
7-May-2010 Cape
Foulweather OR
No Entangled in 3 crab pots, whale not relocated. SI (0.75)
16-Apr-2010 Seaside OR No 27-ft long gray whale stranded dead, entangled in crab pot gear Dead
8-Apr-2010 San Francisco CA No
Rope wrapped around caudal peduncle; identified as gray whale from photo. Free-swimming, diving. No rescue effort, no resightings, final status unknown
SI
5-Mar-2010 San Diego No Free-swimming entangled whale reported by member of the public; no rescue effort initiated; no resightings reported; final status unknown.
SI (0.75)
21-Jul-2009 Trinidad Head CA Yes Free-swimming animal with green gillnet, rope & small black floats
wrapped around caudal peduncle; report received via HSU SI
105

researcher on scene during research cruise; animal resighted on 3 Aug; no rescue effort initiated; final status unknown. Photos show rope cutting into caudal peduncle. This whale was re-sighted in 2010 and 2011, still trailing gear.
24-Jun-2009 Clallam County, WA Yes
Whale found entangled in tribal set gillnet in morning. Net had been set 8 pm previous day. Whale able to breath, but not swim freely and was stationary in net. Right pectoral flipper and head were well-wrapped in net webbing. In response to disentanglement attempts, whale reacted violently and swam away. The net was retrieved and found to be torn in two. No confirmation on whether whale was completely free of netting.
SI (0.75)
9-Apr-2009 Sitka, AK No Thick black line wrapped twice around whale's body posterior to the eyes was cut and pulled away by private citizen. Animal swam away and dove.
SI (0.75)
25-Mar-2009 Seal Beach CA No
Free-swimming animal with pink gillnet wrapped around head, trailing 4 feet of visible netting; report received via naturalist on local whale watch vessel; no rescue effort initiated; final status unknown
SI (0.75)
31-Jan-2009 San Diego CA No Free-swimming animal towing unidentified pot/trap gear; report received via USCG on scene; USCG reported gear as 4 lobster pots; final status unknown
SI (0.75)
16-Apr-2008 Eel River CA No
Observed 12 miles west of Eel River by Humboldt State University personnel. It was unknown sexwith an estimated length of 20 ft and in emaciated condition. The animal was described as towing 40-50 feet of line & 3 crab pot buoys from the caudal peduncle and moving very slowly. Vessel retrieved the buoys, pulled them and ~20 ft of line onto the deck and cut it loose from the whale. The whale swam away slowly with 20-30 feet of line still entangling the peduncle, outcome unknown. Identification numbers on buoy traced to crab pot fishery gear that was last fished in Bering Sea in December 2007.
SI
26-Jul-2007 Seattle WA No1 Some gear was removed from the animal, swam away with gear still attached, tribal fishing nets, animal was not sighted again to remove more gear.
SI
20-Apr-2007 Newport OR No
Entangled in crab gear. skipper of nearby vessel removed 8 pots before he had to return to port due to darkness whale still had 8 buoys and several wraps of line around mid-section, left pectoral flipper, and through mouth
SI
13-Jul-06 Ekuk, AK No Stranded animal at Etolin Pt. Observed in commercial salmon set net. Dead
3-Jul-06 Bristol Bay, AK No Animal trailing gear, able to swim but not dive. Ropes, buoys, and
single line with buoys reported around mid-section. SI
29-May-06 Gray's Harbor WA No
Entangled in crab pot. Rope wrapped around fluke, tailstock, mid-body and through baleen. Rope scarring on head and left side (right side unseen).
Dead
14-May-06 Lakeside OR No Live entangled gray whale calf with crab pot and gear wrapped around tail stock and mouth, died on 5/15 Dead
23-Apr-06 Cape Lookout OR No
Entangled whale close to shore, was behind two other larger whales; whale had netting over snout and long line (8-10 times its body length) and 2 bright orange floats
SI
Subsistence/Native Harvest Information Subsistence hunters in Russia and the United States have traditionally harvested whales from the ENP stock in the Bering Sea, although only the Russian hunt has persisted in recent years (Huelsbeck 1988, Reeves 2002). The Makah Tribe of Washington State traditionally hunted gray whales for at least several hundred years until the early 20th century (Huelsbeck 1988) and has requested authorization from NOAA/NMFS, under the MMPA and the Whaling Convention Act, to resume limited hunting of gray whales (see details in Stock Definition and Geographic Range section of this report). In 2005, the Makah Indian Tribe requested authorization from NOAA/NMFS, under the MMPA and the Whaling Convention Act, to resume limited hunting of gray whales for ceremonial and subsistence purposes in the coastal portion of their usual and accustomed (U&A) fishing grounds off the coast of Washington State (NMFS 2008). The spatial overlap of the Makah U&A and the summer distribution of PCFG
1For purposes of calculating annual human-caused mortality, this whale is counted as an ENP whale and not part of the PCFG. This determination is based on observations that PCFG whales are not known to enter Puget Sound and current estimates of PCFG population size exclude whales seen in this area (J. Calambokidis, Cascadia Research, personal communication).
106

whales has management implications. The proposal by the Makah Tribe includes time/area restrictions designed to reduce the probability of killing a PCFG whale and to focus the hunt on whales migrating to/from feeding areas to the north. The Makah proposal also includes catch limits for PCFG whales that result in the hunt being terminated if these limits are met. Similarly, observations of gray whales moving between the western and eastern North Pacific WNP and ENP highlights the need to estimate the probability of a WNP gray whale that utilizes summer feeding areasobserved in the WNP being taken during a hunt by the Makah Tribe (IWC 2011a; IWC 2011b Moore and Weller 2012). NMFS has published a notice of intent to prepare an environmental impact statement (EIS) on the proposed hunt (NMFS 2012) and the IWC is evaluating the what potential impacts a hunt could have on the PCFG has evaluated the potential impacts of the proposed hunt and other sources of human-caused mortality on PCFG whales and concluded, with certain qualifications, that the proposed hunt meets the Commission’s conservation objectives (IWC 2013). The Scientific Committee has not scheduled an implementation review of the impacts of the Makah hunt on whales using summering feeding areas in the WNP, but is continuing to investigate stock structure of north Pacific gray whales and may schedule such a review in the future (IWC 2013). (IWC 2011a; IWC 2011c; IWC 2011b IWC 2012). In 2007 2012, the IWC approved a 5- 6-year quota (2008-2012) of 620 (2013-2018) of 744 gray whales, with an annual cap of 140, for Russian and U.S. (Makah Indian Tribe) aboriginals based on the aboriginal needs statements from each country the joint request and needs statements submitted by the U.S. and Russian federation. The U.S. and Russia have agreed that the quota will be shared with an average annual harvest of 120 whales by the Russian Chukotka people and 4 whales by the Makah Indian Tribe. Total takes by the Russian hunt during the past five years were: 129 in 2006 (IWC 2008), 126 in 2007 (IWC 2009), 127 in 2008 (IWC 2010), 115 in 2009 (IWC 2011c) and 118 in 2010 (IWC 2011a), and 128 in 2011 (IWC 2012). Based on this information, the annual subsistence take averaged 123 123 whales during the 5-year period from 2006 to 2010 2007 to 2011 . Other Mortality Ship strikes are a source of mortality for gray whales (Table 2). For the most recent five-year period, 2006-2010, 2007-2011 the total serious injury and mortality of ENP gray whales attributed to ship strikes is 11 9.8 animals (including six deaths, three serious injuries, and three prorated serious injuries, and , or 2.2 or 2.0 whales per year (Table 2, Carretta et al. 2013). The total ship strike serious injury and mortality of PCFG gray whales during this same period is one animal 1.5 animals, or 0.2 0.3 whales per year (Table 2). Additional mortality from ship strikes probably goes unreported because the whales either do not strand or do not have obvious signs of trauma. In February 2010, a gray whale stranded dead near Humboldt, CA with parts of two harpoons embedded in the body. Since this whale was likely harpooned during the aboriginal hunt in Russian waters, it would have been counted as “struck and lost” in the harvest data. One PCFG gray whale was illegally killed by hunters in Neah Bay in September 2007 (Calambokidis et al. 2009). HABITAT CONCERNS Evidence indicates that the Arctic climate is changing significantly, resulting in a reductions in the extent of sea ice cover in some regions (Johannessen et al. 2004, Comiso et al. 2008 ). These changes are likely to affect gray whales. For example, due to the impacts on the species’ benthic food supply. With the increase in numbers of gray whales (Rugh et al. 2005), in combination with changes in prey distribution (Grebmeier et al. 2006; Moore et al. 2007), some the summer range of gray whales has greatly expanded in the past decade (Rugh et al. 2001). Moore and Huntington (2008) observed that gray whales are opportunistic foragers, with documented feeding year-round off Kodiak, Alaska. Bluhm and Gradinger (2008) examined the availability of pelagic and benthic prey in the Arctic and concluded that pelagic prey is likely to increase while benthic prey is likely to decrease in response to climate change. They noted that marine mammal species that exhibit trophic plasticity (such as gray whales which feed on both benthic and pelagic prey) will adapt better than trophic specialists. Global climate change is also likely to increase human activity in the Arctic as sea ice decreases, including oil and gas exploration and shipping (Hovelsrud et al. 2008). Such activity will increase the chance of oil spills and ship strikes in this region. Gray whales have demonstrated avoidance behavior to anthropogenic sounds associated with oil and gas exploration (Malme et al. 1983, 1984) and low-frequency active sonar during acoustic playback experiments (Buck and Tyack 2000, Tyack 2009). Table 2. Summary of gray whale serious injuries (SI) and deaths attributed to vessel strikes for the five-year period 2006-2010 2007-2011.
Date of Location PCFG range Description Determination
107

observation N 41 - N 52 AND season?
(SI prorate value)
6-Jun-2011 San Mateo CA Yes
Massive hemorrhage into the thorax, blood clots around lungs. Lesions indicate massive trauma. Due to carcass position, the skeleton could not be completely examined (lying on back, top of skull in sand).
Dead
8-Apr-2011 San
Francisco CA
No Crushed mandible.
Dead
12-Feb-2011 Los
Angeles CA
No
Private recreational vessel collided with free-swimming animal; animal breached just prior to contact, bouncing off side of vessel; dove immediately following contact & was not resighted; no blood observed in water; final status unknown; skin sample collected from vessel and genetically identified as a female gray whale. Vessel size assumed less than 65 ft and speed unknown.
SI (0.14)
22-Jan-2011 San Diego CA No
Pleasure sailboat collided with free-swimming animal; animal dove immediately following contact & was not resighted; no blood observed in water; final status unknown. Vessel size assumed less than 65 ft. And speed unknown.
SI (0.14)
12-Mar-2010 Santa
Barbara CA
No
21 meter sailboat underway at 13 kts collided with free-swimming animal; whale breached shortly after collision; no blood observed in water; minor damage to lower portion of boat's keel; final status unknown; DNA analysis of skin sample confirmed species.
SI
16-Feb-2010 San Diego CA No Free-swimming animal with propeller-like wounds to dorsum. SI (0.52)
9-Sep-2009 Quileute River WA Yes
USCG vessel reported to be traveling at 10 knots when they hit the gray whale at noon on 9/9/2009. The animal was hit with the prop and was reported alive after being hit, blood observed in water.
SI (0.52)
1-May-2009 Los
Angeles CA
No
Catalina island transport vessel collided with free-swimming calf accompanied by adult animal; calf was submerged at time of collision; pieces of flesh & blood observed in water; calf never surfaced; presumed mortality.
SI
27-Apr-2009 Whidbey Is. WA No
Large amount of blood in body cavity, bruising in some areas of blubber layer and in some internal organs. Findings suggestive of blunt force trauma likely caused by collision with a large ship.
Dead
5-Apr-2009 Sunset Beach CA No Dead stranding; 3 deep propeller-like cuts on right side, just anterior of
genital opening; carcass towed out to sea Dead
4-Apr-2009 Ilwaco WA No Necropsied, broken bones in skull; extensive hemorrhage head and thorax; sub-adult male Dead
1-Mar-2008 Mexico No Carcass brought into port on bow of cruise ship; collision occurred betweeen ports of San Diego and Cabo San Lucas between 5:00 p.m. On 2/28 & 7:20 a.m. On 3/1
Dead
7-Feb-2008 Orange County CA No
Carcass; propeller-like wounds to left dorsum from mid-body to caudal peduncle; deep external bruising on right side of head; field necropsy revealed multiple cranial fractures
Dead
1-Jun-2007 Marin, CA No Carcass; 4 propeller-like wounds to body Dead
20-Apr-06 San
Francisco CA
No Floating carcass; propeller wounds; killer whale rake mark scars Dead
24-Mar-06 San Diego CA No Free-swimming animal struck by 18 foot pleasure craft; blood observed in
water; final status of animal unknown SI
Ocean acidification could reduce the abundance of shell-forming organisms (Fabry et al. 2008, Hall-Spencer et al. 2008), many of which are important in the gray whales’ diet (Nerini 1984, Moore and Huntington 2008). STATUS OF STOCK In 1994, the ENP stock of gray whales was removed from the List of Endangered and Threatened Wildlife (the List), as it was no longer considered endangered or threatened under the Endangered Species Act (ESA)(NMFS 1994). Punt and Wade (2010 2012) estimated the ENP population was at 91% 85% of carrying capacity (K) and at 129% of the maximum net productivity level (MNPL), with a probability of 0.884 that the population is above MNPL and therefore within the range of its optimum sustainable population (OSP). Even though the stock is within OSP, abundance will fluctuate as the population adjusts to natural and human-caused factors affecting carrying capacity of the environment (Rugh et al. 2005 Punt and Wade 2012). It is expected that a population close to or at carrying capacity will be more susceptible to environmental fluctuations (Moore et al. 2001). The correlation between gray whale calf production and environmental conditions in the
108

Bering Sea (Perryman et al. 2002; Perryman and Weller 2012) may reflect this. Overall, the population nearly doubled in size over the first 20 years of monitoring, and has fluctuated for the last 30 years around its average carrying capacity. This is consistent with a population approaching K. Alter et al. (2007) used estimates of genetic diversity to infer that North Pacific gray whales may have numbered ~96,000 animals in both the western and eastern populations 1,100-1,600 years ago. The authors recommend that because the current estimate of the eastern stock of gray whales is at most 28-56% of this historic abundance, the stock should be designated as “depleted” under the MMPA. NMFS does not accept the recommendation made by Alter et al. (2007) for the following reasons. First, their analysis examines the historic population of the entire Pacific population of gray whales, while MMPA management occurs at the level of a stock, which in this case is the ENP stock. It is speculative to try to determine what proportion of the estimated abundance may have been in the eastern or western populations. It is also uncertain if Alter et al.’s estimates the estimates from Alter et al. (2007) include the Atlantic population (Palsbøll et al. 2007). Second, NMFS relies on current carrying capacity in making MMPA determinations. Ecosystems change over time and with those changes, the carrying capacity of the ecosystem also changes. NMFS interprets carrying capacity to mean “current” carrying capacity in part because it is not reasonable to expect ecosystems to remain static over thousands of years. Thus, an estimate of stock abundance 1,100-1,600 years ago is not relevant to MMPA decision-making, even if such an estimate were available.
Based on 2006-2010 2007-2011 data, the estimated annual level of human-caused mortality and serious injury for ENP gray whales includes Russian harvest (123), mortality from commercial fisheries (3.0) (2.4), and ship strikes (2.2) (2.0), totals 128 127 whales per year, which does not exceed the PBR (558). The IWC completed an implementation review for ENP gray whales (including the PCFG) in 2012 (IWC 2013) and concluded that harvest levels (including the proposed Makah hunt) and other human caused mortality are sustainable, given the current population abundance (Laake et al. 2012, Punt and Wade 2012). Therefore, the ENP stock of gray whales is not classified as a strategic stock.
PCFG gray whales do not currently have a formal status under the MMPA, though the population size appears to have been stable since 2003, based on photo-ID studies (IWC 2011a; IWC 2011b Calambokidis et al. 2012, IWC 2012).Total annual human-caused mortality of PCFG gray whales during the period 2006 to 2010 2007 to 2011 includes deaths due to commercial fisheries (0.2/yr) (0.4/yr), ship strikes (0.2/yr) (0.3/yr), and illegal hunts (0.2/yr), or 0.6 0.9 whales annually. This does not exceed the PBR level of 2.8 2.7 whales for this population. Levels of human-caused mortality and serious injury resulting from commercial fisheries and ship strikes for both ENP and PCFG whales represent minimum estimates as recorded by stranding networks or at-sea sightings. REFERENCES Alter, S.E., S. Flores, J. Urban, L. Rojas-Bracho, and S.R. Palumbi. 2009. Mitochondrial and nuclear genetic
variation across calving lagoons in Eastern North Pacific gray whales (Eschrichtius robustus). Journal of Heredity 100:34-46.
Alter, S.E., E. Rynes, and S. R. Palumbi. 2007. DNA evidence for historic population size and past ecosystem impacts of gray whales. Proc. Nat. Acad. Sci. 104(38):15162-15167.
Andersen, M. S., K. A. Forney, T. V. N. Cole, T. Eagle, R. Angliss, K. Long, L. Barre, L. Van Atta, D. Borggaard, T. Rowles, B. Norberg, J. Whaley, and L. Engleby. 2008. Differentiating Serious and Non-Serious Injury of Marine Mammals: Report of the Serious Injury Technical Workshop, 10-13 September 2007, Seattle, Washington. U.S. Dep. Commer., NOAA Tech. Memo. NMFS-OPR-39. 94 p.
Angliss, R.P. and D.P. DeMaster. 1998. Differentiating Serious and Non-Serious Injury of Marine Mammals Taken Incidental to Commercial Fishing Operations. NOAA Tech Memo. NMFS-OPR-13, 48 p.
Andrews, R.C. 1914. Monographs of the Pacific Cetacea. I. The California gray whale (Rhachianectes glaucus Cope). Mem. Am. Mus. Nat. Hist. 1(5):227-87.
Barrett-Lennard, Lance G., Craig O. Matkin, John W. Durban, Eva L. Saulitis, and David Ellifrit. 2011. Predation on gray whales and prolonged feeding on submerged carcasses by transient killer whales at Unimak Island, Alaska. Marine Ecology Progress Series 421:229-241.
Bluhm, B. and Gradinger, R. 2008. Regional variability in food availability for Arctic marine mammals. Ecol. Appl. 18: S77-96.
Brownell, R. L., Jr., C. A. F. Makeyev, and T. K. Rowles. 2007. Stranding trends for Eastern Gray Whales, Eschrichtius robustus: 1975-2006. Paper SC/59/BRG40 submitted to IWC Scientific Committee.
Buck, J.R. and P.L. Tyack. 2000. Response of gray whales to low-frequency sounds. J. Acoust. Soc. Am. 107:2774. Buckland, S. T., and J. M. Breiwick. 2002. Estimated trends in abundance of eastern Pacific gray whales from
shore counts (1967/68 to 1995/96). J. Cetacean Res. Manage. 4:41-48.
109

Buckland, S. T., J. M. Breiwick, K. L. Cattanach, and J. L. Laake. 1993. Estimated population size of the California gray whale. Mar. Mammal Sci. 9:235-249.
Calambokidis, J., J.L. Laake and A. Klimek. 2010. Abundance and population structure of seasonal gray whales in the Pacific Northwest, 1998 - 2008. Paper IWC/62/BRG32 submitted to the International Whaling Commission Scientific Committee. 50 pp.
Calambokidis, J., J.L. Laake and A. Klimek. 2012. Updated analysis of abundance and population structure of seasonal gray whales in the Pacific Northwest, 1998-2010. Paper SC/M12/AWMP2-Rev submitted to the IWC Scientific Committee. 65 pp.
Calambokidis, J. A. Klimek, and L. Schlender. 2009. Summary of collaborative photographic identification of gray whales from California to Alaska for 2007. Final Report for Purchase OrderAB133F-05-SE-5570.Available from Cascadia Research (www.cascadiaresearch.org), 218½ W Fourth Ave., Olympia, WA 98501.
Calambokidis, J., J. D. Darling, V. Deeke, P. Gearin, M. Gosho, W. Megill, C. M. Tombach, D. Goley, C. Toropova and B. Gisbourne. 2002. Abundance, range and movements of a feeding aggregation of gray whales (Eschrichtius robustus) from California and southeastern Alaska in 1998. J. Cetacean Res. Manage. 4:267-276.
Carretta, J. V., S. M. Wilkin, M. M. Muto, and K. Wilkinson. 2013. Sources of human-related injury and mortality for U.S. Pacific west coast marine mammal stock assessments, 2007-2011. U.S. Dep. Commer., NOAA Tech. Memo. NMFS-SWFSC-514, 83 p.
Carretta, J.V. and L. Enriquez. 2012b. Marine mammal and seabird bycatch in California gillnet fisheries in 2011. NOAA Technical Memorandum NOAA-TM-NMFS-SWFSC-500. 14 p.
Carretta, J.V. and L. Enriquez. 2012a. Marine mammal and seabird bycatch in California gillnet fisheries in 2010. Administrative Report LJ-12-01.NOAA Fisheries, Southwest Fisheries Science Center, National Marine Fisheries Service, La Jolla, CA 92037.14 p.
Carretta, J.V. and L. Enriquez. 2010. Marine mammal and sea turtle bycatch in the California/Oregon swordfish and thresher shark drift gillnet fishery in 2009. Administrative Report LJ-10-03.NOAA Fisheries, Southwest Fisheries Science Center, National Marine Fisheries Service, La Jolla, CA 92037.11 p.
Carretta, J.V. and L. Enriquez. 2009b. Marine mammal bycatch in the California/Oregon swordfish and thresher shark drift gillnet fishery in 2008. Administrative Report LJ-09-03.NOAA Fisheries, Southwest Fisheries Science Center, 3333 North Torrey Pines Court, La Jolla, CA 92037. 10p.
Carretta, J.V. and L. Enriquez. 2009a. Marine mammal and seabird bycatch observed in California commercial fisheries in 2007. Administrative Report LJ-09-01.NOAA Fisheries, Southwest Fisheries Science Center, 3333 North Torrey Pines Court, La Jolla, CA 92037. 12p.
Carretta, J.V., T. Price, D. Petersen, and R. Read. 2004. Estimates of marine mammal, sea turtle, and seabird mortality in the California drift gillnet fishery for swordfish and thresher shark, 1996-2002. Marine Fisheries Review 66(2):21-30.
Carretta, J.V. and L. Enriquez.2007. Marine mammal and sea turtle bycatch in the Calfornia/Oregon thresher shark and swordfish drift gillnet fishery in 2006. Administrative Report LJ-07-06. Southwest Fisheries Science Center, NOAA NMFS, 8604 La Jolla Shores Drive, La Jolla, CA 92037. 9p.
Comiso, J.C., C.L. Parkinson, R. Gersten, and L. Stock. 2008. Accelerated decline in the Arctic sea ice cover. Geophysical Research Letters, Vol. 35, L01703, doi:10.1029/2007GL031972.
Darling, J. D. 1984. Gray whales off Vancouver Island, British Columbia. Pp. 267-287 In M. L. Jones, S. L. Swartz, and S. Leatherwood (eds.), The Gray Whale, Eschrichtius robustus. Academic Press, Inc., Orlando.xxiv + 600 pp.
D’Intino, A. M., Darling, J. D., Urbán-Raminez, J., and Frasier, T. R. 2012. Substructuring of mitochondrial, but not nuclear, markers in the “southern feeding group” of eastern North Pacific gray whales. Paper SC/64/AWMP2 presented to IWC Scientific Committee.
Durban, J., Lang, A., Weller, D.W., Rugh, D., Hobbs, R., Perryman, W. 2010. Comparing shore-based counts of eastern North Pacific gray whales. Paper SC/62/BRG8 presented to the IWC Scientific Committee.
Durban, J., Weller, D.W., Lang, A. and Perryman, W. 2011. Abundance indices of eastern North Pacific gray whales from southbound migration counts, 2007-2011. Paper SC/62/BRG7 presented to the IWC Scientific Committee.
Fabry, V. J., B. A. Seibel, R. A. Feely, and J. C. Orr. 2008. Impacts of ocean acidification on marine fauna and ecosystem processes. – ICES Journal of Marine Science, 65(3): 414–432.
Ford, J. K., Durban, J. W., Ellis, G. M., Towers, J. R., Pilkington, J. F., Barrett‐Lennard, L. G. and Andrews, R. D. 2012. New insights into the northward migration route of gray whales between Vancouver Island, British Columbia, and southeastern Alaska. Marine Mammal Science. doi: 10.1111/j.1748-7692.2012.00572.x
110

Fraser, F. C. 1970. An early 17th century record of the California gray whale in Icelandic waters. Investigations on Cetacea 2:13-20.
Frasier, T.R., S.M. Koroscil, B.N. White, and J.D. Darling. 2011. Assessment of population substructure in relation to summer feeding ground use in the eastern North Pacific gray whale. Endangered Species Research 14:39-48.
Goerlitz, D.S., J. Urban, L. Rojas-Bracho, M. Belson and C.M. Schaeff. 2003. Mitochondrial DNA variation among Eastern North Pacific gray whales (Eschrichtius robustus) on winter breeding grounds in Baja California. Canadian Journal of Zoology-Revue Canadienne De Zoologie 81:1965-1972.
Gosho, M., P. Gearin, R. Jenkinson, J. Laake, L. Mazzuca, D. Kubiak, J. Calambokidis, W. Megill, B. Gisborne, D. Goley, C. Tombach, J. Darling, and V. Deecke. 2011. Movements and diet of gray whales (Eschrichtius robustus) off Kodiak Island, Alaska, 2002 – 2005. Paper SC/M11/AWMP2 presented to the International Whaling Commission AWMP workshop 28 March-1 April 2011.
Grebmeier, J. M., Overland, J. E., Moore, S. E., Farley, E. V., Carmack, E. C., Cooper, L. W., Frey, K. E., Helle, J. H., McLaughlin, F. A. & McNutt, S. L. 2006. A major ecosystem shift in the northern Bering Sea. Science, 311, 1461-1464.
Gulland, F.M.D., H. Pérez-Cortés M., J. Urgán R., L. Rojas-Bracho, G. Ylitalo, J. Weir, S.A. Norman, M.M. Muto, D.J. Rugh, C. Kreuder, and T. Rowles. 2005. Eastern North Pacific gray whale (Eschrichtius robustus) unusual mortality event, 1999-2000. U.S. Dep. Commer., NOAA Tech. Memo. NMFS-AFSC-150, 33 pp.
Hall-Spencer, J. M., R. Rodolfo-Metalpa, S. Martin, E. Ransome, M. Fine, S. M. Turner, S. J. Rowley, D. Tedesco, and M. C. Buia. 2008. Volcanic carbon dioxide vents show ecosystem effects of ocean acidification. Nature 454: 96-99.
Hovelsrud, G.K., McKenna, M. and Huntington, H.P. 2008.Marine mammal harvests and other interactions with humans. Ecol. Appl. 18(2 Supplement): S135-S47.
Huelsbeck, D.R. (1988) Whaling in the pre-contact economy of the central northwest coast. Arctic Anthropology, 25 (1), 1–15.
International Whaling Commission. 2008. Report of the Scientific Committee. Annex F. Report of the sub-Committee on bowhead, right and gray whales. J. Cetacean Res. Manage. (Suppl.) 10:162-163.
International Whaling Commission. 2009. Report of the Scientific Committee. Annex F. Report of the sub-Committee on bowhead, right and gray whales. J. Cetacean Res. Manage. (Suppl.) 11:169-175.
International Whaling Commission. 2010. Report of the Scientific Committee. Annex F. Report of the sub-Committee on bowhead, right and gray whales. J. Cetacean Res. Manage. (Suppl.) 2:154-179.
International Whaling Commission. 2013. Report of the Scientific Committee. J. Cetacean Res. Manage. (Suppl.) 14.
International Whaling Commission. 2012a. Report of the Scientific Committee. J. Cetacean Res. Manage. (Suppl.) 13.
International Whaling Commission.2011b.Report of the 2011 AWMP workshop with a focus on eastern gray whales. Report SC/63/Rep.2 presented to the International Whaling Commission Scientific Committee. [Available at http;//www.iwcoffice.org]
International Whaling Commission.2011c.Report of the Scientific Committee. Annex E. Report of the standing working group on the aboriginal whaling management procedure (AWMP). J. Cetacean Res. Manage. (Suppl.):143-167.
Johannessen, O. M., L. Bengtsson, M. W. Miles, S. I. Kuzmina, V. A. Semenov, G. V. Alexseev, A. P. Nagurnyi, V. F. Zakharov, L. P. Bobylev, L. H. Pettersson, K. Hasselmann, and H. P. Cattle. 2004. Arctic climate change: observed and modeled temperature and sea-ice variability. Tellus56A:328-341.
Jones, M.L. 1990. Reproductive cycle in gray whales based on photographic resightings of females on the breeding grounds from 1977 – 1982. Report of the International Whaling Commission (Special Issue 12): SC/A88/ID38.
Laake, J., Punt, A., Hobbs, R., Ferguson, M., Rugh, D. and J. Breiwick. 2009. Re-analysis of gray whale southbound migration surveys 1967-2006. U.S. Dep. Commer. NOAA Tech. Memo. NMFS-AFSC-203, 55 p.
Laake, J.L., Punt, A.E., Hobbs, R., Ferguson, M., Rugh, D. and Breiwick, J. 2012. Gray whale southbound migration surveys 1967-2006: An integrated re-analysis. Journal of Cetacean Research and Management 12(3):287-306.
Lang, A. R. and Martien, K. K. 2012. Update on the use of a simulation-based approach to evaluate plausible levels of recruitment into the Pacific Coast Feeding Group of gray whales. Paper SC/64/AWMP4 presented to IWC Scientific Committee.
111

Lang, A.R., Weller, D.W., LeDuc, R., Burdin, A.M., Pease, V.L., Litovka, D., Burkanov, V. and Brownell, R.L., Jr. 2011a.Genetic analysis of stock structure and movements of gray whales in the eastern and western North Pacific. Paper SC/63/BRG10 presented to the IWC Scientific Committee.
Lang, A.R., Taylor, B.L., Calambokidis, J., Pease, V.L., Klimik, A., Scordino, J., Robertson, K.M., Litovka, D., Burkanov, V., Gearin, P., George, J.C. and Mate, B. 2011b. Assessment of stock structure among gray whales utilizing feeding grounds in the Eastern North Pacific. Paper SC/M11/AWMP4 presented to the IWC Scientific Committee.
Lang, A.R. 2010. The population genetics of gray whales (Eschrichtius robustus) in the North Pacific. Ph.D.dissertation, University of California San Diego, 222 pp.
LeDuc, R.G., Weller, D.W., Hyde, J., Burdin, A.M., Rosel, P.E., Brownell, R.L., Würsig, B. and Dizon, A.E. 2002. Genetic differences between western and eastern gray whales (Eschrichtius robustus). Journal of Cetacean Research and Management 4:1-5.
LeBoeuf, B. J., M. H. Perez Cortes, R. J. Urban, B. R. Mate, and U. F. Ollervides. 2000. High gray whale mortality and low recruitment in 1999: Potential causes and implications. J. Cetacean Res. Manage. 2:85-99.
Malme C.I., Miles P.R., Clark C.W., Tyack P, Bird J.E. 1983.Investigations of the potential effects of underwater noise from petroleum industry activities on migrating gray whale behavior. Bolt Beranek and Newman Report No. 5366 submitted to Minerals Management Service, US Dept of the Interior, Anchorage, AK. Available at: www.mms.gov/alaska/reports/1980rpts/akpubs80s.htm
Malme C.I., Miles P.R., Clark C.W., Tyack P, Bird J.E. 1984.Investigations of the potential effects of underwater noise from petroleum industry activities on migrating gray whale behavior. Phase II: January 1984 migration. Bolt Beranek and Newman Report No. 5586 submitted to Minerals Management Service, US Dept of the Interior, Anchorage, AK. Available at: www.mms.gov/alaska/reports/1980rpts/akpubs80s.htm
Mate, B., Lagerquist, B. and Irvine, L. 2010. Feeding habitats, migration, and winter reproductive range movements derived from satellite-monitored radio tags on eastern North Pacific gray whales. Paper SC/62/BRG21 presented to the International Whaling Commission Scientific Committee.
Mate, B., Bradford, A.L., Tsidulko, G., Vertyankin, V. and Ilyashenko, V. 2011.Late-feeding season movements of a western North Pacific gray whale off Sakhalin Island, Russia and subsequent migration into the Eastern North Pacific. Paper SC/63/BRG23 presented to the IWC Scientific Committee.
Mead, J.G., and E.D. Mitchell. 1984. Atlantic gray whales. Pp. 33-53 In M. L. Jones, S. L. Swartz, and S. Leatherwood (eds.), The Gray Whale, Eschrichtius robustus.Academic Press, Inc., Orlando. Xxiv + 600 pp.
Minobe, S. 2002. Interannual to interdecadal changes in the Bering Sea and concurrent 1998/99 changes over the North Pacific. Progr.Oceanogr. 55(1-2):45-64.
Mizue, K. 1951. Gray whales in the east sea area of Korea. Sci. Rep. Whales, Res. Inst., Tokyo 5:71-9. Moore, S. E. and H. P. Huntington. 2008. Arctic marine mammals and climate change: impacts and resilience.
Ecological Applications 18(Suppl.):157–165. Moore, J.E. and Weller, D.W. 2013. Probability of taking a western North Pacific gray whale during the proposed
Makah hunt. U.S. Department of Commerce, NOAA Technical Memorandum, NMFS-SWFSC-506. Moore, S.E., J. Urbán R., W.L. Perryman, F. Gulland, H. Pérez-Cortés M., P.R. Wade, L. Rojas-Bracho and T.
Rowles. 2001. Are gray whales hitting ‘K’ hard? Mar. Mammal Sci. 17(4):954-958. Moore, S.E., K.M. Wynne, J.C. Kinney, J.M. Grebmeier. 2007. Gray whale occurrence and forage southeast of
Kodiak, Island, Alaska. Mar. Mammal Sci. 23:419–428. Moritz, C. 1994. Defining ‘evolutionarily significant units’ for conservation. Trends in Ecology and Evolution
9:373-375. Nerini, M. 1984. A review of gray whale feeding ecology. Pp. 423-450 In M. L. Jones, S. L. Swartz, and S.
Leatherwood (eds.), The Gray Whale, Eschrichtius robustus.Academic Press, Inc., Orlando.xxiv + 600 pp. NMFS 1994.Federal Register Volume 59, Number 115 (Thursday, June 16, 1994). NMFS 2008. Draft environmental impact statement for proposed authorization of the Makah whale hunt. National
Marine Fisheries Service, Northwest Region. May 2008. NMFS. 2005. Revisions to Guidelines for Assessing Marine Mammal Stocks. 24 pp. Available at: http://www.nmfs.noaa.gov/pr/pdfs/sars/gamms2005.pdf NMFS 2012. Federal Register 77:29967-29969. Notice of Intent to Prepare an Environmental Impact Statement
related to the Makah Indian Tribe’s (Tribe) request for authorization of treaty right hunting of eastern North Pacific gray whales in usual and accustomed fishing grounds off the coast of Washington State.
Omura, H. 1984. History of gray whales in Japan. pp. 57-77. In: M.L. Jones, S.L. Swartz and S. Leatherwood (eds.) The Gray Whale, Eschrichtius robustus. Academic Press Inc., Orlando Florida. xxiv+600pp.
112

Palsboll, P.J., M. Berube, and F.W. Allendorf. 2007. Identification of management units using population genetic data. Trends in Ecology and Evolution 22: 11-16.
Perryman, W.L. and M.S. Lynn. 2002. Evaluation of nutritive condition and reproductive status of migrating gray whales (Eschrichtius robustus) based on analysis of photogrammetric data. Journal of Cetacean Research and Management 4:155-164.
Perryman, W. L., M. A. Donahue, P. C. Perkins, and S. B. Reilly. 2002. Gray whale calf production 1994-2000: are observed fluctuations related to changes in seasonal ice cover? Mar. Mammal Sci. 18(l):121-144.
Perryman, W.L., G.M. Watters, L.K. Swartz and R.A. Rowlett. 2004. Preliminary results from shore-based surveys of northbound gray whale calves in 2003 and 2004, with a comparison to predicted numbers based on the distribution of seasonal ice. Paper SC/56/BRG43 presented to the IWC Scientific Committee, June 2004 (unpublished). 7pp.
Perryman, W.L., Reilly, S.B. and Rowlett, R.A. 2011. Results of surveys of northbound gray whale calves 2001-2010 and examination of the full seventeen year series of estimates from Piedras Blancas Light Station. Paper SC/M11/AWMP3 presented to the IWC Scientific Committee.
Perryman, W.L. and Weller, D.W. 2012. Anomalous 2012 spring ice cover in the Bering Sea: predicted impacts on eastern North Pacific gray whales. Paper SC/64/BRG18 presented to the IWC Scientific Committee.
Poole, M. M. 1984a. Migration corridors of gray whales along the central California coast, 1980-1982. Pp. 389-407 In M. L. Jones, S. L. Swartz, and S. Leatherwood (eds.), The Gray Whale, Eschrichtius robustus.Academic Press, Inc., Orlando.xxiv + 600 pp.
Poole, M. M. 1984b. Preliminary assessment of annual calf production in the gray whale, Eschrichtius robustus, from Pt. Piedras Blancas, California. Rep. Int. Whal. Comm. (Special Issue 6):223-231.
Punt, A. E. and Wade, P.R. 2012. Population status of the eastern North Pacific stock of gray whales in 2009. Journal of Cetacean Research and Management 12(1): 15-28.
Punt, A. E., and P. R. Wade. 2010. Population status of the eastern North Pacific stock of gray whales in 2009. U.S. Dep. Commer. NOAA Tech. Memo. NMFS-AFSC-207, 43 p.
Ramakrishnan, U. and Taylor, B.L. 2001. Can gray whale management units be assessed using mitochondrial DNA? Journal of Cetacean Research and Management 3:13-18.
Ramakrishnan, U., R. G. LeDuc, J. Darling, B. L. Taylor, P. Gearin, M. Gosho, J. Calambokidis, R. L. Brownell, J. Hyde, and T. E. Steeves. 2001. Are the southern feeding group of Eastern Pacific gray whales a maternal genetic isolate? Rep. Int. Whal. Comm.SC53/SD8 5pp.
Reeves, R. 2002. The origins and character of ‘aboriginal subsistence’ whaling: a global review. Mammal Rev. 32:71-106.
Rice, D.W. 1990. Life history parameters of the gray whale: a review of published estimates. Paper SC/A90/G22 presented to the IWC Scientific Committee Special Meeting on the Assessment of Gray Whales, April 1990.
Rice, D. W., and A. A. Wolman. 1971. The life history and ecology of the gray whale, Eschrichtius robustus. Am. Soc. Mammal. Special Publication 3.142 pp.
Reilly S.B., Bannister J.L., Best P.B., Brown M., Brownell R.L., Butterworth D.S., Clapham P.J., Cooke J., Donovan G.P., Urbán J., Zerbini A.N. (2008) Eschrichtius robustus (western subpopulation). In: IUCN 2011. IUCN Red List of Threatened Species.Version 2011.1.[Available from http:// www.iucnredlist.org/].
Rugh, D.J., R.C. Hobbs, J.A. Lerczak and J.M. Breiwick. 2005. Estimates of abundance of the eastern North Pacific stock of gray whales 1997-2002. J. Cetacean Res. Manage. 7:1-12.
Rugh, D.J., Muto, M.M., Hobbs, R.C. and J.A. Lerczak. 2008. An assessment of shore-based counts of gray whales. Mar. Mammal Sci. 24: 864-880.
Rugh, D. J., K. E. W. Shelden, and A. Schulman-Janiger. 2001. Timing of the southbound migration of gray whales. J. Cetacean Res. Manage. 3(1):31-39.
Scheinen, A.P., D. Kerem, C.D. Macleod, M. Gazo, C.A. Chicote, and M. Castellote. 2011. Gray whale (Eschrichtius robustus) in the Mediterranean Sea: anomalous event or early sign of climate-driven distribution change? Marine Biodiversity Records, 4, e28 doi:10.1017/S1755267211000042.
Shelden, K.E.W., A. Schulman-Janiger, and D.J. Rugh. 2004. Gray whales born north of Mexico: indicator of recovery or consequence of regime shift? Ecological Applications 14:1789-1805.
Steeves, T.E., J.D. Darling, P.E. Rosel, C.M. Schaeff and R.C. Fleischer. 2001. Preliminary analysis of mitochondrial DNA variation in a southern feeding group of eastern North Pacific gray whales. Conservation Genetics 2:379-384.
Swartz, S.L., B.L. Taylor, and D.J. Rugh. 2006. Gray whale Eschrichtius robustus population and stock identity. Mammal Review. 36:66-84.
113

Tyack, P. 2009. Acoustic playback experiments to study behavioral responses of free-ranging marine animals to anthropogenic sound. Marine Ecology Progress Series 395:187-200.
Urbán R.J., Weller, D., Tyurneva, O., Swartz, S., Bradford, A., Yakovlev, Y., Sychenko, O., Rosales N., H., Martínez, A.S., Burdin, A. and Gómez-Gallardo U. A. 2012. Report on the photographic comparison of the western and Mexican gray whale catalogues. Paper SC/64/BRG13 presented to the International Whaling Commission Scientific Committee [Available from http://www.iwcoffice.org/]
Tyurneva O. Yu., Yakovlev Yu. M., Vertyankin V. V. and Selin N. I. 2010.The peculiarities of foraging migrations of the Korean-Okhotsk gray whale (Eschrichtius robustus) population in Russian waters of the Far Eastern seas.Russian J. of Mar. Biol. 36:117-124.
Vertyankin, V.V., Nikulin, V.C., Bednykh A.M. and Kononov, A.P. 2004. Sighting of gray whales (Eschrichtius robustus) near southern Kamchatka.Pp 126-128 in: Marine Mammals of the Holarctic. Collection of scientific papers of International Conference. Koktebel, Crimea, Ukraine, October 11-17, 2004.
Wade, P. R., and R. Angliss. 1997. Guidelines for assessing marine mammal stocks: report of the GAMMS workshop April 3-5, 1996, Seattle, Washington. U.S. Dep. Commer., NOAA Tech. Memo. NMFS-OPR-12, 93 pp.
Wang, P. 1984. Distribution of the gray whale (Eschrichtiusgibbosus) off the coast of China.ActaTher.Sinica 4(1):21-6. [In Chinese with English summary].
Weller, D.W., Burdin, A.M., Würsig, B., Taylor, B.L. and Brownell, R.L., Jr. 2002.The western Pacific gray whale: a review of past exploitation, current status and potential threats. J. Cetacean Res. Manage. 4:7-12.
Weller, D.W., Klimek, A., Bradford, A. L., Calambokidis, J., Lang, A.R., Gisborne, B., Burdin, A.M., Szaniszlo, W. and Brownell, R.L., Jr. 2011.Movements of western gray whales from the Okhotsk Sea to the eastern North Pacific. Paper SC/63/BRG6 presented to the IWC Scientific Committee.
Weller, D.W., S. Bettridge, R.L. Brownell Jr., J.L. Laake, J.E. Moore, P.E. Rosel, B.L. Taylor, and P.R. Wade. 2013. Report of the National Marine Fisheries Service Gray Whale Stock Identification Workshop. U.S. Dep. Commer., NOAA Tech. Memo. NOAA-TM-NMFS-SWFSC-507.
Weller D.W. and R.L. Brownell Jr. 2012. A re-evaluation of gray whale records in the western North Pacific. Paper SC/64/BRG10 presented to the International Whaling Commission Scientific Committee. 4 pp.
Weller D.W., Klimek A., Bradford A.L., Calambokidis J., Lang A.R., Gisborne B., Burdin A.M., Szaniszlo W., Urban J., Gomez-Gallardo Unzueta A., Swartz S., Brownell R.L.J. 2012. Movements of gray whales between the western and eastern North Pacific. Endangered Species Research 18:193-199.
114

Revised 01/15/2011 9/25/2013 BLUE WHALE (Balaenoptera musculus musculus):
Eastern North Pacific Stock STOCK DEFINITION AND GEOGRAPHIC RANGE The International Whaling Commission (IWC) has formally considered only one management stock for blue whales in the North Pacific (Donovan 1991), but this ocean is thought to include more than one population (Ohsumi and Wada 1972; Braham 1991), possibly as many as five (Reeves et al. 1998). North Pacific blue whales were once thought to belong to as many as five separate populations (Reeves et al. 1998), but acoustic evidence suggests only two populations, in the eastern and western north Pacific, respectively (Stafford et al. 2001, Stafford 2003).Blue whales in the North Pacific produce two distinct, stereotypic calls that have been termed the northwestern and northeastern call types, and it has been proposed that these represent two distinct populations with some degree of geographic overlap (Stafford et al. 2001, Stafford 2003). The northeastern call predominates in the Gulf of Alaska, the U.S. West Coast, and the eastern tropical Pacific, while the northwestern call predominates from south of the Aleutian Islands to the Kamchatka Peninsula in Russia, though both call types have been recorded concurrently in the Gulf of Alaska (Stafford et al. 2001, Stafford 2003). Both call types are represented in lower latitudes in the central North Pacific but differ in their seasonal patterns (Stafford et al. 2001). Gilpatrick and Perryman (2008) showed that blue whales from California to Central America (the eastern North Pacific stock) are on average, two meters shorter than blue whales measured from historic whaling records in the central and western north Pacific. Mate et al. (1999) used satellite tags to show that the eastern tropical Pacific is a migratory destination for blue whales that were tagged off southern California, and photographs of blue whales on the Costa Rica Dome in the eastern tropical Pacific have matched individuals that had been previously photographed off California (Calambokidis, pers. comm.). Photographs of blue whales in California have also been matched to individuals photographed off the Queen Charlotte Islands in northern British Columbia and to one individual photographed in the northern Gulf of Alaska (Calambokidis et al. 2009a).
For the Marine Mammal Protection Act (MMPA) stock assessment reports, the Eastern North Pacific Stock of blue whales includes animals found in the eastern North Pacific from the northern Gulf of Alaska to the eastern tropical Pacific. This definition is consistent with both the distribution of the northeastern call type, photogrammetric length determinations and with the known range of photographically identified individuals. Based on locations where the northeastern call type has been recorded, some individuals in this stock may range as far west as Wake Island and as far south as the Equator (Stafford et al. 1999, 2001). The U.S. West Coast is certainly one of the most important feeding areas in summer and fall (Figure 1), but, increasingly, blue whales from this stock have been found feeding to the north and south of this area during summer and fall. Most of this stock is believed to
Figure 1. Blue whale sighting locations based on aerial and summer/autumn shipboard surveys off California, Oregon, and Washington, 1991-2008 (see Appendix 2 for data sources and information on timing and location of surveys). Dashed line represents the U.S. EEZ; thin lines represent completed transect effort for all surveys combined.
115

migrate south to spend the winter and spring in high productivity areas off Baja California, in the Gulf of California, and on the Costa Rica Dome. Given that these migratory destinations are areas of high productivity and given the observations of feeding in these areas, blue whales can be assumed to feed year round. Some individuals from this stock may be present year-round on the Costa Rica Dome (Reilly and Thayer 1990). However, it is also possible that some Southern Hemisphere blue whales might occur north of the equator during the austral winter. One other stock of North Pacific blue whales (the Central North Pacific stock in Hawaiian waters) is recognized in the Pacific Marine Mammal Protection Act (MMPA) Stock Assessment Reports. POPULATION SIZE The size of the feeding stock of blue whales off the U.S. West Coast was has been estimated recently by both line-transect and mark-recapture methods. Barlow and Forney (2007) estimated 603 (CV=0.29) blue whales off California, Oregon, and Washington based on ship line-transect surveys in 2001 and Forney (2007), estimated 721 (CV=0.27) from a 2005 line-transect survey of the same area. More recently, Barlow (2010) estimated 442 (CV=0.25) blue whales from a 2008 line-transect survey in the same region. The unweighted geometric mean of the 2005 and 2008 line-transect estimates is 565 (CV=0.18) whales. Calambokidis et al. (2010) used photographic mark-recapture and estimated population sizes of 2,799 (CV=0.27) based on 2005-2008 photographs of left sides and 2,195 (CV=0.24) based on right sides. The average of the mark-recapture estimates is 2,497 (CV=0.24) whales. Line-transect abundance estimates from summer/autumn research vessel surveys in the California Current ranged between approximately 400 and 800 animals from 2001 to 2008 (Barlow and Forney 2007, Barlow 2010). These estimates are considerably lower than previous line-transect estimates of approximately 1,900 animals obtained between 1991 and 1996 (Barlow 2010) (Figure 2). The lower abundance estimates appear to be related to a northward shift in the distribution of blue whales out of the study area (as far north as the Gulf of Alaska) and not a population decline (Barlow and Forney 2007, Calambokidis et al. 2009a). Mark-recapture estimates are often negatively biased by individual heterogeneity in sighting probabilities (Hammond 1986); however, Calambokidis et al. (2010) minimize such effects by selecting one sample that was taken randomly with respect to distance from the coast. Similarly, the line-transect estimates may also be negatively biased because some blue whales in this stock are outside of the study area at the time of survey (Calambokidis and Barlow 2004). Because some fraction of the population is always outside the survey area, the line-transect and mark recapture estimation methods provide different measures of abundance for this stock. Line transect estimates reflect the average density and abundance of blue whales in the study area during summer and autumn surveys, while mark recapture estimates provide an estimate of total population size. New photographic mark-recapture estimates of abundance for the period 2005 to 2011 presented by Calambokidis (2013) range from approximately 1,000 to 2,300 animals, with the most consistent estimates represented by a 4-yr sampling period Chao model that incorporates individual capture heterogeneity over time. The Chao model consistently yielded estimates of approximately 1,500 whales (Figure 2). The best estimate of blue whale abundance is taken from the Chao model results of Calambokidis (2013) for the period 2008 to 2011, or 1,647 (CV=0.07) whales. Therefore, the best estimate of blue whale abundance is the average of mark-recapture estimates, or 2,497 (CV=0.24). Minimum Population Estimate The minimum population estimate for blue whales is taken as the lower 20th percentile of the log-normal distribution of abundance estimated from the mark-recapture estimate, or approximately 2,046 1,551. Current Population Trend
There is some indication that blue whales increased in abundance in California coastal waters between 1979/80 and 1991 (regression p<0.05, Barlow 1994) and between 1991 and 1996 (not significant, Barlow 1997). Although this may be due to an increase in the stock as a whole, it could also be the result of an increased use of California as a feeding area. The size of the apparent increase in abundance seen by Barlow (1994) is too large to be accounted for by population growth alone. Also, Larkman and Veit (1998) did not detect any increase along consistently surveyed tracklines in the Southern California Bight from 1987 to 1995. Although the population in the North Pacific is expected to have grown since being given IWC protected status in 1966, there is no evidence showing that the eastern North Pacific stock is currently growing. Estimates from line transect surveys declined between 1991-2005 (Figure 2), which is probably due to variability in the fraction of the population that utilizes California waters during the summer and autumn (Calambokidis et al. 2009). Mark-recapture estimates provide the best indicator of population trends for this stock, because of recent northward shifts in blue whale distribution that negatively bias line-transect estimates. Based on mark-recapture estimates shown in Figure 2, there is no evidence of a population size increase in this blue whale population since the early 1990s. While the Petersen mark-recapture
116

estimates show an apparent increase in blue whale abundance since 1996, the estimation errors associated with these estimates are also much higher than for the Chao estimates (Figure 2).
CURRENT AND MAXIMUM NET PRODUCTIVITY RATES No information exists on the overall rate of growth of blue whale populations in the Pacific (Best 1993). Based on mark-recapture estimates from the US West Coast and Baja California, Mexico, Calambokidis et al. (2010 2009b) estimate a rate of increase just under 3% per year, but it is not known if that corresponds to the maximum growth rate of this stock. POTENTIAL BIOLOGICAL REMOVAL The potential biological removal (PBR) level for this stock is calculated as the minimum population size (2,046 1,551) times one half the default maximum net growth rate for cetaceans (½ of 4%) times a recovery factor of 0.3 (for an endangered species which has a minimum abundance greater than 1,500 and a CVNmin<0.5), resulting in a PBR of 12.2 9.3. Because whales in this stock spends approximately three quarters of their time outside the U.S. EEZ, the PBR allocation for U.S. waters is one-quarter of this total, or 3.1 2.3 whales per year.
Figure 2. Estimates of abundance from vessel-based line transect (LT) and mark-recapture (MR) surveys conducted in California waters, 1991-2005 (Barlow and Forney 2007; Calambokidis et al. 2003; Calambokidis and Barlow 2004; Forney 2007; Calambokidis et al. 2007). The four line transect estimates are based on annual surveys conducted in 1991, 1993, 1996, 2001, and 2005, respectively. The three mark-recapture estimates are based on 1991-1993, 1995-1997, 2000-2002, and 2004-2006 pooled estimates, respectively. Approximate 95% lognormal confidence intervals of the individual LT and MR estimates are also shown.
117

Figure 2. Estimates of blue whale abundance from line-transect and photographic mark-recapture surveys, 1991 to 2011 (Barlow and Forney 2007, Barlow 2010, Calambokidis 2013). Vertical bars indicate ±2 standard errors of each abundance estimate. HUMAN-CAUSED MORTALITY AND SERIOUS INJURY New Serious Injury Guidelines NMFS updated its serious injury designation and reporting process, which uses guidance from previous serious injury workshops, expert opinion, and analysis of historic injury cases to develop new criteria for distinguishing serious from non-serious injury (Angliss and DeMaster 1998, Andersen et al. 2008, NOAA 2012). NMFS defines serious injury as an “injury that is more likely than not to result in mortality”. Injury determinations for stock assessments revised in 2013 or later incorporate the new serious injury guidelines, based on the most recent 5-year period for which data are available. Fisheries Information The offshore California swordfish drift gillnet fishery is the only fishery that is likely to take blue whales from this stock, but no fishery mortality or serious injuries have been observed since the observer program was initiated in 1990 (Julian and Beeson 1998, Carretta et al. 2004, Carretta and Enriquez 2009a, 2009b, 2010, 2012a, 2012b. (Table 1). Detailed information on this fishery is provided in Appendix 1. After the 1997 implementation of a Take Reduction Plan, which included skipper education workshops and required the use of pingers and minimum 6-fathom extenders, overall cetacean entanglement rates in the drift gillnet fishery dropped considerably (Barlow and Cameron 1999). Mean annual takes for this fishery (Table 1) are based only on 2004-2008 data (Carretta et al. 2005 Carretta and Enriquez 2006, 2007, 2009a, 2009b). This results in an average estimate of zero blue whales taken annually (Table 1). Some gillnet mortality of large whales may go unobserved because whales swim away with a portion of the net; however, fishermen report that large rorquals (blue and fin whales) usually swim through nets without entangling and with very little damage to the nets. Gillnets have been documented to entangle marine mammals off Baja California (Sosa-Nishizaki et al. 1993), but no recent bycatch data from Mexico are available. Drift gillnet fisheries for swordfish and sharks exist along the entire Pacific coast of Baja California, Mexico and may take animals from the same population. Quantitative data are available only for the Mexican swordfish drift gillnet fishery, which uses vessels, gear, and operational procedures similar to those in the U.S. drift gillnet fishery, although nets may be up to 4.5 km long
118

(Holts and Sosa-Nishizaki 1998). The fleet increased from two vessels in 1986 to 31 vessels in 1993 (Holts and Sosa-Nishizaki 1998). The total number of sets in this fishery in 1992 can be estimated from data provided by these authors to be approximately 2700, with an observed rate of marine mammal bycatch of 0.13 animals per set (10 marine mammals in 77 observed sets; Sosa-Nishizaki et al. 1993). This overall mortality rate is similar to that observed in California driftnet fisheries during 1990-95 (0.14 marine mammals per set; Julian and Beeson, 1998), but species-specific information is not available for the Mexican fisheries. Previous efforts to convert the Mexican swordfish driftnet fishery to a longline fishery have resulted in a mixed-fishery, with 20 vessels alternately using longlines or driftnets, 23 using driftnets only, 22 using longlines only, and seven with unknown gear type (Berdegué 2002). Table 1. Summary of available information on the incidental mortality and injury of blue whales (Eastern North Pacific stock) for commercial fisheries that might take this species (Carretta et al. 2005, Carretta and Enriquez 2006, 2007, 2009a, 2009b, 2010, 2012a, 2012b). Mean annual takes are based on 2004-2008 2007-2011 data unless noted otherwise.
Fishery Name Year(s) Data Type Percent
Observer Coverage
Observed Mortality (and
injury)
Estimated mortality
(CV in parentheses)
Mean Annual Takes (CV in
parentheses)
CA/OR thresher shark/swordfish drift gillnet
fishery
2004 2005 2006 2007 2008 2009 2010 2011
observer
20.6% 20.9% 18.5% 16.4% 13.5% 13.3% 11.9% 19.5%
0 0 0 0 0 0 0 0
0 0 0 0 0 0 0 0
0 (n/a)
Total Annual Takes 0 (n/a) Ship Strikes Ship strikes were implicated in the deaths of five nine blue whales, from 2004-2008 between 2007 and 2011 (NMFS SWR Stranding Database Carretta et al. 2013). Four Five of these deaths occurred in 2007, the highest number recorded for any year. The remaining four ship strike deaths occurred in 2009 (2) and 2010 (2). One additional whale was seriously injured in 2010 and its prorated serious injury value is 0.56 (Carretta et al. 2013). During 2004-2008 2007-2011, there were an additional eight four serious injuries of unidentified large whales attributed to ship strikes (Carretta et al. 2013). Additional mortality from ship strikes probably goes unreported because the whales do not strand or, if they do, they do not always have obvious signs of trauma. Several blue whales have been photographed in California with large gashes in their dorsal surface that appear to be from ship strikes (J. Calambokidis, pers. comm.). Blue whale mortality and injuries attributed to ship strikes in California waters averaged 1.0 1.9 per year for 2004-2008 during 2007-2011. The high number of ship strikes observed in 2007 resulted in NOAA implementing a mitigation plan that includes NOAA weather radio and U.S. Coast Guard advisory broadcasts to mariners entering the Santa Barbara Channel to be observant for whales, along with recommendations that mariners transit the channel at 10 knots or less. The Channel Islands National Marine Sanctuary also developed a blue whale/ship strike response plan, which involved weekly overflights to record whale locations. Additional plan information can be found at http://channelislands.noaa.gov/focus/alert.html. Documented ship strike deaths and serious injuries are derived from actual counts of whale carcasses and should be considered minimum values. Where evaluated, estimates of detection rates of cetacean carcasses are consistently quite low across different regions and species (<1% to 17%), highlighting that observed numbers are unrepresentative of true impacts (Kraus et al. 2005, Perrin et al. 2011, Williams et al. 2011, Prado et al. 2013). Due to this negative bias, Redfern et al. (2013) stress that the number of ship strike deaths of blue whales in the California Current likely exceeds PBR. STATUS OF STOCK The reported take of North Pacific blue whales by commercial whalers totaled 9,500 between 1910 and 1965 (Ohsumi and Wada 1972). Approximately 3,000 of these were taken from the west coast of North America from Baja California, Mexico to British Columbia, Canada (Tonnessen and Johnsen 1982; Rice 1992; Clapham et al. 1997; Rice 1974). Blue whales in the North Pacific were given protected status by the IWC in 1966, but Doroshenko (2000) reported that a small number of blue whales were taken illegally by Soviet whalers after that
119

date. As a result of commercial whaling, blue whales were listed as "endangered" under the Endangered Species Conservation Act of 1969. This protection was transferred to the Endangered Species Act (ESA) in 1973. They are still listed as “endangered”, and consequently the Eastern North Pacific stock is automatically considered as a "depleted" and "strategic" stock under the MMPA. The annual incidental mortality and injury rate (1.0/year 1.9/year) from ship strikes is less than the calculated PBR (3.1 2.3) for this stock, but this rate does not include unidentified large whales struck by vessels, some of which may have been blue whales, nor does it include undetected and unreported ship strikes of blue whales. The number of blue whales struck by ships in the California Current likely exceeds the PBR for this stock (Redfern et al. 2013). To date, no blue whale mortality has been associated with California gillnet fisheries; therefore, total fishery mortality is approaching zero mortality and serious injury rate. Habitat Concerns
Increasing levels of anthropogenic sound in the world’s oceans (Andrew et al. 2002) have been suggested to be a habitat concern for blue whales (Reeves et al. 1998). Tagged blue whales exposed to simulated mid-frequency military sonar sounds showed significant behavioral responses, including cessation of feeding, increased swimming speeds, and movement away from the simulated sound sources, even though the simulated source levels were orders of magnitude lower than some operational military sonar systems (Goldbogen et al. 2013). The authors of this study highlight that sonar sources can disrupt feeding and displace whales from high-quality feeding areas, with negative implications for individual fitness and population health. REFERENCES Andrew, R. K., B. M. Howe, J. A. Mercer, and M. A. Dzieciuch. 2002. Ocean ambient sound: comparing the
1960’s with the 1990’s for a receiver off the California coast. Acoustic Research Letters Online 3:65-70. Barlow, J. 2010. Cetacean abundance in the California Current from a 2008 ship-based line-transect survey.
NOAA Technical Memorandum, NMFS, NOAA-TM-NMFS-SWFSC-456. 19pp. Barlow, J. 1994. Abundance of large whales in California coastal waters: a comparison of ship surveys in 1979/80
and in 1991. Rept. Int. Whal. Commn. 44:399-406. Barlow, J. 1997. Preliminary estimates of cetacean abundance off California, Oregon, and Washington based on a
1996 ship survey and comparisons of passing and closing modes. Admin. Rept. LJ-97-11. Southwest Fisheries Science Center, National Marine Fisheries Service, P.O. Box 271, La Jolla, CA. 25 pp.
Barlow, J. 2003. Preliminary estimates of cetacean abundance off the U.S. West Coast: 1991-2001. Administrative Report LJ-03-03. Available from Southwest Fisheries Science Center, National Marine Fisheries Service, 8604 La Jolla Shores Dr., La Jolla, CA. 26 pp.
Barlow, J., R. W. Baird, J. E. Heyning, K. Wynne, A. M. Manville, II, L. F. Lowry, D. Hanan, J. Sease, and V. N. Burkanov. 1994. A review of cetacean and pinniped mortality in coastal fisheries along the west coast of the U.S. and Canada and the east coast of the Russian Federation. Rep. Int. Whal. Commn, Special Issue 15:405-425.
Barlow, J. and G. A. Cameron. 1999. Field experiments show that acoustic pingers reduce marine mammal bycatch in the California drift gillnet fishery. Report SC/51/SM2 to the Scientific Committee of the International Whaling Commission, May 1999. 20pp.
Barlow, J. and K.A. Forney. 2007. Abundance and population density of cetaceans in the California Current ecosystem. Fishery Bulletin 105:509-526.
Best, P. B. 1993. Increase rates in severely depleted stocks of baleen whales. ICES J. Mar. Sci. 50:169-186. Braham, H. W. 1991. Endangered whales: status update. A Report on the 5-year status of stocks review under the
1978 amendments to the U.S. Endangered Species Act. NMFS Unpublished Report. Calambokidis, J., T. Chandler, L. Schlender, G. H. Steiger, and A. Douglas. 2003. Research on humpback and blue
whale off California, Oregon and Washington in 2002. Final Contract Report to Southwest Fisheries Science Center, National Marine Fisheries Service, P.O. Box 271, La Jolla, CA 92038. 49 pp.
Calambokidis, J. and J. Barlow. 2004. Abundance of blue and humpback whales in the eastern North Pacific estimated by capture-recapture and line-transect methods. Marine Mammal Science 21(1):63-85.
Calambokidis, J., A. Douglas, E. Falcone, and L. Schlender. 2007. Abundance of blue whales off the US West Coast using photo identification. Contract Report AB133F06SE3906 to Southwest Fisheries Science Center, 8604 La Jolla Shores Drive, La Jolla, CA 92037. 13p.
Calambokidis, J., J. Barlow, J.K.B. Ford, T.E. Chandler, and A.B. Douglas. 2009a. Insights into the population structure of blue whales in the Eastern North Pacific from recent sightings and photographic identification. Marine Mammal Science 25:816-832.
120

Calambokidis, J., E. Falcone, A. Douglas, L. Schlender, and J. Huggins. 2010 2009b. Photographic identification of humpback and blue whales off the U.S. West Coast: results and updated abundance estimates from 2008 field season. Final Report for Contract AB133F08SE2786 from Southwest Fisheries Science Center. 18pp. Available at http://www.cascadiaresearch.org/reports/Rep-BmMn-2008-SWFSC-Rev.pdf
Calambokidis, J. 2013. Updated abundance estimates of blue and humpback whales off the US west coast incorporating photo-identifications from 2010 and 2011. Document PSRG-2013-13 presented to the Pacific Scientific Review Group, April 2013. 7 p.
Carretta, J.V., T. Price, D. Petersen, and R. Read. 2004. Estimates of marine mammal, sea turtle, and seabird mortality in the California drift gillnet fishery for swordfish and thresher shark, 1996-2002. Marine Fisheries Review 66(2):21-30.
Carretta, J.V. and L. Enriquez. 2009a. Marine mammal and seabird bycatch observed in California commercial fisheries in 2007. Administrative Report LJ-09-01, available from Southwest Fisheries Science Center, 3333 North Torrey Pines Rd., La Jolla, CA 92037. 12 p.
Carretta, J.V. and L. Enriquez. 2009b. Marine mammal bycatch in the California/Oregon swordfish and thresher shark drift gillnet fishery in 2008. Southwest Fisheries Science Center, NOAA Fisheries Administrative Report LJ-09-03. 10p.
Carretta, J.V. and L. Enriquez. 2010. Marine Mammal and Sea Turtle Bycatch in the California/Oregon Sworfish and Thresher Shark Drift Gillnet Fishery in 2009. Southwest Fisheries Science Center, NOAA Fisheries Administrative Report LJ-10-03. 11p.
Carretta, J.V. and L. Enriquez. 2012a. Marine mammal and seabird bycatch in California gillnet fisheries in 2010. Southwest Fisheries Science Center Administrative Report LJ-12-01. 14p.
Carretta, J.V. and L. Enriquez. 2012b. Marine mammal and seabird bycatch in California gillnet fisheries in 2011. NOAA Technical Memorandum NOAA-TM-NMFS-SWFSC-500. 14 p.
Carretta, J. V., S. M. Wilkin, M. M. Muto, and K. Wilkinson. 2013. Sources of human-related injury and mortality for U.S. Pacific west coast marine mammal stock assessments, 2007-2011. U.S. Dep. Commer., NOAA Tech. Memo. NMFS-SWFSC-514, 83 p.
Carretta, J. V., S. M. Wilkin, M. M. Muto, and K. Wilkinson. 2013. Sources of human-related injury and mortality for U.S. Pacific west coast marine mammal stock assessments, 2007-2011. U.S. Dep. Commer., NOAA Tech. Memo. NMFS-SWFSC-514, 83 p.
Carretta, J.V. and L. Enriquez. 2009b. Marine mammal bycatch observed in the California/Oregon swordfish and thresher shark drift gillnet fishery in 2008. Administrative Report LJ-09-03, available from Southwest Fisheries Science Center, 3333 North Torrey Pines Rd., La Jolla, CA 92037. 10 p.
Carretta, J.V. and L. Enriquez. 2007. Marine mammal and sea turtle bycatch in the California/Oregon thresher shark and swordfish drift gillnet fishery in 2006. Administrative Report LJ-07-06, available from Southwest Fisheries Science Center, 8604 La Jolla Shores Drive, La Jolla, CA 92037. 9p.
Carretta, J.V. and L. Enriquez. 2006. Marine mammal bycatch and estimated mortality in California commercial fisheries during 2005. Administrative Report LJ-06-07, available from Southwest Fisheries Science Center, 8604 La Jolla Shores Drive, La Jolla, CA 92037. 14p.
Carretta, J.V., S.J. Chivers, and K. Danil. 2005. Preliminary estimates of marine mammal bycatch, mortality, and biological sampling of cetaceans in California gillnet fisheries for 2004. Administrative Report LJ-05-10, available from Southwest Fisheries Science Center, 8604 La Jolla Shores Drive, La Jolla, California, 92037. 17 p.
Clapham, P. J., S. Leatherwood, I. Szczepaniak, and R. L. Brownell, Jr. 1997. Catches of humpback and other whales from shore stations at Moss Landing and Trinidad, California, 1919-1926. Marine Mammal Science 13(3):368-394.
Donovan, G. P. 1991. A review of IWC stock boundaries. Rept. Int. Whal. Commn., Special Issue 13:39-68. Doroshenko, N. V. 2000. Soviet whaling for blue, gray, bowhead and right whales in the North Pacific Ocean,
1961-1979. Pages 96-103 in Soviet Whaling Data (1949-1979). Center for Russian Environmental Policy, Moscow. [In Russian and English].
Forney, K.A. 2007. Preliminary estimates of cetacean abundance along the U.S. west coast and within four National Marine Sanctuaries during 2005. U.S. Department of Commerce NOAA Technical Memorandum, NOAA-TM-NMFS-SWFSC-406. 27p.
Gilpatrick, J.W., Jr. and W. L. Perryman. 2008. Geographic variation in external morphology of North Pacific and Southern Hemisphere blue whales (Balaenoptera musculus). Journal of Cetacean Research and Management 10(1):9-21.
121

Goldbogen, J.A., Southall B.L.,DeRuiter S.L., Calambokidis J., Friedlaender A.S.,Hazen E.L., Falcone E.A., Schorr G.S., Douglas A., Moretti D.J., Kyburg C., McKenna M.F., Tyack P.L. 2013. Blue whales respond to simulated mid-frequency military sonar. Proc. R. Soc. B 280:20130657. http://dx.doi.org/10.1098/rspb.2013.0657
Hammond, P. S. 1986. Estimating the size of naturally marked whale populations using capture-recapture techniques. Rept. Int. Whal. Commn., Special Issue 8:253-282.
Hanan, D. A. 1986. California Department of Fish and Game coastal marine mammal study, annual report for the period July 1, 1983 - June 30, 1984. Admin. Rep. LJ-86-16. Southwest Fisheries Science Center, National Marine Fisheries Service, P.O. Box 271, La Jolla, CA. 55 pp.
Hanan, D. A., D. B. Holts, and A. L. Coan, Jr. 1993. The California drift gill net fishery for sharks and swordfish, 1981-82 through 1990-91. Calif. Dept. Fish and Game Fish. Bull. No. 175. 95 pp.
Heyning, J. E., and T. D. Lewis. 1990. Fisheries interactions involving baleen whales off southern California. Rep. int. Whal. Commn. 40:427-431.
Holts, D. and O. Sosa-Nishizaki. 1998. Swordfish, Xiphias gladius, fisheries of the eastern North Pacific Ocean. In: I. Barrett, O. Sosa-Nishizaki and N. Bartoo (eds.). Biology and fisheries of swordfish, Xiphias gladius. Papers from the International Symposium on Pacific Swordfish, Ensenada Mexico, 11-14 December 1994. U.S. Dep. Commer., NOAA Tech. Rep. NMFS 142, 276 p.
Julian, F. and M. Beeson. 1998. Estimates for marine mammal, turtle, and seabird mortality for two California gillnet fisheries: 1990-95. Fish. Bull. 96:271-284.
Kraus. S.D., M.W. Brown, H. Caswell, C.W.Clark, M. Fujiwara, P.K. Hamilton, R.D. Kenney, A.R. Knowlton, S. Landry, C.A.Mayo, W.A. McLellan, M.J. Moore, D.P. Nowacek, D.A. Pabst, A.J. Read, R. M. Rolland. 2005. North Atlantic Right Whales in crisis. Science 309:561-562.
Larkman, V. E. and R. R. Veit. 1998. Seasonality and abundance of blue whales off southern California. CalCOFI Rep. 39:236-239. Mate, B. R., B. A. Lagerquist, and J. Calambokidis. 1999. Movements of North Pacific blue whales during their
feeding season off southern California and their southern fall migration. Mar. Mamm. Sci. 15(4):1246-1257.
Mizroch, S. A., D. W. Rice, and J. M. Breiwick. 1984. The blue whale, Balaenoptera musculus. Mar. Fish. Rev. 46:15-19.
Ohsumi, S. and S. Wada. 1972. Stock assessment of blue whales in the North Pacific. Working Paper for the 24th Meeting of the International Whaling Commission. 20 pp.
Rankin, S., J. Barlow, and K.M. Stafford. 2006. Blue whale (Balaenoptera musculus) sightings and recordings south of the Aleutian Islands. Marine Mammal Science 22(3):708-713.
Reilly, S. B. and V. G. Thayer. 1990. Blue whale (Balaenoptera musculus) distribution in the eastern tropical Pacific. Mar. Mamm. Sci. 6(4):265-277.
Reeves, R. R., P. J. Clapham, R. L. Brownell, Jr., and G. K. Silber. 1998. Recovery plan for the blue whale (Balaenoptera musculus). Office of Protected Resources, NMFS, NOAA, Silver Spring, Maryland. 30 pp.
Redfern, J. V., M. F. McKenna, T. J. Moore, J. Calambokidis, M. L. DeAngelis, E. A. Becker, J. Barlow, K. A. Forney, P. C. Fiedler, and S. J. Chivers. 2013. Assessing the risk of ships striking large whales in marine spatial planning. Conservation Biology, 27:292-302.
Sosa-Nishizaki, O., R. De la Rosa Pacheco, R. Castro Longoria, M. Grijalva Chon, and J. De la Rosa Velez. 1993. Estudio biologico pesquero del pez (Xiphias gladius) y otras especies de picudos (marlins y pez vela). Rep. Int. CICESE, CTECT9306.
Stafford, K. M., S. L. Nieukirk, and C. G. Fox. 1999. An acoustic link between blue whales in the eastern tropical Pacific and the Northeast Pacific. Mar. Mamm. Sci. 15(4):1258-1268.
Stafford, K. M., S. L. Nieukirk, and C. G. Fox. 2001. Geographic and seasonal variation of blue whale calls in the North Pacific. Journal Cetacean Research and Management. 3:65-76.
Stafford, K.M. 2003. Two types of blue whale calls recorded in the Gulf of Alaska. Marine Mammal Science 19(4):682-693.
Tonnessen, J. N., and A. O. Johnsen. 1982. The History of Modern Whaling. Univ. Calif. Press, Berkeley and Los Angeles. 798 pp.
Wade, P. R. and T. Gerrodette. 1993. Estimates of cetacean abundance and distribution in the eastern tropical Pacific. Rept. Int. Whal. Commn. 43:477-493.
Yablokov, A. V. 1994. Validity of whaling data. Nature 367:108.
122

Revised 01/15/2011 9/25/2013
HUMPBACK WHALE (Megaptera novaeangliae): California/Oregon/Washington Stock
STOCK DEFINITION AND GEOGRAPHIC RANGE Although the International Whaling Commission (IWC) only considered one stock (Donovan 1991), there is now good evidence for multiple populations of humpback whales in the North Pacific (Johnson and Wolman 1984; Baker et al. 1990). Humpback whales in the North Pacific feed in coastal waters from California to Russia and in the Bering Sea. They migrate south to wintering destinations off Mexico, Central America, Hawaii, southern Japan, and the Philippines. Mitochondrial and nuclear genetic markers show that considerable structure exists in humpback whale populations in the North Pacific (Baker et al. 1998). Significant levels of mitochondrial and nuclear genetic differences were found between central California and Southeast Alaska feeding areas (Baker et al. 1998). Mitochondrial genetic differences are also found between feeding area in the Atlantic (Palsboll et al. 1995). The genetic exchange rate between California and Alaska is estimated to be less than 1 female per generation (Baker 1992). Two breeding areas (Hawaii and coastal Mexico) showed fewer genetic differences than did the two feeding areas (Baker 1992). Individually identified whales have been found to move between winter breeding areas in Hawaii and Mexico (Baker et al. 1990). There have been no individual matches between 597 humpbacks photographed in California and 617 humpbacks photographed in Alaska (Calambokidis et al. 1996). Only two of the 81 whales photographed in British Columbia have matched with a California catalog (Calambokidis et al. 1996), indicating that the U.S./Canada border is an approximate geographic boundary between feeding populations. Waters off northern Washington may be an area of mixing between the California/Oregon/Washington stock and a southern British Columbia stock. Alternatively, humpback whales in northern Washington and southern British Columbia may be a distinct feeding population (Calambokidis et al. 2008) and a separate stock. For humpback whales, maternally directed fidelity to specific feeding areas within an ocean basin appears to be so strong that genetic differences have evolved in both the Atlantic, where there is a single breeding area, and in the Pacific, where there are multiple breeding areas. Because fidelity appears to be greater in feeding areas than in breeding areas, the stock structure of humpback whales is defined based on feeding areas. Humpback whales occur throughout the north Pacific, with multiple populations currently recognized based on low-latitude winter breeding areas (Baker et al. 1998, Calambokidis et al. 2001, Calambokidis et al. 2008, Barlow et al. 2011, Fleming and Jackson 2011). North Pacific breeding areas fall broadly into three regions, including the 1) western Pacific (Japan and Philippines); 2) central Pacific (Hawaiian Islands); and 3) eastern Pacific (Central America and Mexico) (Calambokidis et al. 2008). Exchange of animals between breeding areas rarely occurs, based on photo-identification data of individual whales (Calambokidis et al. 2001, Calambokidis et al. 2008). Photo-identification evidence also suggests strong site fidelity to feeding areas, but animals from multiple feeding areas converge on
Figure 1. Humpback whale sightings based on shipboard surveys off California, Oregon, and Washington, 1991-2008. Dashed line represents the U.S. EEZ, thin lines indicate completed transect effort of all surveys combined. See Appendix 2 for data sources and information on timing and location of survey effort.
123

common winter breeding areas (Calambokidis et al. 2008). Baker et al. (2008) reported significant differences in mtDNA haplotype frequencies among different breeding and feeding areas in the North Pacific, reflecting strong matrilineal site fidelity to the respective migratory destinations. The most significant differences in haplotype frequencies were found between the California/Oregon feeding area and Russian and Southeastern Alaska feeding areas (Baker et al. 2008). Among breeding areas, the greatest level of differentiation was found between Okinawa and Central America and most other breeding grounds (Baker et al. 2008). Genetic differences between feeding and breeding grounds were also found, even for areas where regular exchange of animals between feeding and breeding grounds is confirmed by photo-identification (Baker et al. 2008).
Along the U.S. west coast, one stock is currently recognized, which includes animals that appear to be part of two separate feeding groups, a California and Oregon feeding group and a northern Washington and southern British Columbia feeding group (Calambokidis et al. 2008, Barlow et al. 2011). Very few photographic matches between these feeding groups have been documented (Calambokidis et al. 2008). Humpbacks from both groups have been photographically matched to breeding areas off Central America, mainland Mexico, and Baja California, but whales from the northern Washington and southern British Columbia feeding group also winter near the Hawaiian Islands and the Revillagigedo Islands off Mexico (Barlow et al. 2011).
For the Marine Mammal Protection Act (MMPA) stock assessment reports, the California/Oregon/Washington Stock is defined to include humpback whales that feed off the west coast of the United States, including animals from both the California-Oregon and Washington-southern British Columbia feeding groups (Calambokidis et al. 1996, Calambokidis et al. 2008, Barlow et al. 2011). The winter migratory destination of this stock is primarily in coastal waters of Mexico and Central America. Three other stocks are recognized in the U.S. MMPA Pacific stock assessment reports: the Central North Pacific Stock (with feeding areas from Southeast Alaska to the Alaska Peninsula), the Western North Pacific Stock (with feeding areas from the Aleutian Islands, the Bering Sea, and Russia), and the American Samoa Stock in the south Pacific (with largely undocumented feeding areas as far south as the Antarctic Peninsula). POPULATION SIZE Based on whaling statistics, the pre-1905 population of humpback whales in the North Pacific was estimated to be 15,000 (Rice 1978), but this population was reduced by whaling to approximately 1,200 by 1966 (Johnson and Wolman 1984). A photo-identification study in 2004-2006 estimated the abundance of humpback whales in the entire Pacific Basin to be approximately 18,000-20,000 21,808 (CV=0.04) (Calambokidis et al. 2008, Barlow et al. 2011). Estimates of regional abundance in the California/Oregon stratum from that study (1,702) are less precise than estimates from dedicated west-coast studies. Barlow and Forney (2007) estimated 1,096 (CV=0.22) humpbacks in California, Oregon, and Washington waters based on summer/fall ship line-transect surveys in 2001. Forney (2007) estimated 1,769 (CV=0.16) humpbacks in the same region based on a 2005 summer/fall ship line-transect survey, which included additional fine-scale coastal strata not included in the 2001 survey. Barlow (2010) recently estimated 1,090 (CV=0.41) humpback whales from a 2008 summer/fall ship line-transect survey of California, Oregon, and Washington waters the same region. The combined 2005 and 2008 line-transect estimate of abundance is the geometric mean of the two annual estimates, or 1,389 (CV=0.21). Calambokidis et al. (2009) estimated humpback whale abundance in these feeding areas from 1991 to 2008 using Petersen mark-recapture estimates based on photo-identification collections in adjacent pairs of years (Figure 2). The 2007/2008 mark-recapture population estimate for California and Oregon (2,043, CV=0.10) is higher than any previous mark-recapture estimates (Calambokidis et al. 2009). In general, mark-recapture estimates are negatively biased due to heterogeneity in sighting probabilities (Hammond 1986); however, this bias is likely to be minimal because the above mark-recapture estimate is based on data from nearly a third of the entire population (the 2007/2008 data contained 672 known individuals). The estimate of 2,043 humpback whales in 2007/2008 is also a negatively biased estimate of this stock because it excludes some whales in Washington. The best estimate of abundance for this stock is the mark-recapture estimate of 2,043 (CV=0.10), which is also the most precise estimate. Abundance estimates from photographic mark-recapture surveys conducted in California and Oregon waters every year from 1991 through 2011 represent the most current estimates (Calambokidis 2013). These estimates include only animals photographed in California and Oregon waters and not animals that are part of the separate feeding group found off Washington state and southern British Columbia (Calambokidis et al. 2009). California and Oregon estimates range from approximately 1,100 to 2,600 animals, depending on the choice of recapture model and sampling period (Figure 2). The best estimate of abundance for California and Oregon waters is taken as the 2008-2011 Darroch estimate of 1,729 (CV = 0.03) whales, which is also the most precise estimate (Calambokidis 2013).
Calambokidis et al. (2008) reported a range of photographic mark-recapture abundance estimates (145 – 469) for the northern Washington and southern British Columbia feeding group most recently in 2005. The best
124

model estimate from that paper (lowest AICc score) was reported as 189 (CV not reported) animals. This estimate is approximately 8 years old and will soon be outdated for use in stock assessments.
Combining abundance estimates from both California/Oregon and Washington/southern British Columbia feeding groups (1,729 + 189) yields an estimate of 1,918 (CV≈0.03) animals for the California/Oregon/Washington stock. The approximate CV of 0.03 for the combined estimate reflects that a vast majority of the variance is derived from the California and Oregon estimate (CV=0.03) and that no CV was provided for the Washington state and southern British Columbia estimate. Minimum Population Estimate The minimum population estimate for humpback whales in the California/Oregon/Washington stock is taken as the lower 20th percentile of the log-normal distribution of the 2007/2008 combined mark-recapture estimate for both feeding groups (Calambokidis et al. 2009) or 1,878 given above, or 1,876 animals. Current Population Trend Ship surveys provide some indication that humpback whales increased in abundance in California coastal waters between 1979/80 and 1991 (Barlow 1994) and between 1991 and 2005 (Barlow and Forney 2007; Forney 2007), but this increase was not steady, and estimates showed a slight dip in 2001. Mark-recapture population estimates have had shown a long-term increase of approximately 7.5% per year (Calambokidis et al. 2009, Figure 2), but more recent estimates show variable trends (Figure 2), depending on the choice of model and time frame used (Calambokidis 2013). although there have been short-term declines during this period, probably due to oceanographic variability. Population estimates for the entire North Pacific have also increased substantially from 1,200 in 1966 to approximately 18,000 to - 20,000 whales in 2004 to 2006 (Calambokidis et al. 2008). Although these estimates are based on different methods and the earlier estimate is extremely uncertain, the growth rate implied by these estimates (6-7%) is consistent with the recently observed growth rates of the California/Oregon/Washington stock. CURRENT AND MAXIMUM NET PRODUCTIVITY RATES The proportion of calves in the California/Oregon/Washington stock from 1986 to 1994 appeared much lower than previously measured for humpback whales in other areas (Calambokidis and Steiger 1994), but in 1995-97 a greater proportion of calves were identified, and the 1997 reproductive rates for this population are closer to those reported for humpback whale populations in other regions (Calambokidis et al. 1998). Despite the apparently low proportion of calves, two independent lines of evidence indicate that this stock was growing in the 1980s and early 1990s (Barlow 1994; Calambokidis et al. 2003) with a best estimate of 8% growth per year (Calambokidis et al. 1999). The current net productivity rate is unknown. POTENTIAL BIOLOGICAL REMOVAL The potential biological removal (PBR) level for this stock is calculated as the minimum population size (1,878 1,855) times one half the estimated population growth rate for this stock of humpback whales (½ of 8%) times a recovery factor of 0.3 (for an endangered species, with Nmin > 1,500 and CV(Nmin) < 0.50), resulting in a PBR of 22.5 22. Because this stock spends approximately half its time outside the U.S. EEZ, the PBR allocation for U.S. waters is 11.3 11whales per year. HUMAN-CAUSED MORTALITY AND SERIOUS INJURY Information on historic whaling has been moved to the Status of Stock section. New Serious Injury Guidelines NMFS updated its serious injury designation and reporting process, which uses guidance from previous serious injury workshops, expert opinion, and analysis of historic injury cases to develop new criteria for distinguishing serious from non-serious injury (Angliss and DeMaster 1998, Andersen et al. 2008, NOAA 2012). NMFS defines serious injury as an “injury that is more likely than not to result in mortality”. Injury determinations for stock assessments revised in 2013 or later incorporate the new serious injury guidelines, based on the most recent 5-year period for which data are available.
125
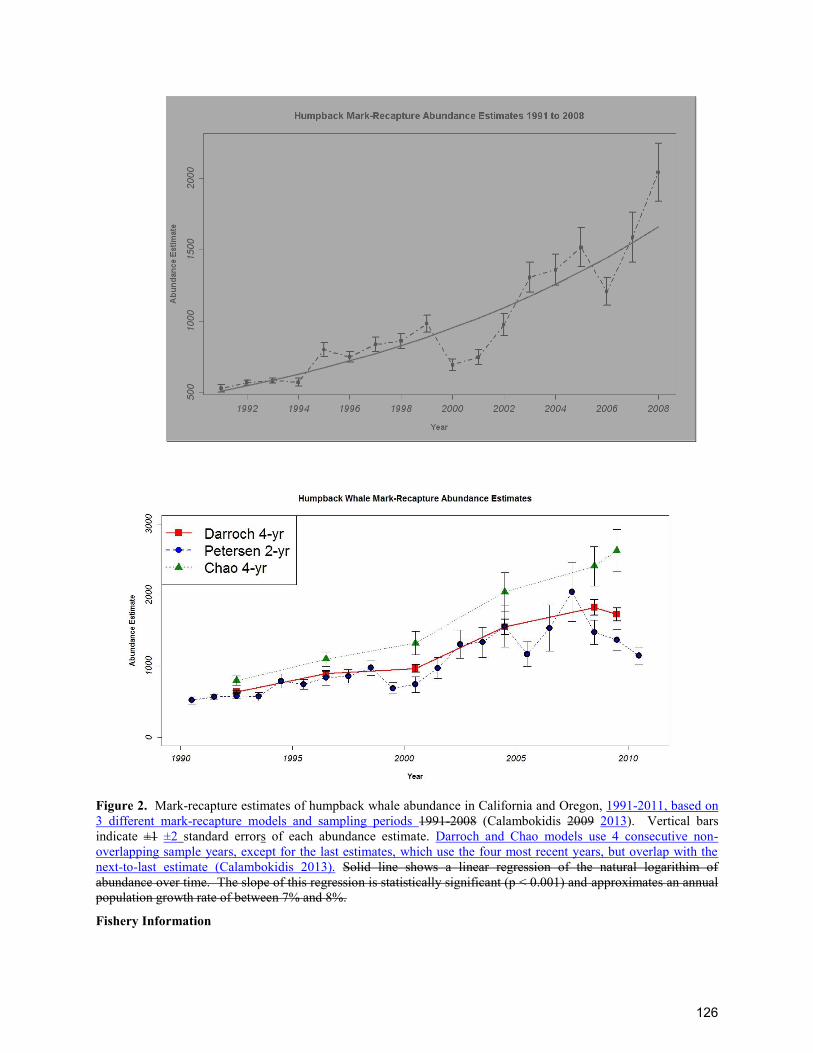
Figure 2. Mark-recapture estimates of humpback whale abundance in California and Oregon, 1991-2011, based on 3 different mark-recapture models and sampling periods 1991-2008 (Calambokidis 2009 2013). Vertical bars indicate ±1 ±2 standard errors of each abundance estimate. Darroch and Chao models use 4 consecutive non-overlapping sample years, except for the last estimates, which use the four most recent years, but overlap with the next-to-last estimate (Calambokidis 2013). Solid line shows a linear regression of the natural logarithim of abundance over time. The slope of this regression is statistically significant (p < 0.001) and approximates an annual population growth rate of between 7% and 8%.
Fishery Information
126

Pot and trap fisheries are the most commonly documented source of serious injury and mortality of humpback whales in U.S. west coast waters (Carretta et al. 2013). Between 2007 and 2011, there were 16 documented humpback whale interactions with pot/trap fisheries (Carretta et al. 2013). Of the 16 documented interactions, 10 were identified as generic ‘crab pot/trap’ and 4 as ‘unidentified pot/trap’ fishery. Two interactions identified as generic ‘crab pot fishery entanglements’ in Oregon resulted in the death of whales. An additional 4 serious injuries and 10 prorated serious injuries of humpbacks occurred during this same period (Carretta et al. 2013). Two interactions with serious injuries had gear positively identified: the CA lobster trap fishery and the CA dungeness crab fishery. Gillnet and unidentified fisheries accounted for 10 interactions with humpback whales between 2007 and 2011 (1 death, 7 serious injuries, and 2 prorated serious injuries). Only one record had a positive identification of the fishery: a self-report of a humpback released with trailing gear from the CA swordfish drift gillnet fishery in 2009. This was designated as a prorated serious injury (prorate value = 0.75), based on a lack of detail regarding the amount of trailing gear or if the gear was constricting in any way. No humpback whales were reported entangled by fishery observers in the California swordfish drift gillnet fishery during 2007-2011 (Carretta and Enriquez 2009a, 2009b, 2010, 2012a, 2012b). The remaining 9 fishery interactions involved humpback whales entangled in ropes and unidentified nets. A summary of human-caused mortality and serious injury of humpback whales from commercial fisheries during 2007 to 2011 is provided in Table 1. Serious injury designations follow the new NMFS serious injury policy implemented in 2012 (Carretta et al. 2013, NOAA 2012). Gillnets have been documented to entangle marine mammals off Baja California (Sosa-Nishizaki et al. 1993), but no recent bycatch data from Mexico are available. A summary of known fishery mortality and injury for this stock of humpback whales for 2004-2008 is given in Table 1. A total of 18 humpback whales were observed entangled in fishing gear during 2004-2008 in California, Oregon, and Washington (Table 1). No entanglements were reported from the observer program that monitors the large-mesh swordfish and thresher shark drift gillnet fishery (Carretta et al. 2005, Carretta and Enriquez 2006, 2007, 2009a, 2009b); however, a free-swimming humpback was observed entangled in gillnet gear of unknown origin in 2006 (NMFS, Southwest Regional Stranding Program, unpublished data). Of the 18 humpbacks entangled in fishing gear, 11 were reported entangled at sea in trap/pot fishery gear off California and Oregon, including two animals later found dead in Oregon (Northwest Regional Stranding Program, unpublished data). Seven humpbacks were reported entangled in unknown gillnet or other gear, including lines and buoys of unknown origin. Two of the 11 pot/trap gear entanglements could be attributed to specific fisheries: One whale was entangled in sablefish trap gear and another in spot prawn trap gear (NMFS, Southwest Regional Stranding Program, unpublished data). The whale entangled in sablefish trap gear was successfully disentangled by divers who removed all the gear, and the animal swam away immediately following disentanglement. Another whale entangled in crab pot gear in 2008 was successfully disentangled from gear. One of the sightings involving crab pot gear included a cow/calf pair where the cow was entangled. Due to the trailing gear, 14 of the humpbacks are considered as serious injuries in Table 1 (two released animals were not considered seriously injured). Including the 14 serious injuries and two deaths, total mean annual serious injury and mortality for the commercial fisheries listed in Table 1 is 3.2 per year for the period 2004-2008. In addition to the humpback entanglements, there were 12 unidentified whales observed entangled in pot/trap gear or unknown gillnet gear during 2004-2008. Some of these animals may represent re-sightings of entangled humpback whales described above. It is likely that most of the unidentified pot/trap fishery entanglements involved humpback whales. Drift gillnet fisheries for swordfish and sharks exist along the entire Pacific coast of Baja California, Mexico and may take animals from the same population. Quantitative data are available only for the Mexican swordfish drift gillnet fishery, which uses vessels, gear, and operational procedures similar to those in the U.S. drift gillnet fishery, although nets may be up to 4.5 km long (Holts and Sosa-Nishizaki 1998). The fleet increased from two vessels in 1986 to 31 vessels in 1993 (Holts and Sosa-Nishizaki 1998). The total number of sets in this fishery in 1992 can be estimated from data provided by these authors to be approximately 2700, with an observed rate of marine mammal bycatch of 0.13 animals per set (10 marine mammals in 77 observed sets; Sosa-Nishizaki et al. 1993). This overall mortality rate is similar to that observed in California driftnet fisheries during 1990-95 (0.14 marine mammals per set; Julian and Beeson, 1998), but species-specific information is not available for the Mexican fisheries. Previous efforts to convert the Mexican swordfish driftnet fishery to a longline fishery have resulted in a mixed-fishery, with 20 vessels alternately using longlines or driftnets, 23 using driftnets only, 22 using longlines only, and seven with unknown gear type (Berdegué 2002). Table 1. Summary of available information on the incidental mortality and serious injury of humpback whales (California/Oregon/Washington stock) for commercial fisheries that might are likely to take this species (Carretta et
127

al. 2013 Carretta et al. 2005, Carretta and Enriquez 2006, 2007, 2009a, 2009b). Injury includes any entanglement that does not result in immediate death and may include serious injury resulting in death. n/a indicates that data are not available. Mean annual takes are based on 2004-2008 2007-2011 data unless noted otherwise. Serious injuries may include prorated serious injuries with values less than one (NOAA 2012), thus the sum of serious injury and mortality may not be a whole number.
Ship Strikes Eight humpback whales were reported struck by vessels between 2007 and 2011 (Carretta et al. 2013). Four deaths, two non-serious injuries, one serious injury, and one prorated serious injury (prorate value = 0.36) resulted from vessel strikes during this period (Carretta et al. 2013). In addition, there were four serious injuries to unidentified large whales from ship strikes during this time. The average annual serious injury and mortality attributable to ship strikes during 2007-2011 is 1.1 whales per year (4 deaths, plus one serious injury, plus one prorated serious injury = 5.36 deaths or injuries / 5-yr period). Two humpback whale deaths were attributed to ship strikes during the period 2004-2008 (NMFS, unpublished stranding data). An additional animal that was struck in Washington waters in 2008 was reported to have broken the stabilizer on the vessel that struck it, but the condition of the whale is unknown. During 2004-2008, there were an additional eight injuries of unidentified large whales attributed to ship strikes. Additional mortality from ship strikes probably goes unreported because the whales do not strand or, if they do, they do not have obvious signs of trauma. Several humpback whales have been photographed in California with large gashes in their dorsal surface that appear to be from ship strikes (J. Calambokidis, pers. comm.). The average number of documented humpback whale deaths by ship strikes for 2004-2008 is 0.4 per year, but it is apparent that animals struck by ships are unlikely to be reported.
Fishery Name Year(s) Data Type
Percent Observer Coverage
Observed Mortality (and serious injury)
Estimated mortality
Mean Annual Takes
CA swordfish and thresher shark drift gillnet
fishery
2004 2005 2006 2007 2008 2009 2010 2011
observer
20.6% 20.9% 18.5% 16.4% 13.5% 13.3% 11.9% 19.5%
0 0 0 0 0 0 0 0
0 0 0 0 0 0 0 0
0 (n/a)
CA halibut and white seabass and other species
large mesh (>3.5”) set gillnet fishery
2004 2005 2006 2007 2008
observer
0% 0%
~1% 17.8%
0%
n/a n/a n/a
0 (0) n/a
n/a
0 (n/a)
Pot or trap fisheries (includes identified and
unidentified pot/trap interactions)
2004 2005 2006 2007 2008
2007-2011
Strandings & sightings
n/a
0 (0) 0 (3) 1 (1) 1 (1) 0 (2)
2 (11.5)
n/a
≥1.8
≥ 2.7
unidentified fisheries
2004 2005 2006 2007 2008
2007-2011
Strandings & sightings
n/a
0 (1) 0 (0) 0 (2) 0 (3) 0 (1)
1 (7.5)
n/a
≥ 1.4
≥ 1.7
Total Annual Takes
≥3.2
≥ 4.4
128

Other human-caused mortality There was no humpback whale mortality reported from non-commercial fishery sources for the period 2004-2008. The average number of observed humpback deaths from unknown anthropogenic sources is zero per year from during 2004-2008. 2007-2011. STATUS OF STOCK Approximately 15,000 humpback whales were taken from the North Pacific from 1919 to 1987 (Tonnessen and Johnsen 1982; C. Allison, IWC unpubl. Data), and, of these, approximately 8,000 were taken from the west coast of Baja California, California, Oregon and Washington (Rice 1978), presumably from this stock. Shore-based whaling apparently depleted the humpback whale stock off California twice: once prior to 1925 (Clapham et al. 1997) and again between 1956 and 1965 (Rice 1974). There has been a prohibition on taking humpback whales since 1966. As a result of commercial whaling, humpback whales were listed as "endangered" under the Endangered Species Conservation Act of 1969. This protection was transferred to the Endangered Species Act (ESA) in 1973. The species is still listed as “endangered”, and consequently the California/Oregon/Washington stock is automatically considered as a "depleted" and "strategic" stock under the MMPA. The estimated annual mortality and serious injury due to entanglement (3.2/yr 4.4/yr), other anthropogenic sources (zero), plus ship strikes (0.4/yr 1.1/yr) in California is less than the PBR allocation of 11.3 11 for U.S. waters. Based on strandings and at sea observations, annual humpback whale mortality and serious injury in commercial fisheries is greater than 10% of the PBR; therefore, total fishery mortality and serious injury is not approaching zero mortality and serious injury rate. The California/Oregon/Washington stock appears to be increasing in abundance underwent a long-term increase from 1990 through approximately 2008 (Figure 2), but more recent estimates have shown variable trends. Habitat Concerns Increasing levels of anthropogenic sound in the world’s oceans (Andrew et al. 2002), such as those produced by shipping traffic, ATOC (Acoustic Thermometry of Ocean Climate) or LFA (Low Frequency Active) sonar, have been suggested to be a habitat concern for whales, particularly for baleen whales that may communicate using low-frequency sound. Based on vocalizations (Richardson et al. 1995; Au et al. 2006), reactions to sound sources (Lien et al. 1990, 1992; Maybaum 1993), and anatomical studies (Hauser et al. 2001), humpback whales also appear to be sensitive to mid-frequency sounds, including those used in active sonar military exercises (U.S. Navy 2007). Behavioral changes associated with exposure to simulated mid-frequency sonar, including cessation of feeding, increased swimming speeds, and movement away from simulated sound sources have been documented in tagged blue whales (Goldbogen et al. 2013). It is likely that the behavior of other baleen whale species, such as humpback whales, may be similarly affected by such anthropogenic sounds. REFERENCES Allison, C. International Whaling Commission. The Red House, 135 Station Road, Impington, Cambridge, UK CB4
9NP. Andrew, R. K., B. M. Howe, J. A. Mercer, and M. A. Dzieciuch. 2002. Ocean ambient sound: comparing the
1960’s with the 1990’s for a receiver off the California coast. Acoustic Research Letters Online 3:65-70. Andersen, M. S., K. A. Forney, T. V. N. Cole, T. Eagle, R. Angliss, K. Long, L. Barre, L. Van Atta, D. Borggaard,
T. Rowles, B. Norberg, J. Whaley, and L. Engleby. 2008. Differentiating Serious and Non-Serious Injury of Marine Mammals: Report of the Serious Injury Technical Workshop, 10-13 September 2007, Seattle, Washington. U.S. Dep. Commer., NOAA Tech. Memo. NMFS-OPR-39. 94 p.
Angliss, R.P. and D.P. DeMaster. 1998. Differentiating Serious and Non-Serious Injury of Marine Mammals Taken Incidental to Commercial Fishing Operations. NOAA Tech Memo. NMFS-OPR-13, 48 p.
Au,W.W.L., A.A. Pack, M.O. Lammers, L.M. Herman, M.H. Deakos, K. Andrews. Acoustic properties of humpback whale songs. J. Acoust. Soc. Am. 120 (2), August 2006.
Baker, C. S., D. Steel, J. Calambokidis, J. Barlow, A. M. Burdin, P. J. Clapham, E. Falcone, J. K. B. Ford, C. M. Gabriele, and U. Gozalez-Peral. 2008. "geneSPLASH: an Initial, Ocean-Wide Survey of Mitochondrial (mt) DNA Diversity and Population Structure among Humpback Whales in the North Pacific." National Fish and Wildlife Foundation, Washington, DC.
Baker, C. S., L. Medrano-Gonzalez, J. Calambokidis, A. Perry, F. Pichler, H. Rosenbaum, J. M. Straley, J. Urban-Ramirez, M. Yamaguchi, and O. von Ziegesar. 1998. Population structure of nuclear and mitochondrial DNA variation among humpback whales in the North Pacific. Mol. Ecol. 7:695-708.
129

Baker, C. S. 1992. Genetic variability and stock identity of humpback whales, world-wide. Final Contract Report to Int. Whal. Commn. 45pp.
Baker, C. S., S. R. Palumbi, R. H. Lambertsen, M. T. Weinrich, J. Calambokidis, and S. J. O'Brien. 1990. Influence of seasonal migration on geographic distribution of mitochondrial DNA haplotypes in humpback whales. Nature 344(15):238-240.
Barlow, Jay, J. Calambokidis, E.A. Falcone, C.S. Baker, A.M. Burdin, P.J. Clapham, J.K.B. Ford et al. 2011. Humpback whale abundance in the North Pacific estimated by photographic capture‐recapture with bias correction from simulation studies. Marine Mammal Science 27:793-818.
Barlow, J. 2010. Cetacean abundance in the California Current from a 2008 ship-based line-transect survey. NOAA Technical Memorandum, NMFS, NOAA-TM-NMFS-SWFSC-456. 19pp.
Barlow, J. 1994. Abundance of large whales in California coastal waters: a comparison of ship surveys in 1979/80 and in 1991. Rept. Int. Whal. Commn. 44:399-406.
Barlow, J. and K.A. Forney. 2007. Abundance and population density of cetaceans in the California Current ecosystem. Fishery Bulletin 105:509-526.
Berdegué, J. 2002. Depredación de las especies pelágicas reservadas a la pesca deportiva y especies en peligro de extinción con uso indiscriminado de artes de pesca no selectivas (palangres, FAD's, trampas para peces y redes de agallar fijas y a la deriva) por la flota palangrera Mexicana. Fundación para la conservación de los picudos. A.C. Mazatlán, Sinaloa, 21 de septiembre.
Barlow, J. and G. A. Cameron. 2003. Field experiments show that acoustic pingers reduce marine mammal bycatch in the California drift gillnet fishery. Marine Mammal Science 19(2):265-283.
Berzin, A. A., and A. A. Rovnin. 1966. The distribution and migrations of whales in the northeastern part of the Pacific, Chukchi and Bering Seas. Izvestiya Tikhookeanskogo Nauchno-Issledovatel’skogo Institut Rybnogo Khozyaistva I Okeanografii 58:179-207. (Translated by Bureau of Commercial Fisheries, U. S. Fish and Wildlife Service, Seattle, 1968, pp. 103-136 In: K. I. Panin (ed.), Soviet Research on Marine Mammals of the Far East).
Braham, H. W. 1991. Endangered whales: status update. A Report on the 5-year status of stocks review under the 1978 amendments to the U.S. Endangered Species Act. NMFS Unpublished Report.
Calambokidis, J. 2013. Updated abundance estimates of blue and humpback whales off the US west coast incorporating photo-identifications from 2010 and 2011. Document PSRG-2013-13 presented to the Pacific Scientific Review Group, April 2013. 7 p.
Calambokidis, J., E. Falcone, A. Douglas, L. Schlender, and J. Huggins. 2009. Photographic identification of humpback and blue whales off the U.S. West Coast: results and updated abundance estimates from 2008 field season. Final Report for Contract AB133F08SE2786 from Southwest Fisheries Science Center. 18pp.
Calambokidis, J., E.A. Falcone, T.J. Quinn, A.M. Burdin, P.J. Clapham, J.K.B. Ford, C.M. Gabriele, R. LeDuc, D. Mattila, L. Rojas-Bracho, J.M. Straley, B.L. Taylor, J. Urban, D. Weller, B.H. Witteveen, M. Yamaguchi, A. Bendlin, D. Camacho, K. Flynn, A. Havron, J. Huggins, and N. Maloney. 2008. SPLASH: Structure of Populations, Levels of Abundance and Status of Humpback Whales in the North Pacific. Final report for Contract AB133F-03-RP-00078. 58 p. Available from Cascadia Research (www.cascadiaresearch.org) and NMFS, Southwest Fisheries Science Center (http://swfsc.noaa.gov).
Calambokidis J., Steiger G.H., Straley J.M. et al. 2001. Movements and population structure of humpback whales in the North Pacific. Marine Mammal Science 17:769-794.
Calambokidis, J., T. Chandler, E. Falcone, and A. Douglas. 2004. Research on large whales off California, Oregon and Washington in 2003. Contract Report to Southwest Fisheries Science Center, P.O. Box 271, La Jolla, CA 92038. 48p.
Calambokidis, J., T. Chandler, K. Rasmussen, G. H. Steiger, L. Schlender. 1998. Humpback and blue whale photographic identification: Report on research in 1997. Contract Report to Southwest Fisheries Science Center, P.O. Box 271, La Jolla, CA 92038. 41pp.
Calambokidis, J., T. Chandler, K. Rasmussen, G. H. Steiger, and L. Schlender. 1999. Humpback and blue whale photo-identification research off California, Oregon and Washington in 1998. Final Contract Report to Southwest Fisheries Science Center, National Marine Fisheries Service, P.O. Box 271, La Jolla, CA 92038. 35 pp.
Calambokidis, J., T. Chandler, L. Schlender, G. H. Steiger, and A. Douglas. 2003. Research on humpback and blue whale off California, Oregon and Washington in 2002. Final Contract Report to Southwest Fisheries Science Center, National Marine Fisheries Service, P.O. Box 271, La Jolla, CA 92038. 49 pp.
130

Calambokidis, J., and G. H. Steiger. 1994. Population assessment of humpback and blue whales using photo-identification from 1993 surveys off California. Final Contract Report to Southwest Fisheries Science Center, P.O. Box 271, La Jolla, CA 92038. 31pp.
Calambokidis, J., G. H. Steiger, J. R. Evenson, K. R. Flynn, K. C. Balcomb, D. E. Claridge, P. Bloedel, J. M. Straley, C. S. Baker, O. von Ziegesar, M. E. Dahlheim, J. M. Waite, J. D. Darling, G. Ellis, and G. A. Green. 1996. Interchange and isolation of humpback whales in California and other North Pacific feeding grounds. Mar. Mamm. Sci. 12(2):215-226.
Calambokidis, J., G. H. Steiger, J. M. Straley, T. J. Quinn, II, L. M. Herman, S. Cerchio, D. R. Salden, M. Yamaguchi, F. Sato, J. Urbán R., J. Jacobsen, O. von Ziegesar, K. C. Balcomb, C. M. Gabriele, M. E. Dahlheim, N. Higashi, S. Uchida, J. K. B. Ford, Y. Miyamura, P. Ladrón de Guevara P., S. A. Mizroch, L. Schlender and K. Rasmussen. 1997. Abundance and population structure of humpback whales in the North Pacific Basin. Final Contract Report 50ABNF500113 to Southwest Fisheries Science Center, P.O. Box 271, La Jolla, CA 92038. 72p.
Calambokidis, J., G. H. Steiger, J. M. Straley, L. M. Herman, S. Cerchio, D. R. Salden, J. Urbán-R., J. K. Jacobsen, O. von Ziegesar, K. C. Balcomb, C. M. Gabriele, M. E. Dahlheim, S. Uchida, G. Ellis, Y. Miyamura, P. Ladrón de Guevara-P., M. Yamaguchi, F. Sata, S. A. Mizroch, L. Schlender, K. Rasmussen, J. Barlow, and T. J. Quinn II. 2001. Movements and population structure of humpback whales in the North Pacific. Mar. Mamm. Sci. 17(4):769-794.
Carretta, J. V., S. M. Wilkin, M. M. Muto, and K. Wilkinson. 2013. Sources of human-related injury and mortality for U.S. Pacific west coast marine mammal stock assessments, 2007-2011. U.S. Dep. Commer., NOAA Tech. Memo. NMFS-SWFSC-514, 83 p.
Carretta, J.V. and L. Enriquez. 2012a. Marine mammal and seabird bycatch in California gillnet fisheries in 2010. Southwest Fisheries Science Center Administrative Report LJ-12-01. 14p.
Carretta, J.V. and L. Enriquez. 2012b. Marine mammal and seabird bycatch in California gillnet fisheries in 2011. NOAA Technical Memorandum NOAA-TM-NMFS-SWFSC-500. 14 p.
Carretta, J.V. and L. Enriquez. 2010. Marine Mammal and Sea Turtle Bycatch in the California/Oregon Sworfish and Thresher Shark Drift Gillnet Fishery in 2009. Southwest Fisheries Science Center, NOAA Fisheries Administrative Report LJ-10-03. 11p.
Carretta, J.V. and L. Enriquez. 2009a. Marine mammal and seabird bycatch observed in California commercial fisheries in 2007. Administrative Report LJ-09-01, available from Southwest Fisheries Science Center, 3333 North Torrey Pines Rd., La Jolla, CA 92037. 12 p.
Carretta, J.V. and L. Enriquez. 2009b. Marine mammal bycatch observed in the California/Oregon swordfish and thresher shark drift gillnet fishery in 2008. Administrative Report LJ-09-03, available from Southwest Fisheries Science Center, 3333 North Torrey Pines Rd., La Jolla, CA 92037. 10 p.
Carretta, J.V. and L. Enriquez. 2007. Marine mammal and sea turtle bycatch in the California/Oregon thresher shark and swordfish drift gillnet fishery in 2006. Administrative Report LJ-07-06, available from Southwest Fisheries Science Center, 8604 La Jolla Shores Drive, La Jolla, CA 92037. 9p.
Carretta, J.V. and L. Enriquez. 2006. Marine mammal bycatch and estimated mortality in California commercial fisheries during 2005. Administrative Report LJ-06-07, available from Southwest Fisheries Science Center, 8604 La Jolla Shores Drive, La Jolla, CA 92037. 14p.
Carretta, J.V. and S.J. Chivers. 2004. Preliminary estimates of marine mammal mortality and biological sampling of cetaceans in California gillnet fisheries for 2003. Paper SC/56/SM1 presented to the IWC Scientific Committee, June 2004 (unpublished). [Available from Southwest Fisheries Science Center, National Marine Fisheries Service, 8604 La Jolla Shores Drive, La Jolla, CA 92037, USA] 21p.
Carretta, J.V., S.J. Chivers, and K. Danil. 2005a. Preliminary estimates of marine mammal bycatch, mortality, and biological sampling of cetaceans in California gillnet fisheries for 2004. Administrative Report LJ-05-10, available from Southwest Fisheries Science Center, 8604 La Jolla Shores Drive, La Jolla, California, 92037. 17 p.
Carretta, J.V., T. Price, D. Petersen, and R. Read. 2005b. Estimates of marine mammal, sea turtle, and seabird mortality in the California drift gillnet fishery for swordfish and thresher shark, 1996-2002. Marine Fisheries Review 66(2):21-30.
Clapham, P. J., S. Leatherwood, I. Szczepaniak, and R. L. Brownell, Jr. 1997. Catches of humpback and other whales from shore stations at Moss Landing and Trinidad, California, 1919-1926. Marine Mammal Science 13(3):368-394.
Cordaro, J. Southwest Region, NMFS, 501 West Ocean Blvd, Long Beach, CA 90802_4213.
131
Darling, J. D. 1991. Humpback whales in Japanese waters. Ogasawara and Okinawa. Fluke identification catalog 1987-1990. Final Contract Report, World Wildlife Fund for Nature, Japan. 22 pp.
Dohl, T. P., R. C. Guess, M. L. Duman, and R. C. Helm. 1983. Cetaceans of central and northern California, 1980-83: Status, abundance, and distribution. Final Report to the Minerals Management Service, Contract No. 14-12-0001-29090. 284p.
Donovan, G. P. 1991. A review of IWC stock boundaries. Rept. Int. Whal. Commn., Special Issue 13:39-68. Fleming, A. and J. Jackson. 2011. Global review of humpback whales (Megaptera novaeangliae). U.S. Dep.
Commer., NOAA Tech. Memo. NOAA-TM-NMFS-SWFSC-474, 206 pp. Forney, K. A., J. Barlow, and J. V. Carretta. 1995. The abundance of cetaceans in California waters. Part II: Aerial
surveys in winter and spring of 1991 and 1992. Fish. Bull. 93:15-26. Forney, K.A. 2007. Preliminary estimates of cetacean abundance along the U.S. west coast and within four
National Marine Sanctuaries during 2005. U.S. Department of Commerce, NOAA Technical Memorandum NMFS-SWFSC-406. 27 p.
Green, G. A., J. J. Brueggeman, R. A. Grotefendt, C. E. Bowlby, M. L. Bonnell, K. C. Balcomb, III. 1992. Cetacean distribution and abundance off Oregon and Washington, 1989-1990. Ch. 1 In: J. J. Brueggeman (ed.). Oregon and Washington Marine Mammal and Seabird Surveys. Minerals Management Service Contract Report 14-12-0001-30426.
Goldbogen, J.A., Southall B.L.,DeRuiter S.L., Calambokidis J., Friedlaender A.S.,Hazen E.L., Falcone E.A., Schorr G.S., Douglas A., Moretti D.J., Kyburg C., McKenna M.F., Tyack P.L. 2013. Blue whales respond to simulated mid-frequency military sonar. Proc. R. Soc. B 280:20130657. http://dx.doi.org/10.1098/rspb.2013.0657
Hammond, P. S. 1986. Estimating the size of naturally marked whale populations using capture-recapture techniques. Rept. Int. Whal. Commn., Special Issue 8:253-282.
Hauser, D.S., D.A. Helweg, and P.W.B. Moore, 2001. A bandpass filter-bank model of auditory sensitivity in the humpback whale. Aquatic Mammals 27:82-91.
Heyning, J. E., and T. D. Lewis. 1990. Fisheries interactions involving baleen whales off southern California. Rep. int. Whal. Commn. 40:427-431.
Holts, D. and O. Sosa-Nishizaki. 1998. Swordfish, Xiphias gladius, fisheries of the eastern North Pacific Ocean. In: I. Barrett, O. Sosa-Nishizaki and N. Bartoo (eds.). Biology and fisheries of swordfish, Xiphias gladius. Papers from the International Symposium on Pacific Swordfish, Ensenada Mexico, 11-14 December 1994. U.S. Dep. Commer., NOAA Tech. Rep. NMFS 142, 276 p.
Johnson, J. H., and A. A. Wolman. 1984. The humpback whale, Megaptera novaeangliae. Mar. Fish. Rev. 46(4):30-37.
Lien, J., S. Todd and J. Guigne. 1990. Inferences about perception in large cetaceans, especially humpback whales, from incidental catches in fixed fishing gear, enhancement of nets by “alarm” devices, and the acoustics of fishing gear. P. 347-362 in J.A. Thomas, R.A. Kastelein and A.Ya. Supin (eds.), Marine mammal sensory systems. Plenum, New York.
Lien, J., W. Barney, S. Todd, R. Seton and J. Guzzwell. 1992. Effects of adding sounds to cod traps on the probability of collisions by humpback whales. P. 701-708 in J.A. Thomas, R.A. Kastelein and A.Ya. Supin (eds.), Marine mammal sensory systems. Plenum, New York.
Maybaum, H.L. 1993. Responses of humpback whales to sonar sounds. J. Acoust. Soc. Am. 94(3, Pt. 2): 1848-1849.
Nishiwaki, M. 1966. Distribution and migration of the larger cetaceans in the North Pacific as shown by Japanese whaling results. Pp. 172-191 In: K. S. Norris (ed.), Whales, Dolphins and Porpoises. University of California Press, Berkeley, CA. Academic Press, New York.
NOAA. 2012. Federal Register 77:3233. National Policy for Distinguishing Serious From Non-Serious Injuries of Marine Mammals. http://www.nmfs.noaa.gov/op/pds/documents/02/238/02-238-01.pdf
Norris, T. F., M. McDonald, and J. Barlow. 1999. Acoustic detections of singing humpback whales (Megaptera novaeangliae) in the eastern North Pacific during their northbound migration. J. Acoust. Soc. Am. 106(1):506-514.
Palsboll, P.J., Clapham, P. J., Mattila, D. K., Larsen, F., Sears, R., Siegismund, H.R., Arctander, P. et al. 1995. Distribution of mtDNA haplotypes in North Atlantic humpback whales: the influence of behaviour on population structure. Marine ecology progress series. Oldendorf, 116(1), 1-10.
Perry, A., C. S. Baker, L. M. Herman. 1990. Population characteristics of individually identified humpback whales in the central and eastern North Pacific: a summary and critique. Rep. Int. Whal. Commn. (Special Issue 12):307-317.
132

Rice, D. W. 1974. Whales and whale research in the eastern North Pacific. pp. 170-195 In: W. E. Schevill (ed.). The Whale Problem: A Status Report. Harvard Press, Cambridge, MA.
Rice, D. W. 1978. The humpback whale in the North Pacific: distribution, exploitation, and numbers. pp. 29-44 In: K. S. Norris and R. R. Reeves (eds.). Report on a Workshop on Problems Related to Humpback Whales (Megaptera novaeangliae) in Hawaii. Contr. Rept. to U. S. Marine Mammal Commn. NTIS PB-280-794. 90pp.
Richardson, W.J., C.R. Greene, C.I. Malme, and D.H. Thomson. 1995. Marine mammals and noise. Academic Press.
Sosa-Nishizaki, O., R. De la Rosa Pacheco, R. Castro Longoria, M. Grijalva Chon, and J. De la Rosa Velez. 1993. Estudio biologico pesquero del pez (Xiphias gladius) y otras especies de picudos (marlins y pez vela). Rep. Int. CICESE, CTECT9306.
Steiger, G. H., J. Calambokidis, R. Sears, K. C. Balcomb, and J. C. Cubbage. 1991. Movement of humpback whales between California and Costa Rica. Mar. Mamm. Sci. 7:306-310.
Tonnessen, J. N., and A. O. Johnsen. 1982. The History of Modern Whaling. Univ. Calif. Press, Berkeley and Los Angeles. 798pp.7:306-310.
Urbán R., J., C. Alverez F., M. Salinas Z., J. Jacobson, K. C. Balcomb III, A. Jaramillo L., P. L. de Guevara P., and A. Aguayo L. 1999. Population size of humpback whale, Megaptera novaeangliae, in waters off the Pacific coast of Mexico.
U.S. Department of the Navy (Navy). 2007. Composite Training Unit Exercises and Joint Task Force Exercises Draft Final Environmental Assessment/Overseas Environmental Assessment. Prepared for the Commander, U.S. Pacific Fleet and Commander, Third Fleet. February 2007.
133

Revised 01/15/2011 9/24/2013
FIN WHALE (Balaenoptera physalus physalus): California/Oregon/Washington Stock
STOCK DEFINITION AND GEOGRAPHIC RANGE The International Whaling Commission (IWC) recognized two stocks of fin whales in the North Pacific: the East China Sea and the rest of the North Pacific (Donovan 1991). Mizroch et al. (1984) cites evidence for additional fin whale subpopulations in the North Pacific. From whaling records, fin whales that were marked in winter 1962-70 off southern California were later taken in commercial whaling operations between central California and the Gulf of Alaska in summer (Mizroch et al. 1984). Mizroch et al. (2009) described eastern and western north Pacific populations, based on a review of sightings data, catch statistics, recaptures of marked whales, blood chemistry data, and acoustics. The two populations are thought to have separate wintering and mating grounds off the coasts of Asia and North America and during summer, whales from each population may co-occur near the Aleutian Islands and Bering Sea (Mizroch et al. 2009). Additional, non-migratory populations exist in the Gulf of California (Tershy et al. 1993; Bérubé et al. 2002) and the East China Sea (Fujino 1960). Evidence of additional subpopulations near Sanriku-Hokkaido and the Sea of Japan exists, based on seasonal catch data and recaptures of marked animals (Mizroch et al. 2009). Fin whales occur throughout the North Pacific, from the southern Chukchi Sea to the Tropic of Cancer (Mizroch et al. 2009), but their wintering areas are poorly known. More recent observations show aggregations of fin whales year-round in southern/central California (Dohl et al. 1983; Barlow 1997; Forney et al. 1995), year-round in the Gulf of California (Tershy et al. 1993), in summer in Oregon (Green et al. 1992; McDonald et al. 1995), and in summer/autumn in the Shelikof Strait/Gulf of Alaska (Brueggeman et al. 1990). Acoustic signals from fin whale are detected year-round off northern California, Oregon and Washington, with a concentration of vocal activity between September and February (Moore et al. 1998). Fin whales occur year-round in the Gulf of Alaska (Stafford et al. 2007); the Gulf of California (Tershy et al. 1993; Bérubé et al. 2002); California (Dohl et al. 1983); and Oregon and Washington (Moore et al. 1998).Fin whales appear very are scarce in the eastern tropical Pacific in summer (Wade and Gerrodette 1993) and winter (Lee 1993). There is still insufficient information to accurately determine population structure, but from a conservation perspective it may be risky to assume panmixia in the entire North Pacific. In the North Atlantic, fin whales were locally depleted in some feeding areas by commercial whaling (Mizroch et al. 1984), in part because subpopulations were not recognized. This assessment will cover the stock of fin
Figure 1. Fin whale sighting locations based on shipboard surveys off California, Oregon, and Washington, 1991-2008 (see Appendix 2 for data sources and information on timing and location of surveys). Dashed line represents the U.S. EEZ; thin lines indicate completed transect effort of all surveys combined.
134

whales which is found along the coasts of California, Oregon, and Washington. Because fin whale abundance appears lower in winter/spring in California (Dohl et al. 1983; Forney et al. 1995) and in Oregon (Green et al. 1992), it is likely that the distribution of this stock extends seasonally outside these coastal waters. Genetic studies of the fin whales have shown that the population in the Gulf of California is isolated from fin whales in the rest of the eastern North Pacific and is an evolutionary unique population (Bérubé et al. 2002). The Marine Mammal Protection Act (MMPA) stock assessment reports recognize three stocks of fin whales in the North Pacific: 1) the California/Oregon/Washington stock (this report), 2) the Hawaii stock, and 3) the Alaska Northeast Pacific stock. POPULATION SIZE The initial pre-whaling population of fin whales in the North Pacific was estimated to be 42,000-45,000 (Ohsumi and Wada 1974). In 1973, the North Pacific population was estimated to have been reduced to 13,620-18,680 (Ohsumi and Wada 1974), of which 8,520-10,970 were estimated to belong to the eastern Pacific stock. A minimum of 148 individually-identified fin whales are found in the Gulf of California (Tershy et al. 1990). The Gulf of California resident population was estimated at approximately 400 whales (Urbán 1996), but that estimate is now outdated.The best estimate of fin whale abundance in In California, Oregon, and Washington waters out to 300 nmi, is the geometric mean of line- transect abundance estimates from summer/autumn ship surveys conducted in 2005 (3,281, CV=0.25) and 2008 (2,825, CV = 0.26) (Forney 2007, Barlow 2010), or was 3,044 (CV=0.18) whales. The best estimate of fin whale abundance in California, Oregon, and Washington waters out to 300 nmi is from a trend-model analysis of line-transect data from 1991 through 2008 (Moore and Barlow 2011), which generated an estimate for 2008 of 3,051 (CV=0.18). The trend-model analysis incorporates information from the entire 1991-2008 time series for each annual estimate of abundance and given the strong evidence of an increasing abundance trend over that time (Moore and Barlow 2011), the best estimate of abundance is represented by the model-averaged estimate for the most recent year, or 2008. This is probably an underestimate because it almost certainly excludes some fin whales which could not be identified in the field and which were recorded as “unidentified rorqual” or “unidentified large whale”. Minimum Population Estimate The minimum population estimate for fin whales is taken as the lower 20th percentile of the log-normal posterior distribution of abundance estimated from for 2008 (Moore and Barlow (2011), or approximately 2,598 whales.2001 and 2005 and 2008 summer/fall ship surveys (Barlow 2003; Forney 2007; Barlow 2010) or approximately 2,624. Current Population Trend Indications of recovery in CA coastal waters date back to 1979/80 (Barlow 1994), but there is now strong evidence that fin whale abundance increased in the California Current between 1991 and 2008 based on analysis of abundance data from line transect surveys conducted in the California Current between 1991 and 2008 (Moore and Barlow 2011). Abundance in waters out to 300 nmi off the coast of California approximately doubled between 1991 and 1996, from approximately 800 (CV = 0.29) to 1400 (CV=0.20), suggesting probable dispersal of animals into this area. Across the entire study area (waters off California, Oregon, and Washington), abundance from 1996 to 2008 increased by an estimated 51%. Mean population growth rate decreased from an estimated 7% per year in 1996/1997 to 3.5% per year by 2008. Zerbini et al. (2006) found similar evidence of increasing abundance trend for fin whales in Alaskan waters at a rate of 4.8% per year between 2001 and 2003. There is some indication that fin whales have increased in abundance in California coastal waters between 1979/80 and 1991 (Barlow 1994) and between 1991 and 1996 (Barlow 1997), but these trends are not statistically significant. Although the population in the North Pacific is expected to have grown since receiving protected status in 1976, the possible effects of continued unauthorized take (Yablokov 1994) and incidental ship strikes and gillnet mortality make this uncertain. There is no evidence of a population trend from recent line-transect abundance surveys conducted in 1996, 2001, and 2005, and 2008 in California, Oregon, and Washington waters out to 300 nmi. Estimates from these three four surveys have been 2,921 2,042 (CV=0.31 0.13); 2,118 (CV=0.50 0.18); and 3,281 (CV=0.25); and 2,825 (CV=0.26) whales, respectively (Barlow and Forney 2007 2003; Forney 2007; Barlow 2010).
135

CURRENT AND MAXIMUM NET PRODUCTIVITY RATES There are no estimates of the growth rate of fin whale populations in the North Pacific (Best 1993). Estimated annual rates of increase in the California Current (California, Oregon, and Washington waters) averaged ≈ 7% during the mid-late 1990s, declining to ≈ 3.5% by 2008 (Moore and Barlow 2011). However, it is unknown how much of this growth is due to immigration rather than birth and death processes. A near doubling of the abundance estimate in California waters between 1991 and 1993 cannot be explained by birth and death processes alone, and movement of individuals between U.S. west coast waters and other areas (e.g., Alaska, Mexico) have been documented (e.g., Mizroch et al. 1984). POTENTIAL BIOLOGICAL REMOVAL The potential biological removal (PBR) level for this stock is calculated as the minimum population size (2,624 2,598) times one half the default maximum net growth rate for cetaceans (½ of 4%) times a recovery factor of 0.3 (for an endangered species, with Nmin > 1,500 and CVNmin < 0.50), resulting in a PBR of 16. HUMAN-CAUSED MORTALITY AND SERIOUS INJURY Historic Whaling Information on historic whaling has been moved to the Status of Stock section. New Serious Injury Guidelines NMFS updated its serious injury designation and reporting process, which uses guidance from previous serious injury workshops, expert opinion, and analysis of historic injury cases to develop new criteria for distinguishing serious from non-serious injury (Angliss and DeMaster 1998, Andersen et al. 2008, NOAA 2012). NMFS defines serious injury as an “injury that is more likely than not to result in mortality”. Injury determinations for stock assessments revised in 2013 or later incorporate the new serious injury guidelines, based on the most recent 5-year period for which data are available. Fisheries Information The offshore drift gillnet fishery is the only fishery that is likely to take fin whales from this stock, and one One fin whale death (in 1999) has been observed in the California swordfish drift gillnet fishery in over 8,000 sets since 1990 when NMFS began observing the fishery. Detailed information on this fishery is provided in Appendix 1. After the 1997 implementation of a Take Reduction Plan, which included skipper education workshops and required the use of pingers and minimum 6-fathom extenders, overall cetacean entanglement rates in the drift gillnet fishery dropped considerably (Barlow and Cameron 2003). Mean annual takes for this fishery (Table 1) are based on 2004-2008 2007-2011 data (Carretta and Chivers 2004,Carretta et al. 2005a, 2005b, Carretta and Enriquez 2006, 2007, 2009a, 2009b, 2010, 2012a, 2012b). This results in an average estimate of zero fin whales taken annually. Some gillnet mortality of large whales may go unobserved because whales swim away with a portion of the net. Three fin whales sighted at-sea were determined to be seriously injured as the result of interactions with unknown fishing gear (buoys and/or line) during the period 2007-2011 (Carretta et al. 2013). ; however, fishermen report that large rorquals (blue and fin whales) usually swim through nets without entangling and with very little damage to the nets. Gillnets have been documented to entangle marine mammals off Baja California (Sosa-Nishizaki et al. 1993), but no recent bycatch data from Mexico are available. Drift gillnet fisheries for swordfish and sharks exist along the entire Pacific coast of Baja California, Mexico and may take animals from this population. Quantitative data are available only for the Mexican swordfish drift gillnet fishery, which uses vessels, gear, and operational procedures similar to those in the U.S. drift gillnet fishery, although nets may be up to 4.5 km long (Holts and Sosa-Nishizaki 1998). The fleet increased from two vessels in 1986 to 31 vessels in 1993 (Holts and Sosa-Nishizaki 1998). The total number of sets in this fishery in 1992 can be estimated from data provided by these authors to be approximately 2700, with an observed rate of marine mammal bycatch of 0.13 animals per set (10 marine mammals in 77 observed sets; Sosa-Nishizaki et al. 1993). This overall mortality rate is similar to that observed in California driftnet fisheries during 1990-95 (0.14 marine mammals per set; Julian and Beeson, 1998), but species-specific information is not available for the Mexican fisheries. Previous efforts to convert the Mexican swordfish driftnet fishery to a longline fishery have resulted in a mixed-fishery, with 20 vessels alternately using longlines or driftnets, 23 using driftnets only, 22 using longlines only, and seven with unknown gear type (Berdegué 2002).
136

Table 1. Summary of available information on the incidental mortality and injury of fin whales (CA/OR/WA stock) for commercial fisheries that might take this species(Carretta and Chivers 2004, Carretta et al. 2005a, 2005b).
Fishery Name
Data Type
Year(s)
Percent Observer Coverage
Observed (or self-
reported)
Estimated Annual Mortality (and serious injury)
Mean Annual Takes
(CV in parentheses)
CA swordfish and thresher shark drift
gillnet fishery
2004 2005 2006 2007 2008 2009 2010 2011
observer
20.6% 20.9% 18.5% 16.4% 13.5% 13.3% 11.9% 19.5%
0 0 0 0 0 0 0 0
0 0 0 0 0 0 0 0
0 (n/a)
Unidentified fishery interactions 2007-2011 at-sea
sightings n/a 3 0 (3) ≥ 0.6
Minimum total annual takes 0 (n/a)
≥ 0.6 (n/a)
Ship Strikes Ship strikes were implicated in the deaths of four seven fin whales and the serious injury of another during 2007-2011 from , NMFS, unpublished stranding data Carretta et al. 2013). One ship strike was recorded in 2008, four in 2009, two in 2010, and one in 2011. During 2004-2008 2007-2011, there were an additional eight four injuries of unidentified large whales attributed to ship strikes. Additional mortality from ship strikes probably goes unreported because the whales do not strand or, if they do, they do not always have obvious signs of trauma. The average observed annual mortality and serious injury due to ship strikes is 1.0 1.6 fin whales per year for the period 2004-2008 during 2007-2011. Documented ship strike deaths and serious injuries are derived from actual counts of whale carcasses and should be considered minimum values. Where evaluated, estimates of detection rates of cetacean carcasses are consistently quite low across different regions and species (<1% to 17%), highlighting that observed numbers are unrepresentative of true impacts (Kraus et al. 2005, Perrin et al. 2011, Williams et al. 2011, Prado et al. 2013). STATUS OF STOCK Fin whales in the entire North Pacific were estimated to be at less than 38% (16,625 out of 43,500) of historic carrying capacity (Mizroch et al. 1984). The initial abundance has never been estimated separately for the "west coast" stock, but this stock was also probably depleted by whaling. Approximately 46,000 fin whales were taken from the North Pacific by commercial whalers between 1947 and 1987 (C. Allison, IWC, pers. comm.). Approximately 5,000 fin whales were taken from the west coast of North America from 1919 to 1965 (Rice 1974; Tonnessen and Johnsen 1982; Clapham et al. 1997). Fin whales in the North Pacific were given protected status by the IWC in 1976. Fin whales are formally listed as "endangered" under the Endangered Species Act (ESA), and consequently the California to Washington stock is automatically considered as a "depleted" and "strategic" stock under the MMPA. The total quantified incidental mortality due to fisheries (zero 0.6/yr) and ship strikes (1.6/yr) is less than the calculated PBR (16). Total fishery mortality is less than 10% of PBR and, therefore, may be approaching zero mortality and serious injury rate. There is some indication that the population may be growing. There is strong evidence that the population has increased since the early 1990s (Moore and Barlow 2011). Increasing levels of anthropogenic sound in the world’s oceans has been suggested to be a habitat concern for whales, particularly for baleen whales that may communicate using low-frequency sound (Croll et al. 2002). Behavioral changes associated with exposure to simulated mid-frequency sonar, including cessation of feeding, increased swimming speeds, and movement away from simulated sound sources has been documented in tagged blue whales (Goldbogen et al. 2013), which have similar communication frequencies to fin whales. It is likely that fin whale behavior may be similarly affected by such anthropogenic sounds. REFERENCES
137

Andersen, M. S., K. A. Forney, T. V. N. Cole, T. Eagle, R. Angliss, K. Long, L. Barre, L. Van Atta, D. Borggaard, T. Rowles, B. Norberg, J. Whaley, and L. Engleby. 2008. Differentiating Serious and Non-Serious Injury of Marine Mammals: Report of the Serious Injury Technical Workshop, 10-13 September 2007, Seattle, Washington. U.S. Dep. Commer., NOAA Tech. Memo. NMFS-OPR-39. 94 p.
Angliss, R.P. and D.P. DeMaster. 1998. Differentiating Serious and Non-Serious Injury of Marine Mammals Taken Incidental to Commercial Fishing Operations. NOAA Tech Memo. NMFS-OPR-13, 48 p.
Barlow, J. 2010. Cetacean abundance in the California Current from a 2008 ship-based line-transect survey. NOAA Technical Memorandum, NMFS, NOAA-TM-NMFS-SWFSC-456. 19 p.
Barlow, J. 1994. Abundance of large whales in California coastal waters: a comparison of ship surveys in 1979/80 and in 1991. Rept. Int. Whal. Commn. 44:399-406.
Barlow, J. 1997. Preliminary estimates of cetacean abundance off California, Oregon, and Washington based on a 1996 ship survey and comparisons of passing and closing modes. Admin. Rept. LJ-97-11 available from Southwest Fisheries Science Center, P.O. Box 271, La Jolla, CA. 25 pp.
Barlow, J., R. W. Baird, J. E. Heyning, K. Wynne, A. M. Manville, II, L. F. Lowry, D. Hanan, J. Sease, and V. N. Burkanov. 1994. A review of cetacean and pinniped mortality in coastal fisheries along the west coast of the U.S. and Canada and the east coast of the Russian Federation. Rep. Int. Whal. Commn, Special Issue 15:405-425.
Barlow, J. and G. A. Cameron. 2003. Field experiments show that acoustic pingers reduce marine mammal bycatch in the California drift gillnet fishery. Marine Mammal Science 19(2):265-283.
Barlow, J. and K.A. Forney. 2007. Abundance and population density of cetaceans in the California Current ecosystem. Fishery Bulletin 105:509-526.
Berdegué, J. 2002. Depredación de las especies pelágicas reservadas a la pesca deportiva y especies en peligro de extinción con uso indiscriminado de artes de pesca no selectivas (palangres, FAD's, trampas para peces y redes de agallar fijas y a la deriva) por la flota palangrera Mexicana. Fundación para la conservación de los picudos. A.C. Mazatlán, Sinaloa, 21 de septiembre.
Bérubé, M., J. Urban-R., A. E. Dizon, R. L. Brownell, and P. J. Palsbøll. 2002. Genetic identification of a small and highly isolated population of fin whales (Balaenoptera physalus) in the Sea of Cortez, México. Conservation Genetics 3:183-190.
Best, P. B. 1993. Increase rates in severely depleted stocks of baleen whales. ICES J. Mar. Sci. 50:169-186.
Brueggeman, J. J., G. A. Green, K. C. Balcomb, C. E. Bowlby, R. A. Grotefendt, K. T. Briggs, M. L. Bonnell, R. G. Ford, D. H. Varoujean, D. Heinemann, and D. G. Chapman. 1990. Oregon-Washington Marine Mammal and Seabird Survey: Information synthesis and hypothesis formulation. U.S. Department of the Interior, OCS Study MMS 89-0030.
Carretta, J. V., S. M. Wilkin, M. M. Muto, and K. Wilkinson. 2013. Sources of human-related injury and mortality for U.S. Pacific west coast marine mammal stock assessments, 2007-2011. U.S. Dep. Commer., NOAA Tech. Memo. NMFS-SWFSC-514, 83 p.
Carretta, J.V. and L. Enriquez. 2012b. Marine mammal and seabird bycatch in California gillnet fisheries in 2011. NOAA Technical Memorandum NOAA-TM-NMFS-SWFSC-504. 14 p.
Carretta, J.V. and L. Enriquez. 2012a. Marine mammal and seabird bycatch in California gillnet fisheries in 2010. Southwest Fisheries Science Center Administrative Report LJ-12-01. 14p.
Carretta, J.V. and L. Enriquez. 2010. Marine Mammal and Sea Turtle Bycatch in the California/Oregon Swordfish and Thresher Shark Drift Gillnet Fishery in 2009. Southwest Fisheries Science Center, NOAA Fisheries Administrative Report LJ-10-03. 11p.
Carretta, J.V. and L. Enriquez. 2009a. Marine mammal and seabird bycatch observed in California commercial fisheries in 2007. Administrative Report LJ-09-01, available from Southwest Fisheries Science Center, 3333 North Torrey Pines Rd., La Jolla, CA 92037. 12 p.
Carretta, J.V. and L. Enriquez. 2009b. Marine mammal bycatch observed in the California/Oregon swordfish and thresher shark drift gillnet fishery in 2008. Administrative Report LJ-09-03, available from Southwest Fisheries Science Center, 3333 North Torrey Pines Rd., La Jolla, CA 92037. 10 p.
Carretta, J.V. and L. Enriquez. 2007. Marine mammal and sea turtle bycatch in the California/Oregon thresher shark and swordfish drift gillnet fishery in 2006. Administrative Report LJ-07-06,
138

available from Southwest Fisheries Science Center, 8604 La Jolla Shores Drive, La Jolla, CA 92037. 9p.
Carretta, J.V. and L. Enriquez. 2006. Marine mammal bycatch and estimated mortality in California commercial fisheries during 2005. Administrative Report LJ-06-07, available from Southwest Fisheries Science Center, 8604 La Jolla Shores Drive, La Jolla, CA 92037. 14p.
Carretta, J.V. and S.J. Chivers. 2004. Preliminary estimates of marine mammal mortality and biological sampling of cetaceans in California gillnet fisheries for 2003. Paper SC/56/SM1 presented to the IWC Scientific Committee, June 2004 (unpublished). [Available from Southwest Fisheries Science Center, National Marine Fisheries Service, 8604 La Jolla Shores Drive, La Jolla, CA 92037, USA].
Carretta, J.V., S.J. Chivers, and K. Danil. 2005a. Preliminary estimates of marine mammal bycatch, mortality, and biological sampling of cetaceans in California gillnet fisheries for 2004. Administrative Report LJ-05-10, available from Southwest Fisheries Science Center, 8604 La Jolla Shores Drive, La Jolla, California, 92037. 17 p.
Carretta, J.V., T. Price, D. Petersen, and R. Read. 2005b. Estimates of marine mammal, sea turtle, and seabird mortality in the California drift gillnet fishery for swordfish and thresher shark, 1996-2002. Marine Fisheries Review 66(2):21-30.
Clapham, P. J., S. Leatherwood, I. Szczepaniak, and R. L. Brownell, Jr. 1997. Catches of humpback and other whales from shore stations at Moss Landing and Trinidad, California, 1919-1926. Mar. Mamm. Sci. 13(3):368-394.
Croll, D.A., C.W. Clark, A. Acevedo, B. Tershy, S. Flores, J. Gedamke, and J. Urban. 2002. Only male fin whales sing loud songs. Nature 417:809
Dohl, T. P., R. C. Guess, M. L. Duman, and R. C. Helm. 1983. Cetaceans of central and northern California, 1980-83: Status, abundance, and distribution. Final Report to the Minerals Management Service, Contract No. 14-12-0001-29090. 284p.
Donovan, G. P. 1991. A review of IWC stock boundaries. Rept. Int. Whal. Commn., Special Issue 13:39-68.
Forney, K. A., J. Barlow, and J. V. Carretta. 1995. The abundance of cetaceans in California waters. Part II: Aerial surveys in winter and spring of 1991 and 1992. Fish. Bull. 93:15-26.
Forney, K. A., J. Barlow, M. M. Muto, M. Lowry, J. Baker, G. Cameron, J. Mobley, C. Stinchcomb, and J. V. Carretta. 2000. U.S. Pacific Marine Mammal Stock Assessments: 2000. U.S. Dep. Commer. NOAA Technical Memorandum NOAA-TM-NMFS-SWFSC-300. 276p.
Forney, K.A. 2007. Preliminary estimates of cetacean abundance along the U.S. west coast and within four National Marine Sanctuaries during 2005. U.S. Department of Commerce, NOAA Technical Memorandum NMFS-SWFSC-406. 27p.
Fujino, K. 1960. Immunogenetic and marking approaches to identifying subpopulations of the North Pacific whales. Scientific Reports of the Whales Research Institute, 15, 85–142.
Goldbogen, J.A., Southall B.L.,DeRuiter S.L., Calambokidis J., Friedlaender A.S.,Hazen E.L., Falcone E.A., Schorr G.S., Douglas A., Moretti D.J., Kyburg C., McKenna M.F., Tyack P.L. 2013. Blue whales respond to simulated mid-frequency military sonar. Proc. R. Soc. B 280:20130657. http://dx.doi.org/10.1098/rspb.2013.0657
Green, G. A., J. J. Brueggeman, R. A. Grotefendt, C. E. Bowlby, M. L. Bonnell, K. C. Balcomb, III. 1992. Cetacean distribution and abundance off Oregon and Washington, 1989-1990. Ch. 1 In: J. J. Brueggeman (ed.). Oregon and Washington Marine Mammal and Seabird Surveys. Minerals Management Service Contract Report 14-12-0001-30426.
Heyning, J. E., and T. D. Lewis. 1990. Fisheries interactions involving baleen whales off southern California. Rep. int. Whal. Commn. 40:427-431.
Holts, D. and O. Sosa-Nishizaki. 1998. Swordfish, Xiphias gladius, fisheries of the eastern North Pacific Ocean. In: I. Barrett, O. Sosa-Nishizaki and N. Bartoo (eds.). Biology and fisheries of swordfish, Xiphias gladius. Papers from the International Symposium on Pacific Swordfish, Ensenada Mexico, 11-14 December 1994. U.S. Dep. Commer., NOAA Tech. Rep. NMFS 142, 276p.
Julian, F. and M. Beeson. 1998. Estimates for marine mammal, turtle, and seabird mortality for two California gillnet fisheries: 1990-95. Fish. Bull. 96:271-284.
Kraus. S.D., M.W. Brown, H. Caswell, C.W.Clark, M. Fujiwara, P.K. Hamilton, R.D. Kenney, A.R. Knowlton, S. Landry, C.A.Mayo, W.A. McLellan, M.J. Moore, D.P. Nowacek, D.A. Pabst, A.J. Read, R. M. Rolland. 2005. North Atlantic Right Whales in crisis. Science 309:561-562.
139

Lee, T. 1993. Summary of cetacean survey data collected between the years of 1974 and 1985. U.S. Dep. Commer. NOAA Tech. Memo. NMFS-SWFSC-181. 184 pp.
McDonald, M. A., J. A. Hildebrand, and S. C. Webb. 1995. Blue and fin whales observed on a seafloor array in the Northeast Pacific, J. Acous. Soc. Am., 98:712-721.1994. Blue and fin whales observed on a seafloor array in the Northeast Pacific. (unpubl. ms.).
Mizroch, S. A., D. Rice, D. Zwiefelhofer, J. Waite, and W. Perryman. 2009. Distribution and movements of fin whales in the North Pacific Ocean. Mammal Rev. 39(3):193-227.
Mizroch, S. A., D. W. Rice, and J. M. Breiwick. 1984. The fin whale, Balaenoptera physalus. Mar. Fish. Rev. 46:20-24.
Moore, J.E. and J. Barlow. 2011. Bayesian state-space model of fin whale abundance trends from a 1991-2008 time series of line-transect surveys in the California Current. Journal of Applied Ecology 48:1195-1205.
Moore, S. E., K. M. Stafford, M. E. Dahlheim, C. G. Fox, H. W. Braham, J. J. Polovina, and D. E. Bain. 1998. Seasonal variation in reception of fin whale calls at five geographic areas in the North Pacific. Mar. Mamm. Sci. 14(3):617-627.
NOAA. 2012. Federal Register 77:3233. National Policy for Distinguishing Serious From Non-Serious Injuries of Marine Mammals. http://www.nmfs.noaa.gov/op/pds/documents/02/238/02-238-01.pdf
Ohsumi, S. and S. Wada. 1974. Status of whale stocks in the North Pacific, 1972. Rept. Int. Whal. Commn. 25:114-126.
Perrin, W.F., J.L. Thieleking, W.A. Walker, F.A. Archer, and K.M. Robertson. 2011. Common bottlenose dolphins (Tursiops truncatus) in California waters: cranial differentiation of coastal and offshore ecotypes. Marine Mammal Science 27(4): 769–792.
Prado, J.H.F., Secchi E.R., and Kinas P.G. 2013. Mark-recapture of the endangered franciscana dolphin (Pontoporia blainvillei) killed in gillnet fisheries to estimate past bycatch from time series of stranded carcasses in southern Brazil. Ecological Indicators. 32: 35–41.
Punt, A. E. and Wade, P.R. 2012. Population status of the eastern North Pacific stock of gray whales in 2009. Journal of Cetacean Research and Management 12(1): 15-28.
Rice, D. W. 1974. Whales and whale research in the eastern North Pacific. pp. 170-195 In: W. E. Schevill (ed.). The Whale Problem: A Status Report. Harvard Press, Cambridge, MA.
Sosa-Nishizaki, O., R. De la Rosa Pacheco, R. Castro Longoria, M. Grijalva Chon, and J. De la Rosa Velez. 1993. Estudio biologico pesquero del pez (Xiphias gladius) y otras especies de picudos (marlins y pez vela). Rep. Int. CICESE, CTECT9306.
Tershy, B. R., D. Breese, and C.S. Strong. 1990. Abundance, seasonal distribution and population composition of balaenopterid whales in the Canal de Ballenas, Gulf of California, Mexico. Rept. Int. Whal. Commn., Special Issue 12:369-375.
Tershy, B. R., J. Urbán-R., D. Breese, L. Rojas-B., and L. T. Findley. 1993. Are fin whales resident to the Gulf of California? Rev. Invest. Cient., Univ. Auton. de Baja California Sur. 1:69-71.
Tonnessen, J. N., and A. O. Johnsen. 1982. The History of Modern Whaling. Univ. Calif. Press, Berkeley and Los Angeles. 798pp.
Urbán, R.J. 1996. La poblaciná del rorcual común Balaenoptera physalus en el Golfo de California. Final Report to the Comisión Nacional para la Bioversidad CONABIO-B040, 102 pp.
Wade, P. R. and T. Gerrodette. 1993. Estimates of cetacean abundance and distribution in the eastern tropical Pacific. Rept. Int. Whal. Commn. 43:477-493.
Williams, R., S. Gero, L. Bejder, J. Calambokidis, S.D. Kraus, D. Lusseau, A.J. Read, and J. Robbins. Underestimating the damage: interpreting cetacean carcass recoveries in the context of the Deepwater Horizon/BP incident. Conservation Letters 4:228-233.
Yablokov, A. V. 1994. Validity of whaling data. Nature 367:108. Zerbini, A. N., J. M. Waite, J. L. Laake, and P. R. Wade. 2006. Abundance, trends and distribution of
baleen whales off western Alaska and the central Aleutian Islands. Deep-Sea Research 53:1772-1790.
140

Revised 01/15/2011 9/23/2013
ROUGH-TOOTHED DOLPHIN (Steno bredanensis): Hawaiian Stock
STOCK DEFINITION AND GEOGRAPHIC RANGE
Rough-toothed dolphins are found throughout the world in tropical and warm-temperate waters (Perrin et al. 2009). They are present around all the main Hawaiian Islands (Shallenberger 1981; Tomich 1986) and have been observed close to the islands and atolls at least as far northwest as Pearl and Hermes Reef French Frigate Shoals (Nitta and Henderson 1993) (Bradford et al 2013). Rough-toothed dolphins were frequently seen offshore throughout the Recent sighting locations of rough-toothed dolphins during a 2002 shipboard survey of waters within the U.S. Exclusive Economic Zone (EEZ) of the Hawaiian Islands during both 2002 and 2010 surveys (Barlow 2006, Bradford et al 2013; Figure 1) are shown in Figure 1. Ten Eight strandings have been reported from the Hawaiian Islands since 1969 Maui, Oahu, and the island of Hawaii (Nitta 1991; Maldini et al. 2005, NMFS PIR Marine Mammal Response Network database), including one since 2007. Little is known about stock structure for this species in the North Pacific. Photographic identification studies around the main Hawaiian Islands suggested have indicated that dispersal rates between the islands of Kauai/Niihau and Hawaii do not exceed 2% per year (Baird et al. 2008). Resighting rates off the island of Hawaii are high, with 75% of well-marked individuals resighted on two or more occasions, suggesting high site fidelity and low population size. Preliminary results of genetic studies of individuals sampled from Kauai/Niihau and Hawaii Island (Albertson, unpublished data), together with resighting data suggest there may be at least two island-associated stocks of rough-toothed dolphins in main Hawaiian Islands (Oleson et al 2013). Resighting data coupled with relatively high sighting rates within the Main Islands stratum versus the outer EEZ stratum (Barlow 2006) may suggest that there are island-associated populations of rough-toothed dolphins in the Hawaii EEZ. Rough-toothed dolphins have also been documented in American Samoan waters (Oleson 2009 NMFS, PIR, unpublished data).
For the Marine Mammal Protection Act (MMPA) stock assessment reports, there are two Pacific management stocks: 1) The Hawaiian Stock (this report), and 2) the American Samoa Stock. The Hawaiian stock includes animals found both within the Hawaiian Islands EEZ and in adjacent international high seas waters; however, because data on abundance, distribution, and human-caused impacts are largely lacking for international high seas waters, the status of this stock is evaluated based on data from the U.S. EEZ waters of the Hawaiian Islands (NMFS 2005). POPULATION SIZE A population estimate for this species has been made in the eastern tropical Pacific (Wade and Gerrodette 1993), but it is not known whether these animals are part of the same population that occurs around the Hawaiian Islands. Mark-recapture estimates for the islands of Kauai/Nihau and Hawaii were derived estimated from identification photographs obtained between 2003 and 2006, resulting in estimates of 1,665 (CV=0.33) around Kauai/Niihau and 198 (CV=0.12) around the island of Hawaii (Baird et al. 2008). These estimates are specific to those island areas and do not represent the abundance of rough-toothed dolphins within the Hawaiian EEZ, as surveys were primarily conducted within 40km of shore. A 2002 shipboard line-transect survey of the entire
Figure 1. Rough-toothed dolphin sighting locations during the 2002 (open diamonds) and 2010 (black diamonds) shipboard cetacean surveys of U.S. EEZ waters surrounding the Hawaiian Islands (Barlow 2006, Bradford et al 2013; see Appendix 2 for details on timing and location of survey effort). Outer line represents approximate boundary of survey area and U.S. EEZ. Gray shading indicates area of Papahanaumokuakea Marine National Monument. Dotted line represents the 1000m isobath.
141

Hawaiian Islands EEZ resulted in an abundance estimate of 8,709 (CV=0.45) rough-toothed dolphins (Barlow 2006). The recent 2010 shipboard line-transect survey of the Hawaiian Islands EEZ resulted in an abundance estimate of 6,288 (CV = 0.39) rough-toothed dolphins (Bradford et al 2013). This is currently the best available abundance estimate for this stock. Minimum Population Estimate The minimum population size is calculated as the lower The 20th percentile of the log-normal 20th percentile distribution (Barlow et al 1995) of the 2002 2010 abundance estimate for Hawaiian Islands EEZ waters (Barlow 2006) is 6,067 or 4,581 rough-toothed dolphins within the Hawaiian Islands EEZ. Current Population Trend No data are available on current population trend. The broad and overlapping confidence intervals around the 2002 and 2010 estimates preclude assessment of trends with the available data. CURRENT AND MAXIMUM NET PRODUCTIVITY RATES No data are available on current or maximum net productivity rate. POTENTIAL BIOLOGICAL REMOVAL The potential biological removal (PBR) level for the Hawaii stock of rough-toothed dolphins is stock is calculated as the minimum population size within the U.S. EEZ of the Hawaiian Islands (4,581)(6,067) times one half the default maximum net growth rate for cetaceans (½ of 4%) times a recovery factor of 0.50 (for a stock of unknown status with no known fishery mortality or serious injury; Wade and Angliss 1997), resulting in a PBR of 46 61 rough-toothed dolphins per year. HUMAN-CAUSED MORTALITY AND SERIOUS INJURY New Serious Injury Guidelines NMFS updated its serious injury designation and reporting process, which uses guidance from previous serious injury workshops, expert opinion, and analysis of historic injury cases to develop new criteria for distinguishing serious from non-serious injury (Angliss and DeMaster 1998, Andersen et al. 2008, NOAA 2012). NMFS defines serious injury as an “injury that is more likely than not to result in mortality”. Injury determinations for stock assessments revised in 2013 or later incorporate the new serious injury guidelines, based on the most recent 5-year period for which data are available. Fishery Information Information on fishery-related mortality and serious injury of cetaceans in Hawaiian waters is limited, but the gear types used in Hawaiian fisheries are responsible for marine mammal mortality and serious injury in other fisheries throughout U.S. waters. . Gillnets appear to capture marine mammals wherever they are used and lobster traps and longlines can be expected to occasionally entangle cetaceans (Perrin et al. 1994).
Interactions with cetaceans have been reported for all Hawaiian pelagic fisheries, and some of these interactions involved rough-toothed dolphins (Nitta and Henderson 1993). Rough-toothed dolphins are known to take bait and catch from Hawaiian sport and commercial fisheries operating near the main islands and in a portion of the northwestern islands (Shallenberger 1981; Schlais 1984; Nitta and Henderson 1993), and they have been specifically reported to interact with the day handline fishery for tuna (palu-ahi) and the troll fishery for billfish and tuna (Schlais 1984; Nitta and Henderson 1993). There are currently two distinct longline fisheries based in Hawaii: a deep-set longline (DSLL) fishery that targets primarily tunas, and a shallow-set longline fishery (SSLL) that targets swordfish. Both fisheries operate within U.S. waters and on the high seas. Between 2004 and 2008, no rough-toothed dolphins were observed hooked or entangled in the SSLL fishery (100% observer coverage) or the DSLL fishery (20-28% observer coverage) (McCracken & Forney 2010). Rough-toothed dolphins are known to take bait and catch from several Hawaiian sport and commercial fisheries operating near the main islands (Shallenberger 1981; Schlais 1984; Nitta and Henderson 1993). They have been specifically reported to interact with the day handline fishery for tuna (palu-ahi), the night handline fishery for squid (ika-shibi), and the troll fishery for billfish and tuna (Schlais 1984; Nitta and Henderson 1993). Interaction rates between dolphins and the NWHI bottomfish fishery have been estimated based on studies conducted in 1990-1993, indicating that an average of 2.67 dolphin interactions, most likely involving bottlenose and rough-toothed dolphins, occurred for every 1000 fish brought on board (Kobayashi and Kawamoto 1995). This fishery was observed from 2003 through 2005 at 18-25% coverage, during which time no incidental takes of cetaceans were reported. The bottomfish fishery is no longer
142
permitted for the Northwestern Hawaiian Islands. Fishermen claim interactions with dolphins that steal bait and catch are increasing. It is not known whether these interactions result in serious injury or mortality of dolphins. Baird et al. (2008) reported increased vessel avoidance of boats by rough-toothed dolphins off the island of Hawaii relative to those off Kauai or Niihau and attributed this to possible shooting of dolphins that are stealing bait or catch from recreational fisherman off the island of Hawaii (Kuljis 1983). No estimates of human-caused mortality or serious injury are currently available for nearshore hook and line or gillnet fisheries because these fisheries are not observed or monitored for protected species bycatch.
There are currently two distinct longline fisheries based in Hawaii: a deep-set longline (DSLL) fishery that targets primarily tunas, and a shallow-set longline fishery (SSLL) that targets swordfish. Between 2007 and 2011, no rough-toothed dolphins were observed hooked or entangled in the SSLL fishery (100% observer coverage) or the DSLL fishery (20-28% observer coverage) (McCracken 2013, Bradford & Forney 2013). However, eight unidentified cetaceans were taken in the DSLL fishery, and two unidentified cetaceans were taken in the SSLL fishery, some of which may have been rough-toothed dolphins. STATUS OF STOCK The Hawaii stock of rough-toothed dolphins is not considered strategic under the 1994 amendments to the MMPA, The status of rough-toothed dolphins in Hawaiian waters relative to OSP is unknown, and there are insufficient data to evaluate trends in abundance. No habitat issues are known to be of concern for this species. Rough-toothed dolphins are It is not listed as “threatened” or “endangered” under the Endangered Species Act (1973), nor designated as “depleted” under the MMPA. Given the absence of recent recorded fishery-related mortality or serious injuries, the Hawaiian stock of rough-toothed dolphins is not considered strategic under the 1994 amendments to the MMPA, and the total fishery mortality and serious injury can be considered to be insignificant and approaching zero. One rough-toothed dolphin stranded in the main Hawaiian Islands tested positive for Brucella (Chernov, 2010) and another for Morbillivirus (Jacob 2012). Brucella is a bacterial infection that if common in the population may limit recruitment by compromising male and female reproductive systems, and can also cause neurological disorders that may result in death (Van Bressem et al. 2009). Although morbillivus is known to trigger lethal disease in cetaceans (Van Bressem et al. 2009), its impact on the health of the stranded animal is not known as it was found in only a few tested tissues (Jacob 2012). The presence of morbillivirus in 10 species (Jacob 2012) and Brucella in 3 species (Chernov 2010, West unpublished data) raises concerns about the history and prevalence of these diseases in Hawaii and the potential population impacts on Hawaiian cetaceans. It is not known if Brucella or Morbillivirus are common in the Hawaii stock. REFERENCES Anderson, M.S., K.A. Forney, T.V.N. Cole, T. Eagle, R.P. Angliss, K. Long, L. Barre, L. VanAtta, D. Borggaard, T.
Rowles, B. Norberg, J. Whaley, L. Engleby. Differentiating serious and non-serious injury of marine mammals: Report of the Serious Injury Technical Workshop 10-13 September 2007, Seattle, WA. NOAA Tech Memo NMFS-OPR-39, 94 p.
Angliss, R.P. and D.P. DeMaster. 1997. Differentiating serious and non-serious injury of marine mammals taken incidental to commercial fishing operations: Report of the Serious Injury Workshop 1-2 April. 1997, Silver Spring, MD. NOAA Tech Memo NMFS-OPR-13, 48 p.
Baird, R.W., D.L. Webster, S.D. Mahaffy, D.J. McSweeney, G.S. Schorr, and A.D. Ligon. 2008. Site fidelity and association patterns in a deep-water dolphin: Rough-toothed dolphins (Steno bredanensis) in the Hawaiian Archipelago. Marine Mammal Science 24(3): 535-553.
Barlow, J. 2006. Cetacean abundance in Hawaiian waters estimated from a summer/fall survey in 2002. Marine Mammal Science 22(2): 446-464.
Barlow, J., S.L. Swartz, T.C. Eagle, and P.R. Wade. 1995. U.S. Marine Mammal Stock Assessments: Guidelines for Preparation, Background, and a Summary of the 1995 Assessments. U.S. Dep. Commer., NOAA Tech. Memo. NMFS-OPR-6, 73 p.
Bradford, A.L. and K.A. Forney. 2013. Injury determinations for cetaceans observed interacting with Hawaii and American Samoa longline fisheries during 2007-2011. PIFSC Working Paper WP-13-002.
Bradford. A.L., K.A. Forney, E.M. Oleson, and J. Barlow. 2013. Line-transect abundance estimates of cetaceans in the Hawaiian EEZ. PIFSC Working Paper WP-13-004.
Chernov, A. E. 2010. The identification of Brucella ceti from Hawaiian cetaceans M.S. Marine Science Thesis. Hawaii Pacific University, Kaneohe, HI, USA
Forney, K.A. 2009. Serious injury determinations for cetaceans caught in Hawaii longline fisheries during 1994-2008. Draft document PSRG-2009-09 presented to the Pacific Scientific Review Group, November 3-5,
143

2009, Del Mar, CA. Jacob, J. M. 2012. Screening and characterization of morbillivirus in Hawaiian cetaceans. M.S. Marine Science
Thesis. Hawaii Pacific University, Kaneohe, HI, Kobayashi, D. R. and K. E. Kawamoto. 1995. Evaluation of shark, dolphin, and monk seal interactions with
Northwestern Hawaiian Island bottomfishing activity: a comparison of two time periods and an estimate of economic impacts. Fisheries Research 23: 11-22.
Kuljis, B.A. 1983. Porpoise/fisheries interactions within the Hawaiian islands. Southwest Fisheries Science Center Admin Rep H-83-19C. 16pp.
Maldini, D., L. Mazzuca, and S. Atkinson. 2005. Odontocete stranding patterns in the Main Hawaiian Islands (1937-2002): How do they compare with live animal surveys? Pacific Science 59(1):55-67.
McCracken, M. 2013. Preliminary assessment of incidental interactions with marine mammals in the Hawaii longline deep and shallow set fisheries from 2007 to 2011. PIFSC Working Paper WP-13-XXX.
McCracken M., and K.A. Forney. 2010. Preliminary assessment of incidental interactions with marine mammals in the Hawaii longline deep and shallow set fisheries. NMFS, Pacific Islands Fisheries Science Center Working Paper WP-10-001. 27p.
Oleson, E.M. 2009. Characteristics of the American Samoa Longline Fishery and estimates of cetacean take, 2006-2008. Document PSRG-2009-14 presented to the Pacific Scientific Review Group, 3-5 November, 2009, La Jolla, CA.
Oleson, E.M., R.W. Baird, K.M. Martien, and B.L. Taylor. 2013. Island-associated stocks of odontocetes in the main Hawaiian Islands: A synthesis of available information to facilitate evaluation of stock structure. PIFSC Working Paper WP-13-003.
Nitta, E. 1991. The marine mammal stranding network for Hawaii: an overview. In: J.E. Reynolds III, D.K. Odell (eds.), Marine Mammal Strandings in the United States, pp.56-62. NOAA Tech. Rep. NMFS 98, 157 pp.
Nitta, E. and J. R. Henderson. 1993. A review of interactions between Hawaii's fisheries and protected species. Mar. Fish. Rev. 55(2):83-92.
NMFS. 2005. Revisions to Guidelines for Assessing Marine Mammal Stocks. 24 pp. Available at: http://www.nmfs.noaa.gov/pr/pdfs/sars/gamms2005.pdf
NMFS. 2012. NOAA Fisheries Policy Directive 02-038-01 Process for Injury Determinations (01/27/12). Available at: http://www.nmfs.noaa.gov/pr/pdfs/serious_injury_policy.pdf
Perrin, W.F., G. P. Donovan and J. Barlow. 1994. Gillnets and Cetaceans. Rep. Int. Whal. Commn., Special Issue 15, 629 pp.
Perrin, W.F., B. Würsig and J.G.M. Thewissen. 2009. Encyclopedia of Marine Mammals. Second Edition. Academic Press, Amsterdam.
Schlais, J.F. 1984. Thieving dolphins: A growing problem in Hawaii's fisheries. Sea Front. 30(5):293-298. Shallenberger, E.W. 1981. The status of Hawaiian cetaceans. Final report to U.S. Marine Mammal Commission.
MMC-77/23, 79pp. Tomich, P. Q. 1986. Mammals in Hawaii: A Synopsis and Notational Bibliography. Bishop Museum Press, Hawaii,
375 pp. Van Bressem, M., J.A. Raga, G. Di Guardo, D.P. Jepson, P. J. Duignan, U. Siebert, T. Barrett, M. C. de Oliveira
Santos, I.B. Moreno, S. Siciliano, A. Aguilar, K. Van Waerebeer. 2009. Emerging infectious diseases in cetaceans worldwide and the possible role of environmental stressors. Diseases of Aquatic Organisms. 85:143-157.
Wade, P. R. and R. P. Angliss. 1997. Guidelines for Assessing Marine Mammal Stocks: Report of the GAMMS Workshop April 3-5, 1996, Seattle, Washington. U. S. Dep. Commer., NOAA Tech. Memo. NMFS-OPR-12. 93 pp.
Wade, P. R. and T. Gerrodette. 1993. Estimates of cetacean abundance and distribution in the eastern tropical Pacific. Rep. Int. Whal. Commn. 43:477-493.
144

Revised 01/15/2011 9/23/2013 RISSO'S DOLPHIN (Grampus griseus):
Hawaiian Stock STOCK DEFINITION AND GEOGRAPHIC RANGE Risso's dolphins are found in tropical to warm-temperate waters worldwide (Perrin et al. 2009). Although they have been considered rare in Hawaiian waters (Shallenberger 1981), six sightings were made during a 2002 survey and 12 during a 2010 survey of the U.S. Exclusive Economic Zone (EEZ) of the Hawaiian Islands (Barlow 2006, Bradford et al 2013; Figure 1). There are six five stranding records from the main Hawaiian Islands since 1978 (Nitta 1991; Maldini et al. 2005, NMFS PIR Marine Mammal Response Network database).
For the Marine Mammal Protection Act (MMPA) stock assessment reports, Risso's dolphins within the Pacific U.S. EEZ are divided into two discrete, non-contiguous areas: 1) Hawaiian waters (this report), and 2) waters off California, Oregon and Washington. The Hawaiian stock includes animals found both within the Hawaiian Islands EEZ and in adjacent international high seas waters; however, because data on abundance, distribution, and human-caused impacts are largely lacking for international high seas waters, the status of this stock is evaluated based on data from U.S. EEZ waters of the Hawaiian Islands (NMFS 2005). POPULATION SIZE Population estimates have been made off Japan (Miyashita 1993), in the eastern tropical Pacific (Wade and Gerrodette 1993), and off the U.S. West Coast (Barlow and Forney 2007), but it is not known whether these animals are part of the same population that occurs around the Hawaiian Islands and in the central North Pacific. A 2002 shipboard line-transect survey of the entire Hawaiian Islands EEZ resulted in an abundance estimate of 2,372 (CV=0.97) Risso’s dolphins (Barlow 2006). The recent 2010 shipboard line-transect survey of the Hawaiian Islands EEZ resulted in an abundance estimate of 7,256 (CV = 0.41) Risso’s dolphins (Bradford et al 2013). This is currently the best available abundance estimate for this stock. Minimum Population Estimate The minimum population size is calculated as the lower 20th percentile of The the log-normal 20th percentile distribution (Barlow et al 1995) of the 2002 2010 abundance estimate, (Barlow 2006) is 1,195 or 5,207 Risso’s dolphins within the Hawaiian Islands EEZ. Current Population Trend The broad and overlapping confidence intervals around the 2002 and 2010 estimates preclude assessment of trends with the available data. No data are available on current population trend. CURRENT AND MAXIMUM NET PRODUCTIVITY RATES No data are available on current or maximum net productivity rate for Hawaiian animals. POTENTIAL BIOLOGICAL REMOVAL
Figure 1. Risso's dolphin sighting locations during the 2002 (open diamonds) and 2010 (black diamonds) shipboard cetacean surveys of U.S. EEZ waters surrounding the Hawaiian Islands (Barlow 2006, Bradford et al 2013; see Appendix 2 for details on timing and location of survey effort). Outer line represents approximate boundary of survey area and U.S. EEZ. Gray shading indicates area of Papahanaumokuakea Marine National Monument. Dotted line is the 1000m isobath.
145

The potential biological removal (PBR) level for the Hawaii stock of Risso’s dolphins is stock is calculated as the minimum population size within the U.S. EEZ of the Hawaiian Islands (5,207)(1,195) times one half the default maximum net growth rate for cetaceans (½ of 4%) times a recovery factor of 0.50 0.40 (for a stock of unknown status with a Hawaiian Islands EEZ fishery mortality and serious injury rate CV greater than 0.80 no known fishery mortality or serious injury within the U.S. EEZ of the Hawaiian Islands; Wade and Angliss 1997), resulting in a PBR of 42 12 Risso’s dolphins per year. HUMAN CAUSED MORTALITY AND SERIOUS INJURY New Serious Injury Guidelines NMFS updated its serious injury designation and reporting process, which uses guidance from previous serious injury workshops, expert opinion, and analysis of historic injury cases to develop new criteria for distinguishing serious from non-serious injury (Angliss and DeMaster 1998, Andersen et al. 2008, NOAA 2012). NMFS defines serious injury as an “injury that is more likely than not to result in mortality”. Injury determinations for stock assessments revised in 2013 or later incorporate the new serious injury guidelines, based on the most recent 5-year period for which data are available. Fishery Information Information on fishery-related mortality and serious injury of cetaceans in Hawaiian waters is limited, but the gear types used in Hawaiian fisheries are responsible for marine mammal mortality and serious injury in other fisheries throughout U.S. waters. Gillnets appear to capture marine mammals wherever they are used, and float lines from lobster traps and longlines can be expected to occasionally entangle cetaceans (Perrin et al. 1994). No interactions between nearshore fisheries and Risso’s dolphins have been reported in Hawaiian waters. No estimates of human-caused mortality or serious injury are currently available for nearshore hook and line or gillnet fisheries because these fisheries are not observed or monitored for protected species bycatch.
Interactions with cetaceans have been reported for all Hawaiian pelagic fisheries (Nitta and Henderson 1993), and some of these interactions involved Risso’s dolphins. There are currently two distinct longline fisheries based in Hawaii: a deep-set longline (DSLL) fishery that targets primarily tunas, and a shallow-set longline fishery (SSLL) that targets swordfish. Both fisheries operate within U.S. waters and on the high seas. Between 2007 and 2011 2004 and 2008, 10 21 Risso’s dolphins were observed killed or seriously injured in the SSLL fishery (100% observer coverage), and 15 3 Risso’s dolphins were observed killed or seriously injured in the DSLL fishery (20-2228% observer coverage) (Bradford & Forney 2013, McCracken 2013Forney 2009, McCracken & Forney 2010). Three One Risso’s dolphin in the DSLL fishery and two in the SSLL fishery were killed, 16 in the SSLL fishery and two in the DSLL fishery the remainder were determined considered to have been seriously injured (Forney 2009), and the remaining three interactions in the SSLL fishery were determined to be not seriously injured (Bradford & Forney 2013) based on an evaluation of the observer’s description of the interaction and following the most recently developed criteria for assessing serious injury in marine mammals (NMFS 2012Andersen et al. 2008). The total observed mortality and serious injury of
Figure 12. Locations of Risso's dolphin takes (filled diamonds) and possible takes of this species (open diamonds) in Hawaii-based longline fisheries, 2007-20112004-2008 . Solid lines represent the U.S. EEZs. Fishery descriptions are provided in Appendix 1.
146
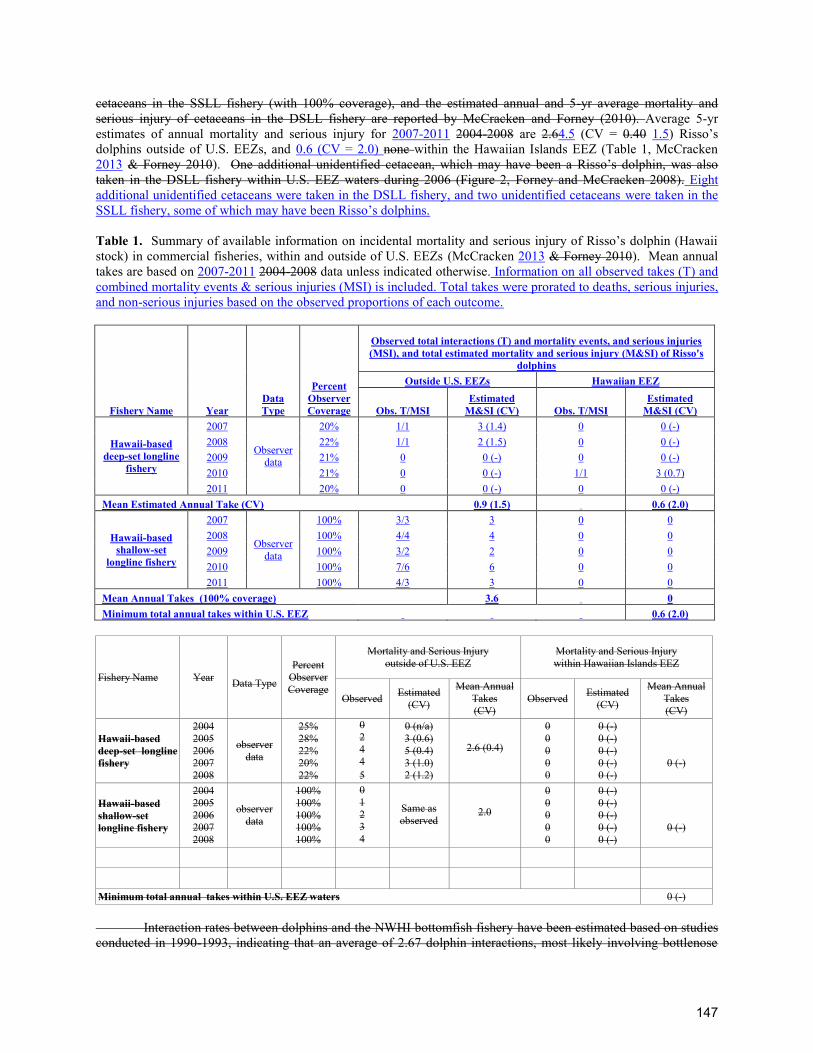
cetaceans in the SSLL fishery (with 100% coverage), and the estimated annual and 5-yr average mortality and serious injury of cetaceans in the DSLL fishery are reported by McCracken and Forney (2010). Average 5-yr estimates of annual mortality and serious injury for 2007-2011 2004-2008 are 2.64.5 (CV = 0.40 1.5) Risso’s dolphins outside of U.S. EEZs, and 0.6 (CV = 2.0) none within the Hawaiian Islands EEZ (Table 1, McCracken 2013 & Forney 2010). One additional unidentified cetacean, which may have been a Risso’s dolphin, was also taken in the DSLL fishery within U.S. EEZ waters during 2006 (Figure 2, Forney and McCracken 2008). Eight additional unidentified cetaceans were taken in the DSLL fishery, and two unidentified cetaceans were taken in the SSLL fishery, some of which may have been Risso’s dolphins. Table 1. Summary of available information on incidental mortality and serious injury of Risso’s dolphin (Hawaii stock) in commercial fisheries, within and outside of U.S. EEZs (McCracken 2013 & Forney 2010). Mean annual takes are based on 2007-2011 2004-2008 data unless indicated otherwise. Information on all observed takes (T) and combined mortality events & serious injuries (MSI) is included. Total takes were prorated to deaths, serious injuries, and non-serious injuries based on the observed proportions of each outcome.
Fishery Name Year Data Type
Percent Observer Coverage
Observed total interactions (T) and mortality events, and serious injuries (MSI), and total estimated mortality and serious injury (M&SI) of Risso's
dolphins Outside U.S. EEZs Hawaiian EEZ
Obs. T/MSI Estimated
M&SI (CV) Obs. T/MSI Estimated
M&SI (CV)
Hawaii-based deep-set longline
fishery
2007
Observer data
20% 1/1 3 (1.4) 0 0 (-) 2008 22% 1/1 2 (1.5) 0 0 (-) 2009 21% 0 0 (-) 0 0 (-) 2010 21% 0 0 (-) 1/1 3 (0.7) 2011 20% 0 0 (-) 0 0 (-)
Mean Estimated Annual Take (CV) 0.9 (1.5) 0.6 (2.0)
Hawaii-based shallow-set
longline fishery
2007
Observer data
100% 3/3 3 0 0 2008 100% 4/4 4 0 0 2009 100% 3/2 2 0 0 2010 100% 7/6 6 0 0 2011 100% 4/3 3 0 0
Mean Annual Takes (100% coverage) 3.6 0 Minimum total annual takes within U.S. EEZ 0.6 (2.0)
Fishery Name Year Data Type
Percent Observer Coverage
Mortality and Serious Injury outside of U.S. EEZ
Mortality and Serious Injury within Hawaiian Islands EEZ
Observed Estimated (CV)
Mean Annual Takes (CV)
Observed Estimated (CV)
Mean Annual Takes (CV)
Hawaii-based deep-set longline fishery
2004 2005 2006 2007 2008
observer data
25% 28% 22% 20% 22%
0 2 4 4 5
0 (n/a) 3 (0.6) 5 (0.4) 3 (1.0) 2 (1.2)
2.6 (0.4)
0 0 0 0 0
0 (-) 0 (-) 0 (-) 0 (-) 0 (-)
0 (-)
Hawaii-based shallow-set longline fishery
2004 2005 2006 2007 2008
observer data
100% 100% 100% 100% 100%
0 1 2 3 4
Same as observed
2.0
0 0 0 0 0
0 (-) 0 (-) 0 (-) 0 (-) 0 (-)
0 (-)
Minimum total annual takes within U.S. EEZ waters 0 (-) Interaction rates between dolphins and the NWHI bottomfish fishery have been estimated based on studies conducted in 1990-1993, indicating that an average of 2.67 dolphin interactions, most likely involving bottlenose
147

and rough-toothed dolphins, occurred for every 1000 fish brought on board (Kobayashi and Kawamoto 1995). Fishermen claim interactions with dolphins stealing bait and catch are increasing. It is not known whether these interactions result in serious injury or mortality of dolphins, nor whether Risso’s dolphins are involved. STATUS OF STOCK The Hawaii stock of Risso’s dolphins is not considered strategic under the 1994 amendments to the MMPA. The status of Risso's dolphins in Hawaiian waters relative to OSP is unknown, and there are insufficient data to evaluate trends in abundance. No habitat issues are known to be of concern for this species. Risso’s dolphins are It is not listed as “threatened” or “endangered” under the Endangered Species Act (1973), nor designated as “depleted” under the MMPA. Given the absence of recent fishery-related mortality or serious injuries within the Hawaiian Islands EEZ, the Hawaiian stock of Risso’s dolphins is not considered strategic under the 1994 amendments to the MMPAThe estimated rate of fisheries related mortality or serious injury within the Hawaiian Islands EEZ (0.6 animals per year) is less than the PBR (42)., and tThe total fishery mortality and serious injury can be considered to be insignificant and approaching zero because mortality and serious injury is less than 10% of PBR. However, the potential effect of injuries sustained by Risso’s dolphins in U.S. pelagic longline fisheries in international waters is not known, because no abundance or bycatch estimates are available for international waters. REFERENCES Andersen, M. S., K. A. Forney, T. V. N. Cole, T. Eagle, R. Angliss, K. Long, L. Barre, L. Van Atta, D. Borggaard,
T. Rowles, B. Norberg, J. Whaley, and L. Engleby. 2008. Differentiating Serious and Non-Serious Injury of Marine Mammals: Report of the Serious Injury Technical Workshop, 10-13 September 2007, Seattle, Washington. NOAA Technical Memorandum NMFS-OPR-39. 94p.
Angliss, R.P. and D.P. DeMaster. 1998. Differentiating Serious and Non-Serious Injury of Marine Mammals Taken Incidental to Commercial Fishing Operations. NOAA Tech Memo. NMFS-OPR-13, 48 p.
Barlow, J. 2006. Cetacean abundance in Hawaiian waters estimated from a summer/fall survey in 2002. Marine Mammal Science 22(2): 446-464.Barlow, J., and Forney, K.A. 2007. Abundance and density of cetaceans in the California Current ecosystem. Fishery Bulletin 105(4): 509-526.
Barlow, J., S.L. Swartz, T.C. Eagle, and P.R. Wade. 1995. U.S. Marine Mammal Stock Assessments: Guidelines for Preparation, Background, and a Summary of the 1995 Assessments. U.S. Dep. Commer., NOAA Tech. Memo. NMFS-OPR-6, 73 p.
Bradford, A.L. and K.A. Forney. 2013. Injury determinations for cetaceans observed interacting with Hawaii and American Samoa longline fisheries during 2007-2011. PIFSC Working Paper WP-13-002.
Bradford. A.L., K.A. Forney, E.M. Oleson, and J. Barlow. 2013. Line-transect abundance estimates of cetaceans in the Hawaiian EEZ. PIFSC Working Paper WP-13-004.
Forney, K.A. 2009. Serious injury determinations for cetaceans caught in Hawaii longline fisheries during 1994-2008. Draft document PSRG-2009-09 presented to the Pacific Scientific Review Group, November 3-5, 2009, Del Mar, CA..
Forney, K. A. and McCracken, M. 2008. Preliminary estimates of cetacean injury and mortality in Hawaii-based longline fisheries during 2006. Draft document PSRG-2008-16 presented to the Pacific Scientific Review Group, January 8-10, 2008, Monterey, CA.
Kobayashi, D. R. and K. E. Kawamoto. 1995. Evaluation of shark, dolphin, and monk seal interactions with Northwestern Hawaiian Island bottomfishing activity: a comparison of two time periods and an estimate of economic impacts. Fisheries Research 23: 11-22.
Maldini, D., L. Mazzuca, and S. Atkinson. 2005. Odontocete stranding patterns in the Main Hawaiian Islands (1937-2002): How do they compare with live animal surveys? Pacific Science 59(1):55-67.
McCracken M. and K.A. Forney. 2010. Preliminary assessment of incidental interactions with marine mammals in the Hawaii longline deep and shallow set fisheries. NMFS, Pacific Islands Fisheries Science Center Working Paper WP-10-001. 27p.
McCracken, M. 2013. Preliminary assessment of incidental interactions with marine mammals in the Hawaii longline deep and shallow set fisheries from 2007 to 2011. PIFSC Working Paper WP-13-XXX.
Miyashita, T. 1993. Abundance of dolphin stocks in the western North Pacific taken by the Japanese drive fishery. Rep. Int. Whal. Commn. 43:417-437.
Nitta, E. 1991. The marine mammal stranding network for Hawaii: an overview. In: J.E. Reynolds III, D.K. Odell (eds.), Marine Mammal Strandings in the United States, pp.56-62. NOAA Tech. Rep. NMFS 98, 157 pp.
Nitta, E. and J. R. Henderson. 1993. A review of interactions between Hawaii's fisheries and protected species. Mar. Fish. Rev. 55(2):83-92.
148

NMFS. 2005. Revisions to Guidelines for Assessing Marine Mammal Stocks. 24 pp. Available at: http://www.nmfs.noaa.gov/pr/pdfs/sars/gamms2005.pdf
NMFS. 2012. NOAA Fisheries Policy Directive 02-038-01 Process for Injury Determinations (01/27/12). Available at: http://www.nmfs.noaa.gov/pr/pdfs/serious_injury_policy.pdf
Perrin, W.F., G. P. Donovan and J. Barlow. 1994. Gillnets and Cetaceans. Rep. Int. Whal. Commn., Special Issue 15, 629 pp.
Perrin, W.F., B. Würsig and J.G.M. Thewissen. 2009. Encyclopedia of Marine Mammals. Second Edition. Academic Press, Amsterdam.
Shallenberger, E.W. 1981. The status of Hawaiian cetaceans. Final report to U.S. Marine Mammal Commission. MMC-77/23, 79pp.
Wade, P. R. and R. P. Angliss. 1997. Guidelines for Assessing Marine Mammal Stocks: Report of the GAMMS Workshop April 3-5, 1996, Seattle, Washington. U. S. Dep. Commer., NOAA Tech. Memo. NMFS-OPR-12. 93 pp.
Wade, P. R. and T. Gerrodette. 1993. Estimates of cetacean abundance and distribution in the eastern tropical Pacific. Rep. Int. Whal. Commn. 43:477-493.
149

Revised 01/15/2011 9/23/2013 COMMON BOTTLENOSE DOLPHIN (Tursiops truncatus truncatus):
Hawaiian Islands Stock Complex- Kauai/Niihau, Oahu, 4-Islands, Hawaii Island, Hawaii Pelagic
STOCK DEFINITION AND GEOGRAPHIC RANGE Common bottlenose dolphins are widely distributed throughout the world in tropical and warm-temperate waters (Perrin et al. 2009). The species is primarily coastal in much of its range, but there are populations in some offshore deepwater areas as well. Bottlenose dolphins are common throughout the Hawaiian Islands, from the island of Hawaii to Kure Atoll (Shallenberger 1981). Eighteen Twelve strandings have been reported within the main Hawaiian Islands (Nitta 1991, Maldini et al. 2005, NMFS PIR Marine Mammal Response Network database), including 3 since 2007. Summer/fall shipboard surveys of the waters within the U.S. Exclusive Economic Zone (EEZ) of the Hawaiian Islands resulted in 18 sightings in 2002 and 20 sightings in 2010 Recent sighting locations based on a 2002 shipboard survey of waters within the U.S. Exclusive Economic Zone (EEZ) of the Hawaiian Islands (Barlow 2006, Bradford et al 2013; ) are shown in Figure 1). In the Hawaiian Islands, bottlenose dolphins they are found in shallow inshore waters and deep water (Baird et al. 2009).
Separate offshore and coastal forms of bottlenose dolphins have been identified along continental coasts in several areas (Ross and Cockcroft 1990; Van Waerebeek et al. 1990), and there is some evidence that similar onshore-offshore forms may exist in Hawaiian waters. In their analysis of sightings of bottlenose dolphins in the eastern tropical Pacific (ETP), Scott and Chivers (1990) noted that there was a large hiatus between the westernmost sightings and the Hawaiian Islands. These data suggest that bottlenose dolphins in Hawaiian waters belong to a separate stock from those in the ETP. Furthermore, recent photo-identification and genetic studies off Oahu, Maui, Lanai, Kauai, Niihau, and Hawaii suggest limited movement of bottlenose dolphins between islands and into offshore waters (Baird et al. 2009; Martien et al. 2012in review). These data suggest the existence of demographically distinct resident populations at each of the four main Hawaiian Island groups – Kauai & Niihau, Oahu, the ‘4-island’ Rregion (Molokai, Lanai, Maui, Kahoolawe), and Hawaii. Genetic data support inclusion of bottlenose dolphins in In addition, the genetic data indicate that the deeper waters surrounding the main Hawaiian Islands as part of the are utilized by a larger broadly distributed pelagic population (Martien et al 2012).
Over 99% of the bottlenose dolphins known to be part of one of the
Figure 2. Main Hawaiian Islands Iinsular bottlenose dolphin stock boundaries (gray shading red lines). Areas beyond the 1000 m isobath represent the pelagic stock range.
Figure 1. Bottlenose dolphin sighting locations during the 2002 (open diamonds) and 2010 (black diamonds) shipboard cetacean surveys of U.S. EEZ waters surrounding the Hawaiian Islands (Barlow 2006, Bradford et al. 2013; see Appendix 2 for details on timing and location of survey effort). Outer line represents approximate boundary of survey area and U.S. EEZ. Gray shading indicates area of Papahanaumokuakea Marine National Monument. Dotted line represents the 1000m isobaths. Insular stock boundaries are shown in Figure 2.
150

insular populations linked through photo-identification to one of the insular populations ed around the main Hawaiian Islands (Baird et al. 2009) have been documented in waters of 1000 m or less (Martien & Baird et al. 2009). Based on these data, Martien & Baird et al. (2009) suggested that the boundaries between the insular stocks and the Hawaii Pelagic stock be placed along the 1000 m isobath. Since that isobath does not separate Oahu from the 4-Islands Region, the boundary between those stocks would runs approximately equidistant between the 500 m isobaths around Oahu and the 4-Islands Region, through the middle of Kaiwi Channel. These boundaries (Figure 2) are provisionally applied in this report to recognize separate insular and pelagic bottlenose dolphin stocks for management (NMFS 2005). These boundaries may be revised in the future as additional information becomes available. To date, no data are available regarding population structure of bottlenose dolphins in the Northwestern Hawaiian Islands (NWHI), though sightings during the 2010 survey indicate they are commonly found close to the islands and atolls there (Bradford et al 2013). However, g Given the evidence for existence of island resident populations in the main Hawaiian Islands, the larger distances between islands in the NWHI, and the finding of population structure within the NWHI in other dolphin species (Andrews 2010), it is likely that additional demographically independent populations of bottlenose dolphins exist in the NWHI. However, until data become available upon which to base provisional stock designations in this area, the NWHI will remain part of the Hawaii Pelagic Stock. For the Marine Mammal Protection Act (MMPA) Pacific stock assessment reports, bottlenose dolphins within the Pacific U.S. EEZ are provisionally divided into seven stocks: 1) California, Oregon and Washington offshore stock, 2) California coastal stock, and five Pacific Islands Region management stocks (this report): 3) Kauai/ and Niihau, 4) Oahu, 5) the “4-Islands Region” (Molokai, Lanai, Maui, Kahoolawe), 6) Hawaii Island and 7) the Hawaiian Pelagic Stock, including animals found both within the Hawaiian Islands EEZ and in adjacent international high seas waters. Because data on abundance, distribution, and human-caused impacts are largely lacking for international high seas waters, the status of the Hawaii pelagic stock is evaluated based on data from U.S. EEZ waters of the Hawaiian Islands (NMFS 2005). Estimates of abundance, potential biological removals, and status determinations for the five Hawaiian stocks are presented separately below. HUMAN CAUSED MORTALITY AND SERIOUS INJURY New Serious Injury Guidelines NMFS updated its serious injury designation and reporting process, which uses guidance from previous serious injury workshops, expert opinion, and analysis of historic injury cases to develop new criteria for distinguishing serious from non-serious injury (Angliss and DeMaster 1998, Andersen et al. 2008, NOAA 2012). NMFS defines serious injury as an “injury that is more likely than not to result in mortality”. Injury determinations for stock assessments revised in 2013 or later incorporate the new serious injury guidelines, based on the most recent 5-year period for which data are available. Fishery Information Information on fishery-related mortality of cetaceans in Hawaiian waters is limited, but the gear types used in Hawaiian fisheries are responsible for marine mammal mortality and serious injury in other fisheries throughout U.S. waters. Gillnets appear to capture marine mammals wherever they are used (Perrin et al. 1994). In Hawaii, some mortality of bottlenose dolphins has been observed in inshore gillnets, but no estimate of annual human-caused mortality and serious injury is available. There are at least two reports of entangled bottlenose dolphins drowning in gillnets off Maui (Nitta and Henderson, 1993, Maldini 2003). Although gillnet fisheries are not observed or monitored through any State or Federal program, State regulations ban gillnetting around Maui and much of Oahu and require gillnet fishermen to monitor their nets for bycatch every 30 minutes in those areas where gillnetting is permitted., In 2009, one bottlenose dolphin, known to frequent aquaculture pens off the Kona Coast of the island of Hawaii, was seen with a hook and line trailing out of its mouth (Bradford & Lyman 2013). Based on the description and photographs, this injury was considered serious under the most recently developed criteria for assessing serious injury in marine mammals (NMFS 2012). The animal was resighted in February 2012 without the fish hook and in normal body condition, such that this injury is no longer considered serious. The responsible fishery is not known. No estimates of human-caused mortality or serious injury are currently available for nearshore hook and line or gillnet fisheries because these fisheries are not observed or monitored for protected species bycatch. Interactions with cetaceans have been reported for all Hawaiian pelagic fisheries, and some of these interactions involved bottlenose dolphins (Nitta and Henderson 1993). There are currently two distinct longline fisheries based in Hawaii: a deep-set longline (DSLL) fishery that targets primarily tunas, and a shallow-set longline fishery (SSLL) that targets swordfish. Both fisheries operate within U.S. waters and on the high seas. Between 2004 and 2008, four bottlenose dolphins were observed hooked or entangled in the SSLL fishery (100% observer coverage), and one bottlenose dolphin was observed taken in the DSLL fishery (20-28% observer coverage) (Forney
151

2009, McCracken 2009). Based on the locations, these takes are all considered to have been from the Pelagic Stock of bottlenose dolphins. All five dolphins were determined to have been seriously injured (Forney 2009), based on an evaluation of the observer’s description of the interaction and following the most recently developed criteria for assessing serious injury in marine mammals (Andersen et al. 2008). Average 5-yr estimates of annual mortality and serious injury for the Pelagic Stock during 2004-2008 are 0.6 (CV = 0) bottlenose dolphins outside of U.S. EEZs, and 0.4 (CV = 0.68) within the Hawaiian Islands EEZ (Table 1, McCracken 2009). Bottlenose dolphins are one of the species commonly reported to steal bait and catch from several Hawaiian sport and commercial fisheries (Nitta and Henderson 1993; Schlais 1984). Observations of bottlenose dolphins stealing bait or catch have also been made in the day handline fishery (palu-ahi) for tuna, the night handline fishery for squid (ika-shibi), the handline fishery for mackerel scad, the troll fishery for billfish and tuna, and the inshore set gillnet fishery (Nitta and Henderson 1993). Nitta and Henderson (1993) indicated that bottlenose dolphins remove bait and catch from handlines used to catch bottomfish off the island of Hawaii and Kaula Rock Island and formerly on several banks of the Northwestern Hawaiian Islands. Fishermen claim interactions with dolphins that steal bait and catch are increasing, including anecdotal reports of bottlenose dolphins getting “snagged” (Rizzuto 2007). Interaction rates between dolphins and the NWHI bottomfish fishery were have been estimated based on studies conducted in 1990-1993, indicating that an average of 2.67 dolphin interactions, most likely involving bottlenose and rough-toothed dolphins, occurred for every 1000 fish brought on board (Kobayashi and Kawamoto 1995). It is not known whether these interactions result in serious injury or mortality of dolphins. This fishery was observed from 2003 through 2005 at 18-25% coverage, during which time, no incidental takes of cetaceans were reported. The bottomfish fishery is no longer permitted for the Northwestern Hawaiian Islands. There are currently two distinct longline fisheries based in Hawaii: a deep-set longline (DSLL) fishery that targets primarily tunas, and a shallow-set longline fishery (SSLL) that targets swordfish. Both fisheries operate within U.S. waters and on the high seas. Between 2007 and 2011, seven bottlenose dolphins were observed hooked or entangled in the SSLL fishery (100% observer coverage), and two bottlenose dolphins were observed taken in the DSLL fishery (20-22% observer coverage) (Bradford & Forney 2013, McCracken 2013). Based on the locations, these takes are all considered to have been from the Pelagic Stock of bottlenose dolphins. Eight of the nine dolphins were considered to have been seriously injured (Bradford & Forney 2013), based on an evaluation of the observer’s description of the interaction and following the most recently developed criteria for assessing serious injury in marine mammals (NMFS 2012). Average 5-yr estimates of annual mortality and serious injury for the Pelagic Stock during 2007-2011 are 3.1 (CV = 0.6) bottlenose dolphins outside of U.S. EEZs, and 0.2 (CV = 0) within the Hawaiian Islands EEZ (Table 1, McCracken 2013). Eight unidentified cetaceans were taken in the DSLL fishery, and two unidentified cetaceans were taken in the SSLL fishery, some of which may have been bottlenose dolphins.
Figure 3. Locations of observed Pelagic Stock bottlenose dolphin takes (filled diamonds) in the Hawaii-based longline fishery, 2007-2011 2004-2008. Solid lines represent the U. S. EEZ. Fishery descriptions are provided in Appendix 1.
152

Beginning in the early 1970s the National Marine Fisheries Service received reports of fishermen shooting at bottlenose dolphins to deter them from stealing fish catches (Nitta and Henderson 1993). Nitta and Henderson (1993) also reported that one bottlenose dolphin calf was removed from a small-mesh set gillnet off Maui in 1991 and expressed surprise that bottlenose dolphins are "rarely reported entangled or raiding set gill nets in Hawaii," considering that they so often remove fish from fishing lines. One bottlenose dolphin entangled in a gillnet was reported stranded on Maui in 1998 (NMFS/PIR, unpublished data; Maldini 2003). During 2009, one bottlenose dolphin was photographed off the Kona Coast of the island of Hawaii with a hook and line trailing out of its mouth (pers. comm. Robin Baird), but the responsible fishery is not known. No estimates of human-caused serious injury and mortality are available for nearshore hook-and-line fisheries. T, because here is no provision for systematic collection of information on protected species bycatch for these fisheries; fishers are just encouraged to report protected species interactions to NMFS and not observed or monitored. Table 1. Summary of available information on incidental mortality and serious injury of bottlenose dolphins (Hawaii Pelagic stock) in commercial and gillnet fisheries, within and outside of the U.S. EEZs (McCracken 201309, Forney 2009). Mean annual takes are based on 2007-20112004-2008 data unless otherwise indicated; n/a = not available. Information on all observed takes (T) and combined mortality events & serious injuries (MSI) is included. Total takes were prorated to deaths, serious injuries, and non-serious injuries based on the observed proportions of each outcome.
Fishery Name Year Data Type
Percent Observer Coverage
Observed total interactions (T) and mortality events, and serious injuries (MSI), and total estimated mortality and serious injury (M&SI) of Hawaii
Pelagic stock bottlenose dolphins Outside U.S. EEZs Hawaiian EEZ
Obs. T/MSI Estimated
M&SI (CV) Obs. T/MSI Estimated
M&SI (CV)
Hawaii-based deep-set longline
fishery
2007
Observer data
20% 0 0 (-) 0 0 (-) 2008 22% 0 0 (-) 0 0 (-) 2009 21% 1/1 5 (0.5) 0 0 (-) 2010 21% 1/1 4 ().6) 0 0 (-) 2011 20% 0 0 (-) 0 0 (-)
Mean Estimated Annual Take (CV) 1.9 (0.6) 0 (-)
Hawaii-based shallow-set
longline fishery
2007
Observer data
100% 3/3 3 1/1 1 2008 100% 0 0 0 0 2009 100% 0 0 0 0 2010 100% 2/2 2 0 0 2011 100% 2/1 1 0 0
Mean Annual Takes (100% coverage) 1.2 0.2 Minimum total annual takes within U.S. EEZ 0.2 (-)
Fishery Name Year Data Type
Percent Observer Coverage
Mortality and Serious Injury outside of U.S. EEZ
Mortality and Serious Injury within Hawaiian Islands EEZ
Observed Estimated Mean Annual
Takes (CV)
Observed Estimated (CV)
Mean Annual Takes (CV)
Hawaii-based deep-set longline fishery
2004 2005 2006 2007 2008
observer data
25% 28% 22% 20% 22%
0 0 0 0 0
0 (-) 0 (-) 0 (-) 0 (-) 0 (-)
0 (-)
0 0 1 0 0
0 (-) 0 (-)
1 (1.6) 0 (-) 0 (-)
0.2 (3.1)
Hawaii-based shallow-set longline fishery
2004 2005 2006 2007 2008
observer data
100% 100% 100% 100% 100%
0 0 1 2 0
Same as observed
0.6 (0.0)
0 0 0 1 0
Same as observed 0.2
Minimum total annual takes within U.S. EEZ waters 0.4 (0.68)1 1 Takes were all from the Pelagic Stock of bottlenose dolphins
153

KAUAI/ AND NIIHAU STOCK POPULATION SIZE A photo-identification study conducted from in 2003 to , 2004 and 2005 identified 102 individual bottlenose dolphins around Kauai and Niihau (Baird et al. 2009). A Lincoln-Peterson mark-recapture analysis of the photo-identification data resulted in an abundance estimate of 147 (CV=0.11), or 184 animals when corrected for the proportion of marked individuals (Baird et al. 2009). This abundance underestimates the total number of bottlenose dolphins around Kauai and Niihau because it only represents individuals with distinguishable marks. The CV of this estimate is likely negatively-biased, as it does not account for variation in the proportion of marked animals within groups. Minimum Population Estimate The minimum population size is calculated as the lower 20th percentile of the log-normal distribution (Barlow et al 1995) isThe log-normal 20th percentile of the Baird et al. (2009) mark-recapture estimate, is or 168 134. This is greater than the number of distinct individuals (102) identified during the photo-identification study. Current Population Trend Only one abundance estimate is available for this stock, such that there is insufficient information to assess No data are available on current population trends. CURRENT AND MAXIMUM NET PRODUCTIVITY RATES No data are available on current or maximum net productivity rate for this species in Hawaiian waters. POTENTIAL BIOLOGICAL REMOVAL The potential biological removal (PBR) level for this stock is calculated as the minimum population size (134168) times one half the default maximum net growth rate for cetaceans (½ of 4%) times a recovery factor of 0.50 (for a stock of unknown status with no reported fishery mortality or serious injury within the Kauai/Niihau stock rangeduring the last five years; Wade and Angliss 1997), resulting in a PBR of 1.31.7 bottlenose dolphins per year. STATUS OF STOCK The Kauai/Niihau Stock of bottlenose dolphins is not considered strategic under the 1994 amendments to the MMPA. The status of bottlenose dolphins in the Kauai/Niihau stock Hawaiian waters relative to OSP is unknown, and there are insufficient data to evaluate abundance trends in abundance. No habitat issues are known to be of concern for this species. Bottlenose dolphins It is are not listed as “threatened” or “endangered” under the Endangered Species Act (1973), nor designated as “depleted” under the MMPA. The Kauai and Niihau Stock of bottlenose dolphins is not considered strategic under the 1994 amendments to the MMPA, because tThere have been no reports of recent mortality or serious injuries; of this stock. Hhowever, there is no systematic monitoring for interactions with protected species within near-shore fisheries that may take this species, thus mean annual takes are undetermined. Insufficient information is available to determine whether the total fishery mortality and serious injury for bottlenose dolphins is insignificant and approaching zero mortality and serious injury rate. OAHU STOCK POPULATION SIZE A photo-identification study conducted in 2002, 2003 and 2006 identified 67 individual bottlenose dolphins around Oahu (Baird et al. 2009). A Lincoln-Peterson mark-recapture analysis of the photo-identification data resulted in an abundance estimate of 594 (CV=0.54), or 743 animals when corrected for the proportion of marked individuals (Baird et al. 2009). The estimate only represents individuals with distinguishable marks and does not include individuals from the Northeastern (windward) side of the island. The sample size of encounters (11) was small compared to encounters off other islands; therefore, this estimate is imprecise and should be considered provisional until additional abundance studies can be completed. Minimum Population Estimate The minimum population size is calculated as the lower 20th percentile of the log-normal distribution (Barlow et al 1995) is The log-normal 20th percentile of the Baird et al. (2009) mark-recapture estimate, or 485 is 388. This is substantially greater than the number of distinct individuals (67) identified during the photo-identification study.
154

Current Population Trend Only one abundance estimate is available for this stock, such that there is insufficient information to assess No data are available on current population trends. CURRENT AND MAXIMUM NET PRODUCTIVITY RATES No data are available on current or maximum net productivity rate for this species in Hawaiian waters. POTENTIAL BIOLOGICAL REMOVAL The potential biological removal (PBR) level for the Oahu is stock is calculated as the minimum population size (485 388) times one half the default maximum net growth rate for cetaceans (½ of 4%) times a recovery factor of 0.50 (for a stock of unknown status with no reported fishery mortality in the Oahu stock range during the last five years; Wade and Angliss 1997), resulting in a PBR of 3.9 4.9 bottlenose dolphins per year. STATUS OF STOCK The Oahu stock of bottlenose dolphins is not considered strategic under the 1994 amendments to the MMPA. The status of bottlenose dolphins in Oahu Hawaiian waters relative to OSP is unknown, and there are insufficient data to evaluate abundance trends in abundance. No habitat issues are known to be of concern for this speciesstock. Bottlenose dolphins are It is not listed as “threatened” or “endangered” under the Endangered Species Act (1973), nor designated as “depleted” under the MMPA. The Oahu stock of bottlenose dolphins is not considered strategic under the 1994 amendments to the MMPA, because tThere have been no reports of recent mortality or serious injuries; of this stock. Hhowever, there is no systematic monitoring of for interactions with protected species within near-shore fisheries that may take this species, thus mean annual takes are undetermined. Insufficient information is available to determine whether the total fishery mortality and serious injury for bottlenose dolphins is insignificant and approaching zero mortality and serious injury rate. 4-ISLANDS REGION STOCK POPULATION SIZE A photo-identification study conducted from 2000-2006 identified 98 individual bottlenose dolphins around Maui and Lanai (Baird et al. 2009). A Lincoln-Peterson mark-recapture analysis of the photo-identification data resulted in an abundance estimate of 153 (CV=0.24), or 191 animals when corrected for the proportion of marked individuals (Baird et al. 2009). This abundance estimate likely underestimates the total number of bottlenose dolphins in the 4-islands region because it only represents individuals with distinguishable marks and does not include individuals from the Northeastern (windward) sides of Maui and Molokai. The CV of this estimate is likely negatively-biased, as it does not account for variation in the proportion of marked animals within groups. Minimum Population Estimate The minimum population size is calculated as the lower 20th percentile of the log-normal distribution (Barlow et al 1995) is The log-normal 20th percentile of the Baird et al. (2009) mark-recapture estimate, or 156 is 125. This is greater than the number of distinct individuals (98) identified during the photo-identification study. Current Population Trend Only one abundance estimate is available for this stock, such that there is insufficient information to assess No data are available on current population trends. CURRENT AND MAXIMUM NET PRODUCTIVITY RATES No data are available on current or maximum net productivity rate for this species in Hawaiian waters. POTENTIAL BIOLOGICAL REMOVAL The potential biological removal (PBR) level for the 4-Islands is stock is calculated as the minimum population size (156 125) times one half the default maximum net growth rate for cetaceans (½ of 4%) times a recovery factor of 0.50 (for a stock of unknown status with no reported fishery mortality in the 4-Islands stock area during the last five years; Wade and Angliss 1997), resulting in a PBR of 1.3 1.6 bottlenose dolphins per year. STATUS OF STOCK The 4-Islands Region Stock of bottlenose dolphins is not considered strategic under the 1994 amendments
155

to the MMPA. The status of bottlenose dolphins in 4-IslandsHawaiian waters relative to OSP is unknown, and there are insufficient data to evaluate trends in abundance. No habitat issues are known to be of concern for this species. Bottlenose dolphinsIt is are not listed as “threatened” or “endangered” under the Endangered Species Act (1973), nor as “depleted” under the MMPA. The 4-Islands Region Stock of bottlenose dolphins is not considered strategic under the 1994 amendments to the MMPA, tThere have been no reports of recent mortality or serious injuries of this stock; . Hhowever, there is no systematic monitoring for interactions with protected species within of near-shore fisheries that may take this species, thus mean annual takes are undetermined. Insufficient information is available to determine whether the total fishery mortality and serious injury for bottlenose dolphins is insignificant and approaching zero mortality and serious injury rate. HAWAII ISLAND STOCK POPULATION SIZE A photo-identification study conducted from 2000-2006 identified 69 individual bottlenose dolphins around the island of Hawaii (Baird et al. 2009). A Lincoln-Peterson mark-recapture analysis of the photo-identification data resulted in an abundance estimate of 102 (CV=0.13), or 128 animals when corrected for the proportion of marked individuals (Baird et al. 2009). This abundance estimate likely underestimates the total number of bottlenose dolphins around the island of Hawaii because it only represents individuals with distinguishable marks and does not include individuals from the Northeastern (windward) side of the island. The CV of this estimate is likely negatively-biased, as it does not account for variation in the proportion of marked animals within groups. Minimum Population Estimate The minimum population size is calculated as the lower 20th percentile of the log-normal distribution (Barlow et al 1995) is The log-normal 20th percentile of the Baird et al. (2009) mark-recapture estimate, is or 115 91. This is greater than the number of distinct individuals (69) identified during the photo-identification study. Current Population Trend Only one abundance estimate is available for this stock, such that there is insufficient information to assess No data are available on current population trends. CURRENT AND MAXIMUM NET PRODUCTIVITY RATES No data are available on current or maximum net productivity rate for this species in Hawaiian waters. POTENTIAL BIOLOGICAL REMOVAL The potential biological removal (PBR) level for this the Hawaii Island stock is calculated as the minimum population size (91115) times one half the default maximum net growth rate for cetaceans (½ of 4%) times a recovery factor of 0.50 (for a stock of unknown status with no reported fishery mortality in the Hawaii Islands stock area during the last five years; Wade and Angliss 1997), resulting in a PBR of 0.91.1 bottlenose dolphins per year. STATUS OF STOCK The Hawaii Island Stock of bottlenose dolphins is not considered strategic under the 1994 amendments to the MMPA. The status of bottlenose dolphins in waters around Hawaii Island Hawaiian waters relative to OSP is unknown, and there are insufficient data to evaluate trends in abundance. Hawaii Island bottlenose dolphins are regularly seen near aquaculture pens off the Kona coast, and aquaculture workers have been observed feeding bottlenose dolphins. Bottlenose dolphins in this region are also known to interact with divers. No habitat issues are known to be of concern for this species. Bottlenose dolphins It isare not listed as “threatened” or “endangered” under the Endangered Species Act (1973), nor designated as “depleted” under the MMPA. The Hawaii Island Stock of bottlenose dolphins is not considered strategic under the 1994 amendments to the MMPA, because tThere have been no reports of recent mortality or serious injuries; of this stock. Hhowever, there is no systematic monitoring of takes in near-shore gillnet fisheries that may take this species, thus mean annual takes are undetermined. Insufficient information is available to determine whether the total fishery mortality and serious injury for bottlenose dolphins is insignificant and approaching zero mortality and serious injury rate. HAWAIIAN PELAGIC STOCK POPULATION SIZE Population estimates have been made in Japanese waters (Miyashita 1993) and the eastern tropical Pacific (Wade and Gerrodette 1993), but it is not known whether these animals are part of the same population that occurs
156

around the Hawaiian Islands. A 2002 shipboard line-transect survey of the entire Hawaiian Islands EEZ resulted in an abundance estimate of 3,215 (CV= 0.59) bottlenose dolphins (Barlow 2006), equivalent to a density of 1.31 individuals per 1000 km2. Applying this density to the 2,464,486 km2 area of the Pelagic Stock between the 1000m isobath and the Hawaiian Islands EEZ boundary (see Figures 1-2), the stock-specific abundance for 2002 i was estimated as 3,178 (CV=0.59). The recent 2010 shipboard line-transect survey of the Hawaiian Islands EEZ resulted in an abundance estimate of 5,950 (CV = 0.59) bottlenose dolphins within the pelagic stock area (Bradford et al 2013). This is currently the best available abundance estimate for the Hawaiian Pelagic stock. Minimum Population Estimate The minimum population size is calculated as the lower 20th percentile of the log-normal distribution (Barlow et al 1995) is The log-normal 20th percentile of the 2002 2010 line-transect abundance estimate for the Hawaiian Pelagic Stock, is or 3,755 2,006 bottlenose dolphins. Current Population Trend The broad and overlapping confidence intervals around the 2002 and 2010 estimates preclude assessment of population trends with the available data. No data are available on current population trend. CURRENT AND MAXIMUM NET PRODUCTIVITY RATES No data are available on current or maximum net productivity rate for this species in Hawaiian waters. POTENTIAL BIOLOGICAL REMOVAL
The potential biological removal (PBR) level for this stock is calculated as the minimum population size within the U.S EEZ of the Hawaiian Islands (3,755 2,006) times one half the default maximum net growth rate for cetaceans (½ of 4%) times a recovery factor of 0.450.5 (for a stock of unknown status with a Hawaiian Islands EEZ fishery mortality and serious injury rate CV of 0 between 0.60 and 0.80; Wade and Angliss 1997), resulting in a PBR of 38 18 bottlenose dolphin per year. STATUS OF STOCK The Hawaii Pelagic Stock of bottlenose dolphins is not considered strategic under the 1994 amendments to the MMPA. The status of bottlenose dolphins in Hawaiian waters relative to OSP is unknown, and there are insufficient data to evaluate trends in abundance. No habitat issues are known to be of concern for this species. It is not listed as “threatened” or “endangered” under the Endangered Species Act (1973), nor designated as “depleted” under the MMPA. The Hawaiian Pelagic Stock of bottlenose dolphins is not considered strategic under the 1994 amendments to the MMPA, because tThe estimated rate of fisheries related mortality or serious injury within the Hawaiian Islands EEZ (0.2 0.4 animals per year) is less than the PBR (38 18). However, the potential effects of interactions with U.S. and international pelagic longline fisheries in international waters are not known. Insufficient information is available to determine whether the The total fishery mortality and serious injury for Hawaii pelagic bottlenose dolphins is insignificant and approaching zero mortality and serious injury rate. REFERENCES Andersen, M. S., K. A. Forney, T. V. N. Cole, T. Eagle, R. Angliss, K. Long, L. Barre, L. Van Atta, D. Borggaard,
T. Rowles, B. Norberg, J. Whaley, and L. Engleby. 2008. Differentiating Serious and Non-Serious Injury of Marine Mammals: Report of the Serious Injury Technical Workshop, 10-13 September 2007, Seattle, Washington. NOAA Technical Memorandum NMFS-OPR-39. 94p.
Andrews, K.R., L. Karczmarski, W.W.L. Au, S.H. Rickards, C.A. Venderlip, B.W. Bowen, E.G. Grau, and R.J. Toonen. 2010. Rolling stones and stable homes: social structure, habitat diversity and population genetics of the Hawaiian spinner dolphin (Stenella longirostris). Molecular Ecology 19:732-748.
Angliss, R.P. and D.P. DeMaster. 1997. Differentiating serious and non-serious injury of marine mammals taken incidental to commercial fishing operations: Report of the Serious Injury Workshop 1-2 April. 1997, Silver Spring, MD. NOAA Tech Memo NMFS-OPR-13, 48 p
Baird, R.W., A.M. Gorgone, D.J. McSweeney, A.D. Ligon, M.H. Deakos, D.L. Webster, G.S. Schorr, K.K. Martien, D.R. Salden, and S.D. Mahaffy. 2009. Population structure of island-associated dolphins: Evidence from photo-identification of common bottlenose dolphins (Tursiops truncatus) in the main Hawaiian Islands. Mar. Mam. Sci. 25:251-274.
Barlow, J. 2006. Cetacean abundance in Hawaiian waters estimated from a summer/fall survey in 2002. Marine
157

Mammal Science 22: 446–464. Barlow, J., S.L. Swartz, T.C. Eagle, and P.R. Wade. 1995. U.S. Marine Mammal Stock Assessments: Guidelines for
Preparation, Background, and a Summary of the 1995 Assessments. U.S. Dep. Commer., NOAA Tech. Memo. NMFS-OPR-6, 73 p.
Bradford, A.L. and K.A. Forney. 2013. Injury determinations for cetaceans observed interacting with Hawaii and American Samoa longline fisheries during 2007-2011. PIFSC Working Paper WP-13-002.
Bradford. A.L., K.A. Forney, E.M. Oleson, and J. Barlow. 2013. Line-transect abundance estimates of cetaceans in the Hawaiian EEZ. PIFSC Working Paper WP-13-004.
Bradford, A.L. and E. Lyman. 2013. Injury determinations for humpback whales and other cetaceans reported to the Hawaiian Islands Disentanglement and Pacific Islands Marine Mammal Response Networks during 2007-2011. PIFSC Working Paper WP-13-005.
Forney, K.A. 2009. Serious injury determinations for cetaceans caught in Hawaii longline fisheries during 1994-2008. Draft document PSRG-2008-16 presented to the Pacific Scientific Review Group, November 3-5, 2009, Del Mar, CA..
Kobayashi, D. R. and K. E. Kawamoto. 1995. Evaluation of shark, dolphin, and monk seal interactions with Northwestern Hawaiian Island bottomfishing activity: a comparison of two time periods and an estimate of economic impacts. Fisheries Research 23: 11-22.
Maldini, D., L. Mazzuca, and S. Atkinson. 2005. Odontocete stranding patterns in the Main Hawaiian Islands (1937-2002): How do they compare with live animal surveys? Pacific Science 59(1):55-67.
Martien, K.K., R.W. Baird, N.M. Hedrick, A.M. Gorgone, J.L. Thieleking, D.J. McSweeney, K. Robertson, and D.L. Webster. 2012, . In review. Population structure of island-associated dolphins: evidence from mitochondrial and microsatellite markers for common bottlenose dolphins (Tursiops truncatus) around the main Hawaiian Islands. Marine Mammal Science.28(3): E208-E332.
Martien, K.K., R.W. Baird 2009. A proposal for new stock boundaries for bottlenose dolphins in Hawaii. Document PSRG-13 presented to the Pacific Scientific Review Group, November 3-5, 2009. Available from Southwest Fisheries Science Center, National Marine Fisheries Service, 8604 La Jolla Shores Drive, La Jolla, CA 92037
McCracken M., and K.A. Forney. 2010. Preliminary assessment of incidental interactions with marine mammals in the Hawaii longline deep and shallow set fisheries. NMFS, Pacific Islands Fisheries Science Center Working Paper WP-10-001. 27p.
McCracken, M. 2013. Preliminary assessment of incidental interactions with marine mammals in the Hawaii longline deep and shallow set fisheries from 2007 to 2011. PIFSC Working Paper WP-13-XXX.
Miyashita, T. 1993. Abundance of dolphin stocks in the western North Pacific taken by the Japanese drive fishery. Rep. Int. Whal. Commn. 43:417-437.
Mobley, J. R. , Jr, S. S. Spitz, K. A. Forney, R. A. Grotefendt, and P. H. Forestall. 2000. Distribution and abundance of odontocete species in Hawaiian waters: preliminary results of 1993-98 aerial surveys Admin. Rep. LJ-00-14C. Southwest Fisheries Science Center, National Marine Fisheries Service, P.O. Box 271, La Jolla, CA 92038. 26 pp.
Nitta, E. 1991. The marine mammal stranding network for Hawaii: an overview. In: J.E. Reynolds III, D.K. Odell (eds.), Marine Mammal Strandings in the United States, pp.56-62. NOAA Tech. Rep. NMFS 98, 157 pp.
Nitta, E. and J. R. Henderson. 1993. A review of interactions between Hawaii's fisheries and protected species. Mar. Fish. Rev. 55(2):83-92.
NMFS, Pacific Islands Region, Observer Program, 1602 Kapiolani Blvd, Suite 1110, Honolulu, HI 96814. NMFS 2001. Western Pacific Pelagic Fisheries Biological Opinion. Available from Pacific Islands Region, 1602
Kapiolani Blvd, Suite 1110, Honolulu, HI 96814 (http://swr.nmfs.noaa.gov/pir). NMFS. 2005. Revisions to Guidelines for Assessing Marine Mammal Stocks. 24 pp. Available at:
http://www.nmfs.noaa.gov/pr/pdfs/sars/gamms2005.pdf NMFS. 2012. NOAA Fisheries Policy Directive 02-038-01 Process for Injury Determinations (01/27/12). Available
at: http://www.nmfs.noaa.gov/pr/pdfs/serious_injury_policy.pdf Perrin, W.F., G. P. Donovan and J. Barlow. 1994. Gillnets and Cetaceans. Rep. Int. Whal. Commn., Special Issue
15, 629 pp. Perrin, W.F., B. Würsig and J.G.M. Thewissen. 2009. Encyclopedia of Marine Mammals. Second Edition.
Academic Press, Amsterdam. Rizzuto, J. 2007. Big fish await HIBT teams. West Hawaii Today 39(218):1B, 4B-5B. Ross, G.J.B. and V. G. Cockcroft. 1990. Comments on Australian bottlenose dolphins and the taxonomic status of
Tursiops aduncus (Ehrenberg, 1832). In: The Bottlenose Dolphin (eds. S. Leatherwood and R. Reeves).
158
pp. 101-128. Academic Press, 653pp. Schlais, J.F. 1984. Thieving dolphins: A growing problem in Hawaii's fisheries. Sea Front. 30(5):293-298. Scott, M. D. and S. J. Chivers. 1990. Distribution and herd structure of bottlenose dolphins in the eastern tropical
Pacific Ocean. In: The Bottlenose Dolphin (eds. S. Leatherwood and R. Reeves). pp. 387-402. Academic Press, 653pp.
Shallenberger, E.W. 1981. The status of Hawaiian cetaceans. Final report to U.S. Marine Mammal Commission. MMC-77/23, 79pp.
Van Waerebeek, K., J. C. Reyes, A. J. Read, and J. S. McKinnon. 1990. Preliminary observations of bottlenose dolphins from the Pacific coast of South America. In: The Bottlenose Dolphin (eds. S. Leatherwood and R. Reeves). pp. 143-154. Academic Press, 653 pp.
Wade, P. R. and R. P. Angliss. 1997. Guidelines for Assessing Marine Mammal Stocks: Report of the GAMMS Workshop April 3-5, 1996, Seattle, Washington. U. S. Dep. Commer., NOAA Tech. Memo. NMFS-OPR-12. 93 pp.
Wade, P. R. and T. Gerrodette. 1993. Estimates of cetacean abundance and distribution in the eastern tropical Pacific. Rep. Int. Whal. Commn. 43:477-493.
159

Revised 1/15/2011 9/23/2013 PANTROPICAL SPOTTED DOLPHIN (Stenella attenuata attenuata): Hawaiian Islands Stock Complex – Oahu, 4-Islands, Hawaii Island, and
Hawaiian Pelagic Stocks STOCK DEFINITION AND GEOGRAPHIC RANGE Pantropical spotted dolphins are primarily found in tropical and subtropical waters worldwide (Perrin et al. 2009). Much of what is known about the species in the North Pacific has been learned from specimens obtained in the large directed fishery in Japan and in the eastern tropical Pacific (ETP) tuna purse-seine fishery (Perrin et al. 2009). These Spotted dolphins are common and abundant throughout the Hawaiian archipelago, particularly in channels between islands, over offshore banks (e.g. Penguin Banks), and off the lee shores of the islands (see Shallenberger 1981), including nearshore where they are the second most frequently sighted species during nearshore surveys (Baird et al 2013). Summer/fall shipboard surveys of the waters within the U.S. Exclusive Economic Zone (EEZ) of the Hawaiian Islands, resulted in 14 sightings in 2002 and 49 sightings in 2010 Recent sighting locations from a 2002 shipboard survey of waters within the U.S. Exclusive Economic Zone (EEZ) of the Hawaiian Islands are shown in Figure 1 (Barlow 2006, Bradford et al. 2013; Figure 1). TwelveFourteen strandings of this species have been documented in Hawaii since 1975 (Nitta 1991, Maldini et al. 2005, NMFS PIR Marine Mammal Response Network database), including two since 2007. Morphological differences and distribution patterns indicatehave been used to establish that the spotted dolphins around the Hawaiian Islands belong to a stock that is distinct from those in the ETP (Perrin 1975; Dizon et al. 1994; Perrin et al. 1994b). Their possible affinities with other stocks elsewhere in the Pacific have not been investigated. Fishery interactions with pantropical spotted dolphins demonstrate that this species also occurs in U.S. EEZ
Figure 1. Pantropical spotted dolphin sighting locations during the 2002 (open diamonds) and 2010 (black diamonds) shipboard surveys of U.S. EEZ waters surrounding the Hawaiian Islands (Barlow 2006, Bradford et al. 2013; see Appendix 2 for details on timing and location of survey effort). Outer line represents approximate boundary of survey area and U.S. EEZ. Gray shading indicates area of Papahanaumokuakea Marine National Monument. Dotted line represents the 1000m isobath. Insular stock boundaries are shown in Figure 2.
Figure 2. Main Hawaiian Islands insular spotted dolphin stock boundaries (gray lines). Oahu and 4-Islands stocks extend 20km from shore. Hawaii Island stock extends to 65km from shore based on distance of furthest encounter.
160

waters around Palmyra Island, but it is not known whether these animals are part of the Hawaiian stock or a separate stock of pantropical spotted dolphins. Based on patterns of movement and population structure observed in other island-associated cetaceans (Norris and Dohl 1980; Norris et al.1994; Baird et al. 2008a, 2008b, 2009, Chivers et al 2007, McSweeney et al. 2007, 2009), the animals around Palmyra Island may represent a separate stock. Efforts are currently underway to obtain additional tissue samples of pantropical spotted dolphins for further studies of population structure in the North Pacific Ocean. Pantropical spotted dolphins have been observed in all months of the year around the main Hawaiian Islands, and in areas ranging from shallow near-shore water to depths of 5,000 m, although they peak in sighting rates in depths from 1,500 to 3,500 m (Baird et al. 2013). Although they represent from 22.9 to 26.5% of the odontocete sightings from Oahu, the 4-islands, and Hawaii Island, they are largely absent from the nearshore waters around Kauai and Niihau, representing only 3.9% of sightings in that area (Baird et al. 2013). Genetic analyses of 176 unique samples of pantropical spotted dolphins collected during near-shore surveys off each of the main Hawaiian Islands from 2002 to 2003, and near Hawaii Island from 2005 through 2008 suggest three island-associated stocks are evident (Courbis 2011). The results of the Courbis (2011) study indicate that pantropical spotted dolphins in Hawaii’s nearshore waters have low haplotypic diversity with haplotypes unique to each of the island areas. Courbis (2011) conducted extensive tests on the relatedness of individuals among islands using the microsatellite dataset and found significant differences in haplotype frequencies between islands, suggesting genetic differentiation in spotted dolphins among islands. This suggestion is supported by the results of assignments tests, which indicate support for 3 island-associated populations: Hawaii Island, the 4-Islands region, and Oahu. Samples from Kauai and Niihau did not cluster together, but instead were spread among the Hawaii and Oahu clusters. Analysis of migration rate further support the separation of pantropical spotted dolphins into three island-associated stocks, with migration between regions on the order of a few individuals per generation. Based on an overview of all available information on pantropical spotted dolphins in Hawaiian waters, and NMFS guidelines for assessing marine mammal stocks (NMFS 2005), Oleson et al (2013) proposed designation of three new island associated stocks in Hawaiian waters, as well as recognition of a fourth broadly distributed spotted dolphin stock given the frequency of sightings in pelagic waters. Analysis of 177 genetic samples collected throughout the main Hawaiian Islands suggests that spotted dolphins are not mating randomly across the main Hawaiian Islands, and there is clustering of genotypes, into Hawaii, Oahu, and 4-islands area regions, suggesting that individual island-associated stocks may exist (Courbis et al., in prep.). Hawaiian spotted dolphins may be split into separate island-associated stocks pending the outcome of on-going genetic analysis of these samplesFishery interactions with pantropical spotted dolphins and sightings near Palmyra and Johnston Atolls (NMFS PIR unpublished data) demonstrate that this species also occurs in U.S. EEZ waters there, but it is not known whether these animals are part of the Hawaiian population or are a separate stock or stocks of pantropical spotted dolphins.
For the Marine Mammal Protection Act (MMPA) stock assessment reports, there is a single are four Pacific management stocks including animals found both within the Hawaiian Islands EEZ and in(Oleson et al. 2013): 1) the Oahu stock, which includes spotted dolphins within 20km of Oahu, 2) the 4-Island stock, which includes spotted dolphins within 20 km of Maui, Molokai, Lanai, and Kahoolawe collectively, 3) the Hawaii Island stock, which includes spotted dolphins found within 65km from Hawaii Island, and 4) the Hawaii pelagic stock, which includes spotted dolphins inhabiting the waters throughout the Hawaiian Islands EEZ, outside of the insular stock areas, but including adjacent international high seas waters. Because data on abundance, distribution, and human-caused impacts are largely lacking for international high seas waters, the status of the Hawaii pelagic is stock is evaluated based on data from U.S. EEZ waters of the Hawaiian Islands (NMFS 2005). Spotted dolphins involved in eastern tropical Pacific tuna purse-seine fisheries are managed separately under the MMPA. Information on pantropical spotted dolphins around Palmyra Island will provisionally be included with this stock assessment report, recognizing that separate stock status may be warranted for these animals in the future. Estimates of abundance, potential biological removals, and status determinations will be presented separately for U.S. EEZ waters of the Hawaiian Islands and Palmyra Island.
HUMAN-CAUSED MORTALITY AND SERIOUS INJURY New Serious Injury Guidelines NMFS updated its serious injury designation and reporting process, which uses guidance from previous serious injury workshops, expert opinion, and analysis of historic injury cases to develop new criteria for distinguishing serious from non-serious injury (Angliss and DeMaster 1998, Andersen et al. 2008, NMFS 2012). NMFS defines serious injury as an “injury that is more likely than not to result in mortality”. Injury determinations for stock assessments revised in 2013 or later incorporate the new serious injury guidelines, based on the most recent 5-year period for which data are available.
161

Fishery Information Information on fishery-related mortality
of cetaceans in Hawaiian waters is limited, but the gear types used in Hawaiian fisheries are responsible for marine mammal mortality and serious injury in other fisheries throughout U.S. waters. Entanglement in gillnets and hooking or entanglement in various hook and line fisheries have been reported for small cetaceans in Hawaii (Nitta & Henderson, 1993). No estimates of human-caused mortality or serious injury are currently available for nearshore hook and line or gillnet fisheries because these fisheries are not observed or monitored for protected species bycatch.
Commercial and recreational troll fisherman have been observed “fishing” dolphins off the islands of Hawaii, Lanai, and Oahu, including spotted dolphins, in order to catch tuna associated with the animals (Courbis et al. 2009, Rizzuto, 2007, Shallenberger 1981). Anecdotal reports from fisherman indicate that spotted dolphins are sometimes hooked (Rizzuto 1997) and photographs of dolphins suggest animals may be injured by both lines and propeller strikes (Baird unpublished data). In 2010 a spotted dolphin (4-Islands stock) was observed entangled in fishing line off Lanai. There were several wraps of line around the body and peduncle and a constricting wrap around the dorsal fin (Bradford & Lyman 2013). Based on the information provided this entanglement is considered a serious injury under the under the most Table 1. Summary of available information on incidental mortality and serious injury of pantropical spotted dolphins (Hawaii pelagic stock) in commercial fisheries, within and outside of the U.S. EEZs (McCracken 2013). Mean annual takes are based on 2007-2011data unless otherwise indicated. Information on all observed takes (T) and combined mortality events & serious injuries (MSI) is included. Total takes were prorated to deaths, serious injuries, and non-serious injuries based on the observed proportions of each outcome.
Fishery Name Year Data Type
Percent Observer Coverage
Observed total interactions (T) and mortality events, and serious injuries (MSI), and total estimated mortality and serious injury (M&SI) of Hawaii
pelagic pantropical spotted dolphins Outside U.S. EEZs Hawaiian EEZ
Obs. T/MSI Estimated
M&SI (CV) Obs. T/MSI Estimated
M&SI (CV)
Hawaii-based deep-set longline
fishery
2007
Observer data
20% 0 0 (-) 0 0 (-) 2008 22% 1/1 3 (0.5) 0 0 (-) 2009 21% 0 0 (-) 0 0 (-) 2010 21% 0 0 (-) 0 0 (-) 2011 20% 0 0 (-) 0 0 (-)
Mean Estimated Annual Take (CV) 0.2 (1.1) 0 (-)
Hawaii-based shallow-set
longline fishery
2007
Observer data
100% 0 0 0 0 2008 100% 0 0 0 0 2009 100% 0 0 0 0 2010 100% 0 0 0 0 2011 100% 0 0 0 0
Mean Annual Takes (100% coverage) 0 0 Minimum total annual takes within U.S. EEZ 0 (-)
Figure 23. Locations of observed spotted dolphin takes (filled diamonds) in the Hawaii deep-set longline fishery, 2007-20112004-2008. Solid lines represent the U.S. EEZ. Set locations in this fishery are summarized in Appendix 1.
162

recently developed criteria for assessing serious injury in marine mammals (NMFS 2012). The responsible fishery is not known.
There are currently two distinct longline fisheries based in Hawaii: a deep-set longline (DSLL) fishery that targets primarily tunas, and a shallow-set longline fishery (SSLL) that targets swordfish. Both fisheries operate within U.S. waters and on the high seas. Between 2007 and 2011, no pantropical spotted dolphin were observed hooked or entangled in the SSLL fishery (100% observer coverage), and one pantropical spotted dolphin was observed incidentally killed in high seas waters in the DSLL fishery (20-22% observer coverage) (Bradford & Forney 2013, McCracken 2013) (Figure 3). Average5-yr estimates of annual mortality and serious injury for 2007-2011 are 0.2 (CV = 1.1) spotted dolphins outside of U.S. EEZs, and none within the Hawaiian Islands EEZ (Table 1, McCracken 2013). Eight additional unidentified cetaceans were taken in the DSLL fishery, and two unidentified cetaceans were taken in the SSLL fishery, some of which may have been spotted dolphins. OAHU STOCK POPULATION SIZE The population size of the Oahu stock of spotted dolphins has not been estimated. An extensive photo-identification catalog is available for developing mark-recapture estimates, but no such analyses have yet been conducted. Minimum Population Estimate There is no information on which to base a minimum population estimate of the Oahu stock of spotted dolphins. Current Population Trend No data are available on current population trend. CURRENT AND MAXIMUM NET PRODUCTIVITY RATES No data are available on current or maximum net productivity rate. POTENTIAL BIOLOGICAL REMOVAL
The potential biological removal (PBR) level for the Oahu stock is calculated as the minimum population estimate times one half the default maximum net growth rate for cetaceans (½ of 4%) times a recovery factor of 0.50 (for a species of unknown status with no estimated fishery mortality or serious injury within the Oahu stock area; Wade and Angliss 1997). Because there is no minimum population estimate available the PBR for Oahu stock of spotted dolphins is undetermined. STATUS OF STOCK The Oahu stock of spotted dolphins is not considered a strategic stock under the MMPA. The status of Oahu spotted dolphins relative to OSP is unknown, and there are insufficient data to evaluate trends in abundance for this stock. Spotted dolphins are not listed as “threatened” or “endangered” under the Endangered Species Act (1973), nor designated as “depleted” under the MMPA. There is no information with which to determine whether the total fishery mortality and serious injury for this stock is insignificant and approaching zero mortality and serious injury rate. 4-ISLANDS STOCK POPULATION SIZE The population size of 4-Islands stock of spotted dolphins has not been estimated. An extensive photo-identification catalog is available for developing mark-recapture estimates, but no such analyses have yet been conducted. Minimum Population Estimate There is no information on which to base a minimum population estimate of the 4-Islands stock of spotted dolphins. Current Population Trend No data are available on current population trend.
163

CURRENT AND MAXIMUM NET PRODUCTIVITY RATES No data are available on current or maximum net productivity rate. POTENTIAL BIOLOGICAL REMOVAL
The potential biological removal (PBR) level for the 4-Islands stock is calculated as the minimum population estimate times one half the default maximum net growth rate for cetaceans (½ of 4%) times a recovery factor of 0.50 (for a species of unknown status with no estimated fishery mortality or serious injury within the 4-Islands stock area; Wade and Angliss 1997). Because there is no minimum population estimate available for this stock the PBR for 4-Islands stock of spotted dolphins is undetermined. STATUS OF STOCK The 4-Islands stock of spotted dolphins is not considered a strategic stock under the MMPA. The status of 4-Islands spotted dolphins relative to OSP is unknown, and there are insufficient data to evaluate trends in abundance for this stock. Spotted dolphins are not listed as “threatened” or “endangered” under the Endangered Species Act (1973), nor designated as “depleted” under the MMPA. Although one dolphin has been considered seriously injured due to an interaction with fishing gear, there is insufficient data are available to determine whether the total fishery mortality and serious injury for this stock is insignificant and approaching zero mortality and serious injury rate. HAWAII ISLAND STOCK POPULATION SIZE The population size of the Hawaii Island stock of spotted dolphins has not been estimated. An extensive photo-identification catalog is available for developing mark-recapture estimates, but no such analyses have yet been conducted. Minimum Population Estimate There is no information on which to base a minimum population estimate of the Hawaii Island stock of spotted dolphins. Current Population Trend No data are available on current population trend. CURRENT AND MAXIMUM NET PRODUCTIVITY RATES No data are available on current or maximum net productivity rate. POTENTIAL BIOLOGICAL REMOVAL
The potential biological removal (PBR) level for the Hawaii Island stock is calculated as the minimum population estimate times one half the default maximum net growth rate for cetaceans (½ of 4%) times a recovery factor of 0.50 (for a species of unknown status with no estimated fishery mortality or serious injury within the Hawaii Island stock area; Wade and Angliss 1997). Because there is no minimum population estimate available for this stock the PBR for Hawaii Island stock of spotted dolphins is undetermined. STATUS OF STOCK The Hawaii Island stock of spotted dolphins is not considered a strategic stock under the MMPA. The status of Hawaii Island spotted dolphins relative to OSP is unknown, and there are insufficient data to evaluate trends in abundance for this stock. Spotted dolphins are not listed as “threatened” or “endangered” under the Endangered Species Act (1973), nor designated as “depleted” under the MMPA. There is insufficient data are available to determine whether the total fishery mortality and serious injury for this stock is insignificant and approaching zero mortality and serious injury rate. One spotted dolphin found stranded on Hawaii Island has tested positive for Morbillivirus (Jacob 2012). Although morbillivus is known to trigger lethal disease in cetaceans (Van Bressem et al. 2009), its impact on the health of the stranded animal is not known as its was found in only a few tested tissues (Jacob 2012). The presence of morbillivirus in 10 species of cetacean in Hawaiian waters (Jacob 2012) raises concerns about the history and prevalence of this disease in Hawaii and the potential population impacts on Hawaiian cetaceans.
164

HAWAII PELAGIC STOCK POPULATION SIZE Population estimates are available for Japanese waters (Miyashita 1993) and the eastern tropical Pacific (Wade and Gerrodette 1993), but it is not known whether any of these animals are part of the same population that occurs around the Hawaiian Islands. A 2002 shipboard line-transect survey of the entire Hawaiian Islands EEZ resulted in an abundance estimate of 8,978 (CV=0.48) pantropical spotted dolphins (Barlow 2006). The recent 2010 shipboard line-transect survey of the Hawaiian Islands EEZ resulted in an abundance estimate of 15,917 (CV = 0.40) spotted dolphins within the pelagic stock area (Bradford et al 2013). This is currently the best available abundance estimate for pantropical spotted dolphins within the Hawaiian Islands EEZ. No abundance estimates are currently available for pantropical spotted dolphins in U.S. EEZ waters of Palmyra Island; however, density estimates for pantropical spotted dolphins in other Pacific regions can provide a range of likely abundance estimates in this unsurveyed region. Published estimates of pantropical spotted dolphins (animals per km2) in the Pacific are: 0.0040 (CV=0.48) for the U.S. EEZ of the Hawaiian Islands (Barlow 2006); 0.0407 (CV=0.45) for nearshore waters surrounding the main Hawaiian Islands (Mobley et al. 2000), 0.0678 (CV=0.15) and 0.1064 (CV=0.09) for the eastern tropical Pacific Ocean (Wade and Gerrodette 1993; Ferguson and Barlow 2003), and 0.0731 (CV=0.33) for the eastern tropical Pacific Ocean west of 120°W and north of 5°N (Ferguson and Barlow 2003). Applying the lowest and highest of these density estimates to U.S. EEZ waters surrounding Palmyra Island (area size = 352,821 km2) yields a range of plausible abundance estimates of 1,414 - 37,525 pantropical spotted dolphins. Minimum Population Estimate The minimum population size is calculated as the lower 20th percentile of the log-normal distribution (Barlow et al 1995) The log-normal 20th percentile of the 2002 2010 abundance estimate for the pelagic stock areaHawaiian Islands EEZ (Barlow 2006) is 6,701 or 11,508 pantropical spotted dolphins. No minimum population estimate is currently available for waters surrounding Palmyra Island, but the pantropical spotted dolphin density estimates from other Pacific regions (Barlow 2006, Mobley et al. 2000, Wade and Gerrodette 1993, Ferguson and Barlow 2003; see above) can provide a range of likely values. The lognormal 20th percentiles of plausible abundance estimates for the Palmyra Island EEZ, based on the densities observed elsewhere, range from 964 - 34,792 pantropical spotted dolphins. Current Population Trend The broad and overlapping confidence intervals around the 2002 and 2010 abundance estimates preclude assessment of trend with the available data. No data are available on current population trend. CURRENT AND MAXIMUM NET PRODUCTIVITY RATES No data are available on current or maximum net productivity rate. POTENTIAL BIOLOGICAL REMOVAL The potential biological removal (PBR) level for the Hawaiian pelagic pantropical spotted dolphin stock is calculated as the minimum population estimate size within the U.S. EEZ of the Hawaiian Islands (11,508 6,701) times one half the default maximum net growth rate for cetaceans (½ of 4%) times a recovery factor of 0.50 (for a species of unknown status with no known fishery mortality within the U.S. EEZ of the Hawaiian Islands; Wade and Angliss 1997), resulting in a PBR of 61 115 pantropical spotted dolphins per year. No separate PBR can presently be calculated for pantropical spotted dolphins within the Palmyra Island EEZ, but based on the range of plausible minimum abundance estimates (964 - 34,792), a recovery factor of 0.50 (for a species of unknown status with no documented mortality and serious injury within the Palmyra Islands EEZ during the past five years; Wade and Angliss 1997), and the default growth rate (½ of 4%), the PBR would likely fall between 9.6 and 347 pantropical spotted dolphins per year. HUMAN-CAUSED MORTALITY AND SERIOUS INJURY Fishery Information Information on fishery-related mortality of cetaceans in Hawaiian waters is limited, but the gear types used in Hawaiian fisheries are responsible for marine mammal mortality and serious injury in other fisheries throughout U.S. waters. Gillnets appear to capture marine mammals wherever they are used, and float lines from lobster traps and longlines can be expected to occasionally entangle cetaceans (Perrin et al. 1994a). Interactions with cetaceans have been reported for all Hawaiian pelagic fisheries (Nitta and Henderson 1993). There are currently two distinct
165

longline fisheries based in Hawaii: a deep-set longline (DSLL) fishery that targets primarily tunas, and a shallow-set longline fishery (SSLL) that targets swordfish. Both fisheries operate within U.S. waters and on the high seas. Between 2004 and 2008, no pantropical spotted dolphins were observed hooked or entangled in the SSLL fishery (100% observer coverage), and one pantropical spotted dolphin was observed incidentally killed in international waters in the DSLL fishery (20-28% observer coverage) (Forney 2009, McCracken 2009) (Figure 2). Average 5-yr estimates of annual mortality and serious injury for 2004-2008 are 0.5 (CV=0.7) spotted dolphins outside of U.S. EEZs, and none within the Hawaiian Islands EEZ (Table 1, McCracken & Forney 2010). Commercial and recreational troll fisherman have been observed “fishing” dolphins off the island of Hawaii, including spotted dolphins, in order to catch tuna associated with the animals (Courbis et al. 2009, Rizzuto, 2007, Shallenberger 1981). Anecdotal reports from fisherman indicate that spotted dolphins are occasionally hooked (Rizzuto 1997) and photographs of dolphins suggest animals may be injured by both lines and propeller strikes (Barid unpublished data). Interaction rates between dolphins and the NWHI bottomfish fishery have been estimated based on studies conducted in 1990-1993, indicating that an average of 2.67 dolphin interactions, most likely involving bottlenose and rough-toothed dolphins, occurred for every 1000 fish brought on board (Kobayashi and Kawamoto 1995). Fishermen claim interactions with dolphins that steal bait and catch are increasing. It is not known whether these interactions result in serious injury or mortality of dolphins, nor whether pantropical spotted dolphins are involved. STATUS OF STOCK
The Hawaii pelagic stock of spotted dolphins is not considered strategic under the 1994 amendments to the MMPA. The status of Hawaii pelagic pantropical spotted dolphins in Hawaiian waters relative to OSP is unknown, and there are insufficient data to evaluate trends in abundance. No habitat issues are known to be of concern for this species. Pantropical spotted dolphins It isare not listed as “threatened” or “endangered” under the Endangered Species Act (1973), nor designated as “depleted” under the MMPA. Given the absence of recent recorded fishery-related mortality or serious injuries within U.S. EEZs, the Hawaiian stock of spotted dolphins is not considered strategic under the 1994 amendments to the MMPA. , and the total fishery mortality and serious injury can be considered to be insignificant and approaching zero. However, the potential effect of injuries sustained by pantropical spotted dolphins in U.S. pelagic longline fisheries in international waters is not known, because no abundance estimates or international bycatch estimates are available. Table 1. Summary of available information on incidental mortality and serious injury of pantropical spotted dolphins (Hawaiian stock) in commercial fisheries, within and outside of the U.S. EEZs (McCracken & Forney 2010). Mean annual takes are based on 2004-2008 data unless otherwise indicated. Observed and estimated mortality and serious injury of pantropical spotted dolphins,
by EEZ region Outside of U.S. EEZs Hawaiian Islands EEZ
Fishery Name Year Data Type
Percent Observer Coverage
Obs Estimated (CV)
Mean Annual Takes (CV)
Obs Estimated (CV)
Mean Annual Takes (CV)
Hawaii-based deep-set longline
fishery
2004 2005 2006 2007 2008
observer data
25% 28% 22% 20% 22%
0 0 0 0 1
0 (-) 0 (-) 0 (-) 0 (-)
2 (0.3)
0.5 (0.7)
0 0 0 0 0
0 (-) 0 (-) 0 (-) 0 (-) 0 (-)
0 (-)
Hawaii-based shallow-set
longline fishery
2004 2005 2006 2007 2008
observer data
100% 100% 100% 100% 100%
0 0 0 0 0
Same as observed
0 0 0 0 0
0 0 0 0 0
Same as observed 0
Minimum total annual takes within U.S. EEZ waters 0 (-)
REFERENCES Andersen, M. S., K. A. Forney, T. V. N. Cole, T. Eagle, R. Angliss, K. Long, L. Barre, L. Van Atta, D. Borggaard,
T. Rowles, B. Norberg, J. Whaley, and L. Engleby. 2008. Differentiating Serious and Non-Serious Injury of Marine Mammals: Report of the Serious Injury Technical Workshop, 10-13 September 2007, Seattle, Washington. U.S. Dep. Commer., NOAA Tech. Memo. NMFS-OPR-39. 94 p.
166

Angliss, R.P. and D.P. DeMaster. 1998. Differentiating Serious and Non-Serious Injury of Marine Mammals Taken Incidental to Commercial Fishing Operations. NOAA Tech Memo. NMFS-OPR-13, 48 p.
Baird, R. W., Ligon, A. D., Hooker, S. K., and A. M. Gorgone. 2001. Subsurface and nighttime behaviour of pantropical spotted dolphins in Hawai’i. Can. J. Zool. 79:988-996.
Baird, R.W., A.M. Gorgone, D.J. McSweeney, D.L. Webster, D.R. Salden, M.H. Deakos, A.D. Ligon, G.S. Schorr, J. Barlow and S.D. Mahaffy. 2008a. False killer whales (Pseudorca crassidens) around the main Hawaiian Islands: long-term site fidelity, inter-island movements, and association patterns. Marine Mammal Science 24:591-612.
Baird, R.W., D.L. Webster, S.D. Mahaffy, D.J. McSweeney, G.S. Schorr and A.D. Ligon. 2008b. Site fidelity and association patterns in a deep-water dolphin: rough-toothed dolphins (Steno bredanensis) in the Hawaiian Archipelago. Marine Mammal Science 24:535-553.
Baird, R.W., A.M. Gorgone, D.J. McSweeney, A.D. Ligon, M.H. Deakos, D.L. Webster, G.S. Schorr, K.K. Martien, D.R. Salden, and S.D. Mahaffy. 2009. Population structure of island-associated dolphins: evidence from photo-identification of common bottlenose dolphins (Tursiops truncatus) in the main Hawaiian Islands. Marine Mammal Science 25:251-274.
Baird, R.W., D.L. Webster, J.M. Aschettino, G.S. Schorr and D.J. McSweeney. 2013. Odontocete cetaceans around the main Hawaiian Islands: habitat use and relative abundance from small-boat sighting surveys. Aquatic Mammals, in press
Barlow, J., S.L. Swartz, T.C. Eagle, and P.R. Wade. 1995. U.S. Marine Mammal Stock Assessments: Guidelines for Preparation, Background, and a Summary of the 1995 Assessments. U.S. Dep. Commer., NOAA Tech. Memo. NMFS-OPR-6, 73 p.
Barlow, J. 2006. Cetacean abundance in Hawaiian waters estimated from a summer/fall survey in 2002. Marine Mammal Science 22(2): 446-464.
Bradford, A.L. and K.A. Forney. 2013. Injury determinations for cetaceans observed interacting with Hawaii and American Samoa longline fisheries during 2007-2011. PIFSC Working Paper WP-13-002.
Bradford. A.L., K.A. Forney, E.M. Oleson, and J. Barlow. 2013. Line-transect abundance estimates of cetaceans in the Hawaiian EEZ. PIFSC Working Paper WP-13-004.
Bradford, A.L. and E. Lyman. 2013. Injury determinations for humpback whales and other cetaceans reported to the Hawaiian Islands Disentanglement and Pacific Islands Marine Mammal Response Networks during 2007-2011. PIFSC Working Paper WP-13-005.
Courbis, S, R.W. Baird, F. Cipriano, D. Duffield. In prep. Population Structure of Pantropical Spotted Dolphins Near the Main Hawaiian Islands: Evidence of Multiple Genetic Stocks for Management.
Courbis S., Baird RW, Cipriano F, Duffield D. 2009. Population structure of pantropical spotted dolphins near the main Hawaiian Islands: Evidence of multiple genetic stocks. In: Biennial Conference on the Biology of Marine Mammals. Society for Marine Mammalogy, Quebec City, Quebec Canada. Oct 11-16, 2009.
Courbis, S. 2011. Population structure of island-associated pantropical spotted dolphins (Stenella attenuata) in Hawaiian waters. Ph.D. Dissertation, Portland State University.
Chivers, S. J., R. W. Baird, D. J. McSweeney, D. L. Webster, N. M. Hedrick, and J. C. Salinas. 2007. Genetic variation and evidence for population structure in eastern North Pacific false killer whales (Pseudorca crassidens). Can. J. Zool. 85: 783-794.
Dizon, A. E., W. F. Perrin, and P. A. Akin. 1994. Stocks of dolphins (Stenella spp. and Delphinus delphis) in the eastern tropical Pacific: a phylogeographic classification. NOAA Tech. Rep. NMFS 119, 20 pp.
Ferguson, M. C. and J. Barlow. 2003. Addendum: Spatial distribution and density of cetaceans in the eastern tropical Pacific Ocean based on summer/fall research vessel surveys in 1986-96. Administrative Report LJ-01-04 (addendum), Southwest Fisheries Science Center, National Marine Fisheries Service, 8604 La Jolla Shores Drive, La Jolla, CA 92037.
Forney, K.A. 2009. Serious injury determinations for cetaceans caught in Hawaii longline fisheries during 1994-2008. Draft document PSRG-2009-09 presented to the Pacific Scientific Review Group, November 3-5, 2009, Del Mar, CA.
Jacob, J. M. 2012. Screening and characterization of morbillivirus in Hawaiian cetaceans. M.S. Marine Science Thesis. Hawaii Pacific University, Kaneohe, HI, USA
Kobayashi, D. R. and K. E. Kawamoto. 1995. Evaluation of shark, dolphin, and monk seal interactions with Northwestern Hawaiian Island bottomfishing activity: a comparison of two time periods and an estimate of economic impacts. Fisheries Research 23: 11-22.
Maldini, D., L. Mazzuca, and S. Atkinson. 2005. Odontocete stranding patterns in the Main Hawaiian Islands (1937-2002): How do they compare with live animal surveys? Pacific Science 59(1):55-67.
167

McCracken M. and K.A. Forney 2010. Preliminary assessment of incidental interactions with marine mammals in the Hawaii longline deep and shallow set fisheries. NMFS, Pacific Islands Fisheries Science Center Working Paper WP-10-001. 27p.
McCracken, M. 2013. Preliminary assessment of incidental interactions with marine mammals in the Hawaii longline deep and shallow set fisheries from 2007 to 2011. PIFSC Working Paper WP-13-XXX.
McSweeney, D.J., R.W. Baird and S.D. Mahaffy. 2007. Site fidelity, associations and movements of Cuvier’s (Ziphius cavirostris) and Blainville’s (Mesoplodon densirostris) beaked whales off the island of Hawai‘i. Marine Mammal Science 23:666-687.
McSweeney, D.J., R.W. Baird, S.D.Mahaffy, D.L. Webster, and G.S. Schorr. 2009. Site fidelity and association patterns of a rare species: Pygmy killer whales (Feresa attenuata) in the main Hawaiian Islands. Marine Mammal Science 25(4): 557-572.
Miyashita, T. 1993. Abundance of dolphin stocks in the western North Pacific taken by the Japanese drive fishery. Rep. Int. Whal. Commn. 43:417-437.
Mobley, J. R., Jr, S. S. Spitz, K. A. Forney, R. A. Grotefendt, and P. H. Forestall. 2000. Distribution and abundance of odontocete species in Hawaiian waters: preliminary results of 1993-98 aerial surveys Admin. Rep. LJ-00-14C. Southwest Fisheries Science Center, National Marine Fisheries Service, P.O. Box 271, La Jolla, CA 92038. 26 pp.
Nitta, E. 1991. The marine mammal stranding network for Hawaii: an overview. In: J.E. Reynolds III, D.K. Odell (eds.), Marine Mammal Strandings in the United States, pp.56-62. NOAA Tech. Rep. NMFS 98, 157 pp.
Nitta, E. and J. R. Henderson. 1993. A review of interactions between Hawaii's fisheries and protected species. Mar. Fish. Rev. 55(2):83-92.
NMFS. 2005. Revisions to Guidelines for Assessing Marine Mammal Stocks. 24 pp. Available at: Error! Bookmark not defined.
NMFS. 2012. Federal Register 77:3233. National Policy for Distinguishing Serious From Non-Serious Injuries of Marine Mammals. http://www.nmfs.noaa.gov/op/pds/documents/02/238/02-238-01.pdf
Norris, K. S., B. Würsig, R. S. Wells, and M. Würsig. 1994. The Hawaiian Spinner Dolphin. University of California Press, 408 pp.
Norris, K. S. and T. P. Dohl. 1980. Behavior of the Hawaiian spinner dolphin, Stenella longirostris. Fish. Bull. 77:821-849.
Oleson, E.M., R.W. Baird, K.K. Martien, and B.L. Taylor. 2013. Island-associated stocks of odontocetes in the main Hawaiian Islands: A synthesis of available information to facilitate evaluation of stock structure. PIFSC Working Paper WP-13-003.
Perrin, W. F. 1975. Variation of spotted and spinner porpoise (genus Stenella) in the eastern tropical Pacific and Hawaii. Bull. Scripps Inst. Oceanogr. 21, 206 pp.
Perrin, W.F., G. P. Donovan and J. Barlow. 1994a. Gillnets and Cetaceans. Rep. Int. Whal. Commn., Special Issue 15, 629 pp.
Perrin, W. F., G. D. Schnell, D. J. Hough, J. W. Gilpatrick, Jr., and J. V. Kashiwada. 1994b. Re-examination of geographical variation in cranial morphology of the pantropical spotted dolphin, Stenella attenuata, in the eastern Pacific. Fish. Bull. 92:324-346.
Perrin, W.F., B. Würsig and J.G.M. Thewissen. 2009. Encyclopedia of Marine Mammals. Second Edition. Academic Press, Amsterdam.
Rizzuto, J. 2007. Big fish await HIBT teams. West Hawaii Today 39(218):1B, 4B-5B. Shallenberger, E.W. 1981. The status of Hawaiian cetaceans. Final report to U.S. Marine Mammal Commission.
MMC-77/23, 79pp. Van Bressem, M., J.A. Raga, G. Di Guardo, D.P. Jepson, P. J. Duignan, U. Siebert, T. Barrett, M. C. de Oliveira
Santos, I.B. Moreno, S. Siciliano, A. Aguilar, K. Van Waerebeer. 2009. Emerging infectious diseases in cetaceans worldwide and the possible role of environmental stressors. Diseases of Aquatic Organisms. 85:143-157.
Wade, P. R. and R. P. Angliss. 1997. Guidelines for Assessing Marine Mammal Stocks: Report of the GAMMS Workshop April 3-5, 1996, Seattle, Washington. U. S. Dep. Commer., NOAA Tech. Memo. NMFS-OPR-12. 93 pp.
Wade, P. R. and T. Gerrodette. 1993. Estimates of cetacean abundance and distribution in the eastern tropical Pacific. Rep. Int. Whal. Commn. 43:477-493.
168

Revised 01/15/2011 9/23/2013 STRIPED DOLPHIN (Stenella coeruleoalba):
Hawaiian Stock STOCK DEFINITION AND GEOGRAPHIC RANGE Striped dolphins are found in tropical to warm-temperate waters throughout the world (Perrin et al. 2009). They have been documented in the Hawaiian Islands from 2034 strandings since 1958 (Nitta 1991, Maldini et al. 2005, NMFS PIR Marine Mammal Response Network database), including 8 since 2007. , although sSightings have historically been infrequent in nearshore waters (Shallenberger 1981, Mobley et al. 2000). Summer/fall shipboard surveys of the waters within the U.S. Exclusive Economic Zone (EEZ) of the Hawaiian Islands, resulted in A comprehensive shipboard survey of the Hawaiian Exclusive Economic Zone (EEZ), resulted in 15 sightings of striped dolphins in 2002 and 29 in 2010 (Figure 1; Barlow 2006, Bradford et al 2013). Striped dolphins have been intensively exploited in the western North Pacific, where three migratory stocks are provisionally recognized (Kishiro and Kasuya 1993). In the eastern tropical Pacific all striped dolphins are provisionally considered to belong to a single stock (Dizon et al. 1994). For the Marine Mammal Protection Act (MMPA) stock assessment reports, striped dolphins within the Pacific U.S. EEZ are divided into two discrete, non-contiguous areas: 1) waters off California, Oregon and Washington, and 2) waters around Hawaii (this report), including animals found both within the Hawaiian Islands EEZ and in adjacent high seasinternational waters. Because data on abundance, distribution, and human-caused impacts are largely lacking for high seasinternational waters, the status of the Hawaiian stock all stocks is evaluated based on data from U.S. EEZ waters of the Hawaiian Islands (NMFS 2005). Striped dolphins involved in eastern tropical Pacific tuna purse-seine fisheries are managed separately under the MMPA. POPULATION SIZE Population estimates are available for Japanese waters (Miyashita 1993) and the eastern tropical Pacific (Wade and Gerrodette 1993), but it is not known whether any of these animals are part of the same population that occurs around the Hawaiian Islands. A 2002 shipboard line-transect survey of the entire Hawaiian Islands EEZ resulted in an abundance estimate of 13,143 (CV=0.46) striped dolphins (Barlow 2006). The recent 2010 shipboard line-transect survey of the Hawaiian Islands EEZ resulted in an abundance estimate of 20,650 CV = 0.36)striped dolphins (Bradford et al 2013). This is currently the best available abundance estimate for this stock. Minimum Population Estimate The minimum population size is calculated as the lower 20th percentile of the log-normal distribution (Barlow et al 1995) The log-normal 20th percentile of the 2002 2010 abundance estimate, (Barlow 2006) is 9,088 or 15,391 striped dolphins. Current Population Trend The broad and overlapping confidence intervals around the 2002 and 2010 estimates preclude assessment of trends with the available data.
Figure 1. Striped dolphin sighting locations during the 2002 (open diamonds) and 2010 (black diamonds) shipboard surveys of U.S. EEZ waters surrounding the Hawaiian Islands (Barlow 2006, Bradford et al 2013; see Appendix 2 for details on timing and location of survey effort). Outer line represents approximate boundary of survey area and U.S. EEZ. Gray shading indicates area of Papahanaumokuakea Marine National Monument.
169

No data are available on current population trend. CURRENT AND MAXIMUM NET PRODUCTIVITY RATES No data are available on current or maximum net productivity rate. POTENTIAL BIOLOGICAL REMOVAL The potential biological removal (PBR) level for the Hawaii stock of striped dolphins this stock is calculated as the minimum population size within the U.S. EEZ of the Hawaiian Islands (15,391)(9,088) times one half the default maximum net growth rate for cetaceans (½ of 4%) times a recovery factor of 0.45 0.5 (for a stock of unknown status with no known a Hawaiian Islands EEZ fishery mortality and serious injury within the Hawaiian Islands EEZ rate CV between 0.60 and 0.80; Wade and Angliss 1997), resulting in a PBR of 154 82 striped dolphins per year. HUMAN-CAUSED MORTALITY AND SERIOUS INJURY New Serious Injury Guidelines NMFS updated its serious injury designation and reporting process, which uses guidance from previous serious injury workshops, expert opinion, and analysis of historic injury cases to develop new criteria for distinguishing serious from non-serious injury (Angliss and DeMaster 1998, Andersen et al. 2008, NMFS 2012). NMFS defines serious injury as an “injury that is more likely than not to result in mortality”. Injury determinations for stock assessments revised in 2013 or later incorporate the new serious injury guidelines, based on the most recent 5-year period for which data are available. Fishery Information Information on fishery-related mortality and serious injury of cetaceans in Hawaiian waters is limited, but the gear types used in Hawaiian fisheries are responsible for marine mammal mortality and serious injury in other fisheries throughout U.S. waters. Gillnets appear to capture marine mammals wherever they are used, and float lines from lobster traps and longlines can be expected to occasionally entangle cetaceans (Perrin et al. 1994). Entanglement in gillnets and hooking or entanglement in various hook and line fisheries have been reported for small cetaceans in Hawaii (Nitta & Henderson, 1993). One striped dolphin stranded entangled in fishing gear in 2005, but the responsible fishery cannot be determined, as the entangled gear was not described (NMFS PIR MMRN). No estimates of human-caused mortality or serious injury are currently available for nearshore hook and line or gillnet fisheries because these fisheries are not observed or monitored for protected species bycatch. Interactions with cetaceans have been reported for all Hawaiian pelagic fisheries (Nitta and Henderson 1993). There are currently two distinct longline fisheries based in Hawaii: a deep-set longline (DSLL) fishery that targets primarily tunas, and a shallow-set longline fishery (SSLL) that targets swordfish. Both fisheries operate within U.S. waters and on the high seas. Between 2007 and 20112004 and 2008, one striped dolphin was killed and two seriously injured on the high seas in the SSLL fishery (100% observer coverage), and one striped dolphin was killed
Figure 2. Locations of striped dolphin takes (filled diamonds) in Hawaii-based longline fisheries, 2007-2011 Solid lines represent the U.S. EEZs. Fishery descriptions are provided in Appendix 1.
170

on the high seas within the Hawaiian Islands EEZ in the DSLL fishery (20-2822% observer coverage) (Figure 2, Forney 2009, McCracken & Forney 2010Bradford & Forney 2013, McCracken 2013). Average 5-yr estimates of annual mortality and serious injury for 2007-20112004-2008 are 1.4 (CV = 0.9)zero dolphins outside of U.S. EEZs, and zero0.9 (CV=0.6) within the Hawaiian Islands EEZ (Table 1). Eight unidentified cetaceans were taken in the DSLL fishery, and two unidentified cetaceans were taken in the SSLL fishery, some of which may have been striped dolphins. Interaction rates between dolphins and the NWHI bottomfish fishery have been estimated based on studies conducted in 1990-1993, indicating that an average of 2.67 dolphin interactions, most likely involving bottlenose and rough-toothed dolphins, occurred for every 1000 fish brought on board (Kobayashi and Kawamoto 1995). Fishermen claim interactions with dolphins that steal bait and catch are increasing. It is not known whether these interactions result in serious injury or mortality of dolphins, nor whether striped dolphins are involved. STATUS OF STOCK The Hawaii stock of striped dolphins is not considered strategic under the 1994 amendments to the MMPA. The status of striped dolphins in Hawaiian waters relative to OSP is unknown, and there are insufficient data to evaluate trends in abundance. .No habitat issues are known to be of concern for this species. Striped dolphinsIt isare not listed as “threatened” or “endangered” under the Endangered Species Act (1973), nor designated as “depleted” under the MMPA. Given the absence of recent recorded fishery-related mortality or serious injuries in U.S. EEZ waters, The Hawaiian stock of striped dolphins is not considered strategic under the 1994 amendments to the MMPA, because the estimated rate of fisheries related mortality and serious injury within the Hawaiian Islands EEZ (0.9 animals per year) is less than the PBR (82). Ttotal fishery mortality and serious injury for striped dolphins can be considered insignificant and approaching zero., because the average annual takes are less than 10% of the PBR. One striped dolphin stranded in the main Hawaiian Islands tested positive for Brucella (Chernov, 2010) and another for Morbillivirus (Jacob 2012). Brucella is a bacterial infection that if common in the population may limit recruitment by compromising male and female reproductive systems, and can also cause neurological disorders that may result in death (Van Bressem et al. 2009). Although morbillivus is known to trigger lethal disease in cetaceans (Van Bressem et al. 2009), its impact on the health of the stranded animal is not known as it was found in only a few tested tissues (Jacob 2012). The presence of Morbillivirus in 10 species (Jacob 2012) and Brucella in 3 species (Cherbov 2010, West unpublished data) raises concerns about the history and prevalence of these diseases in Hawaii and the potential population impacts on Hawaiian cetaceans. It is not known if Brucella or Morbillivirus are common in the Hawaii stock Table 1. Summary of available information on incidental mortality and serious injury of striped dolphin (Hawaii stock) in commercial fisheries, within and outside of U.S. EEZs (McCracken & Forney 2010). Mean annual takes are based on 2007-20112004-2008 data unless otherwise indicated. Information on all observed takes (T) and combined mortality events & serious injuries (MSI) is included. Total takes were prorated to deaths, serious injuries, and non-serious injuries based on the observed proportions of each outcome.
Fishery Name Year Data Type
Percent Observer Coverage
Observed total interactions (T) and mortality events, and serious injuries (MSI), and total estimated mortality and serious injury (M&SI) of striped
dolphins Outside U.S. EEZs Hawaiian EEZ
Obs. T/MSI Estimated
M&SI (CV) Obs. T/MSI Estimated
M&SI (CV)
Hawaii-based deep-set longline
fishery
2007
Observer data
20% 0 0 (-) 0 0 (-) 2008 22% 0 0 (-) 0 0 (-) 2009 21% 0 0 (-) 0 0 (-) 2010 21% 0 0 (-) 0 0 (-) 2011 20% 1/1 4 (1.5) 0 0 (-)
Mean Estimated Annual Take (CV) 0.8 (0.9) 0 (-)
Hawaii-based shallow-set
longline fishery
2007
Observer data
100% 0 0 0 0 2008 100% 1/1 1 0 0 2009 100% 0 0 0 0 2010 100% 2/2 2 0 0 2011 100% 0 0 0 0
Mean Annual Takes (100% coverage) 0.6 0 Minimum total annual takes within U.S. EEZ 0 (-)
171

Fishery Name Year Data Type
Percent Observer Coverage
Mortality and Serious Injury outside of U.S. EEZ
Mortality and Serious Injury within Hawaiian Islands EEZ
Observed Estimated Mean Annual Takes (CV) Observed Estimated
(CV) Mean Annual Takes (CV)
Hawaii-based deep-set longline fishery
2004 2005 2006 2007 2008
observer data
25% 28% 22% 20% 22%
0 0 0 0 0
0 (-) 0 (-) 0 (-) 0 (-) 0 (-)
0 (-)
0 0 1 0 0
0 (-) 0 (-)
5 (0.3) 0 (-) 0 (-)
0.9 (0.6)
Hawaii-based shallow-set longline fishery
2004 2005 2006 2007 2008
observer data
100% 100% 100% 100% 100%
0 0 0 0 1
Same as observed
0.2
0 0 0 0 0
0 0 0 0 0
0
Minimum total annual takes within U.S. EEZ waters 0.9 (0.6) REFERENCES Anderson, M.S., K.A. Forney, T.V.N. Cole, T. Eagle, R.P. Angliss, K. Long, L. Barre, L. VanAtta, D. Borggaard, T.
Rowles, B. Norberg, J. Whaley, L. Engleby. Differentiating serious and non-serious injury of marine mammals: Report of the Serious Injury Technical Workshop 10-13 September 2007, Seattle, WA. NOAA Tech Memo NMFS-OPR-39, 94 p.
Angliss, R.P. and D.P. DeMaster. 1997. Differentiating serious and non-serious injury of marine mammals taken incidental to commercial fishing operations: Report of the Serious Injury Workshop 1-2 April. 1997, Silver Spring, MD. NOAA Tech Memo NMFS-OPR-13, 48 pBarlow, J., S.L. Swartz, T.C. Eagle, and P.R. Wade. 1995. U.S. Marine Mammal Stock Assessments: Guidelines for Preparation, Background, and a Summary of the 1995 Assessments. U.S. Dep. Commer., NOAA Tech. Memo. NMFS-OPR-6, 73 p.
Barlow, J. 2006. Cetacean abundance in Hawaiian waters estimated from a summer/fall survey in 2002. Marine Mammal Science 22(2): 446-464.
Bradford, A.L. and K.A. Forney. 2013. Injury determinations for cetaceans observed interacting with Hawaii and American Samoa longline fisheries during 2007-2011. PIFSC Working Paper WP-13-002.
Bradford. A.L., K.A. Forney, E.M. Oleson, and J. Barlow. 2013. Line-transect abundance estimates of cetaceans in the Hawaiian EEZ. PIFSC Working Paper WP-13-004.
Chernov, A. E. (2010) The identification of Brucella ceti from Hawaiian cetaceans M.S. Marine Science Thesis. Hawaii Pacific University, Kaneohe, HI, USA
Dizon, A. E., W. F. Perrin, and P. A. Akin. 1994. Stocks of dolphins (Stenella spp. and Delphinus delphis) in the eastern tropical Pacific: a phylogeographic classification. NOAA Tech. Rep. NMFS 119, 20 pp.
Forney, K.A. 2009. Serious injury determinations for cetaceans caught in Hawaii longline fisheries during 1994-2008. Draft document PSRG-2009-09 presented to the Pacific Scientific Review Group, November 3-5, 2009, Del Mar, CA.
Jacob, J. M. 2012. Screening and characterization of morbillivirus in Hawaiian cetaceans. M.S. Marine Science Thesis. Hawaii Pacific University, Kaneohe, HI,
Kishiro, T. and T. Kasuya. 1993. Review of Japanese dolphin drive fisheries and their status. Rep. Int. Whal. Commn. 43:439-452.
Kobayashi, D. R. and K. E. Kawamoto. 1995. Evaluation of shark, dolphin, and monk seal interactions with Northwestern Hawaiian Island bottomfishing activity: a comparison of two time periods and an estimate of economic impacts. Fisheries Research 23: 11-22.
McCracken, M. 2013. Preliminary assessment of incidental interactions with marine mammals in the Hawaii longline deep and shallow set fisheries from 2007 to 2011. PIFSC Working Paper WP-13-XXX.
McCracken M. and K.A. Forney 2010. Preliminary assessment of incidental interactions with marine mammals in the Hawaii longline deep and shallow set fisheries. NMFS, Pacific Islands Fisheries Science Center Working Paper WP-10-001. 27p.
Maldini, D., L. Mazzuca, and S. Atkinson. 2005. Odontocete stranding patterns in the Main Hawaiian Islands (1937-2002): How do they compare with live animal surveys? Pacific Science 59(1):55-67.
Miyashita, T. 1993. Abundance of dolphin stocks in the western North Pacific taken by the Japanese drive fishery. Rep. Int. Whal. Commn. 43:417-437.
172

Mobley, J. R. , Jr, S. S. Spitz, K. A. Forney, R. A. Grotefendt, and P. H. Forestall. 2000. Distribution and abundance of odontocete species in Hawaiian waters: preliminary results of 1993-98 aerial surveys Admin. Rep. LJ-00-14C. Southwest Fisheries Science Center, National Marine Fisheries Service, P.O. Box 271, La Jolla, CA 92038. 26 pp.
Nitta, E. 1991. The marine mammal stranding network for Hawaii: an overview. In: J.E. Reynolds III, D.K. Odell (eds.), Marine Mammal Strandings in the United States, pp.56-62. NOAA Tech. Rep. NMFS 98, 157 pp.
Nitta, E. and J. R. Henderson. 1993. A review of interactions between Hawaii's fisheries and protected species. Mar. Fish. Rev. 55(2):83-92.
NMFS. 2005. Revisions to Guidelines for Assessing Marine Mammal Stocks. 24 pp. Available at: http://www.nmfs.noaa.gov/pr/pdfs/sars/gamms2005.pdf
NMFS. 2012. NOAA Fisheries Policy Directive 02-038-01 Process for Injury Determinations (01/27/12). Available at: http://www.nmfs.noaa.gov/pr/pdfs/serious_injury_policy.pdf
Perrin, W.F., G. P. Donovan and J. Barlow. 1994. Gillnets and Cetaceans. Rep. Int. Whal. Commn., Special Issue 15, 629 pp.
Perrin, W.F., B. Würsig and J.G.M. Thewissen. 2009. Encyclopedia of Marine Mammals. Second Edition. Academic Press, Amsterdam.
Shallenberger, E.W. 1981. The status of Hawaiian cetaceans. Final report to U.S. Marine Mammal Commission. MMC-77/23, 79pp.
Van Bressem, M., J.A. Raga, G. Di Guardo, D.P. Jepson, P. J. Duignan, U. Siebert, T. Barrett, M. C. de Oliveira Santos, I.B. Moreno, S. Siciliano, A. Aguilar, K. Van Waerebeer. 2009. Emerging infectious diseases in cetaceans worldwide and the possible role of environmental stressors. Diseases of Aquatic Organisms. 85:143-157.
Wade, P. R. and R. P. Angliss. 1997. Guidelines for Assessing Marine Mammal Stocks: Report of the GAMMS Workshop April 3-5, 1996, Seattle, Washington. U. S. Dep. Commer., NOAA Tech. Memo. NMFS-OPR-12. 93 pp.
Wade, P. R. and T. Gerrodette. 1993. Estimates of cetacean abundance and distribution in the eastern tropical Pacific. Rep. Int. Whal. Commn. 43:477-493.
173

Revised 01/15/2011 9/23/2013
FRASER'S DOLPHIN (Lagenodelphis hosei): Hawaiian Stock
STOCK DEFINITION AND GEOGRAPHIC RANGE Fraser’s dolphins are distributed worldwide in tropical waters (Dolar 2009 in Perrin et al. 2009). They have only recently been documented within the U.S. Exclusive Economic Zone (EEZ) of the Hawaiian Islands, during a 2002 cetacean survey (Barlow 2006), and were seen 4 times during a similar 2010 survey (Bradford et al 2013, Figure 1). One No strandings of Fraser’s dolphins was have been documented in 1994 in the Hawaiian Islands (Nitta 1991; Maldini et al. 2005NMFS PIR Marine Mammal Response Network)., though there is one sighting off the island of Hawaii from April 2008 (Baird unpublished).
For the Marine Mammal Protection Act (MMPA) stock assessment reports, there is a single Pacific management stock including animals found both within the Hawaiian Islands EEZ and in adjacent international high seas waters. Because data on abundance, distribution, and human-caused impacts are largely lacking for international high seas waters, the status of this stock is evaluated based on data from U.S. EEZ waters of the Hawaiian Islands (NMFS 2005). POPULATION SIZE Population estimates for Fraser’s dolphins have been made in the eastern tropical Pacific (Wade and Gerrodette 1993), but it is not known whether these animals are part of the same population that occurs around the Hawaiian Islands and in the central North Pacific. A 2002 shipboard line-transect survey of the entire Hawaiian Islands EEZ resulted in an abundance estimate of 10,226 (CV=1.16) Fraser’s dolphins (Barlow 2006). The recent 2010 shipboard line-transect survey of the Hawaiian Islands EEZ resulted in an abundance estimate of 16,992 (CV = 0.66) Fraser’s dolphins (Bradford et al 2013) This is currently the best available abundance estimate for this stock. Minimum Population Estimate The minimum population size is calculated as the lower 20th percentile of the log-normal distribution (Barlow et al 1995) The log-normal 20th percentile of the 2002 2010 abundance estimate (Barlow 2006) is 4,700 or 10,241 Fraser’s dolphins. Current Population Trend No data are available on current population trend. The broad and overlapping confidence intervals around the 2002 and 2010 estimates preclude assessment of trend with the available data. CURRENT AND MAXIMUM NET PRODUCTIVITY RATES No data are available on current or maximum net productivity rate for the Hawaiian stock of Fraser’s dolphin. POTENTIAL BIOLOGICAL REMOVAL
Figure 1. Fraser’s dolphin sighting locations during the 2002 (open diamonds) and 2010 (black diamonds) shipboard cetacean surveys of U.S. waters surrounding the Hawaiian Islands (Barlow 2006, Bradford et al 2013; see Appendix 2 for details on timing and location of survey effort). Outer line indicates approximate boundary of survey area and U.S. EEZ. Gray shading indicates area of Papahanaumokuakea Marine National Monument. Dotted line represents the 1000m isobath.
174

The potential biological removal (PBR) level for the Hawaii is stock of Fraser’s dolphin is calculated as the minimum population size within the U.S. EEZ of the Hawaiian Islands (10,241) (4,700) times one half the default maximum net growth rate for cetaceans (½ of 4%) times a recovery factor of 0.50 (for a stock of unknown status with no known fishery mortality or serious injury within the Hawaiian Islands EEZ; Wade and Angliss 1997), resulting in a PBR of 102 47 Fraser’s dolphins per year. HUMAN CAUSED MORTALITY AND SERIOUS INJURY Fishery Information Information on fishery-related mortality and serious injury of cetaceans in Hawaiian waters is limited, but the gear types used in Hawaiian fisheries are responsible for marine mammal mortality and serious injury in other fisheries throughout U.S. waters. Entanglement in gillnets and hooking or entanglement in various hook and line fisheries have been reported for small cetaceans in Hawaii (Nitta & Henderson, 1993). No interactions between nearshore fisheries and Fraser’s dolphins have been reported in Hawaiian waters. Gillnets appear to capture marine mammals wherever they are used, and float lines from lobster traps and longlines can be expected to occasionally entangle cetaceans (Perrin et al. 1994). Interactions with cetaceans have been reported for all Hawaiian pelagic fisheries (Nitta and Henderson 1993), but none of these interactions are known to have involved Fraser’s dolphins.
There are currently two distinct longline fisheries based in Hawaii: a deep-set longline (DSLL) fishery that targets primarily tunas, and a shallow-set longline fishery (SSLL) that targets swordfish. Both fisheries operate within U.S. waters and on the high seas. Between 2007 and 20112004 and 2008, no Fraser’s dolphins were observed hooked or entangled in the SSLL fishery (100% observer coverage) or the DSLL fishery (20-2822% observer coverage) (McCracken 2013, Bradford & Forney 2013& Forney 2010). However, eight unidentified cetaceans were taken in the DSLL fishery, and two unidentified cetaceans were taken in the SSLL fishery, some of which may have been Fraser’s dolphins. Interaction rates between dolphins and the NWHI bottomfish fishery have been estimated based on studies conducted in 1990-1993, indicating that an average of 2.67 dolphin interactions, most likely involving bottlenose and rough-toothed dolphins, occurred for every 1000 fish brought on board (Kobayashi and Kawamoto 1995). Fishermen claim interactions with dolphins that steal bait and catch are increasing. It is not known whether these interactions result in serious injury or mortality of dolphins, nor whether Fraser’s dolphins are involved. STATUS OF STOCK The status of Fraser's dolphins in Hawaiian waters relative to OSP is unknown, and there are insufficient data to evaluate trends in abundance. No habitat issues are known to be of concern for this species. Fraser’s dolphins are It is not listed as “threatened” or “endangered” under the Endangered Species Act (1973), nor as “depleted” under the MMPA. Given the absence of recent fishery-related mortality or serious injuries, the Hawaiian stock of Fraser’s dolphins is not considered strategic under the 1994 amendments to the MMPA, and the total fishery mortality and serious injury can be considered to be insignificant and approaching zero. REFERENCES Barlow, J., S.L. Swartz, T.C. Eagle, and P.R. Wade. 1995. U.S. Marine Mammal Stock Assessments: Guidelines for
Preparation, Background, and a Summary of the 1995 Assessments. U.S. Dep. Commer., NOAA Tech. Memo. NMFS-OPR-6, 73 p.
Barlow, J. 2006. Cetacean abundance in Hawaiian waters estimated from a summer/fall survey in 2002. Marine Mammal Science 22(2): 446-464.
Bradford, A.L. and K.A. Forney. 2013. Injury determinations for cetaceans observed interacting with Hawaii and American Samoa longline fisheries during 2007-2011. PIFSC Working Paper WP-13-002.
Bradford. A.L., K.A. Forney, E.M. Oleson, and J. Barlow. 2013. Line-transect abundance estimates of cetaceans in the Hawaiian EEZ. PIFSC Working Paper WP-13-004.
Forney, K.A. 2009. Serious injury determinations for cetaceans caught in Hawaii longline fisheries during 1994-2008. Draft document PSRG-2009-09 presented to the Pacific Scientific Review Group, November 3-5, 2009, Del Mar, CA.
Kobayashi, D. R. and K. E. Kawamoto. 1995. Evaluation of shark, dolphin, and monk seal interactions with Northwestern Hawaiian Island bottomfishing activity: a comparison of two time periods and an estimate of economic impacts. Fisheries Research 23: 11-22.
Maldini, D., L. Mazzuca, and S. Atkinson. 2005. Odontocete stranding patterns in the Main Hawaiian Islands (1937-2002): How do they compare with live animal surveys? Pacific Science 59(1):55-67.
McCracken, M. 2013. Preliminary assessment of incidental interactions with marine mammals in the Hawaii
175

longline deep and shallow set fisheries from 2007 to 2011. PIFSC Working Paper WP-13-XXX. McCracken M., and K.A. Forney. 2010. Preliminary assessment of incidental interactions with marine mammals in
the Hawaii longline deep and shallow set fisheries. NMFS, Pacific Islands Fisheries Science Center Working Paper WP-10-001. 27p
Nitta, E. 1991. The marine mammal stranding network for Hawaii: an overview. In: J.E. Reynolds III, D.K. Odell (eds.), Marine Mammal Strandings in the United States, pp.56-62. NOAA Tech. Rep. NMFS 98, 157 pp.
Nitta, E. and J. R. Henderson. 1993. A review of interactions between Hawaii's fisheries and protected species. Mar. Fish. Rev. 55(2):83-92.
NMFS. 2005. Revisions to Guidelines for Assessing Marine Mammal Stocks. 24 pp. Available at: http://www.nmfs.noaa.gov/pr/pdfs/sars/gamms2005.pdf
Perrin, W.F., G. P. Donovan and J. Barlow. 1994. Gillnets and Cetaceans. Rep. Int. Whal. Commn., Special Issue 15, 629 pp.
Perrin, W.F., B. Würsig and J.G.M. Thewissen. 2009. Encyclopedia of Marine Mammals. Second Edition. Academic Press, Amsterdam.
Wade, P. R. and R. P. Angliss. 1997. Guidelines for Assessing Marine Mammal Stocks: Report of the GAMMS Workshop April 3-5, 1996, Seattle, Washington. U. S. Dept. Commer., NOAA Tech. Memo. NMFS-OPR-12. 93 pp.
Wade, P. R. and T. Gerrodette. 1993. Estimates of cetacean abundance and distribution in the eastern tropical Pacific. Rep. Int. Whal. Commn. 43:477-493.
176

Revised 01/15/2011 9/23/2013 MELON-HEADED WHALE (Peponocephala electra):
Hawaiian Islands Stock Complex: Hawaiian Islands & Kohala Resident Stocks
STOCK DEFINITION AND GEOGRAPHIC RANGE Melon-headed whales are found in tropical and warm-temperate waters throughout the world. The distribution of reported sightings suggests that the oceanic habitat of this species is primarily equatorial waters (Perryman et al. 1994). Small numbers have been taken in the tuna purse-seine fishery in the eastern tropical Pacific, and they are occasionally killed in direct fisheries in Japan and elsewhere in the western Pacific. Large herds are seen regularly in Hawaiian waters, especially off the Waianae coast of Oahu, the north Kohala coast of Hawaii, and the leeward coast of Lanai (Shallenberger 1981). Summer/fall shipboard surveys of the waters within the U.S. Exclusive Economic Zone (EEZ) of the Hawaiian Islands during 2002 and 2010, resulted in A comprehensive shipboard survey of the Hawaiian Exclusive Economic Zone (EEZ), resulted in only one sighting each year of melon-headed whales (Figure 1; Barlow 2006, Bradford et al 2013). Inter-island movements from Kauai to Hawaii have been documented and genetic samples from at least 82 animals are available for future stock structure analyses (R.W. Baird, pers. comm.). Little is known about this species elsewhere in its range, and most knowledge about its biology comes from mass strandings (Perryman et al. 1994). Twenty Fourteen strandings are known from Hawaii between 1983 and 2011 (Nishiwaki and Norris 1966; Shallenberger 1981; Nitta 1991; Maldini et al. 2005, NMFS-PIR Marine Mammal Response Network database), 5 since 2007. Photo-identification and telemetry studies suggest there are two demographically-independent populations of melon-headed whales in Hawaiian waters, the Hawaiian Islands stock and the Kohala resident stock . Resighting data and social network analyses of photographed individuals indicate very low rates of interchange between these populations (0.0009/yr) (Aschettino et al 2012). This finding is supported by preliminary genetic analyses that suggest restricted gene flow between the Kohala residents and other melon-headed whales sampled in Hawaiian waters (Oleson et al 2013). Some individuals in each population have been seen repeatedly for more than a decade, implying high site-fidelity for both populations. Individuals in the larger Hawaiian Islands stock have been resighted throughout the main Hawaiian Islands. Satellite telemetry data revealed distant offshore movements, nearly to the edge of the U.S. EEZ around the Hawaiian Islands (Figure 2), with apparent foraging near cold and warm-core eddies (Woodworth et al 2012). Individuals in the smaller Kohala resident stock have a range restricted to shallower waters of the Kohala shelf and west side of Hawaii Island (Aschettino et al 2012, Schorr et al. unpublished data). Satellite telemetry data indicate they occur in waters less than 2500m depth around the northwest and west shores of Hawaii Island, west of 1560 45’ W and north of 190 15’N (Oleson et al 2013). The northern boundary between the two stocks provisionally runs through the Alenuihaha Channel between Hawaii Island and Maui, bisecting the distance between the 1000m depth contours (Oleson et al 2013).
Figure 1. Melon-headed whale sighting location during the 2002 (open diamond) and 2010 (black diamond) shipboard surveys of U.S. EEZ waters surrounding the Hawaiian Islands (Barlow 2006, Bradford et al 2013; see Appendix 2 for details on timing and location of survey effort). Outer line represents approximate boundary of survey area and U.S. EEZ. Gray shading indicates area of Papahanaumokuakea Marine National Monument. Dotted line represents the 1000m isobath.
177

For the Marine Mammal Protection Act (MMPA) stock assessment reports, there are two is a single Pacific management stocks including animals found both within the Hawaiian Islands EEZ and in (Oleson et al 2013): 1) the Kohala resident stock, which includes melon-headed whales off the Kohala Peninsula and west coast of Hawaii Island and in less than 2500m of water, and 2) the Hawaiian Islands stock, which includes melon-headed whales inhabiting waters throughout the U.S. EEZ of the Hawaiian Islands, including the area of the Kohala resident stock, and adjacent international high seas waters. At this time, assignment of individual melon-headed whales within the overlap area to either stock requires photographic-identification of the animal. Because data on abundance, distribution, and human-caused impacts are largely lacking for international high seas waters, the status of the Hawaiian Islands this stock is evaluated based on data from U.S. EEZ waters of the Hawaiian Islands (NMFS 2005). HUMAN-CAUSED MORTALITY AND SERIOUS INJURY New Serious Injury Guidelines NMFS updated its serious injury designation and reporting process, which uses guidance from previous serious injury workshops, expert opinion, and analysis of historic injury cases to develop new criteria for distinguishing serious from non-serious injury (Angliss and DeMaster 1998, Andersen et al. 2008, NOAA 2012). NMFS defines serious injury as an “injury that is more likely than not to result in mortality”. Injury determinations for stock assessments revised in 2013 or later incorporate the new serious injury guidelines, based on the most recent 5-year period for which data are available. Fishery Information Information on fishery-related mortality and serious injury of cetaceans in U.S. EEZ of the Hawaiian Islands waters is limited, but the gear types used in Hawaii fisheries are responsible for marine mammal mortality and serious injury in other fisheries throughout U.S. waters. Entanglement in gillnets and hooking or entanglement in various hook and line fisheries have been reported for small cetaceans in Hawaii (Nitta & Henderson, 1993). No interactions between nearshore fisheries and melon-headed whales have been reported in Hawaiian waters. No estimates of human-caused mortality or serious injury are currently available for nearshore hook and line or gillnet fisheries because these fisheries are not observed or monitored for protected species bycatch. There are currently two distinct longline fisheries based in Hawaii: a deep-set longline (DSLL) fishery that targets primarily tunas, and a shallow-set longline fishery (SSLL) that targets swordfish. Both fisheries operate
Figure 2. Sighting locations of melon-headed whales identified as being part of the Kohala resident stock (crosses) and telemetry records of Kohala resident (dark gray triangles) and Hawaiian Islands (light gray squares) melon-headed whale stocks (Schorr et al, unpublished data). The dotted line around waters adjacent to the northwest and west shores of Hawaii Island represents the provisional stock boundary for the Kohala resident stock (Oleson et al 2013). The Kohala resident stock and the Hawaiian Islands stocks overlap throughout the range of the Kohala resident stock. Outer line represents U.S. EEZ. Gray shading indicates area of Papahanaumokuakea Marine National Monument.
178

within U.S. waters and on the high seas. Between 2007 and 2011, no melon-headed whales were observed hooked or entangled in the SSLL fishery (100% observer coverage) or the DSLL fishery (20-22% observer coverage) (Bradford & Forney 2013, McCracken 2013). However, eight unidentified cetaceans were taken in the DSLL fishery, and two unidentified cetaceans were taken in the SSLL fishery, some of which may have been melon-headed whales. Other Mortality In recent years, there has been increasing concern that loud underwater sounds, such as active sonar and seismic operations, may be harmful to beaked whales (Cox et al. 2006) and other cetaceans, including melon-headed whales (Southall et al. 2006) and pygmy killer whales (Feresa attenuata) (Wang and Yang 2006). The use of active sonar from military vessels has been implicated in mass strandings of beaked whales and recent mass-stranding reports suggest some delphinids may be impacted as well. A 2004 mass-stranding of 150-200 melon-headed whales in Hanalei Bay, Kauai occurred during a multi-national sonar training event around Hawaii (Southall et al. 2006). Although data limitations regarding the position of the whales prior to their arrival in the Bay, the magnitude of sonar exposure, behavioral responses of melon-headed whales to acoustic stimuli, and other possible relevant factors preclude a conclusive finding regarding the role of Navy sonar in triggering this event, sonar transmissions were considered a plausible cause of the mass stranding based on the spatiotemporal link between the sonar exercises and the stranding, the direction of movement of the transmitting vessels near Hanalei Bay, and propagation modeling suggesting the sonar transmissions would have been audible at the mouth of Hanalei Bay (Southall et al 2006; Brownell et al. 2009). Additional research on the behavioral response of delphinids in the presence of sonar transmissions is needed in order to understand the level of impact. No estimates of potential mortality or serious injury are available for U.S. waters. KOHALA RESIDENT STOCK POPULATION SIZE
Using the photo-ID catalog of individuals encountered between 2002 and 2009, Achettino (2010) used a POPAN open-population model to produce a mark-recapture abundance estimate of 447 (CV=0.12) individuals. A portion of the data used in that analysis is more than 8 years old; however, full sighting histories were required to produce a valid model for mark-recapture analyses, such that an estimate restricted to only the later years of the period is not available. Although this estimate includes individuals that have died since 2002, it is currently the best available abundance estimate for the resident stock. Minimum Population Estimate
The minimum population size is calculated as the lower 20th percentile of the log-normal distribution (Barlow et al 1995) around the 2002-2009 mark-recapture abundance estimate (Aschettino 2010), or 404 melon-headed whales in the Kohala resident stock. Current Population Trend
Photographic mark-recapture data will be evaluated in the future to assess whether sufficient data exists to assess trends. CURRENT AND MAXIMUM NET PRODUCTIVITY RATES No data are available on current or maximum net productivity rate. POTENTIAL BIOLOGICAL REMOVAL The potential biological removal (PBR) level for this stock is calculated as the minimum population estimate (404) times one half the default maximum net growth rate for cetaceans (½ of 4%) times a recovery factor of 0.50 (for a species of unknown status with no known fishery mortality; Wade and Angliss 1997), resulting in a PBR of 4.0 Kohala resident melon-headed whales per year. STATUS OF STOCK The Kohala resident stock of melon-headed whales is not considered strategic under the MMPA. The status of this stock relative to OSP is unknown, and there are insufficient data to evaluate trends in abundance. Melon-headed whales are not listed as “threatened” or “endangered” under the Endangered Species Act (1973), nor designated as “depleted” under the MMPA. Given the absence of recent recorded fishery-related mortality or serious injuries, the total fishery mortality and serious injury can be considered to be insignificant and approaching
179
zero. The very restricted range and small population size of Hawaii Island resident melon-headed whales suggests this population may be at risk due to its proximity to U.S. Navy training, including sonar transmissions, in the Alenuihaha Channel between Hawaii Island and Maui (Anonymous 2006). Although a 2004 mass-stranding in Hanalei Bay, Kauai could not be conclusively linked to Naval training events in the region (Southall et al 2006), the spatiotemporal link between sonar exercises and the stranding does raise concern on the potential impact on the Hawaii Island resident population due to of sonar training nearby. HAWAIIAN ISLANDS STOCK POPULATION SIZE An abundance estimate of melon-headed whales is available for the eastern tropical Pacific (Wade and Gerrodette 1993), but it is not known whether any of these animals are part of the same population that occurs around the Hawaiian Islands. A 2002 shipboard line-transect survey of the entire Hawaiian Islands EEZ resulted in an abundance estimate of 2,950 (CV=1.17) melon-headed whales (Barlow 2006). The recent 2010 shipboard line-transect survey of the Hawaiian Islands EEZ resulted in an abundance estimate of 2,860 (CV = 1.04) melon-headed whales (Bradford et al 2013). Using the photo-ID catalog of individuals encountered between 2002 and 2009 near the main Hawaiian Islands, Achettino (2010) used a POPAN open-population model to produce a mark-recapture abundance estimate of 5,794 (CV=0.20) individuals. A portion of the data used in that analysis is more than 8 years old; however, full sighting histories were required to produce a valid model for mark-recapture analyses, such that an estimate restricted to only the later years of the period is not available. This is Although this estimate includes individuals that have died since 2002, the mark-recapture estimate is currently the best available abundance estimate for the Hawaiian Islands is stock given the significantly larger dataset used to produce the estimate versus a single line-transect encounter. Minimum Population Estimate The minimum population size is calculated as the lower 20th percentile of the log-normal distribution (Barlow et al 1995) of the 2002-2009 mark-recapture abundance estimate (Aschettino 2010) or 4,904 melon-headed whales in the Hawaii pelagic stock. This log-normal 20th percentile minimum population size is greater than the number of photo-identified individuals within the population (820) (Aschettino et al 2012) and greater than the log-normal 20th percentile line-transect estimate (1,326) (Bradford et al 2013). The log-normal 20th percentile of the 2002 abundance estimate (Barlow 2006) is 1,350 melon-headed whales in the Hawaiian Islands EEZ. Current Population Trend No trend analyses have been conducted on Hawaiian Islands melon-headed whales from line-transect surveys because only two estimates exist. Photographic mark-recapture data will be evaluated in the future to assess whether sufficient data exists to assess trends. data are available on current population trend. CURRENT AND MAXIMUM NET PRODUCTIVITY RATES No data are available on current or maximum net productivity rate. POTENTIAL BIOLOGICAL REMOVAL The potential biological removal (PBR) level for this stock is calculated as the minimum population estimate for size within the U.S. EEZ of the Hawaiian Islands (4,904 1,350) times one half the default maximum net growth rate for cetaceans (½ of 4%) times a recovery factor of 0.50 (for a species of unknown status with no known fishery mortality; Wade and Angliss 1997), resulting in a PBR of 14 49 melon-headed whales per year. HUMAN-CAUSED MORTALITY AND SERIOUS INJURY Fishery Information Information on fishery-related mortality and serious injury of cetaceans in Hawaiian waters is limited, but the gear types used in Hawaiian fisheries are responsible for marine mammal mortality and serious injury in other fisheries throughout U.S. waters. Gillnets appear to capture marine mammals wherever they are used, and float lines from lobster traps and longlines can be expected to occasionally entangle cetaceans (Perrin et al. 1994). Interactions with cetaceans have been reported for all Hawaiian pelagic fisheries (Nitta and Henderson 1993), but no interactions with melon-headed whales have been documented. There are currently two distinct longline fisheries based in Hawaii: a deep-set longline (DSLL) fishery that targets primarily tunas, and a shallow-set longline fishery (SSLL) that targets swordfish. Both fisheries operate within U.S. waters and on the high seas. Between 2004 and 2008, no melon-headed whales were observed hooked or entangled in the SSLL fishery (100%
180
observer coverage) or the DSLL fishery (20-28% observer coverage) (McCracken & Forney 2010). Interaction rates between dolphins and the NWHI bottomfish fishery have been estimated based on studies conducted in 1990-1993, indicating that an average of 2.67 dolphin interactions, most likely involving bottlenose and rough-toothed dolphins, occurred for every 1000 fish brought on board (Kobayashi and Kawamoto 1995). Fishermen claim interactions with dolphins that steal bait and catch are increasing. It is not known whether these interactions result in serious injury or mortality of dolphins, nor whether melon-headed whales are involved. Other Mortality In recent years, there has been increasing concern that loud underwater sounds, such as active sonar and seismic operations, may be harmful to beaked whales (Cox et al. 2006) and other cetaceans, including melon-headed whales (Southall et al. 2006) and pygmy killer whales (Feresa attenuata) (Wang and Yang 2006). The use of active sonar from military vessels has been implicated in mass strandings of beaked whales and recent mass-stranding reports suggest some delphinids may be impacted as well. A 2004 mass-stranding of melon-headed whales in Hanalei Bay, Kauai occurred during a multi-national sonar training event around Hawaii (Southall et al. 2006). Although data limitations preclude a conclusive finding regarding the role of Navy sonar in triggering this event, sonar transmissions were considered a plausible, if not likely cause of the mass stranding based on the spatiotemporal link between the sonar exercises and the stranding, the direction of movement of the transmitting vessels near Hanalei Bay, and propagation modeling suggesting the sonar transmissions would have been audible at the mouth of Hanalei Bay (Southall et al 2006; Brownell et al. 2009). Additional research on the behavioral response of delphinids in the presence of sonar transmissions is needed in order to understand the level of impact. No estimates of potential mortality or serious injury are available for U.S. waters. STATUS OF STOCK The Hawaiian Islands stock of melon-headed whales is not considered strategic under the 1994 amendments to the MMPA. The status of this stockmelon-headed whales in Hawaiian waters relative to OSP is unknown, and there are insufficient data to evaluate trends in abundance. No habitat issues are known to be of concern for this species. It Melon-headed whales are is not listed as “threatened” or “endangered” under the Endangered Species Act (1973), nor designated as “depleted” under the MMPA. Given the absence of recent recorded fishery-related mortality or serious injuries, the Hawaiian Islands stock of melon-headed whales is not considered strategic under the 1994 amendments to the MMPA, and the total fishery mortality and serious injury can be considered to be insignificant and approaching zero. A 2004 mass-stranding of melon-headed whales in Hanalei Bay, Kauai occurred during a multi-national sonar training event around Hawaii (Southall et al. 2006). Although the event could not be conclusively linked to Naval training events in the region (Southall et al 2006), the spatiotemporal link between sonar exercises and the stranding does raise concern on the potential impact on the Hawaiian Islands population due to its frequent use of nearshore areas within the main Hawaiian Islands. REFERENCES Anderson, M.S., K.A. Forney, T.V.N. Cole, T. Eagle, R.P. Angliss, K. Long, L. Barre, L. VanAtta, D. Borggaard, T.
Rowles, B. Norberg, J. Whaley, L. Engleby. Differentiating serious and non-serious injury of marine mammals: Report of the Serious Injury Technical Workshop 10-13 September 2007, Seattle, WA. NOAA Tech Memo NMFS-OPR-39, 94 p.
Angliss, R.P. and D.P. DeMaster. 1997. Differentiating serious and non-serious injury of marine mammals taken incidental to commercial fishing operations: Report of the Serious Injury Workshop 1-2 April. 1997, Silver Spring, MD. NOAA Tech Memo NMFS-OPR-13, 48 p.
Anonymous. 2006. Supplement to the 2002 Rim of the Pacific (RIMPAC) Programmatic Environmental Assessment. Available at http://www.nmfs.noaa.gov/pr/pdfs/ permits/rimpac_ea.pdf (accessed August 2006).
Aschettino, J.M. 2010. Population size and structure of melon-headed whales (Peponocephala electra) around the main Hawaiian Islands: evidence of multiple populations based on photographic data. Master’s Thesis. Hawaii Pacific University.
Aschettino, J.M., R.W. Baird, D.J. McSweeney, D.L. Webster, G.S. Schorr, J.L. Huggins, K.K. Martien, S.D. Mahaffy, and K.L. West. 2012. Population structure of melon-headed whales (Peponocephala electra) in the Hawaiian Archipelago: evidence of multiple populations based on photo identification. Marine Mammal Science 28(4): 666-689. doi: 10.1111/j.1748-7692.2011.00517.x
Barlow, J. 2006. Cetacean abundance in Hawaiian waters estimated from a summer/fall survey in 2002. Marine Mammal Science 22(2): 446-464.
181

Barlow, J., S.L. Swartz, T.C. Eagle, and P.R. Wade. 1995. U.S. Marine Mammal Stock Assessments: Guidelines for Preparation, Background, and a Summary of the 1995 Assessments. U.S. Dep. Commer., NOAA Tech. Memo. NMFS-OPR-6, 73 p.
Bradford, A.L. and K.A. Forney. 2013. Injury determinations for cetaceans observed interacting with Hawaii and American Samoa longline fisheries during 2007-2011. PIFSC Working Paper WP-13-002.
Bradford. A.L., K.A. Forney, E.M. Oleson, and J. Barlow. 2013. Line-transect abundance estimates of cetaceans in the Hawaiian EEZ. PIFSC Working Paper WP-13-004.
Brownell, R.L, Jr., K. Ralls, S. Baumann-Pickering, and M.M. Poole. 2009. Behavior of melon-headed whales, Peponocephala electra, near oceanic islands. Marine Mammal Science 25(3):639-658.
Cox, T.M., T.J. Ragen, A.J. Read, E. Vos, R.W. Baird, K. Balcomb, J. Barlow, J. Caldwell, T. Cranford, L. Crum, A. D’Amico, G. D’Spain, A. Fernandez, J. Finneran, R. Gentry, W. Gerth, F. Gulland, J.A. Hildebrand, D. Houser, T. Hullar, P.D. Jepson, D. Ketten, C.D. Macleod, P. Miller, S. Moore, D. Mountain, D. Palka, P. Ponganis, S. Rommel, T. Rowles, B. Taylor, P. Tyack, D. Wartzok, R. Gisiner, J. Mead, and L. Brenner. 2006. Understanding the impacts of anthropogenic sound on beaked whales. J.Cetacean Res. Manag. 7: 177-187.
Forney, K.A. 2009. Serious injury determinations for cetaceans caught in Hawaii longline fisheries during 1994-2008. Draft document PSRG-2009-09 presented to the Pacific Scientific Review Group, November 3-5, 2009, Del Mar, CA.
Kobayashi, D. R. and K. E. Kawamoto. 1995. Evaluation of shark, dolphin, and monk seal interactions with Northwestern Hawaiian Island bottomfishing activity: a comparison of two time periods and an estimate of economic impacts. Fisheries Research 23:11-22.
Maldini, D., L. Mazzuca, and S. Atkinson. 2005. Odontocete stranding patterns in the Main Hawaiian Islands (1937-2002): How do they compare with live animal surveys? Pacific Science 59(1):55-67.
McCracken M., and K.A. Forney. 2010. Preliminary assessment of incidental interactions with marine mammals in the Hawaii longline deep and shallow set fisheries. NMFS, Pacific Islands Fisheries Science Center Working Paper WP-10-001. 27p
McCracken, M. 2013. Preliminary assessment of incidental interactions with marine mammals in the Hawaii longline deep and shallow set fisheries from 2007 to 2011. PIFSC Working Paper WP-13-XXX.
Nishiwaki, M. and K. S. Norris. 1966. A new genus, Peponocephala, for the odontocete cetacean species Electra electra. Sci. Rep. Whales Res. Inst. 20:95-100.
Nitta, E. 1991. The marine mammal stranding network for Hawaii: an overview. In: J.E. Reynolds III, D.K. Odell (eds.), Marine Mammal Strandings in the United States, pp.56-62. NOAA Tech. Rep. NMFS 98, 157 pp.
Nitta, E. and J. R. Henderson. 1993. A review of interactions between Hawaii's fisheries and protected species. Mar. Fish. Rev. 55(2):83-92.
NMFS, Pacific Islands Region, Observer Program, 1602 Kapiolani Blvd, Suite 1110, Honolulu, HI 96814. NMFS. 2005. Revisions to Guidelines for Assessing Marine Mammal Stocks. 24 pp. Available at:
http://www.nmfs.noaa.gov/pr/pdfs/sars/gamms2005.pdf NMFS. 2012. NOAA Fisheries Policy Directive 02-038-01 Process for Injury Determinations (01/27/12). Available
at: http://www.nmfs.noaa.gov/pr/pdfs/serious_injury_policy.pdf Oleson, E.M., R.W. Baird, K.K. Martien, and B.L. Taylor. 2013. Island-associated stocks of odontocetes in the main
Hawaiian Islands: A synthesis of available information to facilitate evaluation of stock structure. PIFSC Working Paper WP-13-003.
Perrin, W.F., G. P. Donovan and J. Barlow. 1994. Gillnets and Cetaceans. Rep. Int. Whal. Commn., Special Issue 15, 629 pp.
Perryman, W. L., D. W. K. Au, S. Leatherwood, and T. A. Jefferson. 1994. Melon-headed whale Peponocephala electra Gray, 1846. In: S. H. Ridgway and R. Harrison (eds.), Handbook of Marine Mammals, Vol.5: The First Book of Dolphins, pp. 363-386. Academic Press, 416 pp.
Shallenberger, E.W. 1981. The status of Hawaiian cetaceans. Final report to U.S. Marine Mammal Commission. MMC-77/23, 79pp.
Southall, B. R. Braun, F.M.D. Gulland, A.D. Heard, R.W. Baird, S.M. Wilkin, T.K. Rowles. 2006. Hawaiian melon-headed whale (Peponocephala electra) mass stranding event of July 3-4, 2004. NOAA Technical Memorandum NMFS-OPR-31. 73 pp.
Wade, P. R. and R. P. Angliss. 1997. Guidelines for Assessing Marine Mammal Stocks: Report of the GAMMS Workshop April 3-5, 1996, Seattle, Washington. U. S. Dep. Commer., NOAA Tech. Memo. NMFS-OPR-12. 93 pp.
Wade, P. R. and T. Gerrodette. 1993. Estimates of cetacean abundance and distribution in the eastern tropical
182
Pacific. Rep. Int. Whal. Commn. 43:477-493. Wang, J.Y., and S.-C. Yang. 2006. Unusual cetacean stranding events in Chinese waters in early 2004 and 2005. J.
Cetacean Res. and Manag. 8:283-292. Woodworth, P.A., G.S. Schorr, R.W. Baird, D.J. McSweeney, M.B. Hanson, R.D. Andrews, and J.J. Polovina. 2012.
Eddies as offshore foraging grounds for melon-headed whales (Peponocephala electra). Marine Mammal Science 28(3); 638-647.
183

Revised 01/15/2011 9/23/2013 PYGMY KILLER WHALE (Feresa attenuata):
Hawaiian Stock STOCK DEFINITION AND GEOGRAPHIC RANGE Pygmy killer whales are found in tropical and subtropical waters throughout the world (Ross and Leatherwood 1994). They are poorly known in most parts of their range. Small numbers have been taken directly and incidentally in both the western and eastern Pacific. Most knowledge of this species is from stranded or live-captured specimens. Pryor et al. (1965) stated that pygmy killer whales have been observed several times off the lee shore of Oahu, and that "they seem to be regular residents of the Hawaiian area." Although all sightings up to that time had been off Oahu and the Big Island, Shallenberger (1981) stated that this species might be found elsewhere in Hawaii, as well. More recently, pygmy killer whales have also been seen off the islands of Niihau and Lanai (McSweeney et al. 2009). Summer/fall shipboard surveys of the waters within the U.S. Exclusive Economic Zone (EEZ) of the Hawaiian Islands, resulted in tThree sightings of pygmy killer whales were made during a in 2002 and five in 2010 shipboard survey of U.S. Exclusive Economic Zone (EEZ) waters surrounding the Hawaiian Islands (Figure 1; Barlow 2006, Bradford et al 2013). Six Eight strandings have been documented from the Hawaiian Islands since 1981Maui and the island of Hawaii (Nitta 1991, Maldini et al. 2005, NMFS PIR Marine Mammal Response Network database), including one since 2007.
Several recent studies suggest that while pygmy killer whales are relatively rare in Hawaiian waters, a small resident population occurs in the main Hawaiian Islands (MHI). A 22-year study off the island of Hawaii Island suggested this species is relatively rare (1.2% of all sightings) indicates that pygmy killer whales yet occurs there year-round and in stable social groups. Over 80% of pygmy killer whales seen off Hawaii Island have been resighted and 92% have been linked into a single social network High resighting rates suggest a small-island associated population off the island of Hawaii (McSweeney et al. 2009). Movements have also been documented between Hawaii Island and Oahu and between Oahu and Lanai (Baird et al 2011a). Satellite telemetry data from four tagged pygmy killer whales suggest this resident group remains within 20km of shore (Baird et al 2011a,b). Encounter rates for pygmy killer whales during near shore surveys are rare, representing only 1.2% of all cetacean encounters to date (McSweeney et al 2009. , which may warrant d Division of this population into a separate island-associated stock may be warranted in the future.
For the Marine Mammal Protection Act (MMPA) stock assessment reports, there is a single Pacific management stock including animals found both within the Hawaiian Islands EEZ and in adjacent international high seas waters. Because data on abundance, distribution, and human-caused impacts are largely lacking for international high seas waters, the status of this stock is evaluated based on data from U.S. EEZ waters of the Hawaiian Islands (NMFS 2005). POPULATION SIZE
A population estimate has been made for this species in the eastern tropical Pacific (Wade and Gerrodette 1993), but it is not known whether any of these animals are part of the same population that occurs around the Hawaiian Islands. A 2002 shipboard line-transect survey of the entire Hawaiian Islands EEZ resulted in an abundance estimate of 956 (CV=0.83) pygmy killer whales (Barlow 2006). The recent 2010 shipboard line-
Figure 1. Pygmy killer whale sighting locations during the 2002 (open diamonds) and 2010 (black diamonds) shipboard surveys of U.S. EEZ waters surrounding the Hawaiian Islands (Barlow 2006, Bradford et al 2013; see Appendix 2 for details on timing and location of survey effort). Outer line represents approximate boundary of survey area and U.S. EEZ. Gray shading indicates area of Papahanaumokuakea Marine National Monument. Dotted line represents the 1000m isobath.
184

transect survey of the Hawaiian Islands EEZ resulted in an abundance estimate of 3,433 (CV = 0.52) pygmy killer whales (Bradford et al 2013).This is currently the best available abundance estimate for this stock. Minimum Population Estimate The minimum population size is calculated as the lower 20th percentile of the log-normal distribution (Barlow et al 1995) of the The log-normal 20th percentile of the 2002 2010 abundance estimate (Barlow 2006) is 520 or 2,274 pygmy killer whales within the Hawaiian EEZ. Current Population Trend
The broad and overlapping confidence intervals around the 2002 and 2010 estimates preclude assessment of pygmy killer whales trends with the available data. No data are available on current population trend. CURRENT AND MAXIMUM NET PRODUCTIVITY RATES No data are available on current or maximum net productivity rate. POTENTIAL BIOLOGICAL REMOVAL The potential biological removal (PBR) level for pygmy killer whales this stock is calculated as the minimum population estimate for within the U.S. EEZ of the Hawaiian Islands (2,274 520) times one half the default maximum net growth rate for cetaceans (½ of 4%) times a recovery factor of 0.50 (for a stock of unknown status with no known fishery mortality or serious injury within the Hawaiian Islands EEZ; Wade and Angliss 1997), resulting in a PBR of 23 5.2 pygmy killer whales per year. HUMAN-CAUSED MORTALITY AND SERIOUS INJURY New Serious Injury Guidelines NMFS updated its serious injury designation and reporting process, which uses guidance from previous serious injury workshops, expert opinion, and analysis of historic injury cases to develop new criteria for distinguishing serious from non-serious injury (Angliss and DeMaster 1998, Andersen et al. 2008, NOAA 2012). NMFS defines serious injury as an “injury that is more likely than not to result in mortality”. Injury determinations for stock assessments revised in 2013 or later incorporate the new serious injury guidelines, based on the most recent 5-year period for which data are available. Fishery Information Information on fishery-related mortality and serious injury of cetaceans in Hawaiian waters is limited, but the gear types used in Hawaiian fisheries are responsible for marine mammal mortality and serious injury in other fisheries throughout U.S. waters. Entanglement in gillnets and hooking or entanglement in various hook and line fisheries have been reported for small cetaceans in Hawaii (Nitta & Henderson, 1993). A stranded pygmy killer whale from Oahu showed signs of hooking injury (Schofield 2007) and mouthline injuries have also been noted in some individuals (Baird unpublished data), though it is not known if these interactions result in serious injury or mortality. No estimates of human-caused mortality or serious injury are currently available for nearshore hook and line or gillnet fisheries because these fisheries are not observed or monitored for protected species bycatch. Gillnets appear to capture marine mammals wherever they are used, and float lines from lobster traps and longlines can be expected to occasionally entangle cetaceans (Perrin et al. 1994). Interactions with cetaceans have been reported for all Hawaiian pelagic fisheries (Nitta and Henderson 1993), but no interactions with pygmy killer whales have been documented. There are currently two distinct longline fisheries based in Hawaii: a deep-set longline (DSLL) fishery that targets primarily tunas, and a shallow-set longline fishery (SSLL) that targets swordfish. Both fisheries operate within U.S. waters and on the high seas. Between 2007 and 20112004 and 2008, no pygmy killer whales were observed hooked or entangled in the SSLL fishery (100% observer coverage) or the DSLL fishery (20-2228% observer coverage) (Bradford & Forney 2013, McCracken 2013& Forney 2010). However, eight unidentified cetaceans were taken in the DSLL fishery, and two unidentified cetaceans were taken in the SSLL fishery, some of which may have been pygmy killer whales.
Interaction rates between dolphins and the NWHI bottomfish fishery have been estimated based on studies conducted in 1990-1993, indicating that an average of 2.67 dolphin interactions, most likely involving bottlenose and rough-toothed dolphins, occurred for every 1000 fish brought on board (Kobayashi and Kawamoto 1995). Fishermen claim interactions with dolphins that steal bait and catch are increasing. It is not known whether these interactions result in serious injury or mortality of dolphins, nor whether pygmy killer whales are involved. A stranded pygmy killer whale from Oahu showed signs of hooking injury (Schofield 2007) and mouthline injuries
185

have also been noted in some individuals (Baird unpublished data), though it is not known if these interactions result in serious injury or mortality. Other Mortality In recent years, there has been increasing concern that loud underwater sounds, such as active sonar and seismic operations, may be harmful to beaked whales (Cox et al. 2006) and other cetaceans, including melon-headed whales (Southall et al. 2006, Brownell et al. 2009) and pygmy killer whales (Wang and Yang 2006). The use of active sonar from military vessels has been implicated in mass strandings of beaked whales, and recent mass-stranding reports suggest some delphinids may be impacted as well. Two mass-strandings of pygmy killer whales occurred in the coastal areas of southwest Taiwan in February 2005, possibly associated with offshore naval training exercises (Wang and Yang 2006). A necropsy of one of the pygmy killer whales revealed hemorrhaging in the cranial tissues of the animal. Additional research on the behavioral response of delphinids in the presence of sonar transmissions is needed in order to understand the level of impact. No estimates of potential mortality or serious injury are available for U.S. waters. STATUS OF STOCK The Hawaii stock of pygmy killer whales is not considered strategic under the 1994 amendments to the MMPA. The status of pygmy killer whales in Hawaiian waters relative to OSP is unknown, and there are insufficient data to evaluate trends in abundance. No habitat issues are known to be of concern for this species. Pygmy killer whales This species isare not listed as “threatened” or “endangered” under the Endangered Species Act (1973), nor designated as “depleted” under the MMPA. Given the absence of recent recorded fishery-related mortality or serious injuries, the Hawaii stock of pygmy killer whales is not considered strategic under the 1994 amendments to the MMPA, and the total fishery mortality and serious injury can be considered to be insignificant and approaching zero. REFERENCES Anderson, M.S., K.A. Forney, T.V.N. Cole, T. Eagle, R.P. Angliss, K. Long, L. Barre, L. VanAtta, D. Borggaard, T.
Rowles, B. Norberg, J. Whaley, L. Engleby. Differentiating serious and non-serious injury of marine mammals: Report of the Serious Injury Technical Workshop 10-13 September 2007, Seattle, WA. NOAA Tech Memo NMFS-OPR-39, 94 p.
Angliss, R.P. and D.P. DeMaster. 1997. Differentiating serious and non-serious injury of marine mammals taken incidental to commercial fishing operations: Report of the Serious Injury Workshop 1-2 April. 1997, Silver Spring, MD. NOAA Tech Memo NMFS-OPR-13, 48 p.
Baird, R.W., G.S. Schorr, D.L. Webster, S.D. Mahaffy, J.M. Aschettino and T. Cullins. 2011a. Movements and spatial use of satellite-tagged odontocetes in the western main Hawaiian Islands: results of field work undertaken off O‘ahu in October 2010 and Kaua‘i in February 2011. Annual progress report under Grant No. N00244-10-1-0048 from the Naval Postgraduate School.
Baird, R.W., G.S. Schorr, D.L. Webster, D.J. McSweeney, M.B. Hanson and R.D. Andrews. 2011b. Movements of two satellite-tagged pygmy killer whales (Feresa attenuata) off the island of Hawaii. Marine Mammal Science. DOI: 10.1111/j.1748-7692.2010.00458.x
Barlow, J. 2006. Cetacean abundance in Hawaiian waters estimated from a summer/fall survey in 2002. Marine Mammal Science 22(2): 446-464.
Barlow, J., S.L. Swartz, T.C. Eagle, and P.R. Wade. 1995. U.S. Marine Mammal Stock Assessments: Guidelines for Preparation, Background, and a Summary of the 1995 Assessments. U.S. Dep. Commer., NOAA Tech. Memo. NMFS-OPR-6, 73 p.
Bradford, A.L. and K.A. Forney. 2013. Injury determinations for cetaceans observed interacting with Hawaii and American Samoa longline fisheries during 2007-2011. PIFSC Working Paper WP-13-002.
Bradford. A.L., K.A. Forney, E.M. Oleson, and J. Barlow. 2013. Line-transect abundance estimates of cetaceans in the Hawaiian EEZ. PIFSC Working Paper WP-13-004.
Brownell, R.L, Jr., K. Ralls, S. Baumann-Pickering, and M.M. Poole. 2009. Behavior of melon-headed whales, Peponocephala electra, near oceanic islands. Marine Mammal Science 25(3):639-658.
Cox, T.M., T.J. Ragen, A.J. Read, E. Vos, R.W. Baird, K. Balcomb, J. Barlow, J. Caldwell, T. Cranford, L. Crum, A. D’Amico, G. D’Spain, A. Fernandez, J. Finneran, R. Gentry, W. Gerth, F. Gulland, J.A. Hildebrand, D. Houser, T. Hullar, P.D. Jepson, D. Ketten, C.D. Macleod, P. Miller, S. Moore, D. Mountain, D. Palka, P. Ponganis, S. Rommel, T. Rowles, B. Taylor, P. Tyack, D. Wartzok, R. Gisiner, J. Mead, and L. Brenner. 2006. Understanding the impacts of anthropogenic sound on beaked whales. J.Cetacean Res. Manag. 7:
186

177-187. Forney, K.A. 2009. Serious injury determinations for cetaceans caught in Hawaii longline fisheries during 1994-
2008. Draft document PSRG-2009-09 presented to the Pacific Scientific Review Group, November 3-5, 2009, Del Mar, CA.
Kobayashi, D. R. and K. E. Kawamoto. 1995. Evaluation of shark, dolphin, and monk seal interactions with Northwestern Hawaiian Island bottomfishing activity: a comparison of two time periods and an estimate of economic impacts. Fisheries Research 23: 11-22.
Maldini, D., L. Mazzuca, and S. Atkinson. 2005. Odontocete stranding patterns in the Main Hawaiian Islands (1937-2002): How do they compare with live animal surveys? Pacific Science 59(1):55-67.
McCracken M., and K.A. Forney. 2010. Preliminary assessment of incidental interactions with marine mammals in the Hawaii longline deep and shallow set fisheries. NMFS, Pacific Islands Fisheries Science Center Working Paper WP-10-001. 27p
McCracken, M. 2013. Preliminary assessment of incidental interactions with marine mammals in the Hawaii longline deep and shallow set fisheries from 2007 to 2011. PIFSC Working Paper WP-13-XXX.
McSweeney, D.J., R.W. Baird, S.D.Mahaffy, D.L. Webster, and G.S. Schorr. 2009. Site fidelity and association patterns of a rare species: Pygmy killer whales (Feresa attenuata) in the main Hawaiian Islands. Marine Mammal Science 25(4): 557-572.
Nitta, E. 1991. The marine mammal stranding network for Hawaii: an overview. In: J.E. Reynolds III, D.K. Odell (eds.), Marine Mammal Strandings in the United States, pp.56-62. NOAA Tech. Rep. NMFS 98, 157 pp.
Nitta, E. and J. R. Henderson. 1993. A review of interactions between Hawaii's fisheries and protected species. Mar. Fish. Rev. 55(2):83-92.
NMFS. 2005. Revisions to Guidelines for Assessing Marine Mammal Stocks. 24 pp. Available at: http://www.nmfs.noaa.gov/pr/pdfs/sars/gamms2005.pdf
NMFS. 2012. NOAA Fisheries Policy Directive 02-038-01 Process for Injury Determinations (01/27/12). Available at: http://www.nmfs.noaa.gov/pr/pdfs/serious_injury_policy.pdf
Perrin, W.F., G. P. Donovan and J. Barlow. 1994. Gillnets and Cetaceans. Rep. Int. Whal. Commn., Special Issue 15, 629 pp.
Pryor, T., K. Pryor and K. S. Norris. 1965. Observations on a pygmy killer whale (Feresa attenuata Gray) from Hawaii. J. Mamm. 46:450-461.
Ross, G. J. B. and S. Leatherwood. 1994. Pygmy killer whale Feresa attenuata Gray, 1874. In: S. H. Ridgway and R. Harrison (eds.), Handbook of Marine Mammals, Vol.5: The First Book of Dolphins, pp.387-404. Academic Press, 416 pp.
Schofield, D. 2007. Pygmy killer whale (Feresa attenuata) stranding of July 23, 2006. National Marine Fisheries Service, Honolulu, HI.
Shallenberger, E.W. 1981. The status of Hawaiian cetaceans. Final report to U.S. Marine Mammal Commission. MMC-77/23, 79pp.
Southall, B. R. Braun, F.M.D. Gulland, A.D. Heard, R.W. Baird, S.M. Wilkin, T.K. Rowles. 2006. Hawaiian melon-headed whale (Peponocephala electra) mass stranding event of July 3-4, 2004. NOAA Technical Memorandum NMFS-OPR-31. 73 pp.
Wade, P. R. and R. P. Angliss. 1997. Guidelines for Assessing Marine Mammal Stocks: Report of the GAMMS Workshop April 3-5, 1996, Seattle, Washington. U. S. Dep. Commer., NOAA Tech. Memo. NMFS-OPR-12. 93 pp.
Wade, P. R. and T. Gerrodette. 1993. Estimates of cetacean abundance and distribution in the eastern tropical Pacific. Rep. Int. Whal. Commn. 43:477-493.
Wang, J.Y., and S.-C. Yang. 2006. Unusual cetacean stranding events in Chinese waters in early 2004 and 2005. J. Cetacean Res. and Manag. 8:283-292.
187

Revised 1/8/20139/23/2013
FALSE KILLER WHALE (Pseudorca crassidens): Hawaiian Islands Stock Complex – Main Hawaiian Islands Insular,
Northwestern Hawaiian Islands, and Hawaii Pelagic Stocks
STOCK DEFINITION AND GEOGRAPHIC RANGE False killer whales are found worldwide mainly in tropical and warm-temperate waters (Stacey et al. 1994). In the North Pacific, this species is well known from southern Japan, Hawaii, and the eastern tropical Pacific. There are seven six stranding records from Hawaiian waters since 1974 (Nitta 1991; Maldini et al. 2005, NMFS PIR Marine Mammal Response Network database), including one since 2007. One on-effort sighting of false killer whales was made during a 2002 shipboard survey, and six during a 2010 shipboard survey of waters within the U.S. Exclusive Economic Zone (EEZ) of the Hawaiian Islands (Figure 1; Barlow 2006, Bradford et al. 2012). Smaller-scale surveys conducted around the main Hawaiian Islands (Figure 2) show that false killer whales are also encountered in nearshore waters (Baird et al. 2005, Mobley et al. 2000), and a single on-effort and three off-effort sightings during a 2010 shipboard survey reveal that the species also occurs near shore in the Northwestern Hawaiian Islands (Baird et al. 20123). This species also occurs in U.S. EEZ waters around Palmyra and Johnston Atolls (NMFS/PIR/PSD unpublished data), and American Samoa (Johnston et al. 2008, Oleson 2009).
Genetic, photo-identification, and telemetry studies indicate there are three demographically-independent populations of false killer whales in Hawaiian waters. Genetic analyses indicate restricted gene flow between false killer whales sampled near the main Hawaiian Islands (MHI), the Northwestern Hawaiian Islands (NWHI), and in pelagic waters of the Eastern (ENP) and Central North Pacific (CNP) (Chivers et al. 2007, 2010; Martien et al. 2011). Chivers et al. (2010) expanded previous analyses with additional samples and analysis of 8 nuclear DNA (nDNA) microsatellites, revealing strong phylogeographic patterns consistent with local evolution of haplotypes nearly unique to false killer whales occurring nearshore within the Hawaiian Archipelago. Analysis of 21 additional samples collected during a 2010 shipboard survey in Hawaiian waters reveals significant differentiation in both mitochondrial DNA (mtDNA) and nDNA between false killer whales found near the MHI and the NWHI (Martien et al. 2011). Photographic–identification of individuals seen near the NWHI confirms that they do not associate with individuals near the MHI south of Kauai (Baird et al. 2013). Two false killer whales previously photographed near Kauai were seen in groups observed near Nihoa in the NWHI, and are not known to associate with animals from the MHI, suggesting geographic overlap of MHI and NWHI false killer whale populations near Kauai. Further evaluation of photographic and genetic data from individuals seen near the MHI suggest the occurrence of three separate social clusters (Baird et al. 2012, Martien et al. 2011), where mating primarily occurs within clusters, though some mating is known to occur between males and females of different social clusters (Martien et al. 2011).
Figure 1. False killer whale on-effort sighting locations during standardized shipboard surveys of the Hawaiian Islands U.S. EEZ (2002, gray diamond, Barlow 2006; 2010, black triangles, Bradford et al. 2012, the Johnston Atoll EEZ and pelagic waters of the central Pacific south of the Hawaiian Islands (2005, gray crosses, Barlow and Rankin 2007) and the Johnston Atoll EEZ. Outer lines represent approximate boundary of U.S. EEZs; light shaded gray area is the main Hawaiian Islands insular false killer whale stock area, including overlap zone between MHI insular and pelagic false killer whale stocks; dark shaded gray area is the Northwestern Hawaiian Islands stock area, which overlaps the pelagic false killer whale stock area and part of the MHI insular false killer whale stock area.
188

Observers have collected tissue samples for genetic analysis from cetaceans incidentally caught in the Hawaii-based longline fishery since 2003. Between 2003 and 2010, eight false killer whale samples, four collected outside the Hawaiian EEZ and four collected within the EEZ but more than 100 nautical miles (185km) from the main Hawaiian Islands (see Figure 3), were determined to have Pacific pelagic haplotypes (Chivers et al. 2010). At the broadest scale, significant differences in both mtDNA and nDNA are evident between pelagic false killer whales in the ENP and CNP strata (Chivers et al. 2010), although the sample distribution to the east and west of Hawaii is insufficient to determine whether the sampled strata represent one or more stocks, and where pelagic stock boundaries would be drawn.
Genetic, photographic, and telemetry data collected from Hawaiian false killer whales demonstrates the existence of a previously unknown stock of island-associated false killer whales in the NHWI, and supports the current recognized boundaries of the MHI insular and pelagic stocks. The three stocks have overlapping ranges. MHI insular false killer whales have been seen as far as 112 km from the main Hawaiian Islands, while pelagic stock animals have been seen within 42 km of the main Hawaiian Islands (Baird et al. 2008, Baird 2009, Baird et al. 2010, Forney et al. 2010). NWHI false killer whales have been seen as far as 93 km from the NWHI and near Kauai (Baird et al. 2012, Bradford et al. 2012, Martien et al. 2011). Animals seen within 40 km of each of the main Hawaiian Islands between from Hawaii Island andto Oahu are considered to belong to the MHI insular stock. Waters within 40 km of Kauai and Niihau are an overlap zone between the MHI insular and NWHI stocks, as individuals from both populations are known to occur have been seen there. Animals seen within 93 km of the NWHI, inside the Papahānaumokuākea Marine National Monument may belong to either the NWHI or pelagic stock, as animals from both stocks have been seen inside the Monument. Animals beyond 140 km of the MHI and beyond 93 km of the NWHI are considered to belong to the pelagic stock. The MHI insular and pelagic stocks overlap between 40 km and 140 km from shore contiguously between Oahu and Hawaii Island. All three stocks overlap within 40 km and 93 km around Kauai and Niihau, and the MHI insular and pelagic stocks overlap from 93 km to 140 km around these islands (Figure 2). The pelagic stock includes animals found within the Hawaiian Islands EEZ and in adjacent international waters; however, because data on false killer whale abundance, distribution, and human-caused impacts are largely lacking for international waters, the status of this stock is evaluated based on data from U.S. EEZ waters of the Hawaiian Islands (NMFS 2005). The Palmyra Atoll stock of false killer whales are still considered to beremains a separate stock, because comparisons amongst false killer whales sampled at Palmyra Atoll and those sampled from
Figure 2. Sighting, biopsy, and telemetry records of false killer whale identified as being part of the MHI insular (square symbols), NWHI (triangle symbols), or pelagic (open and cross symbols) stocks. The dark gray area is the 40-km MHI insular core area; light gray area is the 40-km to 140-km MHI insular-pelagic overlap zone (Baird et al. 2010, Baird unpublished data; reproduced from Forney et al. 2010); medium gray area is the 50-nmi (93-km) Monument boundary extended to the east to encompass Kauai, representing the NWHI stock boundary. The MHI insular, pelagic, and NWHI stocks overlap in the vicinity of Kauai.
189

the MHI insular stock and the pelagic ENP reveal restricted gene flow, although the sample size remains low for robust comparisons (Chivers et al. 2007, 2010). NMFS will obtain and analyze additional samples for genetic studies of stock structure, and will evaluate new information on stock ranges as it becomes available.
For the Marine Mammal Protection Act (MMPA) stock assessment reports, there are currently five Pacific Islands Region management stocks (Forney et al. 2011, Martien et al. 2011): 1) the Main Hawaiian Islands insular stock, which includes animals inhabiting waters within 140 km (approx. 75 nmi) of the main Hawaiian Islands, 2) the Northwestern Hawaiian Islands stock, which includes animals inhabiting waters within 93 km (50 nmi) of the NWHI and Kauai, 3) the Hawaii pelagic stock, which includes false killer whales inhabiting waters greater than 40 km (22 nmi) from the main Hawaiian Islands, including adjacent high seas waters, 4) the Palmyra Atoll stock, which includes animals found within the U.S. EEZ of Palmyra Atoll, and 5) the American Samoa stock, which includes animals found within the U.S. EEZ of American Samoa. Estimates of abundance, potential biological removal, and status determinations for the first three stocks are presented below; the Palmyra Atoll and American Samoa Stocks are covered in separate reports.
HUMAN-CAUSED MORTALITY AND SERIOUS INJURY New Serious Injury Guidelines NMFS updated its serious injury designation and reporting process, which uses guidance from previous serious injury workshops, expert opinion, and analysis of historic injury cases to develop new criteria for distinguishing serious from non-serious injury (Angliss and DeMaster 1998, Andersen et al. 2008, NOAA 2012). NMFS defines serious injury as an “injury that is more likely than not to result in mortality”. Injury determinations for stock assessments revised in 2013 or later incorporate the new serious injury guidelines, based on the most recent 5-year period for which data are available. Fishery Information Interactions with false killer whales, including depredation of catch of a variety of pelagic fishes, have been identified in logbooks and NMFS observer records from Hawaii pelagic longline fishing tripslonglines (Nitta and Henderson 1993, Oleson et al. 2010, NMFS/PIR unpublished data). False killer whales have been observed feeding on mahi mahi, Coryphaena hippurus, and yellowfin tuna, Thunnus albacares (Baird 2009), and they have been reported to take large fish from the trolling lines of commercial and recreational fishermen (Shallenberger 1981). There are anecdotal reports of marine mammal interactions in the commercial Hawaii shortline fishery which sets gear at Cross Seamount and possibly around the main Hawaiian Islands. The shortline fishery is permitted through the State of Hawaii Commercial Marine License program, and until recently, no reporting systems existed to document marine mammal interactions. This fishery was added to the 2010 List of Fisheries as a Category II fishery (Federal Register Vol. 74, No. 219, p. 58859-58901, November 16, 2009), and efforts are underway to obtain data on interactions between shortlines and marine mammals. Baird and Gorgone (2005) documented high rates of dorsal fin disfigurements consistent with injuries from unidentified fishing line for false killer whales belonging to the MHI insular stock. It is unknown whether these injuries might
Figure 3. Locations of observed false killer whale takes (black diamondsfilled symbols) and possible takes (blackfish) of this species (open diamondssymbols) in the Hawaii-based longline fisheries, 2007-20112006-2010. Deep-set fishery takes are shown in black; shallow-set fishery takes are shown in gray. Stars are locations of genetic samples from fishery-caught false killer whales. Some take locations overlap. Solid gray lines represent the U.S. EEZ; the dotted line is the outer (140-km) boundary of the overlap zone between MHI insular and pelagic false killer whale stocks; the dashed line is the 93-km boundary of the NWHI stock; the gray shaded area is the February-September longline exclusion zone.
190

have been caused by longline gear, shortline gear, or other hook-and-line gear used around the main Hawaiian Islands. No estimates of human-caused mortality or serious injury are currently available for nearshore hook and line or gillnet fisheries because these fisheries are not observed or monitored for protected species bycatch.
There are two distinct longline fisheries based in Hawaii: a deep-set longline (DSLL) fishery that targets primarily tunas, and a shallow-set longline fishery (SSLL) that targets swordfish. Both fisheries operate within U.S. waters and on the high seas, but are prohibited from operating within the Papahanaumokuakea Marine National Monument and within the Longline Exclusion Area around the main Hawaiian Islands. , within the ranges of both MHI insular and pelagic stocks. Between 2006 and 2010, two 2007 and 2011, three false killer whales were observed hooked or entangled in the SSLL fishery (100% observer coverage) within the U.S. EEZ of the Hawaiian Islands, and 24 22 false killer whales were observed taken in the DSLL fishery (≥20% 20-22% observer coverage) within Hawaiian waters or adjacent high-seas waters (excluding Palmyra Atoll EEZ waters) (Bradford & Forney 2013 Forney 2011). One false killer whale take in the DSLL fishery resulted in the death of the animal in international waters. Based on an evaluation of the observer’s description of each interaction and following the most recently developed criteria for assessing serious injury in marine mammals (NMFS 2012Andersen et al. 2008), twoone animals taken in the SSLL fishery within the Hawaii EEZ wereas considered not seriously injured and one was considered seriously injured, both within the Hawaii EEZ. In the DSLL fishery, one false killer whale taken within the overlap zone of the MHI insular and pelagic stocks, two taken in Hawaiian waters within the range of the pelagic stock, and one taken onin the high seasinternational waters were considered not seriously injured. The level of injury could not be determined based on the observer descriptions for one false killer whale taken in the DSLL, within the range of the pelagic stock. The remaining 1918 false killer whales taken in the DSLL fishery, (eightnine in high seas international waters and, eleven nine in the Hawaiian Islands EEZ pelagic stock range were considered seriously injured (Bradford & Forney 2013Forney 2011). Seven additional unidentified “blackfish” (unidentified cetaceans known to be either false killer whales or short-finned pilot whales) that may have been false killer whales were also seriously injured during 2007-2011 (Bradford & Forney 2013). Additionally, one unidentified blackfish was taken on the high seas in the deep set longline fishery in 2011, but was not seriously injured (Table 1). Five of the seven serious injuries were taken in the DSLL fishery within U.S. EEZ waters, including one animal within the MHI insular stock range and the remaining two serious injuries were taken the SSLL fishery on the high seas (Table 1 and Figure 3). during 2006-2010 (Forney 2011; see McCracken 2011 for description of short-finned pilot whale takes within the deep and shallow set fisheries). Six of these were taken in the DSLL fishery within U.S. EEZ waters, including one animal within the MHI insular stock range, and one was taken in the SSLL fishery in international waters (Figure 3).
The total observed mortality and serious injury of cetaceans in the SSLL fishery (with 100% coverage), and the estimated annual and 5-yr average mortality and serious injury of cetaceans in the DSLL fishery (with approximately 20% coverage) are reported by McCracken (2011). A number of recent changes are reflected in the methodology. Estimated takes of false killer whales and observed takes for which injury severity is undetermined, are prorated based on the proportions of observed interactions that resulted in death or serious injury (93%) or non-serious injury (7%), between the years 2000 and 2010. Further, tTakes of false killer whales of unknown stock in the MHI insular/pelagic stock overlap zone are prorated to one stock or the other assuming that densities of MHI insular stock animals decline and pelagic stock densities increase with distance from shore (McCracken 2010). No genetic samples are available to establish stock identity for these takes, but both stocks are considered at risk of interacting with longline gear. The pelagic stock is known to interact with longline fisheries in waters offshore of the overlap zone, based on two genetic samples obtained by fishery observers (Chivers et al. 2008). MHI insular false killer whales have been documented via telemetry to move far enough offshore (112km) to reach longline fishing areas, and animals from this stock have a high rate of dorsal fin disfigurements consistent with injuries from unidentified fishing line (Baird and Gorgone 2005).
Finally, takes of unidentified blackfish are prorated to each stock based on distance from shore (McCracken 2010). The distance-from-shore model was chosen following consultation with the Pacific Scientific Review Group, based on the model’s performance and simplicity relative to a number of other more complicated models with similar output (McCracken 2010). Proration of false killer whales takes within the MHI insular-pelagic overlap zone and of unidentified blackfish takes introduces unquantified uncertainty into the bycatch estimates, but until methods of determining stock identity for animals observed taken within the overlap zone are available, and all animals taken can be identified to species (e.g., photos, tissue samples), this approach ensures that potential impacts to all stocks are assessed.
Based on these bycatch analyses, estimates of annual and 5-yr average annual mortality and serious injury of false killer whales, by stock and EEZ area, are shown in Table 1. Estimates of mortality and serious injury (M&SI) include a pro-rated portion of the animals categorized as unidentified blackfish (UB). Although annual M&SI estimates are shown as whole numbers of animals, the 5-yr average M&SI is calculated based on the
191

unrounded annual estimates. Because of high rates of false killer whale mortality and serious injury in Hawaii-based longline fisheries, a
Take Reduction Team (Team) was established in January 2010 (75 FR 2853, 19 January 2010). The Team was charged with developing recommendations to reduce incidental mortality and serious injury of the Hawaii pelagic, MHI insular, and Palmyra stocks of false killer whales in the DSLL and SSLL fisheries. The Team submitted a draft Take Reduction Plan (Plan) to NMFS (http://www.nmfs.noaa.gov/pr/pdfs/interactions/fkwtrp_draft.pdf), and NMFS published a final Plan based on the Team’s recommendations (77 FR 71260, 29 November, 2012). The Plan became effective December 31, 2012, with but certain gear requirements effective go into effect on February 27, 2013. Take reduction measures include gear requirements, time-area closures, and measures to improve captain and crew response to hooked and entangled false killer whales. Additionally, the Plan includes non-regulatory measures that NMFS will implement to improve data quality and dissemination to the Team and the public. Table 1. Summary of available information on incidental mortality and serious injury of false killer whales (Hawaiian Islands Stock Complex) and unidentified blackfish in commercial fisheries, by stock and EEZ area, as applicable (McCracken 20132010). Mean annual takes are based on 2007-20112006-2010 estimates unless otherwise indicated. Information on all observed takes (T) and combined mortality events & serious injuries (MSI) is included. Total takes were prorated to deaths, serious injuries, and non-serious injuries based on the observed proportions of each outcome. Unidentified blackfish are pro-rated as either false killer whales or short-finned pilot whales according to their distance from shore (McCracken 2010). CVs are estimated based on the combined variances of annual false killer whale and blackfish take estimates based on the methods of McCracken and Forney (2010) and do not yet incorporate additional uncertainty introduced by prorating false killer whales takes in the overlap zone and prorating the takes of unidentified blackfish.
Fishery Name Year
Data Type
Percent Observer Coverage
Observed total interactions (T) and mortality events, and serious injuries (MSI), and total estimated mortality and serious injury (M&SI) of false killer whales by stock / EEZ
region
Hawaii Pelgic Stock Main Hawaiian Islands Insular
Stock
Northwestern Hawaiian Islands
Stock Outside U.S. EEZs Hawaiian EEZ Obs. FKW T/MSI Estimated
M&SI (CV)
Obs. FKW T/MSI Estimated
M&SI (CV)
Obs. FKW T/MSI Estimated
M&SI (CV)
Obs. FKW T/MSI Estimated
M&SI (CV) Obs.
UB T/MSI
Obs. UB
T/MSI
Obs. UB
T/MSI
Obs. UB
T/MSI
Hawaii-based
deep-set longline fishery
2007
Observer data
20% 1/0 0 2 (3.4)
2/1 0 8 ( )
0 0 0 (-)
0 0 0 (-)
2008 22% 0 0 0 (-)
3/3 3/3 17 ( )
0 0 0 (-)
0 0 0 (-)
2009 21% 7/7 0 38 (0.2)
3/3 0 12 ( )
0 0 0 (-)
0 0 0 (-)
2010 21% 1/1 0 6 (1.4)
3/2 1/1 14 ( )
0 0 0 (-)
0 0 0 (-)
2011 20% 0
1/0 2 (0.6) 2/2
1/1* 11 ( ) 0
1/1* 1 ( ) 0 0 0 (-)
Mean Estimated Annual Take (CV) 9.6 (0.4) 12.4 (0.3) 0.1 (0.3) 0 (-)
Hawaii-based
shallow-set
longline fishery
2007
Observer data
100% 0 0 0
0 0 0
0 0 0
0 0 0
2008 100% 0
1/1 1 1/0 0 0
0 0 0
0 0 0
2009 100% 0 0 0
1/1 0 1
0 0 0
0 0 0
2010 100% 0 0 0
0 0 0
0 0 0
0 0 0
2011 100% 0
1/1 1 1/0 0 0
0 0 0
0 0 0
Mean Annual Takes (100% coverage) 0.3 0.2 0 0 Minimum total annual takes within U.S. EEZ 12.6 (0.3) 0.1 (0.3) 0
192

* False killer whale and unidentified blackfish takes within the MHI insular/pelagic stock overlap zone are shown once for each stock, but total estimates derived from these takes are prorated among potentially affected stocks based on the distance from shore of the take location (see text above, and McCracken 2010). MAIN HAWAIIAN ISLANDS INSULAR STOCK POPULATION SIZE
A photographic mark-recapture study during 2000-2004 around the main Hawaiian Islands produced an estimate of 123 (CV=0.72) MHI insular false killer whales (Baird et al. 2005). This abundance estimate is based in part on data collected more than 8 years ago, and is considered outdated as a measure of current abundance (NMFS 2005). A Status Review for the MHI insular stock (Oleson et al. 2010) used recent, unpublished estimates of abundance for two time periods, 2000-2004 and 2006-2009 in a Population Viability Analysis (PVA). The new estimates were based on more recent sighting histories and open population models, yielding more precise estimates for the two time periods. The new abundance estimate for the 2000-2004 period is 162 (CV=0.23) animals. Two separate estimates for 2006-2009 were presented in the Status Review; 151 (CV=0.20) and 170 (CV=0.21), depending on whether animals photographed near Kauai are included in the estimate (Baird unpublished data). The animals seen near Kauai included in the higher estimate have now been associated with the NWHI stock (Baird et al. 2013in press), such that the best estimate of population size for the MHI insular stock is the smaller estimate of 151 animals. However, it should be noted that even this smaller estimate may be positively-biased, because missed photo-ID matches were discovered after the analyses were complete (discussed in Oleson et al. 2010). The best estimate will be updated when a new mark-recapture estimate accounting for the missed matches is available. Minimum Population Estimate
The minimum population estimate for the MHI insular stock of false killer whales is the number of distinct individuals identified during 2008-2011 photo-identification studies, or 129 false killer whales (Baird, unpublished data). Recent mark-recapture estimates (Oleson et al. 2010) of abundance are known to have a positive bias of unknown magnitude due to missed matches, and therefore are not suitable for deriving a minimum abundance estimate.
Current Population Trend
Fishery Name Year Data Type
Percent Observer Coverage
Observed total interactions (T) and mortality events, and serious injuries (MSI), and total estimated mortality and serious injury (M&SI) of false killer whales by stock / EEZ region
Hawaii Pelagic Stock Main Hawaiian Islands Insular
Stock
Northwestern Hawaiian Islands
Stock Outside of U.S. EEZs Hawaiian Islands EEZ
Obs. FKW T/MSI Estimated
M&SI (CV)
Obs. FKW T/MSI Estimated
M&SI (CV)
Obs. FKW T/MSI Estimated
M&SI (CV)
Obs. FKW T/MSI
Estimated M&SI (CV) Obs. UB
T/MSI Obs. UB T/MSI
Obs. UB T/MSI
Obs. UB T/MSI
Hawaii-based deep-set longline
fishery
2006
Observer data
22% 2/2 0/0
8 (0.7)
2/1* 2/2* 13 (1.7) 1/0*
1/1* 2.2 (0.7) 0/0 0 (-)
2007 20% 1/0 0/0
2 (3.7)
2/1 0/0 8 (0.8) 0/0
0/0 0 (-) 0/0 0 (-)
2008 22% 0/0 0/0
0 (-)
4/3 3/3 17 (0.4) 0/0
0/0 0 (-) 0/0 0 (-)
2009 20% 7/7 0/0 39 (0.2) 2/2
0/0 12 (0.5) 0/0 0/0 0 (-) 0/0 0 (-)
2010 21% 1/1 0/0 6 (1.3) 2/3
1/1 14 (0.5) 0/0 0/0 0 (-) 0/0 0 (-)
Mean Estimated Annual Takes (CV) 11.2 (0.3) 13.6 (0.3) 0.5 (1.7) 0 (-)
Hawaii-based
shallow-set longline fishery
2006
Observer data
100% 0/0 0/0
0
0/0 0/0
0
0/0 0/0
0
0/0 0
2007 100% 0/0 0/0
0
0/0 0/0
0
0/0 0/0
0
0/0 0
2008 100% 0/0 1/1
0.5
1/0 0/0
0
0/0 0/0
0
0/0 0
2009 100% 0/0 0/0 0 1/1
0/0 1 0/0 0/0 0 0/0 0
2010 100% 0/0 0/0 0 0/0
0/0 0 0/0 0/0 0 0/0 0
Mean Annual Takes (100% coverage) 0.1 0.2 0 0
Minimum total annual takes within U.S. EEZ 13.8 (0.3) 0.5 (1.7) 0 (-)
193

Reeves et al. (2009) suggested that the MHI insular stock of false killer whales may have declined during the last two decades, based on sightings data collected near Hawaii using various methods between 1989 and 2007. Baird (2009) reviewed trends in sighting rates of false killer whales from aerial surveys conducted using consistent methodology around the main Hawaiian Islands between 1994 and 2003 (Mobley et al. 2000). Sighting rates during these surveys showed a statistically significant decline that could not be attributed to any weather or methodological changes. The Status Review of Hawaiian MHI insular false killer whales (Oleson et al. 2010) presented a quantitative analysis of extinction risk using a Population Viability Analysis (PVA). The modeling exercise was conducted to evaluate the probability of actual or near extinction, defined as a population reduced to fewer than 20 animals, given measured, estimated, or inferred information on population size and trends, and varying impacts of catastrophes, environmental stochasticity and Allee effects. All plausible models indicated the probability of decline to fewer than 20 animals within 75 years wais greater than 20%. Though causation was not evaluated, all plausible models indicated the population has been declining since 1989, withcurrent declines at an average annual “growth” rate of -9% since 1989 (95% probability intervals -5% to -12.5%; Oleson et al. 2010).
CURRENT AND MAXIMUM NET PRODUCTIVITY RATES
No data are available on current or maximum net productivity rate for this species in Hawaiian waters. POTENTIAL BIOLOGICAL REMOVAL
The potential biological removal (PBR) level for the MHI insular false killer whale stock is calculated as the minimum population estimate size (129) times one half the default maximum net growth rate for cetaceans (½ of 4%) times a recovery factor of 0.1 (for a stock listed as Endangered under the ESA and with minimum population size less than 1500 individuals; Taylor et al 2000) resulting in a PBR of 0.3 false killer whales per year. The recovery factor was chosen to be 0.1 because the stock has been proposed for listing as endangered under the U.S Endangered Species Act (see below) and because of the significant recent decline experienced by this stock (Oleson et al. 2010).
STATUS OF STOCK The status of MHI insular stock false killer whales relative to OSP is unknown, although this stock appears to have declined during the past two decades (Oleson et al. 2010, Reeves et al. 2009; Baird 2009). Ylitalo et al. (2009) documented elevated levels of polychlorinated biphenyls (PCBs) in three of nine MHI insular false killer whales sampled, and biomass of some false killer whale prey species may have declined around the main Hawaiian Islands (Oleson et al. 2010, Boggs & Ito 1993, Reeves et al. 2009). MHI insular false killer whales have beenare listed as “endangered” under the Endangered Species Act (1973) (77 FR 70915, 28 November, 2012). The listing follows receipt of a petition from the Natural Resources Defense Council on October 1, 2009, requesting that Hawaiian insular false killer whales be listed as endangered under the ESA. NMFS determined that the petition presented substantial scientific information indicating that a listing may be warranted and thus was required to conduct an ESA status review of the stock (75 FR 316; January 5, 2010) and established a Biological Review Team (BRT) for this purpose. The Status Review report produced by the Biological Review Team (BRT) (Oleson et al. 2010) found that Hawaiian insular false killer whales are a Distinct Population Segment (DPS) of the global false killer whale taxon. The BRT evaluated risk to the population, including identification and ranking of threats to the population, quantitative assessment of extinction probability using a PVA, and an assessment of the overall risk of extinction to the population. The PVA analysis indicated the probability of near-extinction (less than 20 animals) within 75 years (3 generations) was greater than 20% for all biologically plausible models and given a wide range of input variables. Of the 29 identified threats to the population, the BRT considered the effects of small population size, including inbreeding depression and Allee effects, exposure to environmental contaminants (Ylitalo et al 2009), competition for food with commercial fisheries (Boggs & Ito, 1993, Reeves et al 2009), and hooking, entanglement, or intentional harm by fishers to be the most substantial threats to the population. The BRT concluded that Main Hawaiian Islands insular false killer whales were at high risk of extinction. Following additional information on the occurrence of another island-associated stock in the NWHI, the BRT reevaluated the DPS decision and concluded that the population still met the standard to be listed as a DPS (Oleson et al. 2012). Because MHI insular false killer whales are formally listed as "endangered" under the ESA, they are automatically considered as a "depleted" and "strategic" stock under the MMPA.False killer whales are not listed as “depleted” under the MMPA . Based on the best available scientific information (Oleson et al. 2010), Main Hawaiian Islands insular false killer whales are declining, therefore the stock is considered “strategic” under the MMPA. The estimated average annual human-caused mortality and serious injury from longline fisheries for this stock (0.5 0.1 animals per year) is less greater than the PBR (0.3), but is not approaching zero mortality and serious injury rate because it exceeds 10% of PBR (NMFS 2004). , providing further support for the “strategic” designation.
194

HAWAII PELAGIC STOCK POPULATION SIZE Analyses of a 2002 shipboard line-transect survey of the Hawaiian Islands EEZ resulted in an abundance estimate of 484 (CV = 0.93) false killer whales within the Hawaiian Islands EEZ outside of about 75 nmi of the main Hawaiian Islands (Barlow & Rankin 2007). This abundance estimate is now more than 8 years old and therefore will no longer be used based on NMFS Guidelines for Assessing Marine Mammal Stocks (NMFS 2005). A new abundance survey was completed in 2010 within the Hawaiian Islands EEZ and resulted in five on-effort detections of false killer whales attributed to the Hawaii pelagic stock. Analysis of 2010 shipboard line-transect data resulted in an abundance estimate of 1,503 (CV=0.66) false killer whales outside of 40 km of the main Hawaiian Islands (Bradford et al. 2012). Bradford et al. (2012) reported that most (64%) false killer whale groups seen during the 2010 HICEAS survey were seen moving toward the vessel when detected by the visual observers. Together with a significant increase in sightings close to the trackline, this behavioral data suggests vessel attraction is likely occurring and may be significant. Although Bradford et al. (2012) employed a half-normal model to minimize the effect of vessel attraction, any potential positive bias could not be entirely eliminated. Tthe abundance estimate is likely still presumably positively biased as a result of vessel attraction, thoughbut the extent of any bias is unknown. The acoustic data collected during the 2010 survey are still being analyzed and additional refinements to this estimate are expected. A 2005 survey (Barlow and Rankin 2007) resulted in a separate abundance estimate of 906 (CV=0.68) false killer whales in international waters south of the Hawaiian Islands EEZ and within the EEZ of Johnston Atoll, but it is unknown how many of these animals might belong to the Hawaii pelagic stock. Minimum Population Estimate The minimum population size is calculated as the lower 20th percentile of the log-normal distribution (Barlow et al 1995) The log-normal 20th percentile of the 2010 abundance estimate for the Hawaiian Islands EEZ outside of 40 km from the main Hawaiian Islands (Bradford et al. 2012) oris 906 false killer whales. The minimum abundance estimate has not been corrected for vessel attraction and may be an over-estimate of minimum population size. The acoustic data collected during the 2010 survey are still being analyzed and additional refinements to this estimate are expected. Current Population Trend No data are available on current population trend. It is incorrect to interpret the increase in the abundance estimate from 2002 to 2010 as an increase in population size, given changes to the survey design in 2010 and the analytical framework specifically intended to better enumerate and account for overall group size, the low precision of each estimate, and a lack of understanding of the oceanographic processes that may drive the distribution of this stock over time. Further, estimation of the detection function for the 2002 and 2010 estimates relied on very similar datasets, such that the resulting abundance estimates are not independent estimates of population size. Further, oOnly a portion of the overall range of this population has been surveyed, precluding evaluation of abundance of the entire stock. CURRENT AND MAXIMUM NET PRODUCTIVITY RATES No data are available on current or maximum net productivity rate for this species in Hawaiian waters. POTENTIAL BIOLOGICAL REMOVAL Following the NMFS Guidelines for Assessing Marine Mammal Stocks (NMFS 2005), the PBR is calculated only within the U.S. EEZ of the Hawaiian Islands, because estimates of human-caused mortality and serious injury are not available from all U.S. and non-U.S. sources in international waters where this stock may occur. The potential biological removal (PBR) level for the Hawaii pelagic stock of false killer whales is thus calculated as the minimum population estimatesize forwithin the U.S. EEZ of the Hawaiian Islands (906) times one half the default maximum net growth rate for cetaceans (½ of 4%) times a recovery factor of 0.50 (for a stock of unknown status with a Hawaiian Islands EEZ mortality and serious injury rate CV = 0.30; Wade and Angliss 1997), resulting in a PBR of 9.1 false killer whales per year. STATUS OF STOCK The status of the Hawaii pelagic stock of false killer whales relative to OSP is unknown, and there are insufficient data to evaluate trends in abundance. No habitat issues are known to be of concern for this stock. This stock is not listed as “threatened” or “endangered” under the Endangered Species Act (1973), nor designated as “depleted” under the MMPA. Following the NMFS Guidelines for Assessing Marine Mammal Stocks (NMFS
195

2005), the status of this transboundary stock of false killer whales is assessed based on the estimated abundance and estimates of mortality and serious injury within the U.S. EEZ of the Hawaiian Islands because estimates of human-caused mortality and serious injury from all U.S. and non-U.S. sources in high seasinternational waters are not available, and because the geographic range of this stock beyond the Hawaiian Islands EEZ is poorly known. Because the rate of mortality and serious injury to false killer whales within the Hawaiian Islands EEZ (12.613.8 animals per year) exceeds the PBR (9.1 animals per year), this stock is considered a “strategic stock” under the MMPA. The total fishery mortality and serious injury for the Hawaii pelagic stock of false killer whales cannot be considered to be insignificant and approaching zero , because it has exceeded the PBR for more than 10 years. NMFS has considered whether the status assessment of this transboundary stock would change if animals outside the Hawaiian Islands EEZ are considered. Using all available peer-reviewed information on the abundance of false killer whales on the high-seas and within the EEZ of Johnston Atoll, a PBR can be calculated as the lower 20th percentile of the Barlow and Rankin (2007) abundance estimate (539), times one half the default maximum net growth rate for cetaceans (½ of 4%) times a recovery factor of 0.50 (for a stock of unknown status with a mortality and serious injury rate CV = 0.30; Wade and Angliss 1997), resulting in 5.4 false killer whales per year. This minimum abundance estimate may be based on a smaller geographic area than the (unknown) full range of the pelagic stock because areas to the north of the Hawaiian Islands EEZ are not included; however, the estimate meets the definition of a ‘minimum population estimate’ under the MMPA. Bycatch information for the high seas is incomplete because the levels of false killer whale takes in non-U.S. fisheries are not known. The average annual estimated mortality and serious injury by U.S. longline vessels operating on the high seas and within the EEZ of Johnston Atoll is 11.3 (McCracken 2011). This value is greater than the PBR of 5.4, and the combined U.S. and international mortality and serious injury is likely substantially higher, because fishing effort by foreign vessels may be up to six times greater than that of the U.S. fleet (NMFS, unpublished data). Better information on the full geographic range of this stock and quantitative estimates of bycatch in international fisheries are needed to reduce the uncertainties regarding impacts of false killer whale takes on the high seas, but these uncertainties do not change the current assessment that the pelagic false killer whale stock is strategic. NORTHWESTERN HAWAIIAN ISLANDS STOCK POPULATION SIZE A 2010 line transect survey that included the waters surrounding the Northwestern Hawaiian Islands produced an estimate of 552 (CV = 1.09) false killer whales attributed to the Northwestern Hawaiian Islands stock (Bradford et al. 2012). This is the best available abundance estimate for false killer whales within the Northwestern Hawaiian Islands. Bradford et al. (2012) reported that most (64%) false killer whale groups seen during the 2010 HICEAS survey were seen moving toward the vessel when detected by the visual observers. Together with a significant increase in sightings close to the trackline, this behavioral data suggests vessel attraction is likely occurring and may be significant. Although Bradford et al. (2012) employed a half-normal model to minimize the effect of vessel attraction, any potential positive bias could not be entirely eliminated. Tthe abundance estimate is likely stillpresumably positively biased as a result of vessel attraction, though but the extent of any bias is unknown. The acoustic data collected during the 2010 survey are still being analyzed and additional refinements to this estimate are expected. Minimum Population Estimate The minimum population size is calculated as the lower 20th percentile of the log-normal distribution (Barlow et al 1995) The log-normal 20th percentile of the 2010 abundance estimate for the Northwestern Hawaiian Islands stock (Bradford et al. 2012) or is 262 false killer whales. This estimate has not been corrected for vessel attraction and may be positively biased.an over-estimate of minimum population size. Current Population Trend No data are available on current population trend because there is only one estimate of abundance from 2010. CURRENT AND MAXIMUM NET PRODUCTIVITY RATES No data are available on current or maximum net productivity rate for this species in the waters surrounding the Northwestern Hawaiian Islands. POTENTIAL BIOLOGICAL REMOVAL The potential biological removal (PBR) level for the Northwestern Hawaiian Islands false killer whale stock is calculated as the minimum population estimate size (262) times one half the default maximum net growth
196

rate for cetaceans (½ of 4%) times a recovery factor of 0.50 (for a stock of unknown status, Wade and Angliss 1997), resulting in a PBR of 2.6 false killer whales per year. STATUS OF STOCK The Northwestern Hawaiian Islands stock of false killer whales is not considered “strategic” under the 1994 amendments to the MMPA. The status of false killer whales in Northwestern Hawaiian Islands waters relative to OSP is unknown, and there are insufficient data to evaluate trends in abundance. Ylitalo et al. (2009) documented elevated levels of polychlorinated biphenyls (PCBs) in three of nine Hawaii insular false killer whales sampled, and biomass of some false killer whale prey species may have declined around the Northwestern Hawaiian Islands (Oleson et al. 2010, Boggs & Ito 1993, Reeves et al. 2009), though waters within the Papahānaumokuākea Marine National Monument have been closed to commercial longlining since 1991. This stock is not listed as “threatened” or “endangered” under the Endangered Species Act (1973), nor as “depleted” under the MMPA. The rate of fishery mortality and serious injury to Northwestern Hawaiian Islands false killer whales within the Northwestern Hawaiian Islands is unknown but may assumed to be insignificant and approaching zero, because commercial and recreational fishing is prohibited within Monument waters and longlines are excluded from the majority of the stock rangezone near Kauai. unknown, but may be approaching zero if the stock remains entirely within Monument waters and the longline exclusion zone near Kauai. Mortality and serious injury does not exceed the PBR (2.6) for this stock. and thus, this stock is not considered “strategic” under the MMPA. REFERENCES Andersen, M. S., K. A. Forney, T. V. N. Cole, T. Eagle, R. Angliss, K. Long, L. Barre, L. Van Atta, D. Borggaard,
T. Rowles, B. Norberg, J. Whaley, and L. Engleby. 2008. Differentiating Serious and Non-Serious Injury of Marine Mammals: Report of the Serious Injury Technical Workshop, 10-13 September 2007, Seattle, Washington. NOAA Technical Memorandum NMFS-OPR-39. 94p.
Angliss, R.P. and D.P. DeMaster. 1997. Differentiating serious and non-serious injury of marine mammals taken incidental to commercial fishing operations: Report of the Serious Injury Workshop 1-2 April. 1997, Silver Spring, MD. NOAA Tech Memo NMFS-OPR-13, 48 p.
Baird, R.W. 2009. A review of false killer whales in Hawaiian waters: biology, status, and risk factors. Report prepared for the U.S. Marine Mammal Commission under Order No. E40475499, December 23, 2009. 40p.
Baird, R.W., A.M. Gorgone, D.J. McSweeney, D.L. Webster, D.R. Salden, M.H. Deakos, A.D. Ligon, G.S. Schorr, J. Barlow and S.D. Mahaffy. 2008. False killer whales (Pseudorca crassidens) around the main Hawaiian Islands: long-term site fidelity, inter-island movements, and association patterns. Marine Mammal Science 24:591-612
Baird, R.W., A.M. Gorgone, D.L. Webster, D.J. McSweeney, J.W. Durban, A.D. Ligon, D.R. Salden, and M.H. Deakos. 2005. False killer whales around the main Hawaiian Islands: An assessment of inter-island movements and population size using individual photo-identification. Contract Report JJ133F04SE0120 prepared for the Pacific Islands Fisheries Science Center, National Marine Fisheries Service, 2570 Dole Street, Honolulu, Hawaii, 96822. 24pp.
Baird, R.W., and A.M. Gorgone. 2005. False killer whale dorsal fin disfigurements as a possible indicator of long-line fishery interactions in Hawaiian waters. Pacific Science 59:593-601.
Baird, R.W., E.M. Oleson, J. Barlow, A.D. Ligon, A.M. Gorgone, and S.D. Mahaffy. 2013 In press. Photo-identification and satellite-tagging of false killer whales during HICEAS 2010: evidence of an island-associated population within the Papahanaumokuakea Marine National Monument. Pacific Science.
Baird, R.W, G.S. Schorr, D.L. Webster, D.J. McSweeney, M.B. Hanson, and R.D. Andrews. 2010. Movements and habitat use of satellite-tagged false killer whales around the main Hawaiian Islands. Endangered Species Research 10:107-121.
Barlow, J., S.L. Swartz, T.C. Eagle, and P.R. Wade. 1995. U.S. Marine Mammal Stock Assessments: Guidelines for Preparation, Background, and a Summary of the 1995 Assessments. U.S. Dep. Commer., NOAA Tech. Memo. NMFS-OPR-6, 73 p.
Barlow, J. 2006. Cetacean abundance in Hawaiian waters estimated from a summer/fall survey in 2002. Marine Mammal Science 22: 446–464.
Barlow, J. and S. Rankin. 2007. False killer whale abundance and density: Preliminary estimates for the PICEAS study area south of Hawaii and new estimates for the US EEZ around Hawaii. Administrative Report LJ-07-02. Southwest Fisheries Science Center, National Marine Fisheries Service, 8604 La Jolla Shores Drive, La Jolla, CA 92037.
Boggs, C.H. and R.Y. Ito. 1993. Hawaii's pelagic fisheries. In: Boehlert GW (ed.). The fisheries of Hawaii and U.S.-associated Pacific Islands. Mar. Fish. Rev. 55(2): 61-68.
197

Bradford, A.L., K.A. Forney, E.M. Oleson, and J. Barlow. 2012. Line-transect abundance estimates of false killer whales (Pseudorca crassidens) in the pelagic region of the Hawaiian Exclusive Economic Zone and in the insular waters of the Northwestern Hawaiian Islands. Pacific Islands Fish. Sci. Cent., Natl. Mar. Fish. Serv., NOAA, Honolulu, HI 96822. Pacific Islands Fish. Sci. Cent. Admin. Rep. H-12-02, 23 p.
Bradford, A.L. and K.A. Forney. 2013. Injury determinations for cetaceans observed interacting with Hawaii and American Samoa longline fisheries during 2007-2011. PIFSC Working Paper WP-13-002.
Chivers, S. J., R. W. Baird, D. J. McSweeney, D. L. Webster, N. M. Hedrick, and J. C. Salinas. 2007. Genetic variation and evidence for population structure in eastern North Pacific false killer whales (Pseudorca crassidens). Can. J. Zool. 85: 783-794.
Chivers S. J., K. A. Forney, and D. Johnston. 2008. Rationale for the 2008 revision to Hawaiian stock boundaries for false killer whales, Pseudorca crassidens. SWFSC Administrative Report LJ-08-04. Available from SWFSC, 8604 La Jolla Shores Drive, La Jolla, CA 92038. 5p.
Chivers, S. J., R. W. Baird, K. M. Martien, B. Taylor, L., E. Archer, A. M. Gorgone, B. L. Hancock, N. Hedrick, M., D. K. Mattila, D. J. McSweeney, E. M. Oleson, C. L. Palmer, V. Pease, K. M. Robertson, J. Robbins, J. C. Salinas, G. S. Schorr, M. Schultz, J. L. Theileking and D. L. Webster. 2010. Evidence of genetic differentiation for Hawai'i insular false killer whales (Pseudorca crassidens). 44p. NOAA Technical Memorandum, NOAA-TM-NMFS-SWFSC-458.
Forney, K.A. 2011. Serious Injury Determinations for marine mammals caught in U.S. longline fisheries in Hawaii and American Samoa. Draft document PSRG-2011-11 presented to the Pacific Scientific Review Group, November 7-9, 2011, Seattle, WA.
Forney, K. A., R. W. Baird, and E. M. Oleson. 2010. Rationale for the 2010 revision of stock boundaries for the Hawai‘i insular and pelagic stocks of false killer whales, Pseudorca crassidens. U.S. Dep. Commer., NOAA Tech. Memo. NMFS-SWFSC-471. 7p.
Johnston, D. W., J. Robbins, M. E. Chapla, D. K. Mattila & K. R. Andrews. 2008. Diversity, habitat associations and stock structure of odontocete cetaceans in the waters of American Samoa, 2003-2006. Journal of Cetacean Research and Management 10: 59-66.
Maldini, D., L. Mazzuca, and S. Atkinson. 2005. Odontocete stranding patterns in the main Hawaiian Islands (1937-2002): How do they compare with live animal surveys? Pacific Science 59(1):55-67.
Martien, K, R.W. Baird, B.L. Taylor, E.M. Oleson, S.J. Chivers. 2011. Population structure and mechanisms of gene flow within island-associated false killer whales (Pseudorca crassidens) around the Hawaiian Archipelago. PSRG-11-14, 19pp.
McCracken, M. L. and K.A. Forney. 2010. Preliminary assessment of incidental interactions with marine mammals in the Hawaii longline deep and shallow set fisheries. NMFS, Pacific Islands Fisheries Science Center Working Paper WP-10-001. 27p.
McCracken, M.L. 2010. Adjustments to false killer whale and short-finned pilot whale bycatch estimates. NMFS, Pacific Islands Fisheries Science Center Working paper WP-10-007, 23p.
McCracken, M. 2013. Preliminary assessment of incidental interactions with marine mammals in the Hawaii longline deep and shallow set fisheries from 2007 to 2011. PIFSC Working Paper WP-13-XXX.
McCracken, M.L. 2011. Assessment of incidental interactions with marine mammals in the Hawaii longline deep and shallow set fisheries from 2006 through 2010. Pacific Islands Fisheries Science Center Working paper WP-11-012, 30p.
Mobley, J.R., Jr, S. S. Spitz, K. A. Forney, R. A. Grotefendt, and P. H. Forestall. 2000. Distribution and abundance of odontocete species in Hawaiian waters: preliminary results of 1993-98 aerial surveys Admin. Rep. LJ-00-14C. Southwest Fisheries Science Center, National Marine Fisheries Service, P.O. Box 271, La Jolla, CA 92038. 26 pp.
Nitta, E. 1991. The marine mammal stranding network for Hawaii: an overview. In: J.E. Reynolds III, D.K. Odell (eds.), Marine Mammal Strandings in the United States, pp.56-62. NOAA Tech. Rep. NMFS 98, 157 pp.
Nitta, E. and J. R. Henderson. 1993. A review of interactions between Hawaii's fisheries and protected species. Mar. Fish. Rev. 55(2):83-92.
NMFS. 2004. Federal Register 69:43338. Authorization for commercial fisheries under the Marine Mammal Protection Act of 1972: Zero Mortality Rate Goal. Available at: www.nmfs.noaa.gov/pr/pdfs/fr/fr69-43338.pdf.
NMFS. 2005. Revisions to Guidelines for Assessing Marine Mammal Stocks. 24 pp. Available at: http://www.nmfs.noaa.gov/pr/pdfs/sars/gamms2005.pdf
NMFS. 2012. NOAA Fisheries Policy Directive 02-038-01 Process for Injury Determinations (01/27/12). Available at: http://www.nmfs.noaa.gov/pr/pdfs/serious_injury_policy.pdf
198
Oleson, E.M. 2009. Assessment of American Samoa longline fishery and estimates of cetacean bycatch, 2006-2008. NMFS, Pacific Islands Fisheries Science Center Working Paper WP-09-006, 12p.
Oleson, E.M., C.H. Boggs, K.A. Forney, M.B. Hanson, D.R. Kobayashi, B.L. Taylor, P.R. Wade, and G.M. Ylitalo. 2010. Status Review of Hawaiian Insular False Killer Whales (Pseudorca crassidens) under the Endangered Species Act. U.S Dep. Commerc. NOAA Tech Memo., NOAA-TM-NMFS-PIFSC-22. 140 p. + Appendices.
Oleson, E.M., C.H. Boggs, K.A. Forney, M.B. Hanson, D.R. Kobayashi, B.L. Taylor, P.R. Wade, and G.M. Ylitalo. 2012. Reevaluation of the DPS designation for Hawaiian (now Main Hawaiian Islands) insular false killer whales. Pacific Islands Fisheries Science Center Internal Report IR-12-038. 39 pp. Available at: http://www.pifsc.noaa.gov/library/pubs/IR-12-038.pdf
Reeves, R.R., S. Leatherwood, and R.W. Baird. 2009. Evidence of a possible decline since 1989 in false killer whales (Pseudorca crassidens) around the main Hawaiian Islands. Pacific Science 63(2): 253–261.
Shallenberger, E.W. 1981. The status of Hawaiian cetaceans. Final report to U.S. Marine Mammal Commission. MMC-77/23, 79pp.
Stacey, P. J., S. Leatherwood, and R. W. Baird. 1994. Pseudorca crassidens. Mamm. Spec. 456:1-6. Wade, P. R. and R. P. Angliss. 1997. Guidelines for Assessing Marine Mammal Stocks: Report of the GAMMS
Workshop April 3-5, 1996, Seattle, Washington. U. S. Dep. Commer., NOAA Tech. Memo. NMFS-OPR-12. 93 pp.
Ylitalo, G. M., R. W. Baird, G. K. Yanagida, D. L. Webster, S. J. Chivers, J. L. Bolton, G. S. Schorr and D. J. McSweeney. 2009. High levels of persistent organic pollutants measured in blubber of island-associated false killer whales (Pseudorca crassidens) around the main Hawaiian Islands. Marine Pollution Bulletin 58: 1932-1937.
199

Revised 01/15/2011 9/23/2013 KILLER WHALE (Orcinus orca):
Hawaiian Stock STOCK DEFINITION AND GEOGRAPHIC RANGE Killer whales have been observed in all oceans and seas of the world (Leatherwood and Dahlheim 1978). Although reported from tropical and offshore waters (Heyning and Dahlheim 1988), killer whales prefer the colder waters of both hemispheres, with greatest abundances found within 800 km of major continents (Mitchell 1975). They are considered rare in Hawaiian waters. No killer whales were seen during 1993-98 aerial surveys within about 25 nmi of the main Hawaiian Islands, but one sighting was reported during subsequent surveys (Mobley et al. 2000, 2001). Baird et al. (2006) reported 21 sighting records in Hawaiian waters between 1994 and 2004. Summer/fall shipboard surveys of U.S. Exclusive Economic Zone (EEZ) Hawaiian waters resulted in two sightings in 2002 and one in 2010. Two sightings of killer whales were made during a 2002 shipboard survey of waters within the U.S. Exclusive Economic Zone (EEZ) of the Hawaiian Islands (Figure 1; Barlow 2006; Bradford et al 2013). Three One strandings have been reported from the island of Hawaii was reported in since 1950 (Richards 1952, NMFS PIR Marine Mammal Reponses Network database), including one since 2007. Eighteen and 21 additional sightings or strandings were reported around the main Hawaiian Islands, French Frigate Shoals, and offshore of the Hawaiian islands (Baird et al. 2006). Except in the northeastern Pacific where "resident", "transient", and “offshore” stocks have been described for coastal waters of Alaska, British Columbia, and Washington to California (Bigg 1982; Leatherwood et al. 1990, Bigg et al. 1990, Ford et al. 1994), little is known about stock structure of killer whales in the North Pacific. Baird et al. (2006) report a sighting of this species off the island of Hawaii in 2003. A global-scale analysis of killer whale phylogeographic structure clustered one animal sampled near Hawaii with eastern and western North Pacific transients. The other Hawaii sample within that analysis did not cluster with any known ecotype, but had divergence time between that of transient and offshore forms (Morin et al 2010) and also note analyses of genetic results from two samples collected, indicating a haplotype similar to the Gulf of Alaska “transient” killer whales and one similar to that of mammal eating killer whales in coastal Alaska.
For the Marine Mammal Protection Act (MMPA) stock assessment reports, eight killer whale stocks are recognized within the Pacific U.S. EEZ: 1) the Eastern North Pacific Alaska Resident stock - occurring from southeastern Alaska to the Aleutian Islands and Bering Sea, 2) the Eastern North Pacific Northern Resident stock - occurring from British Columbia through part of southeastern Alaska, 3) the Eastern North Pacific Southern Resident stock – occurring mainly within the inland waters of Washington State and southern British Columbia, but also in coastal waters from British Columbia through California, 4) the Eastern North Pacific Gulf of Alaska, Aleutian Islands, and Bering Sea Transient stock - occurring mainly from Prince William Sound through the Aleutian Islands and Bering Sea, 5) the AT1 Transient stock - occurring in Alaska from Prince William Sound through the Kenai Fjords, 6) the West Coast Transient stock - occurring from California through southeastern Alaska, 7) the Eastern North Pacific Offshore stock - occurring from California through Alaska, and 8) the Hawaiian stock (this report). The Hawaii stock includes animals found both within the Hawaiian Islands EEZ and in adjacent international high seas waters. ; however, bBecause data on abundance, distribution, and human-caused impacts are
Figure 1. Locations of killer whale sightings from longline observer records (crosses; NMFS/PIR, unpublished data) and Killer whale sighting locations during the 2002 (open diamonds) and 2010 (black diamonds) shipboard surveys of U.S. EEZ waters surrounding the Hawaiian Islands (Barlow 2006, Bradford et al 2013; see Appendix 2 for details on timing and location of survey effort). Outer line represents approximate boundary of survey area and U.S. EEZ. Gray shading indicates area of Papahanaumokuakea Marine National Monument. Dotted line represents the 1,000m isobath.
200
largely lacking for international high seas waters, the status of this stock is evaluated based on data from U.S. EEZ waters of the Hawaiian Islands (NMFS 2005). Stock assessment reports for the Southern Resident, Eastern North Pacific Offshore, and Hawaiian stocks can be found in the Pacific Region stock assessment reports; all other killer whale stock assessments are included in the Alaska Region stock assessments. POPULATION SIZE Population sizes for killer whales in the coastal waters of British Columbia and Washington are known from photo-identification studies (Bigg et al. 1990). The population of killer whales in the eastern tropical Pacific has been estimated from shipboard sightings surveys (Wade and Gerrodette 1993). A 2002 shipboard line-transect survey of the entire Hawaiian Islands EEZ resulted in an abundance estimate of 349 (CV=0.98) killer whales (Barlow 2006). The recent 2010 shipboard line-transect survey of the Hawaiian Islands EEZ resulted in an abundance estimate of 101 (CV = 1.0) killer whales (Bradford et al 2013). This is currently the best available abundance estimate for this stock. Minimum Population Estimate The minimum population size is calculated as the lower 20th percentile of the log-normal distribution (Barlow et al 1995) The log-normal 20th percentile of the 2002 2010 abundance estimate (Barlow 2006) is 175 or 50 killer whales within the Hawaiian Islands EEZ. Current Population Trend No data are available on current population trend. The broad and overlapping confidence intervals around the 2002 and 2010 estimates preclude assessment of trend with the available data. CURRENT AND MAXIMUM NET PRODUCTIVITY RATES No data are available on current and maximum net productivity rate in Hawaiian waters. POTENTIAL BIOLOGICAL REMOVAL The potential biological removal (PBR) level for this stock is calculated as the minimum population size within the U.S. EEZ of the Hawaiian Islands (50) (175) times one half the default maximum net growth rate for cetaceans (½ of 4%) times a recovery factor of 0.50 (for a stock of unknown status with no known fishery mortality or serious injury within the Hawaiian Islands EEZ; Wade and Angliss 1997), resulting in a PBR of 1.0 1.8 killer whales per year. HUMAN-CAUSED MORTALITY AND SERIOUS INJURY New Serious Injury Guidelines NMFS updated its serious injury designation and reporting process, which uses guidance from previous serious injury workshops, expert opinion, and analysis of historic injury cases to develop new criteria for distinguishing serious from non-serious injury (Angliss and DeMaster 1998, Andersen et al. 2008, NOAA 2012). NMFS defines serious injury as an “injury that is more likely than not to result in mortality”. Injury determinations for stock assessments revised in 2013 or later incorporate the new serious injury guidelines, based on the most recent 5-year period for which data are available. Fishery Information Information on fishery-related mortality and serious injury of cetaceans in Hawaiian waters is limited, but the gear types used in Hawaiian fisheries are responsible for marine mammal mortality and serious injury in other fisheries throughout U.S. waters. Gillnets appear to capture marine mammals wherever they are used, and float lines from lobster traps and longlines can be expected to occasionally entangle cetaceans (Perrin et al. 1994No interactions between nearshore fisheries and killer whales have been reported in Hawaiian waters. No estimates of human-caused mortality or serious injury are currently available for nearshore hook and line or gillnet fisheries because these fisheries are not observed or monitored for protected species bycatch.). Interactions with cetaceans have been reported for all Hawaiian pelagic fisheries (Nitta and Henderson 1993), but kKiller whale interactions with Hawaii fisheries appear to be rare. In 1990, a solitary killer whale was reported to have removed the catch from a longline in Hawaii (Dollar 1991). There are currently two distinct longline fisheries based in Hawaii: a deep-set longline (DSLL) fishery that targets primarily tunas, and a shallow-set longline fishery (SSLL) that targets swordfish. Both fisheries operate within U.S. waters and on the high seas. Between 2004 and 2008 2007 and 2011, no killer whales were observed hooked or entangled in the SSLL fishery
201
(100% observer coverage) or the DSLL fishery (20-2228% observer coverage) (McCracken 2013, Bradford & Forney 2013& Forney 2010). Interaction rates between dolphins and the NWHI bottomfish fishery have been estimated based on studies conducted in 1990-1993, indicating that an average of 2.67 dolphin interactions, most likely involving bottlenose and rough-toothed dolphins, occurred for every 1000 fish brought on board (Kobayashi and Kawamoto 1995). Fishermen claim interactions with dolphins that steal bait and catch are increasing. It is not known whether these interactions result in serious injury or mortality of dolphins, nor whether killer whales are involved. STATUS OF STOCK The Hawaii stock of killer whales is not considered strategic under the 1994 amendments to the MMPA. The status of killer whales in Hawaiian waters relative to OSP is unknown, and there are insufficient data to evaluate trends in abundance. No habitat issues are known to be of concern for this stock. Killer whalesThis species isare not listed as “threatened” or “endangered” under the Endangered Species Act (1973), nor designated as “depleted” under the MMPA. Given the absence of recent recorded fishery-related mortality or serious injuries, the Hawaiian stock of killer whales is not considered strategic under the 1994 amendments to the MMPA , and the total fishery mortality and serious injury can be considered to be insignificant and approaching zero. REFERENCES Anderson, M.S., K.A. Forney, T.V.N. Cole, T. Eagle, R.P. Angliss, K. Long, L. Barre, L. VanAtta, D. Borggaard, T.
Rowles, B. Norberg, J. Whaley, L. Engleby. Differentiating serious and non-serious injury of marine mammals: Report of the Serious Injury Technical Workshop 10-13 September 2007, Seattle, WA. NOAA Tech Memo NMFS-OPR-39, 94 p.
Angliss, R.P. and D.P. DeMaster. 1997. Differentiating serious and non-serious injury of marine mammals taken incidental to commercial fishing operations: Report of the Serious Injury Workshop 1-2 April. 1997, Silver Spring, MD. NOAA Tech Memo NMFS-OPR-13, 48 p.
Baird, R.W., D.J. McSweeney, C. Bane, J. Barlow, D.R. Salden, L.K. Antoine, R.G. DeLuc, and D.L. Webster. 2006. Killer whales in Hawaiian waters: Information on population identity and feeding habits. Pacific Science 60(4): 523-530.
Barlow, J. 2006. Cetacean abundance in Hawaiian waters estimated from a summer/fall survey in 2002. Marine Mammal Science 22(2): 446-464.
Barlow, J., S.L. Swartz, T.C. Eagle, and P.R. Wade. 1995. U.S. Marine Mammal Stock Assessments: Guidelines for Preparation, Background, and a Summary of the 1995 Assessments. U.S. Dep. Commer., NOAA Tech. Memo. NMFS-OPR-6, 73 p.
Bigg, M. A. 1982. An assessment of killer whale (Orcinus orca) stocks off Vancouver Island, British Columbia. Rep. Int. Whal. Commn. 32:655-666.
Bigg, M. A., P. F. Olesiuk, G. M. Ellis, J. K. B. Ford, and K. C. Balcomb, III. 1990. Social organization and genealogy of resident killer whales (Orcinus orca) in the coastal waters of British Columbia and Washington State. Rep. Int. Whal. Commn. (Spec. Iss. 12):383-405.
Bradford, A.L. and K.A. Forney. 2013. Injury determinations for cetaceans observed interacting with Hawaii and American Samoa longline fisheries during 2007-2011. PIFSC Working Paper WP-13-002.
Bradford. A.L., K.A. Forney, E.M. Oleson, and J. Barlow. 2013. Line-transect abundance estimates of cetaceans in the Hawaiian EEZ. PIFSC Working Paper WP-13-004.
Dollar, R. A. 1991. Summary of swordfish longline observations in Hawaii, July 1990-March 1991. Southwest Fish. Cent. Admin. Rep. H-91-09, 13 pp.
Ford, J. K. B., G. M. Ellis, and K.C. Balcomb. 1994. Killer whales. The natural history and genealogy of Orcinus orca in British Columbia and Washington State. UBC Press, Vancouver, Canada.
Forney, K.A. 2009. Serious injury determinations for cetaceans caught in Hawaii longline fisheries during 1994-2008. Draft document PSRG-2009-09 presented to the Pacific Scientific Review Group, November 3-5, 2009, Del Mar, CA.
Heyning, J. E. and M. E. Dahlheim. 1988. Orcinus orca. Mamm. Spec.304:1-9. Kobayashi, D. R. and K. E. Kawamoto. 1995. Evaluation of shark, dolphin, and monk seal interactions with
Northwestern Hawaiian Island bottomfishing activity: a comparison of two time periods and an estimate of economic impacts. Fisheries Research 23: 11-22.
Leatherwood, J. S., and M. E. Dahlheim. 1978. Worldwide distribution of pilot whales and killer whales. Naval Ocean Systems Center, Tech. Rep. 443:1-39.
Leatherwood, S., C. O. Matkin, J. D. Hall, and G. M. Ellis. 1990. Killer whales, Orcinus orca, photo-identified in
202

Prince William Sound, Alaska, 1976 through 1987. Can Field-Nat. 104:362-371. McCracken M., and K.A. Forney. 2010. Preliminary assessment of incidental interactions with marine mammals in
the Hawaii longline deep and shallow set fisheries. NMFS, Pacific Islands Fisheries Science Center Working Paper WP-10-001. 27p
McCracken, M. 2013. Preliminary assessment of incidental interactions with marine mammals in the Hawaii longline deep and shallow set fisheries from 2007 to 2011. PIFSC Working Paper WP-13-XXX.
Mitchell, E. D. 1975. Report on the meeting on small cetaceans, Montreal, April 1-11, 1974. J. Fish. Res. Board Canada, 32:914-916.
Mobley, J. R., Jr, S. S. Spitz, K. A. Forney, R. A. Grotefendt, and P. H. Forestall. 2000. Distribution and abundance of odontocete species in Hawaiian waters: preliminary results of 1993-98 aerial surveys Admin. Rep. LJ-00-14C. Southwest Fisheries Science Center, National Marine Fisheries Service, P.O. Box 271, La Jolla, CA 92038. 26 pp.
Mobley, J. R. , L. Mazzuca, A. S. Craig, M. W. Newcomer, and S. S. Spitz. 2001. Killer whales (Orcinus orca) sighted West of Ni'ihau, Hawai'i. Pacific Science 55:301_303.
Morin, P.A., F.I. Archer, A.D. Foote, et al. 2010. Complete mitochondrial genome phylogeographic analysis of killer whales (Orcinus orca) indicates multiple species. Gen. Res. 20: 908-916.
Nitta, E. and J. R. Henderson. 1993. A review of interactions between Hawaii's fisheries and protected species. Mar. Fish. Rev. 55(2):83-92.
NMFS. 2005. Revisions to Guidelines for Assessing Marine Mammal Stocks. 24 pp. Available at: http://www.nmfs.noaa.gov/pr/pdfs/sars/gamms2005.pdf
NMFS. 2012. NOAA Fisheries Policy Directive 02-038-01 Process for Injury Determinations (01/27/12). Available at: http://www.nmfs.noaa.gov/pr/pdfs/serious_injury_policy.pdf
Perrin, W.F., G. P. Donovan and J. Barlow. 1994. Gillnets and Cetaceans. Rep. Int. Whal. Commn., Special Issue 15, 629 pp.
Richards, L. P. 1952. Cuvier's beaked whale from Hawaii. J. Mamm. 33:255. Wade, P. R. and R. P. Angliss. 1997. Guidelines for Assessing Marine Mammal Stocks: Report of the GAMMS
Workshop April 3-5, 1996, Seattle, Washington. U. S. Dep. Commer., NOAA Tech. Memo. NMFS-OPR-12. 93 pp.
Wade, P. R. and T. Gerrodette. 1993. Estimates of cetacean abundance and distribution in the eastern tropical Pacific. Rep. Int. Whal. Commn. 43:477-493.
203

Revised 01/15/20119/23/2013 SHORT-FINNED PILOT WHALE (Globicephala macrorhynchus):
Hawaiian Stock STOCK DEFINITION AND GEOGRAPHIC RANGE Short-finned pilot whales are found in all oceans, primarily in tropical and warm-temperate waters. They are commonly observed around the main Hawaiian Islands and are also present around the Northwestern Hawaiian Islands (Shallenberger 1981; Barlow 2006, Baird et al 2013, Bradford et al 2013). Summer/fall shipboard surveys of the waters within the U.S. Exclusive Economic Zone (EEZ) of the Hawaiian Islands resulted in During a 2002 shipboard survey of waters within the U.S. Exclusive Economic Zone (EEZ) of the Hawaiian Islands, 25 sightings in 2002 and 36 in 2010, including a higher frequency of encounters near shore within the Northwestern Hawaiian Islandssightings of short-finned pilot whales were made (Figure 1; Barlow 2006, Bradford et al 2013). Twenty-three Fourteen strandings of short-finned pilot whales have been documented from the main Hawaiian Islands since 1957, including five mass strandings in May and October of 1958 and 1959 (Tomich 1986; Nitta 1991; Maldini et al. 2005, NMFS-PIR Marine Mammal Response Network database). There have been four strandings since 2007. Stock structure of short-finned pilot whales has not been adequately studied in the North Pacific, except in Japanese waters, where tTwo forms of short-finned pilot whales have been identified in Japanese waters based on pigmentation patterns and differences in the shape of the heads of adult males (Kasuya et al. 1988). The pilot whales in Hawaiian waters are similar morphologically to the Japanese "southern form." Phylogeographic analysis of short-finned pilot whale samples off Hawaii versus those in the eastern tropical Pacific and western Pacific suggest long-term isolation of those animals found in Hawaiian waters (Chivers et al. 2003).
Photo-identification and telemetry studies suggest there may be inshore and pelagic populations of short-finned pilot whales in Hawaiian waters. Resighting and social network analyses of individuals photographed off Hawaii Island suggest the occurrence of one large and several smaller social clusters that use those waters, with some individuals within the smaller social clusters commonly resighted off Hawaii Island (Mahaffy 2012). Further, two groups of 14 individuals have been seen at Hawaii and elsewhere in the main Hawaiian Islands, one off Oahu and the other off Kauai. Satellite telemetry data from over 60 individuals tagged throughout the main Hawaiian Islands also support the occurrence of at least two populations (Oleson et al 2013). Genetic analyses are underway to evaluate differentiation between island-associated versus pelagic short-finned pilot whales. Oleson et al. (2013) suggested formal stock division would be more robust following conclusion of genetics analyses and updating of the social network with more recent sightings data.Preliminary photo-identification work with pilot whales in Hawaii indicated a high degree of site fidelity around the main island of Hawaii (Shane and McSweeney 1990) and around Kauai and Niihau (Baird et al. 2006). Genetic analyses of tissue samples collected near the main Hawaiian Islands indicate that Hawaiian short-finned pilot whales are reproductively isolated from short-finned pilot whales found in the eastern Pacific Ocean (S. Chivers, NMFS/SWFSC, unpublished data); however, the offshore range of this Hawaiian population is unknown. Fishery interactions with short-finned pilot whales demonstrate that this species also occurs in U.S. EEZ waters of Palmyra Atoll and Johnston Atoll (Figure 2), but it is not known whether these animals are part of the Hawaiian stock or whether they represent separate stocks of short-finned pilot whales. Based on patterns of movement and
Figure 1. Short-finned pilot whale sighting locations during the 2002 (open diamonds) and 2010 (black diamonds) shipboard surveys of U.S. EEZ waters surrounding the Hawaiian Islands (Barlow 2006, Bradford et al 2013); see Appendix 2 for details on timing and location of survey effort). Outer solid line represents approximate boundary of survey area and U.S. EEZ. Gray shading indicates area of Papahanaumokuakea Marine National Monument.
204

population structure observed in other island-associated cetaceans (Norris and Dohl 1980; Norris et al.1994; Baird et al. 2008a, 2008b, 2009, Chivers et al 2007, McSweeney et al. 2007, 2009), it is possible that the animals around Palmyra Atoll and Johnston Atoll are one or more separate stocks. Efforts are currently underway to obtain additional samples of short-finned pilot whales for further studies of population structure in the North Pacific Ocean. For the Marine Mammal Protection Act (MMPA) stock assessment reports, short-finned pilot whales within the Pacific U.S. EEZ are divided into two discrete, non-contiguous areas: 1) Hawaiian waters (this report), and 2) waters off California, Oregon and Washington. Information on short-finned pilot whales around Palmyra Atoll and Johnston Atoll will provisionally be included with this stock assessment report, recognizing that separate stock status may be warranted for these animals in the future. Estimates of abundance, potential biological removals, and status determinations will be presented separately for U.S. waters of the Hawaiian Islands, Palmyra Atoll, and Johnston Atoll. The Hawaii, Johnston, and Palmyra stocks each includes animals found both within the Hawaiian Islands EEZ and in adjacent international high seas waters. ; however, because The status of the Hawaii stock is evaluated based ondata on abundance, distribution, and human-caused impacts within the Hawaiian Islands EEZ, as such datasets are largely lacking for high seasinternational waters, the status of each stock is evaluated based on data from U.S. EEZ waters (NMFS 2005). POPULATION SIZE Estimates of short-finned pilot whale populations have been made off Japan (Miyashita 1993) and in the eastern tropical Pacific (Wade and Gerrodette 1993), but it is not known whether any of these animals are part of the same population that occurs around the Hawaiian Islands. A 2002 shipboard line-transect survey of the entire Hawaiian Islands EEZ resulted in an abundance estimate of 8,846 (CV=0.49) short-finned pilot whales (Barlow 2006). The recent 2010 shipboard line-transect survey of the Hawaiian Islands EEZ resulted in an abundance estimate of 12,422 (CV = 0.43) short-finned pilot whales (Bradford et al 2013). This is currently the best available abundance estimate for short-finned pilot whales within the Hawaiian Islands EEZ. No abundance estimates are currently available for short-finned pilot whales in U.S. EEZ waters of Palmyra Atoll; however, density estimates for short-finned pilot whales in other Pacific regions can provide a range of likely abundance estimates in this unsurveyed region. Published estimates of short-finned pilot whale density (animals per km2) in the Pacific are: 0.0040 (CV=0.38) for the U.S. EEZ of the Hawaiian Islands (Barlow 2006); 0.0237 (CV=0.32) for nearshore waters surrounding the main Hawaiian Islands (Mobley et al. 2000), 0.0084 (CV=0.14) and 0.0040 (CV=0.23) for the eastern tropical Pacific Ocean (Wade and Gerrodette 1993; Ferguson and Barlow 2003), and 0.0025 (CV=0.29) for the eastern tropical Pacific Ocean west of 120°W and north of 5°N (Ferguson and Barlow 2003). Applying the lowest and highest of these density estimates to U.S. EEZ waters surrounding Palmyra Atoll (area size = 352,821 km2) yields a range of plausible abundance estimates of 891-8,362 short-finned pilot whales. Similarly, there are no abundance estimates for short-finned pilot whales in U.S. EEZ waters of Johnston Atoll. Applying the lowest and highest of the above density estimates to U.S. EEZ waters surrounding Johnston Atoll (area size = 443,586 km2) yields a range of plausible abundance estimates of 1,121-10,513 short-finned pilot whales. Minimum Population Estimate The minimum population size is calculated as the lower 20th percentile of the log-normal distribution (Barlow et al 1995) The log-normal 20th percentile of the 2002 2010 abundance estimate for the Hawaiian Islands EEZ or(Barlow 2006) is 8,7825,986 short-finned pilot whales. No minimum population estimate is currently available for waters surrounding Palmyra Atoll or Johnston Atoll, but the short-finned pilot whale density estimates from other Pacific regions (Barlow 2006, Mobley et al. 2000, Wade and Gerrodette 1993, Ferguson and Barlow 2003; see above) can provide a range of likely values. The lognormal 20th percentiles of plausible abundance estimates for the Palmyra Atoll EEZ, based on the densities observed elsewhere, range from 701 to 6,429 short-finned pilot whales. The lognormal 20th percentiles of plausible abundance estimates for the Johnston Atoll EEZ, based on the densities observed elsewhere, range from 882 to 8,083 short-finned pilot whales. Current Population Trend The broad and overlapping confidence intervals around the 2002 and 2010 estimates preclude assessment of trend with the available data.No data are available on current population trend. CURRENT AND MAXIMUM NET PRODUCTIVITY RATES No data are available on current or maximum net productivity rate.
205

Figure 2. Locations of short-finned pilot whale takes (filled diamonds) and possible takes of this species (open diamonds) in Hawaii-based longline fisheries, 2007-20112004-2008 . Some take locations overlap. Solid lines represent the U. S. EEZ. Fishery descriptions are provided in Appendix 1.
POTENTIAL BIOLOGICAL REMOVAL The potential biological removal (PBR) level for the Hawaiian short-finned pilot whale stock is calculated as the minimum population estimatesize (8,782 5,986) times one half the default maximum net growth rate for cetaceans (½ of 4%) times a recovery factor of 0.40 (for a species of unknown status with a Hawaiian Islands EEZ fishery mortality and serious injury rate CV> 0.80; Wade and Angliss 1997), resulting in a PBR of 7048 short-finned pilot whales per year. No separate PBR can presently be calculated for Palmyra Atoll waters, but based on the range of plausible minimum abundance estimates (701-6,429), a recovery factor of 0.50 (for a species of unknown status with no known fishery mortality and serious injury within the Palmyra Atoll EEZ; Wade and Angliss 1997), and the default growth rate (½ of 4%), the PBR would likely fall between 7.0 and 64 short-finned pilot whales per year. Similarly, based on the range of plausible minimum abundance estimates for Johnston Atoll (882-8,083), a recovery factor of 0.40 (for a species of unknown status with a fishery mortality and serious injury rate CV>0.80 within the Johnston Atoll EEZ; Wade and Angliss 1997), and the default growth rate (½ of 4%), the PBR would likely fall between 7.1 and 65 short-finned pilot whales per year. HUMAN-CAUSED MORTALITY AND SERIOUS INJURY New Serious Injury Guidelines NMFS updated its serious injury designation and reporting process, which uses guidance from previous serious injury workshops, expert opinion, and analysis of historic injury cases to develop new criteria for distinguishing serious from non-serious injury (Angliss and DeMaster 1998, Andersen et al. 2008, NMFS 2012). NMFS defines serious injury as an “injury that is more likely than not to result in mortality”. Injury determinations for stock assessments revised in 2013 or later incorporate the new serious injury guidelines, based on the most recent 5-year period for which data are available. Fishery Information Information on fishery-related mortality of cetaceans in Hawaiian waters is limited, but the gear types used in Hawaiian fisheries are responsible for marine mammal mortality and serious injury in other fisheries throughout U.S. waters. Gillnets appear to capture marine mammals wherever they are used, and float lines from lobster traps and longlines can be expected to occasionally entangle cetaceans (Perrin et al. 1994). Entanglement in gillnets and hooking or entanglement in various hook and line fisheries have been reported for small cetaceans in Hawaii (Nitta & Henderson, 1993). No estimates of human-caused mortality or serious injury are currently available for nearshore hook and line or gillnet fisheries because these fisheries are not observed or monitored for protected species bycatch. Interactions with cetaceans have been reported for all Hawaiian pelagic fisheries (Nitta and Henderson 1993). There are currently two distinct longline fisheries based in Hawaii: a deep-set longline (DSLL) fishery that targets primarily tunas, and a shallow-set longline fishery (SSLL) that targets swordfish. Both fisheries operate within U.S. waters and on the high seas, but are prohibited from operating within the Papahanaumokuakea Marine National Monument, a region that extends 50 nmi from shore
206

around the Northwestern Hawaiian Islands, and within the Longline Exclusion Area, a region extending 25-75 nmi from shore around the main Hawaiian Islands. Between 2007 and 20112004 and 2008, no short-finned pilot whales were observed hooked or entangled in the SSLL fishery (100% observer coverage), and foureight short-finned pilot whales were observed taken in the DSLL fishery (20-28% observer coverage) (Bradford & Forney 2013, McCracken 2013Forney 2009, McCracken 2009), all in high-seas waters. Based on an evaluation of the observer’s description of the interaction and following the most recently developed criteria for assessing serious injury in marine mammals (Andersen et al. 2008 NMFS 2012), two short-finned pilot whales taken in international waters were considered not seriously injured, and the other two remaining , six (four in international waters, one in the Hawaiian Islands EEZ, and one in the EEZ of Johnston Atoll) were considered seriously injured (Bradford & Forney 2013Forney 2009). Average 5-yr estimates of annual mortality and serious injury for 2004-2008 are 2.0 (CV = 0.5) short-finned pilot whales outside of U.S. EEZs, 0.7 (CV=1.4) within the Hawaiian Islands EEZ, and 0.5 (CV=0.8) within the Johnston Atoll EEZ (McCracken & Forney 2010). Seven additional unidentified “blackfish” (unidentified cetaceans known to be either false killer whales or short-finned pilot whales) that may have been pilot whales were also seriously injured during 2007-2011 (Bradford & Forney 2013). Additionally, one unidentified blackfish was taken on the high seas in the deep set longline fishery in 2011, but was not seriously injured (Table 1). Five of the seven serious injuries were taken in the DSLL fishery within U.S. EEZ waters and the remaining two serious injuries were taken the SSLL fishery on the high seas (Table 1 and Figure 3).Unidentified blackfish are prorated to each stock based on distance from shore (McCracken 2010). The distance-from-shore model was chosen following consultation with the Pacific Scientific Review Group, based on the model’s performance and simplicity relative to a number of other more complicated models with similar output (McCracken 2010). Proration of unidentified blackfish takes introduces unquantified uncertainty into the bycatch estimates, but until all animals taken can be identified to species (e.g., photos, tissue samples), this approach ensures that potential impacts to all stocks are assessed. Average 5-yr estimates of annual mortality and serious injury for 2007-2011 are 0.7 (CV = 2.1) short-finned pilot whales outside of U.S. EEZs and 0.1 (CV = 7.2) within the Hawaiian Islands EEZ. Although M&SI estimates are shown as whole numbers of animals, the 5-yr average M&SI is calculated based on the unrounded annual estimates. Eight unidentified cetaceans were taken in the DSLL fishery, and two unidentified cetaceans were taken in the SSLL fishery, some of which may have been short-finned pilot whales.
Eight additional unidentified cetaceans, which may have been short-finned-pilot whales, were also taken during 2004-2008. Six of these were taken in the DSLL fishery in Hawaiian Islands EEZ waters, one was taken in the DSLL fishery in international waters, and one was taken in the SSLL fishery in international waters (Figure 2). Interaction rates between dolphins and the NWHI bottomfish fishery have been estimated based on studies conducted in 1990-1993, indicating that an average of 2.67 dolphin interactions, most likely involving bottlenose and rough-toothed dolphins, occurred for every 1000 fish brought on board (Kobayashi and Kawamoto 1995). Fishermen claim interactions with dolphins that steal bait and catch are increasing. It is not known whether these interactions result in serious injury or mortality of dolphins, nor whether short-finned pilot whales are involved. Table 1. Summary of available information on incidental mortality and serious injury of short-finned pilot whales (Hawaii stock) and including those presumed to be short-finned pilot whales based on assignment of unidentified blackfish to this species in commercial fisheries, within and outside of the U.S. EEZs (McCracken 2013). Mean annual takes are based on 2007-2011 data unless otherwise indicated. Information on all observed takes (T) and combined mortality events & serious injuries (MSI) is included. Total takes were prorated to deaths, serious injuries, and non-serious injuries based on the observed proportions of each outcome. Unidentified blackfish are pro-rated as either false killer whales or short-finned pilot whales according to their distance from shore (McCracken 2010). CVs are estimated based on the combination of annual short-finned pilot whale and blackfish variances and do not yet incorporate additional uncertainty introduced by prorating the unidentified blackfish.
Fishery Name Year Data Type
Percent Observer Coverage
Observed total interactions (T) and mortality events, and serious injuries (MSI), and total estimated mortality and serious injury (M&SI) of short-
finned pilot whales (GM) Outside U.S. EEZs Hawaiian EEZ
Obs. GM T/MSI Estimated
M&SI (CV)
Obs. GM T/MSI Estimated
M&SI (CV) Obs. UB T/MSI Obs. UB T/MSI
Hawaii-based deep-set longline 2007
Observer data 20%
1/1 0 2 (2.4)
0 0 0 (-)
207

STATUS OF STOCK The Hawaii stock of short-finned pilot whales is not considered strategic under the 1994 amendments to the
MMPA. The status of short-finned pilot whales in Hawaiian waters relative to OSP is unknown, and there are insufficient data to evaluate trends in abundance. No habitat issues are known to be of concern for this species. Short-finned pilot whales It isare not listed as “threatened” or “endangered” under the Endangered Species Act (1973), nor designated as “depleted” under the MMPA. The Hawaiian stock of short-finned pilot whales is not considered strategic under the 1994 amendments to the MMPA, because tThe estimated rate of mortality and serious injury within the Hawaiian Islands EEZ (0.1 7 animals per year) is less than the PBR (70 52). Although no estimates of abundance or PBR are currently available for short-finned pilot whales around Johnston Atoll, the estimated average rate of mortality and serious injury of short-finned pilot whales within the EEZ of Johnston Atoll ( 0.5 animals per year) is below the range of likely PBRs (7.1 to 65) for this region. There have been no serious injuries or mortality of short-finned pilot whales within the Palmyra Atoll EEZ. The potential effects of mortality and serious injuries of short-finned pilot whales in the Hawaii-based fishery in international waters is not known, because no abundance estimates or international bycatch estimates are available. Based on the available data, which indicate total fishery-related takes are less than 10% of PBR, the total fishery mortality and serious injury for short-finned pilot whales can be considered to be insignificant and approaching zero. Table 1. Summary of available information on incidental mortality and serious injury of short-finned pilot whales (Hawaiian stock) including those presumed to be short-finned pilot whales based on assignment of to this speciesin commercial fisheries, within and outside of the U.S. EEZs (McCracken & Forney 2010). Mean annual takes are based on 2004-2008 data unless otherwise indicated.
Fishery Name Year
Data Type
Percent Observer Coverage
Observed and estimated mortality and serious injury of short-finned pilot whales, by EEZ region
Outside of U.S. EEZs Hawaiian Islands EEZ Johnston Atoll EEZ
Obs.
Estimated (CV)
Mean Annual Takes (CV)
Obs.
Estimated (CV)
Mean Annual Takes (CV)
Obs. Estimated (CV)
Mean Annual Takes (CV)
Hawaii-based deep-set longline fishery
2004 2005 2006 2007 2008
observer data
25% 28% 22% 20% 22%
0 1 1 1 1
0 (-) 4 (0.4) 1 (2.1) 2 (1.5) 3 (0.8)
2.0 (0.5)
0 0 1 0 0
0 (-) 0 (-)
4 (0.7) 0 (-) 0 (-)
0.7
(1.4)
1 0 0 0 0
3 (0.2) 0 (-) 0 (-) 0 (-) 0 (-)
0.5
(0.8)
fishery 2008 22%
3/1 0 2 (1.6)
0 3/3 0 (0.5)
2009 21% 0 0 0 (-)
0 0 0 (-)
2010 21% 0 0 0 (-)
0 1/1 0 (1.2)
2011 20% 0
1/0 0 (1.1) 0
1/1 0 (0.9) Mean Estimated Annual Take (CV) 1.0 (2.1) 0.1 (7.2)
Hawaii-based shallow-set
longline fishery
2007
Observer data
100% 0 0 0
0 0 0
2008 100% 0
1/1 0 0 0 0
2009 100% 0 0 0
0 0 0
2010 100% 0 0 0
0 0 0
2011 100% 0
1/1 0 0 0 0
Mean Annual Takes (100% coverage) 0.1 0 Minimum total annual takes within U.S. EEZ 0.1 (7.2)
208

Fishery Name Year
Data Type
Percent Observer Coverage
Observed and estimated mortality and serious injury of short-finned pilot whales, by EEZ region
Outside of U.S. EEZs Hawaiian Islands EEZ Johnston Atoll EEZ
Obs.
Estimated (CV)
Mean Annual Takes (CV)
Obs.
Estimated (CV)
Mean Annual Takes (CV)
Obs. Estimated (CV)
Mean Annual Takes (CV)
Hawaii-based shallow-set longline fishery
2004 2005 2006 2007 2008
observer data
100% 100% 100% 100% 100%
0 0 0 0 0
Same as observed
0 (n/a)
0 0 0 0 0
Same as observed
0
0 0 0 0 0
Same as observed
0
Minimum total annual takes within U.S. EEZ waters 1.2 (1.02) REFERENCES Andersen, M. S., K. A. Forney, T. V. N. Cole, T. Eagle, R. Angliss, K. Long, L. Barre, L. Van Atta, D. Borggaard,
T. Rowles, B. Norberg, J. Whaley, and L. Engleby. 2008. Differentiating Serious and Non-Serious Injury of Marine Mammals: Report of the Serious Injury Technical Workshop, 10-13 September 2007, Seattle, Washington. NOAA Technical Memorandum NMFS-OPR-39. 94p.
Angliss, R.P. and D.P. DeMaster. 1998. Differentiating Serious and Non-Serious Injury of Marine Mammals Taken Incidental to Commercial Fishing Operations. NOAA Tech Memo. NMFS-OPR-13, 48 p.
Baird, R.W., G.S. Schorr, D.L. Webster, S.D. Mahaffy, A.B. Douglas, A.M. Gorgone, and D.J. McSweeney. 2006. A survey for odontocete cetaceans off Kaua'i and Ni'ihau, Hawai'i, during October and November 2005: evidence for population structure and site fidelity. Report prepared under contract #AB133F05SE519 to Pacific Islands Fisheries Science Center, National Marine Fisheries Service, 2570 Dole Street, Honolulu, HI 96822, USA. 16p.
Baird, R.W., A.M. Gorgone, D.J. McSweeney, D.L. Webster, D.R. Salden, M.H. Deakos, A.D. Ligon, G.S. Schorr, J. Barlow and S.D. Mahaffy. 2008a. False killer whales (Pseudorca crassidens) around the main Hawaiian Islands: long-term site fidelity, inter-island movements, and association patterns. Marine Mammal Science 24:591-612.
Baird, R.W., D.L. Webster, S.D. Mahaffy, D.J. McSweeney, G.S. Schorr and A.D. Ligon. 2008b. Site fidelity and association patterns in a deep-water dolphin: rough-toothed dolphins (Steno bredanensis) in the Hawaiian Archipelago. Marine Mammal Science 24:535-553.
Baird, R.W., A.M. Gorgone, D.J. McSweeney, A.D. Ligon, M.H. Deakos, D.L. Webster, G.S. Schorr, K.K. Martien, D.R. Salden, and S.D. Mahaffy. 2009. Population structure of island-associated dolphins: evidence from photo-identification of common bottlenose dolphins (Tursiops truncatus) in the main Hawaiian Islands. Marine Mammal Science 25:251-274.
Baird, R.W., D.L. Webster, J.M. Aschettino, G.S. Schorr and D.J. McSweeney. 2013. Odontocete cetaceans around the main Hawaiian Islands: habitat use and relative abundance from small-boat sighting surveys. Aquatic Mammals, in press.
Barlow, J. 2006. Cetacean abundance in Hawaiian waters estimated from a summer/fall survey in 2002. Marine Mammal Science 22: 446–464.
Barlow, J., S.L. Swartz, T.C. Eagle, and P.R. Wade. 1995. U.S. Marine Mammal Stock Assessments: Guidelines for Preparation, Background, and a Summary of the 1995 Assessments. U.S. Dep. Commer., NOAA Tech. Memo. NMFS-OPR-6, 73 p.
Bradford, A.L. and K.A. Forney. 2013. Injury determinations for cetaceans observed interacting with Hawaii and American Samoa longline fisheries during 2007-2011. PIFSC Working Paper WP-13-002.
Bradford. A.L., K.A. Forney, E.M. Oleson, and J. Barlow. 2013. Line-transect abundance estimates of cetaceans in the Hawaiian EEZ. PIFSC Working Paper WP-13-004.
Chivers, S. J., R. W. Baird, D. J. McSweeney, D. L. Webster, N. M. Hedrick, and J. C. Salinas. 2007. Genetic variation and evidence for population structure in eastern North Pacific false killer whales (Pseudorca crassidens). Can. J. Zool. 85: 783-794.
Chivers, S.J., R.G. LeDuc AND R.W. Baird. 2003. Hawaiian Island populations of false killer whales and short-finned pilot whales revealed by genetic analyses. Page 32, In: Abstracts of the 15th Biennial Conference on the Biology of Marine Mammals, Greensboro, NC, 14–19 December 2003.
Ferguson, M. C. and J. Barlow. 2003. Addendum: Spatial distribution and density of cetaceans in the eastern
209

tropical Pacific Ocean based on summer/fall research vessel surveys in 1986-96. Administrative Report LJ-01-04 (addendum), Southwest Fisheries Science Center, National Marine Fisheries Service, 8604 La Jolla Shores Drive, La Jolla, CA 92037.
Forney, K.A. 2009. Serious injury determinations for cetaceans caught in Hawaii longline fisheries during 1994-2008. Draft document PSRG-2009-09 presented to the Pacific Scientific Review Group, November 3-5, 2009, Del Mar, CA.
Kasuya, T., T. Miyashita, and F. Kasamatsu. 1988. Segregation of two forms of short-finned pilot whales off the Pacific coast of Japan. Sci. Rep. Whales Res. Inst. 39:77-90.
Kobayashi, D. R. and K. E. Kawamoto. 1995. Evaluation of shark, dolphin, and monk seal interactions with Northwestern Hawaiian Island bottomfishing activity: a comparison of two time periods and an estimate of economic impacts. Fisheries Research 23: 11-22.
Maldini, D., L. Mazzuca, and S. Atkinson. 2005. Odontocete stranding patterns in the Main Hawaiian Islands (1937-2002): How do they compare with live animal surveys? Pacific Science 59(1):55-67.
McCracken, M.L. 2010. Adjustments to false killer whale and short-finned pilot whale bycatch estimates. NMFS, Pacific Islands Fisheries Science Center Working paper WP-10-007, 23p.
McCracken, M. 2013. Preliminary assessment of incidental interactions with marine mammals in the Hawaii longline deep and shallow set fisheries from 2007 to 2011. PIFSC Working Paper WP-13-XXX.
McCracken M., and K.A. Forney. 2010. Preliminary assessment of incidental interactions with marine mammals in the Hawaii longline deep and shallow set fisheries. NMFS, Pacific Islands Fisheries Science Center Working Paper WP-10-001. 27p.McCracken, M.L. 2010. Adjustments to false killer whale and short-finned pilot whale bycatch estimates. NMFS, Pacific Islands Fisheries Science Center Working paper WP-10-007, 23p.
McSweeney, D.J., R.W. Baird and S.D. Mahaffy. 2007. Site fidelity, associations and movements of Cuvier’s (Ziphius cavirostris) and Blainville’s (Mesoplodon densirostris) beaked whales off the island of Hawai‘i. Marine Mammal Science 23:666-687.
McSweeney, D.J., R.W. Baird, S.D.Mahaffy, D.L. Webster, and G.S. Schorr. 2009. Site fidelity and association patterns of a rare species: Pygmy killer whales (Feresa attenuata) in the main Hawaiian Islands. Marine Mammal Science 25(4): 557-572.
Miyashita, T. 1993. Abundance of dolphin stocks in the western North Pacific taken by the Japanese drive fishery. Rep. Int. Whal. Commn. 43:417-437.
Mobley, J. R. , Jr, S. S. Spitz, K. A. Forney, R. A. Grotefendt, and P. H. Forestall. 2000. Distribution and abundance of odontocete species in Hawaiian waters: preliminary results of 1993-98 aerial surveys Admin. Rep. LJ-00-14C. Southwest Fisheries Science Center, National Marine Fisheries Service, P.O. Box 271, La Jolla, CA 92038. 26 pp.
Nitta, E. 1991. The marine mammal stranding network for Hawaii: an overview. In: J.E. Reynolds III, D.K. Odell (eds.), Marine Mammal Strandings in the United States, pp.56-62. NOAA Tech. Rep. NMFS 98, 157 pp.
Nitta, E. and J. R. Henderson. 1993. A review of interactions between Hawaii's fisheries and protected species. Mar. Fish. Rev. 55(2):83-92.
NMFS. 2005. Revisions to Guidelines for Assessing Marine Mammal Stocks. 24 pp. Available at: http://www.nmfs.noaa.gov/pr/pdfs/sars/gamms2005.pdf
NOAA. 2012. NOAA Fisheries Policy Directive 02-038-01 Process for Injury Determinations (01/27/12). Available at: http://www.nmfs.noaa.gov/pr/pdfs/serious_injury_policy.pdf
Norris, K. S., B. Würsig, R. S. Wells, and M. Würsig. 1994. The Hawaiian Spinner Dolphin. University of California Press, 408 pp.
Norris, K. S. and T. P. Dohl. 1980. Behavior of the Hawaiian spinner dolphin, Stenella longirostris. Fish. Bull. 77:821-849.
Oleson, E.M., R.W. Baird, K.K. Martien, and B.L. Taylor. 2013. Island-associated stocks of odontocetes in the main Hawaiian Islands: A synthesis of available information to facilitate evaluation of stock structure. PIFSC Working Paper WP-13-003.
Perrin, W.F., G. P. Donovan and J. Barlow. 1994. Gillnets and Cetaceans. Rep. Int. Whal. Commn., Special Issue 15, 629 pp.
Shallenberger, E.W. 1981. The status of Hawaiian cetaceans. Final report to U.S. Marine Mammal Commission. MMC-77/23, 79pp.
Shane, S. H. and D. McSweeney. 1990. Using photo-identification to study pilot whales social organization. Rep. Int. Whal. Commn. (Spec. Iss. 12):259-263.
Tomich, P. Q. 1986. Mammals in Hawaii: A Synopsis and Notational Bibliography. Bishop Museum Press, Hawaii,
210

375 pp. Wade, P. R. and R. P. Angliss. 1997. Guidelines for Assessing Marine Mammal Stocks: Report of the GAMMS
Workshop April 3-5, 1996, Seattle, WA. U. S. Dep. Commer., NOAA Tech. Memo. NMFS-OPR-12. 93 pp.
Wade, P. R. and T. Gerrodette. 1993. Estimates of cetacean abundance and distribution in the eastern tropical Pacific. Rep. Int. Whal. Commn. 43:477-493.
211

Revised 01/15/2011 9/23/2013 BLAINVILLE'S BEAKED WHALE (Mesoplodon densirostris):
Hawaiian Pelagic Stock
STOCK DEFINITION AND GEOGRAPHIC RANGE Blainville's beaked whale has a cosmopolitan distribution in tropical and temperate waters, apparently the most extensive known distribution of any Mesoplodon species (Mead 1989). TwoTen strandings have been documented since were reported in 1961, two from Midway Island (Galbreath 1963), one and another in 1983 from Laysan Island (Nitta 1991), and 7 others in the main Hawaiian Islands (NMFS PIR Marine Mammal Response Network database), including 3 since 2007. Sixteen sightings were reported from the main islands by Shallenberger (1981), who suggested that Blainville's beaked whales were present off the Waianae Coast of Oahu for prolonged periods annually. Resightings of individual Blainville’s beaked whales during a 21-yr study suggests long-term site fidelity and year round occurrence off the island of Hawaii (McSweeney et al. 2007). Summer/fall shipboard surveys of the waters within the U.S. Exclusive Economic Zone (EEZ) of the Hawaiian Islands, resulted in three Three sightings in 2002 and one in 2010; however, several sightings of unidentified Mesoplodon whales may have also been Blainville’s beaked whale were made during a 2002 shipboard survey of waters within the U.S. Exclusive Economic Zone (EEZ) of the Hawaiian Islands (Figure 1; Barlow 2006, Bradford et. al. 2013).
Recent analysis of Blainville’s beaked whale resightings and movements near the main Hawaiian Islands (MHI) off the Island of Hawaii suggest the existence of insular and offshore (pelagic) populations of this species in Hawaiian waters; however, further movement and genetic studies are needed to better understand individual movements and stock structure of Blainville’s beaked whales in Hawaii (McSweeney et al. 2007, Baird et al. 2009, Schorr et al., 2009, Baird et al. 2013). Photo-identification of individual Blainville’s beaked whales from Hawaii Island since 1986 reveal repeated use of this area by individuals for over 17 years (Baird et al. 2011) and 75% of individuals seen off Hawaii Island link by association into a single social network (Baird et al. 2013). Those individuals seen farthest from shore and in deep water (>2100m) have not been resighted, suggesting they may be part of an offshore, pelagic population (Baird et al. 2011). Eleven Blainville’s beaked whales linked to the social network have been satellite tagged off Hawaii Island. All 11 individuals had movements restricted to the MHI, extending to nearshore waters of Oahu, with average distance from shore of 21.6 km (Baird et al. 2013). One individual tagged 32km from Hawaii Island did not link to the social network and had movements extending far from shore, moving over 900km from the tagging location in 20 days, approaching the edge of the Hawaiian EEZ west of Nihoa (Baird et al. 2011). -a Some genetic samples have been collected recently from around the main Hawaiian islands, (R.W. Baird, pers. comm.). Division of this population into a separate island-associated stock may be warranted in the future.
For the Marine Mammal Protection Act (MMPA) stock assessment reports, three Mesoplodon stocks are defined within the Pacific U.S. EEZ: 1) M. densirostris in Hawaiian waters (this report), 2) M. stejnegeri in Alaskan waters, and 3) all Mesoplodon species off California, Oregon and Washington. The Hawaiian stock of Blainville’s beaked whales includes animals found both within the Hawaiian Islands EEZ and in adjacent international high seas waters. ; however, bBecause data on abundance, distribution, and human-caused impacts are largely lacking for
Figure 1. Sighting locations of Mesoplodon densirostris (diamonds)filled circles), Indopacetus pacificus (triangle), and unidentified Mesoplodon beaked whales (crosssquares) during the 2002 (open symbols) and 2010 (black symbols) shipboard cetacean surveys of U.S. EEZ waters surrounding the Hawaiian Islands (Barlow 2006; see Appendix 2 for details on timing and location of survey effort). Outer line indicates approximate boundary of survey area and U.S. EEZ. Gray shading indicates area of Papahanaumokuakea Marine National Monument. Dotted line represents the 1,000m isobath.
212
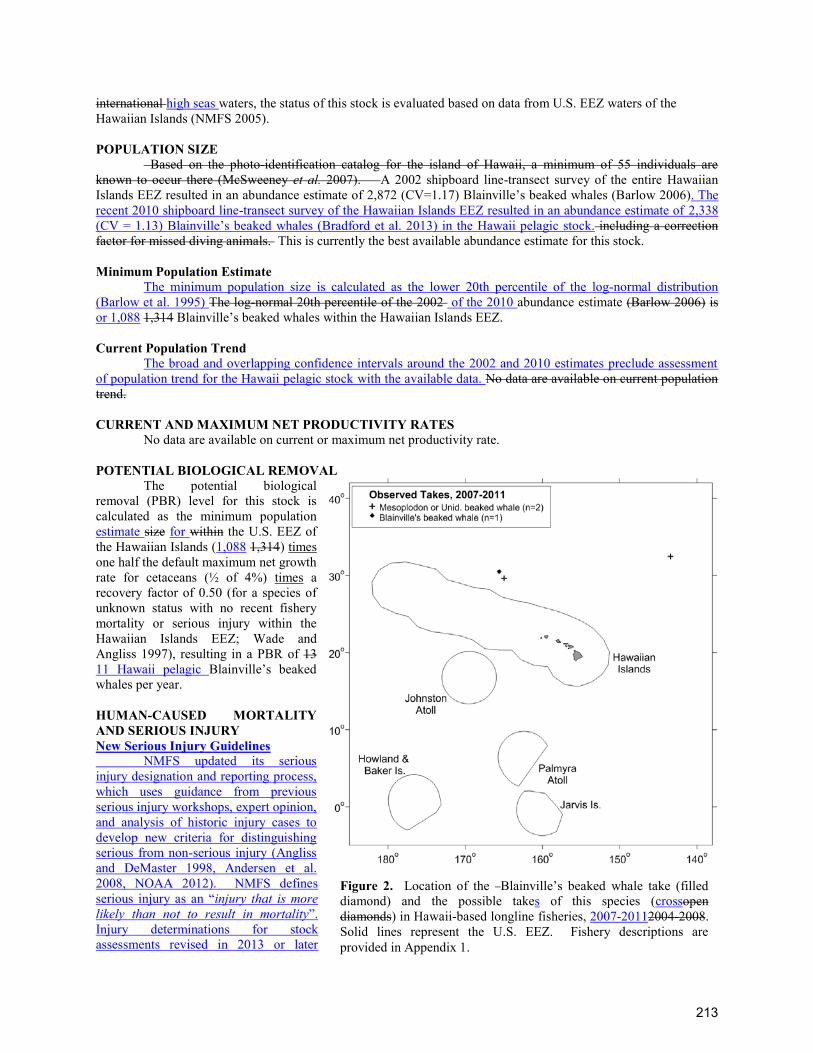
international high seas waters, the status of this stock is evaluated based on data from U.S. EEZ waters of the Hawaiian Islands (NMFS 2005). POPULATION SIZE Based on the photo-identification catalog for the island of Hawaii, a minimum of 55 individuals are known to occur there (McSweeney et al. 2007). A 2002 shipboard line-transect survey of the entire Hawaiian Islands EEZ resulted in an abundance estimate of 2,872 (CV=1.17) Blainville’s beaked whales (Barlow 2006). The recent 2010 shipboard line-transect survey of the Hawaiian Islands EEZ resulted in an abundance estimate of 2,338 (CV = 1.13) Blainville’s beaked whales (Bradford et al. 2013) in the Hawaii pelagic stock. including a correction factor for missed diving animals. This is currently the best available abundance estimate for this stock. Minimum Population Estimate The minimum population size is calculated as the lower 20th percentile of the log-normal distribution (Barlow et al. 1995) The log-normal 20th percentile of the 2002 of the 2010 abundance estimate (Barlow 2006) is or 1,088 1,314 Blainville’s beaked whales within the Hawaiian Islands EEZ. Current Population Trend The broad and overlapping confidence intervals around the 2002 and 2010 estimates preclude assessment of population trend for the Hawaii pelagic stock with the available data. No data are available on current population trend. CURRENT AND MAXIMUM NET PRODUCTIVITY RATES No data are available on current or maximum net productivity rate. POTENTIAL BIOLOGICAL REMOVAL The potential biological removal (PBR) level for this stock is calculated as the minimum population estimate size for within the U.S. EEZ of the Hawaiian Islands (1,088 1,314) times one half the default maximum net growth rate for cetaceans (½ of 4%) times a recovery factor of 0.50 (for a species of unknown status with no recent fishery mortality or serious injury within the Hawaiian Islands EEZ; Wade and Angliss 1997), resulting in a PBR of 13 11 Hawaii pelagic Blainville’s beaked whales per year. HUMAN-CAUSED MORTALITY AND SERIOUS INJURY New Serious Injury Guidelines NMFS updated its serious injury designation and reporting process, which uses guidance from previous serious injury workshops, expert opinion, and analysis of historic injury cases to develop new criteria for distinguishing serious from non-serious injury (Angliss and DeMaster 1998, Andersen et al. 2008, NOAA 2012). NMFS defines serious injury as an “injury that is more likely than not to result in mortality”. Injury determinations for stock assessments revised in 2013 or later
Figure 2. Location of the Blainville’s beaked whale take (filled diamond) and the possible takes of this species (crossopen diamonds) in Hawaii-based longline fisheries, 2007-20112004-2008. Solid lines represent the U.S. EEZ. Fishery descriptions are provided in Appendix 1.
213

incorporate the new serious injury guidelines, based on the most recent 5-year period for which data are available. Fishery Information Information on fishery-related mortality of cetaceans in Hawaiian waters is limited, but the gear types used in Hawaiian fisheries are responsible for marine mammal mortality and serious injury in other fisheries throughout U.S. waters. Gillnets appear to capture marine mammals wherever they are used, and float lines from lobster traps and longlines can be expected to occasionally entangle cetaceans (Perrin et al. 1994). No interactions between nearshore fisheries and Blainville’s beaked whales have been reported in Hawaiian waters. No estimates of human-caused mortality or serious injury are currently available for nearshore hook and line or gillnet fisheries because these fisheries are not observed or monitored for protected species bycatch. Interactions with cetaceans are reported for all pelagic fisheries (Nitta and Henderson 1993). There are currently two distinct longline fisheries based in Hawaii: a deep-set longline (DSLL) fishery that targets primarily tunas, and a shallow-set longline fishery (SSLL) that targets swordfish. Both fisheries operate within U.S. waters and on the high seas. Between 2007 and 2011 2004 and 2008, no Blainville’s beaked whale was observed killed or seriously injured in the SSLL fishery (100% observer coverage) or the DSLL fishery (20-28% observer coverage) (Bradford & Forney 2013 Forney 2009, McCracken 2009 2013) within the Hawaiian EEZ. and one One Blainville’s beaked whale was observed taken, but not seriously injured, on the high seas in international waters in the DSSLL fishery (20-28% observer coverage) (Bradford & Forney 2013McCracken & Forney 2010). One unidentified Mesoplodon whale and one unidentified beaked whale were taken in the SSLL fishery and both were considered to be seriously injured based on an evaluation of the observer’s description of the interaction and following the most recently developed criteria for assessing serious injury in marine mammals (NMFS 2012). Average 5-yr estimates of annual mortality and serious injury for 2007-20112004-2008 are zero 0.7 (CV=0.9) Blainville’s beaked whales within or outside of the U.S. EEZs, and zero within the Hawaiian Islands EEZ 0.4 (CV = 0) Mesoplodon or unidentified beaked whales outside the U.S. EEZs (Table 1). Eight unidentified cetaceans were taken in the DSLL fishery, and two unidentified cetaceans were taken in the SSLL fishery, some of which may have been Blainville’s beaked whales.
Other Mortality
Anthropogenic sound sources, such as military sonar and seismic testing have been implicated in the mass strandings of beaked whales, including atypical events involving multiple beaked whale species (Simmonds and Lopez-Jurado 1991, Frantiz 1998, Anon. 2001, Jepson et al. 2003, Cox et al. 2006). While D’Amico et al. (2009) note that most mass strandings of beaked whales are unassociated with documented sonar activities, lethal or sub-lethal effects of such activities would rarely be documented, due to the remote nature of such activities and the low probability that an injured or dead beaked whale would strand. Filadelpho et al. (2009) reported statistically significant correlations between military sonar use and mass strandings of beaked whales in the Mediterranean and Caribbean Seas, but not in Japanese and Southern California waters, and hypothesized that regions with steep bathymetry adjacent to coastlines are more conducive to stranding events in the presence of sonar use. In Hawaiian waters, Faerber & Baird (2010) suggest that the probability of stranding is lower than in some other regions due to nearshore currents carrying animals away from beaches, and that stranded animals are less likely to be detected due to low human population density near many of Hawaii’s beaches. Actual and simulated sonar are known to interrupt the foraging dives and echolocation activities of tagged beaked whales (Tyack et al. 2011, DeRuiter et al. 2013). Cuvier’s beaked whales tagged and tracked during simulated mid-frequency sonar exposure showed avoidance reactions, including prolonged diving, cessation of echolocation click production associated with foraging, and directional travel away from the simulated sonar source (DeRuiter et al. 2013). Blainville’s beaked whale presence was monitored on hydrophone arrays before, during, and after sonar activities on a Caribbean military range, with evidence of avoidance behavior: whales were detected throughout the range prior to sonar exposure, not detected in the center of the range coincident with highest sonar use, and gradually returned to the range center after the cessation of sonar activity (Tyack et al. 2011). Fernández et al. (2013) report that there have been no mass strandings of beaked whales in the Canary Islands following a 2004 ban on sonar activities in that region. The absence of beaked whale bycatch in California drift gillnets following the introduction of acoustic pingers into the fishery implies additional sensitivity of beaked whales to anthropogenic sound (Carretta et al. 2008, Carretta and Barlow 2011). In recent years, there has been increasing concern that loud underwater sounds, such as active sonar and seismic operations, may be harmful to beaked whales (Malakoff 2002). The use of active sonar from military vessels has been implicated in mass strandings of beaked whales in the Mediterranean Sea during 1996 (Frantzis 1998), the Bahamas during 2000 (U.S. Dept. of Commerce and Secretary of the Navy 2001), and the Canary Islands
214

during 2002 (Martel 2002). Similar military active sonar operations occur around the Hawaiian islands. It has been suggested that quick ascent from deep dives in response to acoustic exposure could lead to death in beaked whales (Cox et al. 2006). A modeling exercise based on dive data from Blainville’s, Cuvier’s and northern bottlenose whales suggests that the dive habits of all three species produce tissue nitrogen saturation levels that would normally cause decompression sickness in terrestrial mammals (Hooker et al. 2009). The impact of sonar exercises on resident versus offshore beaked whales may be significantly different with offshore animals less frequently exposed, and possibly subject to more extreme reactions (Baird et al. 2009). No estimates of potential mortality or serious injury are available for U.S. waters. Table 1. Summary of available information on incidental mortality and serious injury of Blainville’s beaked whales (Hawaiian stock) in commercial fisheries, within and outside of the Hawaiian Islands EEZ (McCracken 2013& Forney 2010). Mean annual takes are based on 2007-20112004-2008 data unless otherwise indicated. Information on all observed takes (T) and combined mortality events & serious injuries (MSI) is included. Total takes were prorated to deaths, serious injuries, and non-serious injuries based on the observed proportions of each outcome.
Fishery Name Year Data Type
Percent Observer Coverage
Observed total interactions (T) and mortality events, and serious injuries (MSI), and total estimated mortality and serious injury (M&SI) of
Blainville's beaked whales (MD), unidentified Mesoplont whales (UM) and unidentified beaked whales (ZU)
Outside U.S. EEZs Hawaiian EEZ
Obs. MD T/MSI Obs. UM+ZU
T/MSI
Estimated MD M&SI (CV) Estimated
UM+ZU MSI (CV)
Obs. MD T/MSI Obs. UM+ZU
T/MSI
Estimated MD M&SI (CV) Estimated
UM+ZU MSI (CV)
Hawaii-based deep-set longline
fishery
2007
Observer data
20% 0 0 (-) 0 0 (-) 2008 22% 0 0 (-) 0 0 (-) 2009 21% 0 0 (-) 0 0 (-) 2010 21% 0 0 (-) 0 0 (-) 2011 20% 0 0 (-) 0 0 (-)
Mean Estimated Annual MD Take (CV) 0 (-) 0 (-) Mean Estimated Annual UM+ZU Take (CV) 0 (-) 0 (-)
Hawaii-based shallow-set
longline fishery
2007
Observer data
100% 0 0 0 0 2008 100% 0 0 0 0 2009 100% 0 0 0 0 2010 100% 0 0 0 0
2011 100% 1/0 2/2
0 0.4
0 0
Mean Annual MD Takes (100% coverage) 0 0 Mean Annual UM + ZU Takes (100% coverage) 0.4 0 Minimum total annual MD takes within U.S. EEZ 0 (-)
Fishery Name Year Data Type
Percent Observer Coverage
Mortality and Serious Injury outside of U.S. EEZ
Mortality and Serious Injury within Hawaiian Islands EEZ
Observed Estimated (CV)
Mean Annual Takes (CV)
Observed Estimated (CV)
Mean Annual Takes (CV)
Hawaii-based deep-set longline fishery
2004 2005 2006 2007 2008
Observer data
25% 28% 22% 20% 22%
0 0 0 0 0
0 (-) 3 (0.3) 0 (-) 0 (-) 0 (-)
0.7 (0.9)
0 0 0 0 0
0 (-) 0 (-) 0 (-) 0 (-) 0 (-)
0 (-)
215

Fishery Name Year Data Type
Percent Observer Coverage
Mortality and Serious Injury outside of U.S. EEZ
Mortality and Serious Injury within Hawaiian Islands EEZ
Observed Estimated (CV)
Mean Annual Takes (CV)
Observed Estimated (CV)
Mean Annual Takes (CV)
Hawaii-based shallow-set longline fishery
2004 2005 2006 2007 2008
Observer data
100% 100% 100% 100% 100%
0 0 0 0 0
Same as observed 0
0 0 0 0 0
Same as observed 0
Minimum total annual takes within U.S. EEZ waters 0 (-) STATUS OF STOCK The Hawaii pelagic stock of Blainville’s beaked whales is not considered strategic under the 1994 amendments to the MMPA The status of Blainville's beaked whales in Hawaiian waters relative to OSP is unknown, and there are insufficient data to evaluate trends in abundance. Blainville’s beaked whales are not listed as “threatened” or “endangered” under the Endangered Species Act (1973), nor designated as “depleted” under the MMPA. Given the absence of recorded recent fishery-related mortality or serious injuries within U.S. EEZs, the Hawaiian stock of Blainville’s beaked whales is not considered strategic under the 1994 amendments to the MMPA, and the total fishery mortality and serious injury can be considered to be insignificant and approaching zero. However, the effect of potential interactions of Blainville’s beaked whales and unidentified beaked whales (some of which may have been Blainville’s beaked whales) with the Hawaii-based longline fishery in international waters is not known . The impacts of anthropogenic sound on beaked whales remains a concern (Barlow and Gisiner 2006, Cox et al. 2006, Hildebrand et al. 2005, Weilgart 2007). The increasing level of anthropogenic noise in the world’s oceans has been suggested to be a habitat concern for whales (Richardson et al. 1995), particularly for deep-diving whales like Blainville’s beaked whales that feed in the oceans’ “sound channel”. One Blainville’s beaked whale found stranded on the main Hawaiian Islands has tested positive for Morbillivirus (Jacob 2012). Although morbillivus is known to trigger lethal disease in cetaceans (Van Bressem et al. 2009), its impact on the health of the stranded animal is not known as it was found in only a few tested tissues (Jacob 2012). The presence of morbillivirus in 10 species of cetacean in Hawaiian waters, including all 3 known species of beaked whales (Jacob 2012), raises concerns about the history and prevalence of this disease in Hawaii and the potential population impacts on Hawaiian cetaceans. REFERENCES Anderson, M.S., K.A. Forney, T.V.N. Cole, T. Eagle, R.P. Angliss, K. Long, L. Barre, L. VanAtta, D. Borggaard, T.
Rowles, B. Norberg, J. Whaley, L. Engleby. Differentiating serious and non-serious injury of marine mammals: Report of the Serious Injury Technical Workshop 10-13 September 2007, Seattle, WA. NOAA Tech Memo NMFS-OPR-39, 108 p.
Angliss, R.P. and D.P. DeMaster. 1997. Differentiating serious and non-serious injury of marine mammals taken incidental to commercial fishing operations: Report of the Serious Injury Workshop 1-2 April. 1997, Silver Spring, MD. NOAA Tech Memo NMFS-OPR-13, 48 p.
Anon. 2001. Joint Interim Report, Bahamas Marine Mammal Stranding Event of 15_16 March 2000. Available from NOAA, NMFS, Office of Protected Resources, Silver Spring, MD.
Baird, R.W., G.S. Schorr, D.L. Webster, S.D. Mahaffy, D.J. McSweeney, M.B. Hanson, and R.D. Andrews. 2011. Open-ocean movements of a satellite-tagged Blainville’s beaked whale (Mesoplodon densirostris); Evidence for an offshore population in Hawaii? Aquatic Mammals 37(4): 506-511.
Baird, R.W., G.S. Schorr, D.L. Webster, S.D. Mahaffy, D.J. McSweeney, M.B. Hanson, and K.D. Andrews. 2009. Movements of satellite-tagged Cuvier’s and Blainville’s beaked whales in Hawaii: Evidence for an offshore population of Blainville’s beaked whales. Report to Southwest Fisheries Science Center, 15p.
Baird, R.W., G.S. Schorr, M.B. Hanson, D.L. Webster, S.D. Mahaffy, D.J. McSweeney, and R.D. Andrews. 2013. Niche partitioning of beaked whales: Comparing diving behavior and habitat use of Cuvier’s and Blainville’s beaked whales off the Island of Hawaii. Draft document PSRG-2013-B09 presented to the Pacific Scientific Review Group, April 2-4, 2013. Del Mar, CA.
216

Barlow, J. and R. Gisiner. 2006. Mitigating, monitoring, and assessing the effects of anthropogenic sound on beaked whales. J. Cet. Res. Manage. 7(3):239-249.
Barlow, J. 2006. Cetacean abundance in Hawaiian waters estimated from a summer/fall survey in 2002. Marine Mammal Science 22: 446–464.
Barlow, J., S.L. Swartz, T.C. Eagle, and P.R. Wade. 1995. U.S. Marine Mammal Stock Assessments: Guidelines for Preparation, Background, and a Summary of the 1995 Assessments. U.S. Dep. Commer., NOAA Tech. Memo. NMFS-OPR-6, 73 p.
Bradford, A.L. and K.A. Forney. 2013. Injury determinations for cetaceans observed interacting with Hawaii and American Samoa longline fisheries during 2007-2011. PIFSC Working Paper WP-13-002.
Bradford. A.L., K.A. Forney, E.M. Oleson, and J. Barlow. 2013. Line-transect abundance estimates of cetaceans in the Hawaiian EEZ. PIFSC Working Paper WP-13-004.
Carretta, J., J. Barlow, and L. Enriquez. 2008. Acoustic pingers eliminate beaked whale bycatch in a gillnet fishery. Marine Mammal Science 24(4): 956-961.
Carretta, J.V. and J. Barlow. 2011. Long-term effectiveness, failure rates, and “dinner bell” properties of acoustic pingers in a gillnet fishery. Marine technology Society Journal 45(5): 7-19.
Cox, T.M., T.J. Ragen, A.J. Read, E. Vos, R.W. Baird, K. Balcomb, J. Barlow, J. Caldwell, T. Cranford, L. Crum, A. D’Amico, G. D’Spain, A. Fernandez, J. Finneran, R. Gentry, W. Gerth, F. Gulland, J.A. Hildebrand, D. Houser, T. Hullar, P.D. Jepson, D. Ketten, C.D. Macleod, P. Miller, S. Moore, D. Mountain, D. Palka, P. Ponganis, S. Rommel, T. Rowles, B. Taylor, P. Tyack, D. Wartzok, R. Gisiner, J. Mead, and L. Brenner. 2006. Understanding the impacts of anthropogenic sound on beaked whales. J.Cetacean Res. Manag. 7: 177-187.
D’Amico A., Gisiner R.C., Ketten D.R., Hammock J.A., Johnson C., et al. 2009. Beaked whale strandings and naval exercises. Aquat. Mamm. 34: 452–472.
DeRuiter, S.L., Southall B.L.,Calambokidis J., Zimmer W.M.X., Sadykova D., Falcone E.A., Friedlaender A.S., Joseph J.E., Moretti D., Schorr G.S., Thomas L., Tyack P.L. 2013. First direct measurements of behavioural responses by Cuvier’s beaked whales to mid-frequency active sonar. Biol Lett 9: 20130223. http://dx.doi.org/10.1098/rsbl.2013.0223
Faerber, M.M. and R.W. Baird. 2010. Does a lack of observed beaked whale strandings in military exercise areas mean no impacts have occurred? A comparison of stranding and detection probabilities in the Canary and main Hawaiian Islands. Mar. Mamm. Sci. 26(3); 602-613.
Fernández, A., Arbelo, M. and Martín, V. 2013. No mass strandings since sonar ban. Nature 497:317. Filadelfo R., Mintz J., Michlovich E., D’Amico A., Tyack P.L. 2009. Correlating military sonar use with beaked
whale mass strandings: what do the historical data show? Aquat Mamm 34: 435–444. Forney, K.A. 2009. Serious injury determinations for cetaceans caught in Hawaii longline fisheries during 1994-
2008. Draft document PSRG-2009-09 presented to the Pacific Scientific Review Group, November 3-5, 2009, Del Mar, CA.
Frantzis, A. 1998. Does acoustic testing strand whales? Nature 392(5):29. Galbreath, E. C. 1963. Three beaked whales stranded on the Midway Islands, central Pacific Ocean. J. Mamm.
44:422-423. Hildebrand J.A. 2005. Impacts of anthropogenic sound. In: Reynolds III JE, Perrin WF, Reeves RR, Montgomery S,
Ragen TJ, editors. Marine mammal research: conservation beyond crisis. Baltimore: Johns Hopkins University. pp. 101 – 123.
Hooker, S.K., R.W. Baird, F.A. Fahlman. 2009. Could beaked whales get the bends? Effect of diving behavior and physiology on modeled gas exchange for three species: Ziphius cavirostris, Mesoplodon densirostris, and Hyperoodon ampulata.. Respiration Physiology and Neurobiology 117(2009): 235-246.
Jacob, J. M. 2012. Screening and characterization of morbillivirus in Hawaiian cetaceans. M.S. Marine Science Thesis. Hawaii Pacific University, Kaneohe, HI,
Jepson, P.D., M. Arbelo, R. Deaville, I. A.P. Patterson, P. Castro, J.R. Baker, E. Degollada, H.M. Ross, P. Herraez, A.M. Pocknell, F. Rodriguez, F.E. Howie, A. Espinoza, R.J. Reid, J.R. Jaber, V. martin, A.A. Cunningham, and A. Fernandez. 2003. "Gas-bubble lesions in stranded cetaceans." Nature 425, no. 6958 (2003): 575-576.
Malakoff, D. 2002. Suit ties whale deaths to research cruise. Science 298:722-723. Martel, V. M. 2002. Summary of the report on the atypical mass stranding of beaked whales in the Canary Islands
in September 2002 during naval exercises. Society for the Study of the Cetaceans in the Canary Archipelago (SECAC). Unpublished report. 11p.
McCracken M., and K.A. Forney. 2010. Preliminary assessment of incidental interactions with marine mammals in
217

the Hawaii longline deep and shallow set fisheries. Pacific Islands Science Center Working Paper WP-09-007. Draft document PSRG-2009-10 presented to the Pacific Scientific Review Group, November 3-5, 2009, Del Mar, CA
McCracken, M. 2013. Preliminary assessment of incidental interactions with marine mammals in the Hawaii longline deep and shallow set fisheries from 2007 to 2011. PIFSC Working Paper WP-13-XXX.
McSweeney, D.J., R.W. Baird, and S.D. Mahaffy. 2007. Site fidelity, associations, and movements of Cuvier’s (Ziphius cavirostris) and Blainville’s (Mesoplodon densirostris) beaked whales off the island of Hawaii. Mar. Mamm. Sci. 23(3):666-687.
Mead, J. G. 1989. Beaked whales of the genus Mesoplodon. In: S. H. Ridgway and R. Harrison (eds.), Handbook of Marine Mammals, Vol. 4: The River Dolphins and Larger Toothed Whales, pp. 349-430. Academic Press, 442 pp.
Nitta, E. 1991. The marine mammal stranding network for Hawaii: an overview. In: J.E. Reynolds III, D.K. Odell (eds.), Marine Mammal Strandings in the United States, pp.56-62. NOAA Tech. Rep. NMFS 98, 157 pp.
Nitta, E. and J. R. Henderson. 1993. A review of interactions between Hawaii's fisheries and protected species. Mar. Fish. Rev. 55(2):83-92.
NMFS. 2005. Revisions to Guidelines for Assessing Marine Mammal Stocks. 24 pp. Available at: http://www.nmfs.noaa.gov/pr/pdfs/sars/gamms2005.pdf
NMFS. 2012. NOAA Fisheries Policy Directive 02-038-01 Process for Injury Determinations (01/27/12). Available at: http://www.nmfs.noaa.gov/pr/pdfs/serious_injury_policy.pdf
Perrin, W. F., G. P. Donovan and J. Barlow. 1994. Gillnets and Cetaceans. Rep. Int. Whal. Commn., Special Issue 15, 629 pp.
Richardson, W. J., C. R. Greene, Jr., C. I. Malme, and D. H. Thompson. 1995. Marine Mammals and Noise. Academic Press, San Diego. 576 p.
Schorr, G.S., R.W. Baird, M.B. Hanson, D.L. Webster, D.J. McSweeney, and R.D. Andrews. 2009. Movements of satellite-tagged Blainville’s beaked whales off the island of Hawaii. Endangered Species Res.10:203-213.
Simmonds, M. P., and L.F. Lopez-Jurado. 1991. Whales and the military. Nature, 351(6326): 448. Shallenberger, E. W. 1981. The status of Hawaiian cetaceans. Final report to U.S. Marine Mammal Commission.
MMC-77/23, 79pp. Tyack, P. L., W.M.X. Zimmer, D.Moretti, B.L. Southall, D.E. Claridge, J.W. Durban, C. W. Clark, A. D’Amico, N.
DiMarzio, S. Jarvis, E. McCarthy, R. Morrissey, J. Ward, and I.L. Boyd. 2011. Beaked whales respond to simulated and actual navy sonar. PLoS One 6(3): e17009.
U.S. Department of Commerce and Secretary of the Navy. 2001. Joint Interim Report, Bahamas Marine Mammal Stranding Event of 15_16 March 2000. Available from NOAA, NMFS, Office of Protected Resources, Silver Spring, MD.
Van Bressem, M., J.A. Raga, G. Di Guardo, D.P. Jepson, P. J. Duignan, U. Siebert, T. Barrett, M. C. de Oliveira Santos, I.B. Moreno, S. Siciliano, A. Aguilar, K. Van Waerebeer. 2009. Emerging infectious diseases in cetaceans worldwide and the possible role of environmental stressors. Diseases of Aquatic Organisms. 85:143-157.
Wade, P. R. and R. P. Angliss. 1997. Guidelines for Assessing Marine Mammal Stocks: Report of the GAMMS Workshop April 3-5, 1996, Seattle, Washington. U. S. Dep. Commer., NOAA Tech. Memo. NMFS-OPR-12. 93 pp.
Weilgart, L.S. 2007. The impacts of anthropogenic ocean noise on cetaceans and implications for management. Canadian Journal of Zoology 85:1091-1116.
218

Revised 01/15/2011 9/23/2013
CUVIER'S BEAKED WHALE (Ziphius cavirostris): Hawaiian Pelagic Stock
STOCK DEFINITION AND GEOGRAPHIC RANGE
Cuvier's beaked whales occur
in all oceans and major seas (Heyning 1989). In Hawaii, sevenfive strandings have been reported from Midway Islands, Pearl and Hermes Reef, Oahu, and Hawaii Islands since 1950 (Shallenberger 1981; Galbreath 1963; Richards 1952; Nitta 1991; Maldini et al. 2005, NMFS PIR Marine Mammal Response Network database), one since 2007. Sightings have been reported off Lanai and Maui (Shallenberger 1981) and Hawaii, Ni’ihau, and Kauai (Mobley 2000, Baird et al. 2004, 2009). Summer/fall shipboard surveys of the waters within the U.S. Exclusive Economic Zone (EEZ) of the Hawaiian Islands, resulted in four Four sightings in 2002 and 22 in 2010, including markedly higher sighting rates during nearshore surveys in the Northwestern Hawaiian Islands. were made during a 2002 shipboard survey of waters within the U.S. Exclusive Economic Zone (EEZ) of the Hawaiian islands (Figure 1; Barlow 2006, Bradford et al 2013). While nothing is known about stock structure, some genetic samples have been collected recently from around the island of Hawaii.
Resightings and movement data of individual Cuvier’s beaked whales suggest the existence of insular and offshore populations of this species in Hawaiian waters. during a A 21-yr study off Hawaii Island suggests long-term site fidelity and year round occurrence off the island of Hawaii (McSweeney et al 2007). Eight Cuvier’s beaked whales have been tagged off Hawaii Island since 2006, with all remaining close to the island of Hawaii for the duration of tag data received (Baird et al 2013). Approximately 95% of all locations were within 45 km of shore and the farthest offshore an individual was documented was 67 km (Baird et al. 2013). The available satellite data suggest that a resident population may occur near Hawaii Island, distinct from offshore, pelagic Cuvier’s beaked whales. This conclusion is further supported by the long-term site fidelity evident from photo-identification data (McSweeney et al. 2007). Division of this population into a separate island-associated stock may be warranted in the future.
For the Marine Mammal Protection Act (MMPA) stock assessment reports, Cuvier's beaked whales within the Pacific U.S. EEZ are divided into three discrete, non-contiguous areas: 1) Hawaiian pelagic waters (this report), 2) Alaskan waters, and 3) waters off California, Oregon and Washington. The Hawaiian pelagic stock includes animals found both within the Hawaiian Islands EEZ and in adjacent high seasinternational waters. ; however, bBecause data on abundance, distribution, and human-caused impacts are largely lacking for high seasinternational waters, the status of this stock is evaluated based on data from U.S. EEZ waters of the Hawaiian Islands (NMFS 2005). POPULATION SIZE Wade and Gerrodette (1993) estimated population sizemade an estimate for Cuvier's beaked whales in the eastern tropical Pacific, but it is not known whether any of these animals are part of the same population that occurs around the Hawaiian Islands. The data on which this estimate was based are now over 8 years old. Based on the
Figure 1. Cuvier’s beaked whale sighting locations during the 2002 (open diamonds) and 2010 (black diamonds) shipboard surveys of U.S. EEZ waters surrounding the Hawaiian Islands (Barlow 2006; see Appendix 2 for details on timing and location of survey effort). Outer line represents approximate boundary of survey area and U.S. EEZ. Gray shading indicates area of Papahanaumokuakea Marine National Monument.
219
photo-identification catalog for the island of Hawaii, a minimum of 35 individuals are known to occur there (McSweeney et al. 2007). . A 2002 shipboard line-transect survey of the entire Hawaiian Islands EEZ resulted in an abundance estimate of 15,242 (CV=1.43) Cuvier’s beaked whales (Barlow 2006). The recent 2010 shipboard line-transect survey of the Hawaiian Islands EEZ resulted in an abundance estimate of 1,941 (CV = 0.70) Cuvier’s beaked whales (Bradford et al 2013), including a correction factor for missed diving animals. This is currently the best available abundance estimate for the is Hawaii pelagic stock. Minimum Population Estimate Minimum population size is calculated as the lower 20th percentile of the log-normal distribution (Barlow et al. 1995) of the 2010 abundance estimate, or 1,142 Cuvier’s beaked whales. The log-normal 20th percentile of the 2002 abundance estimate (Barlow 2006) is 6,269 Cuvier’s beaked whales within the Hawaiian Islands EEZ. Current Population Trend
The significant decrease in abundance estimates between the 2002 and 2010 surveys is attributed to the use of higher sea states (beaufort 0–5) in estimating the trackline detection probability for the 2010 survey, compared to the 2002 survey, which utilized only beaufort sea state data 0 through 2 (Bradford et al 2013). This change in analysis methodology precludes evaluation of population trends at this time. No data are available on current population trend.
CURRENT AND MAXIMUM NET PRODUCTIVITY RATES No data are available on current or maximum net productivity rate. POTENTIAL BIOLOGICAL REMOVAL The potential biological removal (PBR) level for the pelagic is stock of Cuvier’s beaked whales is calculated as the minimum population estimate for size within the U.S. EEZ of the Hawaiian Islands (1,142 6,269) times one half the default maximum net growth rate for cetaceans (½ of 4%) times a recovery factor of 0.50 (for a species of unknown status with no known fishery mortality within the Hawaiian Islands EEZ; Wade and Angliss 1997), resulting in a PBR of 63 11.4 Cuvier’s beaked whales per year. HUMAN-CAUSED MORTALITY AND SERIOUS INJURY New Serious Injury Guidelines NMFS updated its serious injury designation and reporting process, which uses guidance from previous serious injury workshops, expert opinion, and analysis of historic injury cases to develop new criteria for distinguishing serious from non-serious injury (Angliss and DeMaster 1998, Andersen et al. 2008, NOAA 2012). NMFS defines serious injury as an “injury that is more likely than not to result in mortality”. Injury determinations for stock assessments revised in 2013 or later incorporate the new serious injury guidelines, based on the most recent 5-year period for which data are available. Fishery Information Information on fishery-related mortality of cetaceans in Hawaiian waters is limited, but the gear types used in Hawaiian fisheries are responsible for marine mammal mortality and serious injury in other fisheries throughout U.S. waters. Gillnets appear to capture marine mammals wherever they are used, and float lines from lobster traps and longlines can be expected to occasionally entangle cetaceans (Perrin et al. 1994). No interactions between nearshore fisheries and Cuvier’s beaked whales have been reported in Hawaiian waters. No estimates of human-caused mortality or serious injury are currently available for nearshore hook and line or gillnet fisheries because these fisheries are not observed or monitored for protected species bycatch. Interactions with cetaceans are reported for all pelagic fisheries (Nitta and Henderson 1993). There are currently two distinct longline fisheries based in Hawaii: a deep-set longline (DSLL) fishery that targets primarily tunas, and a shallow-set longline fishery (SSLL) that targets swordfish. Both fisheries operate within U.S. waters and on the high seas. Between 2007 and 2011 2004 and 2008, no Cuvier’s beaked whales were observed hooked or entangled in the SSLL fishery (100% observer coverage) or the DSLL fishery (20-22 28% observer coverage) (Bradford and Forney 2013, McCracken 2013 & Forney 2010) . One unidentified beaked whale was taken in the SSLL fishery and considered seriously injured based on an evaluation of the observer’s description of the interaction and following the most recently developed criteria for assessing serious injury in marine mammals (NMFS 2012). Average 5-yr estimates of annual mortality and serious injury for 2007-2011 are zero Cuvier’s beaked whales within or outside of the U.S. EEZs, and 0.2 unidentified beaked whales outside the U.S. EEZs (Table 1). Eight unidentified
220

cetaceans were taken in the DSLL fishery, and two unidentified cetaceans were taken in the SSLL fishery, some of which could have been Cuvier’s beaked whales. However, one unidentified cetacean, which may have been a Cuvier’s beaked whale, was taken in the DSLL fishery in international waters (Forney 2009). Other Mortality Anthropogenic sound sources, such as military sonar and seismic testing have been implicated in the mass strandings of beaked whales, including atypical events involving multiple beaked whale species (Simmonds and Lopez-Jurado 1991, Frantiz 1998, Anon. 2001, Jepson et al. 2003, Cox et al. 2006). While D’Amico et al. (2009) note that most mass strandings of beaked whales are unassociated with documented sonar activities, lethal or sub-lethal effects of such activities would rarely be documented, due to the remote nature of such activities and the low probability that an injured or dead beaked whale would strand. Filadelpho et al. (2009) reported statistically significant correlations between military sonar use and mass strandings of beaked whales in the Mediterranean and Caribbean Seas, but not in Japanese and Southern California waters, and hypothesized that regions with steep bathymetry adjacent to coastlines are more conducive to stranding events in the presence of sonar use. In Hawaiian waters, Faerber & Baird (2010) suggest that the probability of stranding is lower than in some other regions due to nearshore currents carrying animals away from beaches, and that stranded animals are less likely to be detected due to low human population density near many of Hawaii’s beaches. Actual and simulated sonar are known to interrupt the foraging dives and echolocation activities of tagged beaked whales (Tyack et al. 2011, DeRuiter et al. 2013). Cuvier’s beaked whales tagged and tracked during simulated mid-frequency sonar exposure showed avoidance reactions, including prolonged diving, cessation of echolocation click production associated with foraging, and directional travel away from the simulated sonar source (DeRuiter et al. 2013). Blainville’s beaked whale presence was monitored on hydrophone arrays before, during, and after sonar activities on a Caribbean military range, with evidence of avoidance behavior: whales were detected throughout the range prior to sonar exposure, not detected in the center of the range coincident with highest sonar use, and gradually returned to the range center after the cessation of sonar activity (Tyack et al. 2011). Fernández et al. (2013) report that there have been no mass strandings of beaked whales in the Canary Islands following a 2004 ban on sonar activities in that region. The absence of beaked whale bycatch in California drift gillnets following the introduction of acoustic pingers into the fishery implies additional sensitivity of beaked whales to anthropogenic sound (Carretta et al. 2008, Carretta and Barlow 2011). In recent years, there has been increasing concern that loud underwater sounds, such as active sonar and seismic operations, may be harmful to beaked whales (Malakoff 2002). The use of active sonar from military vessels has been implicated in mass strandings of beaked whales in the Mediterranean Sea during 1996 (Frantzis 1998), the Bahamas during 2000 (U.S. Dept. of Commerce and Secretary of the Navy 2001), and the Canary Islands during 2002 (Martel 2002). Similar military active sonar operations occur around the Hawaiian islands. It has been suggested that quick ascent from deep dives in response to acoustic exposure could lead to death in beaked whales (Cox et al. 2006). A modeling exercise based on dive data from Blainville’s, Cuvier’s and northern bottlenose whales suggests that the dive habits of all three species produce tissue nitrogen saturation levels that would normally cause decompression sickness in terrestrial mammals (Hooker et al. 2009). The longer dives and shorter surface intervals of Cuvier’s beaked whales may put them at higher risk for decompression sickness than other species, possibly increasing their susceptibility to high-intensity
Figure 2. Location of the possible take of Cuvier’s beaked whale (cross) in Hawaii-based longline fisheries, 2007-2011. Solid lines represent the U.S. EEZ. Fishery descriptions are provided in Appendix 1.
221

underwater noise (Hooker et al. 2009). affectedIslands that The impact of sonar exercises on resident versus offshore beaked whales may be significantly different with offshore animals less frequently exposed, and possibly subject to more extreme reactions (Baird et al. 2009). No estimates of potential mortality or serious injury are available for U.S. waters. Table 1. Summary of available information on incidental mortality and serious injury of Cuvier’s beaked whales (Hawaii pelagic stock) and unidentified beaked whales (ZU) in commercial fisheries, within and outside of the Hawaiian Islands EEZ (McCracken 2013). Mean annual takes are based on 2007-2011 data unless otherwise indicated. Information on all observed takes (T) and combined mortality events & serious injuries (MSI) is included. Total takes were prorated to deaths, serious injuries, and non-serious injuries based on the observed proportions of each outcome.
Fishery Name Year Data Type
Percent Observer Coverage
Observed total interactions (T) and mortality events, and serious injuries (MSI), and total estimated mortality and serious injury (M&SI)
unidentified beaked whales Outside U.S. EEZs Hawaiian EEZ
Obs. T/MSI Estimated ZU
MSI (CV) Obs. T/MSI Estimated ZU
MSI (CV)
Hawaii-based deep-set longline
fishery
2007
Observer data
20% 0 0 (-) 0 0 (-) 2008 22% 0 0 (-) 0 0 (-) 2009 21% 0 0 (-) 0 0 (-) 2010 21% 0 0 (-) 0 0 (-) 2011 20% 0 0 (-) 0 0 (-)
Mean Estimated Annual Unidentified Beaked Whale Take (CV) 0 (-) 0 (-)
Hawaii-based shallow-set
longline fishery
2007
Observer data
100% 0 0 0 0 2008 100% 0 0 0 0 2009 100% 0 0 0 0 2010 100% 0 0 0 0 2011 100% 1/1 0.2 0 0
Mean Annual Unidentified Beaked Whale Takes (100% coverage) 0.2 0 Minimum total annual ZI takes within U.S. EEZ 0 (-)
STATUS OF STOCK The Hawaii stock of Cuvier’s beaked whales is not considered strategic under the 1994 amendments to the MMPA. The status of Cuvier's beaked whales in Hawaiian waters relative to OSP is unknown, and there are insufficient data to evaluate trends in abundance. Cuvier’s beaked whales It is are not listed as “threatened” or “endangered” under the Endangered Species Act (1973), nor designated as “depleted” under the MMPA. Because tThere have been no reported fishery related mortality or injuries within the Hawaiian Islands EEZ, such that the Hawaiian stock of Cuvier’s beaked whales is not considered strategic under the 1994 amendments to the MMPA, and the total mortality and serious injury can be considered to be insignificant and approaching zero. The impacts of anthropogenic sound on beaked whales remain a concern (Barlow and Gisiner 2006, Cox et al. 2006, Hildebrand et al. 2005, Weilgart 2007). The increasing level of anthropogenic noise in the world’s oceans has been suggested to be a habitat concern for whales (Richardson et al. 1995, Weilgart 2007), particularly for deep-diving whales like Cuvier’s beaked whales that feed in the oceans’ “sound channel”. One Cuvier’s beaked whale found stranded on the main Hawaiian Islands tested positive for Morbillivirus (Jacob 2012). Although morbillivus is known to trigger lethal disease in cetaceans (Van Bressem et al. 2009), its impact on the health of the stranded animal is not known as it was found in only a few tested tissues (Jacob 2012). The presence of morbillivirus in 10 species of cetacean in Hawaiian waters, including all 3 known species of beaked whales (Jacob 2012), raises concerns about the history and prevalence of this disease in Hawaii and the potential population impacts on Hawaiian cetaceans. REFERENCES Anderson, M.S., K.A. Forney, T.V.N. Cole, T. Eagle, R.P. Angliss, K. Long, L. Barre, L. VanAtta, D. Borggaard, T.
Rowles, B. Norberg, J. Whaley, L. Engleby. Differentiating serious and non-serious injury of marine mammals: Report of the Serious Injury Technical Workshop 10-13 September 2007, Seattle, WA. NOAA Tech Memo NMFS-OPR-39, 94 p.
222
Angliss, R.P. and D.P. DeMaster. 1997. Differentiating serious and non-serious injury of marine mammals taken incidental to commercial fishing operations: Report of the Serious Injury Workshop 1-2 April. 1997, Silver Spring, MD. NOAA Tech Memo NMFS-OPR-13, 48 p.
Anon. 2001. Joint Interim Report, Bahamas Marine Mammal Stranding Event of 15_16 March 2000. Available from NOAA, NMFS, Office of Protected Resources, Silver Spring, MD.
Baird, R.W., D.J. McSweeney, A.D. Ligon and D.L. Webster. 2004. Tagging feasibility and diving of Cuvier's beaked whales (Ziphius cavirostris) and Blainville's beaked whales (Mesoplodon densirostris) in Hawai'i. Report prepared under Order No. AB133F-03-SE-0986 to the Hawai'i Wildlife Fund, Volcano, HI, from the Southwest Fisheries Science Center, National Marine Fisheries Service, La Jolla, CA, 92037 USA.
Baird, R.W., G.S. Schorr, D.L. Webster, S.D. Mahaffy, D.J. McSweeney, M.B. Hanson, and K.D. Andrews. 2009. Movements of satellite-tagged Cuvier’s and Blainville’s beaked whales in Hawaii: Evidence for an offshore population of Blainville’s beaked whales. Report to Southwest Fisheries Science Center, 15p.
Baird, R.W., G.S. Schorr, M.B. Hanson, D.L. Webster, S.D. Mahaffy, D.J. McSweeney, and R.D. Andrews. 2013. Niche partitioning of beaked whales: Comparing diving behavior and habitat use of Cuvier’s and Blainville’s beaked whales off the Island of Hawaii. Draft document PSRG-2013-XX presented to the Pacific Scientific Review Group, April 2-4, 2013. Del Mar, CA.
Barlow, J. 2006. Cetacean abundance in Hawaiian waters estimated from a summer/fall survey in 2002. Marine Mammal Science 22: 446–464.
Barlow, J. and R. Gisiner. 2006. Mitigating, monitoring, and assessing the effects of anthropogenic sound on beaked whales. J. Cet. Res. Manage. 7(3):239-249.
Barlow, J., S.L. Swartz, T.C. Eagle, and P.R. Wade. 1995. U.S. Marine Mammal Stock Assessments: Guidelines for Preparation, Background, and a Summary of the 1995 Assessments. U.S. Dep. Commer., NOAA Tech. Memo. NMFS-OPR-6, 73 p.
Bradford, A.L. and K.A. Forney. 2013. Injury determinations for cetaceans observed interacting with Hawaii and American Samoa longline fisheries during 2007-2011. PIFSC Working Paper WP-13-002.
Bradford. A.L., K.A. Forney, E.M. Oleson, and J. Barlow. 2013. Line-transect abundance estimates of cetaceans in the Hawaiian EEZ. PIFSC Working Paper WP-13-004.
Carretta, J., J. Barlow, and L. Enriquez. 2008. Acoustic pingers eliminate beaked whale bycatch in a gillnet fishery. Marine Mammal Science 24(4): 956-961.
Carretta, J.V. and J. Barlow. 2011. Long-term effectiveness, failure rates, and “dinner bell” properties of acoustic pingers in a gillnet fishery. Marine technology Society Journal 45(5): 7-19.
Cox, T.M., T.J. Ragen, A.J. Read, E. Vos, R.W. Baird, K. Balcomb, J. Barlow, J. Caldwell, T. Cranford, L. Crum, A. D’Amico, G. D’Spain, A. Fernandez, J. Finneran, R. Gentry, W. Gerth, F. Gulland, J.A. Hildebrand, D. Houser, T. Hullar, P.D. Jepson, D. Ketten, C.D. Macleod, P. Miller, S. Moore, D. Mountain, D. Palka, P. Ponganis, S. Rommel, T. Rowles, B. Taylor, P. Tyack, D. Wartzok, R. Gisiner, J. Mead, and L. Brenner. 2006. Understanding the impacts of anthropogenic sound on beaked whales. J.Cetacean Res. Manag. 7: 177-187.
D’Amico A., Gisiner R.C., Ketten D.R., Hammock J.A., Johnson C., et al. 2009. Beaked whale strandings and naval exercises. Aquat. Mamm. 34: 452–472.
DeRuiter, S.L., Southall B.L.,Calambokidis J., Zimmer W.M.X., Sadykova D., Falcone E.A., Friedlaender A.S., Joseph J.E., Moretti D., Schorr G.S., Thomas L., Tyack P.L. 2013. First direct measurements of behavioural responses by Cuvier’s beaked whales to mid-frequency active sonar. Biol Lett 9: 20130223. http://dx.doi.org/10.1098/rsbl.2013.0223
Faerber, M.M. and R.W. Baird. 2010. Does a lack of observed beaked whale strandings in military exercise areas mean no impacts have occurred? A comparison of stranding and detection probabilities in the Canary and main Hawaiian Islands. Mar. Mamm. Sci. 26(3); 602-613.
Fernández, A., Arbelo, M. and Martín, V. 2013. No mass strandings since sonar ban. Nature 497:317. Filadelfo R., Mintz J., Michlovich E., D’Amico A., Tyack P.L. 2009. Correlating military sonar use with beaked
whale mass strandings: what do the historical data show? Aquat Mamm 34: 435–444. Forney, K.A. 2009. Serious injury determinations for cetaceans caught in Hawaii longline fisheries during 1994-
2008. Draft document PSRG-2009-09 presented to the Pacific Scientific Review Group, November 3-5, 2009, Del Mar, CA.
Frantzis, A. 1998. Does acoustic testing strand whales? Nature 392(5):29. Galbreath, E. C. 1963. Three beaked whales stranded on the Midway Islands, central Pacific Ocean. J. Mamm.
44:422-423. Heyning, J. E. 1989. Cuvier's beaked whale Ziphius cavirostris G. Cuvier, 1823. In: S. H. Ridgway and R.
223

Harrison (eds.), Handbook of Marine Mammals, Vol. 4: The River Dolphins and Larger Toothed Whales, pp. 289-308. Academic Press, 442 pp.
Hildebrand J.A. 2005. Impacts of anthropogenic sound. In: Reynolds III JE, Perrin WF, Reeves RR, Montgomery S, Ragen TJ, editors. Marine mammal research: conservation beyond crisis. Baltimore: Johns Hopkins University. pp. 101 – 123.
Hooker, S.K., R.W. Baird, F.A. Fahlman. 2009. Could beaked whales get the bends? Effect of diving behavior and physiology on modeled gas exchange for three species: Ziphius cavirostris, Mesoplodon densirostris, and Hyperoodon ampulata.. Respiration Physiology and Neurobiology 117(2009): 235-246.
Jacob, J. M. 2012. Screening and characterization of morbillivirus in Hawaiian cetaceans. M.S. Marine Science Thesis. Hawaii Pacific University, Kaneohe, HI,
Jepson, P.D., M. Arbelo, R. Deaville, I. A.P. Patterson, P. Castro, J.R. Baker, E. Degollada, H.M. Ross, P. Herraez, A.M. Pocknell, F. Rodriguez, F.E. Howie, A. Espinoza, R.J. Reid, J.R. Jaber, V. martin, A.A. Cunningham, and A. Fernandez. 2003. "Gas-bubble lesions in stranded cetaceans." Nature 425, no. 6958 (2003): 575-576.
Malakoff, D. 2002. Suit ties whale deaths to research cruise. Science 298:722-723. Maldini, D., L. Mazzuca, and S. Atkinson. 2005. Odontocete stranding patterns in the Main Hawaiian Islands
(1937-2002): How do they compare with live animal surveys? Pacific Science 59(1):55-67. McCracken, M. 2013. Preliminary assessment of incidental interactions with marine mammals in the Hawaii
longline deep and shallow set fisheries from 2007 to 2011. PIFSC Working Paper WP-13-XXX. McCracken M., and K.A. Forney. 2010. Preliminary assessment of incidental interactions with marine mammals in
the Hawaii longline deep and shallow set fisheries. NMFS, Pacific Islands Fisheries Science Center Working Paper WP-10-001. 27p.
McSweeney, D.J., R.W. Baird, and S.D. Mahaffy. 2007. Site fidelity, associations, and movements of Cuvier’s (Ziphius cavirostris) and Blainville’s (Mesoplodon densirostris) beaked whales off the island of Hawaii. Mar. Mamm. Sci. 23(3):666-687.
Martel, V. M. 2002. Summary of the report on the atypical mass stranding of beaked whales in the Canary Islands in September 2002 during naval exercises. Society for the Study of the Cetaceans in the Canary Archipelago (SECAC). Unpublished report. 11p.
Mobley, J. R. , Jr, S. S. Spitz, K. A. Forney, R. A. Grotefendt, and P. H. Forestall. 2000. Distribution and abundance of odontocete species in Hawaiian waters: preliminary results of 1993-98 aerial surveys Admin. Rep. LJ-00-14C. Southwest Fisheries Science Center, National Marine Fisheries Service, P.O. Box 271, La Jolla, CA 92038. 26 pp.
Nitta, E. 1991. The marine mammal stranding network for Hawaii: an overview. In: J.E. Reynolds III, D.K. Odell (eds.), Marine Mammal Strandings in the United States, pp.56-62. NOAA Tech. Rep. NMFS 98, 157 pp.
Nitta, E. and J. R. Henderson. 1993. A review of interactions between Hawaii's fisheries and protected species. Mar. Fish. Rev. 55(2):83-92.
NMFS. 2005. Revisions to Guidelines for Assessing Marine Mammal Stocks. 24 pp. Available at: http://www.nmfs.noaa.gov/pr/pdfs/sars/gamms2005.pdf
NMFS. 2012. NOAA Fisheries Policy Directive 02-038-01 Process for Injury Determinations (01/27/12). Available at: http://www.nmfs.noaa.gov/pr/pdfs/serious_injury_policy.pdf
Perrin, W.F., G. P. Donovan and J. Barlow. 1994. Gillnets and Cetaceans. Rep. Int. Whal. Commn., Special Issue 15, 629 pp.
Richards, L. P. 1952. Cuvier's beaked whale from Hawaii. J. Mamm. 33:255. Richardson, W. J., C. R. Greene, Jr., C. I. Malme, and D. H. Thompson. 1995. Marine Mammals and Noise.
Academic Press, San Diego. 576 p. Shallenberger, E. W. 1981. The status of Hawaiian cetaceans. Final report to U.S. Marine Mammal Commission.
MMC-77/23, 79pp. Simmonds, M. P., and L.F. Lopez-Jurado. 1991. Whales and the military. Nature, 351(6326): 448. Tyack, P. L., W.M.X. Zimmer, D.Moretti, B.L. Southall, D.E. Claridge, J.W. Durban, C. W. Clark, A. D’Amico, N.
DiMarzio, S. Jarvis, E. McCarthy, R. Morrissey, J. Ward, and I.L. Boyd. 2011. Beaked whales respond to simulated and actual navy sonar. PLoS One 6(3): e17009.
U.S. Department of Commerce and Secretary of the Navy. 2001. Joint Interim Report, Bahamas Marine Mammal Stranding Event of 15_16 March 2000. Available from NOAA, NMFS, Office of Protected Resources, Silver Spring, MD.
Van Bressem, M., J.A. Raga, G. Di Guardo, D.P. Jepson, P. J. Duignan, U. Siebert, T. Barrett, M. C. de Oliveira Santos, I.B. Moreno, S. Siciliano, A. Aguilar, K. Van Waerebeer. 2009. Emerging infectious diseases in
224

cetaceans worldwide and the possible role of environmental stressors. Diseases of Aquatic Organisms. 85:143-157.
Wade, P. R. and R. P. Angliss. 1997. Guidelines for Assessing Marine Mammal Stocks: Report of the GAMMS Workshop April 3-5, 1996, Seattle, Washington. U. S. Dep. Commer., NOAA Tech. Memo. NMFS-OPR-12. 93 pp.
Wade, P. R. and T. Gerrodette. 1993. Estimates of cetacean abundance and distribution in the eastern tropical Pacific. Rep. Int. Whal. Commn. 43:477-493.
Weilgart, L.S. 2007. The impacts of anthropogenic ocean noise on cetaceans and implications for management. Canadian Journal of Zoology 85:1091-1116.
225

Revised 01/15/2011 9/23/2013
LONGMAN’S BEAKED WHALE (Indopacetus pacificus): Hawaiian Stock
STOCK DEFINITION AND GEOGRAPHIC RANGE Longman’s beaked whale is considered one of the rarest and least known cetacean species (Jefferson et al. 1993; Rice 1998; Dalebout et al 2003). Until recently, it was known only from two skulls found in Australia and Somalia (Longman 1926; Azzaroli 1968). Recent genetic studies (Dalebout et al. 2003) have revealed that sightings of ‘tropical bottlenose whales’ (Hyperoodon sp.; Pitman et al. 1999) in the Indo-Pacific region were in fact Longman’s beaked whales, providing the first description of the external appearance of this species. Although originally described as Mesoplodon pacificus (Longman 1926), it has been proposed that this species is sufficiently unique to be placed within its own genus, Indopacetus (Moore 1968; Dalebout et al. 2003). The distribution of Longman’s beaked whale, as determined from stranded specimens and sighting records of ‘tropical bottlenose whales’, includes tropical waters from the eastern Pacific westward through the Indian Ocean to the eastern coast of Africa. No strandings of Longman’s beaked whales have been documented in Hawaiian waters, A single stranding of Longman’s beaked whale has been reported in Hawaii, in 2010 near Hana, Maui (West et al 2012).although numerous strandings of unidentified beaked whales have been reported (Nitta 1991; Maldini et al. 2005). Summer/fall shipboard surveys of the waters within the U.S. Exclusive Economic Zone (EEZ) of the Hawaiian Islands, resulted in one sighting in 2002 and three in 2010 (Barlow 2006, Bradford et al 2013; Figure 1)One sighting of Longman’s beaked whale was made during a 2002 survey of waters within the U.S. Exclusive Economic Zone (EEZ) of the Hawaiian Islands (Figure 1; Barlow 2006).
For the Marine Mammal Protection Act (MMPA) stock assessment reports, there is one Pacific stock of Longman’s beaked whales, found within waters of the Hawaiian Islands EEZ. This stock includes animals found both within the Hawaiian Islands EEZ and in adjacent international high seas waters; however, because data on abundance, distribution, and human-caused impacts are largely lacking for international high seas waters, the status of this stock is evaluated based on data from U.S. EEZ waters of the Hawaiian Islands (NMFS 2005). POPULATION SIZE A 2002 shipboard line-transect survey of the entire Hawaiian Islands EEZ resulted in an abundance estimate of 1,007 (CV=1.25) Longman’s beaked whales (Barlow 2006). The recent 2010 shipboard line-transect survey of the Hawaiian Islands EEZ resulted in an abundance estimate of 4,571 (CV = 0.65) Longman’s beaked whales (Bradford et al 2013). This is currently the best available abundance estimate for this stock. Minimum Population Estimate The minimum population size is calculated as the lower 20th percentile of the log-normal distribution (Barlow et al 1995) around The log-normal 20th percentile of the 2002 2010 abundance estimate, or (Barlow 2006) is 443 2,773 Longman’s beaked whales within the Hawaiian Islands EEZ.
Figure 1. Sighting locations of Longman’s beaked whale Indopacetus pacificus (triangle), Mesoplodon densirostris (circle) and unidentified Mesoplodon beaked whales (crosses) during the 2002 (open diamond) and 2010 (black diamonds) shipboard cetacean surveys of U.S. waters surrounding the Hawaiian Islands (Barlow 2006, Bradford et al 2013; see Appendix 2 for details on timing and location of survey effort). Outer line indicates approximate boundary of survey area and U.S. EEZ. Gray shading indicates area of Papahanaumokuakea Marine National Monument. Dotted line represents the 1000m isobath.
226

Current Population Trend The increase in the abundance estimate for the 2010 survey versus the 2002 survey is attributed primarily to use of beaufort sea states 0-5 in 2010 versus 0-2 in the 2002 when estimating the trackline detection probability, resulting in significantly less extrapolation to unsurveyed areas in 2010 (Bradford et al 2013). This change in analysis methodology precludes evaluation of population trend at this time. No data are available on current population trend. CURRENT AND MAXIMUM NET PRODUCTIVITY RATES No data are available on current or maximum net productivity rate for Longman’s beaked whales. POTENTIAL BIOLOGICAL REMOVAL The potential biological removal (PBR) level for this stock is calculated as the minimum population size within the U.S. EEZ of the Hawaiian Islands (2,773)(443) times one half the default maximum net growth rate for cetaceans (½ of 4%) times a recovery factor of 0.50 (for a stock of unknown status with no known fishery mortality or serious injury within the Hawaiian Islands EEZ; Wade and Angliss 1997), resulting in a PBR of 284.4 Longman’s beaked whales per year. HUMAN CAUSED MORTALITY AND SERIOUS INJURY New Serious Injury Guidelines NMFS updated its serious injury designation and reporting process, which uses guidance from previous serious injury workshops, expert opinion, and analysis of historic injury cases to develop new criteria for distinguishing serious from non-serious injury (Angliss and DeMaster 1998, Andersen et al. 2008, NOAA 2012). NMFS defines serious injury as an “injury that is more likely than not to result in mortality”. Injury determinations for stock assessments revised in 2013 or later incorporate the new serious injury guidelines, based on the most recent 5-year period for which data are available. Fishery Information Information on fishery-related mortality and serious injury of cetaceans in Hawaiian waters is limited, but the gear types used in Hawaiian fisheries are responsible for marine mammal mortality and serious injury in other fisheries throughout U.S. waters. Gillnets appear to capture marine mammals wherever they are used, and float lines from lobster traps and longlines can be expected to occasionally entangle cetaceans (Perrin et al. 1994). No interactions between nearshore fisheries and Longman’s beaked whales have been reported in Hawaiian waters. No estimates of human-caused mortality or serious injury are currently available for nearshore hook and line or gillnet fisheries because these fisheries are not observed or monitored for protected species bycatch. Interactions with cetaceans have been reported for all Hawaiian pelagic fisheries (Nitta and Henderson 1993). There are currently two distinct longline fisheries based in Hawaii: a deep-set longline (DSLL) fishery that targets primarily tunas, and a shallow-set longline fishery (SSLL) that targets swordfish. Both fisheries operate within U.S. waters and on the high seas. Between 2004 and 20082007 and 2011, no Longman’s beaked whales were observed hooked or entangled in the SSLL fishery (100% observer coverage) or the DSLL fishery (20-2228% observer coverage) (McCracken 2013, Bradford & Forney 2013& Forney 2010). However, eightone unidentified cetaceans, which may have been a Longman’s beaked whale, wereas taken in the DSLL fishery, and two unidentified cetaceans, one unidentified Mesoplodon, and one unidentified beaked whale, which may have been Longman’s beaked whales were taken in the SSLL fishery. Other Mortality Anthropogenic sound sources, such as military sonar and seismic testing have been implicated in the mass strandings of beaked whales, including atypical events involving multiple beaked whale species (Simmonds and Lopez-Jurado 1991, Frantiz 1998, Anon. 2001, Jepson et al. 2003, Cox et al. 2006). While D’Amico et al. (2009) note that most mass strandings of beaked whales are unassociated with documented sonar activities, lethal or sub-lethal effects of such activities would rarely be documented, due to the remote nature of such activities and the low probability that an injured or dead beaked whale would strand. Filadelpho et al. (2009) reported statistically significant correlations between military sonar use and mass strandings of beaked whales in the Mediterranean and Caribbean Seas, but not in Japanese and Southern California waters, and hypothesized that regions with steep bathymetry adjacent to coastlines are more conducive to stranding events in the presence of sonar use. In Hawaiian waters, Faerber & Baird (2010) suggest that the probability of stranding is lower than in some other regions due to
227

nearshore currents carrying animals away from beaches, and that stranded animals are less likely to be detected due to low human population density near many of Hawaii’s beaches. Actual and simulated sonar are known to interrupt the foraging dives and echolocation activities of tagged beaked whales (Tyack et al. 2011, DeRuiter et al. 2013). Cuvier’s beaked whales tagged and tracked during simulated mid-frequency sonar exposure showed avoidance reactions, including prolonged diving, cessation of echolocation click production associated with foraging, and directional travel away from the simulated sonar source (DeRuiter et al. 2013). Blainville’s beaked whale presence was monitored on hydrophone arrays before, during, and after sonar activities on a Caribbean military range, with evidence of avoidance behavior: whales were detected throughout the range prior to sonar exposure, not detected in the center of the range coincident with highest sonar use, and gradually returned to the range center after the cessation of sonar activity (Tyack et al. 2011). Fernández et al. (2013) report that there have been no mass strandings of beaked whales in the Canary Islands following a 2004 ban on sonar activities in that region. The absence of beaked whale bycatch in California drift gillnets following the introduction of acoustic pingers into the fishery implies additional sensitivity of beaked whales to anthropogenic sound (Carretta et al. 2008, Carretta and Barlow 2011). In recent years, there has been increasing concern that loud underwater sounds, such as active sonar and seismic operations, may be harmful to beaked whales (Malakoff 2002). The use of active sonar from military vessels has been implicated in mass strandings of beaked whales in the Mediterranean Sea during 1996 (Frantzis 1998), the Bahamas during 2000 (U.S. Dept. of Commerce and Secretary of the Navy 2001), and the Canary Islands 2002 (Martel, 2002). Similar military active sonar operations occur around the Hawaiian Islands. It has been suggested that quick ascent from deep dives in response to acoustic exposure could lead to death in beaked whales (Cox et al. 2006). A modeling exercise based on dive data from Blainville’s, Cuvier’s and northern bottlenose whales suggest that the dive habits of all three species produce tissue nitrogen saturation levels that would normally cause decompression sickness in terrestrial mammals (Hooker et al. 2009). No estimates of potential mortality or serious injury are available for U.S. waters. STATUS OF STOCK The Hawaii stock of Longman’s beaked whales is not considered strategic under the 1994 amendments to the MMPA. The status of Longman's beaked whales in Hawaiian waters relative to OSP is unknown, and there are insufficient data to evaluate trends in abundance. Longmans’ beaked whales are It is not listed as “threatened” or “endangered” under the Endangered Species Act (1973), nor designated as “depleted” under the MMPA. Given the absence of recent recorded fishery-related mortality or serious injuries, the Hawaiian stock of Longman’s beaked whales is not considered strategic under the 1994 amendments to the MMPA. , and the total fishery mortality and serious injury can be considered to be insignificant and approaching zero The impacts of anthropogenic sound on beaked whales remain a concern (Barlow and Gisiner 2006, Cox et al. 2006, Hildebrand et al. 2005, Weilgart 2007). . The increasing level of anthropogenic noise in the world’s oceans has been suggested to be a habitat concern for whales (Richardson et al. 1995), particularly for deep-diving whales like Longman’s beaked whales that feed in the oceans’ “sound channel”. The first confirmed case of morbillivirus in a Hawaiian cetacean was found in a subadult Longman’s beaked whale stranded on Maui in 2010 (West et al 2012). The presence of morbillivirus in 10 species of cetacean in Hawaiian waters, including all 3 known species of beaked whales (Jacob 2012), raises concerns about the history and prevalence of this disease in Hawaii and the potential population impacts on Hawaii cetaceans. REFERENCES Anderson, M.S., K.A. Forney, T.V.N. Cole, T. Eagle, R.P. Angliss, K. Long, L. Barre, L. VanAtta, D. Borggaard, T.
Rowles, B. Norberg, J. Whaley, L. Engleby. Differentiating serious and non-serious injury of marine mammals: Report of the Serious Injury Technical Workshop 10-13 September 2007, Seattle, WA. NOAA Tech Memo NMFS-OPR-39, 94 p.
Angliss, R.P. and D.P. DeMaster. 1997. Differentiating serious and non-serious injury of marine mammals taken incidental to commercial fishing operations: Report of the Serious Injury Workshop 1-2 April. 1997, Silver Spring, MD. NOAA Tech Memo NMFS-OPR-13, 48 p.
Anon. 2001. Joint Interim Report, Bahamas Marine Mammal Stranding Event of 15_16 March 2000. Available from NOAA, NMFS, Office of Protected Resources, Silver Spring, MD.
Azzaroli, M. L. 1968. Second specimen of Mesoplodon pacificus, the rarest living beaked whale. Monitore Zoologico Italiano (N.S.) 2:67-79.
Barlow, J. 2006. Cetacean abundance in Hawaiian waters estimated from a summer/fall survey in 2002. Marine Mammal Science 22: 446–464.
Barlow, J. and R. Gisiner. 2006. Mitigating, monitoring, and assessing the effects of anthropogenic sound on beaked whales. J. Cet. Res. Manage. 7(3):239-249.
228

Barlow, J., S.L. Swartz, T.C. Eagle, and P.R. Wade. 1995. U.S. Marine Mammal Stock Assessments: Guidelines for Preparation, Background, and a Summary of the 1995 Assessments. U.S. Dep. Commer., NOAA Tech. Memo. NMFS-OPR-6, 73 p.
Bradford, A.L. and K.A. Forney. 2013. Injury determinations for cetaceans observed interacting with Hawaii and American Samoa longline fisheries during 2007-2011. PIFSC Working Paper WP-13-002.
Bradford. A.L., K.A. Forney, E.M. Oleson, and J. Barlow. 2013. Line-transect abundance estimates of cetaceans in the Hawaiian EEZ. PIFSC Working Paper WP-13-004.
Carretta, J., J. Barlow, and L. Enriquez. 2008. Acoustic pinger eliminate beaked whale bycatch in a gillnet fishery. Marine Mammal Science 24(4): 956-961.
Carretta, J.V. and J. Barlow. 2011. Long-term effectiveness, failure rates, and “dinner bell” properties of acoustic pingers in a gillnet fishery. Marine technology Society Journal 45(5): 7-19.
Cox, T.M., T.J. Ragen, A.J. Read, E. Vos, R.W. Baird, K. Balcomb, J. Barlow, J. Caldwell, T. Cranford, L. Crum, A. D’Amico, G. D’Spain, A. Fernandez, J. Finneran, R. Gentry, W. Gerth, F. Gulland, J.A. Hildebrand, D. Houser, T. Hullar, P.D. Jepson, D. Ketten, C.D. Macleod, P. Miller, S. Moore, D. Mountain, D. Palka, P. Ponganis, S. Rommel, T. Rowles, B. Taylor, P. Tyack, D. Wartzok, R. Gisiner, J. Mead, and L. Brenner. 2006. Understanding the impacts of anthropogenic sound on beaked whales. J.Cetacean Res. Manag. 7: 177-187.
Dalebout, M. L., G. J. B. Ross, C. S. Baker, R. C. Anderson, P. B. Best, V. G. Cockcroft, H. L. Hinsz, V. Peddemors and R. L. Pitman. 2003. Appearance, distribution and genetic distinctiveness of Longman’s beaked whale, Indopacetus pacificus. Marine Mammal Science 19:421-461.
D’Amico A., Gisiner R.C., Ketten D.R., Hammock J.A., Johnson C., et al. 2009. Beaked whale strandings and naval exercises. Aquat. Mamm. 34: 452–472.
DeRuiter, S.L., Southall B.L.,Calambokidis J., Zimmer W.M.X., Sadykova D., Falcone E.A., Friedlaender A.S., Joseph J.E., Moretti D., Schorr G.S., Thomas L., Tyack P.L. 2013. First direct measurements of behavioural responses by Cuvier’s beaked whales to mid-frequency active sonar. Biol Lett 9: 20130223. http://dx.doi.org/10.1098/rsbl.2013.0223
Faerber, M.M. and R.W. Baird. 2010. Does a lack of observed beaked whale strandings in military exercise areas mean no impacts have occurred? A comparison of stranding and detection probabilities in the Canary and main Hawaiian Islands. Mar. Mamm. Sci. 26(3); 602-613.
Fernández, A., Arbelo, M. and Martín, V. 2013. No mass strandings since sonar ban. Nature 497:317. Filadelfo R., Mintz J., Michlovich E., D’Amico A., Tyack P.L. 2009. Correlating military sonar use with beaked
whale mass strandings: what do the historical data show? Aquat Mamm 34: 435–444. Forney, K.A. 2009. Serious injury determinations for cetaceans caught in Hawaii longline fisheries during 1994-
2008. Draft document PSRG-2009-09 presented to the Pacific Scientific Review Group, November 3-5, 2009, Del Mar, CA..Frantzis, A. 1998. Does acoustic testing strand whales? Nature 392(5):29.
Hooker, S.K., R.W. Baird, F.A. Fahlman. 2009. Could beaked whales get the bends? Effect of diving behavior and physiology on modeled gas exchange for three species: Ziphius cavirostris, Mesoplodon densirostris, and Hyperoodon ampulata.. Respiration Physiology and Neurobiology 117(2009): 235-246.
Hildebrand J.A. 2005. Impacts of anthropogenic sound. In: Reynolds III JE, Perrin WF, Reeves RR, Montgomery S, Ragen TJ, editors. Marine mammal research: conservation beyond crisis. Baltimore: Johns Hopkins University. pp. 101 – 123.
Jacob, J. M. 2012. Screening and characterization of morbillivirus in Hawaiian cetaceans. M.S. Marine Science Thesis. Hawaii Pacific University, Kaneohe, HI,
Jefferson, T. A., S. Leatherwood, and M. A. Webber. 1993. FAO species identification guide: marine mammals of the world. United States Environment Programme; Food and Agriculture Organization of the United Nations (FAO), Rome. 320p.
Jepson, P.D., M. Arbelo, R. Deaville, I. A.P. Patterson, P. Castro, J.R. Baker, E. Degollada, H.M. Ross, P. Herraez, A.M. Pocknell, F. Rodriguez, F.E. Howie, A. Espinoza, R.J. Reid, J.R. Jaber, V. martin, A.A. Cunningham, and A. Fernandez. 2003. "Gas-bubble lesions in stranded cetaceans." Nature 425, no. 6958 (2003): 575-576.
Longman, H.A. 1926. New records of Cetacea, with a list of Queensland species. Memoirs of the Queensland Museum 8:266-278.
Malakoff, D. 2002. Suit ties whale deaths to research cruise. Science 298:722-723 Maldini, D., L. Mazzuca, and S. Atkinson. 2005. Odontocete stranding patterns in the Main Hawaiian Islands
(1937-2002): How do they compare with live animal surveys? Pacific Science 59(1):55-67. Martel, V. M. 2002. Summary of the report on the atypical mass stranding of beaked whales in the Canary Islands
229

in September 2002 during naval exercises. Society for the Study of the Cetaceans in the Canary Archipelago (SECAC). Unpublished report. 11p. McCracken, M. 2013. Preliminary assessment of incidental interactions with marine mammals in the Hawaii longline deep and shallow set fisheries from 2007 to 2011. PIFSC Working Paper WP-13-XXX.
McCracken M., and K.A. Forney. 2010. Preliminary assessment of incidental interactions with marine mammals in the Hawaii longline deep and shallow set fisheries. NMFS, Pacific Islands Fisheries Science Center Working Paper WP-10-001. 27p.
Moore J. C. 1968. Relationships among the living genera of beaked whales. Fieldiana Zoology 53:209-298. NMFS 2001. Western Pacific Pelagic Fisheries Biological Opinion. Available from Pacific Islands Region, 1602
Kapiolani Blvd, Suite 1110, Honolulu, HI 96814 (). NMFS. 2005. Revisions to Guidelines for Assessing Marine Mammal Stocks. 24 pp. Available at:
http://www.nmfs.noaa.gov/pr/pdfs/sars/gamms2005.pdf NMFS. 2012. NOAA Fisheries Policy Directive 02-038-01 Process for Injury Determinations (01/27/12). Available
at: http://www.nmfs.noaa.gov/pr/pdfs/serious_injury_policy.pdf Nitta, E. 1991. The marine mammal stranding network for Hawaii: an overview. In: J.E. Reynolds III, D.K. Odell
(eds.), Marine Mammal Strandings in the United States, pp.56-62. NOAA Tech. Rep. NMFS 98, 157 pp. Nitta, E. and J. R. Henderson. 1993. A review of interactions between Hawaii's fisheries and protected species.
Mar. Fish. Rev. 55(2):83-92. Perrin, W. F., G. P. Donovan and J. Barlow. 1994. Gillnets and Cetaceans. Rep. Int. Whal. Commn., Special Issue
15, 629 pp. Pitman, R. L., D. M. Palacios, P. L Brennan, K.C. III. Balcomb, and T. Miyashita. 1999. Sightings and possible
identity of a bottlenose whale in the tropical Indo-Pacific: Indopacetus pacificus? Marine Mammal Science 15:531-549.
Rice, D. W. 1998. Marine Mammals of the world: systematics and distribution. Special Publication 4. The Society for Marine Mammalogy, Lawrence, KS, USA.
Richardson, W. J., C. R. Greene, Jr., C. I. Malme, and D. H. Thompson. 1995. Marine Mammals and Noise. Academic Press, San Diego. 576 p.
Simmonds, M. P., and L.F. Lopez-Jurado. 1991. Whales and the military. Nature, 351(6326): 448.U.S. Department of Commerce and Secretary of the Navy. 2001. Joint Interim Report, Bahamas Marine Mammal Stranding Event of 15_16 March 2000. Available from NOAA, NMFS, Office of Protected Resources, Silver Spring, MD.
Tyack, P. L., W.M.X. Zimmer, D.Moretti, B.L. Southall, D.E. Claridge, J.W. Durban, C. W. Clark, A. D’Amico, N. DiMarzio, S. Jarvis, E. McCarthy, R. Morrissey, J. Ward, and I.L. Boyd. 2011. Beaked whales respond to simulated and actual navy sonar. PLoS One 6(3): e17009.
Wade, P. R. and R. P. Angliss. 1997. Guidelines for Assessing Marine Mammal Stocks: Report of the GAMMS Workshop April 3-5, 1996, Seattle, Washington. U. S. Dep. Commer., NOAA Tech. Memo. NMFS-OPR-12. 93 pp.
West, K.L, S. Sanchez, D. Rothstein, K.M. Robertson, S. Dennison, G. Levine, N. Davis, D. Schoffield, C.W. Potter, and B. Jensen. 2012. A Longman’s beaked whale (Indopacetus pacificus) strands in Maui, Hawaii, with the first case of morbillivirus in the central Pacific. Mar. Mamm. Sci. DOI: 10.1111/j.1748-7692.2012.00616.x.
Weilgart, L.S. 2007. The impacts of anthropogenic ocean noise on cetaceans and implications for management. Canadian Journal of Zoology 85:1091-1116.
230
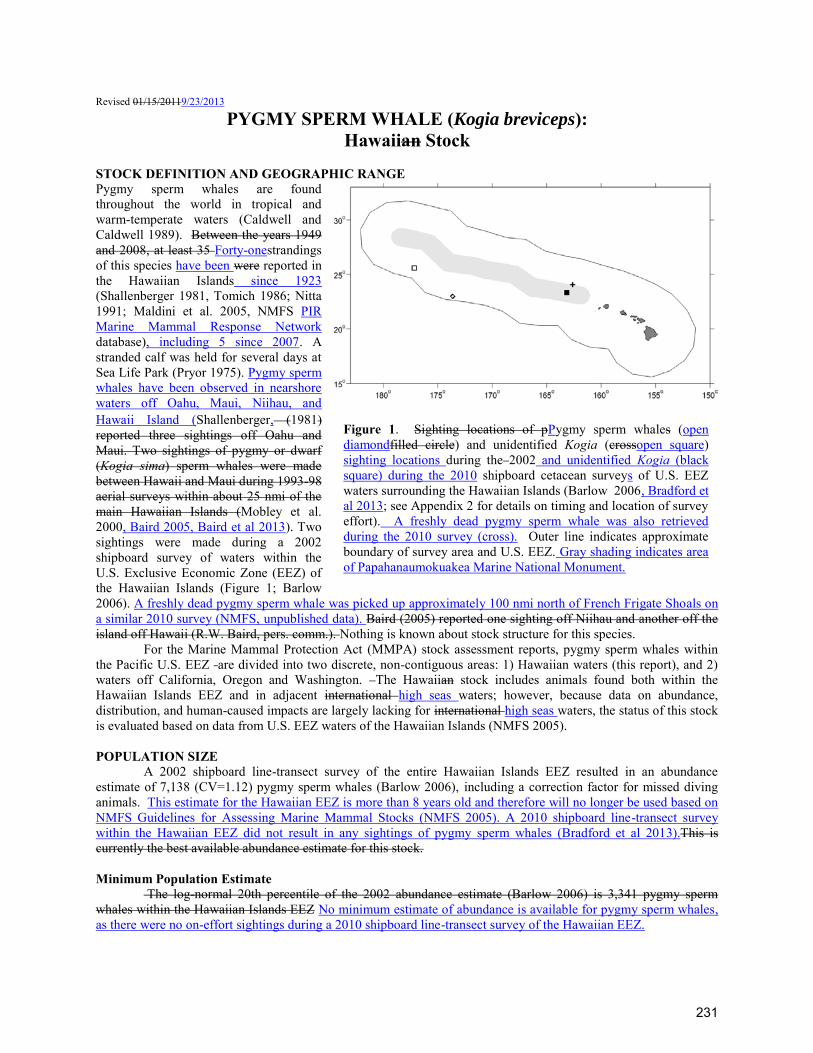
Revised 01/15/20119/23/2013
PYGMY SPERM WHALE (Kogia breviceps): Hawaiian Stock
STOCK DEFINITION AND GEOGRAPHIC RANGE Pygmy sperm whales are found throughout the world in tropical and warm-temperate waters (Caldwell and Caldwell 1989). Between the years 1949 and 2008, at least 35 Forty-onestrandings of this species have been were reported in the Hawaiian Islands since 1923 (Shallenberger 1981, Tomich 1986; Nitta 1991; Maldini et al. 2005, NMFS PIR Marine Mammal Response Network database), including 5 since 2007. A stranded calf was held for several days at Sea Life Park (Pryor 1975). Pygmy sperm whales have been observed in nearshore waters off Oahu, Maui, Niihau, and Hawaii Island (Shallenberger, (1981) reported three sightings off Oahu and Maui. Two sightings of pygmy or dwarf (Kogia sima) sperm whales were made between Hawaii and Maui during 1993-98 aerial surveys within about 25 nmi of the main Hawaiian Islands (Mobley et al. 2000, Baird 2005, Baird et al 2013). Two sightings were made during a 2002 shipboard survey of waters within the U.S. Exclusive Economic Zone (EEZ) of the Hawaiian Islands (Figure 1; Barlow 2006). A freshly dead pygmy sperm whale was picked up approximately 100 nmi north of French Frigate Shoals on a similar 2010 survey (NMFS, unpublished data). Baird (2005) reported one sighting off Niihau and another off the island off Hawaii (R.W. Baird, pers. comm.). Nothing is known about stock structure for this species.
For the Marine Mammal Protection Act (MMPA) stock assessment reports, pygmy sperm whales within the Pacific U.S. EEZ are divided into two discrete, non-contiguous areas: 1) Hawaiian waters (this report), and 2) waters off California, Oregon and Washington. The Hawaiian stock includes animals found both within the Hawaiian Islands EEZ and in adjacent international high seas waters; however, because data on abundance, distribution, and human-caused impacts are largely lacking for international high seas waters, the status of this stock is evaluated based on data from U.S. EEZ waters of the Hawaiian Islands (NMFS 2005). POPULATION SIZE
A 2002 shipboard line-transect survey of the entire Hawaiian Islands EEZ resulted in an abundance estimate of 7,138 (CV=1.12) pygmy sperm whales (Barlow 2006), including a correction factor for missed diving animals. This estimate for the Hawaiian EEZ is more than 8 years old and therefore will no longer be used based on NMFS Guidelines for Assessing Marine Mammal Stocks (NMFS 2005). A 2010 shipboard line-transect survey within the Hawaiian EEZ did not result in any sightings of pygmy sperm whales (Bradford et al 2013).This is currently the best available abundance estimate for this stock. Minimum Population Estimate The log-normal 20th percentile of the 2002 abundance estimate (Barlow 2006) is 3,341 pygmy sperm whales within the Hawaiian Islands EEZ No minimum estimate of abundance is available for pygmy sperm whales, as there were no on-effort sightings during a 2010 shipboard line-transect survey of the Hawaiian EEZ.
Figure 1. Sighting locations of pPygmy sperm whales (open diamondfilled circle) and unidentified Kogia (crossopen square) sighting locations during the 2002 and unidentified Kogia (black square) during the 2010 shipboard cetacean surveys of U.S. EEZ waters surrounding the Hawaiian Islands (Barlow 2006, Bradford et al 2013; see Appendix 2 for details on timing and location of survey effort). A freshly dead pygmy sperm whale was also retrieved during the 2010 survey (cross). Outer line indicates approximate boundary of survey area and U.S. EEZ. Gray shading indicates area of Papahanaumokuakea Marine National Monument.
231

Current Population Trend No data are available on current population abundance or trend. CURRENT AND MAXIMUM NET PRODUCTIVITY RATES No data are available on current or maximum net productivity rate. POTENTIAL BIOLOGICAL REMOVAL The potential biological removal (PBR) level for this stock is calculated as the minimum population size within the U.S EEZ of the Hawaiian Islands (3,341) times one half the default maximum net growth rate for cetaceans (½ of 4%) times a recovery factor of 0.50 (for a stock of unknown status with no known fishery mortality or serious injury within the Hawaiian Islands EEZ; Wade and Angliss 1997), resulting in a PBR of 33 pygmy sperm whales per year. Because there is no minimum population size estimate for pygmy sperm whales in Hawaii, the PBR is undetermined. HUMAN-CAUSED MORTALITY AND SERIOUS INJURY New Serious Injury Guidelines NMFS updated its serious injury designation and reporting process, which uses guidance from previous serious injury workshops, expert opinion, and analysis of historic injury cases to develop new criteria for distinguishing serious from non-serious injury (Angliss and DeMaster 1998, Andersen et al. 2008, NOAA 2012). NMFS defines serious injury as an “injury that is more likely than not to result in mortality”. Injury determinations for stock assessments revised in 2013 or later incorporate the new serious injury guidelines, based on the most recent 5-year period for which data are available. Fishery Information Information on fishery-related mortality of cetaceans in Hawaiian waters is limited, but the gear types used in Hawaiian fisheries are responsible for marine mammal mortality and serious injury in other fisheries throughout U.S. waters. Gillnets appear to capture marine mammals wherever they are used, and float lines from lobster traps and longlines can be expected to occasionally entangle cetaceans (Perrin et al. 1994). No estimates of human-caused mortality or serious injury are currently available for nearshore hook and line or gillnet fisheries because these fisheries are not observed or monitored for protected species bycatch. Interactions with cetaceans have been reported for all Hawaiian pelagic fisheries (Nitta and Henderson 1993). There are currently two distinct longline fisheries based in Hawaii: a deep-set longline (DSLL) fishery that targets primarily tunas, and a shallow-set longline fishery (SSLL) that targets swordfish. Both fisheries operate within U.S. waters and on the high seas. Between 2007 and 20112004 and 2008, one pygmy or dwarf sperm whale was observed hooked in the SSLL fishery (100% observer coverage) (Figure 2, Bradford & Forney 2013, McCracken 2013& Forney 2010). Based on an evaluation of the observer’s
Figure 2. Location of pygmy or dwarf sperm whale take (filled diamond) in Hawaii-based longline fisheries, 2007-20112004-2008. Solid lines represent the U.S. EEZs. Fishery descriptions are provided in Appendix 1.
232

description of the interaction and following the most recently developed criteria for assessing serious injury in marine mammals (Andersen et al. 2008NMFS 2012), this animal was considered not seriously injured (Forney 2009Bradford & Forney 2013). No pygmy sperm whales were observed hooked or entangled in the DSLL fishery (20-2228% observer coverage). Eight unidentified cetaceans were taken in the DSLL fishery, and two unidentified cetaceans were taken in the SSLL fishery, some of which may have been pygmy sperm whales. Table 1. Summary of available information on incidental mortality and serious injury of pygmy sperm whales (Hawaiian stock) in commercial fisheries, within and outside of the Hawaiian Islands EEZ (McCracken 2013& Forney 2010). Mean annual takes are based on 2004-2008 data unless otherwise indicated; n/a = not available.Mean annual takes are based on 2007-2011 data unless otherwise indicated. Information on all observed takes (T) and combined mortality events & serious injuries (MSI) is included. Total takes were prorated to deaths, serious injuries, and non-serious injuries based on the observed proportions of each outcome.
Fishery Name Year Data Type
Percent Observer Coverage
Observed total interactions (T) and mortality events, and serious injuries (MSI), and total estimated mortality and serious injury (M&SI) of pygmy
sperm whales Outside U.S. EEZs Inside Hawaiian EEZ
Obs. T/MSI Estimated
M&SI (CV) Obs. T/MSI Estimated
M&SI (CV)
Hawaii-based deep-set longline
fishery
2007
Observer data
20% 0 0 (-) 0 0 (-) 2008 22% 0 0 (-) 0 0 (-) 2009 21% 0 0 (-) 0 0 (-) 2010 21% 0 0 (-) 0 0 (-) 2011 20% 0 0 (-) 0 0 (-)
Mean Estimated Annual Take (CV) 0 (-) 0 (-)
Hawaii-based shallow-set
longline fishery
2007
Observer data
100% 0 0 0 0 2008 100% 1*/0 0 0 0 2009 100% 0 0 0 0 2010 100% 0 0 0 0 2011 100% 0 0 0 0
Mean Annual Takes (100% coverage) 0 0 Minimum total annual takes within U.S. EEZ 0 (-)
*One animal was identified as either a pygmy sperm whale or a dwarf sperm whale. STATUS OF STOCK The Hawaii stock of pygmy sperm whales is not considered strategic under the 1994 amendments to the MMPA. The status of pygmy sperm whales in Hawaiian waters relative to OSP is unknown, and there are insufficient data to evaluate trends in abundance. Pygmy sperm whales areIt is not listed as “threatened” or “endangered” under the Endangered Species Act (1973), nor designated as “depleted” under the MMPA. Given the absence of recent recorded fishery-related mortality or serious injuries within the Hawaiian Islands EEZ, the Hawaiian stock of pygmy sperm whales is not considered strategic under the 1994 amendments to the MMPA, and the total fishery mortality and serious injury can be considered to be insignificant and approaching zero. The increasing level of anthropogenic noise in the world’s oceans has been suggested to be a habitat concern for whales (Richardson et al. 1995), particularly for deep-diving whales like pygmy sperm whales that feed in the oceans’ “sound channel”. One pygmy sperm whale found stranded in the main Hawaiian Islands has tested positive for Morbillivirus (Jacob 2012). Although morbillivus is known to trigger lethal disease in cetaceans (Van Bressem et al. 2009), its impact on the health of the stranded animal is not known as it was found in only a few tested tissues (Jacob 2012). The presence of morbillivirus in 10 species of cetacean in Hawaiian waters (Jacob 2012) raises concerns about the history and prevalence of this disease in Hawaii and the potential population impacts on Hawaiian cetaceans.
Fishery Name Year Data Type
Percent Observer
Mortality and Serious Injury outside of U.S. EEZ
Mortality and Serious Injury within Hawaiian Islands EEZ
233

Coverage Observed Estimated
(CV) Mean Annual
Takes (CV)
Observed Estimated (CV)
Mean Annual Takes (CV)
Hawaii-based deep-set longline fishery
2004 2005 2006 2007 2008
observer data
25% 28% 22% 20% 22%
0 0 0 0 0
0 (-) 0 (-) 0 (-) 0 (-) 0 (-)
0 (-)
0 0 0 0 0
0 (-) 0 (-) 0 (-) 0 (-) 0 (-)
0 (-)
Hawaii-based shallow-set longline fishery
2004 2005 2006 2007 2008
observer data
100% 100% 100% 100% 100%
0 0 0 0
1*
Same as observed 0.2
0 0 0 0 0
Same as observed 0
Minimum total annual takes within U.S. EEZ waters 0 *One animal, which was either a pygmy sperm whale or dwarf sperm whales, observed not seriously injured. REFERENCES Anderson, M.S., K.A. Forney, T.V.N. Cole, T. Eagle, R.P. Angliss, K. Long, L. Barre, L. VanAtta, D. Borggaard, T.
Rowles, B. Norberg, J. Whaley, L. Engleby. Differentiating serious and non-serious injury of marine mammals: Report of the Serious Injury Technical Workshop 10-13 September 2007, Seattle, WA. NOAA Tech Memo NMFS-OPR-39, 94 p.
Angliss, R.P. and D.P. DeMaster. 1997. Differentiating serious and non-serious injury of marine mammals taken incidental to commercial fishing operations: Report of the Serious Injury Workshop 1-2 April. 1997, Silver Spring, MD. NOAA Tech Memo NMFS-OPR-13, 48 p.
Baird, R.W. 2005. Sightings of dwarf (Kogia sima) and pygmy (K. breviceps) sperm whales from the main Hawaiian Islands. Pacific Science 59: 461-466..
Baird, R.W., D.L. Webster, J.M. Aschettino, G.S. Schorr and D.J. McSweeney. 2013. Odontocete cetaceans around the main Hawaiian Islands: habitat use and relative abundance from small-boat surveys. SRG Meeting Document.
Barlow, J. 2006. Cetacean abundance in Hawaiian waters estimated from a summer/fall survey in 2002. Marine Mammal Science 22: 446–464.
Bradford, A.L. and K.A. Forney. 2013. Injury determinations for cetaceans observed interacting with Hawaii and American Samoa longline fisheries during 2007-2011. PIFSC Working Paper WP-13-002.
Bradford. A.L., K.A. Forney, E.M. Oleson, and J. Barlow. 2013. Line-transect abundance estimates of cetaceans in the Hawaiian EEZ. PIFSC Working Paper WP-13-004.
Forney, K.A. 2009. Serious injury determinations for cetaceans caught in Hawaii longline fisheries during 1994-2008. Draft document PSRG-2009-09 presented to the Pacific Scientific Review Group, November 3-5, 2009, Del Mar, CA..Caldwell, D. K. and M. C. Caldwell. 1989. Pygmy sperm whale Kogia breviceps (de Blainville, 1838): Dwarf sperm whale Kogia simus Owen, 1866. In: S. H. Ridgway and R. Harrison (eds.), Handbook of Marine Mammals, Vol. 4: The River Dolphins and Larger Toothed Whales, pp. 235-260. Academic Press, 442 pp.
Jacob, J. M. 2012. Screening and characterization of morbillivirus in Hawaiian cetaceans. M.S. Marine Science Thesis. Hawaii Pacific University, Kaneohe, HI,
Maldini, D., L. Mazzuca, and S. Atkinson. 2005. Odontocete stranding patterns in the Main Hawaiian Islands (1937-2002): How do they compare with live animal surveys? Pacific Science 59(1):55-67.
McCracken, M. 2013. Preliminary assessment of incidental interactions with marine mammals in the Hawaii longline deep and shallow set fisheries from 2007 to 2011. PIFSC Working Paper WP-13-XXX.
McCracken M., and K.A. Forney. 2010. Preliminary assessment of incidental interactions with marine mammals in the Hawaii longline deep and shallow set fisheries. NMFS, Pacific Islands Fisheries Science Center Working Paper WP-10-001. 27p.
Mobley, J. R., Jr, S. S. Spitz, K. A. Forney, R. A. Grotefendt, and P. H. Forestall. 2000. Distribution and abundance of odontocete species in Hawaiian waters: preliminary results of 1993-98 aerial surveys Admin. Rep. LJ-00-14C. Southwest Fisheries Science Center, National Marine Fisheries Service, P.O. Box 271, La Jolla, CA 92038. 26 pp.
NMFS Pacific Islands Regional Office Stranding Database. Available from NMFS-PIRO 1601 Kapiolani Blvd, Ste. 1110, Honolulu, HI 96814.
NMFS. 2005. Revisions to Guidelines for Assessing Marine Mammal Stocks. 24 pp. Available at: http://www.nmfs.noaa.gov/pr/pdfs/sars/gamms2005.pdf
234

NMFS. 2012. NOAA Fisheries Policy Directive 02-038-01 Process for Injury Determinations (01/27/12). Available at: http://www.nmfs.noaa.gov/pr/pdfs/serious_injury_policy.pdf
Nitta, E. 1991. The marine mammal stranding network for Hawaii: an overview. In: J.E. Reynolds III, D.K. Odell (eds.), Marine Mammal Strandings in the United States, pp.56-62. NOAA Tech. Rep. NMFS 98, 157 pp.
Nitta, E. and J. R. Henderson. 1993. A review of interactions between Hawaii's fisheries and protected species. Mar. Fish. Rev. 55(2):83-92.
Perrin, W.F., G. P. Donovan and J. Barlow. 1994. Gillnets and Cetaceans. Rep. Int. Whal. Commn., Special Issue 15, 629 pp.
Pryor, K. 1975. Lads Before the Wind: Adventures in Porpoise Training. Harper and Row, New York, 278 pp. Richardson, W. J., C. R. Greene, Jr., C. I. Malme, and D. H. Thompson. 1995. Marine Mammals and Noise.
Academic Press, San Diego. 576 p. Shallenberger, E.W. 1981. The status of Hawaiian cetaceans. Final report to U.S. Marine Mammal Commission.
MMC-77/23, 79pp. Tomich, P. Q. 1986. Mammals in Hawaii: A Synopsis and Notational Bibliography. Bishop Museum Press, Hawaii,
375 pp. Van Bressem, M., J.A. Raga, G. Di Guardo, D.P. Jepson, P. J. Duignan, U. Siebert, T. Barrett, M. C. de Oliveira
Santos, I.B. Moreno, S. Siciliano, A. Aguilar, K. Van Waerebeer. 2009. Emerging infectious diseases in cetaceans worldwide and the possible role of environmental stressors. Diseases of Aquatic Organisms. 85:143-157.
Wade, P. R. and R. P. Angliss. 1997. Guidelines for Assessing Marine Mammal Stocks: Report of the GAMMS Workshop April 3-5, 1996, Seattle, Washington. U. S. Dep. Commer., NOAA Tech. Memo. NMFS-OPR-12. 93 pp.
235

Revised 01/15/2011 9/23/2013 DWARF SPERM WHALE (Kogia sima):
Hawaiian Stock STOCK DEFINITION AND GEOGRAPHIC RANGE Dwarf sperm whales are found throughout the world in tropical to warm-temperate waters (Nagorsen 1985). Rice (1998) recently argued that the species name simus, was incorrect and should be replaced by sima to reflect rules of Latin usage. At least seven four strandings of dwarf sperm whales have been documented in Hawaii since 1985 (Tomich 1986; Nitta 1991; Maldini et al. 2005, NMFS PIR Marine Mammal Response Network database), including two since 2007. Two sightings of pygmy or dwarf sperms whales were made between Hawaii and Maui during 1993-98 aerial surveys within about 25 nmi of the main Hawaiian Islands (Mobley et al. 2000). From 2002 and 2012, , and dwarf sperm whales whales have been seen were seen near Niihau, Kauai, Oahu, Lanai, and Hawaii during small boat surveys between 2000 and 2003 (Baird et al 2005, Baird et al 2013). Summer/fall shipboard surveys of the waters within the U.S. Exclusive Economic Zone (EEZ) of the Hawaiian Islands, resulted in Ffive sightings of dwarf sperm whales were made during a 2002 and one during 2010 shipboard surveys of waters within the U.S. Exclusive Economic Zone (EEZ) of the Hawaiian Islands (Figure 1; Barlow 2006, Bradford et al 2013).
Small boat surveys within the main Hawaiian Islands (MHI) since 2002 have documented dwarf sperm whales on 73 occasions, most commonly in water depths between 500m and 1,000m (Baird et al 2013). Long-term site-fidelity is evident off Hawaii Island, with one third of the distinctive individuals seen there encountered in more than one year. Resighting data from 25 individuals documented at Hawaii Island suggest an island-resident population with restricted range, with all encounters in less than 1,600m water depth and less than 20 km from shore (Baird et al 2013). Division of this population into a separate island-associated stock may be warranted in the future.
For the Marine Mammal Protection Act (MMPA) stock assessment reports, dwarf sperm whales within the Pacific U.S. EEZ are divided into two discrete, non-contiguous areas: 1) Hawaiian waters (this report), and 2) waters off California, Oregon and Washington. The Hawaiian stock includes animals found within the Hawaiian Islands EEZ and in adjacent high seasinternational waters; however, because data on abundance, distribution, and human-caused impacts are largely lacking for international high seas waters, the status of this stock is evaluated based on data from U.S. EEZ waters of the Hawaiian Islands (NMFS 2005). POPULATION SIZE Wade and Gerrodette (1993) provided an estimate for the eastern tropical Pacific, but it is not known whether these animals are part of the same population that occurs in the central North Pacific. Baird (2005) reports that dwarf sperm whales are the sixth most commonly sighted odontocete around the Main Hawaiian Islands. This species’ small size, tendency to avoid vessels, and deep-diving habits, combined with the high proportion of Kogia sightings that are not identified to species, may result in negatively biased estimates of relative abundances in this region (R.W. Baird, pers. comm.). A 2002 shipboard line-transect survey of the entire Hawaiian Islands EEZ resulted in an abundance estimate of 17,519 (CV=0.74) dwarf sperm whales (Barlow 2006), including a correction factor for missed diving animals. There were no on-effort sightings of dwarf sperm whales during the 2010
Figure 1. Dwarf sperm whale (open diamonds) and unidentified Kogia (open squares) Ssighting locations of dwarf sperm whales (filled circle) and unidentified Kogia (cross) during the 2002 (open symbols) and 2010 (black symbols) shipboard cetacean surveys of U.S. waters surrounding the Hawaiian Islands (Barlow 2006, Bradford et al 2013; see Appendix 2 for details on timing and location of survey effort). Outer line indicates approximate boundary of survey area and U.S. EEZ. Gray shading indicates area of Papahanaumokuakea Marine National Monument. Dotted line represents the 1000m isobath.
236

shipboard survey of the Hawaiian EEZ (Bradford et al 2013), such that there is no current This is currently the best available abundance estimate for this stock. Minimum Population Estimate The log-normal 20th percentile of the 2002 abundance estimate (Barlow 2006) is 10,043 dwarf sperm whales within the Hawaiian Islands EEZ; however, the minimum abundance estimate for the entire Hawaiian EEZ is ≥ 8 years old and will no longer be used (NMFS 2005). No minimum estimate of abundance is available for this stock, as there were no sightings of dwarf sperm whales during a 2010 shipboard line-transect survey of the Hawaiian EEZ. Current Population Trend No data are available on current population abundance or trend. CURRENT AND MAXIMUM NET PRODUCTIVITY RATES No data are available on current or maximum net productivity rate. POTENTIAL BIOLOGICAL REMOVAL The potential biological removal (PBR) level for this stock is calculated as the minimum population size within the U.S. EEZ of the Hawaiian Islands (10,043) times one half the default maximum net growth rate for cetaceans (½ of 4%) times a recovery factor of 0.50 (for a stock of unknown status with no known fishery mortality or serious injury within the Hawaiian Islands EEZ; Wade and Angliss 1997)., resulting in a PBR of 100 dwarf sperm whales per year. Because there is no minimum population size estimate for Hawaii pelagic dwarf sperm whales, the PBR is undetermined.
HUMAN-CAUSED MORTALITY AND SERIOUS INJURY New Serious Injury Guidelines NMFS updated its serious injury designation and reporting process, which uses guidance from previous serious injury workshops, expert opinion, and analysis of historic injury cases to develop new criteria for distinguishing serious from non-serious injury (Angliss and DeMaster 1998, Andersen et al. 2008, NOAA 2012). NMFS defines serious injury as an “injury that is more likely than not to result in mortality”. Injury determinations for stock assessments revised in 2013 or later incorporate the new serious injury guidelines, based on the most recent 5-year period for which data are available. Fishery Information Information on fishery-related mortality of cetaceans in Hawaiian waters is limited, but the gear types used in Hawaiian fisheries are responsible for marine mammal mortality and serious injury in other fisheries throughout U.S. waters. . Gillnets appear to capture marine mammals wherever they are used, and float lines from lobster traps and longlines can be expected to occasionally entangle cetaceans (Perrin et al. 1994). No interactions between nearshore fisheries and dwarf sperm whales have been reported in Hawaiian waters. No estimates of human-caused
Figure 2. Location of pygmy or dwarf sperm whale take (filled diamond) in Hawaii-based longline fisheries, 2007-20112004-2008. Solid lines represent the U.S. EEZs. Fishery descriptions are provided in Appendix 1.
237
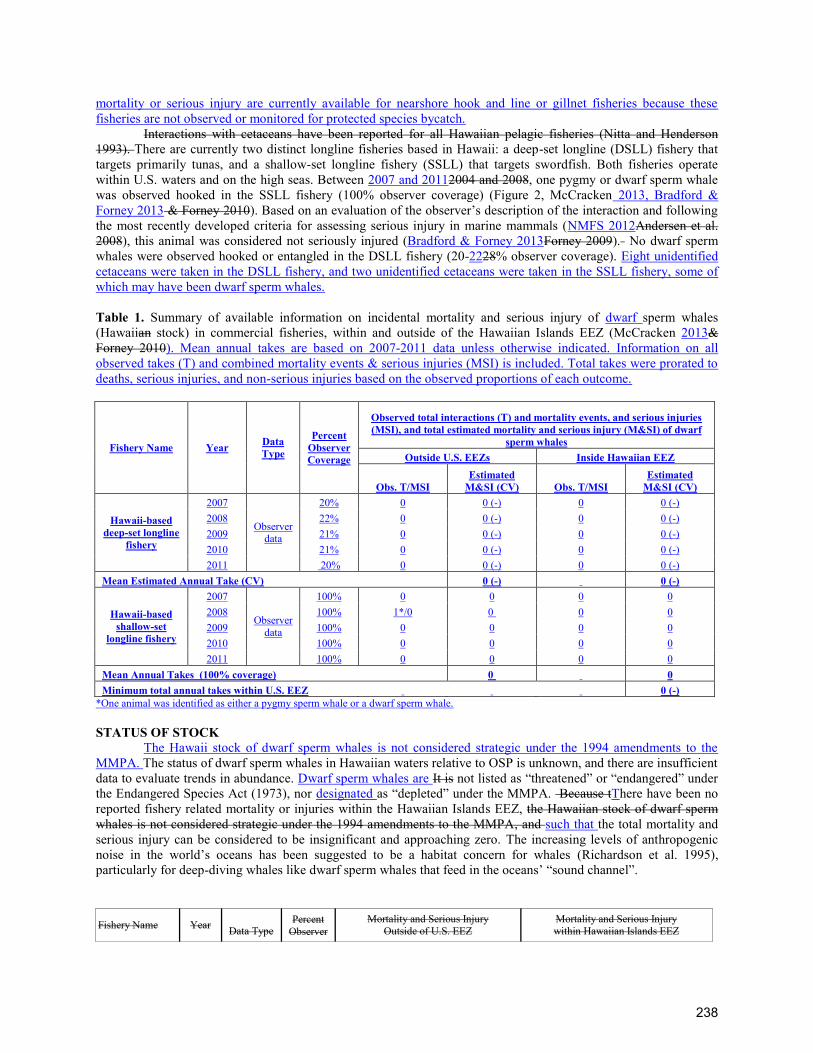
mortality or serious injury are currently available for nearshore hook and line or gillnet fisheries because these fisheries are not observed or monitored for protected species bycatch.
Interactions with cetaceans have been reported for all Hawaiian pelagic fisheries (Nitta and Henderson 1993). There are currently two distinct longline fisheries based in Hawaii: a deep-set longline (DSLL) fishery that targets primarily tunas, and a shallow-set longline fishery (SSLL) that targets swordfish. Both fisheries operate within U.S. waters and on the high seas. Between 2007 and 20112004 and 2008, one pygmy or dwarf sperm whale was observed hooked in the SSLL fishery (100% observer coverage) (Figure 2, McCracken 2013, Bradford & Forney 2013 & Forney 2010). Based on an evaluation of the observer’s description of the interaction and following the most recently developed criteria for assessing serious injury in marine mammals (NMFS 2012Andersen et al. 2008), this animal was considered not seriously injured (Bradford & Forney 2013Forney 2009). No dwarf sperm whales were observed hooked or entangled in the DSLL fishery (20-2228% observer coverage). Eight unidentified cetaceans were taken in the DSLL fishery, and two unidentified cetaceans were taken in the SSLL fishery, some of which may have been dwarf sperm whales. Table 1. Summary of available information on incidental mortality and serious injury of dwarf sperm whales (Hawaiian stock) in commercial fisheries, within and outside of the Hawaiian Islands EEZ (McCracken 2013& Forney 2010). Mean annual takes are based on 2007-2011 data unless otherwise indicated. Information on all observed takes (T) and combined mortality events & serious injuries (MSI) is included. Total takes were prorated to deaths, serious injuries, and non-serious injuries based on the observed proportions of each outcome.
Fishery Name Year Data Type
Percent Observer Coverage
Observed total interactions (T) and mortality events, and serious injuries (MSI), and total estimated mortality and serious injury (M&SI) of dwarf
sperm whales Outside U.S. EEZs Inside Hawaiian EEZ
Obs. T/MSI Estimated
M&SI (CV) Obs. T/MSI Estimated
M&SI (CV)
Hawaii-based deep-set longline
fishery
2007
Observer data
20% 0 0 (-) 0 0 (-) 2008 22% 0 0 (-) 0 0 (-) 2009 21% 0 0 (-) 0 0 (-) 2010 21% 0 0 (-) 0 0 (-) 2011 20% 0 0 (-) 0 0 (-)
Mean Estimated Annual Take (CV) 0 (-) 0 (-)
Hawaii-based shallow-set
longline fishery
2007
Observer data
100% 0 0 0 0 2008 100% 1*/0 0 0 0 2009 100% 0 0 0 0 2010 100% 0 0 0 0 2011 100% 0 0 0 0
Mean Annual Takes (100% coverage) 0 0 Minimum total annual takes within U.S. EEZ 0 (-)
*One animal was identified as either a pygmy sperm whale or a dwarf sperm whale. STATUS OF STOCK The Hawaii stock of dwarf sperm whales is not considered strategic under the 1994 amendments to the MMPA. The status of dwarf sperm whales in Hawaiian waters relative to OSP is unknown, and there are insufficient data to evaluate trends in abundance. Dwarf sperm whales are It is not listed as “threatened” or “endangered” under the Endangered Species Act (1973), nor designated as “depleted” under the MMPA. Because tThere have been no reported fishery related mortality or injuries within the Hawaiian Islands EEZ, the Hawaiian stock of dwarf sperm whales is not considered strategic under the 1994 amendments to the MMPA, and such that the total mortality and serious injury can be considered to be insignificant and approaching zero. The increasing levels of anthropogenic noise in the world’s oceans has been suggested to be a habitat concern for whales (Richardson et al. 1995), particularly for deep-diving whales like dwarf sperm whales that feed in the oceans’ “sound channel”.
Fishery Name Year Data Type
Percent Observer
Mortality and Serious Injury Outside of U.S. EEZ
Mortality and Serious Injury within Hawaiian Islands EEZ
238

Coverage Observed Estimated
(CV) Mean Annual
Takes (CV)
Observed Estimated (CV)
Mean Annual Takes (CV)
Hawaii-based deep-set longline fishery
2004 2005 2006 2007 2008
observer data
25% 28% 22% 20% 22%
0 0 0 0 0
0 (-) 0 (-) 0 (-) 0 (-) 0 (-)
0 (-)
0 0 0 0 0
0 (-) 0 (-) 0 (-) 0 (-) 0 (-)
0 (-)
Hawaii-based shallow-set longline fishery
2004 2005 2006 2007 2008
observer data
100% 100% 100% 100% 100%
0 0 0 0
1*
Same as observed 0.2
0 0 0 0 0
Same as observed 0
Minimum total annual takes within U.S. EEZ waters 0 (-) *One animal, which was either a pygmy sperm whale or dwarf sperm whales, observed not seriously injured. REFERENCES Anderson, M.S., K.A. Forney, T.V.N. Cole, T. Eagle, R.P. Angliss, K. Long, L. Barre, L. VanAtta, D. Borggaard, T.
Rowles, B. Norberg, J. Whaley, L. Engleby. Differentiating serious and non-serious injury of marine mammals: Report of the Serious Injury Technical Workshop 10-13 September 2007, Seattle, WA. NOAA Tech Memo NMFS-OPR-39, 94 p.
Angliss, R.P. and D.P. DeMaster. 1997. Differentiating serious and non-serious injury of marine mammals taken incidental to commercial fishing operations: Report of the Serious Injury Workshop 1-2 April. 1997, Silver Spring, MD. NOAA Tech Memo NMFS-OPR-13, 48 p.
Baird, R.W. 2005. Sightings of dwarf (Kogia sima) and pygmy (K. breviceps) sperm whales from the main Hawaiian Islands. Pacific Science 59: 461-466.
Baird, R.W., D.L. Webster, J.M. Aschettino, G.S. Schorr and D.J. McSweeney. 2013. Odontocete cetaceans around the main Hawaiian Islands: habitat use and relative abundance from small-boat sighting surveys. Aquatic Mammals, in press.
Barlow, J. 2006. Cetacean abundance in Hawaiian waters estimated from a summer/fall survey in 2002. Marine Mammal Science 22: 446–464.
Bradford, A.L. and K.A. Forney. 2013. Injury determinations for cetaceans observed interacting with Hawaii and American Samoa longline fisheries during 2007-2011. PIFSC Working Paper WP-13-002.
Bradford. A.L., K.A. Forney, E.M. Oleson, and J. Barlow. 2013. Line-transect abundance estimates of cetaceans in the Hawaiian EEZ. PIFSC Working Paper WP-13-004.
Forney, K.A. 2009. Serious injury determinations for cetaceans caught in Hawaii longline fisheries during 1994-2008. Draft document PSRG-2009-09 presented to the Pacific Scientific Review Group, November 3-5, 2009, Del Mar, CA..
Jacob, J. M. 2012. Screening and characterization of morbillivirus in Hawaiian cetaceans. M.S. Marine Science Thesis. Hawaii Pacific University, Kaneohe, HI,
Maldini, D., L. Mazzuca, and S. Atkinson. 2005. Odontocete stranding patterns in the Main Hawaiian Islands (1937-2002): How do they compare with live animal surveys? Pacific Science 59(1):55-67.
McCracken M., and K.A. Forney. 2010. Preliminary assessment of incidental interactions with marine mammals in the Hawaii longline deep and shallow set fisheries. NMFS, Pacific Islands Fisheries Science Center Working Paper WP-10-001. 27p.
McCracken, M. 2013. Preliminary assessment of incidental interactions with marine mammals in the Hawaii longline deep and shallow set fisheries from 2007 to 2011. PIFSC Working Paper WP-13-XXX.
Mobley, J. R. , Jr, S. S. Spitz, K. A. Forney, R. A. Grotefendt, and P. H. Forestall. 2000. Distribution and abundance of odontocete species in Hawaiian waters: preliminary results of 1993-98 aerial surveys Admin. Rep. LJ-00-14C. Southwest Fisheries Science Center, National Marine Fisheries Service, P.O. Box 271, La Jolla, CA 92038. 26 pp.
Nagorsen, D. 1985. Kogia simus. Mamm. Spec. 239:1-6. Nitta, E. 1991. The marine mammal stranding network for Hawaii: an overview. In: J.E. Reynolds III, D.K. Odell
(eds.), Marine Mammal Strandings in the United States, pp.56-62. NOAA Tech. Rep. NMFS 98, 157 pp. Nitta, E. and J. R. Henderson. 1993. A review of interactions between Hawaii's fisheries and protected species.
Mar. Fish. Rev. 55(2):83-92.NMFS. 2005. Revisions to Guidelines for Assessing Marine Mammal Stocks. 24 pp. Available at: http://www.nmfs.noaa.gov/pr/pdfs/sars/gamms2005.pdf
239

NMFS. 2012. NOAA Fisheries Policy Directive 02-038-01 Process for Injury Determinations (01/27/12). Available at: http://www.nmfs.noaa.gov/pr/pdfs/serious_injury_policy.pdf
Perrin, W.F., G. P. Donovan and J. Barlow. 1994. Gillnets and Cetaceans. Rep. Int. Whal. Commn., Special Issue 15, 629 pp.
Rice, D.W. 1998. Marine Mammals of the World Systematics and Distribution. Special Publication Number 4 The Society of Marine Mammalogy. Douglas Wartzok (ed.). 231 pp.
Richardson, W. J., C. R. Greene, Jr., C. I. Malme, and D. H. Thompson. 1995. Marine Mammals and Noise. Academic Press, San Diego. 576 p.
Tomich, P. Q. 1986. Mammals in Hawaii: A Synopsis and Notational Bibliography. Bishop Museum Press, Hawaii, 375 pp.
Van Bressem, M., J.A. Raga, G. Di Guardo, D.P. Jepson, P. J. Duignan, U. Siebert, T. Barrett, M. C. de Oliveira Santos, I.B. Moreno, S. Siciliano, A. Aguilar, K. Van Waerebeer. 2009. Emerging infectious diseases in cetaceans worldwide and the possible role of environmental stressors. Diseases of Aquatic Organisms. 85:143-157.
Wade, P. R. and R. P. Angliss. 1997. Guidelines for Assessing Marine Mammal Stocks: Report of the GAMMS Workshop April 3-5, 1996, Seattle, Washington. U. S. Dep. Commer., NOAA Tech. Memo. NMFS-OPR-12. 93 pp.
Wade, P. R. and T. Gerrodette. 1993. Estimates of cetacean abundance and distribution in the eastern tropical Pacific. Rep. Int. Whal. Commn. 43:477-493.
240

Revised 01/15/2011 9/23/2013
SPERM WHALE (Physeter macrocephalus): Hawaiian Stock
STOCK DEFINITION AND GEOGRAPHIC RANGE Sperm whales are widely distributed across the entire North Pacific and into the southern Bering Sea in summer but the majority are thought to be south of 40oN in winter (Rice 1974, 1989; Gosho et al. 1984; Miyashita et al. 1995). For management, the International Whaling Commission (IWC) had divided the North Pacific into two management regions (Donovan 1991) defined by a zig-zag line which starts at 150oW at the equator to, is 160oW between 40-50oN, and endings up at 180oW north of 50oN; however, the IWC has not reviewed this stock boundary in many years (Donovan 1991). Summer/fall surveys in the eastern tropical Pacific (Wade and Gerrodette 1993) show that although sperm whales are widely distributed in the tropics, their relative abundance tapers off markedly westward towards the middle of the tropical Pacific (near the IWC stock boundary at 150oW) and tapers off northward towards the tip of Baja California. The Hawaiian Islands marked the center of a major nineteenth century whaling ground for sperm whales (Gilmore 1959; Townsend 1935). Since 1936, at least 1828 strandings have been reported from the Hawaiian IslandsOahu, Kauai and Kure Atoll (Woodward 1972; Nitta 1991; Maldini et al. 2005, NMFS PIR Marine Mammal Response Network databse), including 7 since 2007. Sperm whales have also been sighted throughout the Hawaiian EEZ, including nearshore waters of the main and around several of the Northwestern Hawaiian Islands (Rice 1960; Barlow 2006), off the main island of Hawaii (Lee 1993; Mobley et al. 2000) in the Kauai Channel and in the Alenuihaha Channel between Maui and the island of Hawaii (Shallenberger 1981). In addition, the sounds of sperm whales have been recorded throughout the year off Oahu (Thompson and Friedl 1982). A sSummer/fall 2002 shipboard surveys of waters within the U.S. Exclusive Economic Zone (EEZ) of the Hawaiian Islands resulted in 43 sperm whale sightings in 2002 and 46 in 2010 throughout the study area (Figure 1; Barlow 2006, Bradford et al 2013). The stock identity of sperm whales in the North Pacific has been inferred from historical catch records (Bannister and Mitchell 1980) and from trends in CPUE and tag-recapture data (Ohsumi and Masaki 1977), but much uncertainty remains. A 1997 survey designed specifically to investigate stock structure and abundance of sperm whales in the northeastern temperate Pacific revealed no apparent hiatus in distribution between the U.S. EEZ off California and areas farther west, out to Hawaii (Barlow and Taylor 2005). Recent Very preliminary genetic analyses revealed significant differences in mitochondrial and nuclear DNA and in single-nucleotide polymorphisms between sperm whales sampled off the coast of California, Oregon and Washington and those sampled nearoffshore to Hawaii and in the eastern tropical Pacific (ETP) (Mesnick et al 2011., unpubl. data).; analyses of additional genetic samples are ongoing at the NMFS, Southwest Fisheries Science Center. These results suggest demographic independence between matrilineal groups found California, Oregon, and Washington, and those found elsewhere in the central and eastern tropical Pacific. Further, assignment tests identified male sperm whales sampled in the sub-Arctic with each of the three regions, suggesting mixing of males from potentially several populations during the summer (Mesnick et al 2011).
For the Marine Mammal Protection Act (MMPA) stock assessment reports, sperm whales within the Pacific U.S. EEZ are divided into three discrete, non-contiguous areasstocks: 1) waters around Hawaii (this report), 2) California, Oregon and Washington waters, and 3) Alaskan waters. This The Hawaii stock includes animals found both within the Hawaiian Islands EEZ and in adjacent international high seas waters; however, because data
Figure 1. Sperm whale sighting locations during the 2002 (open diamonds) and 2010 (black diamonds) shipboard surveys of U.S. EEZ waters surrounding the Hawaiian Islands (Barlow 2006, Bradford et al 2013; see Appendix 2 for details on timing and location of survey effort). Outer line represents approximate boundary of survey area and U.S. EEZ. Gray shading indicates area of Papahanaumokuakea Marine National Monument.
241

on abundance, distribution, and human-caused impacts are largely lacking for international high seas waters, the status of the Hawaii this stock is evaluated based on data from U.S. EEZ waters of the Hawaiian Islands (NMFS 2005). POPULATION SIZE A large 1982 abundance estimate for the entire eastern North Pacific (Gosho et al. 1984) was based on a CPUE method which is no longer accepted as valid by the International Whaling Commission. A spring 1997 combined visual and acoustic line-transect survey conducted in the eastern temperate North Pacific resulted in estimates of 26,300 (CV=0.81) sperm whales based on visual sightings, and 32,100 (CV=0.36) based on acoustic detections and visual group size estimates (Barlow and Taylor 2005). Sperm whales appear to be a good candidate for acoustic surveys due to the increased range of detection; however, visual estimates of group size are still required (Barlow and Taylor 2005). In the eastern tropical Pacific, the abundance of sperm whales has been estimated as 22,700 (95% C.I.=14,800-34,600; Wade and Gerrodette 1993). However, it is not known whether any or all of these animals routinely enter the U.S. EEZ of the Hawaiian Islands. A 2002 shipboard line-transect survey of the entire Hawaiian Islands EEZ resulted in an abundance estimate of 6,919 (CV=0.81) sperm whales (Barlow 2006). The recent 2010 shipboard line-transect survey of the Hawaiian Islands EEZ resulted in an abundance estimate of 3,354 (CV = 0.34) sperm whales (Bradford et al 2013), including a correction factor for missed diving animals. This is currently the best available abundance estimate for this stock. Minimum Population Estimate The minimum population size is calculated as the lower 20th percentile of the log-normal distribution (Barlow et al 1995) around The log-normal 20th percentile of the 2002 2010 abundance estimate (Barlow 2006) is 3,805or 2,539 sperm whales within the Hawaiian Islands EEZ. Current Population Trend
The broad and overlapping confidence intervals around the 2002 and 2010 estimates preclude assessment of trend with the available data. No data on current population trend are available. CURRENT AND MAXIMUM NET PRODUCTIVITY RATES No data on current or maximum net productivity rate are available. POTENTIAL BIOLOGICAL REMOVAL The potential biological removal (PBR) level for the Hawaii stock of sperm whales is stock is calculated as the minimum population size (2,539)(3,805) within the U.S. EEZ of the Hawaiian Islands times one half the default maximum net growth rate for cetaceans (½ of 4%) times a recovery factor of 0.2 (for an endangered species with Nmin > 1,500 and CVNmin > 0.50, with low vulnerability to extinction; (Taylor et al. 2003), resulting in a PBR of 10.215 sperm whales per year. HUMAN-CAUSED MORTALITY AND SERIOUS INJURY New Serious Injury Guidelines NMFS updated its serious injury designation and reporting process, which uses guidance from previous serious injury workshops, expert opinion, and analysis of historic injury cases to develop new criteria for distinguishing serious from non-serious injury (Angliss and DeMaster 1998, Andersen et al. 2008, NMFS 2012). NMFS defines serious injury as an “injury that is more likely than not to result in mortality”. Injury determinations for stock assessments revised in 2013 or later incorporate the new serious injury guidelines, based on the most recent 5-year period for which data are available. Fishery Information Information on fishery-related mortality of cetaceans in Hawaiian waters is limited, but the gear types used in Hawaiian fisheries are responsible for marine mammal mortality and serious injury in other fisheries throughout U.S. waters. Gillnets appear to capture marine mammals wherever they are used, and float lines from lobster traps and longlines can be expected to occasionally entangle cetaceans (Perrin et al. 1994). One stranded sperm whale was found with fishing line and netting its stomach, though its unclear whether the gear caused its death, nor what fisheries the gear came from (NMFS PIR MMRN). No estimates of human-caused mortality or serious injury are currently available for nearshore hook and line or gillnet fisheries because these fisheries are not observed or monitored for protected species bycatch.
242

Interactions with cetaceans are reported for all pelagic fisheries, and large whales have been entangled in longlines off the Hawaiian Islands (Nitta and Henderson 1993; Forney 2009). There are currently two distinct longline fisheries based in Hawaii: a deep-set longline (DSLL) fishery that targets primarily tunas, and a shallow-set longline fishery (SSLL) that targets swordfish. Both fisheries operate within U.S. waters and on the high seas Between 2007 and 20112004 and 2008, no sperm whales were observed hooked or entangled in the SSLL fishery (100% observer coverage) and one was observed either hooked or entangled in or the DSLL fishery (20-2228% observer coverage) (Bradford & Forney 2013McCracken & Forney 2010). The single sperm whale observed interacting with the DSLL fishery was prorated as 75% probability of serious injury (Bradford & Forney 2013), based on an evaluation of the observer’s description of the interaction and following the most recently developed criteria for assessing serious injury in marine mammals (NMFS 2012). The prorating of serious injury is based on the proportion of known outcomes for whales with similar fisheries interactions in other regions. Average 5-yr estimates of annual mortality and serious injury for sperm whales during 2007-20112004-2008 are zero sperm whales outside of U.S. EEZs, and 0.7 (CV = 0.6) within the Hawaiian Islands EEZ (Table 1, McCracken 2013). Historical Mortality Between 1800 and 1909, about 60,842 sperm whales were estimated taken in the North Pacific (Best 1976). The reported take of North Pacific sperm whales by commercial whalers between 1947 and 1987 totaled 258,000 (C. Allison, pers. comm.). Factory ships operated as far south as 20oN (Ohsumi 1980). Ohsumi (1980) lists an additional 28,198 sperm whales taken mainly in coastal whaling operations from 1910 to 1946. Based on the massive under-reporting of Soviet catches, Brownell et al. (1998) estimated that about 89,000 whales were additionally taken by the Soviet pelagic whaling fleet between 1949 and 1979. The Japanese coastal operations apparently also under-reported catches by an unknown amount (Kasuya 1998). Thus a total of at least 436,000 sperm whales were taken between 1800 and the end of commercial whaling for this species in 1987. Of this grand total, an estimated 33,842 were taken by Soviet and Japanese pelagic whaling operations in the eastern North Pacific from the longitude of Hawaii to the U.S. West coast, between 1961 and 1976 (Allen 1980, IWC statistical Areas II and III), and 965 were reported taken in land-based U.S. West coast whaling operations between 1947 and 1971 (Ohsumi 1980). In addition, 13 sperm whales were taken by shore whaling stations in California between 1919 and 1926 (Clapham et al. 1997). There has been a prohibition on taking sperm whales in the North Pacific since 1988, but large-scale pelagic whaling stopped earlier, in 1980. Some of the whales taken during the whaling era were certainly from a population or populations that occur within Hawaiian waters.
Figure 3. Locations of observed sperm whale take (filled diamonds) in the Hawaii-based longline fishery, 2007-2011. Solid lines represent the U. S. EEZ. Fishery descriptions are provided in Appendix 1.
243

Table 1. Summary of available information on incidental mortality and serious injury of sperm whales in commercial fisheries, within and outside of the U.S. EEZs (McCracken 2013). Mean annual takes are based on 2007-2011 data. Information on all observed takes (T) and combined mortality events & serious injuries (MSI) is included. Total takes were prorated to deaths, serious injuries, and non-serious injuries based on the observed proportions of each outcome.
*This injury was prorated 75% probability of being a serious injury based on known outcomes from other whales with this injury type (NOAA 2012). STATUS OF STOCK The only estimate of the status of North Pacific sperm whales in relation to carrying capacity (Gosho et al. 1984) is based on a CPUE method which is no longer accepted as valid. The status of sperm whales in Hawaiian waters relative to OSP is unknown, and there are insufficient data to evaluate trends in abundance. Sperm whales are formally listed as "endangered" under the Endangered Species Act (ESA), and consequently the Hawaiian stock is automatically considered as a "depleted" and "strategic" stock under the MMPA. The estimated rate of fisheries related mortality or serious injury within the Hawaiian Islands EEZ (0.7 animals per year) is less than the PBR (10.2).Given the absence of recent fishery-related mortality or serious injuries within the Hawaiian Islands EEZ, the Hawaiian stock of sperm whales is not considered strategic under the 1994 amendments to the MMPA, and the total fishery mortality and serious injury can be considered to be insignificant and approaching zero. Insufficient information is available to determine whether the total fishery mortality and serious injury for sperm whales is insignificant and approaching zero mortality and serious injury rate. The increasing level of anthropogenic noise in the world’s oceans has been suggested to be a habitat concern for whales (Richardson et al. 1995), particularly for deep-diving whales like sperm whales that feed in the oceans’ “sound channel”. One sperm whale stranded in the main Hawaiian Islands tested positive for both Brucella and Morbillivirus (Jacob 2012, West, unpublished data). Brucella is a bacterial infection that if common in the population may limit recruitment by compromising male and female reproductive systems, and can also cause neurological disorders that may result in death (Van Bressem et al. 2009). Morbillivus is known to trigger lethal disease in cetaceans (Van Bressem et al. 2009); however, investigation of the pathology of the stranded sperm whale suggests that Brucella was more likely the cause of death in this sperm whale (West, unpublished data). The presence of Morbillivirus in 10 species (Jacob 2012) and Brucella in 3 species (Cherbov 2010, West unpublished data) raises concerns about the history and prevalence of these diseases in Hawaii and the potential population impacts on Hawaiian cetaceans. It is not known if Brucella or Morbillivirus are common in the Hawaii stock. REFERENCES Andersen, M. S., K. A. Forney, T. V. N. Cole, T. Eagle, R. Angliss, K. Long, L. Barre, L. Van Atta, D. Borggaard,
T. Rowles, B. Norberg, J. Whaley, and L. Engleby. 2008. Differentiating Serious and Non-Serious Injury
Fishery Name Year Data Type
Percent Observer Coverage
Observed total interactions (T) and mortality events, and serious injuries (MSI), and total estimated mortality and serious injury (M&SI) of sperm
whales Outside U.S. EEZs Hawaiian EEZ
Obs. T/MSI Estimated
M&SI (CV) Obs. T/MSI Estimated
M&SI (CV)
Hawaii-based deep-set longline
fishery
2007
Observer data
20% 0 0 (-) 0 0 (-) 2008 22% 0 0 (-) 0 0 (-) 2009 21% 0 0 (-) 0 0 (-) 2010 21% 0 0 (-) 0 0 (-) 2011 20% 0 0 (-) 1/1* 3 (0.2)
Mean Estimated Annual Take (CV) 0 (-) 0.7 (0.5)
Hawaii-based shallow-set
longline fishery
2007
Observer data
100% 0 0 0 0 2008 100% 0 0 0 0 2009 100% 0 0 0 0 2010 100% 0 0 0 0 2011 100% 0 0 0 0
Mean Annual Takes (100% coverage) 0 Minimum total annual takes within U.S. EEZ 0.7 (0.5)
244

of Marine Mammals: Report of the Serious Injury Technical Workshop, 10-13 September 2007, Seattle, Washington. U.S. Dep. Commer., NOAA Tech. Memo. NMFS-OPR-39. 94 p.
Angliss, R.P. and D.P. DeMaster. 1998. Differentiating Serious and Non-Serious Injury of Marine Mammals Taken Incidental to Commercial Fishing Operations. NOAA Tech Memo. NMFS-OPR-13, 48 p.
Allen, K. R. 1980. Size distribution of male sperm whales in the pelagic catches. Rep. Int. Whal. Commn. Special Issue 2:51-56.
Allison, C. International Whaling Commission. The Red House, 135 Station Road, Impington, Cambridge, UK CB4 9NP.
Barlow, J. 2006. Cetacean abundance in Hawaiian waters estimated from a summer/fall survey in 2002. Marine Mammal Science 22: 446–464.
Barlow, J and B. Taylor. 2005. Estimates of sperm whale abundance in the northeast temperate Pacific from a combined visual and acoustic survey. Mar. Mamm. Sci. 21(3):429-445.
Barlow, J., S.L. Swartz, T.C. Eagle, and P.R. Wade. 1995. U.S. Marine Mammal Stock Assessments: Guidelines for Preparation, Background, and a Summary of the 1995 Assessments. U.S. Dep. Commer., NOAA Tech. Memo. NMFS-OPR-6, 73 p.
Bannister, J. and E. Mitchell. 1980. North Pacific sperm whale stock identity: distributional evidence from Maury and Townsend charts. Rep. Int. Whal. Commn. (Spec. Iss. 2):219-230.
Best, P. B. 1976. A review of world sperm whale stocks. Paper ACMRR/MM/SC/8 Rev.1, FAO Scientific Consultation of Marine Mammals, Bergen, Norway.
Bradford, A.L. and K.A. Forney. 2013. Injury determinations for cetaceans observed interacting with Hawaii and American Samoa longline fisheries during 2007-2011. PIFSC Working Paper WP-13-002.
Bradford. A.L., K.A. Forney, E.M. Oleson, and J. Barlow. 2013. Line-transect abundance estimates of cetaceans in the Hawaiian EEZ. PIFSC Working Paper WP-13-004.
Brownell, R. L., Jr., A. V. Yablokov and V. A. Zemmsky. 1998. USSR pelagic catches of North Pacific sperm whales, 1949-1979: Conservation implications. Paper SC/50/CAWS27 presented to the International Whaling Commission, June 1998 (unpublished).
Clapham, P. J., S. Leatherwood, I. Szczepaniak, and R. L. Brownell, Jr. 1997. Catches of humpback and other whales from shore stations at Moss Landing and Trinidad, California, 1919-1926. Marine Mammal Science 13(3):368-394.
Donovan, G. P. 1991. A review of IWC stock boundaries. Rept. Int. Whal. Commn., Special Issue 13:39-68. Forney, K.A. 2009. Serious injury determinations for cetaceans caught in Hawaii longline fisheries during 1994-
2008. Draft document PSRG-2009-09 presented to the Pacific Scientific Review Group, November 3-5, 2009, Del Mar, CA.
Gilmore, R. M. 1959. On the mass strandings of sperm whales. Pac. Nat. 1(9-10):3-15. Gosho, M. E., D. W. Rice, and J. M. Breiwick. 1984. The sperm whale Physeter macrocephalus. Mar. Fish. Rev.
46(4):54-64. Jacob, J. M. 2012. Screening and characterization of morbillivirus in Hawaiian cetaceans. M.S. Marine Science
Thesis. Hawaii Pacific University, Kaneohe, HI, Kasuya, T. 1998. Evidence of statistical manipulations in Japanese coastal sperm whale fishery. Paper
SC/50/CAWS10 presented to the International Whaling Commission, June 1998 (unpublished). Lee, T. 1993. Summary of cetacean survey data collected between the years of 1974 and 1985. NOAA Tech.Mem.
NMFS 181, 184pp. Maldini, D., L. Mazzuca, and S. Atkinson. 2005. Odontocete stranding patterns in the Main Hawaiian Islands
(1937-2002): How do they compare with live animal surveys? Pacific Science 59(1):55-67. McCracken M., and K.A. Forney. 2010. Preliminary assessment of incidental interactions with marine mammals in
the Hawaii longline deep and shallow set fisheries. NMFS, Pacific Islands Fisheries Science Center Working Paper WP-10-001. 27p.
McCracken, M. 2013. Preliminary assessment of incidental interactions with marine mammals in the Hawaii longline deep and shallow set fisheries from 2007 to 2011. PIFSC Working Paper WP-13-XXX.
Mesnick, S. Southwest Fisheries Science Center, NMFS, 8604 La Jolla Shores Drive, La Jolla, California, 92037. Mesnick, S.L., B.L. Taylor, F.I. Archer, et al. 2011. Sperm whale population structure in the eastern and central
North Pacific inferred by the use of single-nucleotide polymorphisms, microsatellites, and mitochondrial DNA. Molecular Ecology 11:278-298.
Miyashita, T., H. Kato, and T. Kasuya (Eds.). 1995. Worldwide map of cetacean distribution based on Japanese sighting data. Volume 1. National Research Institute of Far Seas Fisheries, Shizuoka, Japan. 140pp.
Mobley, J. R. , Jr, S. S. Spitz, K. A. Forney, R. A. Grotefendt, and P. H. Forestall. 2000. Distribution and
245

abundance of odontocete species in Hawaiian waters: preliminary results of 1993-98 aerial surveys Admin. Rep. LJ-00-14C. Southwest Fisheries Science Center, National Marine Fisheries Service, P.O. Box 271, La Jolla, CA 92038. 26 pp.
Nitta, E. 1991. The marine mammal stranding network for Hawaii: an overview. In: J.E. Reynolds III, D.K. Odell (eds.), Marine Mammal Strandings in the United States, pp.56-62. NOAA Tech. Rep. NMFS 98, 157 pp.
Nitta, E. and J. R. Henderson. 1993. A review of interactions between Hawaii's fisheries and protected species. Mar. Fish. Rev. 55(2):83-92.
NMFS. 2005. Revisions to Guidelines for Assessing Marine Mammal Stocks. 24 pp. Available at: http://www.nmfs.noaa.gov/pr/pdfs/sars/gamms2005.pdf
NMFS. 2012. NOAA Fisheries Policy Directive 02-038-01 Process for Injury Determinations (01/27/12). Available at: http://www.nmfs.noaa.gov/pr/pdfs/serious_injury_policy.pdf
Ohsumi, S. 1980. Catches of sperm whales by modern whaling in the North Pacific. Rep. Int. Whal. Commn. (Spec. Iss. 2):11-18.
Ohsumi, S. and Y. Masaki. 1977. Stocks and trends of abundance of the sperm whale in the North Pacific. Rep. Int. Whal. Commn. 27:167-175.
Perrin, W.F., G. P. Donovan and J. Barlow. 1994. Gillnets and Cetaceans. Rep. Int. Whal. Commn., Special Issue 15, 629 pp.
Rice, D. W. 1960. Distribution of the bottle-nosed dolphin in the leeward Hawaiian Islands. J. Mamm. 41:407-408.
Rice, D. W. 1974. Whales and whale research in the eastern North Pacific. pp. 170-195 In: W. E. Schevill (ed.). The Whale Problem: A Status Report. Harvard Press, Cambridge, MA.
Rice, D. W. 1989. Sperm whale Physeter macrocephalus Linneaus, 1758. In: S. H. Ridgway and R. Harrison (eds.), Handbook of Marine Mammals, Vol. 4: The River Dolphins and Larger Toothed Whales, pp. 177-233. Academic Press, 442 pp.
Richardson, W. J., C. R. Greene, Jr., C. I. Malme, and D. H. Thompson. 1995. Marine Mammals and Noise. Academic Press, San Diego. 576 p.
Shallenberger, E.W. 1981. The status of Hawaiian cetaceans. Final report to U.S. Marine Mammal Commission. MMC-77/23, 79pp.
Taylor, B.L., M. Scott, J. Heyning, and J. Barlow. 2003. Suggested guidelines for recovery factors for endangered marine mammals. U.S. Dep. Commerce, NOAA Tech. Memo., NMFS-TM-NMFS-SWFSC-354. 6 p.
Thompson, P. O. and W. A. Friedl. 1982. A long term study of low frequency sound from several species of whales off Oahu, Hawaii. Cetology 45:1-19.
Townsend, C. H. 1935. The distribution of certain whales as shown by logbook records of American whaleships. Zoologica 19:1-50.
Van Bressem, M., J.A. Raga, G. Di Guardo, D.P. Jepson, P. J. Duignan, U. Siebert, T. Barrett, M. C. de Oliveira Santos, I.B. Moreno, S. Siciliano, A. Aguilar, K. Van Waerebeer. 2009. Emerging infectious diseases in cetaceans worldwide and the possible role of environmental stressors. Diseases of Aquatic Organisms. 85:143-157.
Wade, P. R. and R. P. Angliss. 1997. Guidelines for Assessing Marine Mammal Stocks: Report of the GAMMS Workshop April 3-5, 1996, Seattle, Washington. U. S. Dep. Commer., NOAA Tech. Memo. NMFS-OPR-12. 93 pp.
Wade, P. R. and T. Gerrodette. 1993. Estimates of cetacean abundance and distribution in the eastern tropical Pacific. Rep. Int. Whal. Commn. 43:477-493.
Woodward, P. W. 1972. The natural history of Kure Atoll, northwestern Hawaiian Islands. Atoll Res. Bull. 164:302.
246

Revised 01/15/2011 9/23/2013
BLUE WHALE (Balaenoptera musculus musculus): Central North Pacific Stock
STOCK DEFINITION AND GEOGRAPHIC RANGE The International Whaling Commission (IWC) has formally considered only one management stock for blue whales in the North Pacific (Donovan 1991), but up to five populations have been proposed (Reeves et al. 1998). Rice (1974) hypothesized that blue whales from Baja California migrated far offshore to feed in the eastern Aleutians or Gulf of Alaska and returned to feed in California waters; though more however, he has more recently concluded that the California population is separate from the Gulf of Alaska population (Rice 1992). Length frequency analyses (Gilpatrick et al. 1996) and photo-identification studies (Calambokidis et al. 1995) through the 1990s supported separate populations status for blue whales feeding off California and those feeding in Alaskan waters. Whaling catch data indicated that whales feeding along the Aleutian Islands are were probably part of a central Pacific stock (Reeves et al. 1998), which was thought mayto migrate to offshore waters north of Hawaii in winter (Berzin and Rovnin 1966). Blue whale feeding aggregations have not been found in Alaska despite several surveys (Leatherwood et al. 1982; Stewart et al. 1987; Forney and Brownell 1996).; however, blue whale calls have been recorded there between 1995 and 2001 (Stafford et al. 2001, Stafford 2003). More Rrecently, analyses of acoustic data obtained throughout the North Pacific Ocean (Stafford et al. 2001; Stafford 2003) haves revealed two distinct blue whale call types, suggesting two North Pacific stocks: eastern and central (formerly western). The regional occurrence patterns suggestindicate that blue whales from the eastern North Pacific stock winter off Mexico, centralCentral America, and as far south as 8º S (Stafford et al. 1999), and feed during summer off the U. S. West Coast and to a lesser extent in the Gulf of Alaska. This stock has previously been observeddocumented to feed in waters off California (and occasionally as far north as British Columbia; Calambokidis et al. 1998) in summer/fall (from June to November) migrating south to productive areas off Mexico (Calambokidis et al. 1990) and as far south as the Costa Rica Dome (10 N) in winter/spring (Mate et al. 1999, Stafford et al. 1999). Blue whales belonging to the central Pacific stock appear to feed in summer southwest of Kamchatka, south of the Aleutians, and in the Gulf of Alaska (Stafford 2003; Watkins et al. 2000), and in winter they migrate to lower latitudes in the western and central Pacific and less frequently in the central Pacific, including Hawaii (Stafford et al. 2001).
The firstonly published sighting record of blue whales near Hawaii is that of Berzin and Rovnin (1966), though recently, two blue whales were seen with fin whales and an unidentified rorqual in November 2010 during a survey of Hawaiian U.S. EEZ waters (Bradford et al. 2013). FourTwo sightings have been made by observers on Hawaii-based longline vessels (Figure 1; NMFS/PIR, unpublished data). Additional evidence that blue whales occur in this area comes from acoustic recordings made off Oahu and Midway Islands (Northrop et al. 1971; Thompson and Friedl 1982), which likely included at least some whales within the U.S. Exclusive Economic Zone (EEZ). The recordings made off Hawaii showed bimodal peaks throughout the year (Stafford et al. 2001), with central Pacific call types heard during winter and eastern Pacific calls heard during summer. For the Marine Mammal Protection
Figure 1. Locations of four blue whale sightings made by observers aboard Hawaii-based longline fishing vessels between July 1994 and December 2009 (crosses, NMFS/PIR unpublished data), and location of a single blue whale sighting during a 2010 (black diamond) shipboard cetacean survey of U.S. EEZ waters surrounding the Hawaiian Islands (Bradford et al. 2013; see Appendix 2 for details on timing and location of survey effort). Outer line indicates approximate boundary of survey area and U.S. EEZ. Gray shading indicates area of Papahanaumokuakea Marine National Monument. Dotted line represents the 1000m isobath. Solid lines represent the U.S. Exclusive Economic Zone (EEZ).
247

Act (MMPA) stock assessment reports, there are two blue whale stocks within the Pacific U.S. EEZ: 1) the central North Pacific stock (this report), which includes whales found around the Hawaiian Islands during winter and 2) the eastern North Pacific stock, which feeds primarily off California. POPULATION SIZE From ship line-transect surveys, Wade and Gerrodette (1993) estimated 1,400 blue whales for the eastern tropical Pacific. No blue whale sightings were made during a summer 1994 shipboard survey south of the Aleutian Islands (Forney and Brownell 1996), during twelve aerial surveys conducted in 1993-98 within about 25 nmi of the main Hawaiian Islands (Mobley et al. 2000), or during a summer/fall 2002 shipboard surveys of the entire Hawaiian Islands EEZ (Barlow 2006). A 2010 shipboard line-transect survey of the entire Hawaiian Islands EEZ resulted in a summer/fall abundance estimate of 81 (CV = 1.14) blue whales (Bradford et al. 2013). This is currently the best available abundance estimate for this stock within the Hawaii EEZ, but the majority of blue whales would be expected to be at higher latitudes feeding grounds at this time of year.Therefore, no estimate of abundance is available for the central Pacific blue whale stock. Minimum Population Estimate The minimum population size is calculated as the lower 20th percentile of the log-normal distribution (Barlow et al. 1995) of the 2010 abundance estimate, or 38 blue whales within the Hawaiian Islands EEZ. No data are available to provide a minimum population estimate. Current Population Trend The first sightings of blue whales during systematic surveys occurred in 2010, and there is currently insufficient No data to assessare available on current population trends. CURRENT AND MAXIMUM NET PRODUCTIVITY RATES No data are available on current or maximum net productivity rate. POTENTIAL BIOLOGICAL REMOVAL The potential biological removal (PBR) level for the Central North Pacific stock of blue whales is calculated as the minimum population size within the U.S. EEZ of the Hawaiian Islands (38) times one half the default maximum net growth rate for cetaceans (½ of 4%) times a recovery factor of 0.1 (the default value for an endangered species with Nmin <1500; Taylor et al. 2003), resulting in a PBR of 0.1 Central Pacific blue whales per year. No PBR can be calculated for this stock at this time. HUMAN-CAUSED MORTALITY AND SERIOUS INJURY New Serious Injury Guidelines NMFS updated its serious injury designation and reporting process, which uses guidance from previous serious injury workshops, expert opinion, and analysis of historic injury cases to develop new criteria for distinguishing serious from non-serious injury (Angliss and DeMaster 1998, Andersen et al. 2008, NOAA 2012). NMFS defines serious injury as an “injury that is more likely than not to result in mortality”. Injury determinations for stock assessments revised in 2013 or later incorporate the new serious injury guidelines, based on the most recent 5-year period for which data are available. Fishery Information
Information on fishery-related mortality of cetaceans in Hawaiian waters is limited, but the gear types used in Hawaiian fisheries are responsible for marine mammal mortality and serious injury in other fisheries throughout U.S. waters. Gillnets appear to capture marine mammals wherever they are used, and float lines from lobster traps and longlines can be expected to occasionally entangle cetaceans (Perrin et al. 1994). Interactions with cetaceans are reported for all pelagic fisheries, and large whales have been entangled in longline gear off the Hawaiian Islands (Nitta and Henderson 1993, Forney 2009). There are currently two distinct longline fisheries based in Hawaii: a deep-set longline (DSLL) fishery that targets primarily tunas, and a shallow-set longline fishery (SSLL) that targets swordfish. Both fisheries operate within U.S. waters and on the high seas. Between 2007 and 20112004 and 2008, no blue whales were observed hooked or entangled in the SSLL fishery (100% observer coverage) or the DSLL fishery (20-2228% observer coverage) (McCracken 2013, Bradford & Forney 2013& Forney 2010). Large whales have been observed entangled in longline gear in the Hawaii EEZ in the past (Forney 2010).
248

Historical Mortality At least 9,500 blue whales were taken by commercial whalers throughout the North Pacific between 1910 and 1965 (Ohsumi and Wada 1972). Some proportion of this total may have been from a population or populations that migrate seasonally into the Hawaiian EEZ. The species has been protected in the North Pacific by the IWC since 1966. STATUS OF STOCK The status of blue whales in Hawaiian waters relative to OSP is unknown, and there are insufficient data to evaluate trends in abundance. Blue whales are formally listed as "endangered" under the Endangered Species Act (ESA), and consequently the central Pacific stock is automatically considered as a "depleted" and "strategic" stock under the MMPA. Because there have been no reported fishery related mortality or serious injuries of blue whales within the Hawaiian Islands EEZ, the total fishery-related mortality and serious injury of this stock can be considered to be insignificant and approaching zero. Increasing levels of anthropogenic noise in the world’s oceans has been suggested to be a habitat concern for blue whales (Reeves et al. 1998). Tagged blue whales exposed to simulated mid-frequency military sonar sounds showed significant behavioral responses, including cessation of feeding, increased swimming speeds, and movement away from the simulated sound sources, even though the simulated source levels were orders of magnitude lower than some operational military sonar systems (Goldbogen et al. 2013). The authors of this study highlight that sonar sources can disrupt feeding and displace whales from high-quality feeding areas, with negative implications for individual fitness and population health. REFERENCES Angliss, R.P. and D.P. DeMaster. 1997. Differentiating serious and non-serious injury of marine mammals taken
incidental to commercial fishing operations: Report of the Serious Injury Workshop 1-2 April. 1997, Silver Spring, MD. NOAA Tech Memo NMFS-OPR-13, 48 p.
Anderson, M.S., K.A. Forney, T.V.N. Cole, T. Eagle, R.P. Angliss, K. Long, L. Barre, L. VanAtta, D. Borggaard, T. Rowles, B. Norberg, J. Whaley, L. Engleby. Differentiating serious and non-serious injury of marine mammals: Report of the Serious Injury Technical Workshop 10-13 September 2007, Seattle, WA. NOAA Tech Memo NMFS-OPR-39, 108 p.
Barlow, J., S.L. Swartz, T.C. Eagle, and P.R. Wade. 1995. U.S. Marine Mammal Stock Assessments: Guidelines for Preparation, Background, and a Summary of the 1995 Assessments. U.S. Dep. Commer., NOAA Tech. Memo. NMFS-OPR-6, 73 p.
Barlow, J. 2006. Cetacean abundance in Hawaiian waters estimated from a summer/fall survey in 2002. Marine Mammal Science 22: 446–464.
Berzin, A. A. and A. A. Rovnin. 1966. Distribution and migration of whales in the northeastern part of the Pacific Ocean, Bering and Chukchi Seas. Izv. Tikhookean. Nauchno-issled, Inst. Rybn. Khoz. Okeanogr. (TINRO) 58:179-207. {In Russian}. (Translated by U.S. Dep. Inter., Bur. Commer. Fish., Seattle, Washington, 1966, pp. 103-106 In: Panin, K. I. (ed) Soviet Research on marine mammals of the Far East).
Bradford, A.L. and K.A. Forney. 2013. Injury determinations for cetaceans observed interacting with Hawaii and American Samoa longline fisheries during 2007-2011. PIFSC Working Paper WP-13-002.
Bradford. A.L., K.A. Forney, E.M. Oleson, and J. Barlow. 2013. Line-transect abundance estimates of cetaceans in the Hawaiian EEZ. PIFSC Working Paper WP-13-004.
Calambokidis, J, T. Chandler, K. Rasmussen, G.H. Steiger, and L. Schlender. 1998. Humpback and blue whale photographic identification: Report of research in 1997. Final report to Southwest Fisheries Science Center, Olympic Coast National Marine Sanctuary, University of California at Santa Cruz, and Cornell University. Cascadia Research, 218½ W. Fourth Ave., Olympia, WA 98501. 41pp.
Calambokidis, J., R. Sears, G. H. Steiger, and J. Evenson. 1995. Movement and stock structure of blue whales in the eastern North Pacific. P.19 In: Proceedings of the Eleventh Biennial Conference on the Biology of Marine Mammals, Orlando, FL, 14-18 December 1995 (Abstract). Society for Marine Mammalogy, Lawrence, KS.
Calambokidis, J., G. H. Steiger, J.C. Cubbage, K.C. Balcomb, C. Ewald, S. Kruse, R. Wells, and R. Sears. 1990. Sightings and movement of blue whales off central California 1986-88 from photo-identification of individuals. Rep. Int. Whaling. Commn., Special Issue 12:343-348.
Donovan, G. P. 1991. A review of IWC stock boundaries. Rept. Int. Whal. Commn., Special Issue 13:39-68. Forney, K.A. 201009. Serious injury determinations for cetaceans caught in Hawaii longline fisheries during 1994-
2008. NOAA Tech. Memo. SWFSC-462.Draft document PSRG-2009-09 presented to the Pacific Scientific Review Group, November 3-5, 2009, Del Mar, CA..
Forney, K. A. and Brownell, R. L., Jr. 1996. Preliminary report of the 1994 Aleutian Island Marine Mammal
249

Survey. Paper SC/48/O11 presented to the International Whaling Commission, June 1996 (unpublished). Gilpatrick, J., W. Perryman, M. Lynn, and M. A. DeAngelis. 1996. Geographic populations of blue whales
(Balaenoptera musculus) in the North Pacific Ocean investigated from whaling records and aerial photogrammetry. Paper SC/47/NP4 presented to the International Whaling Commission, May 1995 (unpublished).
Goldbogen, J.A., Southall B.L.,DeRuiter S.L., Calambokidis J., Friedlaender A.S.,Hazen E.L., Falcone E.A., Schorr G.S., Douglas A., Moretti D.J., Kyburg C., McKenna M.F., Tyack P.L. 2013. Blue whales respond to simulated mid-frequency military sonar. Proc. R. Soc. B 280:20130657. http://dx.doi.org/10.1098/rspb.2013.0657
Leatherwood, S., R. R. Reeves, W. F. Perrin, and W. E. Evans. 1982. Whales, dolphins, and porpoises of the eastern North Pacific and adjacent Arctic waters: A guide to their identification. NOAA Technical Rept. NMFS Circular 444. 245 pp.
Mate, B.R., B.A. Lagerquist, and J. Calambokidis. Movements of North Pacific blue whales during the feeding season off southern California and their southern fall migration. Mar. Mamm. Sci. 15(4):1246-1257.
McCracken, M. 2013. Preliminary assessment of incidental interactions with marine mammals in the Hawaii longline deep and shallow set fisheries from 2007 to 2011. PIFSC Working Paper WP-13-XXX.
McCracken M., and K.A. Forney. 2010. Preliminary assessment of incidental interactions with marine mammals in the Hawaii longline deep and shallow set fisheries. NMFS, Pacific Islands Fisheries Science Center Working Paper WP-10-001. 27p
Mobley, J. R. , Jr, S. S. Spitz, K. A. Forney, R. A. Grotefendt, and P. H. Forestall. 2000. Distribution and abundance of odontocete species in Hawaiian waters: preliminary results of 1993-98 aerial surveys Admin. Rep. LJ-00-14C. Southwest Fisheries Science Center, National Marine Fisheries Service, P.O. Box 271, La Jolla, CA 92038. 26 pp.
Nitta, E. and J. R. Henderson. 1993. A review of interactions between Hawaii's fisheries and protected species. Mar. Fish. Rev. 55(2):83-92.
NMFS. 2005. Revisions to Guidelines for Assessing Marine Mammal Stocks. 24 pp. Available at: http://www.nmfs.noaa.gov/pr/pdfs/sars/gamms2005.pdf
NMFS. 2012. NOAA Fisheries Policy Directive 02-038-01 Process for Injury Determinations (01/27/12). Available at: http://www.nmfs.noaa.gov/pr/pdfs/serious_injury_policy.pdf
Northrop, J., W. C. Cummings, and M. F. Morrison. 1971. Underwater 20-Hz signals recorded near Midway Island. J. Acoust. Soc. Am. 49:1909-1910.
Ohsumi, S. and S. Wada. 1972. Stock assessment of blue whales in the North Pacific. Int. Whal. Commn. Sci. Comm. Rep., 20 pp.
Perrin, W.F., G.P. Donovan and J. Barlow. 1994. Gillnets and Cetaceans. Rep. Int. Whal. Commn., Spec. Iss. 15, 629pp.
Reeves, R. R., P. J. Clapham, R. L. Brownell, Jr., and G. K. Silber. 1998. Recovery plan for the blue whale (Balaenoptera musculus). Office of Protected Resources, NMFS, NOAA, Silver Spring, Maryland. 30 pp.
Rice, D. W. 1974. Whales and whale research in the eastern North Pacific. pp. 170-195 In: W. E. Schevill (ed.). The Whale Problem: A Status Report. Harvard Press, Cambridge, MA.
Rice, D. W. 1992. The blue whales of the southeastern North Pacific Ocean. pp. 1-3 In. Alaska Fisheries Science Center, Quart. Rept. Oct.-Dec.
Stafford, K.M., S.L. Nieukirk, and C.G. Fox. 1999. An acoustic link between blue whales in the eastern tropical Pacific and the northeast Pacific. Mar. Mamm. Sci. 15(4):1258-1268.
Stafford, K.M., S. L. Nieukirk, and G.G. Fox. 2001. Geographic and seasonal variation of blue whale calls in the North Pacific. J. Cetacean Res. Manage. 3(1):65-76.
Stafford. K.M. 2003. Two types of blue whale calls recorded in the Gulf of Alaska. Mar. Mamm. Sci. 19:682-693 Stewart, B. S., S. A. Karl, P. K. Yochem, S. Leatherwood, and J. L. Laake. 1987. Aerial surveys for cetaceans in
the former Akutan, Alaska, whaling grounds. Arctic 40(1):33-42. Taylor, B.L., M. Scott, J. Heyning, and J. Barlow. 2003. Suggested guidelines for recovery factors for endangered
marine mammals. U.S. Dep. Commerce, NOAA Tech. Memo., NMFS-TM-NMFS-SWFSC-354. 6 p. Thompson, P. O. and W. A. Friedl. 1982. A long term study of low frequency sound from several species of whales
off Oahu, Hawaii. Cetology 45:1-19. Wade, P. R. and R. P. Angliss. 1997. Guidelines for Assessing Marine Mammal Stocks: Report of the GAMMS
Workshop April 3-5, 1996, Seattle, Washington. U. S. Dep. Commer., NOAA Tech. Memo. NMFS-OPR-12. 93 pp.
Wade, P. R. and T. Gerrodette. 1993. Estimates of cetacean abundance and distribution in the eastern tropical
250

Pacific. Rep. Int. Whal. Commn. 43:477-493. Watkins, W. A., J. E. George, M. A. Daher, K. Mullin, D. L. Martin, S. H. Haga, and N. A. DiMarzio. 2000. Whale
call data for the North Pacific November 1995 through July 1999: Occurrence of calling whales and source locations from SOSUS and other acoustic systems. Technical Report WHOI_00_02 available from Woods Hole Oceanographic Institution. 160pp.
Watkins, W.A., M.A. Daher, G.M. Reppucci, J.E. George, D.L. Martin, N.A. DiMarzio, and D.P. Gannon. 2000. Seasonality and distribution of whale calls in the North Pacific. Oceanography 13(1): 62-67.
251

Revised 01/15/2011 10/28/2013
FIN WHALE (Balaenoptera physalus physalus): Hawaiian Stock
STOCK DEFINITION AND GEOGRAPHIC RANGE Fin whales are found throughout all oceans and seas of the world from tropical to polar latitudes. They have been considered rare in Hawaiian waters and are absent to rare in eastern tropical Pacific waters (Hamilton et al. 2009). Balcomb (1987) observed 8-12 fin whales in a multispecies feeding assemblage on 20 May 1966 approx. 250 mi. south of Honolulu. Additional sightings were reported north of Oahu in May 1976, and in the Kauai Channel in February 1979 (Shallenberger 1981), . More recently, aA single fin whale was observed north of Kauai in February 1994 (Mobley et al. 1996), and off Lanai in 2012 (Baird unpublished data). Summer/fall shipboard surveys of the waters within the U.S. Exclusive Economic Zone (EEZ) of the Hawaiian Islands, resulted in , and five sightings in 2002 and two sightings in 2010were made during a 2002 survey of waters within the U.S. Exclusive Economic Zone (EEZ) of the Hawaiian Islands (Barlow 2003, Bradford et al 2013; Figure 1). A single stranding washas been reported on Maui in 1954 (Shallenberger 1981). Thompson and Friedl (1982; and see Northrop et al. 1968) suggested that fin whales migrate into Hawaiian waters mainly in fall and winter, based on acoustic recordings off Oahu and Midway Islands. Although the exact positions of the whales producing the sounds could not be determined, at least some of them were almost certainly within the U.S. EEZ. More recently, McDonald and Fox (1999) reported an average of 0.027 calling fin whales per 10002 km (grouped by 8-hr periods) based on passive acoustic recordings within about 16 km of the north shore of Oahu. The International Whaling Commission (IWC) recognized two stocks of fin whales in the North Pacific: the East China Sea and the rest of the North Pacific (Donovan 1991). Mizroch et al. (1984) cite evidence for additional fin whale subpopulations in the North Pacific. There is still insufficient information to accurately determine population structure, but from a conservation perspective it may be risky to assume panmixia in the entire North Pacific. In the North Atlantic, fin whales were locally depleted in some feeding areas by commercial whaling (Mizroch et al. 1984), in part because subpopulations were not recognized. The Marine Mammal Protection Act (MMPA) stock assessment reports recognize three stocks of fin whales in the North Pacific: 1) the Hawaii stock (this report), 2) the California/Oregon/Washington stock, and 3) the Alaska stock. The Hawaiian stock includes animals found both within the Hawaiian Islands EEZ and in adjacent high seas international waters; however, because data on abundance, distribution, and human-caused impacts are largely lacking for high seasinternational waters, the status of this stock is evaluated based on data from U.S. EEZ waters of the Hawaiian Islands (NMFS 2005). POPULATION SIZE Using passive acoustic detections from a hydrophone north of Oahu, MacDonald and Fox (1999) estimated an average density of 0.027 calling fin whales per 1000 km2 within about 16 km from shore. However, the relationship between the number of whales present and the number of calls detected is not known, and therefore this acoustic method does not provide an estimate of absolute abundance for fin whales. A 2002 shipboard line-transect survey of the entire Hawaiian Islands EEZ resulted in an abundance estimate of 174 (CV=0.72) fin whales (Barlow
Figure 1. Locations of fin whale sightings from longline observer records (crosses; NMFS/PIR, unpublished data) and Fin whale sighting locations during the 2002 (open diamonds) and 2010 (black diamonds) shipboard surveys of U.S. EEZ waters surrounding the Hawaiian Islands (Barlow 2003, Bradford et al 2013; see Appendix 2 for details on timing and location of survey effort). Outer line represents approximate boundary of survey area and U.S. EEZ. Gray shading indicates area of Papahanaumokuakea Marine National Monument. Dotted line represents the 1000m isobath.
252

2003). The recent 2010 shipboard line-transect survey of the Hawaiian Islands EEZ resulted in an abundance estimate of 58 (CV = 1.12) fin whales (Bradford et al 2013). This is currently the best available abundance estimate for this stock within the Hawaii EEZ, but the majority of fin whales would be expected to be at higher latitudes feeding grounds at this time of year Minimum Population Estimate The minimum population size is calculated as the lower 20th percentile of the log-normal distribution (Barlow et al 1995) around The log-normal 20th percentile of the 201002 abundance estimate or 27 is 101 fin whales within the Hawaiian Islands EEZ. Current Population Trend No data are available on current population trend. The broad and overlapping confidence intervals around the 2002 and 2010 estimates preclude assessment of trend with the available data. CURRENT AND MAXIMUM NET PRODUCTIVITY RATES No data are available on current or maximum net productivity rate. POTENTIAL BIOLOGICAL REMOVAL The potential biological removal (PBR) level for the Hawaii is stock of fin whales is calculated as the minimum population size within the U.S EEZ of the Hawaiian Islands (27)(101) times one half the default maximum net growth rate for cetaceans (½ of 4%) times a recovery factor of 0.1 (the default value for an endangered species with Nmin <1500; Taylor et al 2003Wade and Angliss 1997), resulting in a PBR of 0.10.2 fin whales per year. HUMAN-CAUSED MORTALITY AND SERIOUS INJURY New Serious Injury Guidelines NMFS updated its serious injury designation and reporting process, which uses guidance from previous serious injury workshops, expert opinion, and analysis of historic injury cases to develop new criteria for distinguishing serious from non-serious injury (Angliss and DeMaster 1998, Andersen et al. 2008, NOAA 2012). NMFS defines serious injury as an “injury that is more likely than not to result in mortality”. Injury determinations for stock assessments revised in 2013 or later incorporate the new serious injury guidelines, based on the most recent 5-year period for which data are available. Fishery Information
Information on fishery-related mortality of cetaceans in Hawaiian waters is limited, but the gear types used in Hawaiian fisheries are responsible for marine mammal mortality and serious injury in other fisheries throughout U.S. waters. Gillnets appear to capture marine mammals wherever they are used, and float lines from lobster traps and longlines can be expected to occasionally entangle cetaceans (Perrin et al. 1994). Interactions with cetaceans are reported for all pelagic fisheries, and large whales have been entangled in longline gear off the Hawaiian Islands (Nitta and Henderson 1993, Forney 2009). There are currently two distinct longline fisheries based in Hawaii: a deep-set longline (DSLL) fishery that targets primarily tunas, and a shallow-set longline fishery (SSLL) that targets swordfish. Both fisheries operate within U.S. waters and on the high seas. Between 2007 and 20112004 and 2008, no fin whales were observed hooked or entangled in the SSLL fishery (100% observer coverage) or the DSLL fishery (20-2822% observer coverage) (McCracken 2013, Bradford & Forney 2013& Forney 2010). Large whales have been observed entangled in longline gear off the Hawaiian Islands in the past (Forney 2010). Historical Mortality Large numbers of fin whales were taken by commercial whalers throughout the North Pacific from the early 20th century until the 1970s (Tønnessen and Johnsen 1982). Approximately 46,000 fin whales were taken from the North Pacific by commercial whalers between 1947 and 1987 (C. Allison, IWC, pers. comm.). Some of the whales taken may have been from a population or populations that migrate seasonally into the Hawaiian EEZ. The species has been protected in the North Pacific by the IWC since 1976. STATUS OF STOCK The status of fin whales in Hawaiian waters relative to OSP is unknown, and there are insufficient data to evaluate trends in abundance. Fin whales are formally listed as "endangered" under the Endangered Species Act
253

(ESA), and consequently the Hawaiian stock is automatically considered as a "depleted" and "strategic" stock under the MMPA. Because there have been no reported fishery related mortality or serious injuries within the Hawaiian Islands EEZ, the total fishery-related mortality and serious injury of this stock can be considered to be insignificant and approaching zero. The increasing level of anthropogenic noise in the world’s oceans has been suggested to be a habitat concern for whales (Richardson et al. 1995). REFERENCES Allison, C. International Whaling Commission. The Red House, 135 Station Road, Impington, Cambridge, UK CB4
9NP. Anderson, M.S., K.A. Forney, T.V.N. Cole, T. Eagle, R.P. Angliss, K. Long, L. Barre, L. VanAtta, D. Borggaard, T.
Rowles, B. Norberg, J. Whaley, L. Engleby. Differentiating serious and non-serious injury of marine mammals: Report of the Serious Injury Technical Workshop 10-13 September 2007, Seattle, WA. NOAA Tech Memo NMFS-OPR-39, 94 p.
Angliss, R.P. and D.P. DeMaster. 1997. Differentiating serious and non-serious injury of marine mammals taken incidental to commercial fishing operations: Report of the Serious Injury Workshop 1-2 April. 1997, Silver Spring, MD. NOAA Tech Memo NMFS-OPR-13, 48 p.
Balcomb, K. C., III. 1987. The Whales of Hawaii. Marine Mammal Fund, 99 pp. Barlow, J., S.L. Swartz, T.C. Eagle, and P.R. Wade. 1995. U.S. Marine Mammal Stock Assessments: Guidelines for
Preparation, Background, and a Summary of the 1995 Assessments. U.S. Dep. Commer., NOAA Tech. Memo. NMFS-OPR-6, 73 p.
Barlow, J. 2003. Cetacean abundance in Hawaiian waters during summer/fall 2002. Admin. Rep. LJ-03-13. Southwest Fisheries Science Center, National Marine Fisheries Service, 8604 La Jolla Shores Drive, La Jolla, CA 92037.
Bradford, A.L. and K.A. Forney. 2013. Injury determinations for cetaceans observed interacting with Hawaii and American Samoa longline fisheries during 2007-2011. PIFSC Working Paper WP-13-002.
Bradford. A.L., K.A. Forney, E.M. Oleson, and J. Barlow. 2013. Line-transect abundance estimates of cetaceans in the Hawaiian EEZ. PIFSC Working Paper WP-13-004.
Donovan, G. P. 1991. A review of IWC stock boundaries. Rept. Int. Whal. Commn., Special Issue 13:39-68. Forney, K.A. 201009. Serious injury determinations for cetaceans caught in Hawaii longline fisheries during 1994-
2008. NOAA Tech. Memo. SWFSC-462.Draft document PSRG-2009-09 presented to the Pacific Scientific Review Group, November 3-5, 2009, Del Mar, CA.
Goldbogen, J.A., Southall B.L.,DeRuiter S.L., Calambokidis J., Friedlaender A.S.,Hazen E.L., Falcone E.A., Schorr G.S., Douglas A., Moretti D.J., Kyburg C., McKenna M.F., Tyack P.L. 2013. Blue whales respond to simulated mid-frequency military sonar. Proc. R. Soc. B 280:20130657. http://dx.doi.org/10.1098/rspb.2013.0657
Hamilton, T.A., J.V. Redfern, J. Barlow, L.T. Balance, T. Gerrodette, R.S. Holt, K.A. Forney, and B.L. Taylor. 2009. Atlas of cetacean sightings for Southwest Fisheries Science Center Cetacean and Ecosystem Surveys: 1986 – 2005. U.S. Dep. of Commerce, NOAA Technical Memorandum, NOAA-TM-NMFS-SWFSC-440. 70 p.
McCracken, M. 2013. Preliminary assessment of incidental interactions with marine mammals in the Hawaii longline deep and shallow set fisheries from 2007 to 2011. PIFSC Working Paper WP-13-XXX.
McCracken M., and K.A. Forney. 2010. Preliminary assessment of incidental interactions with marine mammals in the Hawaii longline deep and shallow set fisheries. NMFS, Pacific Islands Fisheries Science Center Working Paper WP-10-001. 27p
McDonald, M. A., and C. G. Fox. 1999. Passive acoustic methods applied to fin whale population density estimation. J. Acoust. Soc. Am. 105: 2643-2651.
Mizroch, S. A., D. W. Rice, and J. M. Breiwick. 1984. The fin whale, Balaenoptera physalus Mar. Fish. Rev. 46(4):20-24.
Mobley, J. R., Jr., M. Smultea, T. Norris, and D. Weller. 1996. Fin whale sighting north of Kaua’i, Hawai’i. Pacific Science 50:230-233.
Nitta, E. and J. R. Henderson. 1993. A review of interactions between Hawaii's fisheries and protected species. Mar. Fish. Rev. 55(2):83-92.
Northrop, J., W. C. Cummings, and P. O. Thompson. 1968. 20-Hz signals observed in the central Pacific. J. Acoust. Soc. Am. 43:383-384.
NMFS. 2005. Revisions to Guidelines for Assessing Marine Mammal Stocks. 24 pp. Available at: http://www.nmfs.noaa.gov/pr/pdfs/sars/gamms2005.pdf
254

NMFS. 2012. NOAA Fisheries Policy Directive 02-038-01 Process for Injury Determinations (01/27/12). Available at: http://www.nmfs.noaa.gov/pr/pdfs/serious_injury_policy.pdf
Perrin, W.F., G. P. Donovan and J. Barlow. 1994. Gillnets and Cetaceans. Rep. Int. Whal. Commn., Special Issue 15, 629 pp.
Richardson, W. J., C. R. Greene, Jr., C. I. Malme, and D. H. Thompson. 1995. Marine Mammals and Noise. Academic Press, San Diego. 576 p.
Shallenberger, E.W. 1981. The status of Hawaiian cetaceans. Final report to U.S. Marine Mammal Commission. MMC-77/23, 79pp.
Taylor, B.L., M. Scott, J. Heyning, and J. Barlow. 2003. Suggested guidelines for recovery factors for endangered marine mammals. U.S. Dep. Commerce, NOAA Tech. Memo., NMFS-TM-NMFS-SWFSC-354. 6 p.
Thompson, P. O. and W. A. Friedl. 1982. A long term study of low frequency sound from several species of whales off Oahu, Hawaii. Cetology 45:1-19.
Tønnessen, J. N. and A. O. Johnsen. 1982. The History of Modern Whaling. Hurst, 789 pp. Wade, P. R. and R. P. Angliss. 1997. Guidelines for Assessing Marine Mammal Stocks: Report of the GAMMS
Workshop April 3-5, 1996, Seattle, Washington. U. S. Dep. Commer., NOAA Tech. Memo. NMFS-OPR-12. 93 pp.
255

Revised 01/15/20119/23/2013
BRYDE'S WHALE (Balaenoptera edeni): Hawaiian Stock
STOCK DEFINITION AND GEOGRAPHIC RANGE
Bryde's whales occur in tropical and warm temperate waters throughout the world. Shallenberger (1981) reported a sighting of a Bryde's whale southeast of Nihoa in April 1977 (see DeLong and Brownell 1977; Leatherwood et al. 1982: Fig. 39c). Leatherwood et al. (1982) described the species as relatively abundant in summer and fall on the Mellish and Miluoki banks northeast of Hawaii and around Midway Islands, but the basis for this statement was not explained. Ohsumi and Masaki (1975) reported the tagging of "many" Bryde's whales between the Bonin and Hawaiian Islands in the winters of 1971 and 1972 (Ohsumi 1977). Summer/fall shipboard surveys of the waters within the U.S. Exclusive Economic Zone (EEZ) of the Hawaiian Islands A summer/fall 2002 shipboard survey of waters within the U.S. Exclusive Economic Zone (EEZ) of the Hawaiian Islands resulted in 13 Bryde’s whale sightings throughout the study area in 2002 and 30 in 2010 (Figure 1; Barlow 2006; Bradford et al 2013). There is currently With presently available evidence, there is no biological basis for defining separate stocks of Bryde's whales in the central North Pacific. Bryde's whales were seen occasionally also occasionally occur off southern California (Morejohn and Rice 1973) in the 1960s, but their seasonal occurrence has increased since at least 2000 based on detection of their distinctive calls (Kerosky et al 2012).
For the MMPA stock assessment reports, Bryde's whales within the Pacific U.S. EEZ are divided into two areas: 1) Hawaiian waters (this report), and 2) the eastern Pacific (east of 150oW and including the Gulf of California and waters off California). The Hawaiian stock includes animals found both within the Hawaiian Islands EEZ and in adjacent high seasinternational waters; however, because data on abundance, distribution, and human-caused impacts are largely lacking for high seasinternational waters, the status of this stock is evaluated based on data from U.S. EEZ waters of the Hawaiian Islands (NMFS 2005). POPULATION SIZE Tillman (1978) concluded from Japanese and Soviet CPUE data that the stock size in the North Pacific pelagic whaling grounds, mostly to the west of the Hawaiian Islands, declined from approximately 22,500 in 1971 to 17,800 in 1977. An estimate of 13,000 (CV=0.202) Bryde's whales was made from vessel surveys in the eastern tropical Pacific between 1986 and 1990 (Wade and Gerrodette 1993). The area to which this estimate applies is mainly east and somewhat south of the Hawaiian Islands, and it is not known whether these animals are part of the same population that occurs around the Hawaiian Islands. A 2002 shipboard line-transect survey of the entire Hawaiian Islands EEZ resulted in an abundance estimate of 469 (CV=0.45) Bryde’s whales (Barlow 2006). A more recent estimate from a similar 2010 EEZ-wide survey resulted in an abundance estimate of 798 (CV = 0.28) Bryde’s whales (Bradford et al 2013). This is currently the best available abundance estimate for this stock. Minimum Population Estimate Minimum population size is calculated as the lower 20th percentile of the log-normal distribution (Barlow et
Figure 1. Bryde’s whale sighting locations during the 2002 (open diamonds) and 2010 (black diamonds) shipboard surveys of U.S. EEZ waters surrounding the Hawaiian Islands (Barlow 2006, Bradford et al 2013; see Appendix 2 for details on timing and location of survey effort). Outer line represents approximate boundary of survey area and U.S. EEZ. Gray shading indicates area of Papahanaumokuakea Marine National Monument. Dotted line represents the 1000m isobath.
256
al. 1995) of the 2010 abundance estimate, or 633 Bryde’s whales. The log-normal 20th percentile of the 2002 abundance estimate (Barlow 2006) is 327 or 633 Bryde’s whales within the Hawaiian Islands EEZ. Current Population Trend No data are available on current population trends. The broad and overlapping confidence intervals around the 2002 and 2010 estimates preclude assessment of trends with the available data. CURRENT AND MAXIMUM NET PRODUCTIVITY RATES No data are available on current or maximum net productivity rate. POTENTIAL BIOLOGICAL REMOVAL The potential biological removal (PBR) level for the Hawaii is stock of Bryde’s whales is calculated as the minimum population size within the U.S EEZ of the Hawaiian Islands (633)(327) times one half the default maximum net growth rate for cetaceans (½ of 4%) times a recovery factor of 0.50 (for a stock of unknown status with no known fishery mortality or serious injury within the Hawaiian Islands EEZ; Wade and Angliss 1997), resulting in a PBR of 6.3 3.3 Bryde’s whales per year. HUMAN-CAUSED MORTALITY AND SERIOUS INJURY New Serious Injury Guidelines NMFS updated its serious injury designation and reporting process, which uses guidance from previous serious injury workshops, expert opinion, and analysis of historic injury cases to develop new criteria for distinguishing serious from non-serious injury (Angliss and DeMaster 1998, Andersen et al. 2008, NOAA 2012). NMFS defines serious injury as an “injury that is more likely than not to result in mortality”. Injury determinations for stock assessments revised in 2013 or later incorporate the new serious injury guidelines, based on the most recent 5-year period for which data are available. Fishery Information
Information on fishery-related mortality of cetaceans in Hawaiian waters is limited, but the gear types used in Hawaiian fisheries are responsible for marine mammal mortality and serious injury in other fisheries throughout U.S. waters. Gillnets appear to capture marine mammals wherever they are used, and float lines from lobster traps and longlines can be expected to occasionally entangle cetaceans (Perrin et al. 1994). Interactions with cetaceans are reported for all pelagic fisheries, and large whales have been entangled in longline gear off the Hawaiian Islands (Nitta and Henderson 1993, Forney 2009). There are currently two distinct longline fisheries based in Hawaii: a deep-set longline (DSLL) fishery that targets primarily tunas, and a shallow-set longline fishery (SSLL) that targets swordfish. Both fisheries operate within U.S. waters and on the high seas. Between 2007 and 2011 2004 and 2008, no one Bryde’s whales were was observed hooked or entangled in the SSLL fishery (100% observer coverage) in international waters (McCracken & Forney 2010). Based on an evaluation of the observer’s description of the interaction and following the most recently developed criteria for assessing serious injury in marine mammals (Andersen et al. 2008), this animal was considered not seriously injured (Forney 2009) or the . No Bryde’s whales were observed hooked or entangled the DSLL fishery (20-22% 28% observer coverage) (McCracken 2013, Bradford & Forney 2013). Large whales have been observed entangled in longline gear off the Hawaiian Islands in the past (Forney 2010). Table 1. Summary of available information on incidental mortality and serious injury of Bryde’s whales (Hawaiian stock) in commercial fisheries, within and outside of the Hawaiian Islands EEZ (McCracken & Forney 2010). Mean annual takes are based on 2004-2008 data unless otherwise indicated; n/a = not available.
Fishery Name Year Data Type
Percent Observer Coverage
Mortality and Serious Injury outside of U.S. EEZ
Mortality and Serious Injury within Hawaiian Islands EEZ
Observed Estimated (CV)
Mean Annual Takes (CV)
Observed Estimated (CV)
Mean Annual Takes (CV)
Hawaii-based deep-set longline fishery
2004 2005 2006 2007 2008
observer data
25% 28% 22% 20% 22%
0 0 0 0 0
0 (-) 0 (-) 0 (-) 0 (-) 0 (-)
0 (-)
0 0 0 0 0
0 (-) 0 (-) 0 (-) 0 (-) 0 (-)
0
257

Fishery Name Year Data Type
Percent Observer Coverage
Mortality and Serious Injury outside of U.S. EEZ
Mortality and Serious Injury within Hawaiian Islands EEZ
Observed Estimated (CV)
Mean Annual Takes (CV)
Observed Estimated (CV)
Mean Annual Takes (CV)
Hawaii-based shallow-set longline fishery
2004 2005 2006 2007 2008
observer data
100% 100% 100% 100% 100%
0 0* 0 0 0
Same as observed 0.2
0 0 0 0 0
Same as observed 0
Minimum total annual takes within U.S. EEZ waters 0 *One animal observed not seriously injured. Historical Mortality Small numbers of Bryde's whales were taken near the Northwestern Hawaiian Islands by Japanese and Soviet whaling fleets during in the early 1970s (Ohsumi 1977). Pelagic whaling for Bryde's whales in the North Pacific ended after the 1979 season (IWC 1981), and coastal whaling for this species ended in the western Pacific in 1987 (IWC 1989). STATUS OF STOCK The Hawaiian stock of Bryde’s whales is not considered strategic under the 1994 amendments to the MMPA The status of Bryde's whales in Hawaiian waters relative to OSP is unknown, and there are insufficient data to evaluate trends in abundance. Bryde’s whales are It is not listed as “threatened” or “endangered” under the Endangered Species Act (1973), nor designated as “depleted” under the MMPA. Given the absence of recent recorded fishery-related mortality or serious injuries within the Hawaiian Islands EEZ, the Hawaiian stock of Bryde’s whales is not considered strategic under the 1994 amendments to the MMPA. , and the total fishery mortality and serious injury can be considered to be insignificant and approaching zero. The increasing level of anthropogenic noise in the world’s oceans has been suggested to be a habitat concern for whales (Richardson et al. 1995, Weilgart 2007). REFERENCES Andersen, M. S., K. A. Forney, T. V. N. Cole, T. Eagle, R. Angliss, K. Long, L. Barre, L. Van Atta, D. Borggaard,
T. Rowles, B. Norberg, J. Whaley, and L. Engleby. 2008. Differentiating Serious and Non-Serious Injury of Marine Mammals: Report of the Serious Injury Technical Workshop, 10-13 September 2007, Seattle, Washington. NOAA Technical Memorandum NMFS-OPR-39. 94p.
Angliss, R.P. and D.P. DeMaster. 1997. Differentiating serious and non-serious injury of marine mammals taken incidental to commercial fishing operations: Report of the Serious Injury Workshop 1-2 April. 1997, Silver Spring, MD. NOAA Tech Memo NMFS-OPR-13, 48 p.
Barlow, J., S.L. Swartz, T.C. Eagle, and P.R. Wade. 1995. U.S. Marine Mammal Stock Assessments: Guidelines for Preparation, Background, and a Summary of the 1995 Assessments. U.S. Dep. Commer., NOAA Tech. Memo. NMFS-OPR-6, 73 p.
Barlow, J. 2006. Cetacean abundance in Hawaiian waters estimated from a summer/fall survey in 2002. Marine Mammal Science 22: 446–464.
Bradford, A.L. and K.A. Forney. 2013. Injury determinations for cetaceans observed interacting with Hawaii and American Samoa longline fisheries during 2007-2011. PIFSC Working Paper WP-13-002.
Bradford. A.L., K.A. Forney, E.M. Oleson, and J. Barlow. 2013. Line-transect abundance estimates of cetaceans in the Hawaiian EEZ. PIFSC Working Paper WP-13-004.
DeLong, R. L. and R. L. Brownell, Jr. 1977. Hawaiian monk seal (Monachus schauinslandi) habitat and population survey in the northwestern (Leeward) Hawaiian Islands, April 1977. Northwest Alaska Fish Cent. Proc. Rep., 43 pp.
Forney, K.A. 200109. Serious injury determinations for cetaceans caught in Hawaii longline fisheries during 1994-2008. NOAA Tech. Memo. SWFSC-462.Draft document PSRG-2009-09 presented to the Pacific Scientific Review Group, November 3-5, 2009, Del Mar, CA..
International Whaling Commission. 1981. Japan. Progress report on cetacean research June 1979-May 1980. Rep. Int. Whal. Commn. 31:195-200.
International Whaling Commission. 1989. Japan. Progress report on cetacean research June 1987 to April 1988. Rep. Int. Whal. Commn. 39:201-204.
258

Leatherwood, S., R. R. Reeves, W. F. Perrin, and W. E. Evans. 1982. Whales, dolphins, and porpoises of the eastern North Pacific and adjacent arctic waters: A guide to their identification. NOAA Tech. Rep. NMFS 444, 245 pp.
Kerosky, S.M., A. Širović, L.K Roche, S. Baumann-Pickering, S.M Wiggins, and J.A Hildebrand. 2012. Bryde's whale seasonal range expansion and increasing presence in the Southern California Bight from 2000 to 2010. Deep-Sea Research Part I. 65: 125-132.
McCracken, M. 2013. Preliminary assessment of incidental interactions with marine mammals in the Hawaii longline deep and shallow set fisheries from 2007 to 2011. PIFSC Working Paper WP-13-XXX.
McCracken M., and K.A. Forney. 2010. Preliminary assessment of incidental interactions with marine mammals in the Hawaii longline deep and shallow set fisheries. NMFS, Pacific Islands Fisheries Science Center Working Paper WP-10-001. 27p
Mobley, J. R. , Jr, S. S. Spitz, K. A. Forney, R. A. Grotefendt, and P. H. Forestall. 2000. Distribution and abundance of odontocete species in Hawaiian waters: preliminary results of 1993-98 aerial surveys Admin. Rep. LJ-00-14C. Southwest Fisheries Science Center, National Marine Fisheries Service, P.O. Box 271, La Jolla, CA 92038. 26 pp.
Morejohn, G. V. and D. W. Rice. 1973. First record of Bryde's whale (Balaenoptera edeni) off California. Cal. Fish Game 59:313-315.
Nitta, E. and J. R. Henderson. 1993. A review of interactions between Hawaii's fisheries and protected species. Mar. Fish. Rev. 55(2):83-92.
NMFS. 2005. Revisions to Guidelines for Assessing Marine Mammal Stocks. 24 pp. Available at: http://www.nmfs.noaa.gov/pr/pdfs/sars/gamms2005.pdf
NMFS. 2012. NOAA Fisheries Policy Directive 02-038-01 Process for Injury Determinations (01/27/12). Available at: http://www.nmfs.noaa.gov/pr/pdfs/serious_injury_policy.pdf
Ohsumi, S. 1977. Stocks and trends of abundance of the sperm whale in the North Pacific. Rep. Int. Whal. Commn. 27:167-175.
Ohsumi, S. and Y. Masaki. 1975. Japanese whale marking in the North Pacific, 1963-72. Bull. Far Seas Fish. Res. Lab. 12:171-219.
Perrin, W.F., G. P. Donovan and J. Barlow. 1994. Gillnets and Cetaceans. Rep. Int. Whal. Commn., Special Issue 15, 629 pp.
Richardson, W. J., C. R. Greene, Jr., C. I. Malme, and D. H. Thompson. 1995. Marine Mammals and Noise. Academic Press, San Diego. 576 p.
Shallenberger, E.W. 1981. The status of Hawaiian cetaceans. Final report to U.S. Marine Mammal Commission. MMC-77/23, 79pp.
Tillman, M. F. 1978. Modified Delury estimates of the North Pacific Bryde's whale stock. Rep. Int. Whal. Commn. 28:315-317.
Wade, P. R. and R. P. Angliss. 1997. Guidelines for Assessing Marine Mammal Stocks: Report of the GAMMS Workshop April 3-5, 1996, Seattle, Washington. U. S. Dep. Commer., NOAA Tech. Memo. NMFS-OPR-12. 93 pp.
Wade, P. R. and T. Gerrodette. 1993. Estimates of cetacean abundance and distribution in the eastern tropical Pacific. Rep. Int. Whal. Commn. 43:477-493.
Weilgart, L.S. 2007. The impacts of anthropogenic ocean noise on cetaceans and implications for management. Canadian Journal of Zoology 85:1091-1116.
259

Revised 01/15/2011 8/22/2013
SEI WHALE (Balaenoptera borealis borealis): Hawaiian Stock
STOCK DEFINITION AND GEOGRAPHIC RANGE The International Whaling Commission (IWC) only considers one stock of sei whales in the North Pacific (Donovan 1991), but some evidence exists for multiple populations (Masaki 1977; Mizroch et al. 1984; Horwood 1987). Sei whales are distributed far out to sea in temperate regions of the world and do not appear to be associated with coastal features. Whaling effort for this species was distributed continuously across the North Pacific between 45-55oN (Masaki 1977). Two sei whales that were tagged off California were later killed in whaling operations off Washington and British Columbia (Rice 1974) and the movement of tagged animals has been noted in many other regions of the North Pacific. There is still insufficient information to accurately determine population structure, but from a conservation perspective it may be risky to assume panmixia in the entire North Pacific. Four sightings of sei whales were recently made during a sSummer/fall 2002 shipboard surveys of the waters within the U.S. Exclusive Economic Zone (EEZ) of the Hawaiian Islands resulted in four sightings in 2002 and three in 2010 (Figure 1; Barlow 2003; Bradford et al 2013). There have been no reported strandings of sei whales in the Hawaiian Islands.
For the Marine Mammal Protection Act (MMPA) stock assessment reports, sei whales within the Pacific U.S. EEZ are divided into three discrete, non-contiguous areas: 1) waters around Hawaii (this report), 2) California, Oregon and Washington waters, and 3) Alaskan waters. The Hawaiian stock includes animals found both within the Hawaiian Islands EEZ and in adjacent international high seas waters; however, because data on abundance, distribution, and human-caused impacts are largely lacking for international high seas waters, the status of this stock is evaluated based on data from U.S. EEZ waters of the Hawaiian Islands (NMFS 2005). POPULATION SIZE Ohsumi and Wada (1974) estimate the pre-whaling abundance of sei whales to be 58,000-62,000 in the North Pacific. Later, Tillman (1977) used a variety of different methods to estimate the abundance of sei whales in the North Pacific and revised this pre-whaling estimate to 42,000. His estimates for the year 1974, following 27 years of whaling, ranged from 7,260 to 12,620. All methods depend on using the history of catches and trends in CPUE or sighting rates; there have been no direct estimates of sei whale abundance in the entire North Pacific based on sighting surveys. A 2002 shipboard line-transect survey of the entire Hawaiian Islands EEZ resulted in a summer/fall abundance estimate of 77 (CV=1.06) sei whales (Barlow 2003). More recently, the 2010 shipboard line-transect survey of the Hawaiian Islands EEZ resulted in a summer/fall abundance estimate of 178 (CV = 0.9) sei whales (Bradford et al 2013). This is currently the best available abundance estimate for this stock, but the majority of sei whales would be expected to be inat higher- latitudes in their feeding grounds at this time of year. Minimum Population Estimate The minimum population size is calculated as the lower 20th percentile of the log-normal distribution (Barlow et al 1995) of The log-normal 20th percentile of the 2002 2010 abundance estimate isor 9337 sei whales
Figure 1. Sei whale sighting locations during the 2002 (open diamonds) and 2010 (black diamonds) shipboard cetacean surveys of U.S. EEZ waters surrounding the Hawaiian Islands (Barlow 2003, Bradford et al 2013; see Appendix 2 for details on timing and location of survey effort). Outer line indicates approximate boundary of survey area and U.S. EEZ. Gray shading indicates area of Papahanaumokuakea Marine National Monument. Dotted line represents the 1000m isobath.
260

within the Hawaiian Islands EEZ. Current Population Trend No data are available on current population trend. Although the population in the North Pacific is expected to have grown since being given protected status in 1976, the possible effects of continued unauthorized takes (Yablokov 1994) make this uncertain. The broad and overlapping confidence intervals around the 2002 and 2010 estimates preclude assessment of trend with the available data. CURRENT AND MAXIMUM NET PRODUCTIVITY RATES No data are available on current or maximum net productivity rate for sei whales. POTENTIAL BIOLOGICAL REMOVAL The potential biological removal (PBR) level for this stock is calculated as the minimum population size within the U.S. EEZ of the Hawaiian Islands (93)(37) times one half the default maximum net growth rate for cetaceans (½ of 4%) times a recovery factor of 0.1 (the default value for an endangered species with Nmin <1500; Taylor et al 2003Wade and Angliss 1997), resulting in a PBR of 0.20.1 sei whales per year. HUMAN-CAUSED MORTALITY AND SERIOUS INJURY New Serious Injury Guidelines NMFS updated its serious injury designation and reporting process, which uses guidance from previous serious injury workshops, expert opinion, and analysis of historic injury cases to develop new criteria for distinguishing serious from non-serious injury (Angliss and DeMaster 1998, Andersen et al. 2008, NOAA 2012). NMFS defines serious injury as an “injury that is more likely than not to result in mortality”. Injury determinations for stock assessments revised in 2013 or later incorporate the new serious injury guidelines, based on the most recent 5-year period for which data are available. Fishery Information Information on fishery-related mortality of cetaceans in Hawaiian waters is limited, but the gear types used in Hawaiian fisheries are responsible for marine mammal mortality and serious injury in other fisheries throughout U.S. waters. Gillnets appear to capture marine mammals wherever they are used, and float lines from lobster traps and longlines can be expected to occasionally entangle cetaceans (Perrin et al. 1994) In March 2011 a subadult sei whale was found near Lahaina, Maui entangled with one or two wraps of heavy-gauge polypropylene line around the tailstock and trailing about 30 feet of line including a large bundle (Bradford & Lyman 2013). Closer examination also revealed line scars on the body near the dorsal fin. Although disentanglement was attempted, the gear could not be removed. Although the source of the line entangling the whale could not be determined, this injury is considered serious based on extent of trailing gear and condition of the whale (Bradford & Lyman 2013, NMFS 2012). This serious injury record results in an average annual serious injury and mortality rate of 0.2 sei whales for the period 2007 to 2011.
Interactions with cetaceans are reported for all pelagic fisheries, and large whales have been entangled in longline gear off the Hawaiian Islands (Nitta and Henderson 1993; Forney 2009). There are currently two distinct longline fisheries based in Hawaii: a deep-set longline (DSLL) fishery that targets primarily tunas, and a shallow-set longline fishery (SSLL) that targets swordfish. Both fisheries operate within U.S. waters and on the high seas. Between 2004 and 20082007 and 2011, no sei whales were observed hooked or entangled in the SSLL fishery (100% observer coverage) or the DSLL fishery (20-28% observer coverage) (McCracken 2013, Bradford & Forney 2013 & Forney 2010). Large whales have been observed entangled in longline gear in the Hawaii EEZ in the past (Forney 2010). Historical Whaling The reported take of North Pacific sei whales by commercial whalers totaled 61,500 between 1947 and 1987 (C. Allison, IWC, pers. comm.). There has been an IWC prohibition on taking sei whales since 1976, and commercial whaling in the U.S. has been prohibited since 1972. STATUS OF STOCK Previously, sei whales were estimated to have been reduced to 20% (8,600 out of 42,000) of their pre-whaling abundance in the North Pacific (Tillman 1977). Sei whales are formally listed as "endangered" under the Endangered Species Act (ESA), and consequently the Hawaiian stock is automatically considered as a "depleted"
261

and "strategic" stock under the MMPA. Because there have been no reported fishery related mortality or serious injuries of sei whales within the Hawaiian Islands EEZ, the total fishery-related mortality and serious injury can be considered to be insignificant and approaching zero. The observed rate of fisheries related mortality or serious injury within the Hawaiian Islands EEZ (0.2 animals per year) is equal to the PBR (0.2), though the responsible fishery is unknown. The increasing level of anthropogenic noise in the world’s oceans has been suggested to be a habitat concern for whales (Richardson et al. 1995). Behavioral changes associated with exposure to simulated mid-frequency sonar, including cessation of feeding, increased swimming speeds, and movement away from simulated sound sources have been documented in tagged blue whales (Goldbogen et al. 2013). It is likely that the behavior of other baleen whale species, such as sei whales, may be similarly affected by such anthropogenic sounds. REFERENCES Allison, C. International Whaling Commission. The Red House, 135 Station Road, Impington, Cambridge, UK CB4
9NP. Anderson, M.S., K.A. Forney, T.V.N. Cole, T. Eagle, R.P. Angliss, K. Long, L. Barre, L. VanAtta, D. Borggaard, T.
Rowles, B. Norberg, J. Whaley, L. Engleby. Differentiating serious and non-serious injury of marine mammals: Report of the Serious Injury Technical Workshop 10-13 September 2007, Seattle, WA. NOAA Tech Memo NMFS-OPR-39, 94 p.
Angliss, R.P. and D.P. DeMaster. 1997. Differentiating serious and non-serious injury of marine mammals taken incidental to commercial fishing operations: Report of the Serious Injury Workshop 1-2 April. 1997, Silver Spring, MD. NOAA Tech Memo NMFS-OPR-13, 48 p.
Barlow, J. 2003. Cetacean abundance in Hawaiian waters during summer/fall 2002. Admin. Rep. LJ-03-13. Southwest Fisheries Science Center, National Marine Fisheries Service, 8604 La Jolla Shores Drive, La Jolla, CA 92037.
Barlow, J., S.L. Swartz, T.C. Eagle, and P.R. Wade. 1995. U.S. Marine Mammal Stock Assessments: Guidelines for Preparation, Background, and a Summary of the 1995 Assessments. U.S. Dep. Commer., NOAA Tech. Memo. NMFS-OPR-6, 73 p.
Bradford, A.L. and K.A. Forney. 2013. Injury determinations for cetaceans observed interacting with Hawaii and American Samoa longline fisheries during 2007-2011. PIFSC Working Paper WP-13-002.
Bradford. A.L., K.A. Forney, E.M. Oleson, and J. Barlow. 2013. Line-transect abundance estimates of cetaceans in the Hawaiian EEZ. PIFSC Working Paper WP-13-004.
Bradford, A.L. and E. Lyman. 2013. Injury determinations for humpback whales and other cetaceans reported to the Hawaiian Islands Disentanglement and Pacific Islands Marine Mammal Response Networks during 2007-2011. PIFSC Working Paper WP-13-005.
Donovan, G. P. 1991. A review of IWC stock boundaries. Rept. Int. Whal. Commn., Special Issue 13:39-68. Forney, K.A. 2009. Serious injury determinations for cetaceans caught in Hawaii longline fisheries during 1994-
2008. Draft document PSRG-2009-09 presented to the Pacific Scientific Review Group, November 3-5, 2009, Del Mar, CA..
Goldbogen, J.A., Southall B.L.,DeRuiter S.L., Calambokidis J., Friedlaender A.S.,Hazen E.L., Falcone E.A., Schorr G.S., Douglas A., Moretti D.J., Kyburg C., McKenna M.F., Tyack P.L. 2013. Blue whales respond to simulated mid-frequency military sonar. Proc. R. Soc. B 280:20130657. http://dx.doi.org/10.1098/rspb.2013.0657
Horwood, J. 1987. The Sei Whale: Population Biology, Ecology and Management. Croom Helm, London, U.K. 375pp.
Masaki, Y. 1977. The separation of the stock units of sei whales in the North Pacific. Rept. Int. Whal. Commn., Special Issue 1:71-77.
McCracken M., and K.A. Forney. 2010. Preliminary assessment of incidental interactions with marine mammals in the Hawaii longline deep and shallow set fisheries. NMFS, Pacific Islands Fisheries Science Center Working Paper WP-10-001. 27p
McCracken, M. 2013. Preliminary assessment of incidental interactions with marine mammals in the Hawaii longline deep and shallow set fisheries from 2007 to 2011. PIFSC Working Paper WP-13-XXX.
Mizroch, S. A., D. W. Rice, and J. M. Breiwick. 1984. The sei whale, Balaenoptera borealis. Mar. Fish. Rev. 46:25-29.
NMFS. 2005. Revisions to Guidelines for Assessing Marine Mammal Stocks. 24 pp. Available at: http://www.nmfs.noaa.gov/pr/pdfs/sars/gamms2005.pdf
NMFS. 2012. NOAA Fisheries Policy Directive 02-038-01 Process for Injury Determinations (01/27/12). Available at: http://www.nmfs.noaa.gov/pr/pdfs/serious_injury_policy.pdf
262

Nitta, E. and J. R. Henderson. 1993. A review of interactions between Hawaii's fisheries and protected species. Mar. Fish. Rev. 55(2):83-92.
Ohsumi, S. and S. Wada. 1974. Status of whale stocks in the North Pacific, 1972. Rept. Int. Whal. Commn. 25:114-126.
Perrin, W.F., G. P. Donovan and J. Barlow. 1994. Gillnets and Cetaceans. Rep. Int. Whal. Commn., Special Issue 15, 629 pp.
Rice, D. W. 1974. Whales and whale research in the eastern North Pacific. pp. 170-195 In: W. E. Schevill (ed.). The Whale Problem: A Status Report. Harvard Press, Cambridge, MA.
Richardson, W. J., C. R. Greene, Jr., C. I. Malme, and D. H. Thompson. 1995. Marine Mammals and Noise. Academic Press, San Diego. 576 p.
Taylor, B.L., M. Scott, J. Heyning, and J. Barlow. 2003. Suggested guidelines for recovery factors for endangered marine mammals. U.S. Dep. Commerce, NOAA Tech. Memo., NMFS-TM-NMFS-SWFSC-354. 6 p.
Tillman, M. F. 1977. Estimates of population size for the North Pacific sei whale. Rept. Int. Whal. Commn., Special Issue 1:98-106.
Yablokov, A. V. 1994. Validity of whaling data. Nature 367:108. Wade, P. R. and R. P. Angliss. 1997. Guidelines for Assessing Marine Mammal Stocks: Report of the GAMMS
Workshop April 3-5, 1996, Seattle, Washington. U. S. Dep. Commer., NOAA Tech. Memo. NMFS-OPR-12. 93 pp.
263

Revised 01/15/20119/23/2013
MINKE WHALE (Balaenoptera acutorostrata scammoni): Hawaiian Stock
STOCK DEFINITION AND GEOGRAPHIC RANGE The International Whaling Commission (IWC) recognizes 3 stocks of minke whales in the North Pacific: one in the Sea of Japan/East China Sea, one in the rest of the western Pacific west of 180oN, and one in the "remainder" of the Pacific (Donovan 1991). The "remainder" stock only reflects the lack of exploitation in the eastern Pacific and does not imply that only one population exists in that area (Donovan 1991). In the "remainder" area, minke whales are relatively common in the Bering and Chukchi seas and in the Gulf of Alaska, but are not considered abundant in any other part of the eastern Pacific (Leatherwood et al. 1982; Brueggeman et al. 1990). In the Pacific, minke whales are usually seen over continental shelves (Brueggeman et al. 1990). In the extreme north, minke whales are believed to be migratory, but in inland waters of Washington and in central California they appear to establish home ranges (Dorsey et al. 1990). Minke whales have only been recently confirmed to occur seasonally around the Hawaiian Islands (Barlow 2003, Rankin and Barlow, 2005), and their migration routes or destinations are not known. Minke whale “boing” sounds have been detected near the Hawaiian Islands for decades, with detections by the U.S. Navy during February and March (Thompson and Friedl 1982) and at the ALOHA Cabled Observatory 100km north of Oahu from October to May (Oswald et al 2011). Minke whales were observed within 22km of Kauai during a nearshore survey in February 2005 (Rankin et al. 2007) and by four reliable sightings of minke whales were made by observers in the Hawaii-based longline fishery during the months of December-March, 2000-2002 since 1994 (Figure 1; NMFS/PIR unpublished data). Two One confirmed sightings of a minke whale wereas made, one in November 2002 and the other during October 2010 during a surveys of waters within the U.S. Exclusive Economic Zone (EEZ) of the Hawaiian Islands (Barlow 2003; Bradford et al 2013)), and additional acoustic detections of this species’ distinctive call (known as the ‘boing’) were made that could not be visually verified (Figure 1). There are no known stranding records of this species from the main islands (Nitta 1991; Maldini et al. 2005).
For the Marine Mammal Protection Act (MMPA) stock assessment reports, there are three stocks of minke whale within the Pacific U.S. EEZ: 1) a Hawaiian stock (this report), 2) a California/Oregon/ Washington stock, and 3) an Alaskan stock. The Hawaiian stock includes animals found both within the Hawaiian Islands EEZ and in adjacent international high seas waters; however, because data on abundance, distribution, and human-caused impacts are largely lacking for international high seas waters, the status of this stock is evaluated based on data from U.S. EEZ waters of the Hawaiian Islands (NMFS 2005). POPULATION SIZE Using passive acoustic detections from an array of seafloor hydrophones north of Kauai, Martin et al
Figure 1. Locations of minke whale sightings from longline observer records (crossesdiamonds; NMFS/PIR, unpublished data), and sightings (closed circle) and acoustic detections (open circles) made during the 2002 (open diamond) and 2010 (black diamond) shipboard surveys of U.S. EEZ waters surrounding the Hawaiian Islands (Barlow 20036, Bradford et al 2013; see Appendix 2 for details on timing and location of survey effort). Outer line indicates approximate boundary of survey area and U.S. EEZ. Gray shading indicates area of Papahanaumokuakea Marine National Monument.Solid lines represent the U.S. EEZ. Dotted line represents the 1000m isobath.
264

(2012) estimate a preliminary average density of 2.15 ”boing” calling minke whales per 1000 km2 during the period February through April and within an area of 8,767 km2 centered on the seafloor array positioned roughly 50km from shore. However, the relationship between the number of whales present and the number of calls detected is not known, and therefore this acoustic method does not provide an estimate of absolute abundance for minke whales. A sSummer/fall 2002 and 2010 shipboard line-transect surveys of the entire Hawaiian Islands EEZ each resulted in one ‘off effort’ sighting of a minke whale following the acoustic detection of a so-called ‘boing’ (Barlow 2003; Rankin and Barlow, 2005Bradford et al 2013). ThisThese sightings wereas not part of regular survey operations and, therefore, could not be used to calculate an estimates of abundance (Barlow 2003; Bradford et al 2013). Furthermore, tThe majority of this survey took place during summer and early fall, when the Hawaiian stock of minke whale would be expected to be farther north. There currently is no abundance estimate for this stock of minke whales, which appears to occur seasonally (about OctoberNovember - AprilMarch) around the Hawaiian Islands. Minimum Population Estimate There is no minimum population estimate for the Hawaiian stock of minke whales. Current Population Trend No data are available on population size or current population trend. CURRENT AND MAXIMUM NET PRODUCTIVITY RATES No data are available on current or maximum net productivity rate for Hawaiian minke whales. POTENTIAL BIOLOGICAL REMOVAL The potential biological removal (PBR) level for the Hawaii stock of minke whales is calculated as the minimum population estimate times one half the default maximum net growth rate for cetaceans (½ of 4%) times a recovery factor of 0.50 (for a species of unknown status with no estimated fishery mortality or serious injury within the U.S. EEZ of the Hawaiian Islands; Wade and Angliss 1997). Because there is no minimum population estimate for Hawaii minke whales, the PBR is undetermined. No PBR can be calculated for this stock at this time. HUMAN CAUSED MORTALITY AND SERIOUS INJURY New Serious Injury Guidelines NMFS updated its serious injury designation and reporting process, which uses guidance from previous serious injury workshops, expert opinion, and analysis of historic injury cases to develop new criteria for distinguishing serious from non-serious injury (Angliss and DeMaster 1998, Andersen et al. 2008, NOAA 2012). NMFS defines serious injury as an “injury that is more likely than not to result in mortality”. Injury determinations for stock assessments revised in 2013 or later incorporate the new serious injury guidelines, based on the most recent 5-year period for which data are available. Fishery Information Information on fishery-related mortality and serious injury of cetaceans in Hawaiian waters is limited, but the gear types used in Hawaiian fisheries are responsible for marine mammal mortality and serious injury in other fisheries throughout U.S. waters. Gillnets appear to capture marine mammals wherever they are used, and float lines from lobster traps and longlines can be expected to occasionally entangle cetaceans (Perrin et al. 1994). There are currently two distinct longline fisheries based in Hawaii: a deep-set longline (DSLL) fishery that targets primarily tunas, and a shallow-set longline fishery (SSLL) that targets swordfish. Both fisheries operate within U.S. waters and on the high seas. Between 2004 and 20082007 and 2011, no minke whales were observed hooked or entangled in the SSLL fishery (100% observer coverage) or the DSLL fishery (20-28% observer coverage) (McCracken 2013& Forney 2010). Large whales have been observed entangled in longline gear in the Hawaii EEZ in the past (Forney 2010), though none of these have been minke whales. STATUS OF STOCK The Hawaii stock of minke whales is not considered strategic under the 1994 amendments to the MMPA. The status of minke whales in Hawaiian waters relative to OSP is unknown, and there are insufficient data to evaluate trends in abundance. Minke whales It isare not listed as “threatened” or “endangered” under the Endangered Species Act (1973), nor designated as “depleted” under the MMPA. Although information on minke whales in Hawaiian waters is limited, this stock would not be considered strategic under the 1994 amendments to the MMPA bBecause there has been no reported fisheries related mortality or serious injury within the Hawaiian Islands
265

EEZ, . Insufficient information is available to determine whether the total fishery mortality and serious injury for minke whales can be considered is insignificant and approaching zero mortality and serious injury rate. The increasing level of anthropogenic sound in the world’s oceans has been suggested to be a habitat concern for whales (Richardson et al. 1995). REFERENCES Anderson, M.S., K.A. Forney, T.V.N. Cole, T. Eagle, R.P. Angliss, K. Long, L. Barre, L. VanAtta, D. Borggaard, T.
Rowles, B. Norberg, J. Whaley, L. Engleby. Differentiating serious and non-serious injury of marine mammals: Report of the Serious Injury Technical Workshop 10-13 September 2007, Seattle, WA. NOAA Tech Memo NMFS-OPR-39, 94 p.
Angliss, R.P. and D.P. DeMaster. 1997. Differentiating serious and non-serious injury of marine mammals taken incidental to commercial fishing operations: Report of the Serious Injury Workshop 1-2 April. 1997, Silver Spring, MD. NOAA Tech Memo NMFS-OPR-13, 48 p.
Barlow, J. 2003. Cetacean abundance in Hawaiian waters during summer/fall 2002. Admin. Rep. LJ-03-13. Southwest Fisheries Science Center, National Marine Fisheries Service, 8604 La Jolla Shores Drive, La Jolla, CA 92037.
Bradford, A.L. and K.A. Forney. 2013. Injury determinations for cetaceans observed interacting with Hawaii and American Samoa longline fisheries during 2007-2011. PIFSC Working Paper WP-13-002.
Bradford. A.L., K.A. Forney, E.M. Oleson, and J. Barlow. 2013. Line-transect abundance estimates of cetaceans in the Hawaiian EEZ. PIFSC Working Paper WP-13-004.
Brueggeman, J. J., G. A. Green, K. C. Balcomb, C. E. Bowlby, R. A. Grotefendt, K. T. Briggs, M. L. Bonnell, R. G. Ford, D. H. Varoujean, D. Heinemann, and D. G. Chapman. 1990. Oregon-Washington Marine Mammal and Seabird Survey: Information synthesis and hypothesis formulation. U.S. Department of the Interior, OCS Study MMS 89-0030.
Donovan, G. P. 1991. A review of IWC stock boundaries. Rept. Int. Whal. Commn., Special Issue 13:39-68. Dorsey, E. M., S. J. Stern, A. R. Hoelzel, and J. Jacobsen. 1990. Minke whale (Balaenoptera acutorostrata) from
the west coast of North America: individual recognition and small-scale site fidelity. Rept. Int. Whal. Commn., Special Issue 12:357-368.
Leatherwood, S., R. R. Reeves, W. F. Perrin, and W. E. Evans. 1982. Whales, dolphins, and porpoises of the eastern North Pacific and adjacent Arctic waters: A guide to their identification. NOAA Technical Rept. NMFS Circular 444. 245pp.
Forney, K.A. 201009. Serious injury determinations for cetaceans caught in Hawaii longline fisheries during 1994-2008. NOAA Tech. Memo. SWFSC- Draft document PSRG-2009-09 presented to the Pacific Scientific Review Group, November 3-5, 2009, Del Mar, CA.
McCracken, M. 2013. Preliminary assessment of incidental interactions with marine mammals in the Hawaii longline deep and shallow set fisheries from 2007 to 2011. PIFSC Working Paper WP-13-XXX.
McCracken M., and K.A. Forney. 2010. Preliminary assessment of incidental interactions with marine mammals in the Hawaii longline deep and shallow set fisheries. NMFS, Pacific Islands Fisheries Science Center Working Paper WP-10-001. 27p
Maldini, D., L. Mazzuca, and S. Atkinson. 2005. Odontocete stranding patterns in the Main Hawaiian Islands (1937-2002): How do they compare with live animal surveys? Pacific Science 59(1):55-67.
Martin, S.W., T.A. Marques, L. Thomas, R.P. Morrissey, S. Jarvis, N. DiMarzio, D. Moretti, and D.K. Mellinger. 2012 Estimating minke whale (Balaenoptera acutorostrata) boing sound density using passive acoustic sensors. Mar. Mamm. Sci. 29(1): 142-158.
NMFS, Pacific Islands Region, Observer Program, 1602 Kapiolani Blvd, Suite 1110, Honolulu, HI 96814. NMFS. 2005. Revisions to Guidelines for Assessing Marine Mammal Stocks. 24 pp. Available at:
http://www.nmfs.noaa.gov/pr/pdfs/sars/gamms2005.pdf NMFS. 2012. NOAA Fisheries Policy Directive 02-038-01 Process for Injury Determinations (01/27/12). Available
at: http://www.nmfs.noaa.gov/pr/pdfs/serious_injury_policy.pdf Nitta, E. 1991. The marine mammal stranding network for Hawaii: an overview. In: J.E. Reynolds III, D.K. Odell
(eds.), Marine Mammal Strandings in the United States, pp.56-62. NOAA Tech. Rep. NMFS 98, 157 pp. Nitta, E. and J. R. Henderson. 1993. A review of interactions between Hawaii's fisheries and protected species.
Mar. Fish. Rev. 55(2):83-92.Oswald, J.N., W.W.L. Au, and F. Duennebier. 2011. Minke whale (Balaenoptera acutorostrata) boings detected at the Station ALOHA Cabled Observatory. J. Acous. Soc. Am. 129(5):3353-3360.
Oswald, J.N., W.W.L. Au, and F. Duennebier. 2011. Minke whale (Balaenoptera acutorostrata) boings detected at
266

the Station ALOHA Cabled Observatory. The Journal of the Acoustical Society of America 129:3353. Perrin, W. F., G. P. Donovan and J. Barlow. 1994. Gillnets and Cetaceans. Rep. Int. Whal. Commn., Spec. Issue 15,
629p. Rankin, S. and J. Barlow. 2005. Source of the North Pacific “boing” sound attributed to minke whales. J. Acous.
Soc. Am. 118(5):3346-335. Rankin, S., T.F. Norris, M.A Smultea, C. Oedokoven, A.M. Zoidis, E. Silve, J. Rivers. 2007. A visual sighting and
acoustic detections of minke whales, Balaenoptera acutorostrata. (Cetacea: Balaenopteridae), in nearshore Hawaiian waters. Pacific Science 612(3):395-398.
Richardson, W. J., C. R. Greene, Jr., C. I. Malme, and D. H. Thompson. 1995. Marine Mammals and Noise. Academic Press, San Diego. 576 p.
267

Revised 01/15/2011 9/24/2013 Appendix 1. Description of U.S. Commercial Fisheries The Marine Mammal Protection Act (MMPA) requires NMFS to publish a list of commercial fisheries (List Of Fisheries or “LOF”) and classify each fishery based on whether incidental mortality and serious injury of marine mammals is frequent (Category I), occasional (Category II), or unlikely or unknown (Category III). The LOF is published annually in the Federal Register. The categorization of a fishery in the LOF determines whether participants in that fishery are subject to certain provisions of the MMPA, such as registration, observer coverage, and take reduction plan requirements. The categorization criteria as they appear in the LOF is reprinted below:
The fishery classification criteria consist of a two-tiered, stock-specific approach that first addresses the total impact of all fisheries on each marine mammal stock, and then addresses the impact of individual fisheries on each stock. This approach is based on consideration of the rate, in numbers of animals per year, of incidental mortality and serious injury of marine mammals due to commercial fishing operations relative to the Potential Biological Removal (PBR) level for each marine mammal stock. The MMPA (16 U.S.C. 1362 (20)) defines the PBR level as the maximum number of animals, not including natural mortality, that may be removed from a marine mammal stock while allowing that stock to reach or maintain its optimum sustainable population. This definition can also be found in the implementing regulations for section 118 at 50 CFR 229.2. Tier 1: If the total annual mortality and serious injury across all fisheries that interact with a stock is less than or equal to 10 percent of the PBR level of the stock, all fisheries interacting with the stock would be placed in Category III. Otherwise, these fisheries are subject to the next tier (Tier 2) of analysis to determine their classification. Tier 2, Category I: Annual mortality and serious injury of a stock in a given fishery is greater than or equal to 50 percent of the PBR level. Tier 2, Category II: Annual mortality and serious injury of a stock in a given fishery is greater than 1 percent and less than 50 percent of the PBR level. Tier 2, Category III: Annual mortality and serious injury of a stock in a given fishery is less than or equal to 1 percent of the PBR level. While Tier 1 considers the cumulative fishery mortality and serious injury for a particular stock, Tier 2 considers fishery-specific mortality and serious injury for a particular stock. Additional details regarding how the categories were determined are provided in the preamble to the final rule implementing section 118 of the MMPA (60 FR 45086, August 30, 1995). Since fisheries are categorized on a per-stock basis, a fishery may qualify as one Category for one marine mammal stock and another Category for a different marine mammal stock. A fishery is typically categorized on the LOF at its highest level of classification (e.g., a fishery that qualifies for Category III for one marine mammal stock and for Category II for another marine mammal stock will be listed under Category II). Other Criteria That May Be Considered In the absence of reliable information indicating the frequency of incidental mortality and serious injury of marine mammals by a commercial fishery, NMFS will determine whether the incidental serious injury or mortality qualifies for Category II by evaluating other factors such as fishing techniques, gear used, methods used to deter marine mammals, target species, seasons and areas fished, qualitative data from logbooks or fisher reports, stranding data, and the species and distribution of marine mammals in the area, or at the discretion of the Assistant Administrator for Fisheries (50 CFR 229.2). This appendix describes commercial fisheries that occur in California, Oregon, Washington, and Hawaiian waters and that interact or may interact with marine mammals. The first three sections describe sources of marine mammal mortality data for these fisheries. The fourth section describes the commercial fisheries for these states. A list of all known fisheries for these states was published as a proposed rule in the Federal Register, 71 FR 20941, 24 April 2006. 1. Sources of Mortality/Injury Data There are three major sources of marine mammal mortality/injury data for the active commercial fisheries in California, Oregon, and Washington, and Hawaii. These sources are the NMFS Observer Programs, the Marine Mammal
268

Revised 01/15/2011 9/24/2013 Appendix 1. Description of U.S. Commercial Fisheries Authorization Program (MMAP) data, and the NMFS Marine Mammal Stranding Network (MMSN) data. Each of these data sources has a unique objective. Data on mammal mortality and injury are reported to the MMAP by fishers in any commercial fisheries. Marine mammal mortality and injury is also monitored by the NMFS Marine Mammal Stranding Network (MMSN). Data provided by the MMSN is not duplicated by either the NMFS Observer Program or MMAP reporting. Human-related data from the MMSN include occurrences of mortality due to entrainment in power station intakes, ship strikes, shooting, evidence of net and line fishery entanglement (net remaining on animal, net marks, severed flukes), and ingestion of hooks. 2. Marine Mammal Reporting from Fisheries In 1994, the MMPA was amended to implement a long-term regime for managing mammal interactions with commercial fisheries (the Marine Mammal Authorization Program, or MMAP). Logbooks are no longer required - instead vessel owners/operators in any commercial fishery (Category I, II, or III) are required to submit one-page pre-printed reports for all interactions (including those that occur while an observer is onboard) resulting in an injury to or death of a marine mammal. The report must include owner/operator’s name and address, vessel name and ID, where and when the interaction occurred, the fishery, species involved, and type of injury (if the animal was released alive). These postage-paid report forms are mailed to all Category I and II fishery participants that have registered with NMFS, and must be completed and returned to NMFS within 48 hours of returning to port for trips in which a marine mammal injury or mortality occurred. The number of self-reported marine mammal interactions is considerably lower than the number reported by fishery observers, even though observer reports are typically based on 20% observer effort. For example, from 2000-2004, there were 112 fisher self-reports of marine mammal interactions in the California swordfish/thresher shark drift gillnet fishery. This compares with 141 observed interactions over the same period, based on only 20% observer coverage. This suggests that fisher self-reports are negatively-biased. From 2007-2011 there were 12 fisher self-reports of marine mammal interactions in the Hawaii-based deep-set longline fishery, 11 of which corresponded to observer records. This compares with 50 observed interactions over the same period, based on 20-22% observer coverage. This suggests fisher self-reports are significantly negatively biased. 3. NMFS Marine Mammal Stranding Network data
From 2000-2004, there were 1,022 cetacean and 13,215 pinniped strandings recorded in California, Oregon, and Washington states. Approximately 10% of all cetacean and 6% of all pinniped strandings showed evidence of human-caused mortality during this period. From 2007-2011, there were 144 cetacean strandings recorded in Hawaii, with 42% of all cetacean strandings showing evidence of human-caused mortality during this period. Human-related causes of mortality include: entrainment in power station intakes, shooting, net fishery entanglement, and hook/line, set-net and trap fishery interaction. 4. Fishery Descriptions Category I, CA/OR thresher shark/swordfish drift gillnet fishery (≥14 inch mesh) Number of permit holders: The numbers of eligible permit holders in California for 2002-2006 were 106, 100, 96, 90, and 88, 2008 to 2012 ranged between 78 and 84 respectively (data source: California Deparment of Fish and Game Wildlife website: www.dfg.ca.gov/licensing). Permits are non-transferable and are linked to individual fishermen, not vessels. Number of active permit holders: The numbers of vessels active in this fishery declined from 40 in 2008 to 16 vessels in 2012. 2002-2006 were 50, 43, 43, 40, and 43 respectively. Information on the number of permit holders is obtained from the Status of the U.S. west coast fisheries for Highly Migratory Species through 2004; Stock Assessment and Fishery Evaluation report available from the Pacific Fishery Management Council website (www.pcouncil.org) and the California Department of Fish and Game. Total effort: Both estimated and observed effort for the drift-net fishery during the calendar years 1990 through 2006 2012 are shown in Figure 2. Geographic range: Effort in this fishery ranges from the U.S./Mexico border north to waters off the state of Oregon. For this fishery there are area-season closures (see below). Figures 1-5 shows locations of observed sets for the period 1990 to 2012. and Figure 6 shows approximate locations of observed marine mammal entanglements for the period 1998-2002.
269

Revised 01/15/2011 9/24/2013 Appendix 1. Description of U.S. Commercial Fisheries Seasons: This fishery is subject to season-area restrictions. From February 1 to May 15 effort must be further than 200 nautical miles (nmi) from shore; from May 16 to August 14, effort must be further than 75 nmi from shore, and from August 15 to January 31 there is only the 3 nmi off-shore restriction for all gillnets in southern California (see halibut and white seabass fishery below). The majority of the effort occurs from October through December. A season-area closure to protect leatherback sea turtles was implemented in this fishery in August 2001. The closure area prohibits drift gillnet fishing from August 15 through November 15, in the area bounded by straight lines from Point Sur, California (N36o 17') to N 34o 27' W 123o 35', west to W129o, north to N 45o, then east to the Oregon coast. An additional season-area closure south of Point Conception and east of W120 degrees longitude is effective during the months of June, July, and August during El Niño years to protect loggerhead turtles (Federal Register, 68 FR 69962, 16 December 2003). Gear type and fishing method: Typical gear used for this fishery is a 1000-fathom gillnet with a stretched mesh size typically ranging from 18-22 inches (14 inch minimum). The net is set at dusk and allowed to drift during the night after which, it is retrieved. The fishing vessel is typically attached to one end of the net. Soak duration is typically 12-14 hours depending on the length of the night. Net extender lengths of a minimum 36 ft. became mandatory for the 1997-1998 fishing season. The use of acoustic warning devices (pingers) became mandatory 28 October 1997. Regulations: The fishery is managed under a Fishery Management Plan (FMP) developed by the Pacific Fishery Management Council and NMFS. Management type: The drift-net fishery is a limited-entry fishery with seasonal closures and gear restrictions (see above). The state of Oregon restricts landing to swordfish only. Comments: This fishery has had a NMFS observer program in place since July 1990. Due to bycatch of strategic stocks including short-finned pilot whales, beaked whales, sperm whales and humpback whales, a Take Reduction Team was formed in 1996. Since then, the implementation of increased extender lengths and the deployment of pingers have substantially decreased cetacean entanglement. The fraction of active vessels in this fishery that are not observed owing to a lack of berthing space for observers has been increasing as larger vessels drop out of this fishery. The fishery currently operates under an emergency rule designed to reduce to the bycatch of sperm whales (Federal Register 4 September 2013, Volume 78: pages 54548-54552. Category I, Hawaii deep-set (tuna target) longline/set line fishery Note: The Hawaii-based longline fisheries of the Pelagic Fishery Ecosystem Plan (FEP) consist of two separately managed longline fisheries. One is the deep-set (tuna targeted) fishery which is classified as a Category I fishery under the MMPA. This fishery is discussed here. The classification of this fishery was elevated to Category I in 2004 based on revised PBR levels of false killer whales and observed false killer whale mortality in this fishery (Federal Register 69 FR 48407 1, 10 August 2004). The other Hawaii-based longline fishery is the Hawaii shallow-set longline (swordfish targeted) fishery which is classified as a Category II fishery under the MMPA and is discussed in the Category II section of this Appendix. Number of permit holders: The number of Hawaii longline limited access permit holders is 164. Not all such permits are renewed and used every year. Permit holders may use the permits for either deep-set or shallow-set fishing, but must notify NMFS how they will fish before each trip. Most holders of Hawaii longline limited access permits are based in, or operate out of, Hawaii. Number of active deep-set longline vessels targeting tuna: From 20057 to 201108, the number of active longline vessels based and landing in Hawaii was 124, 127, 129, and 127, 127, 122, and 129, respectively (http://www.pifsc.noaa.gov/fmsd/reports.php). Total effort: The number of trips ranged from a low of approximately 500 (in 1992) to 1,40027 in 20057. Figure 4 shows the number of fishing trips by longline vessels based and landing in Hawaii, by year and trip type, 1991-2009. The number of sets for the deep-set tuna fishery in 2007-20112005, 2006, 2007, and 2008 was 16,549, 16,397, 17,809, and 17,885, 16,810, 16,070, and 17,155 respectively. The number of hooks set in 2005, 2006, 2007, and 20082007-2011 was 33.7 million, 34.5 million, 38.8 million, and 40.1 million, 37.7 million, 37.1 million, and 40.7 millionrespectively.
270

Revised 01/15/2011 9/24/2013 Appendix 1. Description of U.S. Commercial Fisheries Geographic range: The Hawaii-based pelagic, deep-set longline fishery operates inside and outside the EEZ, primarily around the main Hawaiian Islands and Northwestern Hawaiian Islands, with some trips to the EEZs around the remote U.S. Pacific islands (however there are restricted areas, please refer to “Regulations”). Vessels vary their fishing grounds depending on their target species. Most of the deep-set fishing occurs south of 250° N. Seasons: This fishery operates year-round, although vessel activity increases during the fall and is greatest during the winter and spring months. Gear type: Deep-set longline gear typically consists of a continuous main line set on the surface and supported in the water column horizontally by floats with branch lines connected at intervals to the main line. In addition radio buoys are also used to keep track of the mainline as it drifts at sea. A line shooter is used on deep-sets to deploy the mainline faster than the speed of the vessel, thus allowing the longline gear to sink to its target depth (average target depth is 167 m, target depth for bigeye tuna is approximately 400 m). The main line is typically 30 to 100 km (18 to 60 nm) long. A minimum of 15, but typically 20 to 30, weighted branch lines (gangions) are clipped to the mainline at regular intervals between the floats. Each gangion terminates with a single baited hook. The branch lines are typically 11 to 15 meters (35 to 50 feet) long. Sanma (saury) or sardines are used for bait. Lightsticks are not typically attached to the gangions on this type of longline set. Deep-set longline gear is set in the morning and hauled in the afternoonevening and at night. Regulations: This fishery is managed under the Pelagics FEP and subject to Federal regulation. Measures that are currently applicable to the fishery include, but are not limited to, limited access (requirement for a permit), vessel and gear marking requirements, vessel length restrictions, Federal catch and effort logbooks, large longline restricted areas around the Hawaiian Archipelago, vessel monitoring system (VMS), annual protected species workshops, use of circle hooks with wire diameter not greater than 4.5mm and branch line not less than 2.0mm, and the use of sea turtle, seabird, and marine mammal handling and mitigation gear and techniques. The vessel operator must notify NMFS prior to departure whether the vessel is undertaking a deep-set or shallow-set trip. Once the trip type is set, it cannot be changed during the trip. Vessel operators must take a NMFS contracted observer if requested by NMFS – target observer coverage is 20 percent of trips. If any marine mammal interaction (hooking or entanglement) resulting in injury or mortality occurs, the vessel operator must complete and mail a pre-addressed, postage paid form to NOAA Fisheries within 48 hours of the end of the trip. Additional information on all applicable regulations for the deep-set longline fishery is available at http://www.fpir.noaa.gov/SFD/SFD_regs_2.html. This fishery is subject to the False Killer Whale Take-Reduction Team. NMFS is currently implementing the Take-Reduction Plan and associated regulations. Management type: Federal limited access program. This fishery is managed under a Fishery Ecosystem Plan (FEP) developed by the Western Pacific Fishery Management Council and NMFS. Comments: Non-target species are caught incidentally. Interactions with common bottlenose dolphins, false killer whales, humpback whales, short-finned pilot whales, pantropical spotted dolphins, Blainville’s beaked whale, sperm whales, striped dolphins and Risso’s dolphins have been documented. Longline hooks have also been recovered from Hawaiian monk seals, but these were not observed during longline fishing operations. Due to interactions with protected species, especially turtles, this fishery has been observed since February 24, 1994. Initially, observer coverage was less than 5%, increased to 10% in 2000, and equaled or exceeded 20% since in 2001, 2002, and 2003. Observer coverage was 20.1 %, 21.7%, and 20.6% in 2007, 2008, and 2009 respectively. Observed marine mammal injures and deaths inform 2007-2011 included 24 false killer whales, 14 short-finned pilot whales, 3 Risso’s dolphins, 2 common bottlenose dolphins, 1 sperm whale, 1 pantropical spotted dolphin, one striped dolphin, and 214 unidentified cetaceans. Four of the interactions were deaths, 32 were serious injuries, nine were non-serious injuries, one involved prorating a large whale interaction as 0.75 serious (NMFS, 2012), and four were classified as cannot-be-determined. Observed mortality included 1 Risso’s dolphin. Observed marine mammal injuries in 2008 included 3 false killer whales, 3 short-finned pilots whales, 1 Risso’s dolphin, 2 unidentified cetaceans, and 2 unidentified whales. Observed mortality in 2008 included 1 spotted dolphin. Observed injuries of marine mammals in 2009 included 9 false killer whales, 1 bottlenose dolphin, and 3 unidentified whales. Observed mortality of marine mammals in this fishery in 2009 included 1 false killer whale.
271

Revised 01/15/2011 9/24/2013 Appendix 1. Description of U.S. Commercial Fisheries Category II I1, CA halibut/white seabass and other species set gillnet fishery (>3.5 inch mesh). Note: This fishery has not targeted angel sharks since 1994, when regulatory changes resulted in nets being fished >3 nmi from shore in southern California. Thus, there is a proposed name change to this fishery to reflect current fishing practices. Halibut are typically targeted using 8.5 inch mesh while the remainder of the fishery targets white seabass and yellowtail using 6.5 inch mesh. In recent years, there has been an increasing number of 6.0-6.5 inch mesh sets fished using drifting methods; this component is now identified as a separate fishery (see “CA yellowtail, barracuda, white seabass, and tuna drift gillnet fishery (>3.5 and <14 in mesh)” fishery described below). Number of permit holders: There is no specific permit category for this fishery. Overall, the current number of legal permit holders for gill and trammel nets, excluding swordfish drift gillnets and herring gillnets for 2002-2006 are, 209, 193, 187, 172, and 166, respectively. were between 141 and 154 annually. Information on permit numbers is available from the California Department of Fish and Game website (http://www.dfg.ca.gov/licensing). Number of active permit holders: Based on logbook data, there were at least 62 active permit holders during the period 2002-2006. Annual participation in the fishery appears to have declined, as the number of active permit holders by individual year (43, 42, 41, 31, 28) has declined. Approximately 50 vessels participate in this fishery (NMFS List of Fisheries, Federal Register 29 August 2013). Total effort: Fishing effort in the halibut fishery has declined from over 3,200 sets in 2002 to approximately 1,400 sets in 2006. A summary of estimated fishing effort and observer coverage for the years 1990-2003 is shown in Figure 8. Effort in the white seabass and yellowtail portion of this fishery has ranged between 456 and 948 days annually for the period 2002-2006. A portion of the effort in the white seabass and yellowtail fishery utilizes drifting nets (see “CA yellowtail, barracuda, white seabass, and tuna drift gillnet fishery (>3.5 and <14 in mesh)” fishery description in the Category II fishery section below). Total fishing effort for the period 2008 to 2012 has been approximately 2,000 sets annually. Geographic range: Effort in this fishery previously ranged from the U.S./Mexico border north to Monterey Bay and was localized in more productive areas: San Ysidro, San Diego, Oceanside, Newport, San Pedro, Ventura, Santa Barbara, Morro Bay, and Monterey Bay. Fishery effort is now predominantly in the Ventura Flats area off of Ventura, the San Pedro area between Pt. Vicente and Santa Catalina Island and in the Monterey Bay area. The central California portion of the fishery from Point Arguello to Point Reyes has been closed since September 2002 when a ban on gillnets inshore of 60 fathoms took effect. Seasons: This fishery operates year round. Effort generally increases during the summer months and declines during the last three months of a year. Gear type and fishing method: Typical gear used for this fishery is a 200 fathom gillnet with a stretched mesh size of 8.5 inches. The component of this fishery that targets white seabass and yellowtail utilizes 6.5 inch mesh. The net is generally set during the day and allowed to soak for up to 2 days. Soak duration is typically 8-10, 19-24, or 44-49 hours. The depth of water ranges from 15-50 fathoms with most sets in water depths of 15-35 fathoms. Regulations: This fishery is managed by the California Dept. of Fish and Game in accordance with state and federal laws. Management type: The halibut and white seabass set-net fishery is a limited-entry fishery with gear restrictions and area closures. Comments: An observer program for the halibut and white seabass portion of this fishery operated from 1990-94 and was discontinued after area closures were implemented in 1994, which prohibited gillnets within 3 nmi of the mainland and within 1 nmi of the Channel Islands in southern California. NMFS re-established an observer program for this fishery in Monterey Bay in 1999-2000 due to a suspected increase in harbor porpoise mortality in Monterey Bay. In 1999 and 2000, fishery mortality exceeded PBR for the Monterey Bay harbor porpoise stock, which at that time, was designated as 1 Due to the closure of the fishery in central California, which has reduced the threat to stocks of harbor porpoise in this region, the draft 2009 NMFS MMPA List of Fisheries proposes to recategorize this fishery to ‘Category II’.
272

Revised 01/15/2011 9/24/2013 Appendix 1. Description of U.S. Commercial Fisheries strategic [the stock is currently non-strategic]. In the autumn of 2000, the California Department of Fish and Game implemented the first in a series of emergency area closures to set gillnets within 60 fathoms along the central California coast in response to concerns over mortality of common murres and threats to sea otters. This effectively reduced fishing effort to negligible levels in 2001 and 2002 in Monterey Bay. A ban on gill and trammel nets inside of 60 fathoms from Point Reyes to Point Arguello became effective in September 2002. Mortality Bycatch of marine mammals, including California sea lions and harbor seals, continues in the southern California portion of this fishery, as evidenced by fisher self-reports under the Marine Mammal Authorization Program (MMAP) from 2000-2005 based on limited observer data. During this time, fishermen reported mortality of 60 California sea lions, 20 harbor seals, one northern elephant seal and one unidentified common dolphin. NMFS renewed observer coverage in halibut/white seabass set gillnet fishery in 2006 and through 2007, observers recorded bycatch data from 260 sets. No cetaceans were observed entangled during this period, but there were 34 California sea lions, two harbor seals, and one unidentified pinniped observed killed. Category II, Hawaii shallow-set (swordfish target) longline/set line fishery Note: The Hawaii-based longline fisheries of the Pelagic Fishery Ecosystem Plan (FEP) consist of two separately managed longline fisheries. One is the deep-set (tuna targeted) fishery which is classified as a Category I fishery under the MMPA. The other is the Hawaii shallow-set longline (swordfish targeted) fishery which is classified as a Category II fishery under the MMPA and is discussed here. Number of permit holders: The number of Hawaii longline limited access permit holders is 164. Not all such permits are renewed and used every year. Permit holders may use the permits for either deep-set or shallow-set fishing, but must notify NMFS how they will fish before each trip. Most holders of Hawaii longline limited access permits are based in, or operate out of, Hawaii. Longline general permits are not limited by number. These general permits are open access and usable in Guam, CNMI, and the Pacific Remote Island Areas; they are usually not more than a half dozen a year. Number of active shallow-set longline vessels targeting swordfish: From 20052007 to 20082011, the number of active shallow-set longline vessels based in and landing in Hawaii was 33, 35, 28, and 27, 28, 28, and 20respectively. Total effort: The number of trips since 1991 has ranged from zero (2002-2003) to approximately 300 in 1993. Figure 4 shows the number of fishing trips by longline vessels based and landing in Hawaii, by year and trip type, 1991-201109. The number of sets for the shallow-set swordfish fishery in 2005, 2006, 2007-2011, and 2008 was 1,645, 850, 1,570, and 1,5897, 1,762, 1,833, and 1,468respectively. The number of hooks set in 2005, 2006, 2007-2011, and 2008 was 1.4 million, 0.7 million, 1.4 million, and 1.5 million, 1.7 million, 1.8 million, 1.5 millionrespectively. Geographic range: The most productive swordfishing areas for Hawaii-based longline vessels are north of Hawaii outside the U.S. Exclusive Economic Zone (EEZ) on the high seas, and this fishery operates almost entirely north of Hawaii (north of approximately 20° N). In some years, when influenced by seawater temperature, this fishery may operate mostly north of 30° N. Seasons: Shallow-set effort is highest in either the first or second quarter of the calendar year and drops off substantially in the latter half of the year. Gear type: Shallow-set longline gear typically consists of a continuous main line set on the surface and supported in the water column horizontally by floats with branch lines connected at intervals to the main line. In addition radio buoys are also used to keep track of the mainline as it drifts at sea. Longline fishing for swordfish is known as shallow-set longline fishing as the bait is set at depths of 30–90 m. The portion of the mainline with branchlines attached is suspended between floats at about 20–75 m of depth, and the branchlines hang off the mainline another 10–15 m. Only 4-6 branchlines are clipped to the mainline between floats, and a typical set for swordfish uses about 700–1,000-1,200 hooks. Shallow-set longline gear is set at night, with luminescent light sticks attached to the branchlines. Formerly, J-hooks and squid bait were used, but since 2004, circle hooks and mackerel-type bait have been required. These gear restrictions were implemented to reduce sea turtle bycatch. Regulations: This fishery is managed under the Pelagics FEP and subject to Federal regulation. Measures that are currently applicable to the fishery include, but are not limited to, limited access (requirement for a permit), vessel and gear
273

Revised 01/15/2011 9/24/2013 Appendix 1. Description of U.S. Commercial Fisheries marking requirements, vessel length restrictions, Federal catch and effort logbooks, 100-percent observer coverage, large longline restricted areas around the Hawaiian Archipelago, vessel monitoring system (VMS), annual protected species workshops, and the use of sea turtle, seabird, and marine mammal handling and mitigation gear and techniques. The vessel operator must notify NMFS prior to departure whether the vessel is undertaking a shallow-set or a deep-set trip. Once the trip type is set, the type cannot be changed during the trip. All shallow-set trips must have a NMFS contracted observer. If any marine mammal interaction (hooking or entanglement) resulting in injury or mortality occurs, the vessel operator must complete and mail a pre-addressed, postage paid form to NOAA Fisheries within 48 hours of the end of the trip. More information on all applicable regulations is available at http://www.fpir.noaa.gov/SFD/SFD_regs_2.html. This fishery is subject to the False Killer Whale Take-Reduction Team. NMFS is currently implementing the Take-Reduction Plan and associated regulations. Management type: Federal limited access program. This fishery is managed under a Fishery Ecosystem Plan (FEP) by the Western Pacific Fishery Management Council and NMFS. Comments: Non-target species are caught incidentally. Interactions with common bottlenose dolphins, false killer whales, humpback whales, short-finned pilot whales, striped dolphins, Bryde’s whales, Risso’s dolphins, sperm whales, spinner dolphins, pygmy sperm or dwarf sperm whales, Blainville’s beaked whales, and common dolphins have been documented. The shallow-set fishery was completely closed in 2001 and reopened in 2004. One hundred percent observer coverage is required in this fishery. Observed injuries of marine mammals in this fishery in October 2007-2011 through 2008 included 13 false killer whales, 321 Risso’s dolphins, 12 humpback whale, 1 pygmy or dwarf sperm whale, 13 striped dolphins, 8 common bottlenose dolphins, 1 short-beaked common dolphin, 1 Blainville’s beaked whale, and 2 unidentified beaked whales, and 2 unidentified dolphins1 unidentified whale. Three of the interactions were deaths, 31 were serious injuries, 10 were non-serious injuries, and 2 involved prorating a large whale interaction as 0.75 serious. Observed mortality for the period included 1 Risso’s dolphin. Observed injuries of marine mammals in 2009 included 1 false killer whale, 3 Risso’s dolphins, and 1 unidentified whale. No observed mortality was reported in 2009. Category II, Hawaii Shortline Fishery Note: The Hawaii shortline fishery was added to the 2010 List of Fisheries as a Category II fishery under the MMPA based on analogy with the Category I “HI deep-set (tuna-target) longline/set line” and Category II “HI shallow-set (swordfish-target) longline/set line” fisheries (Federal Register 74 FR 58859, 16 November 2009). Number of permit holders: There are no specific fishing permits issued for this fishery. However, all persons with a State of Hawaii Commercial Marine License (CML) may participate in any fishery, including the “HI shortline” fishery. Number of active shortline vessels: Of those persons possessing CMLs, shortline participation has varied between 5 and 141 vessels from 2003 - 200811. Total effort: From 2003-2008, there was an average of 135,757 pounds (lbs) of fish landed each year. In 2008 alone, 104,152 lbs of fish were landed. Geographic range: The Category II “HI shortline” fishery is a small-scale system operating off the State of HI, and targeting bigeye tuna (Thunnus obesus) or the lustrous pomfret (Eumigistes illustris). This fishery was developed to target these fish species when they concentrate over the summit of Cross Seamount, 290 km (180 mi) south of the State of HI. Seasons: This fishery has no seasonal component and may operate year-round. Gear type: The gear style is designed specifically to target the aggregating fish species over seamount structures. The primary gear type used is a horizontal main line (monofilament) less than 1 nautical mile long, and includes two baskets of approximately 50 hooks each. The gear is set before dawn and has a short soak time, with the gear retrieved about two hours after it is set. Regulations: All persons with a State of Hawaii Commercial Marine License (CML) may participate in the “HI shortline” fishery. The mainline length must be less than 1 nautical mile.
274

Revised 01/15/2011 9/24/2013 Appendix 1. Description of U.S. Commercial Fisheries Management type: Hawaii State managed fishery. Comments: Currently, there is no Federal reporting system in place to document potential marine mammal interactions in this fishery. However, there are anecdotal reports of interactions off the north side of Maui, but the species and extent of interactions are unknown. Category II, American Samoa Longline Fishery Note: The American Samoa longline fishery was added to the 2006 List of Fisheries as a Category II fishery under the MMPA based on analogy with Category I “HI deep-set (tuna-target) longline/set line” and Category II “HI shallow-set (swordfish-target) longline/set line” fisheries. Number of permit holders: Unknown. Number of active longline vessels: From 2007 to 2011, the number of active vessels was 29, 28, 26, 26, and 24. Total effort: The number of trips for 2007-2011was 377, 287, 175, 264, and 274. The number of sets for the American Samoa longline fishery in 2007-2011 was 5,910, 4,730, 4,601, 4,496, and 3,776. The number of hooks set in 2007-2011 was 17,524, 14,372, 14,207, 13,067, and 10,767. Geographic range: Waters surrounding American Samoa year-round. Seasons: Shallow-set effort is highest in either the first or second quarter of the calendar year and drops off substantially in the latter half of the year. Gear type: This fishery uses longline gear. Vessels over 50 ft (15.2 m) may set 1,500-2,500 hooks and have a greater fishing range and capacity for storing fish (8-40 metric tons). The fleet reached a peak of 66 vessels in 2001, and set a peak of almost 7,000 sets in 2002. It is more common for fishermen to set their gear in the day and haul in the afternoon, mainly to improve their catch rates. Regulations: This fishery is a limited entry fishery for pelagic longline vessels in the U.S. EEZ around American Samoa. In 2000, the fishery began to expand rapidly with the influx of large (more than 50 ft (15.2m m) overall length) conventional mono hull vessels, similar to the type used in the Hawaii-based longline fisheries. Regulations implemented in 2002 prohibit any large U.S. vessels (50 ft (15.2 m) and longer) from fishing within 50 nmi around the islands of American Samoa. In 2005, the rapid expansion of longline fishing effort within the U.S. EEZ waters around American Samoa prompted the implementation of a limited entry system. Under the limited access program, NMFS issued a total of 60 initial longline limited entry permits in 2005 to qualified candidates, spread among 4 vessel size classes: 22 permits issued in Class A (less than or equal to 40 ft (12.2 m) length); 5 in Class B (40-50 ft (12.2-15.2m)); 12 in Class C (50.1–70 ft (15.2–21.3 m)); and 21 in Class D (more than 70 ft (21.3 m)). The number of active vessels has shifted to large vessels (Class C and D), with only a couple of small vessels active in the past two years. Permits may be transferred and renewed. Under the limited entry program, vessel operators must submit federal catch and effort logbooks, vessels over 40 ft (12.2 m) must carry observers if requested by NMFS, and vessels over 50 ft (15.2 m) must have an operational vessel monitoring system (VMS). In addition, vessel owners and operators must attend a protected species workshop annually, carry and use dip nets, clippers, and bolt cutters, and follow handling, resuscitation, and release requirements for incidentally hooked or entangled sea turtles. Management type: Federal limited access program. This fishery is managed under a Fishery Ecosystem Plan (FEP) by the Western Pacific Fishery Management Council and NMFS. Comments: Non-target species are caught incidentally. Interactions with false killer whales, Risso’s dolphins, and Cuvier’s beaked whale have been documented. One hundred percent observer coverage is required in this fishery. Observed injuries of marine mammals in this fishery in 2007-2011 included 3 false killer whales, 21 Risso’s dolphins, 2 humpback whale, 1 pygmy or dwarf sperm whale, 3 striped dolphins, 8 common bottlenose dolphins, 1 short-beaked common dolphin, 1
275

Revised 01/15/2011 9/24/2013 Appendix 1. Description of U.S. Commercial Fisheries Blainville’s beaked whale, 2 unidentified beaked whales, and 2 unidentified dolphins. Three of the interactions were deaths, 31 were serious injuries, 10 were non-serious injuries, and 2 involved prorating a large whale interaction as 0.75 serious. Category II, CA yellowtail, barracuda, white seabass, and tuna drift gillnet fishery (>3.5 and <14 in mesh) Note: This fishery has developed recently as an offshoot of the “CA other species, large mesh (>3.5 in) set gillnet fishery” (see Category I fishery section above). Fishermen use the same gear as in the set gillnet fishery (typically 6.5 inch mesh nets, 100-200 fathoms in length, except that they instead utilize drifting nets to target white seabass and yellowtail. Albacore tuna and barracuda are also targeted in this fishery. Number of permit holders: There are approximately 24 active permit holders in this fishery. Total effort: From 2002-2006, there were 221, 193, 120, 184, and 175 From 2008 to 2012, there were between 207 and 271 small-mesh drift gillnet sets fished, respectively annually, as determined from California Department of Fish and Game logbook data. Geographic range: This drift gillnet component of this fishery operates primarily south of Point Conception. Observed sets have been clustered around Santa Cruz Island, the east Santa Barbara Channel, and Cortez and Tanner Banks. Some effort has also been observed around San Clemente Island and San Nicolas Island. Seasons: This fishery operates year round. Targeted species is typically determined by market demand on a short-term basis. Gear type and fishing method: Typical gear used for this fishery is a 150 to 200-fathom gillnet, which is allowed to drift. The mesh size depends on the target species but typical values observed are 6.0 and 6.5 inches. Regulations: This fishery is managed by the California Dept. of Fish and Game in accordance with State and Federal laws. Management type: This fishery is a limited-entry fishery with gear restrictions and area closures. Comments: This fishery primarily targets white seabass and yellowtail but also targets barracuda and albacore tuna. From 2002-2004, there have been 63 sets observed from 17 vessel trips. Marine mammal mortality includes two long-beaked common dolphin and 3 California sea lions. Also, 4 California sea lions were entangled and released alive during this period. In 2003, there was one coastal bottlenose dolphin stranded with 3.5-inch gillnet wrapped around its tailstock, the responsible fishery is unknown. Observer coverage in this fishery was 12% in 2002, 10% in 2003, and 17% in 2004. Category II, CA swordfish longline fishery Number of permit holders: As recently as 2004, there were 20-30 vessels participating in the fishery. Only one vessel was active in 2005. This decline in participation was due to the prohibition in shallow set swordfishing east of W150 longitude. Number of active permit holders: In January 2006, there was only one vessel participating in this fishery, which fished for tuna using deep set methods outside the U.S. EEZ. The remaining vessels from this fishery now participate in the Hawaii longline fishery. Total Effort: An estimated 1 - 1.5 million hooks were fished annually when 20-30 California-based vessels participated in the fishery. In 2005, there were only two trips fished by one vessel. Ten sets were observed in the first trip and it is unknown how many sets were made during the second trip because no observer was present. Geographic range: The fishery management plan (FMP) for highly migratory species prohibits targeting swordfish with shallow set fishing methods east of W150 longitude. In March 2006, the Pacific Fishery Management Council approved an application for an exempted fishing permit (EFP) that would allow one vessel to utilize shallow set longline methods within the U.S. EEZ, with the same shallow-set regulations used in the Hawaii fishery (circle hooks and fish bait). An
276

Revised 01/15/2011 9/24/2013 Appendix 1. Description of U.S. Commercial Fisheries environmental assessment of this proposal will be prepared by the Highly Migratory Species Management Team (HMSMT) for review at a future Council meeting. This EFP will be effective no sooner than 2007 if it receives final approval. Seasons: The fishery operates year-round. Gear type: Typically, vessels fish 24 to 72 km of mainline, rigged with 22-m gangions at approximately 60-m intervals. Anywhere from 800 to 1,300 hooks are deployed in a set, with large squid (Illex sp.) used for bait. Variously colored lightsticks are used, for fishing takes place primarily during the night when more swordfish are available in surface waters. The mainline is deployed in 4-7 hours and left to drift unattached for 7-10 hours. Retrieval typically takes about 7-10 hours. A description of the gear used for deep sets targeting tuna is given in the Hawaii longline fishery section. Regulations: Longline vessels are prohibited from operating within the 200-nmi limit, but may unload their catch in California ports and are required to have a California state commercial fishing license. Management type: The California longline fishery is managed under a Highly Migratory Species Fishery Management Plan (FMP) developed by the Pacific Fishery Management Council and NMFS. . The FMP was partially approved by NMFS on February 4, 2004. NMFS published a final rule on March 11, 2004 which prohibits shallow longline sets of the type normally targeting swordfish on the high seas in the Pacific Ocean east of 150˚ W. longitude. A mandatory observer program became effective for this fishery in August 2002. Comments: Between October 2001 and February 2004, 23 trips were observed by California-based longline observers, with 469 sets observed (<15% observer coverage). Between October 2001 and November 2003 the longline observer program reported one injured Risso’s dolphin and one unidentified dolphin killed. Examination of photographs of the dead dolphin led marine mammal identification experts to conclude that the animal was most likely a striped dolphin. Category II, California Anchovy, Mackerel, and Sardine Purse Seine Fishery. 2 Number of permit holders: There are 63 limited-entry permits (Pacific Fishery Management Council. 2005. Status of the Pacific Coast coastal pelagic species fishery and recommended acceptable biological catches. Stock Assessment and Fishery Evaluation Report 2005). Number of active permit holders: There are 61 vessels actively fishing. Total effort: The fishery is managed under a capacity goal, with gross tonnage of vessels used as a proxy for fishing capacity. Capacity for the fleet is approximately 5,400 gross tons. Harvest guidelines for sardine and mackerel are also set annually. Geographic range: These fisheries occur along the coast of California predominantly from San Pedro, including the Channel Islands, north to San Francisco. Seasons: This fishery operates year round. Targeted species vary seasonally with availability and market demand. Gear type and fishing method: Purse seine, drum seine and lampara nets utilizing standard seining techniques. Regulations: This is a limited-entry fishery. Management type: The fishery is managed under a Coastal Pelagic Species Fisheries Management Plan developed by the Pacific Fishery Management Council and NMFS.
2 Information for this fishery came from the following sources: Pacific Fishery Management Council. 2005. Status of the Pacific Coast coastal pelagic species fishery and recommended acceptable biological catches. Stock assessment and fishery evaluation – 2005; California Coastal Pelagic Species Pilot Observer Program Informational Report 12 October 2005 (NMFS SW Region, unpublished); Lyle Enriquez NMFS Southwest Regional Office (personal communication) and the Marine Mammal Authorization Program, Registration and Reporting System. This fishery was formerly known as the “CA anchovy, mackerel, and tuna purse seine fishery” and was renamed in the NMFS MMPA List of Fisheries for 2007 (Federal Register Volume 72, No. 59, 14466). The “tuna” component of this fishery was designated as a separate fishery in the 2007 List of Fisheries and is named the “CA tuna purse seine fishery” (see fishery description below).
277

Revised 01/15/2011 9/24/2013 Appendix 1. Description of U.S. Commercial Fisheries A NMFS pilot observer program began in July 2004 and continued through January 2006. A total of 93 sets have been observed. Observed marine mammal interactions with the fishery have included one California sea lion killed, 54 sea lions released alive, and one sea otter released alive. Under the MMAP self-reporting program, the following mortality was reported: In 2003, four California sea lions drowned after chewing through a bait barge net used by the anchovy lampara net fishery. Category II, California tuna purse seine fishery. Note: This fishery was previously included in the CA anchovy, mackerel, and sardine purse seine fishery (see above). Vessels in the anchovy, mackerel, and sardine fishery target tuna when oceanographic conditions result in an influx of tuna into southern California waters. Data for this fishery were obtained from the ‘Status of the U.S. West Coast Fisheries for Highly Migratory Species through 2004’, available at the Pacific Fishery Management Council website (http://www.pcouncil.org). Number of permit holders: There are 63 limited-entry permits (Pacific Fishery Management Council. 2005. Status of the Pacific Coast coastal pelagic species fishery and recommended acceptable biological catches. Stock Assessment and Fishery Evaluation Report 2005). Number of active permit holders: Between one and 23 vessels actively purse seined for tunas during the period 2000-2004. Total effort: The number of vessels landing bluefin, yellowfin, skipjack, and albacore in 2000-2004 varied between one and 23. Logbooks are not required for this fishery, and the overall number of sets fished is unknown. Geographic range: Observed sets in this fishery have occurred in the southern California Bight. Seasons: Observed sets occurred in August and September. The timing of fishing effort varies with the availability of tuna species in this region. Gear type and fishing method: Small coastal purse seine vessels with a <640 mt carrying capacity target bluefin, yellowfin, albacore and skipjack tuna during warm-water periods in southern California. Regulations: This is a limited-entry fishery. Management type: This fishery is managed under a Highly Migratory Species Management Plan developed by the Pacific Fishery Management Council and NMFS. Comments: A pilot observer program for this fishery began in July 2004 and ended in January 2006. A total of 9 trips and 15 sets were observed with no marine mammal interactions. Category II, WA Puget Sound Region salmon drift gillnet fishery. Number of permit holders: This commercial fishery includes all inland waters south of the US-Canada border and east of the Bonilla/Tatoosh line, at the entrance to the Strait of Juan de Fuca. Treaty Indian salmon gillnet fishing is not included in this commercial fishery. In 1999, the U.S. and Canada reached an agreement that significantly reduced the U.S. share of sockeye salmon. In order to compensate the non-treaty U.S. fishermen for the impact of this reduction, a federally funded buyback program was established. By the 2001 fishing season, the number of available drift gillnet permits had been reduced from 675 (1999) to 216. The intent of the buyback program was to reduce the number of drift gillnet permits to 200 (pers. comm., David Cantillon, NMFS, Northwest Region). The number of permit holders is reported to be 210 in the NMFS 2013 List of Fisheries (Federal Register 29 August 2013). Number of active permit holders: Under the cooperative program that integrates issuance of Marine Mammal Authorization Certificates into the existing State license process, NMFS receives data on vessels that have completed the licensing process and are eligible to fish. These vessels are a subset of the total permits extant (725 in 2001), and the
278

Revised 01/15/2011 9/24/2013 Appendix 1. Description of U.S. Commercial Fisheries remainder of the permits are inactive and do not participate in the fishery during a given year. The number of "active" permits is assumed to be equal to or less than the number of permits that are eligible to fish. From 1997-2001, the number of active permits was 633, 559, 199, 248, and 182, respectively. Total effort: Effort in the Puget Sound salmon drift gillnet fishery is regulated by systematic openings and closures that are specific to area and target salmon species. Since 1994, the number of active vessels in the Puget Sound drift gillnet fishery has declined. In addition, at least one major portion of the fishery, the previously observed sockeye fishery in areas 7 and 7A, has experienced reductions in available fishing time (openings). The number of days and total number of hours that the sockeye fishery remained open, approached the 1994 level only once (1997) in the period from 1995 through 1998. In the remaining years the available sockeye fishing time was less than half of the 1994 level. In recent years, poor sockeye returns and market conditions have combined to reduce participation in the fishery beyond the reductions created originally by the federal buyback program. In 2001, drift gillnets fished for only one opening, and 182 gear units were fished in all areas as compared to the 559 cited for 1998. Owing to the buyback program and reduced salmon runs, it is expected that the number of active permits will remain low. Geographic Range: The fishery occurs in the inland marine waters south of the U.S./Canada border and east of the Bonilla/Tatoosh line at the entrance to the Strait of Juan de Fuca. The inland waters are divided into smaller statistical catch areas which are regulated independently. Seasons: This fishery has multiple seasons throughout the year that vary among local areas dependent on local salmon runs. The seasons are managed to access harvestable surplus of robust stocks of salmon while minimizing impacts on weak stocks. Gear type and fishing methods: Vessels operating in this fishery use a drift gillnet of single web construction, not exceeding 300 fathoms in length. Minimum mesh size for gillnet gear varies by target species. Fishing directed at sockeye and pink salmon are limited to gillnet gear with a 5-inch minimum mesh and a 6 inch maximum, with an additional "bird mesh" requirement that the first 20 meshes below the corkline be constructed of 5-inch opaque white mesh for visibility; the chinook season has a 7-inch minimum mesh; the coho season has a 5-inch minimum mesh; and the chum season has a 6- to 6.25-inch minimum mesh. The depth of gillnets can vary depending upon the fishery and the area fished. Normally they range from 180 to 220 meshes in depth, with 180 meshes as a common depth. It is the intention of the fisher to keep the net off the bottom. The vessel is attached to one end of the net and drifts with the net. The entire net is periodically retrieved onto the vessel and catch is removed. Drift times vary depending on fishing area, tidal condition and catch. Regulations: The fishery is a limited-entry fishery with seasonal openings, area closures, and gear restrictions. Management type: The fishery occurs in State waters and is managed by the Washington Department of Fish and Wildlife consistent with the U.S.-Canada Pacific Salmon Commission management regimes and the ocean salmon management objectives of the Pacific Fishery Management Council. U.S. and Canadian Fraser River sockeye and pink salmon fisheries are managed by the bilateral Fraser Panel in Panel Area waters. This includes the entire U.S. drift gillnet fishery for Fraser sockeye and pink salmon. For U.S. fisheries, Fraser Panel Orders are given effect by federal regulations that consist of In-season Orders issued by the NMFS Regional Administrator of the NMFS Northwest Region. These regulations are filed in the Federal Register post-season. Comments: In 1993, observers were placed onboard vessels in a pilot program to monitor seabird and marine mammal interactions with fishing effort for several target salmon species in a number of areas throughout the Puget Sound region. In 1994 observer effort was concentrated in the sockeye fishery in areas 7 and 7A, where interactions with seabirds and marine mammals were most likely to occur. Incidental takes of harbor porpoise, Dall’s porpoise and harbor seals have been documented in the fishery. The overall take of marine mammals for the salmon drift gillnet fisheries in Puget Sound is unlikely to have increased since the fisheries were last observed, owing to reductions in the number of participating vessels and available fishing time. Salmon drift gillnet fisheries in Washington inland waters were last observed in 1993 and 1994, with observer coverage levels typically less than 10% (Erstad et al. 1996, Pierce et al. 1994, Pierce et al. 1996, NWIFC 1995). Fishing effort in the inland waters drift gillnet fishery has declined considerably since 1994 because far fewer vessels participate today (NMFS NW Region, unpublished data). Past marine mammal entanglements in this fishery included harbor porpoise, Dall’s porpoise, and harbor seals.
279

Revised 01/15/2011 9/24/2013 Appendix 1. Description of U.S. Commercial Fisheries Category II, OR swordfish surface longline fishery. Number of permit holders: The number of permits issued annually from 2000-2005 has ranged between one and seven (pers. comm., Jean McCrae, Oregon Department of Fish and Wildlife, Marine Resources Program). Number of active permit holders: Based on landings of swordfish with this gear type, there were no active permit holders in this fishery from 2000-2005. Total effort: From 2000-2005, there were no reported swordfish landings using longline gear. Geographic range: The Fishery Management Plan prohibits targeting highly migratory species such as swordfish with longlines within the U.S. EEZ, thus any fishing would have to occur outside the EEZ. However, shallow set methods used for swordfish are also prohibited east of W150 longitude. Seasons: This fishery could occur year-round, however, effort would generally terminate by late fall. Gear type: Fishing gear consists of a buoyed mainline fitted with leaders and baited hooks. The mainline is fished near the surface suspended from buoys (rather than anchored to the bottom as in groundfish longline fisheries). Swordfish longlines may not exceed 1000 fathoms in length and must be attached at one end to the vessel when fishing. The gear is typically set in the evening and retrieved in the morning. Regulations: The fishery is a limited-entry fishery with gear and bycatch restrictions. Management type: The fishery is managed under a Highly Migratory Species Fisheries Management Plan developed by the Pacific Fishery Management Council and NMFS. Category II, OR blue shark surface longline fishery. Number of permit holders: The number of Oregon Developmental Fishery Permits for fishing blue shark using a floating longline is limited to 10. From 2000-2005, there were fewer than 5 permits issued annually for this fishery (pers. comm., Jean McCrae, Oregon Department of Fish and Wildlife, Marine Resources Program). Number of active permit holders: There were no active permits in the blue shark longline fishery off Oregon from 2000-2005. The effort in this fishery prior to 1998 was estimated to be low based on the number of permits issued and very limited landings. Total effort: From 2000-2005, there were no reported landings of blue sharks using longline gear. Geographic range: This fishery occurs off the coast of Oregon. The Fishery Management Plan prohibits targeting highly migratory species such as blue sharks with longlines within the U.S. EEZ, thus any fishing would have to occur outside the EEZ. Seasons: This fishery occurs year-round, however, effort in this fishery generally terminates by late fall. Gear type: Fishing gear consists of a buoyed mainline fitted with leaders and baited hooks. The mainline is fished near the surface suspended from buoys (rather than anchored to the bottom as in groundfish longline fisheries). Shark longlines must be marked at each terminal surface end with a pole and flag, an operating light, a radar reflector, and a buoy showing clear identification and gear owner. The gear is typically set in the evening and retrieved in the morning. Regulations: The fishery is a limited-entry fishery with gear and bycatch restrictions. Management type: The fishery is managed under a Highly Migratory Species Fisheries Management Plan developed by the Pacific Fishery Management Council and NMFS.
280

Revised 01/15/2011 9/24/2013 Appendix 1. Description of U.S. Commercial Fisheries Category II, CA squid purse seine fishery.3 Number of Permit Holders: A permit has been required to participate in the squid fishery since April 1998. Originally, only two types of permits were issued, either a vessel or light boat permit during the moratorium period from 1998 to 2004. Since the adoption of the Market Squid Fishery Management Plan (MSFMP) in 2005, a total of seven different permit types are now allowed under the restricted access program. Permit types include both transferable and non-transferable vessel, brail and light boat permits whose qualifying criteria are based on historical participation in the fishery during the moratorium period. Market squid vessel and brail permits allow a vessel to use lights to attract and capture squid using either purse seines or brail gear. Light boat owner permits only allow the use of attracting lights to attract and aggregate squid. In addition, three experimental non-transferable permits are allowed for vessel fishing outside of historical fishing areas north of San Francisco. In the 2006/2007 season there were 91 vessel permits, 14 brail permits, 64 light boat permits and 3 experimental permits issued. A permit is not required when fishing for live bait or when landing two short tons or less, which is considered incidental. Number of Active Permit Holders: The number of active permits varies by year depending on market conditions and availability of squid. During the 2006/2007 season (1 April 2006 – 31 March 2007) there were approximately 84 vessels active during some portion of the year. Twenty-nine vessels harvested 86% of the total landings greater than two tons. The 1999/2000 season had the highest squid landings to date (115,437mt), with 132 vessels making squid landings. Total Effort: Logbooks have been mandatory for the squid fishery since May 2000. Results for the 2006 calendar year indicate that each hour of fishing required 1.4 hours of search time by light boats. Combined searching and fishing effort resulted in 6.9 metric tons (mt) of catch per hour. In the 2006/2007 season, the fishery made 1,611 landings. This is a 47% decrease from the previous season. In addition, the average landing decreased from 23.9 mt to 21.7 mt. Geographic Range: Since the 1960’s there have been two distinct fisheries in operation north and south of Point Conception. Since the mid-1980’s the majority of the squid fishing harvest has occurred in the southern fishery, with efforts focused around the Channel Islands and along the mainland from Port Hueneme to La Jolla. In the 2006/2007 season, the southern fishery landed 98% of the catch with the majority of landings occurring around the northern Channel Islands. In contrast, during the 2005/2006 season, landings in the southern fishery were primarily around Catalina Island. The northern fishery, centered primarily in Monterey Bay, has been in operation since the mid-1860’s and has historical significance to California. During the 2002/2003 season, a moderate El Niño condition resulted in nearly 60% of the catch being landed in northern California. Seasons: The fishery can occur year-round; however, fishing efforts differ north and south of Point Conception. Typically, the northern fishery operates from April through September while the southern fishery is most active from October through March. El Niño conditions generally hamper the fishery in the southern fishery and squid landings are minimal during these events. In contrast, landings in the northern fishery often increase during El Niño events and then are depressed for several years after. Gear Type: There are several gears employed in this fishery. From 1996 to 2006, the vast majority (95%) of vessels use either purse (69%) or drum (26%) seine nets. Other types of nets used include brail (5%) and lampara nets (<1%). Another gear type associated with the fishery is attracting lights (30,000 watts maximum) that are used to attract and aggregate spawning squid in shallow waters. Regulations: Since March 2005, the fishery operates under a restricted access program that requires all vessels to be permitted. A mandatory logbook program for fishing and lighting vessels has been in place since May 2000. A /monitoring program has been in place since 2000 that samples the landings is designed to evaluate the impact of the fishery on the resource. Attracting lights were regulated with each vessel restricted to no more than 30,000 watts of light during fishing activities. These lights must also be shielded and oriented directly downward to reduce light scatter. The lighting restrictions were enacted to avoid risks to nesting brown pelicans and interactions with other seabird species of 3This fishery description was provided by Dianna Porzio and Dale Sweetnam, California Department of Fish and Game. Details of marine mammal interactions with this fishery were obtained from NOAA Fisheries, Southwest Regional Office.
281

Revised 01/15/2011 9/24/2013 Appendix 1. Description of U.S. Commercial Fisheries concern. A seabird closure area restricting the use of attracting lights for commercial purposes in any waters of the Gulf of the Farallones National Marine Sanctuary was enacted. A seasonal catch limitation of 107,047 mt (118,000 short tons) was established to limit further expansion of the fishery. Commercial squid fishing is prohibited between noon on Friday and noon on Sunday of each week to allow an uninterrupted consecutive two-day period of spawning. Additional closure areas to the fishery to protect squid spawning habitat include the Channel Islands Marine Protected Areas (MPAs) and the newly established MPAs along the central California coast as well as areas closed to the use of purse seine gear including the leeward side of Catalina Island, Carmel and Santa Monica Bays. Management Type: The market squid fishery is under California State management. The fishery was largely unregulated until 1998 when it came under regulatory control of the California Fish and Game Commission and the Department of Fish and Game. The MSFMP was enacted on March 28, 2005. The MSFMP was developed to ensure sustainable long-term conservation and to be responsive to environmental and socioeconomic changes. Market squid is also considered a monitored species under the Pacific Fishery Management Council’s (PFMC) Coastal Pelagic Species Fishery Management Plan. Comments: During the 1980’s, California’s squid fishery grew rapidly in fleet size and landings when international demand for squid increased due to declining fisheries in other parts of the world. In 1997 industry-sponsored legislation halted the growth of fleet size with a moratorium on new permits. Landing records were set several times during the 1990’s, but landings seem to fluctuate with changing environmental and atmospheric conditions of the California Current. Encounters with marine mammals and sea birds are documented in logbooks. Seal bombs are used regularly, but fishermen report that they no longer have an effect. A pilot observer program began in July 2004 and has documented one unidentified common dolphin death in 135 sets through January 2006. In addition, there have been 96 California sea lions and three harbor seals released alive (NMFS, Southwest Region, unpublished data). In addition to the observed death, there were three strandings of Risso’s dolphin from 2002-2003 where evidence of gunshot wounds was confirmed, suggesting interaction with this fishery (NMFS Southwest Regional Office, unpublished data). The squid fishery operates primarily at night and targets spawning aggregations of adult squid. In recent years the amount of daylight fishing has increased, especially in Monterey, in part due to better sonar gear, but also to reduce interactions with California sea lions. The PFMC adopted the egg escapement method to monitor the impact of market squid fishery since no reliable biomass estimate has been developed. It is a proxy for Maximum Sustainable Yield (MSY), setting an egg escapement threshold level at which to evaluate the magnitude of fishing mortality on the spawning potential of the squid stock. The egg escapement method was developed on conventional spawning biomass “per-recruit” theory. In general, the MSY Control Rule for market squid is based on evaluating levels of egg escapement associated with the exploited population. The egg escapement threshold, initially set at 30%, represents a biological reference point from which to evaluate fishery related impacts. Category III, CA Dungeness crab pot Notes: NMFS is reviewing several pot and trap fisheries along the U.S. west coast, in response to entanglements of humpback whales in pot and trap gear. An update on these fisheries will appear in the MMPA Proposed List of Fisheries for 2009. For all commercial pot and trap fisheries in California, a general trap permit is required, in addition to any specific permits required for an individual fishery. All traps are required to be tended and serviced at least every 96 hours, weather permitting. Descriptions of those pot and/or trap fisheries for which interactions with marine mammals have been documented or suspected are included in this Appendix. Number of permit holders: The Dungeness crab fishery is a limited access fishery requiring a vessel-based permit that is transferable. This program was initiated in 1994 based on landing histories. The number of vessels participating on an annual basis does vary, but approximately 400 vessels have been landing crab in recent years. Number of active permit holders: Approximately 400 vessels have been landing crabs in recent years. Total effort: There is no restriction on the number of traps that may be fished at one time by a single vessel. Some vessels use as many as 1000 or more traps at the peak of the season (December/January). Geographic range: This fishery operates in central and northern California.
282

Revised 01/15/2011 9/24/2013 Appendix 1. Description of U.S. Commercial Fisheries Seasons: The fishery is divided into two management areas. The central region (south of the Mendocino-Sonoma county line) fishery opens November 15 and continues through June 30. The northern region (north of the Mendocino-Sonoma county line) is annually scheduled to open on December 1, but may be delayed by CDF&G based on the condition of market size crabs, and continues until July 15. Gear type: For each trap fished there is one vertical line in the water, though only in the northern region, is fishing strings illegal. All traps are required to be marked with buoys bearing the commercial fishing license number. The normal operating depth for Dungeness crab is between 35 and 70 m. Traps are typically tended on a daily basis. Regulations: There is no daily logbook requirement for the commercial Dungeness crab fishery. There is a recreation fishery for Dungeness crab, which allows for 10 crab per day to be harvested except when fishing on a commercial passenger fishing vessel (CPFV) in central California, the limit is 6 crab per person. There is no reliable estimate for the effort or landings in the sport fishery except that CPFVs are required to track catch and effort by species. Management type: The Dungeness crab pot fishery is managed by the California legislature, CDF&G and also by the tri-state committee for Dungeness, which includes the states of Oregon and Washington. Comments: Humpback whale entanglements with Dungeness crab gear have not been confirmed, but are suspected as the responsible fishery based on the location and timing of fishing effort and observed humpback entanglements. Category III, OR Dungeness crab pot Notes: Dungeness crab is the most significant pot/trap fishery in the state of Oregon. Over the long term, the fishery has averaged around 10 million lb of landings per year; although since 2003, annual landings have been approximately 25 to 30 million lb. This fishery requires an Oregon issued limited-entry permit, which is transferable. Number of permit holders: There were 433 permit holders in 2006. Number of active permit holders: A total of 364 vessels landed crabs in 2006. Total effort: In 2006, the fishery made a transition to a three-tiered pot limitation program which allows a maximum of 200, 300, or 500 pots to be fished at any one time depending on previous landing history. The pot limitation is implemented through a buoy tag requirement. All Dungeness crab pots require buoy tags with the identifying associated permit attached. The expected result of the buoy tags and tier limits is to reduce the number of pots in Oregon waters down from 200,000 to approximately 150,000. Geographic range: Oregon waters. Seasons: The Dungeness crab season runs from December 1 to August 14. The highest landings are always recorded in December through February, at the beginning of the season. Gear type: Pots. Regulations: All Oregon pot/trap gear must be marked on its terminal ends with pole and flag, light, radar reflector, and buoy with the owner/operator number clearly marked. By law, gear may not be left unattended for more than seven days. All vessel operators and deck hands must have a commercial fishing license or crewmembers license. Management type: State management, Oregon Department of Fish and Wildlife. Comments: Humpback whale entanglements with Dungeness crab gear have not been confirmed, but are suspected as the responsible fishery based on the location and timing of fishing effort and observed humpback entanglements. Category III, CA spot prawn fishery
283

Revised 01/15/2011 9/24/2013 Appendix 1. Description of U.S. Commercial Fisheries Number of permit holders: A three-tiered limited access permit system is used in this fishery to accommodate changes in the fishery that occurred when trawling methods were banned and replaced with trap fishing in 2003. Permits are linked to the vessel owner and only Tier 1 permits are transferable. Tier 1 permits allow a maximum of 500 traps in use at a time. Eighteen vessels had Tier 1 permits in 2007. Tier 2 permits allow 150 traps in use at a time. There were three vessels utilizing Tier 2 permits in 2007. Tier 3 permits were issued to allow vessels that previously used trawl gear to switch to trap gear to target spot prawn. There were nine Tier 3 permits issued in 2007. Information on 2007 license statistics was obtained from the CA Department of Fish and Game website, http://www.dfg.ca.gov/licensing/statistics/statistics.html. Number of active permit holders: A total of 30 vessels participated in this fishery in 2007. Total effort: Landings have increased every year since 2003. The total number of traps set is unknown, although the theoretical maximum number of traps that may be fished annually is approximately 13,000. Geographic range: The fishery operates from Monterey south. Over half of the landings are made in Los Angeles and San Diego. Traps are typically set in waters of 182 m (100 fathoms) or more. South of Point Arguello, traps must be fished in waters 91 m (50 fathoms) or deeper. Seasons: North of Point Arguello, the fishery is open from February 1 to October 30. North of Point Arguello, the open season is August 1 to April 30. Gear type: Strings of 25 to 50 traps are fished in deep waters (>182 m). Regulations: For all commercial pot and trap fisheries in California, a general trap permit is required, in addition to any specific permits required for an individual fishery. All traps are required to be tended and serviced at least every 96 hours, weather permitting. There is a daily logbook requirement in this fishery. There is no buoy marking requirement and no recreational fishery for this species. Management type: This fishery is managed under state authority by the California Department of Fish and Game. Comments: One humpback whale was seriously injured in 2006 as a result of entanglement in spot prawn trap gear. Category III, WA/OR/CA sablefish pot Notes: Sablefish is likely the most commonly targeted groundfish caught in pot gear in off the U.S. west coast. Number of permit holders: There are 32 limited-entry permits (LEPs) to catch sablefish with pot gear. Open access privileges are also available to fishermen. Number of active permit holders: Including all vessels which made landings with an LEP or under open access rules, a total of about 150 vessels participated in this fishery in 2007. This total fluctuates on an annual basis. Total effort: Estimated annual landings indicate usually over 1 million lbs of sablefish are landed per year in this fishery. Geographic range: The fishery is well distributed from central California north to the U.S./Canadian border. Most of the effort occurs out in deeper waters (200-400 m). Seasons: Most fishing effort occurs January through September. Gear type: Traps <6 ft. in any dimension. Regulations: A general trap permit is all that is required for open access to this fishery by the states along the U.S. west coast. LEPs are divided into a three-tiered system which allocates annual landing limits to individual permits based on the status of the stock. Daily logbook reporting is required. Management type: Sablefish is managed under the federal Groundfish Fishery Management Plan. This is the only trap fishery regulated by the federal government; all others are managed by the states.
284

Revised 01/15/2011 9/24/2013 Appendix 1. Description of U.S. Commercial Fisheries Comments: One humpback whale was seriously injured in 2006 as a result of entanglement in sablefish trap gear. Category III, CA rock crab Number of permit holders: There were 134 permits issued in 2007. Number of active permit holders: Unknown, but it is likely that most issued permits are active. Total effort: Annual landings averaged approximately 1 million pounds from 2000 to 2005. Geographic range: The fishery operates throughout California waters. Most landings are made south of Morro Bay, California, with approximately 65% of all landings coming from the Santa Barbara area. Seasons: There are no seasonal restrictions, though some area closures exist. Gear type: There is no restriction on the number of traps that may be fished at one time by the vessel but the typical number of traps operated at any given time is less than 200. Traps are usually buoyed singularly or in pairs, but fishing strings (multiple traps attached together between two buoys) is allowed. Buoys are required to be marked with the license number of the operator. The normal working depth of traps in this fishery is 10 to 35 fathoms. Regulations: There is no daily logbook requirement for the commercial rock crab fishery. Management type: The fishery is managed by the California Department of Fish and Game. Comments: The recreational bag limit is 35 crabs per day, but there is no reliable estimate of the effort or landings in the sport fishery. Category III, CA halibut bottom trawl. Notes: This is a newly-listed fishery in the 2007 MMPA NMFS List of Fisheries (Federal Register Volume 72, No. 59, 14466). Information on fishing effort was provided by Stephen Wertz, California Department of Fish and Game. Number of permit holders: There were 60 permits issued in 2006. Number of active permit holders: There were 31 active permit holders in 2006. Total effort: Thirty one vessels made 3,711 tows statewide in 2006, totaling 3,897 tow hours, in 332 days of fishing effort. Geographic range: The fishery operates from Bodega Bay in northern California to San Diego in southern California, from 3 to 200 nautical miles offshore. Trawling is prohibited in state waters (0 to 3 nmi offshore) and within the entire Monterey Bay, except in the designated “California halibut trawl grounds”, between Point Arguello and Point Mugu beyond 1 nautical mile from shore. Trawls used in this region must have a minimum mesh size of 7.5 in and trawling is prohibited here between 15 March and 15 June to protect spawning adults. Seasons: Fishing is permitted year-round, except in state waters. State waters are closed between 15 March and 15 June. Gear type: Otter trawls, with a minimum mesh size of 4.5 inches are required in federal waters, while fishing in state waters has a 7.5 inch mesh size requirement. Regulations: Fishing in state waters is limited to the period 14 March – 16 June in the ‘California halibut trawl grounds’ in southern California between Point Arguello and Point Mugu. All other fishing must occur in federal waters beyond 3 nautical miles from shore.
285

Revised 01/15/2011 9/24/2013 Appendix 1. Description of U.S. Commercial Fisheries Management type: The fishery is managed by the California Department of Fish and Game. Comments: No marine mammal interactions have been documented for this fishery, but the gear type and fishing methods are similar to the WA/OR/CA groundfish trawl fishery (also category III), which is known to interact with marine mammals. Category III, CA herring gillnet fishery.4 The herring fishery is concentrated in four spawning areas which are managed separately by the California Department of Fish and Game (CDFG); catch quotas are based on population estimates derived from acoustic and spawning-ground surveys. The largest spawning aggregations occur in San Francisco Bay and produces more than 90% of the herring catch. Smaller spawning aggregations are fished in Tomales Bay, Humboldt Bay, and Crescent City Harbor. During the early 1990's, there were 26 round haul permits (either purse seine or lampara nets). Between 1993 and 1998, all purse seine fishers converted their gear to gillnets with stretched mesh size less than 2.5 inches (which are not known to take mammals) as part of CDFG efforts to protect herring resources. The fishery is managed through a limited-entry program. The California Department of Fish and Game website lists a total of 447 herring gillnet permits for 2005 (http://www.dfg.ca.gov/mrd/herring/index.html). Of these, 406 permits exist for San Francisco Bay, 34 in Tomales Bay, 4 in Humboldt Bay, and 3 in Crescent City Harbor. This fishery begins in December (San Francisco Bay) or January (northern California) and ends when the quotas have been reached, but no later than mid-March. Category III, WA Willapa Bay salmon drift gillnet fishery. Number of permit holders: The total number of permit holders for this fishery in 1995 and 1996 was 300, but this number has declined in subsequent years. In 1997 there were 264 total permits and 243 in 1998. The NMFS 2001 List of Fisheries lists an estimate of 82 vessels/persons in this fishery. Number of active permit holders: The number of active permit holders is assumed to be equal to or less than the number of permits eligible to fish in a given year. The number of permits renewed and eligible to fish in 1996 was 300 but declined to 224 in 1997 and 196 permits were renewed for 1998. The 1996-98 counts do not include permits held on waivers for those years, but do include permits that were eligible to fish at some point during the year and subsequently entered into a buyback program. The number of permits issued for this fishery has been reduced through a combination of State and federal permit buyback programs. Vessels permitted to fish in the Willapa Bay are also permitted to fish in the lower Columbia River drift gillnet fishery. Total effort: Effort in this fishery is regulated through area and species openings. The fishery was observed in 1992 and 1993 when fishery opening were greater than in recent years. In 1992 and 1993 there were 42 and 19 days of open fishing time during the summer "dip-in" fishery. The "dip-in" fishery was closed in 1994 through 1999. Available openings have also declined in the fall chinook/coho fisheries. In 1992/93 respectively there were 44 and 78 days of available fishing time. There were 43, 45, 22 and 16.5 available open fishing days during 1995 through 1998. Geographic range: This fishery includes all inland marine waters of Willapa Bay. The waters of the Bay are further divided into smaller statistical catch areas. Seasons: Seasonal openings coincide with local salmon run timing and fish abundance. Gear type: Fishing gear used in this fishery is a drift gillnet of single web construction, not exceeding 250 fathoms in length, with a minimum stretched mesh size ranging upward from 5 inches depending on target salmon species. The gear is commonly set during periods of low and high slack tides. It is the intention of the fisher to keep the net off the bottom. The vessel is attached to one end of the net and drifts with the net. The entire net is periodically retrieved onto the vessel and catch is removed. Drift times vary depending on fishing area, tidal condition, and catch. Regulations: This fishery is a limited-entry fishery with seasonal openings and gear restrictions. 4 Pers. Comm. Becky Ota, State Herring Manager, Senior Biologist.
286

Revised 01/15/2011 9/24/2013 Appendix 1. Description of U.S. Commercial Fisheries Management type: The salmon drift gillnet fishery is managed by the Washington Department of Fish and Wildlife. Comments: Observers were placed onboard vessels in this fishery to monitor marine mammal interactions in the early 1980s and in 1990-93. Five incidentally taken harbor seals were recovered by observers in the fishery from 1991through 1993 (3 in ‘92 and 2 in ‘93). Two incidentally taken northern elephant seals were recovered by observers from the fishery in 1991 but no takes of this species were observed. The summer fishery (July- August) in Willapa Bay has been closed since it was last observed in 1993 and available fishing time declined from 1996 through 1998. Category III, WA Grays Harbor salmon drift gillnet fishery. Number of permit holders: This commercial drift gillnet fishery does not include Treaty Indian salmon gillnet fishing. The total number of permit holders for this commercial fishery in 1995 and 1996 was 117 but this number has declined in subsequent years. In 1997 there were 101 total permits and 87 in 1998. Number of active permit holders: The NMFS 2001 List of Fisheries lists a total of 24 vessels/persons operating in this fishery. The number of active permit holders is assumed to be equal to or less than the number of permits eligible to fish in a given year. The number of permits renewed and eligible to fish in 1996 was 117 but declined to 79 in 1997 and 59 permits were renewed for 1998. The 1996-98 counts do not include permits held on waivers for those years but do include permits that were eligible to fish at some point during the year and subsequently entered a buyback program. The number of permits issued for this fishery has been reduced through a combination of State and federal permit buyback programs. Vessels permitted to fish in Grays Harbor are also permitted to fish in the lower Columbia River salmon drift gillnet fishery. Total effort: Effort in this fishery is regulated through area and species openings. The fishery was observed in 1992 and 1993 when fishery openings were greater than in recent years. In 1992 and 1993 there were 42 and 19 days of open fishing time during the summer "dip-in" fishery. The "dip-in" fishery was closed in 1994 through 1999. Available openings have also declined in the fall chinook/coho fisheries. There were 11, 17.5, 9 and 5 available open fishing days during the 1995 through 1998 fall season. Geographic range: Effort in this fishery includes all marine waters of Grays Harbor. The waters are further divided into smaller statistical catch areas. Seasons: This fishery is subject to seasonal openings which coincide with local salmon run timing and fish abundance. Gear type: Fishing gear used in this fishery is a drift gillnet of single web construction, not exceeding 250 fathoms in length, with a minimum stretched mesh size ranging of 5 inches depending on target salmon species. The gear is commonly set during periods of low and high slack tides and retrieved periodically by the tending vessel. It is the intention of the fisher to keep the net off the bottom. The vessel is attached to one end of the net and drifts with the net. The entire net is periodically retrieved onto the vessel and catch is removed. Drift times vary depending on fishing area, tidal condition, and catch. Regulations: The fishery is a limited-entry fishery with seasonal openings and gear restrictions. Management type: The salmon drift gillnet fishery is managed by the Washington Department of Fish and Wildlife. Comments: Observers were placed onboard vessels in this fishery to monitor marine mammal interactions in the early 1980s and in 1990-93. Incidental take of harbor seals was observed during the fishery in 1992 and 1993. In 1992, one harbor seal was observed entangled dead during the summer fishery and one additional seal was observed entangled during the fall fishery but it escaped uninjured. In 1993, one harbor seal was observed entangled dead and one additional seal was recovered by observers during the summer fishery. The summer fishery (July-August) in Grays Harbor has been closed since it was last observed in 1993. Available fishing time in the fall chinook fisheries declined from 1996 through 1998. Category III, WA, OR lower Columbia River salmon drift gillnet fishery.
287

Revised 01/15/2011 9/24/2013 Appendix 1. Description of U.S. Commercial Fisheries Number of permit holders: The total number of permit holders was 856 (344 from Oregon and 512 from Washington) when the fishery was last observed in 1993. In 1995 through 1998 the number of permits was 747, 693, 675 and 620 respectively. The number of permits issued for this fishery by Washington has been reduced through a combination of State and federal buy-back programs. This reduction is reflected in the overall decline in the total number of permits. Number of active permit holders: The number of active permits is a subset of the total permits issued for the fishery. For example, in 1995, 110 vessels (of the 747 vessels holding permits) landed fish in the mainstem fishery. Total effort: Effort in this fishery is regulated through species related seasonal openings and gear restrictions. The fishery was observed in 1991, 1992 and 1993 during several seasons of the year. The winter seasons (openings) for 1991 through 1993 totaled 13, 9.5, and 6 days respectively. The winter season has subsequently been reduced to remnant levels to protect upriver ESA listed salmon stocks. In 1995 there was no winter salmon season, in 1996 the fishery was open for 1 day. In 1997 and 1998 the season was shifted to earlier in the year and gear restrictions were imposed to target primarily sturgeon. The fall fishery in the mainstem was also observed 1992 and 1993 as was the Young's Bay terminal fishery in 1993, however, no marine mammal mortality was observed in these fisheries. The fall mainstem fishery openings varied from 1 day in 1995 to just under 19.5 days in 1997 and 6 days in 1998. The fall Youngs Bay terminal fishery fluctuated between 60 and 70 days for the 1995 through 1998 period which was similar to the fishery during the period observed. Geographic range: This fishery occurs in the main stem of the Columbia river from the mouth at the Pacific Ocean upstream to river mile 140 near the Bonneville Dam. The lower Columbia is further subdivided into smaller statistical catch areas which can be regulated independently. Seasons: This fishery is subject to season and statistical area openings which are designed to coincide with run timing of harvestable salmon runs while protecting weak salmon stocks and those listed under the Endangered Species Act. In recent years, early spring (winter) fisheries have been sharply curtailed for the protection of listed salmon species. In 1994, for example, the spring fishery was open for only three days with approximately 1900 fish landed. In 1995 the spring fishery was closed and in 1996 the fishery was open for one day but fishing effort was minimal owing to severe flooding. Only 100 fish were landed during the one day in 1996. Gear type: Typical gear used in this fishery is a gillnet of single web construction, not exceeding 250 fathoms in length, with a minimum stretched mesh size ranging upwards from 5 inches depending on target salmon species. The gear is commonly set during periods of low and high slack tides. It is the intention of the fisher to keep the net off the bottom. The vessel is attached to one end of the net and drifts with the net. The entire net is periodically retrieved onto the vessel and catch is removed. Drift times vary depending on fishing area, tidal condition, and catch. Regulations: The fishery is a limited-entry fishery with seasonal openings, area closures, and gear restrictions. Management type: The lower Columbia River salmon drift gillnet fishery is managed jointly by the Washington Department of Fish and Wildlife and the Oregon Department of Fish and Wildlife. Comments: Observers were placed onboard vessels in this fishery to monitor marine mammal interactions in the early 1980s and in 1990-93. Incidental takes of harbor seals and California sea lions were documented, but only during the winter seasons (which have been reduced dramatically in recent years to protect ESA-listed salmon). No mortality was observed during the fall fisheries. Category III, WA, OR salmon net pens. Number of permit holders: There were 12 commercial salmon net pen (“grow out”) facilities licensed in Washington in 1998. There are no commercial salmon net pen or aquaculture facilities currently licensed in Oregon. Non-commercial salmon enhancement pens are not included in the list of commercial fisheries. Number of active permit holders: Twelve salmon net pen facilities in Washington.
288

Revised 01/15/2011 9/24/2013 Appendix 1. Description of U.S. Commercial Fisheries Total effort: The 12 licensed facilities on Washington operate year-round. Geographic range: In Washington, net pens are found in protected waters in the Straits (Port Angeles), northern Puget Sound (in the San Juan Island area) as well as in Puget Sound south of Admirality Inlet. There are currently no commercial salmon pens in Oregon. Seasons: Salmon net pens operate year-round. Gear type: Net pens are large net impoundments suspended below a floating dock-like structure. The floating docks are anchored to the bottom and may also support guard (predator) net systems. Multiple pens are commonly rafted together and the entire facility is positioned in an area with adequate tidal flow to maintain water quality. Regulations: Specific regulations unknown. Management type: In Washington, the salmon net pen fishery is managed by the Washington Department of Natural Resources through Aquatic Lands Permits as well as the Washington Department of Fish and Wildlife. Comments: Salmon net pen operations have not been monitored by NMFS for marine mammal interactions, however, incidental takes of California sea lions and harbor seals have been reported. Category III, WA, OR, CA groundfish trawl. Approximate number of vessels/persons: In 1998, approximately 332 vessels used bottom and mid-water trawl gear to harvest Pacific coast groundfish. This is down from 383 vessels in 1995. The NMFS List of Fisheries for 2001 lists 585 vessels as participating in this fishery. Groundfish trawl vessels harvest a variety of species including Pacific hake, flatfish, sablefish, lingcod, and rockfish. This commercial fishery does not include Treaty Indian fishing for groundfish. All observed incidental marine mammal takes have occurred in the mid-water trawl fishery for Pacific hake. The annual hake allocation is divided between vessels that harvest and process catch at sea and those that harvest and deliver catch to shore-based processing facilities. At least one NMFS-trained observer is placed on board each at-sea processing vessel to provide comprehensive data on total catch, including marine mammal takes. In the California, Oregon, and Washington range of the fishery, the number of vessels fishing ranged between 12 and 16 (all with observers) during 1997-2001. Hake vessels that deliver to shore-based processors are issued Exempted Fishing Permits that requires the entire catch to be delivered unsorted to processing facilities where State technicians have the opportunity to sample. In 1998, 13% of the hake deliveries landed at shore-based processors were monitored. The following is a description of the commercial hake fishery. Number of permit holders/active permit holders: A license limitation ("limited-entry") program has been in effect in the Pacific coast groundfish fishery since 1994. The number of limited-entry permits is limited to 404. Non-tribal trawl vessels that harvest groundfish are required to possess a limited-entry permit to operate in the fishery. Any vessel with a federal limited-entry trawl permit may fish for hake, but the number of vessels that do is smaller than the number of permits. In 1998, approximately 61 limited-entry vessels, 7 catcher/processors and 50 catcher vessels delivering to shoreside and mothership processors, made commercial landings of hake during the regular season. In addition, 6 unpermitted mothership processors received unsorted hake catch. Total effort: The hake allocation continues to be fully utilized. From 1997 to 1999 the annual allocation was 232,000 mt/year, this is an increase over the 1996 allocation of 212,000 mt and the 1995 allocation of 178,400 mt. In 1998, motherships vessels received 50,087 mt of hake in 17 days, catcher/processors took 70,365 mt of hake in 54 days and shore-based processors received 87,862 mt of hake over a 196 day period. Geographic range: The fishery extends from northern California (about 40o 30' N. latitude) to the U.S.-Canada border. Pacific hake migrate from south to north during the fishing season, so effort in the south usually occurs earlier than in the north.
289

Revised 01/15/2011 9/24/2013 Appendix 1. Description of U.S. Commercial Fisheries Seasons: From 1997 to 1999, season start dates have remained unchanged. The shore-based season in most of the Eureka area (between 42O- 40O30' N latitude) began on April 1, the fishery south of 40O30' N latitude opened April 15, and the fishery north of 42O N latitude started on June 15. In 1998, the primary season for the shore-based fleet closed on October 13, 1998. The primary seasons for the mothership and catcher/processor sectors began May 15, north of 420 N. lat. In 1998, the mothership fishery closed on May 31, the catcher/processor fishery closed on August 7. Gear type: The Pacific hake trawl fishery is conducted with mid-water trawl gear with a minimum mesh size of 3 inches throughout the net. Regulations/Management type: This fishery is managed through Federal regulations by the Pacific Fishery Management Council under the Groundfish Fishery Management Plan. Comments: Since 1991, incidental takes of Steller sea lions, Pacific white-sided dolphins, Dall's porpoise, California sea lions, harbor seals, northern fur seals, and northern elephant seals have been documented in the hake fishery. From 1997-2001, 4 California sea lions, 2 harbor seals, 2 northern elephant seals, 1 Pacific white-sided dolphin, and 6 Dall’s porpoise were reported taken in California/Oregon/Washington regions by this fishery. Category III fisheries in Hawaii are managed primarily by the State of Hawaii5. Some fisheries have undergone many changes in geographic and temporal extent in recent years and complete analyses of fishing effort for recent years are not yet available. For many, fishing season and specific gear types are not well defined. These fishery descriptions will be updated as new information and analyses become available. Category III, Hawaii gillnet fishery.6 Number of active permit holders: In 2011 there were 36 active commercial fishers. 1997 there were 129 active commercial fishers. In 1995 there were approximately 115. Total effort: In 20111997 there were 495 trips.2,109 trips for a total catch of 864,194 pounds with 792,210 pounds sold. This fishery operates in nearshore and coastal pelagic regions. Seasons: This fishery operates year-round with the exception of juvenile big-eyed scad less than 8.5 inches which cannot be taken from July through October. Gear type: Gillnets are of stretched mesh greater than 2 inches and stretched mesh size greater than 2.75 inches for stationary gillnets. The net dimensions may not exceed 7 feet high and 125 feet long.. Stationary nets must be inspected every 2 hours and total soak time cannot exceed four hours in the same location. New restrictions implemented in 2002 include that nets may not: 1) be used more than once in a 24-hour period; 2) exceed a 12 ft stretched height limit; 3) exceed a single-panel; 4) be used at night; 5) be set within 100 ft. of another lay net; 6) be set in more than 80 ft depths; 7) be left unattended for more than ½ hour; 8) break coral during retrieval and nets must be 1) registered with the Division of Aquatic Resources; 2) inspected within two hours after being set; 2) tagged with two marker buoys while fished. In addition to these gear restrictions, non-commercial users of lay nets may not use a net longer than 500 ft, while commercial users may use nets up to 1200 ft in length. Additional mesh restrictions are in place for taking big-eyed scad. Regulations: . Stationary nets must be inspected every 2 hours and total soak time cannot exceed four hours in the same location. New restrictions implemented in 2007 include that nets may not: 1) be used more than once in a 24-hour period; 2) exceed a 7 ft stretched height limit; 3) exceed a single-panel; 4) be used at night; 5) be set within 250 ft. of another lay net; 6) be set in more than 80 ft depths; 7) be left unattended for more than ½ hour; 8) break coral during retrieval, 9) be set
5Descriptions of Hawaii State managed fisheries provided by Reggie Cocoban and Sarah Courbis , State of Hawaii, Department of Land and Natural Resources, Division of Aquatic Resources and Hawaii Humpback Whale National Marine Sanctuary, Honolulu Hawaii. 6Descriptions of Hawaii State managed fisheries provided by William Devick, State of Hawaii, Department of Land and Natural Resources, Division of Aquatic Resources, Honolulu Hawaii.
290

Revised 01/15/2011 9/24/2013 Appendix 1. Description of U.S. Commercial Fisheries in freshwater streams or stream mouths, and nets must be 1) registered with the Division of Aquatic Resources; 2) inspected within two hours after being set; 2) tagged with two marker buoys while fished. Gillnets are prohibited around all of Maui and portions of Oahu and Hawaii Island. Gear and season restrictions (see above). Management type: Managed by the State of Hawaii Division of Aquatic Resources. Comments: The principle catches include reef fishes and big-eyed scad (akule) and mackerel scad (opelu). Interactions have been documented with bottlenose dolphins and spinner dolphins. Category III, Hawaii lift (opelu) net fishery Number of active permit holders: In 2011 there were 22 active commercial fishers. Total effort: In 2011 there were 843 trips. Seasons: unknown. Gear type: Fishing with a net that captures fish by raising the net from beneath a school of fish. Normally fish are encouraged over and into the new with chum. Regulations: Managed under State of Hawaii regulations. Management type: Managed by the State of Hawaii Division of Aquatic Resources. Category III, Hawaii inshore purse seine fishery Number of active permit holders: In 2011 there were less than 3 active commercial fishers. Total effort: unknown. Seasons: unknown. Gear type: Fishing with a net that is used to surround a school of fish and is closed by drawing the bottom of the net together to form a bag.
Regulations: Unlawful for any person without a valid commercial marine license to take akule with any net that has less than 2-3/4" stretched mesh.
Management type: Managed by the State of Hawaii Division of Aquatic Resources. Category III, Hawaii throw net/ cast net fishery Number of active permit holders: In 2011 there were 29 active commercial fishers. Total effort: In 2011 there were 445 fishing trips. Seasons: unknown. Gear type: Fishing with a round or conical shaped net with a weighted outer perimeter that is thrown over fish.
291

Revised 01/15/2011 9/24/2013 Appendix 1. Description of U.S. Commercial Fisheries Regulations: Minimum size 2 inch stretched mesh. Possession of thrownets with mesh size less than 2 inches in or near the water where fish may be taken is unlawful. Nets with smaller mesh may be used to take shrimp (`opae), `opelu, and makiawa. Management type: Managed by the State of Hawaii Division of Aquatic Resources. Comments: Targets inshore and reef fish. Category III, Hawaii seine net fishery Number of active permit holders: In 2011 there were 26 active commercial fishers. Total effort: In 2011 there were 227 fishing trips. Seasons: unknown. Gear type: Includes Hukilau, beach seine, dragnet, pen, surround, etc. Fishing with a net by moving it through the water to surround fish by corralling and trapping them within the walls of the net. Regulations: Managed under State of Hawaii regulations. Management type: Managed by the State of Hawaii Division of Aquatic Resources. Comments: Typical species: usually inshore and reef fish. Category III, Hawaii lobster tangle net fishery Number of active permit holders: In 2011 there were no active license holders, and there have been less than 3 active license holders since at least 2009. Total effort: None in 2011. Seasons: unknown. Gear type: Fishing with a net with large eye mesh (4-7 in) used to entangle lobsters. Regulations: Managed under State of Hawaii regulations. Management type: Managed by the State of Hawaii Division of Aquatic Resources. Category III, Hawaii trolling, rod, and reel fishery. Number of active permit holders: In 2011 there were 2,126 active commercial fishers. Total effort: In 2011 there were 30,020 fishing trips. Seasons: unknown. Gear type: Fishing by towing or dragging line(s) with artificial lure(s), dead or live bait, or green stick and dnaglers using a sail, surf or motor-powered vessel underway. Up to six lines rigged with artificial lures may be trolled when outrigger
292

Revised 01/15/2011 9/24/2013 Appendix 1. Description of U.S. Commercial Fisheries poles are used to keep gear from tangling. When using live bait, trollers move at slower speeds to permit the bait to swim naturally. Pelagic trollers generally fish at an average distance of 5 to 8 miles from shore, with a maximum distance of about 30 miles from shore. Trollers fish where water masses converge and where submarine cliffs, seamounts, and other underwater features dramatically change the bathymetry. Trolls often fish drifting logs, other flotsam, underneath bird aggregations, and near FADs. Typical target species include mahimahi, ono, billfishes (marlin, sailfishes, etc.), kaku, uluas, kamanu, tunas, etc. Regulations: Managed under State of Hawaii regulations. Management type: Managed by the State of Hawaii Division of Aquatic Resources. Category III, Hawaii kaka line fishery. Number of active permit holders: In 2011 there were 17 active commercial fishers. Total effort: In 2011 there were 46 fishing trips. Seasons: unknown. Gear type: Fishing with a gear consisting of a mainline less than one nautical mile in length to which are attached multiple branchlines with baited hooks. Mainline is set horizontally, and fixed on or near the bottom, or in shallow midwater. Typical target species varies spending on set location, e.g., nearshore or pelagics. Regulations: Managed under State of Hawaii regulations. Management type: Managed by the State of Hawaii Division of Aquatic Resources. Category III, Hawaii vertical longline fishery. Number of active permit holders: In 2011 there were 9 active commercial fishers. Total effort: In 2011 there were 92 fishing trips. Seasons: unknown. Gear type: Fishing using a vertical mainline, less than one nautical mile in length and suspended from the surface with float, from which leaders with baited hooks are attached and ending with a terminal weight. Regulations: Managed under State of Hawaii regulations. Management type: Managed by the State of Hawaii Division of Aquatic Resources. Category III, Hawaii crab trap fishery. Number of active permit holders: In 2011 there were 9 license holders fishing crab traps. Total effort: In 2011 there were 168 crab traps trips. Seasons: unknown.
293

Revised 01/15/2011 9/24/2013 Appendix 1. Description of U.S. Commercial Fisheries Gear type: Fishing with any of various fishing devices made into the shape of a box, container, or enclosure, with one or more openings that allow marine life to get inside but keep them from leaving. Regulations: Minimum mesh size: Netting - stretched mesh 2 inches; Rigid material - 2 inches by 1 inch. Entrance cones for traps have no minimum mesh size. Traps must be portable and not exceed 10 feet in length or 6 feet in height or width. Management type: Managed by the State of Hawaii Division of Aquatic Resources. Category III, Hawaii fish trap fishery. Number of active permit holders: In 2011 there were 9 active commercial fishers. Total effort: In 2011, there were 125 fish trap trips.
Seasons: unknown.
Gear type: Fishing with any of various fishing devices made into the shape of a box, container, or enclosure, with one or more openings that allow marine life to get inside but keep them from leaving. Regulations: Regulations: Minimum mesh size: Netting - stretched mesh 2 inches; Rigid material - 2 inches by 1 inch. Entrance cones for traps have no minimum mesh size. Traps must be portable and not exceed 10 feet in length or 6 feet in height or width. Management type: Managed by the State of Hawaii Division of Aquatic Resources. Category III, Main Hawaiian Islands Hawaii lobster trap fishery.7 8 Note: The portion of this fishery managed by the State of Hawaii and operating in the MHI is about 1% of the size (total pounds of lobster caught) of the federally managed fishery operating primarily in the NWHI. The description that follows refers to the NWHI fishery unless stated otherwise. Number of permit holders: There are 15 permit holders under a (1991) federal limited access program. Number of active permit holders: In 1998 and 1999 there were 5 and 6 vessels that participated, respectively. In the MHI there were 5 active fishers in 1997. In 2011 there were less than 3 active commercial fishers. Total effort: The number of trap hauls for 1999 is not available at this time. However, the majority of the effort took place in the 4 harvest guideline areas; Necker Bank, Gardner Pinnacles and Maro Reef, with the remaining effort spread out over 10 unique areas. In 1998 171,000 trap hauls were made by the 5 vessels during 9 trips and in 1997 a total of 177,700 hauls were made. In the MHI 19 trips were made in 1997. Geographic range: Lobster permits allow fishing operations in the US EEZ from 3 to 200 nmi offshore American Samoa, Guam and Hawaii (including the EEZ areas of the NWHI and MHI). However, no vessels have operated in the EEZ’s of American Samoa or Guam since 1983. Lobster fishing is prohibited within the NWHI. Seasons: This fishery operates under a seasonal harvest guideline system opening on July 1. The season ends once the harvest guideline is met, but no later than December 31. In 1998, the harvest guideline was divided into the 4 areas mentioned above with total lobster catch set at (in thousands) 70, 20, 80, and 116, respectively. Area closure occurs once an area’s harvest guideline is met. In the MHI, open season is from September through April. 7Kawamoto, K. and Samuel G. Pooley. 1999. Draft Annual report of the 1998 western pacific lobster fishery. 8Kawamoto, K. 1999. Summary of the 1999 NWHI Lobster Fishing Season. NMFS Honolulu Laboratory.
294

Revised 01/15/2011 9/24/2013 Appendix 1. Description of U.S. Commercial Fisheries Gear type: One string consists of approximately 100-fathom-plus plastic lobster traps. About 10 such strings are pulled and set each day. Since 1987 escape vents that allow small lobsters to escape from the trap have been mandatory. In 1996, the fishery became “retain all”, i.e. there are no size limits or prohibitions on the retention of berried female lobsters. The entry-way of the lobster trap must be less than 6.5 inches to prevent monk seals from getting their heads stuck in the trap. In the MHI, rigid trap materials must have a dimension greater than 1 inch by 2 inches, with the trap not exceeding 10 feet by six feet. Regulations: Season, gear and quota restrictions (see above) for the NWHI were formulated by the Western Pacific Regional Fishery Management Council and implemented by NMFS. The MHI fishery is managed by the State of Hawaii, Division of Aquatic Resources with season and gear restrictions (see above). Management type: Limited-access program with bank specific quotas and closures. In the MHI, oOpen access. Comments: The NWHI fishery targets the red spiny lobster and the common slipper lobster. The ridgeback slipper lobster is also taken. Protected species of concern include monk seals (mentioned above) and turtles. There have been no interactions with these species since 1995, but they have been seen in the vicinity of the fishing gear. Category III, Hawaii shrimp trap fishery. Number of active permit holders: In 2011 there were 4 active commercial fishers Total effort: In 2011 there were 69 shrimp trap trips. Seasons: unknown. Gear type: Fishing with any of various fishing devices made into the shape of a box, container, or enclosure, with one or more openings that allow marine life to enter but not exit. Regulations: Traps for shrimp and `opae have no minimum mesh size. Traps must be portable and not exceed 10 feet in length or 6 feet in height or width. Management type: Managed by the State of Hawaii Division of Aquatic Resources. Category III, Hawaii crab net fishery. Number of active permit holders: In 2011 there were 6 active commercial fishers Total effort: In 2011 there were 61 crab net trips. Seasons: unknown. Gear type: Fishing normally with a small circular lift net that is used to catch crabs. Regulations: Managed under State of Hawaii regulations. Management type: Managed by the State of Hawaii Division of Aquatic Resources. Category III, Hawaii Kona crab net fishery. Number of active permit holders: In 2011 there were 48 active commercial fishers
295

Revised 01/15/2011 9/24/2013 Appendix 1. Description of U.S. Commercial Fisheries Total effort: In 2011 there were 179 Kona crab trips. Seasons: Closed during breeding season May-August Regulations: Only male crabs of at least 4 inches carapace length may be retained. Management type: Managed by the State of Hawaii Division of Aquatic Resources. Category III, aku boat- pole and line fishery. Number of active permit holders: In 2011 there were 3 active commercial fishers Total effort: In 2011 there were 86 aku boat trips. Seasons: unknown. Gear type: Fishing for aku (skipjack tuna) using live bait (such as nehu or iao) and or artificial lures. Generally live bait and/or water is flung or sprayed out from the stern of the (often drifting) vessel to “chum up the school” and get them feeding. Fishers on the stern of the boat often jig and slap the water with their poles to increase surface feeding behavior. Fish are hooked with pole and line, using a barbless hook (feathered, baited or not). Regulations: Managed under State of Hawaii regulations. Management type: Managed by the State of Hawaii Division of Aquatic Resources. Category III, Hawaii Main Hawaiian Islands deep sea bottomfish handline and jig fishery. Note: The Hawaii bottomfish complex is a U.S. fishery management unit comprised primarily of several species of snappers and jacks and a grouper inhabiting waters of the Hawaiian Archipelago. The federal fisheries management regime includes three fishing zones: the main Hawaiian Islands (MHI) Zone, and two zones in the Northwestern Hawaiian Islands, the Mau Zone and the Hoomalu Zone. All bottomfish fishing currently takes place in the MHI zone due to the closure of the Northwestern Hawaiian Islands under Presidential Proclamation 8031. There are two commercial bottomfish fisheries in Hawaii: a distant water Northwestern Hawaiian Islands (NWHI) limited-entry fishery under federal jurisdiction and tThe main Hawaiian Islands bottomfish fishery is managed jointly by NMFS and primarily under the State of Hawaii jurisdiction. Number of permit holders: In 2010 there were 569 active commercial fishers. The main Hawaiian Islands fishery is open-access with close to 2,000 bottomfish vessels registered with the State of Hawaii, whereas the NWHI is restricted to a maximum of 17 vessels. Number of active permit holders: In 1997 in the MHI a total of 750 fishers were active. The NWHI are divided into the Mau Zone (closer to MHI) and the Hoomalu Zone. The Hoomalu Zone is a limited-entry zone with 6 vessels participating in 1998, 7 vessels fished the Mau Zone in the same year. Restrictions on new entry into the Mau Zone were implemented in 1998.
296

Revised 01/15/2011 9/24/2013 Appendix 1. Description of U.S. Commercial Fisheries Total effort: From 2008 to 2010 in the MHI the reported average annual catch was 221,500 lbs., with an additional 44,300 to 553,700 lbs. estimated to have been caught but not reported9 In 1998 in the MHI approximately 8,500 trips were made with a total catch of 424,000 pounds for an ex-vessel landing value of $1,336,000. This fishery occurs primarily in offshore banks and pinnacles. In the NWHI 332,000 pounds ($894,000) were caught in 1998, below average since 1990. Seasons: Year round. Gear type: This fishery is a hook-and-line fishery that takes place in deep water. In the NWHI fishery, vessels are 30 ft or greater and conduct trips of about 10 days. In the MHI the vessels are smaller than 30 ft and trips last from 1 to 3 days. Regulations: In the MHI, the sale of snappers (opakapaka, onaga and uku) and jacks less than one pound is prohibited. In June of 1998, Hawaii Division of Aquatic Resources (HDAR) closed 19 areas to bottomfishing, and regulations pertaining to seven species (onaga, opakapaka, ehu, kalekale, gindai, hapuupuu and lehi) were enacted. Total Allowable Catch (TAC) limits have been established for the "Deep-7" bottomfish species; these are the 7 primary species targeted by the commercial fleet. The TAC applies to both commercial and non-commercial sectors of the fishery. To ensure the TAC is not exceeded, NMFS and the State of Hawaii monitor the catch of Deep-7 bottomfish during the annual fishing season. Annual TAC quota for Hawaii Restricted Bottomfish Species specified in Federal Register by August 31st each year. Management type: The MHI is managed by the HDAR with catch, gear and area restrictions (see above) but no permit limits. The NWHI is a limited access federal program. The portion of the fishery in Federal waters is managed under the Fishery Ecosystem Plan for the Hawaiian Archipelago, and operates under an annual catch limit. The fishery is co-managed with the State of Hawaii, which has adopted complementary measures in State waters. Comments: The deep-slope bottomfish fishery in Hawaii concentrates on species of eteline snappers, carangids, and a single species of grouper concentrated at depths of 30-150 fathoms. These fish have been fished on a subsistence basis since ancient times and commercially for at least 90 years. NMFS is considering the possibility of re-categorizing the NWHI bottomfish fishery from Category III to Category II due to concerns for potential interactions between bottomfish fishing vessels and Hawaiian monk seals, although there were none observed during 26 NWHI bottomfish trips during 1990-1993, and none reported. On 12 of the 26 trips, bottlenose dolphins have been observed stealing fish from the lines, but no hookings or entanglements occurred. Effort in this fishery increases significantly around the Christmas season because a target species, a true snapper, is typically sought for cultural festivities.11 No data are collected for recreational or subsistence fishermen, but their MHI catch is estimated to be about equal to the MHI commercial catch. Category III, Hawaii inshore handline fishery. Number of active permit holders: In 2011 there were 378 active commercial fishers Total effort: In 2011 there were 4,577 inshore handline trips. Seasons: unknown. Gear type: Fishing from a vessel using a vertical mainline with single/multiple lures or baited hooks and weight, lowered near the bottom to include drifting for octopus (tako) while using a handline. Fishing tackle usually consists of lighter gear than deep-sea handline. Line can be retrieved manually or by any other powered method. This fishery occurs in nearshore and coastal pelagic regions. Regulations: Managed under State of Hawaii regulations. Management type: Managed by the State of Hawaii Division of Aquatic Resources. 9 Brodziak, J., D. Courtney, L. Wagatsuma, J. O’Malley, H-H. Lee, W. Walsh, A. Andrews, R. Humphreys, and G. DiNardo. 2011. Stock assessment of the main Hawaiian Islands Deep7 bottomfish complex through 2010. U.S. Dep. Commer., NOAA Tech. Memo., NOAA-TM-NMFS-PIFSC-29, 176 p. + Appendix
297

Revised 01/15/2011 9/24/2013 Appendix 1. Description of U.S. Commercial Fisheries Comments: The principal catches include reef fishes and big-eyed scad (akule) and mackerel scad (opelu). In 1997 a total of 750 fishers made 8,526 fishing trips in the main Hawaiian Islands, caught 531,449 pounds and sold 475,562 pounds for an ex-vessel landing value of $1,010,758. This fishery occurs in nearshore and coastal pelagic regions. Category III, Hawaii tuna handline and jig fishery. Number of active permit holders: In 2011 there were 498 active commercial fishers. Total effort: In 2011 there were 4,619 trips classified as one of the three tuna handline methods, 74 hybrid, 1,626 ika-shibi, and 2,919 palu-ahi. Seasons: unknown. Gear type: Palu-ahi tuna handline fishing usually takes place during the daytime. Sometimes instead of using lead weights, the baited hook and cut pieces of bait (“chum”) are laid on a stone and the leader is wrapped around the stone and secured with a slipknot. The line wrapped stone is then lowered to the desired depth, where a tug on the line releases the slipknot, dispersing the chum and releasing the baited hook. The stone falls to the bottom, leaving the line free to be worked by the fisherman. This method also includes the use of “danglers” for reporting purposes. Iki-shibi tuna handline fishing occurs mainly at night also using a vertical mainline with high-test monofilament leader, from which is suspended a single baited hook. A weight may be used between the mainline and leader, with four or more lines usually attached to the vessel by breakaway links. A sea anchor is used to control and slow (at times stop) the drift of the vessel. A small light is usually suspended from the boat to attract muhe’e (“true squid”) or opelu, typically used as bait. Line may be hauled manually, mechanically or by any powered method. Hybrid tuna handline fishing is a unique mixture of fishing methods used to catch pelagic species primarily on offshore seamounts and near NOAA weather buoys. It is generally a combination of methods which could include handlining, trolling, baiting techniques and other methods which are used simultaneously. Regulations: Managed under State of Hawaii regulations. Management type: Managed by the State of Hawaii Division of Aquatic Resources. Comments: This fishery occurs around offshore fish aggregating devices and mid-ocean seamounts and pinnacles. The principal catches are small to medium sized bigeye, yellowfin and albacore tuna. There are several types of handline methods in the Hawaiian fisheries. Baited lines with chum are used in day fishing operations (palu-ahi), another version uses squid as bait during night operations (ika-shibi), and an operation called “danglers” uses multiple lines with artificial lures suspended or dangled over the water. Interactions have been documented for rough-toothed dolphins, bottlenose dolphins, and Hawaiian monk seals. In 1997 a total of 543 fishers made 6,627 trips in the MHI, and caught 2,014,656 pounds and sold 1,958,759 pounds for an ex-vessel value of $3,788,391. Category III, Hawaii spearfishing fishery. Number of active permit holders: In 2011 there were 143 active commercial fishers Total effort: In 2011 there were 2,142 spearfishing trips. Seasons: unknown. Gear type: Fishing with a shaft with one or more sharpened points at one end usually associated with diving. Includes bow and torch fishing. Regulations: Managed under State of Hawaii regulations.
298

Revised 01/15/2011 9/24/2013 Appendix 1. Description of U.S. Commercial Fisheries Management type: Managed by the State of Hawaii Division of Aquatic Resources. Comments: Interactions have been documented with Hawaiian monk seals. Category III, Hawaii charter vessel fishery. Number of active permit holders: In 2011 there were 114 active commercial fishers Total effort: unknown. Seasons: unknown. Gear type: Does not refer to a specific method or gear type, but rather an industry that takes paid fare (passengers or tourists) to catch pelagic oir benthic fish and then sells some portion of the catch. Fishing methds may include troll, various tuna handline methods, casting, inshore handline and deep-sea bottomfish handline methods. Regulations: Managed under State of Hawaii regulations. Management type: Managed by the State of Hawaii Division of Aquatic Resources. References: Carretta, J.V. and J. Barlow. 2011. Long-term effectiveness, failure rates, and “dinner bell” properties of acoustic pingers in a gillnet fishery. Marine Technology Society Journal 45(5):7-19.
299

Revised 01/15/2011 9/24/2013 Appendix 1. Description of U.S. Commercial Fisheries Table 1. Characteristics of Category I and Category II gillnet fisheries in California. Fishery Species Mesh Size Water Depth Set Duration Deployment Miscellaneous Category I CA/OR thresher shark and swordfish drift gillnet fishery
swordfish/shark 14 to 22 inches Ranges from 90 to 4600 meters
Typically 8 to 15 hrs
Drift net only Nets 500 to 1800 meters in length; other species caught: opah, louver, tuna, thresher, blue shark, mako shark
Category I CA halibut and white seabass set gillnet fishery (>3.5 inch mesh)
Halibut 8.5 inch < 70 meters 24 hrs Set net Barracuda 3.5 inch < 12 hrs Drift net April – July Leopard Shark 7.0 to 9.0 inch < 90 meters Fished similar to
halibut. Perch/Croaker 3.5 to 4.0 inch < 40 meters < 24 hrs Set net Few boats target
these species Rockfish 4.5 to 7.5 inch > 90 meters 12 to 18 hrs Set net Net lengths 450 to
1800 meters. Soupfin shark is major bycatch.
Soupfin shark/white seabass
6.0 to 8.5 inch > 50 meters 24 hrs Set net Few boats target this species.
Miscellaneous shark 6.0 to 14 inch < 70 meters 8 to 24 hrs Drift, some set net Species include thresher and swell sharks.
Category II CA Yellowtail, barracuda, white seabass, and tuna drift gillnet fishery
White seabass, yellowtail, barracuda, white seabass, and tuna
Typically 6.5 inch 15 to 90 meters 8 to 24 hrs Mostly drift net White seabass predominant target species.
300

Revised 01/15/2011 9/24/2013 Appendix 1. Description of U.S. Commercial Fisheries
Figure 1. Locations of 7,660 8,365 sets observed in the California/Oregon large-mesh drift gillnet fishery for thresher shark and swordfish, 1990-2006 2012. The cross-hatched area in blue has been closed to gillnetting from 15 August to 15 November each year since 2001 to protect leatherback turtles. The outer dashed line represents the U.S. Exclusive Economic Zone. Total estimates of fishing effort over this period are approximately 48,000 sets. Observed sets represent approximately 15% of all fishing effort during the period 1990 to 2012, where the total estimate of fishing effort is approximately 53,000 sets.
301

Revised 01/15/2011 9/24/2013 Appendix 1. Description of U.S. Commercial Fisheries
Figure 2. Estimated (gray) and observed (black) days of fishing effort for 1990-20072012 in the California/Oregon thresher shark/swordfish drift gillnet fishery ( 14 inch mesh). One fishing day is equal to one set in this fishery. Percent observer coverage for each year is shown above the bars. The approximate observer coverage during this period has been 15% (Carretta and Barlow 2011).
302

Revised 01/15/2011 9/24/2013 Appendix 1. Description of U.S. Commercial Fisheries
Figure 3. Estimated (gray) and observed (black) days of fishing effort for 1990- 20072012 in the California halibut/white seabass set gillnet fishery (> 3.5 inch mesh). The fishery has been observed only sporadically since 1994. Percent observer coverage for each year is shown above the bars. The observer coverage estimate for 2007 is based on the number of sets observed in 2007 (n=248 sets) and 2006 fishing effort obtained from logbooks (n = 1,387 sets).
303
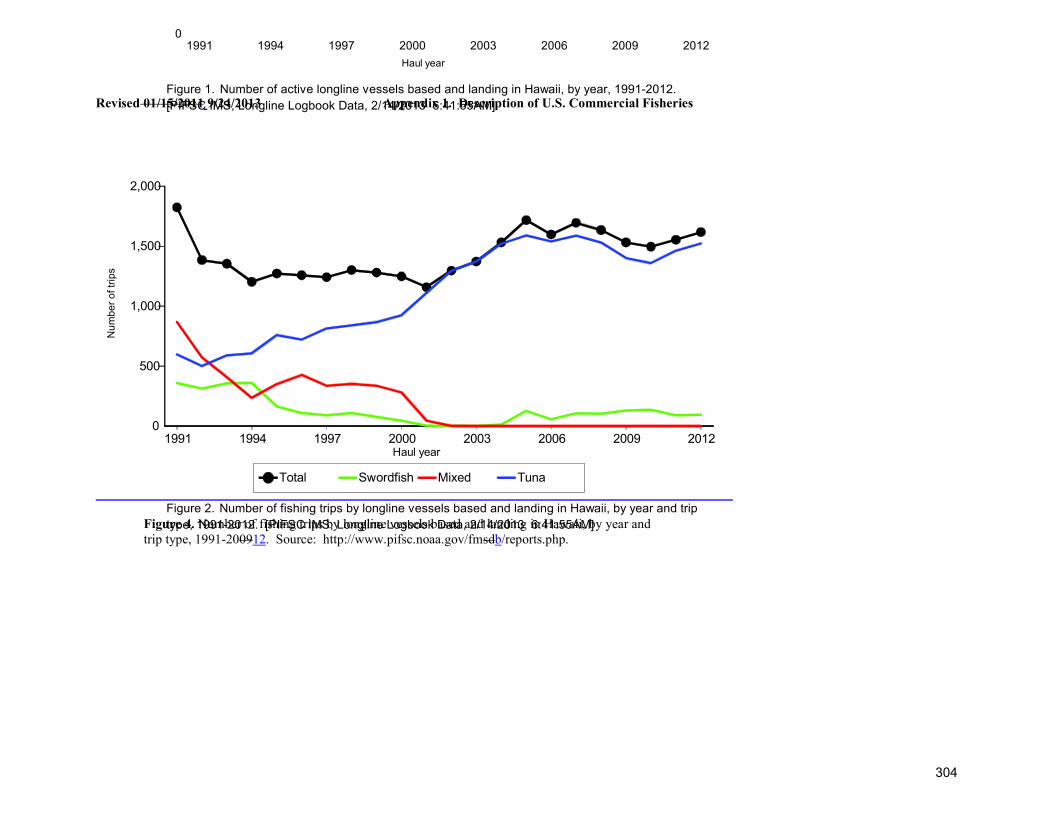
Revised 01/15/2011 9/24/2013 Appendix 1. Description of U.S. Commercial Fisheries
0
40
80
120
160
1991 1994 1997 2000 2003 2006 2009 2012
141123 122 125
110 104 105115 122 125
101 102 110126 125 127 129 129 127 124 129 129
Num
ber o
f ves
sels
Figure 1. Number of active longline vessels based and landing in Hawaii, by year, 1991-2012. [PIFSC IMS, Longline Logbook Data, 2/14/2013 6:41:55AM]
Haul year
0
500
1,000
1,500
2,000
1991 1994 1997 2000 2003 2006 2009 2012
Total Swordfish Mixed Tuna
Num
ber o
f trip
s
Figure 2. Number of fishing trips by longline vessels based and landing in Hawaii, by year and trip type, 1991-2012. [PIFSC IMS, Longline Logbook Data, 2/14/2013 6:41:55AM]
Haul year
Figure 4. Number of fishing trips by longline vessels based and landing in Hawaii, by year and trip type, 1991-200912. Source: http://www.pifsc.noaa.gov/fmsdb/reports.php.
304

Appendix 3. 2013 Pacific Marine Mammal Stock Assessment Reports. S=strategic stock; N=non-strategic stock.Shaded lines indicate reports revised in 2013. unk=unknown, undet=undetermined, n/a=not applicable.(P) indicates 'prospective stocks'.
Total AnnualAnnual Fishery
Mortality Mortality SARNMFS + Serious + Serious Strategic Last
Species Stock Area Center N est CV N est N min R max Fr PBR Injury Injury Status RevisedCalifornia sea lion U.S. SWC 296,750 n/a 153,337 0.12 1 9,200 ≥431 ≥337 N 2006 2007 2008 2011
Harbor seal California SWC 30,196 n/a 26,667 0.12 1 1,600 31 18 N 2002 2004 2009 2011
Harbor seal Oregon/Washington Coast AKC unk unk unk 0.12 1 unk 10.6 7.4 N 1999 2013
Harbor seal Washington Northern Inland Waters (P) AKC unk unk unk 0.12 1 unk 9.8 2.8 N 1999 2013
Harbor seal Southern Puget Sound (P) AKC unk unk unk 0.12 1 unk 3.4 1 N 1999 2013
Harbor seal Hood Canal (P) AKC unk unk unk 0.12 1 unk 0.2 0.2 N 1999 2013
Northern Elephant Seal California breeding SWC 124,000 n/a 74,913 0.117 1 4,382 10.4 8.8 N 2001 2002 2005 2007
Guadalupe Fur Seal Mexico to California SWC 7,408 n/a 3,028 0.12 0.5 91 0 0 S 1993 2000
Northern Fur Seal California AKC 12,844 n/a 6,722 0.12 1 403 2.6 N 2009 2010 2011 2013
Monk Seal Hawaii PIC 1,209 n/a 1,182 0.07 0.1 undet ≥1.8 ≥0.6 S 2009 2010 2011 2013
Harbor porpoise Morro Bay SWC 2,917 0.41 2,102 0.04 0.5 21 ≥0.6 ≥0.6 N 2002 2007 2012 2013
Harbor porpoise Monterey Bay SWC 3,715 0.51 2,480 0.04 0.5 25 N 2002 2007 2011 2013
Harbor porpoise San Francisco – Russian River SWC 9,886 0.51 6,625 0.04 0.5 66 N 2002 2007 2011 2013
Harbor porpoise Northern CA/Southern OR SWC 35,769 0.52 23,749 0.04 1 475 ≥0.6 ≥0.6 N 2002 2007 2011 2013
Harbor porpoise Northern Oregon/Washington Coast AKC 21,487 0.44 15,123 0.04 0.5 151 ≥3.0 ≥3.0 N 2002 2010 2011 2013Harbor porpoise Washington Inland Waters AKC 10,682 0.38 7,841 0.04 0.4 63 ≥2.2 ≥2.6 N 1996 2002 2003 2011
Dall’s porpoise California/Oregon/Washington SWC 42,000 0.33 32,106 0.04 0.4 257 ≥0.4 ≥0.4 N 2001 2005 2008 2010
Pacific white-sided dolphin California/Oregon/Washington SWC 26,930 0.28 21,406 0.04 0.4 171 17.8 11.8 N 2001 2005 2008 2013
Risso’s dolphin California/Oregon/Washington SWC 6,272 0.30 4,913 0.04 0.4 39 1.6 1.6 N 2001 2005 2008 2010
Common Bottlenose dolphin California Coastal SWC 323 0.13 290 0.04 0.5 2.4 0.2 0.2 N 2000 2004 2005 2008Common Bottlenose dolphin California/Oregon/Washington Offshore SWC 1,006 0.48 684 0.04 0.4 5.5 ≥2.0 ≥2.0 N 2001 2005 2008 2013
Striped dolphin California/Oregon/Washington SWC 10,908 0.34 8,231 0.04 0.5 82 0 0 N 2001 2005 2008 2010
Common dolphin, short-beaked California/Oregon/Washington SWC 411,211 0.21 343,990 0.04 0.5 3,440 64 64 N 2001 2005 2008 2010
Common dolphin, long-beaked California SWC 107,016 0.42 76,224 0.04 0.4 610 13.8 13 N 2005 2008 2009 2012
Northern right whale dolphin California/Oregon/Washington SWC 8,334 0.40 6,019 0.04 0.4 48 4.8 3.6 N 2001 2005 2008 2010
Killer whale Eastern North Pacific Offshore SWC 240 0.49 162 0.04 0.5 1.6 0 0 N 2001 2005 2008 2010
Killer whale Eastern North Pacific Southern Resident NWC 85 n/a 85 0.032 0.1 0.14 0 0 S 2010 2011 2012 2013
Short-finned pilot whale California/Oregon/Washington SWC 760 0.64 465 0.04 0.4 4.6 0 0 N 2001 2005 2008 2010
Baird’s beaked whale California/Oregon/Washington SWC 847 0.81 466 0.04 0.5 4.7 0 0 N 2001 2005 2008 2013
Mesoplodont beaked whales California/Oregon/Washington SWC 694 0.65 389 0.04 0.5 3.9 0 0 S 2001 2005 2008 2013
Cuvier’s beaked whale California/Oregon/Washington SWC 6,590 0.55 4,481 0.04 0.5 45 0 0 S 2001 2005 2008 2013
Pygmy Sperm whale California/Oregon/Washington SWC 579 1.02 271 0.04 0.5 2.7 0 0 N 2001 2005 2008 2010
Dwarf sperm whale California/Oregon/Washington SWC unk unk unk 0.04 0.5 undet 0 0 N 2001 2005 2008 2010
Sperm whale California/Oregon/Washington SWC 971 0.31 751 0.04 0.1 1.5 4.0 3.8 S 2001 2005 2008 2012
Gray whale Eastern North Pacific SWC 19,126 0.07 18,017 0.062 1.0 558 127 2.4 N 2009 2010 2011 2013
Humpback whale California/Oregon/Washington SWC 1,918 0.03 1,855 0.08 0.3 11.0 ≥ 5.5 ≥ 4.4 S 2009 2010 2011 2013
Blue whale Eastern North Pacific SWC 1,647 0.07 1,551 0.04 0.3 2.3 1.9 0 S 2005 2008 2011 2013
Fin whale California/Oregon/Washington SWC 3,051 0.18 2,598 0.04 0.3 16 2.2 0.6 S 2001 2005 2008 2013
Sei whale Eastern North Pacific SWC 126 0.53 83 0.04 0.1 0.17 0 0 S 2001 2005 2008 2010
Minke whale California/Oregon/Washington SWC 478 1.36 202 0.04 0.5 2.0 0 0 N 2001 2005 2008 2010
Rough-toothed dolphin Hawaii SWC 6,288 0.39 4,581 0.04 0.5 46 unk unk N 2002 2010 2013
Rough-toothed dolphin American Samoa PIC unk unk unk 0.04 0.5 unk unk unk unk n/a n/a n/a 2010
Recent Abundance Surveys
305

Appendix 3. 2013 Pacific Marine Mammal Stock Assessment Reports. S=strategic stock; N=non-strategic stock.Shaded lines indicate reports revised in 2013. unk=unknown, undet=undetermined, n/a=not applicable.(P) indicates 'prospective stocks'.
Total AnnualAnnual Fishery
Mortality Mortality SARNMFS + Serious + Serious Strategic Last
Species Stock Area Center N est CV N est N min R max Fr PBR Injury Injury Status Revised
Risso’s dolphin Hawaii SWC 7,256 0.41 5,207 0.04 0.5 42 0.6 0.6 N 2002 2010 2013
Common Bottlenose dolphin Hawaii Pelagic SWC 5,950 0.59 3,755 0.04 0.5 38 0.2 0.2 N 2002 2010 2013
Common Bottlenose dolphin Kaua'I and Ni'ihau SWC 184 0.11 168 0.04 0.5 1.7 unk unk N 2003 2004 2005 2013
Common Bottlenose dolphin O'ahu SWC 743 0.54 485 0.04 0.5 4.9 unk unk N 2002 2003 2006 2013
Common Bottlenose dolphin 4 Islands Region SWC 191 0.24 156 0.04 0.5 1.6 unk unk N 2002 2003 2006 2013
Common Bottlenose dolphin Hawaii Island SWC 128 0.13 115 0.04 0.5 1.1 unk unk N 2002 2003 2006 2013
Pantropical Spotted dolphin Hawaii Pelagic PIC 15,917 0.40 11,508 0.04 0.5 115.0 0 0 N 2002 2010 2013
Pantropical Spotted dolphin O'ahu PIC unk unk unk 0.04 0.5 undet unk unk N n/a 2013
Pantropical Spotted dolphin 4 Islands Region PIC unk unk unk 0.04 0.5 undet unk unk N n/a 2013
Pantropical Spotted dolphin Hawaii Island PIC unk unk unk 0.04 0.5 undet unk unk N n/a 2013
Spinner dolphin Hawaii Pelagic PIC unk unk unk 0.04 0.5 undet 0 0 N 2002 2010 2013
Spinner dolphin Hawaii Island PIC 820 0.04 793 0.04 0.5 7.9 unk unk N 1994 2003 2011 2013
Spinner dolphin Oahu / 4 Islands PIC 355 0.09 329 0.04 0.5 3.3 unk unk N 1993 1998 2007 2013
Spinner dolphin Kaua'I / Ni'ihau PIC 601 0 509 0.04 0.5 5.1 unk unk N 1995 1998 2005 2013
Spinner dolphin Kure / Midway PIC unk unk unk 0.04 0.5 undet unk unk N 1998 2010 2013
Spinner dolphin Pearl and Hermes Reef PIC unk unk unk 0.04 0.5 undet unk unk N n/a 2013
Spinner dolphin American Samoa PIC unk unk unk 0.04 0.5 unk unk unk unk n/a 2010
Striped dolphin Hawaii Pelagic PIC 20,650 0.36 15,391 0.04 0.5 154 unk unk N 2002 2010 2013
Fraser’s dolphin Hawaii PIC 16,992 0.66 10,241 0.04 0.5 102 0 0 N 2002 2010 2010
Melon-headed whale Hawaiian Islands PIC 5,794 0.20 4,904 0.04 0.5 49 0 0 N 2002 2010 2013
Melon-headed whale Kohala Resident PIC 447 0.12 404 0.04 0.5 4.0 0 0 N 2009 2013
Pygmy killer whale Hawaii PIC 3,433 0.52 2,274 0.04 0.5 23.0 0 0 N 2002 2010 2013
False killer whale Northwestern Hawaiian Islands PIC 552 1.09 262 0.04 0.5 2.6 0 0 N 2010 2013
False killer whale Hawaii Pelagic PIC 1,503 0.66 906 0.04 0.5 9.1 12.6 12.6 S 2002 2010 2013
False killer whale Palmyra Atoll PIC 1,329 0.65 806 0.04 0.4 6.4 0.3 0.3 N 2005 2013
False killer whale Main Hawaiian Islands Insular PIC 151 0.20 129 0.04 0.1 0.3 0.1 0.1 S 2009 2010 2011 2013
False killer whale American Samoa PIC unk unk unk 0.04 0.5 unk unk unk unk n/a n/a n/a 2010
Killer whale Hawaii PIC 101 1.00 50 0.04 0.5 1.0 0 0 N 2002 2010 2013
Pilot whale, short-finned Hawaii PIC 12,422 0.43 8,782 0.04 0.4 70 0.1 0.1 N 2002 2010 2013
Blainville’s beaked whale Hawaii Pelagic PIC 2,338 1.13 1,088 0.04 0.5 11.0 0 0 N 2002 2010 2013
Longman's Beaked Whale Hawaii PIC 4,571 0.65 2,773 0.04 0.5 28.0 0 0 N 2002 2010 2013
Cuvier’s beaked whale Hawaii Pelagic PIC 1,941 0.70 1,142 0.04 0.5 11.4 0 0 N 2002 2010 2013
Pygmy sperm whale Hawaii PIC unk unk unk 0.04 0.5 undet 0 0 N 2002 2010 2013
Dwarf sperm whale Hawaii PIC unk unk unk 0.04 0.5 undet 0 0 N 2002 2010 2013
Sperm whale Hawaii PIC 3,354 0.34 2,539 0.04 0.1 10.2 0.7 0.7 S 2002 2010 2013
Blue whale Central North Pacific PIC 81 1.14 38 0.04 0.1 0.1 0 0 S 2002 2010 2013
Fin whale Hawaii PIC 58 1.12 27 0.04 0.1 0.1 0 0 S 2002 2010 2013
Bryde’s whale Hawaii PIC 798 0.28 633 0.04 0.5 6.3 0 0 N 2002 2010 2013
Sei whale Hawaii PIC 178 0.90 93 0.04 0.1 0.2 0.2 0.2 S 2002 2010 2013
Minke whale Hawaii PIC unk unk unk 0.04 0.5 undet 0 0 N 2002 2010 2013
Humpback whale American Samoa SWC unk unk 150 0.106 0.1 0.4 0 0 S 2006 2007 2008 2009
Sea Otter Southern USFWS 2,826 n/a 2,723 0.06 0.1 8 0.8 0.8 S 2006 2007 2008 2008
Sea Otter Washington USFWS n/a n/a 1,125 0.2 0.1 11 0.2 0.2 N 2006 2007 2008 2008
Recent Abundance Surveys
306