harambee neighborhood - lisc institute for … · 14 3 greater bethlehem temple ... located across...
TRANSCRIPT

Page1 Milwaukee Sustainable Communities Indicators Monitoring Report, October 2011
LISC Sustainable Communities InitiativeNeighborhood:Harambee
Harambee NeighborhoodThe Harambee (translates to “all pull together” in Swahili) Neighborhood is located just north of Milwaukee’s central business district and is bounded by I-43 on the west, Capital Drive and the rail corridor on the north, Holton Street on the east, and Center Street to the south. Former mayor Frank Zeidler – Milwaukee’s last Socialist mayor – called the neighborhood home un�l his death in 2006.
The neighborhood was first se�led by early German-Americans in the 1800s but became the center of Milwaukee’s African American community by the 1950s. In recent history, it has been heavily affected by redlining, slum clearance, construc�on of the I-43 freeway, and race riots in the summer of 1967.
As a lower to middle-class, predominantly African-American neighborhood, Harambee has recently seen an influx of upper income residents to its south and east, along its borders with Brewers Hill and River West, while the northern end is also enjoying extensive residen�al rehabilita�on through the partnership of the City with churches, private businesses, philanthropy, neighborhood groups, business improvement districts, non-profit community development corpora�ons, and the police department.
Page2 Milwaukee Sustainable Communities Indicators Monitoring Report, October 2011
LISC Sustainable Communities InitiativeNeighborhood:Harambee
��
�
�
�
�
�
�
��
��
��
��
��
��
��
��
��
��
��
��
��
��
��
��
����
��
��
��
��
��
��
��
��
��
��
��
��
��
��
��
��
��
��
��
��
��
����
��
��
��
��
��
��
��
��
��
��
��
��
��
��
��
��
��
��
��
��
��
��
��
��
��
��
��
��
��
��
��
����
��
��
��
��
��
��
��
��
��
���
���
���
���
���
���
���
���
���
��
��
��
����
���
���
���
��
���
������
������
���
���
����
��
��
���
��
��
��
��
��
���
��
��
����
��
���
��
���
���
§̈¦43
2700 N CENTER ST
2800 N HADLEY ST
2600 N CLARK ST
3000 N CHAMBERS ST
2900 N LOCUST ST
3100 N BURLEIGH ST
3200 N AUER AV
3300 N CONCORDIA AV
3400 N TOWNSEND ST
3500 N KEEFE AV
4000 N CAPITOL DR
3900 N MELVINA ST
3800 N ABERT PL
3700 N VIENNA AV
3600 N NASH ST
200
W 2
ND
ST
300
W M
ARTI
N L
KIN
G J
R D
R
400
W 4
TH S
T
500
W 5
TH S
T
100
W 1
ST S
T
100
E PA
LMER
ST
600
W 6
TH S
T
700
W 7
TH S
T
500
E H
OLT
ON
ST
200
E H
UBB
ARD
ST
300
E R
ICH
ARD
S ST
400
E BU
FFU
M S
T
W ATKINSON AV
Old Number New NameChurches
2 1 All People's Gathering-ELCA3 2 Bethel Temple4 3 CAC Grace Gospel Center5 4 DS Pentecostal Church6 5 Ebenezer COGIC7 6 Ephesians Missionary Church8 7 Faith Christian Outreach Center9 8 Faith Fellowship Missionary
10 9 Fellowship Church11 10 Free Will Community Baptist12 11 God's Restored Hope13 12 Grace Fellowship Church14 13 Greater Bethlehem Temple16 14 Hallowed Missionary Baptist17 15 Holly Grove Missionary Baptist18 16 Holy Ghost Lutheran19 17 Holy Miracle Church20 18 Iglesia Genesis Inc21 19 Johnsons Temple Church22 20 King Solomon Missionary Baptist Church23 21 Marantha King of Kings COGIC24 22 Midwest Church of Christ25 23 Mount Moriah Baptist Church27 24 Mt Horeb Baptist Church26 25 Mt Zion COGIC28 26 New Covenant Christian Ministry29 27 New Life Presbyterian30 28 Pentecostal Deliverance Spiritual Church31 29 Philippian Church of God in Christ32 30 Pilgrim Baptist Church33 31 Pleasant Grove Missionary Church34 32 Praise Temple35 33 Riverwest Community Church36 34 Robert Thomas AME Church37 35 Shiloh Tabernacle38 36 Solomon Community Church39 37 St. John Concordia AME Church40 38 St. Martin de Porres Church41 39 St. Phillip's Lutheran Church42 40 True Love Missionary Baptist43 41 Zebaoth Lutheran
School44 42 Aurora Weir Center45 43 Dr. Brenda Noach Choice School 46 44 Green Bay Avenue Public School47 45 Harambee Community School
46 Hope School48 47 Malaika Early Learning Center49 48 Malcolm X Academy50 49 Messmer High School51 50 MLK Elementary School53 51 St. Phillip Lutheran Preschool54 52 St. Phillip Lutheran School (Elementary)
Social Services56 53 5th District Police Station57 54 Acclaim Inc.58 55 Adult Learning Center59 56 Career Planning Resource Center-CPRC60 57 Center for Teaching Entrepreneurship61 58 Clinton Rose Center62 59 Coalition for Community Health63 60 Greater Philadelphia COGIC Resource Center64 61 Harambee Ombudsman Project, Inc.65 62 Head Start Center66 63 HeartLove Place55 64 Hope High School67 65 Intercessions, Inc.68 66 Interfaith/Garfield Peace69 67 Isaac Coggs Clinic70 68 League of Martin71 69 Martin Luther King Economic Dev Corp72 70 MetalHouse73 71 Micah, Inc.74 72 Milwaukee Fire Dept - Battalion 2/Engine 1875 73 Milwaukee Health Services76 74 New Gospel Community Center77 75 New Opportunities Center78 76 SDC Head start Center79 77 Social Development Commission80 78 St. Conrad Friary - St. Martin de Porres81 79 STD Specialties Clinic82 80 Vincent Center83 81 Wisconsin FACETS, Inc.84 82 Women In Transition Service Inc.85 83 Women's Business Initiative86 84 Women's Correctional Facility87 85 YMCA Holton Youth Center
Residential Development88 86 Calvary Housing Development
87 CCP Rehab88 Habitat for Humanity - New Construction
90 89 HACM Houses91 90 Holton Terrace Apartments92 91 King Drive Commons Phase 293 92 Leon Sullivan Townhouses
93 MCSC Rehab89 94 Park Hill Sr. Apartments94 95 VOA Facility
Commercial Development96 Finesse Jazz Club
95 97 Lena's Groceries96 98 Ponderosa Restaurant97 99 QF & H Diner
Mixed Use Development98 100 King Commons
Proposed Redevelopment101 Fresh Start Rehab102 Hope K-12 School - Future Site103 King Drive Green Market 104 New Harambee Homesites
105 105 Recreational Trail99 106 Riverworks Commerce Center
107 Shiloh Senior Housing108 Targeted Investment Neighborhood
Other100 109 Ameritech King Commerce Center
110 Harambee Community Gardens102 111 Martin Luther King Library103 112 Milwaukee Community Journal104 113 Milwaukee Enterprise Center106 114 US Postal Service107 115 Zeidler Historic Home
���������������������������������
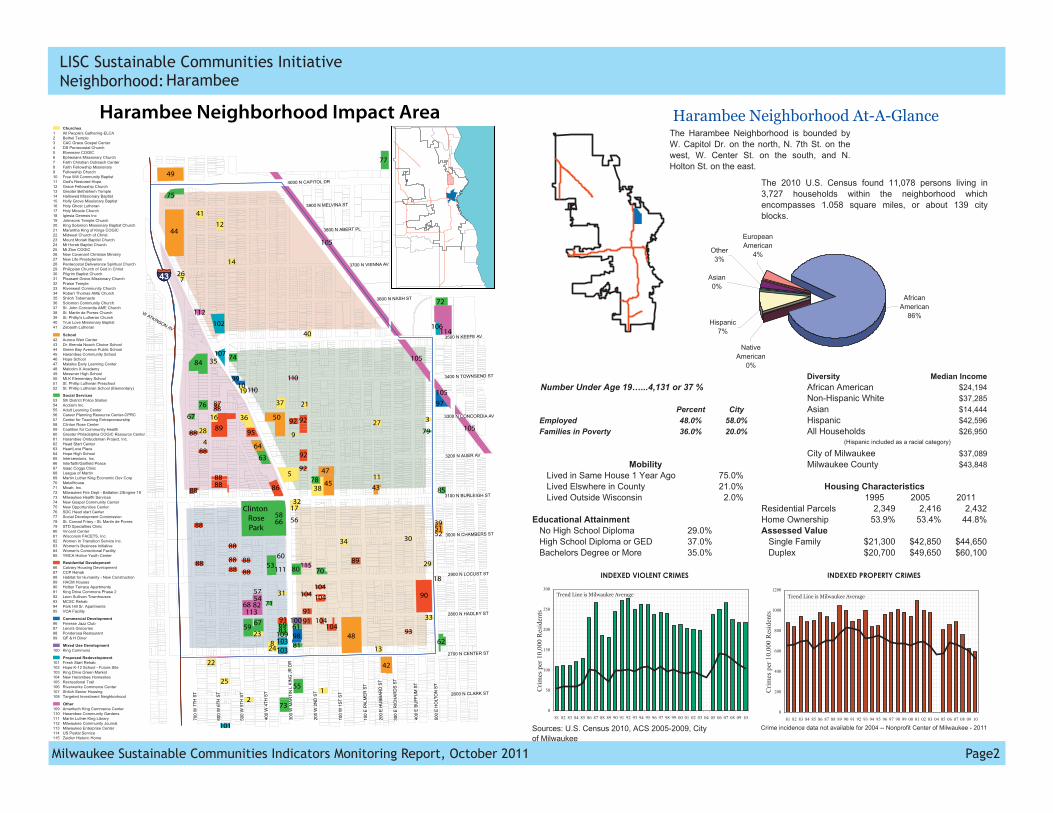
Diversity Median IncomeAfrican American $24,194Non-Hispanic White $37,285
Percent City Asian $14,444Employed 48.0% 58.0% Hispanic $42,596Families in Poverty 36.0% 20.0% All Households $26,950
City of Milwaukee $37,089Milwaukee County $43,848
Lived in Same House 1 Year Ago 75.0%Lived Elswhere in County 21.0%Lived Outside Wisconsin 2.0% 1995 2005 2011
Residential Parcels 2,349 2,416 2,432Educational Attainment Home Ownership 53.9% 53.4% 44.8%
No High School Diploma 29.0% Assessed ValueHigh School Diploma or GED 37.0% Single Family $21,300 $42,850 $44,650Bachelors Degree or More 35.0% Duplex $20,700 $49,650 $60,100
Crime incidence data not available for 2004 -- Nonprofit Center of Milwaukee - 2011Sources: U.S. Census 2010, ACS 2005-2009, City of Milwaukee
Harambee Neighborhood At-A-GlanceThe Harambee Neighborhood is bounded byW. Capitol Dr. on the north, N. 7th St. on thewest, W. Center St. on the south, and N.Holton St. on the east.
(Hispanic included as a racial category)
Housing Characteristics
Mobility
Number Under Age 19…...4,131 or 37 %
The 2010 U.S. Census found 11,078 persons living in3,727 households within the neighborhood whichencompasses 1.058 square miles, or about 139 cityblocks.
AfricanAmerican
86%Hispanic
7%
Asian0%
Other3%
NativeAmerican
0%
EuropeanAmerican
4%
INDEXED VIOLENT CRIMES
0
50
100
150
200
250
300
81 82 83 84 85 86 87 88 89 90 91 92 93 94 95 96 97 98 99 00 01 02 03 04 05 06 07 08 09 10
Crim
es p
er 1
0,00
0 R
esid
ents
Trend Line is Milwaukee Average
INDEXED PROPERTY CRIMES
0
200
400
600
800
1000
1200
81 82 83 84 85 86 87 88 89 90 91 92 93 94 95 96 97 98 99 00 01 02 03 04 05 06 07 08 09 10
Crim
es p
er 1
0,00
0 R
esid
ents
Trend Line is Milwaukee Average

Page3 Milwaukee Sustainable Communities Indicators Monitoring Report, October 2011
LISC Sustainable Communities InitiativeNeighborhood:Harambee
The indicators found in this study show that Harambee is a neighborhood that has suffered greatly in recent years, but is receiving substan�al investment from community development organiza�ons. Some indicators are beginning to show posi�ve trends.
Many housing indicators are trending nega�ve in Harambee.; Supply, value of sales, home ownership of single family and duplex, foreclosure rate, value and number of tax delinquencies. Posi�ve indicators are assessed value, ra�o of value of duplex to single family homes, number of arm’s length sales, share of Milwaukee’s arm’s length sales, value and number of construc�on permits and percent of loans that are “high cost.”
Employment indicators for Hambee show a decrease in the number of residents that are employed at the same �me that the number of jobs in the neighborhood increased. Indicators of income and wealth, like housing indicators, give mixed results. The number of families receiving W-2 benefits decreased greatly and the poverty rate was slightly reduced. The average adjusted income and the ra�o of income of new home buyers in Harambee compared to the city are both decreasing.
Indicators of community and culture show mostly posi�ve trends. Although violent crime increased, property crime and vacancy rates were down. The number of nonprofits increased and voter par�cipa�on increased for gubernatorial elec�ons and maintained historically high levels for presiden�al elec�ons.
Although enrollment in Harambee schools was down, a�endance rate and proficiency in math and reading increased. A lower percentage of students qualified for free or reduced cost lunch.
Harambee Comparison NeighborhoodsSeveral comparison neighborhoods were chosen in an a�empt to track progress within the target neighborhoods and to determine whether investments made as a result of the Sustainable Communi�es Ini�a�ve might result in change to measured indicators. While many factors influence neighborhood trends, every effort has been made to choose comparison areas with similar characteris�cs that are following similar trends as the target neighborhood. For a detailed discussion of how these neighborhoods were constructed in Milwaukee see appendix.
NH
OLT
ON
ST
W NORTH AV
W CENTER ST
W WALNUT ST
W CAPITOL DRW CAPITOL DR
S1S
TST
N27
THST
W BURLEIGH STW BURLEIGH ST
W NORTH AV
W HIGHLAND BL
W WISCONSIN AV
N20
THST
N35
THST
N35
THST
N12
THST
W MITCHELL ST
SC
ESAR
EC
HAV
EZD
R
S35
THST
W GREENFIELD AV
E KENWO
E N
E
E ED
AV
W LISBON AV
SLA
YTO
NBL
W NATIONAL AV
Harambee
Tract 47
Tract 65
Trac
t84
Trac
t101
Tract 165
§̈¦43
§̈¦794§̈¦94
§̈¦43-94
Harambee Comparison Tracts

Page4 Milwaukee Sustainable Communities Indicators Monitoring Report, October 2011
LISC Sustainable Communities InitiativeNeighborhood:Harambee
Tract 65 - This tract is found at the north central edge of the north side central city in the Franklin Heights neighborhood. Tract 65 is directly south of tract 47.
Two comparison tracts face greater challenges than the Harambee target:
Tract 101 –Tract 101 (also a “match” for the Washington Park target) is in the center of the north side central city. It is located in the small Triangle North neighborhood, just to the northeast of the Midtown neighborhood. Part of the tract is in the North Division neighborhood to the north of Triangle North. Almost 40% of the residents of this tract are children, with a high propor�on ages 10-19.
Tract 84 - Tract 84 is part of a very old, poor community located in the center of the north side central city. It is located in the North Division neighborhood just west of Interstate 94, with North Division High School located within its borders. Historically, this area depended upon King Drive retail development located across the freeway in the Harambee neighborhood.
Two comparison tracts are somewhat be�er off than the Harambee target:
Tract 47 - Homes in tract 47 are somewhat newer than other comparison tracts - primarily built between 1910 and1920. Tract 47 is in a declining industrial area, but historically this was a working class community with less a�rac�ve housing stock than surrounding areas.
Tract 165 - Tract 165 is on the near south side, bisected by Interstate 94. Parts of the tract are in the Walker’s Point, Clock Tower Acres and Historic Mitchell Street neighborhoods. The housing is as old as North side Central City housing, but is in somewhat be�er condi�on than in those areas.
§̈¦43
£¤43
N9T
HST
NH
OLT
ON
ST
N8T
HST
N7T
HST
NR
ICH
ARD
SST
N3R
DST
N1S
TST
NPI
ERC
EST
NBR
EMEN
ST
NBU
FFU
MST
N5T
HST
NM
ARTI
NL
KIN
GJR
DR
N2N
DST
N6T
HST
N4T
HST
W KEEFE AV
E VIENNA AV
E HADLEY ST
E LOCUST ST
E CAPITOL DR
E CENTER ST
W LOCUST ST
W CENTER ST
E KEEFE AV
E AUER AV
W RING ST
W CAPITOL DR
E BURLEIGH STW BURLEIGH ST
E CHAMBERS ST
E CONCORDIA AV
W HADLEY ST
NPO
RTW
ASH
ING
TON
AV
E NASH ST
W AUER AV
W MELVINA ST
W CHAMBERS ST
N2N
DLA
W ABERT PL
W VIENNA AV
W CONCORDIA AV
NJULIA
ST
NPA
LMER
ST
NAC
HIL
LES
ST
E TOWNSEND ST
NFR
ATN
EYST
W ATKINSON AV
E ABERT PL
NH
UBB
ARD
ST
NBO
OTH
ST
W CHRISTINE LA
NHUMBOLDT
BL
E MELVINA ST
W TOWNSEND ST
N8T
HST
NPA
LMER
ST
W CONCORDIA AV
N4T
HST
N8T
HST
N8TH
ST
N7T
HST
N4T
HST
NBR
EMEN
ST
N6T
HST
W VIENNA AV
N5T
HST
N1S
TST
N1S
TST
E TOWNSEND ST
N6T
HST
NPA
LMER
ST
N2N
DST
N2N
DST
N6T
HST
N1S
TST
NFR
ATN
EYST
Source: City of Milwakee Master Property File Nonprofit Center of Milwaukee 2011
Harambee NeighborhoodLand Use 2011
Agriculture
CEMETARY
Church / Religios Org
Duplex
Manufacturing / Const / Warehouse
Mixed Commercial
Mixed Residential
Apartment
Parks
Quasi-Public
Schools
Service / Fire
Single Family
Transportation
Under Construction
Vacant Lot
Wholesale / Retail

Page5 Milwaukee Sustainable Communities Indicators Monitoring Report, October 2011
LISC Sustainable Communities InitiativeNeighborhood:Harambee
Domain:
ylppuS gnisuoH1102-0002 slecraP laitnediseR fo rebmuN
0
005
000,1
005,1
000,2
005,2
000,3
110201029002800270026002500240023002200210020002
Num
ber o
f Res
iden
tial P
arce
ls
eebmaraH stcarT nosirapmoC
Change in Housing Supply2000-2011
-10.0% -8.0% -6.0% -4.0% -2.0% 0.0%
Harambee
Tract 47
Tract 65
Tract 84
Tract 101
Tract 165
Housing
Single Family Homes (Land use pattern)Data Source: City of Milwaukee Master Property File
Single Family housing, when combined with high home ownership rates, represents a more typical neighborhood pa�ern. Older communi�es in Milwaukee have a substan�al number of duplex units which are increasingly less valued by residents. Replacement pa�erns are crea�ng lower density, but an increasingly sustainable housing mix.
Since 1990, Harambee has seen a long, slow decrease in the number of residen�al parcels and units coincident with an overall popula�on decline of 26% between the 1990 and 2010 U.S. Census. The number of residen�al parcels and the number of housing units in the neighborhood both decreased slightly in Harambee from 2000-2011.
Housing
Population1990, 2000, and 2010
0
2,000
4,000
6,000
8,000
10,000
12,000
14,000
16,000
18,000
1990 2000 2010
Harambee Harambee Comparison Tracts

Page6 Milwaukee Sustainable Communities Indicators Monitoring Report, October 2011
LISC Sustainable Communities InitiativeNeighborhood:Harambee
Domain:
Number of Housing Units 1990, 2000, 2010
0
1,000
2,000
3,000
4,000
5,000
6,000
7,000
8,000
1990 2000 2010
Harambee Harambee Comparison Tracts
The housing mix favors Duplex units (55%) with smaller contribu�ons from Single Family units (24%) and Apartments (21%). Harambee has propor�onately many more duplex units than the city as a whole (29%).
In the last five years, Habitat for Humanity has targeted the neighborhood and with the help of Thrivent constructed 50 homes, reversing the decline from 1984 through 2002, Habitat homes generally have larger lot sizes than previous development resul�ng in lower overall housing density in the neighborhood. No Habitat homes were built in Harambee comparison tracts during this period.
The number of residen�al parcels in all comparison tracts combined declined since 2000 at a rate very close to that for Harambee. Comparison tracts consistently had about two hundred more residen�al parcels than the Harambee neighborhood. More than 1/3 of residen�al parcels in comparison tracts are found in tract 47.
Like the Harambee neighborhood, the housing supply in comparison tracts is favored by units in duplex parcels, but here single family homes are also a high percentage of housing units. Duplexes account for 53% of housing units, single family homes account for 32% of units and apartments account for the remaining 15% of units.
Housing
Housing Supply - 2011
Duplex55%
SingleFamily24%
Apartments21%
Harambee Comparison Tracts Housing Supply - 2011
Apartments15%
SingleFamily32%
Duplex53%

Page7 Milwaukee Sustainable Communities Indicators Monitoring Report, October 2011
LISC Sustainable Communities InitiativeNeighborhood:Harambee
Domain:
Value of Property SalesData Source: City of Milwaukee Assessor’s Office
The current price being paid for homes reflects the strength of the housing market and ul�mately, the value of all homes in the neighborhood. It will be appropriate to consider sales of new homes separately from the sales of older homes as this market develops. The measure is limited to “arms length” sales - with independent sellers and buyers and without discounts.
The housing market in Harambee experienced a boom and bust cycle during the 2000’s fueled primarily by Real Estate specula�on and easily available credit. Milwaukee saw a more gradual rise and fall of sales prices - the current median is within 10% of the peak value. The median sales price and total number of sales for Harambee proper�es peaked in 2006 at $91,500 and 226 sales. The graph shows a three year rolling average that peaks in 2005 – 2007. The median sales price for Milwaukee at this �me was $142,150, down from a peak of $143,392 in 2004 – 2006. By 2010 sales prices and volume had dropped substan�ally; the median price for Harambee property sales dropped to only $32,500 for 12 sales.
Housing sales volume and value for comparison tracts as a whole have tracked very closely with Harambee for the en�re period from 1995 un�l 2010. The trend in median sales price for tracts 47, 65 and 84 fit a similar pa�ern to the Harambee neighborhood but at consistently lower prices. A more vola�le pa�ern is seen in tracts 84 and 101 where few sales occurred.
The value of all housing sales generally rose in Milwaukee from 1995 to 2009, with the strongest rise during the period 2002 to 2006. This is due to new construc�on sales and par�cularly condo development as well as gentrifica�on of several neighborhoods near the downtown business district. A few comparison neighborhoods lost value early in this cycle, including tracts 101 and 84, but rebounded drama�cally a�er 1998.
Housing
Value of Housing Sales2000-02 - 2008-10
$0
$20,000
$40,000
$60,000
$80,000
$100,000
$120,000
$140,000
$160,000
00-02 01-03 02-04 03-05 04-06 05-07 06-08 07-09 08-10
Med
ian
Sale
s Pr
ice
Milwaukee City Harambee Comparison Tracts
Points plot a threeyear rolling average
Change in Value of Housing Sales2000-02 - 2008-10
-80% -60% -40% -20% 0% 20% 40% 60% 80% 100%
Harambee
Tract 47
Tract 65
Tract 84
Tract 101
Tract 165
Three year rollng average
Page8 Milwaukee Sustainable Communities Indicators Monitoring Report, October 2011
LISC Sustainable Communities InitiativeNeighborhood:Harambee
Domain:
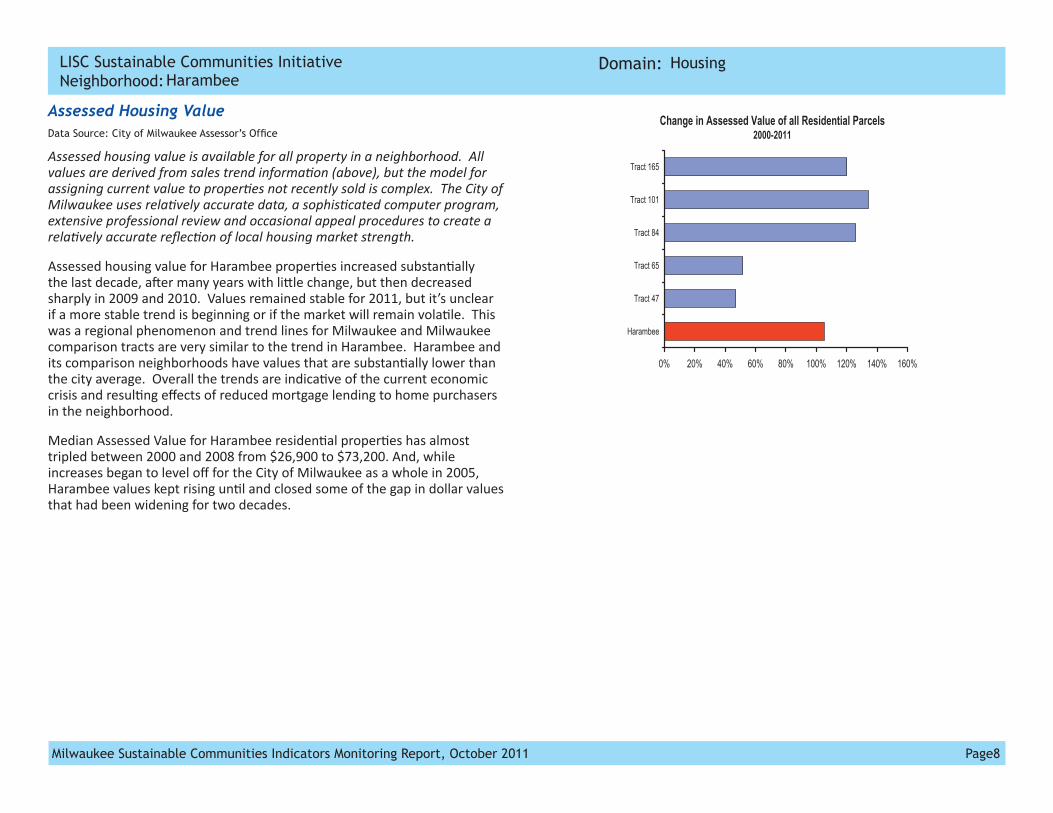
Assessed Housing ValueData Source: City of Milwaukee Assessor’s Office
Assessed housing value is available for all property in a neighborhood. All values are derived from sales trend informa�on (above), but the model for assigning current value to proper�es not recently sold is complex. The City of Milwaukee uses rela�vely accurate data, a sophis�cated computer program, extensive professional review and occasional appeal procedures to create a rela�vely accurate reflec�on of local housing market strength.
Assessed housing value for Harambee proper�es increased substan�ally the last decade, a�er many years with li�le change, but then decreased sharply in 2009 and 2010. Values remained stable for 2011, but it’s unclear if a more stable trend is beginning or if the market will remain vola�le. This was a regional phenomenon and trend lines for Milwaukee and Milwaukee comparison tracts are very similar to the trend in Harambee. Harambee and its comparison neighborhoods have values that are substan�ally lower than the city average. Overall the trends are indica�ve of the current economic crisis and resul�ng effects of reduced mortgage lending to home purchasers in the neighborhood.
Median Assessed Value for Harambee residen�al proper�es has almost tripled between 2000 and 2008 from $26,900 to $73,200. And, while increases began to level off for the City of Milwaukee as a whole in 2005, Harambee values kept rising un�l and closed some of the gap in dollar values that had been widening for two decades.
Housing
Change in Assessed Value of all Residential Parcels2000-2011
0% 20% 40% 60% 80% 100% 120% 140% 160%
Harambee
Tract 47
Tract 65
Tract 84
Tract 101
Tract 165

Page9 Milwaukee Sustainable Communities Indicators Monitoring Report, October 2011
LISC Sustainable Communities InitiativeNeighborhood:Harambee
Domain:
Assessed Value Relative to the City2000 - 2011
-$80,000
-$70,000
-$60,000
-$50,000
-$40,000
-$30,000
-$20,000
-$10,000
$02000 2001 2002 2003 2004 2005 2006 2007 2008 2009 2010 2011
Med
ian
Ass
esse
d Va
lue
Harambee Har Comp Tracts
Assessed Value of all Residential Parcels2000-2011
$0
$20,000
$40,000
$60,000
$80,000
$100,000
$120,000
$140,000
2000 2001 2002 2003 2004 2005 2006 2007 2008 2009 2010 2011
Med
ian
Valu
e
Harambee Milwaukee City Har Comp Tracts
The Assessed value trends in comparison tracts were very similar to the Harambee trend. Assessed values were less in comparison tracts, except for tract 165 which had consistently higher values than Harambee, and tract 47 which also had consistently higher values un�l 2008 - 2010 when it was slightly lower.
The distribu�on of housing values in Harambee skews towards the lower end of the scale with a very high percentage of proper�es valued between $40k and $100k. Harambee has rela�vely more proper�es under $100k and rela�vely fewer proper�es over $100k than Milwaukee as a whole.
Riverwest, the neighborhood directly east of Harambee, experienced large uniform increases in housing values over the 15 year period between 1995 and 2011. As seen on the maps on the following pages, that trend quickly dissipates west of the neighborhood boundary at Holton Street and is generally not found in the Harambee neighborhood. Some parts of Harambee did see increases in value, however, including a corridor along North 2nd Street and the blocks surrounding the intersec�on of Mar�n Luther King Drive and Burleigh Street where numerous residen�al redevelopment projects have been completed.
Growth in assessed values for duplexes has been weaker than for single family parcels.
Housing

Page10 Milwaukee Sustainable Communities Indicators Monitoring Report, October 2011
LISC Sustainable Communities InitiativeNeighborhood:Harambee
Domain:
£¤43
N9T
HST
N13
THST
NHOLTONST
N8T
HST
N7T
HST
N11TH
ST
N12
THST
N3R
DST
NRICHAR
DSST
N1S
TST
NBU
FFUMST
W KEEFE AV
N5T
HST
NMAR
TINLKINGJR
DR
N2N
DST
W LOCUST ST
W CENTER ST
W CAPITOL DR
W BURLEIGH ST
N6T
HST
N4T
HST
N11TH
LA
W RING ST
W ATKINSON AV
N10
THLA
N10
THST
W HADLEY ST
E KEEFE AV
NPO
RTWAS
HINGTO
NAV
W AUER AV
W MELVINA ST
W CHAMBERS ST
E CAPITOL DR
E HADLEY ST
E LOCUST ST
E CENTER ST
N2N
DLA
E VIENNAAV
W ABERT PL
E BURLEIGH ST
W VIENNAAV
W CONCORDIA AV
E CHAMBERS ST
E CONCORDIAAV
NJULIA
ST
NPA
LMER
ST
E AUER AV
W FINN PL
E NASH ST
NAC
HILLE
SST
E TOWNSEND ST
E ABERT PL
N9T
HLA
W CHRISTINE LA
W MESSMER ST
W TOWNSEND ST
E MELVINA ST
NPA
LMER
ST
N8TH
ST
W CONCORDIA AV
W CONCORDIA AV
N8T
HST
N10
THST
W CHAMBERS ST
W ABERT PL
N2N
DST
N4T
HST
N7T
HST
N1S
TST
N6T
HST
N5T
HST
N1S
TST
NPA
LMER
ST
N1S
TST
N6T
HST
W RING ST
N10
THST
N2N
DST
N6T
HST
N4T
HST
N12
THST
W VIENNAAV
§̈¦43§̈43
Source: City of Milwakee Master Property File Nonprofit Center of Milwaukee 2011
Harambee Neighborhood
Assessed Value 2008< $25,000
$25,000 - $50,000
$50,000 - $75,000
$75,000 - $100,000
$100,000 - $125,000
$125,000 - $150,000
> $150,000
Non-residential
£¤43
N9T
HST
NH
OLT
ON
ST
N8T
HST
N11
THST
N12
THST
N7T
HST
NR
ICH
ARD
SST
N3R
DST
N1S
TST
NBU
FFU
MST
N5T
HST
W KEEFE AV
NM
ARTI
NL
KIN
GJR
DR
W LOCUST ST
W CENTER ST
N2N
DST
W CAPITOL DR
W BURLEIGH ST
N6T
HST
N4T
HST
N11
THLA
W RING ST
N10
THLA
W ATKINSON AV
N10
THST
W HADLEY ST
E KEEFE AV
NPO
RT
WAS
HIN
GTO
NAV
W AUER AV
W MELVINA ST
W CHAMBERS ST
E CAPITOL DR
E HADLEY ST
E LOCUST ST
E CENTER ST
E VIENNA AV
N2N
DLA
W ABERT PL
E BURLEIGH ST
W VIENNA AV
W CONCORDIA AV
E CHAMBERS ST
E CONCORDIA AV
NJULIA
ST
NPA
LMER
ST
E AUER AV
E NASH ST
NAC
HIL
LES
ST
E TOWNSEND ST
E ABERT PL
W FINN PL
N9T
HLA
W CHRISTINE LA
W RANDOLPH ST
NG
REENBAY
AV
W MESSMER ST
W TOWNSEND ST
E MELVINA ST
W CAPITOL PL
N8TH
ST
W RING ST
NPA
LMER
ST
E NASH ST
W CONCORDIA AV
N4T
HST
N8T
HST
W RANDOLPH ST
N11
THST
N6T
HST
N2N
DST
W ABERT PL
N5T
HST
N10
THST
N1S
TST
W CHAMBERS ST
N1S
TST
N10
THST
N12
THST
N1S
TST
N6T
HST
N2N
DST
N2N
DST
N6T
HST
N4T
HST
W VIENNA AV
N7T
HST
W CONCORDIA AV
§̈¦43
Source: City of Milwakee Master Property File Nonprofit Center of Milwaukee 2011
Harambee Neighborhood
Assessed Value 2011< $25,000
$25,000 - $50,000
$50,000 - $75,000
$75,000 - $100,000
$100,000 - $125,000
$125,000 - $150,000
> $150,000
Non-residential
Housing

Page11 Milwaukee Sustainable Communities Indicators Monitoring Report, October 2011
LISC Sustainable Communities InitiativeNeighborhood:Harambee
Domain:
Ratio of Duplex to Single Family Housing ValueData Source: City of Milwaukee Assessor’s Office, City of Milwaukee Master Property File
The assessed value of Duplex proper�es should be higher the value of single family proper�es. Ra�os near or below one o�en occur in neighborhoods where duplexes are investor owned, represent a small propor�on of proper�es or both. Alterna�vely, high duplex values are o�en a sign of high rates of owner occupancy and well maintained proper�es.
In recent decades, duplex parcels have had similar median assessed values as single family parcels in the Harambee neighborhood, and the ra�o of duplex to single family housing value has ranged between 0.9 and 1.1.
The value of duplex parcels rela�ve to single family parcels increased slightly between 1998 and 2005 and then sharply in 2008. The value of duplexes rela�ve to single family homes was higher in Harambee and the comparison tracts than in the City of Milwaukee as a whole. The ra�o for Milwaukee fluctuated between 0.8 and 1.0.
The ra�o in comparison tracts, like in Harambee also stayed within a narrow range of 0.9 to 1.1 in recent decades but the pa�ern of ups and downs were not coincident with those in Harambee. Like Harambee, several comparison neighborhoods saw higher rela�ve values for duplexes a�er the “bubble” for single family housing values burst in 2007.
Tract 101 has shown a marked increase in the ra�o of duplex to single family values during the middle years of the study with values over 1.6 for much of this �me, but this was largely because single family values dropped substan�ally.
Tract 165, on Milwaukee’s south side, is located in a more stable housing market. Single family homes were substan�ally undervalued at the beginning of the study and, as they gained value, the ra�o declined from 1.4, the highest of all comparison tracts in 1984, to about 1.1 in 2011.
Housing
Median Housing ValueRatio of Duplex to Single Family 2000 - 2011
0.00
0.20
0.40
0.60
0.80
1.00
1.20
1.40
1.60
2000 2001 2002 2003 2004 2005 2006 2007 2008 2009 2010 2011
Dup
lex/
Sing
le F
amily
Val
ue R
atio
Harambee Milwaukee City Comparison Tracts
Change in Median Housing ValueRatio of Duplex to Single Family 2000-2011
-30% -20% -10% 0% 10% 20% 30%
Harambee
Tract 47
Tract 65
Tract 84
Tract 101
Tract 165
Page12 Milwaukee Sustainable Communities Indicators Monitoring Report, October 2011
LISC Sustainable Communities InitiativeNeighborhood:Harambee
Domain: Housing
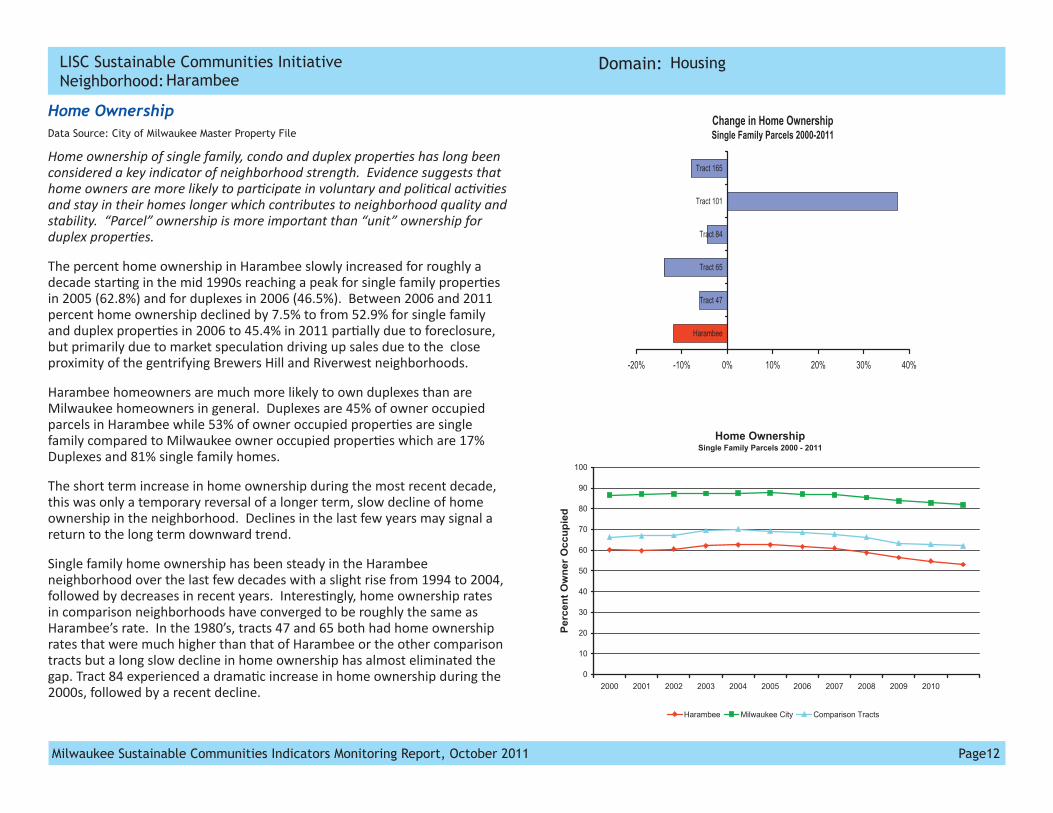
Home OwnershipData Source: City of Milwaukee Master Property File
Home ownership of single family, condo and duplex proper�es has long been considered a key indicator of neighborhood strength. Evidence suggests that home owners are more likely to par�cipate in voluntary and poli�cal ac�vi�es and stay in their homes longer which contributes to neighborhood quality and stability. “Parcel” ownership is more important than “unit” ownership for duplex proper�es.
The percent home ownership in Harambee slowly increased for roughly a decade star�ng in the mid 1990s reaching a peak for single family proper�es in 2005 (62.8%) and for duplexes in 2006 (46.5%). Between 2006 and 2011 percent home ownership declined by 7.5% to from 52.9% for single family and duplex proper�es in 2006 to 45.4% in 2011 par�ally due to foreclosure, but primarily due to market specula�on driving up sales due to the close proximity of the gentrifying Brewers Hill and Riverwest neighborhoods.
Harambee homeowners are much more likely to own duplexes than are Milwaukee homeowners in general. Duplexes are 45% of owner occupied parcels in Harambee while 53% of owner occupied proper�es are single family compared to Milwaukee owner occupied proper�es which are 17% Duplexes and 81% single family homes.
The short term increase in home ownership during the most recent decade, this was only a temporary reversal of a longer term, slow decline of home ownership in the neighborhood. Declines in the last few years may signal a return to the long term downward trend.
Single family home ownership has been steady in the Harambee neighborhood over the last few decades with a slight rise from 1994 to 2004, followed by decreases in recent years. Interes�ngly, home ownership rates in comparison neighborhoods have converged to be roughly the same as Harambee’s rate. In the 1980’s, tracts 47 and 65 both had home ownership rates that were much higher than that of Harambee or the other comparison tracts but a long slow decline in home ownership has almost eliminated the gap. Tract 84 experienced a drama�c increase in home ownership during the 2000s, followed by a recent decline.
Home OwnershipSingle Family Parcels 2000 - 2011
0
10
20
30
40
50
60
70
80
90
100
2000 2001 2002 2003 2004 2005 2006 2007 2008 2009 2010
Perc
ent O
wne
r Occ
upie
d
Harambee Milwaukee City Comparison Tracts
Change in Home OwnershipSingle Family Parcels 2000-2011
-20% -10% 0% 10% 20% 30% 40%
Harambee
Tract 47
Tract 65
Tract 84
Tract 101
Tract 165

Page13 Milwaukee Sustainable Communities Indicators Monitoring Report, October 2011
LISC Sustainable Communities InitiativeNeighborhood:Harambee
Domain:
Percent Home OwnershipDuplex Parcels 2000 - 2011
0
10
20
30
40
50
60
70
80
90
100
2000 2001 2002 2003 2004 2005 2006 2007 2008 2009 2010 2011
Perc
ent o
f Dup
lex
Parc
els
Harambee Milwaukee City Comparison Tracts
Change in Percent Duplex Home Ownership2000-2011
-25% -20% -15% -10% -5% 0% 5% 10% 15% 20%
Harambee
Tract 47
Tract 65
Tract 84
Tract 101
Tract 165
Duplex parcel ownership has also been steady in the Harambee target area. The drop from strong home ownership is most obvious for tract 41. Tract 101 has fluctuated the more than other comparison tracts, star�ng out lowest and steadily rising to just higher than all but tract 41. This indicator shows similar trends in the comparison tracts, with all but tract 165 seeing small declines recently.
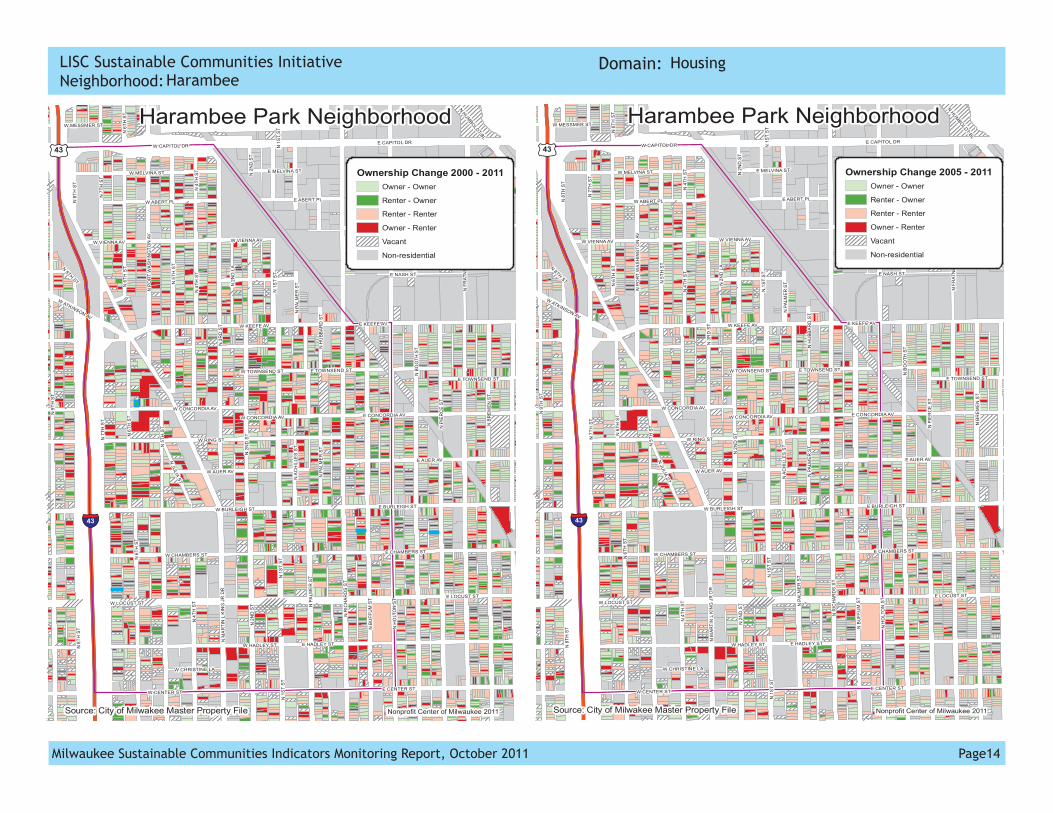
Home ownership in Harambee decreased slightly between 2000 and 2011 with most blocks that were predominately owner occupied staying that way, especially in the northern and eastern parts of the neighborhood. Many blocks in the western part of the neighborhood near Interstate 43 and in the southern part of the neighborhood were converted from owner occupied housing in 2000 to rental housing in 2010.
2011 Housing Type - Milwaukee Owner Occupied Parcels
Duplex17%
Apartments2%
SingleFamily81%
2011 Housing Type - Harambee Owner Occupied Parcels
Duplex45%
Apartments2%
SingleFamily53%
Housing
Page14 Milwaukee Sustainable Communities Indicators Monitoring Report, October 2011
LISC Sustainable Communities InitiativeNeighborhood:Harambee
Domain:
£¤43
N9T
HST
NH
OLT
ON
ST
N8T
HST
N7T
HST
NR
ICH
ARD
SST
N3R
DST
N1S
TST
NPI
ERC
EST
NBR
EMEN
ST
NBU
FFU
MST
N5T
HST
NM
ARTI
NL
KIN
GJR
DR
N2N
DST
N6T
HST
N4T
HST
W KEEFE AV
E VIENNA AV
E HADLEY ST
E LOCUST ST
E CAPITOL DR
E CENTER ST
W LOCUST ST
W CENTER ST
E KEEFE AV
E AUER AV
W RING ST
W CAPITOL DR
E BURLEIGH STW BURLEIGH ST
E CHAMBERS ST
E CONCORDIA AV
W HADLEY ST
NPO
RTW
ASH
ING
TON
AV
E NASH ST
W AUER AV
W MELVINA ST
W CHAMBERS ST
N2N
DLA
W ABERT PL
W VIENNA AV
W CONCORDIA AV
NJULIA
ST
NPA
LMER
ST
NAC
HIL
LES
ST
E TOWNSEND ST
NFR
ATN
EYST
W ATKINSON AV
E ABERT PL
NH
UBB
ARD
ST
NBO
OTH
ST
W CHRISTINE LA
NHUMBOLDT
BL
W MESSMER ST
E MELVINA ST
W TOWNSEND ST
E TOWNSEND ST
NPA
LMER
ST
NPA
LMER
ST
N8TH
ST
W CONCORDIA AV
N8T
HST
N6T
HST
N4T
HST
N7T
HST
W VIENNA AV
N6T
HST
N5T
HST
N1S
TST
NBR
EMEN
ST
NFR
ATN
EYST
N4T
HST
N1S
TST
N2N
DST
N2N
DST
N6T
HST
N1S
TST
§̈¦43
Source: City of Milwakee Master Property File Nonprofit Center of Milwaukee 2011
Harambee Park Neighborhood
Ownership Change 2005 - 2011Owner - Owner
Renter - Owner
Renter - Renter
Owner - Renter
Vacant
Non-residential
Housing
£¤43
N9T
HST
NH
OLT
ON
ST
N8T
HST
N7T
HST
NR
ICH
ARD
SST
N3R
DST
N1S
TST
NPI
ERC
EST
NBR
EMEN
ST
NBU
FFU
MST
N5T
HST
NM
ARTI
NL
KIN
GJR
DR
N2N
DST
N6T
HST
N4T
HST
W KEEFE AV
E VIENNA AV
E HADLEY ST
E LOCUST ST
E CAPITOL DR
E CENTER ST
W LOCUST ST
W CENTER ST
E KEEFE AV
E AUER AV
W RING ST
W CAPITOL DR
E BURLEIGH STW BURLEIGH ST
E CHAMBERS ST
E CONCORDIA AV
W HADLEY ST
NPO
RTW
ASH
ING
TON
AV
E NASH ST
W AUER AV
W MELVINA ST
W CHAMBERS ST
N2N
DLA
W ABERT PL
W VIENNA AV
W CONCORDIA AV
NJULIA
ST
NPA
LMER
ST
NAC
HIL
LES
ST
E TOWNSEND ST
NFR
ATN
EYST
W ATKINSON AV
E ABERT PL
NH
UBB
ARD
ST
NBO
OTH
ST
W CHRISTINE LA
NHUMBOLDT
BL
W MESSMER ST
E MELVINA ST
W TOWNSEND ST
E TOWNSEND ST
NPA
LMER
ST
NPA
LMER
ST
N8TH
ST
W CONCORDIA AV
N8T
HST
N6T
HST
N4T
HST
N7T
HST
W VIENNA AV
N6T
HST
N5T
HST
N1S
TST
NBR
EMEN
ST
NFR
ATN
EYST
N4T
HST
N1S
TST
N2N
DST
N2N
DST
N6T
HST
N1S
TST
§̈¦43
Source: City of Milwakee Master Property File Nonprofit Center of Milwaukee 2011
Harambee Park Neighborhood
Ownership Change 2000 - 2011Owner - Owner
Renter - Owner
Renter - Renter
Owner - Renter
Vacant
Non-residential

Page15 Milwaukee Sustainable Communities Indicators Monitoring Report, October 2011
LISC Sustainable Communities InitiativeNeighborhood:Harambee
Domain: Housing
Pace of Property SalesData Source: City of Milwaukee Assessor’s Office
Pace of sales can be used as a component to determine the “desirability” of a neighborhood when used in conjunc�on with other factors such as sales price, etc. A slow sales pace indicates an una�rac�ve market, although a high volume of sales could signal rapid turnover. Ideally, the pace of sales mirrors regional pa�erns.
The number of sales in the Harambee neighborhood was quite low throughout the nine�es – fewer than 20 sales per year –and remained that way un�l 2004 when sales increased sharply. The sales boom lasted three years in Harambee and was followed by a bust in 2008 - 2010. Only 35 arms-length sales were made in the neighborhood in 2008, 17 in 2009, and 12 and 2010.
The combined number of sales in comparison tracts was slightly higher than the number of sales in the Harambee neighborhood before the boom (except for 2002 when Harambee had 4 more sales), but since 2004 Harambee has had a more sales per year. Sales were sharply down in 2008 - 2010 in comparison tracts.
During the housing boom, sales in Harambee were evenly dispersed throughout the neighborhood. Sales in Harambee a�er the bust have occurred in the areas where residen�al redevelopment has occurred along 2nd Street, near the intersec�on of Mar�n Luther King Jr Blvd and Burleigh St, and in the eastern por�on of the neighborhood that borders the Riverwest neighborhood.
Total Housing Sales2000-02 - 2008-10
0
10
20
30
40
50
60
70
00-02 01-03 02-04 03-05 04-06 05-07 06-08 07-09 08-10Num
ber o
f Sal
es p
er 1
,000
Res
iden
tial P
arce
ls
Harambee Milwaukee City Har Comp Tracts
Points plot a threeyear rolling average
Change in Total Housing Sales2000-2010
-40% -30% -20% -10% 0% 10% 20% 30% 40%
Harambee
Tract 47
Tract 65
Tract 84
Tract 101
Tract 165
Three year rolling average

Page16 Milwaukee Sustainable Communities Indicators Monitoring Report, October 2011
LISC Sustainable Communities InitiativeNeighborhood:Harambee
Domain:
§̈¦43
£¤43
N9T
HST
NH
OLT
ON
ST
N8T
HST
N11
THST
N7T
HST
N3R
DS
T
NR
ICH
AR
DS
ST
N1S
TS
T
NB
UFF
UM
ST
N5T
HST
NM
AR
TIN
LK
ING
JRD
R
W KEEFE AV
N2N
DS
T
W LOCUST ST
W CENTER ST
N6T
HST
W CAPITOL DR
N4T
HST
W BURLEIGH ST
W RING ST
E KEEFE AV
N10
THLA
N10
THS
T
W HADLEY ST E HADLEY ST
E LOCUST ST
E CAPITOL DR
E VIENNA AV
E CENTER ST
NP
OR
TW
AS
HIN
GTO
NAV
W AUER AV
E BURLEIGH ST
W MELVINA ST
W CHAMBERS ST
W ATKINSON AV
N2N
DLA
W ABERT PL
E CHAMBERS ST
E CONCORDIA AV
E AUER AV
E NASH ST
W VIENNA AV
W CONCORDIA AV
NJULIA
ST
NPA
LMER
ST
NA
CH
ILLE
SS
T
E TOWNSEND ST
E ABERT PL
NH
UB
BA
RD
ST
NB
OO
THS
T
N9T
HLA
W CHRISTINE LA
W RANDOLPH ST
NG
REENBAY
AV
W MESSMER ST
W TOWNSEND ST
E MELVINA ST
W CAPITOL PL
N11
THST
N8T
HST
NPA
LMER
ST
W VIENNA AV
N10
THS
T
N1S
TS
T
E TOWNSEND ST
N8TH
ST E NASH ST
W RANDOLPH ST
N6T
HST
N4T
HST
W CHAMBERS ST
N6T
HST
N10
THS
T
N5T
HST
W ABERT PL
NPA
LMER
ST
N1S
TS
T
NPA
LMER
STN2N
DS
T
N4T
HST
N10
THS
T
N7T
HST
N2N
DS
TN
2ND
ST
N6T
HST
W RING ST
N1S
TS
T
Source: City of Milwakee Master Property File Nonprofit Center of Milwaukee 2011
Harambee Neighborhood
Sales2008 Sales
2009 Sales
2010 Sales
Non-residential
§̈¦43
£¤43
N9T
HST
NH
OLT
ON
ST
N8T
HST
N11
THST
N7T
HST
N3R
DS
T
NR
ICH
AR
DS
ST
N1S
TS
T
NB
UFF
UM
ST
N5T
HST
NM
AR
TIN
LK
ING
JRD
R
W KEEFE AV
N2N
DS
T
W LOCUST ST
W CENTER ST
N6T
HST
W CAPITOL DR
N4T
HST
W BURLEIGH ST
W RING ST
E KEEFE AV
N10
THLA
N10
THS
T
W HADLEY ST E HADLEY ST
E LOCUST ST
E CAPITOL DR
E VIENNA AV
E CENTER ST
NP
OR
TW
AS
HIN
GTO
NAV
W AUER AV
E BURLEIGH ST
W MELVINA ST
W CHAMBERS ST
W ATKINSON AV
N2N
DLA
W ABERT PL
E CHAMBERS ST
E CONCORDIA AV
E AUER AV
E NASH ST
W VIENNA AV
W CONCORDIA AV
NJULIA
ST
NPA
LMER
ST
NA
CH
ILLE
SS
T
E TOWNSEND ST
E ABERT PL
NH
UB
BA
RD
ST
NB
OO
THS
T
N9T
HLA
W CHRISTINE LA
W RANDOLPH ST
NG
REENBAY
AV
W MESSMER ST
W TOWNSEND ST
E MELVINA ST
W CAPITOL PL
N11
THST
N8T
HST
NPA
LMER
ST
W VIENNA AV
N10
THS
T
N1S
TS
T
E TOWNSEND ST
N8TH
ST E NASH ST
W RANDOLPH ST
N6T
HST
N4T
HST
W CHAMBERS ST
N6T
HST
N10
THS
T
N5T
HST
W ABERT PL
NPA
LMER
ST
N1S
TS
T
NPA
LMER
STN2N
DS
T
N4T
HST
N10
THS
T
N7T
HST
N2N
DS
TN
2ND
ST
N6T
HST
W RING ST
N1S
TS
T
Source: City of Milwakee Master Property File Nonprofit Center of Milwaukee 2011
Harambee Neighborhood
Sales2005 Sales
2006 Sales
2007 Sales
Non-residential
Housing
Page17 Milwaukee Sustainable Communities Indicators Monitoring Report, October 2011
LISC Sustainable Communities InitiativeNeighborhood:Harambee
Domain:
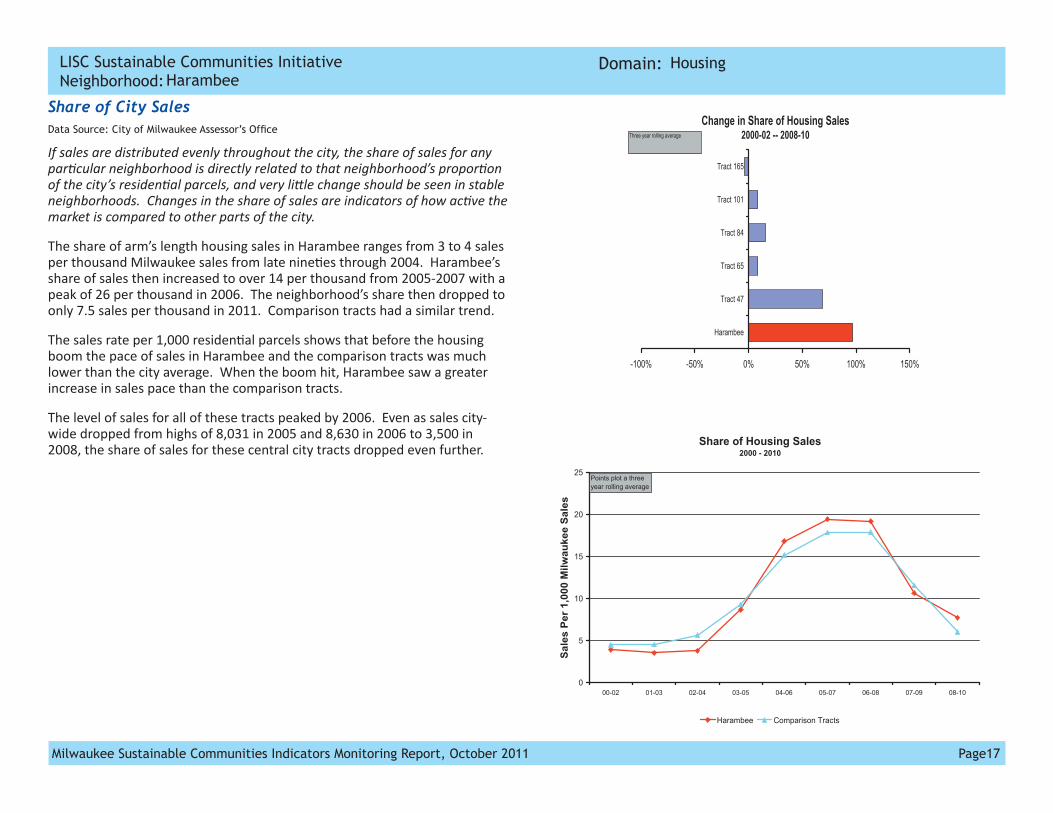
Share of City SalesData Source: City of Milwaukee Assessor’s Office
If sales are distributed evenly throughout the city, the share of sales for any par�cular neighborhood is directly related to that neighborhood’s propor�on of the city’s residen�al parcels, and very li�le change should be seen in stable neighborhoods. Changes in the share of sales are indicators of how ac�ve the market is compared to other parts of the city.
The share of arm’s length housing sales in Harambee ranges from 3 to 4 sales per thousand Milwaukee sales from late nine�es through 2004. Harambee’s share of sales then increased to over 14 per thousand from 2005-2007 with a peak of 26 per thousand in 2006. The neighborhood’s share then dropped to only 7.5 sales per thousand in 2011. Comparison tracts had a similar trend.
The sales rate per 1,000 residen�al parcels shows that before the housing boom the pace of sales in Harambee and the comparison tracts was much lower than the city average. When the boom hit, Harambee saw a greater increase in sales pace than the comparison tracts.
The level of sales for all of these tracts peaked by 2006. Even as sales city-wide dropped from highs of 8,031 in 2005 and 8,630 in 2006 to 3,500 in 2008, the share of sales for these central city tracts dropped even further.
Housing
Share of Housing Sales2000 - 2010
0
5
10
15
20
25
00-02 01-03 02-04 03-05 04-06 05-07 06-08 07-09 08-10
Sale
s Pe
r 1,0
00 M
ilwau
kee
Sale
s
Harambee Comparison Tracts
Points plot a threeyear rolling average
Change in Share of Housing Sales2000-02 -- 2008-10
-100% -50% 0% 50% 100% 150%
Harambee
Tract 47
Tract 65
Tract 84
Tract 101
Tract 165
Three year rolling average

Page18 Milwaukee Sustainable Communities Indicators Monitoring Report, October 2011
LISC Sustainable Communities InitiativeNeighborhood:Harambee
Domain:
Building PermitsData Source: City of Milwaukee Department of Neighborhood Services
The number and value of building and occupancy permits submi�ed in an area gives an indica�on of how much property owners may be inves�ng in the general housing stock of the neighborhood.
The percentage of parcels with ac�ve building permits increased from 1.57% in 2006 to 2.65% in 2009 then fell to 1.92% in 2009. This coincided with an increase in the average value of construc�on permits from less than $20,000 in 2006 to more than $80,000 in 2009 and almost $120,000. New construc�on drove the increase including many single family home built by the Housing Authority and Habitat for Humanity, some privately developed mul�-unit apartment projects, a large office building and a new school.
During the same period, the amount of construc�on in the city and in the comparison tracts decreased. Parcels with construc�on permits in Milwaukee decreased from 2.25% in 2006 to 1.5% in 2010. Construc�on permits in comparison tracts dropped even more than in the city as a whole, from 2.01% in 2006 to just 0.79% in 2010. The average amount spent on construc�on also decreased in comparison tracts likely due to the effects of the current economic recession, but held steady in the city of Milwaukee as a whole.
Housing
Construction Permits2006-07 -- 2009-10
0.00%
0.50%
1.00%
1.50%
2.00%
2.50%
2006-2007 2007-2008 2008-2009 2009-2010
Per
cent
of P
arce
ls w
ith P
erm
its
Harambee Milwaukee City Har Comp Tracts
Two year rolling average
Change in Construction Permits2006-07 - 2009-10
-80% -70% -60% -50% -40% -30% -20% -10% 0% 10% 20%
Harambee
Tract 47
Tract 65
Tract 84
Tract 101
Tract 165Two year rolling average
Average Value of Construction Permits2006-07 -- 2009-10
$0
$20,000
$40,000
$60,000
$80,000
$100,000
$120,000
2006-07 2007-08 2008-09 2009-10
Harambee Milwaukee City Comparison Tracts
F

Page19 Milwaukee Sustainable Communities Indicators Monitoring Report, October 2011
LISC Sustainable Communities InitiativeNeighborhood:Harambee
Domain:
Housing AffordabilityData Source: Home Mortgage Disclosure Act Loan Application Register
Housing development strategies which create housing for purchase that is unaffordable by many households in a neighborhood may displace residents rather than allowing them to move up to more stable home ownership.
The measure of affordability used here relies on mortgage data and therefore only measures affordability of newly purchased homes. This indicator is influenced more by the housing market and lending prac�ces than by employment and wages.
Homes in the city of Milwaukee in general and in the Harambee neighborhood and comparison tracts specifically are quite affordable with the average buyer spending less than 20% of income on mortgages most years. The propor�on of income spent on mortgages by home buyers in Harambee increased from only 10% in 2004 to more than 20% in 2007 as sales values increased. This was followed by a sharp drop to 15.7%, increased in 2009 to 17.1%, then dropped again in 2010 to just 11.2%.
Neither the city as a whole or the comparison tracts experienced the increase in income spent on mortgages that Harambee did in 2009.
Housing affordability for Milwaukee as a whole and for comparison tracts showed increases from 2004 un�l 2007 followed by decreases in 2008 and 2009, and followed by increases in 2010.
Housing
Housing Affordability2004-2010
0.0%
5.0%
10.0%
15.0%
20.0%
25.0%
2004-05 2005-06 2006-07 2007-08 2008-09 2009-10
Perc
ent o
f Inc
ome
Spen
t on
mor
tgag
e
Harambee Milwaukee City Comparison Tracts
Points plot a twoyear rolling average
Change in Housing Affordability2004-05 to 2009-10
-200% 0% 200% 400% 600% 800% 1000%
Harambee
Tract 47
Tract 65
Tract 84
Tract 101
Tract 165 Two yearrolling average
Page20 Milwaukee Sustainable Communities Indicators Monitoring Report, October 2011
LISC Sustainable Communities InitiativeNeighborhood:Harambee
Domain:
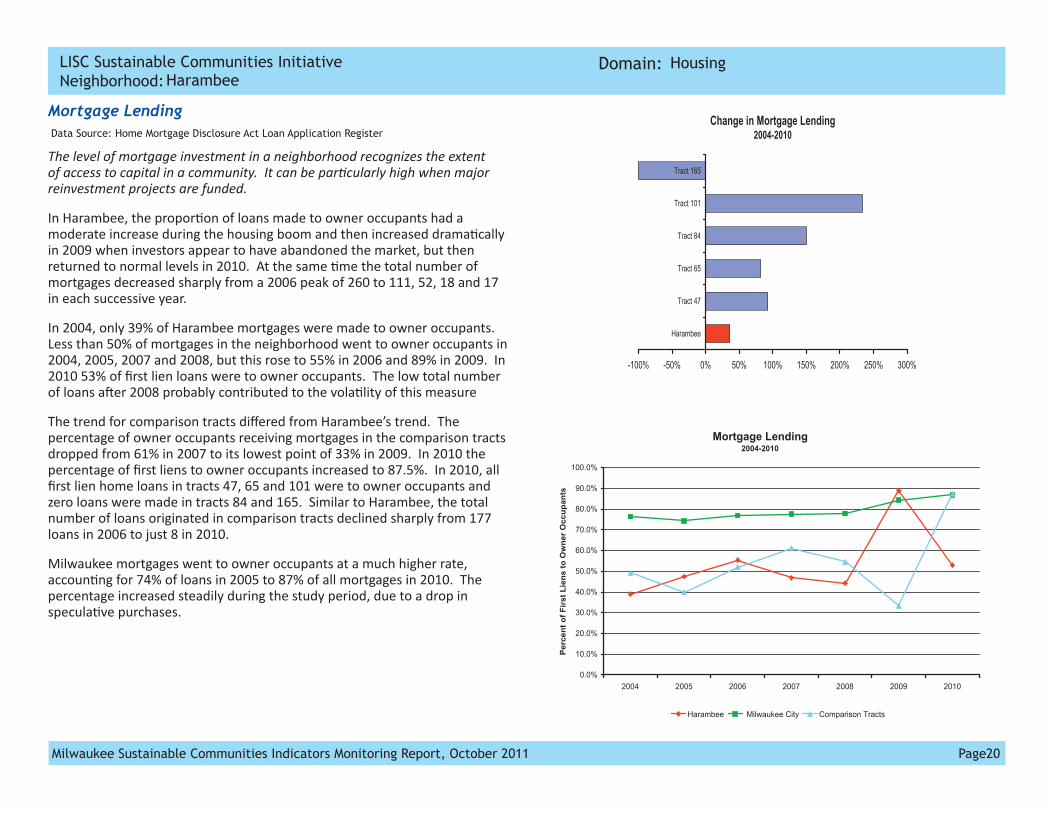
Mortgage Lending Data Source: Home Mortgage Disclosure Act Loan Application Register
The level of mortgage investment in a neighborhood recognizes the extent of access to capital in a community. It can be par�cularly high when major reinvestment projects are funded.
In Harambee, the propor�on of loans made to owner occupants had a moderate increase during the housing boom and then increased drama�cally in 2009 when investors appear to have abandoned the market, but then returned to normal levels in 2010. At the same �me the total number of mortgages decreased sharply from a 2006 peak of 260 to 111, 52, 18 and 17 in each successive year.
In 2004, only 39% of Harambee mortgages were made to owner occupants. Less than 50% of mortgages in the neighborhood went to owner occupants in 2004, 2005, 2007 and 2008, but this rose to 55% in 2006 and 89% in 2009. In 2010 53% of first lien loans were to owner occupants. The low total number of loans a�er 2008 probably contributed to the vola�lity of this measure
The trend for comparison tracts differed from Harambee’s trend. The percentage of owner occupants receiving mortgages in the comparison tracts dropped from 61% in 2007 to its lowest point of 33% in 2009. In 2010 the percentage of first liens to owner occupants increased to 87.5%. In 2010, all first lien home loans in tracts 47, 65 and 101 were to owner occupants and zero loans were made in tracts 84 and 165. Similar to Harambee, the total number of loans originated in comparison tracts declined sharply from 177 loans in 2006 to just 8 in 2010.
Milwaukee mortgages went to owner occupants at a much higher rate, accoun�ng for 74% of loans in 2005 to 87% of all mortgages in 2010. The percentage increased steadily during the study period, due to a drop in specula�ve purchases.
Housing
Mortgage Lending2004-2010
0.0%
10.0%
20.0%
30.0%
40.0%
50.0%
60.0%
70.0%
80.0%
90.0%
100.0%
2004 2005 2006 2007 2008 2009 2010
Perc
ent o
f Firs
t Lie
ns to
Ow
ner
Occ
upan
ts
Harambee Milwaukee City Comparison Tracts
Change in Mortgage Lending2004-2010
-100% -50% 0% 50% 100% 150% 200% 250% 300%
Harambee
Tract 47
Tract 65
Tract 84
Tract 101
Tract 165

Page21 Milwaukee Sustainable Communities Indicators Monitoring Report, October 2011
LISC Sustainable Communities InitiativeNeighborhood:Harambee
Domain:
High Cost Lending2004-2010
0.0%
10.0%
20.0%
30.0%
40.0%
50.0%
60.0%
70.0%
80.0%
90.0%
2004 2005 2006 2007 2008 2009 2010
Perc
ent o
f Firs
t lie
ns th
at a
re H
igh
Cos
t
Harambee Milwaukee City Comparison Tracts
Change in High Cost Lending2008-2010
-100% -80% -60% -40% -20% 0%
Harambee
Tract 47
Tract 65
Tract 84
Tract 101
Tract 165
Housing
High cost lending, o�en referred to as the sub-prime loan market, make up a much larger segment of the mortgage market in Harambee compared to the city of Milwaukee as a whole. At the height of the housing bubble in 2006, more than 70% of loans in Harambee were high cost loans, while in comparison tracts almost 8 in 10 mortgages were high cost.
When the housing bubble burst in 2007, the propor�on of high cost loans dropped each year to less than 10% in comparison tracts and the city, and to less than 20% in the Harambee neighborhood. In 2010 only 5.9% of loans were high cost. It appears that much of the housing bubble in Harambee and Comparison Tracts was fueled by increased access to lending through high cost loan products and that many of the buyers during the bubble were investors.
Foreclosure Rateby year First Quarter 2007 - First Quarter 2011
0%
2%
4%
6%
8%
10%
12%
2007 2008 2009 2010 2011
Perc
ent o
f Mor
tgag
es in
Def
ault
53212 Milwaukee ZIP Codes

Page22 Milwaukee Sustainable Communities Indicators Monitoring Report, October 2011
LISC Sustainable Communities InitiativeNeighborhood:Harambee
Domain:
Tax DelinquencyData Source: City of Milwaukee Treasurer’s Office
The extent of tax delinquency reflects the capacity and willingness of resident and absentee owners to meet their obliga�ons to maintain their proper�es. Two years of delinquency reflects circumstances where an owner risks losing the property to tax foreclosure.
The number of proper�es in Harambee that were two or more year delinquent peaked in 2009, dropped in 2010 and then increased to nearly the same level in 2011. The Milwaukee Department of City Development has taken a more aggressive approach to tax foreclosures in the years since the housing crisis began and some of the proper�es coming off of the rolls of tax delinquent proper�es have become property of the city.
The average amount of taxes owed on delinquent proper�es in Harambee peaked in 2009 at $3,799, but decreased to less than $3,396 in 2010 as the result of a large number of tax foreclosures by city government. The average amount increased again in 2011 to $3,565. The amount owed in comparison tracts increased from only $2,613 in 2005 to over $3,500 in 2011.
Housing
Tax Delinquent Properties2005-2011
0%
2%
4%
6%
8%
10%
12%
14%
2005 2006 2007 2008 2009 2010 2011
Perc
ent R
esid
entia
l Par
cels
2 o
r mor
e ye
ars
delin
quen
t
Harambee Comparison Tracts Milwaukee City
Change in Percent Properties Tax Delinquent 2005-2011
0% 20% 40% 60% 80% 100% 120% 140%
Harambee
Tract 47
Tract 65
Tract 84
Tract 101
Tract 165
Tax Delinquent Properties2005-2011
$0
$500
$1,000
$1,500
$2,000
$2,500
$3,000
$3,500
$4,000
$4,500
2005 2006 2007 2008 2009 2010 2011
Ave
rage
Am
ount
Ow
ed
per D
elin
quen
t Pro
pert
y
Harambee Milwaukee City Comparison Tracts

Page23 Milwaukee Sustainable Communities Indicators Monitoring Report, October 2011
LISC Sustainable Communities InitiativeNeighborhood:Harambee
Domain:
Economy and Workforce
Employed ResidentsData Source: U.S. Census Local Employment Dynamics Data
The propor�on of adults who are employed is cri�cal to the financial stability of a community and to individual households. (Changes in the number of employed residents are available annually. The number of adults may also change, but accurate data are only available from the Decennial Census.)
The number of Harambee residents employed held steady near 4,000 between 2002 (3,909 employed) and 2008 (3,762 employed), but then dropped to 3,107 employed in 2009. The top employment sector for Harambee residents in 2009 was Health Care and Social Assistance followed by Manufacturing and Educa�onal Services. Harambee had about 100 more employed residents than in all Comparison tracts combined, except for in 2004 when 35 more residents of comparison tracts were employed.
The percentage of Harambee residents 16 or older (based on Census 2000) that were employed ranged between 49% and 52% un�l 2009 when it dropped to just 2009. This employment rate was higher than the rate for comparison tracts but lower than the rate for the city as a whole.
Economy and Workforce
Share of Employment2002-2009
0.00%
0.25%
0.50%
0.75%
1.00%
1.25%
1.50%
1.75%
2002 2003 2004 2005 2006 2007 2008 2009
Shar
e of
Em
ploy
ed M
ilwau
kee
Res
iden
ts
Harambee Comparison Tracts
Change in Number of Employed Residents Aged 16 and Older2002-2009
-30% -25% -20% -15% -10% -5% 0% 5%
Harambee
Tract 47
Tract 65
Tract 84
Tract 101
Tract 165
Employment2002-2009
0
500
1,000
1,500
2,000
2,500
3,000
3,500
4,000
4,500
2002 2003 2004 2005 2006 2007 2008 2009
Num
ber o
f Res
iden
ts E
mpl
oyed
Harambee Comparison Tracts

Page24 Milwaukee Sustainable Communities Indicators Monitoring Report, October 2011
LISC Sustainable Communities InitiativeNeighborhood:Harambee
Domain:
Number of Workers by Industry2009
0 100 200 300 400 500 600 700 800
Number of Workers
Health Care and Social Assistance
Manufacturing
Educational Services
Accommodation and Food Services
Retail Trade
Administration & Support, Waste Management and Remediation
Public Administration
Finance and Insurance
Other Services (excluding Public Administration)
Transportation and Warehousing
Professional, Scientific, and Technical Services
Wholesale Trade
Management of Companies and Enterprises
Arts, Entertainment, and Recreation
Information
Construction
Real Estate and Rental and Leasing
Utilities
Agriculture, Forestry, Fishing and Hunting
Mining, Quarrying, and Oil and Gas Extraction
Economy and Workforce

Page25 Milwaukee Sustainable Communities Indicators Monitoring Report, October 2011
LISC Sustainable Communities InitiativeNeighborhood:Harambee
Domain: Economy and Workforce
Employment AccessData Source: U.S. Census Local Employment Dynamics Data
Although not all residents live near work, the availability of work within a short distance of a neighborhood enhances the value of the neighborhood and the opportuni�es for residents.
Local job pa�erns by sector reflect the extent that changing regional pa�erns within industry sectors are distributed evenly across the region.
The LED dataset shows that the number of available jobs in the Harambee neighborhood declined from 1,721 in 2002 to 951 in 2006, but then sharply increased to 8,550 in 2007 and 9,674 in 2009. This increase appears to be the effect of Manpower Interna�onal reloca�ng their headquarters to within the zip code in September 2007. Although the new loca�on is outside the Harambee neighborhood, peculiari�es with the geocoding process used for LED data resulted in the jobs being associated with the center of the 53215 zip code which is in the Harambee neighborhood.
In comparison tracts, three years show high numbers of jobs – 4,017 in 2003, 3,286 in 2006, 3,234 in 2007, 3,445 in 2008 and 3,152 in 2009 – and three years with low numbers – 1,086 in 2002, 479 in 2004 and 427 in 2005. Tract 165, one of the comparison tracts, is home to Allen-Bradley and this tract had over 3,000 jobs in each of the high years, less than 300 jobs in 2004 and 2005 and 608 jobs in 2002. Tracts 65 and 84 have a very low number of jobs - fewer than 70 for all years.
As seen in the figure on the following page, the leading industry sectors in Harambee in 2009 were Health Care and Social Assistance and Finance and Insurance.
Employment Oppourtunity2002-2009
0
2,000
4,000
6,000
8,000
10,000
12,000
2002 2003 2004 2005 2006 2007 2008 2009
Num
ber o
f Job
s
Harambee Comparison Tracts
Change in The Number of Jobs2002-2009
-100% 0% 100% 200% 300% 400% 500%
Harambee
Tract 47
Tract 65
Tract 84
Tract 101
Tract 165

Page26 Milwaukee Sustainable Communities Indicators Monitoring Report, October 2011
LISC Sustainable Communities InitiativeNeighborhood:Harambee
Domain:
Number of Workers by Industry2009
0 200 400 600 800 1000 1200 1400 1600 1800 2000
Number of Workers
Health Care and Social Assistance
Finance and Insurance
Manufacturing
Educational Services
Management of Companies and Enterprises
Retail Trade
Professional, Scientific, and Technical Services
Administration & Support, Waste Management and Remediation
Accommodation and Food Services
Information
Public Administration
Wholesale Trade
Other Services (excluding Public Administration)
Transportation and Warehousing
Real Estate and Rental and Leasing
Arts, Entertainment, and Recreation
Construction
Utilities
Agriculture, Forestry, Fishing and Hunting
Mining, Quarrying, and Oil and Gas Extraction
Economy and Workforce

Page27 Milwaukee Sustainable Communities Indicators Monitoring Report, October 2011
LISC Sustainable Communities InitiativeNeighborhood:Harambee
Domain: Income and Wealth
Income and Wealth
AFDC (W2) UseData Source: University of Wisconsin-Milwaukee Employment and Training Institute
Families dependent upon welfare resources represent families facing current financial instability. (When families leave W-2 programs, research suggests they may s�ll be financially unstable, but “success” outcome measures are not available.)
Welfare reform in the 1990’s brought about a step drop in the number of families receiving W2 benefits, and the caseload continues to decline although at a much more gradual rate. In 2009, only 289 households within zip code 53212 received income assistance from W2. The decrease in W-2 use in zip 53212 parallels citywide patterns.
Families Receiving AFDC or W-2 Income Support in Zipcode 532121994 - 2009
289352325526
422
770558
647453
530738
1042
2312
2832
3233
3601
0
500
1,000
1,500
2,000
2,500
3,000
3,500
4,000
1994 1995 1996 1997 1998 1999 2000 2001 2002 2003 2004 2005 2006 2007 2008 2009
£¤43
N9T
HST
N13
THS
T
NH
OLT
ON
ST
N8T
HST
N7T
HST
N11
THST
N12
THS
T
N3R
DS
T
NR
ICH
AR
DS
ST
N1S
TS
T
NB
UFF
UM
ST
W KEEFE AV
N5T
HST
NM
AR
TIN
LK
ING
JRD
R
N2N
DS
T
W LOCUST ST
W CENTER ST
W CAPITOL DR
W BURLEIGH ST
N6T
HST
N4T
HST
N11
THLA
W RING ST
W ATKINSON AV
N10
THLA
N10
THS
T
W HADLEY ST
E KEEFE AV
NP
OR
TW
AS
HIN
GTO
NAV
W AUER AV
W MELVINA ST
W CHAMBERS ST
E CAPITOL DR
E HADLEY ST
E LOCUST ST
E CENTER ST
N2N
DLA
E VIENNA AV
W ABERT PL
E BURLEIGH ST
W VIENNA AV
W CONCORDIA AV
E CHAMBERS ST
E CONCORDIA AV
NJU
LIAST
NPA
LMER
ST
E AUER AV
W FINN PL
E NASH ST
NA
CH
ILLE
SS
T
E TOWNSEND ST
E ABERT PL
N9T
HLA
W CHRISTINE LA
W MESSMER ST
W TOWNSEND ST
E MELVINA ST
NPA
LMER
ST
N8TH
ST
W CONCORDIA AV
W CONCORDIA AV
N8T
HST
N10
THS
T
W CHAMBERS ST
W ABERT PL
N2N
DS
T
N4T
HST
N7T
HST
N1S
TS
T
N6T
HST
N5T
HST
N1S
TS
T
NPA
LMER
ST
N1S
TS
T
N6T
HST
W RING ST
N10
THS
T
N2N
DS
T
N6T
HST
N4T
HST
N12
THS
T
W VIENNA AV
§̈¦43
Source: American Community Survey 5 Year Estimate 2005 - 2009 Nonprofit Center of Milwaukee 2011
Harambee Neighborhood
Median Income2005 - 2009
$15,000 or less
$15,001 - $25,000
$25,001 - $40,000
$40,001 - $50,000
More Than $50,000

Page28 Milwaukee Sustainable Communities Indicators Monitoring Report, October 2011
LISC Sustainable Communities InitiativeNeighborhood:Harambee
Domain:
Average Household Income 1990, 2000 and 2005-2009
$0
$5,000
$10,000
$15,000
$20,000
$25,000
$30,000
$35,000
$40,000
$45,000
1990 2000 2005-2009
Harambee Harambee Comparison Tracts Milwaukee
Poverty Rate 1990, 2000 and 2005-2009
0%
10%
20%
30%
40%
50%
60%
1990 2000 2005-2009
Perc
ent o
f Ind
ivdu
als
Bel
ow P
over
ty L
evel
Harambee Harambee Comparison Tracts Milwaukee
The sharp decline in families receiving aid did not correspond with a decrease in poverty, however. Indeed, although average annual household income increased greatly from 1990 to 2009, adjusted incomes increased in the nine�es but much of the gains were then eliminated in the decade since 2000.
The poverty rate mirrored this pa�ern with declines in poverty in the 1990s followed by increases that nearly returned poverty to the 1990 rate.
Average Household Income Adjusted to 2010 Dollars 1990, 2000 and 2005-2009
$0
$10,000
$20,000
$30,000
$40,000
$50,000
$60,000
1990 2000 2005-2009
Harambee Harambee Comparison Tracts Milwaukee
Income and Wealth

Page29 Milwaukee Sustainable Communities Indicators Monitoring Report, October 2011
LISC Sustainable Communities InitiativeNeighborhood:Harambee
Domain:
Median Income of Borrowers for Owner Occupied HousingData Source: Home Mortgage Disclosure Act Loan Application Register
New residents and others making a new commitment to a neighborhood by purchasing a home reflect the future of a neighborhood. The median income of this group reflects the pa�ern of change within the neighborhood. It reflects whether new residents increase or decrease median income for the neighborhood as a whole.
The ra�o of income of Harambee buyers of owner occupied housing to the median income of Milwaukee residents was highest in 2004 at 1.36 and hovered between 1.2 and 1.3 from 2005 to 2009. During the same �me the ra�o of Milwaukee owner occupied borrowers ranged higher, from 1.69 to just less than 2.0. The ra�o in comparison tracts, with the excep�on of a probable data error in 2005, hovered just above 1 un�l it dropped to 0.94 in 2009.
When the same ra�o is calculated with the neighborhood median income instead of the city median, Harambee buyers of owner occupied housing have incomes that are, on average, more than twice average income of the neighborhood as a whole. This suggests that incomes in Harambee may be trending upward as new homeowners move into the neighborhood.
The ra�o of incomes of homebuyers to residents for comparison tracts is also higher than when comparing to the city, but this difference is much less.
Income and Wealth
Ratio of Borrower Income to City Income2004-2009
0
1
2
3
4
5
6
2004 2005 2006 2007 2008 2009Ow
ner O
ccup
ied
Bor
row
er In
com
e / M
edia
n M
ilwau
kee
Inco
me
Harambee Milwaukee City Comparison Tracts
Change in Ratio of Borrower Income to City Income2004-2009
-100% -80% -60% -40% -20% 0% 20% 40%
Harambee
Tract 47
Tract 65
Tract 84
Tract 101
Tract 165
Ratio of Borrower Income to Neighborhood Income2004-2009
0
1
2
3
4
5
6
7
8
2004 2005 2006 2007 2008 2009Ow
ner O
ccup
ied
Bor
row
er In
com
e / M
edia
n H
aram
bee
Inco
me
Harambee Milwaukee City Comparison Tracts

Page30 Milwaukee Sustainable Communities Indicators Monitoring Report, October 2011
LISC Sustainable Communities InitiativeNeighborhood:Harambee
Domain:
Community Quality and Safety
CrimeData Source: City of Milwaukee Fire and Police Commission
Crime levels are a key indicator of neighborhood stability. Felony crimes (Part I) are the most serious crimes and generally more consistently recorded. Property crimes - such as burglary - reflect general security in the neighborhood and may affect whether renters decide to invest or stay in the neighborhood. More serious violent crimes - such as assaults or robbery - may be more cri�cal in determining whether current home owners will stay in a neighborhood.
The number of violent crimes in an area varies widely from year to year. Violent crime per 10,000 residents trends higher in the Harambee neighborhood than in the city as a whole, by a factor of 2 in most years. The trend in comparison tracts is lower than in Harambee but shows similar varia�ons from year to year.
The long term trend in violent crime for Harambee, comparison tracts and Milwaukee as a whole, has resulted in much higher rates per 10,000 residents in 2011 than in 1984. More recently spikes in violent crime in 2005 - 2007 have been followed by decreases over the past few years. This spike followed a year when neighborhood level data was lost due to difficul�es encountered as the police department switched data collec�on and recording procedures.
Violent crime rates are consistently higher in Harambee than in comparison tracts and rates in comparison tracts are consistently higher than rates in the City as a whole. City crime rates have much less annual varia�on than rates for Harambee and the comparison tracts, but also trended upwards during the study period.
Community Quality and Safety
Indexed Violent Crime2000-01 to 2009-10
0
50
100
150
200
250
300
2000-01 2002-03 2004-05 2006-07 2008-09
Crim
es p
er 1
0,00
0 re
side
nts
Harambee Milwaukee City Comparison Tracts
Points plot a twoyear rolling average
Change in Indexed Violent Crime2000-01 to 2009-10
0% 10% 20% 30% 40% 50% 60% 70% 80%
Harambee
Tract 47
Tract 65
Tract 84
Tract 101
Tract 165
Two yearrolling average

Page31 Milwaukee Sustainable Communities Indicators Monitoring Report, October 2011
LISC Sustainable Communities InitiativeNeighborhood:Harambee
Domain:
Indexed Property Crime2000-01 to 2009-10
0
200
400
600
800
1000
1200
2000-01 2002-03 2004-05 2006-07 2008-09
Crim
es p
er 1
0,00
0 re
side
nts
Harambee Milwaukee City Comparison Tracts
Points plot a twoyear rolling average
Change in Indexed Property Crime2000-01 to 2009-10
-25% -20% -15% -10% -5% 0% 5% 10% 15%
Harambee
Tract 47
Tract 65
Tract 84
Tract 101
Tract 165Two year
rolling average
Property crime per 10,000 residents also trends higher in the Harambee neighborhood than in the city as a whole. The trend in comparison tracts is lower than in Harambee but shows similar varia�ons from year to year.
The number of property crimes per 10,000 Harambee residents fluctuates up and down within a range between about 850 and 1,100 per year without an overall up or down trend. Comparison tracts and the City property crime trends are similar to Harambee’s, with year to year varia�on but no clear long term up or down trend. All three trend lines have shown recent declines which may or may not indicate a future downward trend for property crimes in Milwaukee.
Community Quality and Safety

Page32 Milwaukee Sustainable Communities Indicators Monitoring Report, October 2011
LISC Sustainable Communities InitiativeNeighborhood:Harambee
Domain:
VacancyData Source: City of Milwaukee Master Property File, American Community Survey, United
States Postal Service
Increases in the number of vacant parcels in a neighborhood signals a loss of effec�vely used land within a built urban environment. It will also suggest opportuni�es to build new housing, although vacant land that is made up of sca�ered small lots may not be appropriate for rebuilding. In Milwaukee, when vacant parcels are put to other uses, they are reclassified - either joined with an adjacent parcel or recognized as a small park (tot lot), parking lot or other use.
Over 10% of the parcel area in Harambee is classified as vacant which is almost double that for the city as a whole at about 6 percent. The number of vacant parcels has been slowly decreasing in Harambee since 2005 as has the area of vacant parcels. Star�ng 2006, more than thirty new single-family homes were built, mostly on vacant lots, in Harambee through efforts by the City, Habitat for Humanity and some private developers.
Community Quality and Safety
Land Area of Vacant Parcels2005-2010
0.0%
2.0%
4.0%
6.0%
8.0%
10.0%
12.0%
2005 2006 2007 2008 2009 2010
Perc
ent D
eveo
pabl
e La
nd A
rea
Vaca
nt
Harambee Milwaukee City Comparison Tracts
Change in Percent Vacant Land Area2005-2009
-20% 0% 20% 40% 60% 80% 100%
Harambee
Tract 47
Tract 65
Tract 84
Tract 101
Tract 165
Vacant Parcels2005-2010
0
50
100
150
200
250
300
350
400
450
2005 2006 2007 2008 2009 2010
Harambee Comparison Tracts

Page33 Milwaukee Sustainable Communities Indicators Monitoring Report, October 2011
LISC Sustainable Communities InitiativeNeighborhood:Harambee
Domain:
Long-term Residential Vacancy Q1-2008 - Q3-2010
0.00%
0.50%
1.00%
1.50%
2.00%
2.50%
3.00%
3.50%
Q1-2008 Q2-2008 Q3-2008 Q4-2008 Q1-2009 Q2-2009 Q3-2009 Q4-2009 Q1-2010 Q2-2010 Q3-2010
Perc
ent o
f Res
iden
tial P
arce
ls V
acan
t 3 M
onth
s
Harambee Harambee Comparison Tracts Milwaukee City
Long-term Business Vacancy Q1-2008 - Q3-2010
0.00%
1.00%
2.00%
3.00%
4.00%
5.00%
6.00%
7.00%
Q1-2008 Q2-2008 Q3-2008 Q4-2008 Q1-2009 Q2-2009 Q3-2009 Q4-2009 Q1-2010 Q2-2010 Q3-2010
Perc
ent o
f Bus
ines
s Pa
rcel
s Va
cant
3 M
onth
s
Harambee Harambee Comparison Tracts Milwaukee City
Mobility2005 - 2009
0%
10%
20%
30%
40%
50%
60%
70%
80%
90%
100%
2005-2009 1-Year Mobility
Perc
ent o
f Pop
ulat
ion
Livi
ng in
Sam
e H
ouse
as
1 -
Year
Ago
Harambee Harambee Comparison Tracts Milwaukee
In contrast to Harambee, comparison tracts have shown a slow rise in the percent parcel area that is vacant. This has tracked slightly higher than the city average since 2006 when a large industrial parcel in tract 47, owned by Tower Automo�ve, Inc., became vacant. In 2005, before the Tower parcel was reclassified, the percent of land vacant in comparison tracts was only 4.7%.
The rate of long-term business and residen�al vacancy (3 months or more) varies greatly between quarters, but trended higher than the citywide average in Harambee.
Both Harambee and the comparison tracts have extremely mobile popula�ons. Less than half of Harambee and comparison tract residents lived in the same house as the previous year compared to 80% citywide.
Community Quality and Safety

Page34 Milwaukee Sustainable Communities Indicators Monitoring Report, October 2011
LISC Sustainable Communities InitiativeNeighborhood:Harambee
Domain:
Community Institutions and Relationships
Nonprofit InstitutionsData Source: U.S. Internal Revenue Service Exempt Organizations Master File
Nonprofit organiza�ons are a cri�cal community resource. Although more specialized programs serve large areas, many nonprofits provide a localized, neighborhood focused service. Serving as anchor ins�tu�ons in many neighborhoods, they also support community building, leadership development and local problem solving.
The number of Harambee nonprofits per square mile has increased from 47.2 in 2005 to 77.4 in 2010. The number of nonprofits in comparison tracts and in Milwaukee as a whole also increased during this �me.
Harambee has a vibrant nonprofit community hos�ng 82 nonprofit offices equaling 2.4% of all nonprofit offices in the city. Many organiza�ons have located in the Harambee retail district and serve popula�ons across the en�re North Side.
Community Institutions and Relationships
Nonprofits Organizations per Square Mile2005-2010
0
10
20
30
40
50
60
70
80
90
2005 2006 2007 2008 2009 2010
Harambee Milwaukee City Comparison Tracts
Change in Nonprofits per Square Mile2005-2010
0% 50% 100% 150% 200% 250% 300% 350%
Harambee
Tract 47
Tract 65
Tract 84
Tract 101
Tract 165

Page35 Milwaukee Sustainable Communities Indicators Monitoring Report, October 2011
LISC Sustainable Communities InitiativeNeighborhood:Harambee
Domain:
Voter ParticipationData Source: City of Milwaukee Board of Election Commissioners
Poli�cal efficacy reflects a commitment by a neighborhood to influencing the services and policies of government. Conversely, those elected are more responsive to ac�ve community involvement. Voter par�cipa�on is measured by the number of votes as a percentage of the vo�ng age popula�on. Par�cipa�on trend lines in Presiden�al Elec�on years are separated from trend lines in Gubernatorial Elec�on years due to the predictably higher turnout in presiden�al elec�ons.
Wisconsin voters can register to vote at the polls on Elec�on Day and as a result the state consistently has had one of the highest voter par�cipa�on rates in the na�on. The same day registra�on effect is most prominent in high profile elec�ons and probably contributes to Harambee vo�ng in higher numbers than the city as a whole in presiden�al elec�ons. This is also a possible explana�on for the high par�cipa�on rate in the highly compe��ve and high profile 2010 gubernatorial elec�on.
Voter par�cipa�on in comparison tracts was consistently lower than in Harambee and the city as a whole during both presiden�al and gubernatorial elec�ons, but showed a similar increasing trend in gubernatorial elec�ons likely as a result of popular local candidates.
Community Institutions and Relationships
Voter Participation in Elections2004-2008
0
10
20
30
40
50
60
70
80
2002 2004 2006 2008 2010
Perc
ent
Harambee Milwaukee City Comparison Tracts
Presidential Elections
Gubernatorial Elections

Page36 Milwaukee Sustainable Communities Indicators Monitoring Report, October 2011
LISC Sustainable Communities InitiativeNeighborhood:Harambee
Domain:
Education and CultureQuality schools are an important asset for residents and o�en cri�cal in the choices households make to select and invest in a neighborhood. School performance is also an important indicator of the successful development of youth and their likely sustainable future.
The available data do not allow a refined use of this data at the neighborhood level. For the City of Milwaukee Public Schools data is not available for the group of students that lives within an “a�endance area” or other neighborhood division. Performance and A�endance data are easily available, but only at the school building level, which is not necessarily reflec�ve of the students living in the neighborhood. For many schools in Milwaukee, and especially within the Sustainable Communi�es target neighborhoods, fewer than 50% of students a�ending the school live actually in that school a�endance area.
Education and Culture
School Last Year Enrollment in Last Year
Community Trade and Business Center-CTBC 2005-2006 63
Malcolm X Academy 2006-2007 462
Aurora Weier High 2006-2007 77
Schools Closed in Harambee2004-05 to 2009-10
Student EnrollmentData Source: State of Wisconsin Department of Public Instruction – Wisconsin Information
Network for Successful Schools (WINSS)
The numbers of students enrolled in local schools represents the extent of school resources in or near the neighborhood. Declining enrollments when the number of youth is not declining as rapidly, represents a choice by many families to enroll their children in “be�er” choices beyond the neighborhood and choices by other families in the city not to choose these schools. In Milwaukee, schools compete for a shrinking pool of students, so enrollment levels are a measure of their perceived success.
Enrollment in Milwaukee public schools and charter schools in the Harambee neighborhood has dropped more than 29% from 2,796 in 2004-05 to 1,977 in 2009-10. Much of the decline resulted from the closure of schools in the neighborhood with three Harambee schools closing between the 2004-05 and 2008-09 school years. The Community Trade and Business Center (CTBC) school closed in 2006 when it had 63 students, and the Malcolm X Academy (462 Students) and Aurora Weir High School (77 students) closed in 2007. These three closures account for 74% of the decline.

Page37 Milwaukee Sustainable Communities Indicators Monitoring Report, October 2011
LISC Sustainable Communities InitiativeNeighborhood:Harambee
Domain:
Enrollment at Public and Private Schools2004-05 School Year - 2009-10 School Year
0
10,000
20,000
30,000
40,000
50,000
60,000
70,000
80,000
90,000
100,000
2004-2005 2005-2006 2006-2007 2007-2008 2008-2009 2009-2010
Kin
derg
arte
n th
roug
h 12
th G
rade
Stu
dent
s
Milwaukee MPS Milwaukee MPCS
Change in MPS and MPCS Enrollment2004-05 to 2008-09 School Year
-30% -20% -10% 0% 10% 20% 30%
Harambee
Tract 47
Tract 65
Tract 84
Tract 101
Tract 165
Public school enrollment for the city as a whole decreased by 10% over the same period. Enrollment in schools in comparison tracts is very high when compared to Harambee and increased by 5% between the 2004-05 and the 2008-09 school year, but then dropped steeply to only 7,444 in the 2009-10 school year.
Milwaukee also has “choice” schools which are private schools that take public vouchers for some or all of their students. Enrollment figures for these schools are provided as a one-�me count on the third Friday in September. Over 40% of students enrolled in scho0ls in the Harambee neighborhood for the 2009-10 school year a�ended private schools as a result of the Milwaukee Parental Choice program.
Education and Culture
Enrollment at Public and Private Schools2004-05 School Year - 2009-10 School Year
0
1,000
2,000
3,000
4,000
5,000
6,000
7,000
8,000
9,000
10,000
2004-2005 2005-2006 2006-2007 2007-2008 2008-2009 2009-2010
Kin
derg
arte
n th
roug
h 12
th G
rade
Stu
dent
s
Harambee MPS Comparison Tracts MPS Harambee MPCS Comparison Tracts MPCS

Page38 Milwaukee Sustainable Communities Indicators Monitoring Report, October 2011
LISC Sustainable Communities InitiativeNeighborhood:Harambee
Domain:
Student AttendanceData Source: State of Wisconsin Department of Public Instruction – Wisconsin Information
Network for Successful Schools (WINSS)
Student achievement is clearly linked to par�cipa�on in school. A�endance rates account for overall par�cipa�on throughout the school year.
A�endance rates at Harambee schools stayed between 89% and 91% during the 2004-05 through the 2009-10 school years.
A�endance rates in Comparison tracts and the city of Milwaukee trended within the same range, except for an a�endance rate of 85.8% in comparison tracts in 2008-09.
Education and Culture
Student Attendance Rate K-122004-05 School Year - 2009-10 School Year
80
82
84
86
88
90
92
94
96
98
100
2004-2005 2005-2006 2006-2007 2007-2008 2008-2009 2009-2010
Ave
rage
Dai
ly A
ttend
ance
Rat
e
Harambee Milwaukee City Comparison Tracts
Student Attendance Rate2004-05 to 2009-10 School Year
-12% -10% -8% -6% -4% -2% 0% 2%
Harambee
Tract 47
Tract 65
Tract 84
Tract 101
Tract 165

Page39 Milwaukee Sustainable Communities Indicators Monitoring Report, October 2011
LISC Sustainable Communities InitiativeNeighborhood:Harambee
Domain:
Eligibility for Free LunchData Source: State of Wisconsin Department of Public Instruction – Wisconsin Information
Network for Successful Schools (WINSS)
The threshold income requirements for Free Lunch programs represent a rou�ne measure of the number of children in families that are in poverty or near poverty status.
Roughly 90% of students in the Harambee neighborhood were eligible for free or reduced lunch between the 2004-05 and 2010-11 school years. Harambee trended more than ten points higher than the city over this period. Comparison tracts had trends similar to Harambee star�ng with the 2005-06 school year, but were closer to the Milwaukee rate in 2004-05.
Education and Culture
Students Eligible for Free and Reduced Lunch2004-05 School Year - 2010-11 School Year
0
10
20
30
40
50
60
70
80
90
100
2004-2005 2005-2006 2006-2007 2007-2008 2008-2009 2009-2010 2010-2011
Perc
ent
Harambee Milwaukee City Comparison Tracts
Change in Students Eligible for Free and Reduced Lunch
2004-05 to 2010-11 School Year
-10% 0% 10% 20% 30% 40% 50%
Harambee
Tract 47
Tract 65
Tract 84
Tract 101
Tract 165
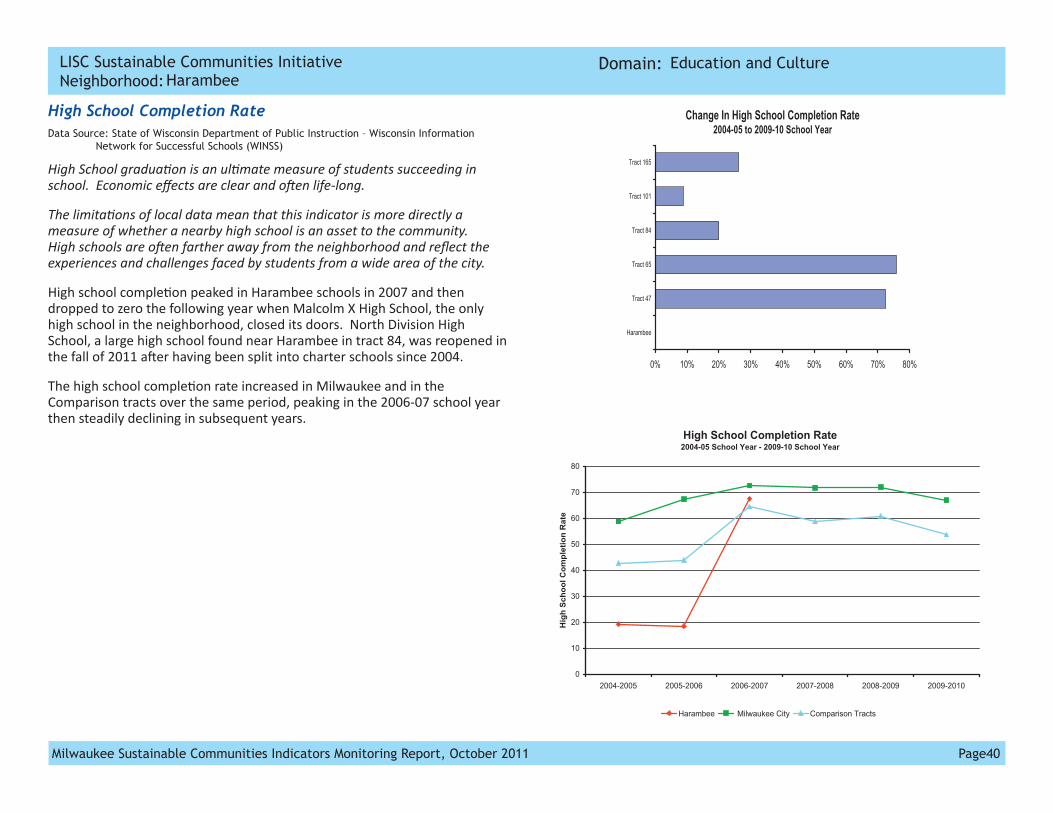
Page40 Milwaukee Sustainable Communities Indicators Monitoring Report, October 2011
LISC Sustainable Communities InitiativeNeighborhood:Harambee
Domain:
High School Completion RateData Source: State of Wisconsin Department of Public Instruction – Wisconsin Information
Network for Successful Schools (WINSS)
High School gradua�on is an ul�mate measure of students succeeding in school. Economic effects are clear and o�en life-long.
The limita�ons of local data mean that this indicator is more directly a measure of whether a nearby high school is an asset to the community. High schools are o�en farther away from the neighborhood and reflect the experiences and challenges faced by students from a wide area of the city.
High school comple�on peaked in Harambee schools in 2007 and then dropped to zero the following year when Malcolm X High School, the only high school in the neighborhood, closed its doors. North Division High School, a large high school found near Harambee in tract 84, was reopened in the fall of 2011 a�er having been split into charter schools since 2004.
The high school comple�on rate increased in Milwaukee and in the Comparison tracts over the same period, peaking in the 2006-07 school year then steadily declining in subsequent years.
Education and Culture
High School Completion Rate2004-05 School Year - 2009-10 School Year
0
10
20
30
40
50
60
70
80
2004-2005 2005-2006 2006-2007 2007-2008 2008-2009 2009-2010
Hig
h Sc
hool
Com
plet
ion
Rat
e
Harambee Milwaukee City Comparison Tracts
Change In High School Completion Rate2004-05 to 2009-10 School Year
0% 10% 20% 30% 40% 50% 60% 70% 80%
Harambee
Tract 47
Tract 65
Tract 84
Tract 101
Tract 165

Page41 Milwaukee Sustainable Communities Indicators Monitoring Report, October 2011
LISC Sustainable Communities InitiativeNeighborhood:Harambee
Domain:
Student AchievementData Source: State of Wisconsin Department of Public Instruction – Wisconsin Information
Network for Successful Schools (WINSS)
Standardized tests allow a comparable measure of student achievement. Third Grade reading and math scores have been recognized as key measures. Students who do not achieve proficiency in these basic skills by the 3rd grade are o�en further challenged in later grades, and ul�mately may drop out of school.
Given the mix of students from mul�ple neighborhoods in a school, the test scores represent in part the success of the school program in mee�ng the needs of its students.
The trend line for Harambee student achievement in reading between 2005-2006 and 2009-2010 was extremely variable. Less than 20% of Harambee third graders tested as Advanced or Proficient in reading in 2005-06 – much lower than Milwaukee as a whole and comparison tracts. Harambee third graders improved in the following two years with more than 50% of students tes�ng in the top two categories. The improvement was short lived and only 38.7% of third graders tested as Advanced or Proficient in 2009-2010. In the 2010-11 school year reading scores improved again with over 50% tes�ng Advanced or Proficient.
Comparison tracts and the city as a whole showed similar trends, they also tested be�er in 2006-07 and 2007-08 school years than 2008-09 and 2009-10. Like Harambee, both the comparison tracts and improved greatly in the 2010-11 school year – comparison tract peaked at 56.8% Proficient or Advanced.
Education and Culture
3rd Grade Students Proficient or Advanced in Reading2005-06 School Year - 2010-11 School Year
0
10
20
30
40
50
60
2005-2006 2006-2007 2007-2008 2008-2009 2009-2010 2010-2011
Perc
ent
Harambee Milwaukee City Comparison Tracts
Change in Percent of 3rd Grade Students Proficient or Advanced in Reading
2005-06 to 2010-11 School Year
-50% 0% 50% 100% 150% 200% 250%
Harambee
Tract 47
Tract 65
Tract 84
Tract 101
Tract 165

Page42 Milwaukee Sustainable Communities Indicators Monitoring Report, October 2011
LISC Sustainable Communities InitiativeNeighborhood:Harambee
Domain:
3rd Grade Students Proficient or Advanced in Math2005-06 School Year - 2010-11 School Year
0
10
20
30
40
50
60
2005-2006 2006-2007 2007-2008 2008-2009 2009-2010 2010-2011
Perc
ent
Harambee Milwaukee City Comparison Tracts
Change in Percent of 3rd Grade Students Proficient or Advanced in Math
2005-06 to 2010-11 School Year
0% 50% 100% 150% 200% 250% 300% 350% 400%
Harambee
Tract 47
Tract 65
Tract 84
Tract 101
Tract 165
Only 10% of Harambee third graders tested as Proficient or Advanced at mathema�cs in the 2005-06 school year. Test scores subsequently improved, but only once, in 2010-11, scored higher than 40% in the top two categories.
Just more than 25% of third graders a�ending Milwaukee schools and comparison tract schools scored Proficient or Advanced at mathema�cs in the 2005-06 school year, but these third graders improved to over 40% of students tested scoring in the top categories for math in the 2007-08 school year and each year since.
Education and Culture

Page43 Milwaukee Sustainable Communities Indicators Monitoring Report, October 2011
LISC Sustainable Communities InitiativeNeighborhood:Harambee
Domain:
Demographics
Change in Diversity-Race and Ethnicity of Owner Occupied Mortgage BorrowersData Source: Home Mortgage Disclosure Act Loan Application Register; US Census American
Community Survey 2009 5-year estimate.
Future trends in the diversity of a neighborhood are reflected by the racial and ethnic characteris�cs of those who are new home buyers. These trends focus on the home owning segment of the popula�on - a more stable element than rental households.
Owner occupied mortgages for home purchase were made to whites at a much higher rate than their demographic representa�on in the Harambee neighborhood. This demographic mismatch decreased substan�ally in 2006 and 2007, as the housing market peaked, but then increased drama�cally with more than 50% of owner occupied mortgages being made to whites.
One likely explana�on for this pa�ern is that young white home buyers are moving into the neighborhood and finding good deals when compared to the more expensive housing market of Riverwest just to the east and Brewer’s Hill to the south. Another explana�on is that loans were easier to secure for non-white borrowers during the housing bubble and then became very hard to get, par�cularly for non-whites, a�er the housing market crashed and the credit market dried up.
Milwaukee showed a similar trend, but the percentage of loans to white borrowers was generally lower than their representa�on in the city with the excep�on of 2005 and 2006.
Comparison tracts show a trend similar to that found in the Harambee neighborhood.
Demographics
Owner Occupied White Borrowers Compared to White Households2004-2010
2004 2004 20042005 2005 20052006 2006 20062007 20072008 2008 20082009 2009 20092010 2010 201020070%
10%
20%
30%
40%
50%
60%
70%
Harambee Milwaukee City Comparison Tracts
Perc
ent
5.7% non Hispanic white households4.2% non Hispanic white households
51.0% non Hispanic white households
Change in Percent Owner Occupied First Liens to Whites
2008-2010
-100% -80% -60% -40% -20% 0% 20% 40% 60%
Harambee
Milwaukee City
Comparison Tracts

Page44 Milwaukee Sustainable Communities Indicators Monitoring Report, October 2011
LISC Sustainable Communities InitiativeNeighborhood:Harambee
Domain:
BirthsNeighborhoods have a limited poten�al for vitality if young households do not recognize the neighborhood as a place to start a family. The Crude Birth Rate reflects the overall balance of a renewing resource within a neighborhood. Neighborhoods go through “life cycles” as a pool of families start families together and may stay within the neighborhood as their children grow. So small changes in this indicator are common. Very low rates, however, are a concern.
Demographics
CONCENTRATIONS OF BIRTHS
Legend
Low
Medium
High
1993
CONCENTRATIONS OF BIRTHS
Legend
Low
Medium
High
2004
Birth pa�erns in Milwaukee changed drama�cally in the past two decades. Neighborhoods on the north side that once had high densi�es of births no longer had high densi�es by 2004. The high density areas on the South Side increased over the period. More recently we have seen the pa�ern of births shi� to the northwest and southwest areas of the city following migra�on of black and Hispanics respec�vely.

Page45 Milwaukee Sustainable Communities Indicators Monitoring Report, October 2011
LISC Sustainable Communities InitiativeNeighborhood:Harambee
Appendix