hands-on exercise #1 diadem classic - national...
TRANSCRIPT

© 2003-2017 National Instruments Corporation. All rights reserved.
DIAdem Hands-On Exercises, page 1 of 104
Hands-on
An Introduction to Using DIAdem 2017
in step by step Exercises
To download this document from the web,
search for “DIAdem Hands-On”
This document is subject to the terms of use available at:
http:/www.ni.com/legal/termsofuse/unitedstates/us/
© 2003-2017 National Instruments Corporation. All rights reserved.
DIAdem Hands-On Exercises, page 2 of 104
Outline of Hands-On Exercises
Exercise #0 Writing a TDMS File in LabVIEW .................... 3
Exercise #1 DataFinding and Automated Reporting .......... 10
Exercise #2 Data Mining and Interactive Reporting ........... 25
Exercise #3 Create Automated Analysis and Reporting ..... 56
Exercise #4 ASCII DataPlugin and Interactive Analysis .... 81

© 2003-2017 National Instruments Corporation. All rights reserved.
DIAdem Hands-On Exercises, page 3 of 104
Exercise #0 Writing a TDMS File in LabVIEW
Scenario: You’ve been charged with finding or creating a data file format that your
company can use to maximize productivity (or some other typically vague
managerial request). You have heard that National Instruments has a good default
file format and claims to offer “Data Management”, whatever that is. You decide
to take a closer look and see if what NI has to offer is a fit for you. In this
exercise you will inspect and use the LabVIEW functions for writing TDMS data
files which, in addition to the data values, also contain key information that can
be searched on later. You will use the TDM Excel Add-in to load these TDMS
files directly into Excel to verify openness and portability. Finally, you will find
the TDMS files you have created by running a simple search in DIAdem and
immediately see a graphical preview of the data channels you stored.
NOTE: LabVIEW is NOT required for this exercise-- DIAdem 2017 is sufficient. If,
however, the *.exe file below does not open for you, re-run the DIAdem 2017
installer and choose to install the LabVIEW Runtime Engine option.
0.0 Your first task is to load a LabVIEW example that ships with DIAdem. Launch
Windows Explorer to find and run the LabVIEW example. If you took all the defaults
when installing DIAdem, you will find the LabVIEW example in the following folder
on your hard drive:
“C:\Program Files\National Instruments\DIAdem 2017\Examples\Documents”
The LabVIEW example you need to launch is called “Generate_TDMS_File.exe”.
Double-click the “Generate_TDMS_File.exe” LabVIEW application to launch it.
(if you’re running in 32bit, you must start with “C:\Program Files (x86)\...”)
NOTE: DIAdem optionally installs the LabVIEW run-time engine— this is why you do not need to
have LabVIEW installed in order to run this compiled LabVIEW application. If you have a recent
version of LabVIEW installed and want to look at the source code for this example, you can double-
click on the “Generate_TDMS_File.llb” (also shown in the dialog above) and select the main
“Generate TDMS File.vi”, from which the executable was compiled.
© 2003-2017 National Instruments Corporation. All rights reserved.
DIAdem Hands-On Exercises, page 4 of 104
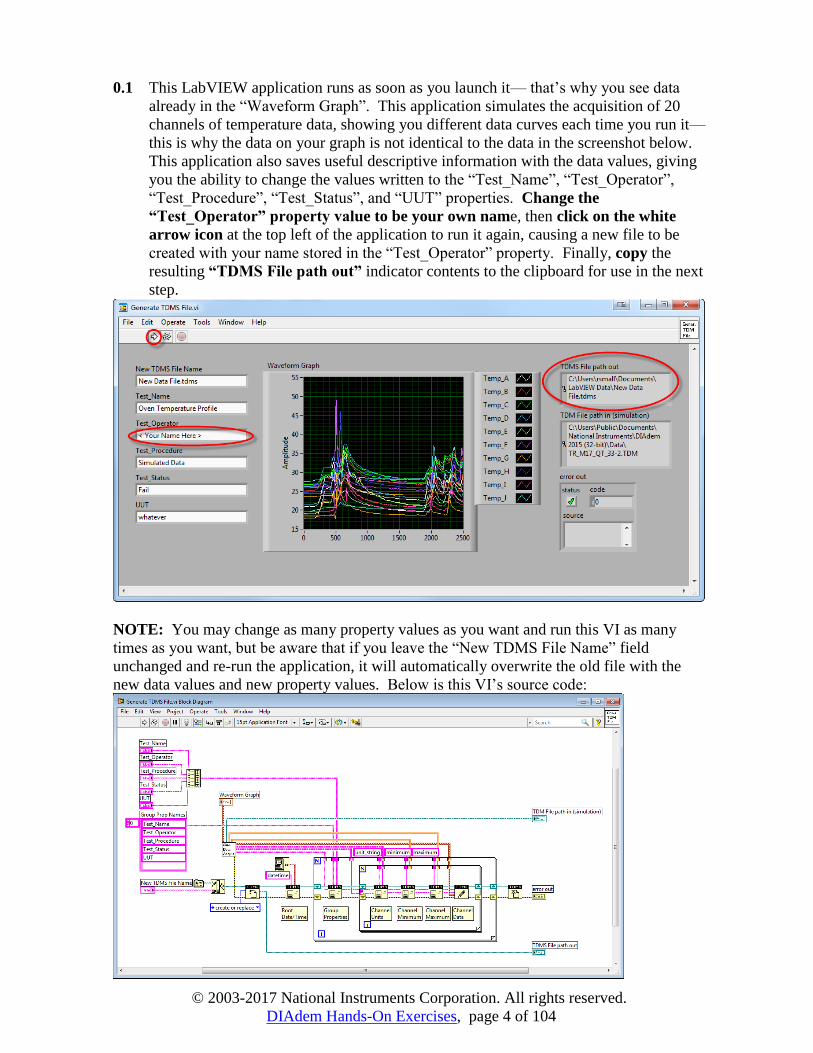
0.1 This LabVIEW application runs as soon as you launch it— that’s why you see data
already in the “Waveform Graph”. This application simulates the acquisition of 20
channels of temperature data, showing you different data curves each time you run it—
this is why the data on your graph is not identical to the data in the screenshot below.
This application also saves useful descriptive information with the data values, giving
you the ability to change the values written to the “Test_Name”, “Test_Operator”,
“Test_Procedure”, “Test_Status”, and “UUT” properties. Change the
“Test_Operator” property value to be your own name, then click on the white
arrow icon at the top left of the application to run it again, causing a new file to be
created with your name stored in the “Test_Operator” property. Finally, copy the
resulting “TDMS File path out” indicator contents to the clipboard for use in the next
step.
NOTE: You may change as many property values as you want and run this VI as many
times as you want, but be aware that if you leave the “New TDMS File Name” field
unchanged and re-run the application, it will automatically overwrite the old file with the
new data values and new property values. Below is this VI’s source code:

© 2003-2017 National Instruments Corporation. All rights reserved.
DIAdem Hands-On Exercises, page 5 of 104
0.2 One of the stated benefits of the TDMS data file format is that it can be read into
Microsoft Excel using a free “TDM Excel Add-in”. You decide to check this out by
trying to read into Excel the TDMS file(s) you just created in the previous step. Paste
the TDMS file path you copied in the last step into Windows Explorer or navigate
to the folder “…\My Documents\LabVIEW Data” and right-click on the TDMS file
you created, then select “Open with” and “Excel Importer”.
0.3 The TDMS file you created opens right up in Excel, and you can quickly find your
name in the Test_Operator field for both channel groups.

© 2003-2017 National Instruments Corporation. All rights reserved.
DIAdem Hands-On Exercises, page 6 of 104
0.4 The TDM Excel Add-in imports all the file, group, and channel properties into the
“New Data File (root)” worksheet, shown below. Note that your TDMS file has a
date/time property in cell D2 and Unit, Minimum, and Maximum properties for each
channel, etc. Each group in the TDMS file is assigned to its own Excel Worksheet
where all its channel values are imported as columns. Click on the “…Lower”
worksheet to view its channel values
0.5 Here you see that all the channel values you saw graphed in the LabVIEW application
are faithfully loaded into Excel. It appears that you really can load TDMS files into
Excel— which means you can send them to anybody without having to first convert to
an ASCII file format.

© 2003-2017 National Instruments Corporation. All rights reserved.
DIAdem Hands-On Exercises, page 7 of 104
0.6 You can also load TDMS files directly from the Excel environment. When installed,
this TDM Excel Add-in appears as a new icon with an orange and blue tree-view on a
white background, with the tip strip “Import a TDM(S) File”. In Excel 2007 or later,
you must first click on the “Add-Ins” tab to see the TDM Excel Add-in icon.
NOTE: LabVIEW and DIAdem automatically install the Excel TDM Add-in, but if the
person you send your TDMS files to doesn’t have it, here are the steps for them to download
it for free. Close Excel completely, launch your web browser (Internet Explorer, etc.) and
navigate to www.ni.com/tdms. Scroll down near to the bottom of that page and click on the
TDM Excel Add-In Tool for Microsoft Exel User Guide and after that the TDM Excel Add-
In Download Page link to get to the download page. Finally, download and install the TDM
Excel Add-in. Now restart Excel and find and click on the “Import a TDM File” icon
© 2003-2017 National Instruments Corporation. All rights reserved.
DIAdem Hands-On Exercises, page 8 of 104
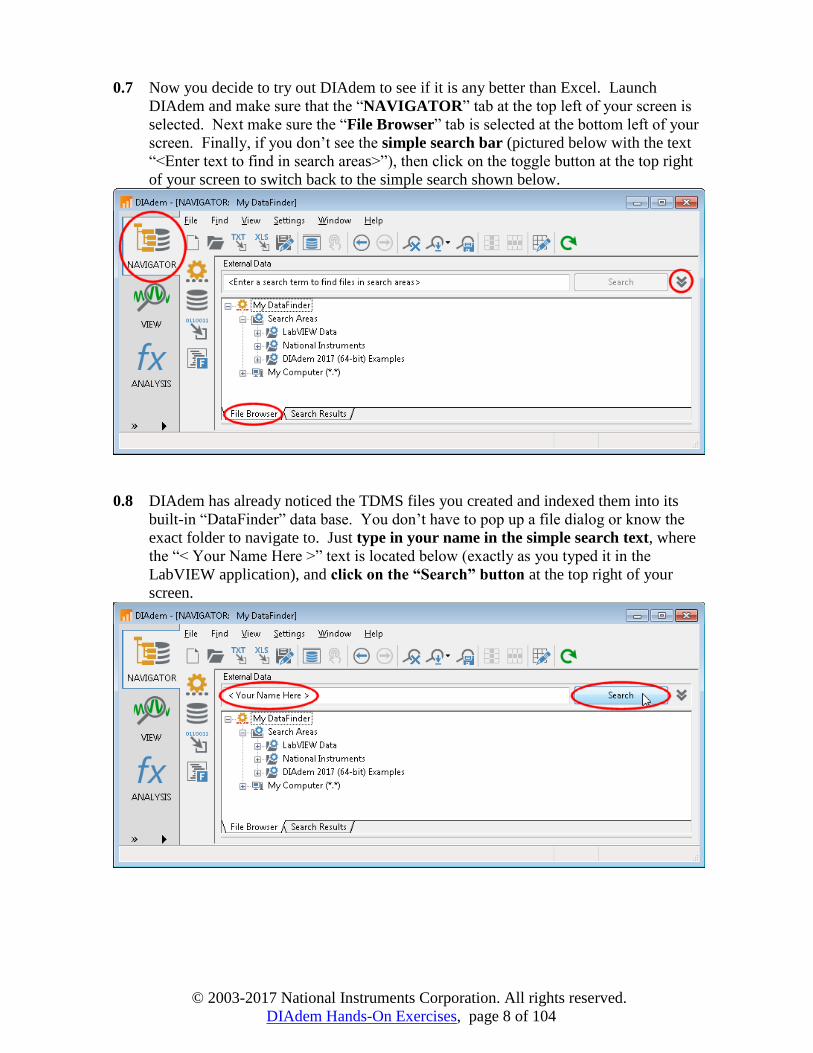
0.7 Now you decide to try out DIAdem to see if it is any better than Excel. Launch
DIAdem and make sure that the “NAVIGATOR” tab at the top left of your screen is
selected. Next make sure the “File Browser” tab is selected at the bottom left of your
screen. Finally, if you don’t see the simple search bar (pictured below with the text
“<Enter text to find in search areas>”), then click on the toggle button at the top right
of your screen to switch back to the simple search shown below.
0.8 DIAdem has already noticed the TDMS files you created and indexed them into its
built-in “DataFinder” data base. You don’t have to pop up a file dialog or know the
exact folder to navigate to. Just type in your name in the simple search text, where
the “< Your Name Here >” text is located below (exactly as you typed it in the
LabVIEW application), and click on the “Search” button at the top right of your
screen.

© 2003-2017 National Instruments Corporation. All rights reserved.
DIAdem Hands-On Exercises, page 9 of 104
0.9 DIAdem should find all the TDMS files you created, plus any others which have your
name as a property value somewhere. Right-click on one of your TDMS files and
select the context menu “Display in Browser” so that DIAdem will show you where
this TDMS file is located in the NAVIGATOR tree view.
0.10 DIAdem highlights in the tree view the file you found with your simple search. Now
open up this file down to the channel level— click on the “+” sign to the left of the
file, then click on the “+” sign to the left of the file’s “…_Upper” group. Click on
the first channel, called “Temp_A”, to see a graphical preview of that channel.
Notice how DIAdem shows you the 3 level hierarchy right in the tree view and shows
you the properties of each level in the property table below it.
NOTE: The graph of your selected data channel will look different than the graph above

© 2003-2017 National Instruments Corporation. All rights reserved.
DIAdem Hands-On Exercises, page 10 of 104
Exercise #1 DataFinding and Automated Reporting
Scenario: You’ve been charged with finding out why so many tests show furnace
temperatures exceeding their allowable thermal profiles. You know a few key
facts about these data files, but over time the files have been stored in different
folders by lots of different people, and it’s not obvious where all the data is
located. You will use the DataFinder to locate all the files which contain out-of-
range temperature data. You will install and use a predefined custom menu in
DIAdem (that a colleague of yours sent you) to automatically calculate
histograms of the out-of-range temperatures. You will use another predefined
custom menu (from this same colleague) to create a trend graph of the out-of-
range temperatures. Finally you will output these graphs to a PDF file so that you
can email your initial findings to your boss.
1.1 First get ready to search in DIAdem. Make sure that the “NAVIGATOR” tab at the
top left of your screen is selected. Next make sure the “File Browser” tab is selected
at the bottom left of your screen. Finally, if you don’t see the simple search bar
(pictured below with the text “<Enter text to find in search areas>”), then click on the
toggle button at the top right of your screen to switch back to the simple search shown
below.

© 2003-2017 National Instruments Corporation. All rights reserved.
DIAdem Hands-On Exercises, page 11 of 104
1.2 Click on the “Delete Internal Data” icon at the top left of your screen to delete any
data currently loaded in DIAdem. Notice that now the Data Portal to the right of your
screen is empty. Click on the “Delete Query” icon (binocular with red X) at the top
of your screen to reset the DataFinder query to the empty query pictured below. Click
the “No” button if asked to save data changes and the “Yes” button if asked to confirm
the query deletion.
1.3 One thing you know about all these data files is they all have file names starting with
“TR_”. Type the text “TR_*.TDM” into the simple search keyword field and either
hit the <Enter> key on your keyboard or click on the “Search” button to the right of
the search text. Now you see a list of all *.TDM data files from all over your hard
drive, or perhaps also mapped network drives, which have a name starting with “TR_”.
© 2003-2017 National Instruments Corporation. All rights reserved.
DIAdem Hands-On Exercises, page 12 of 104
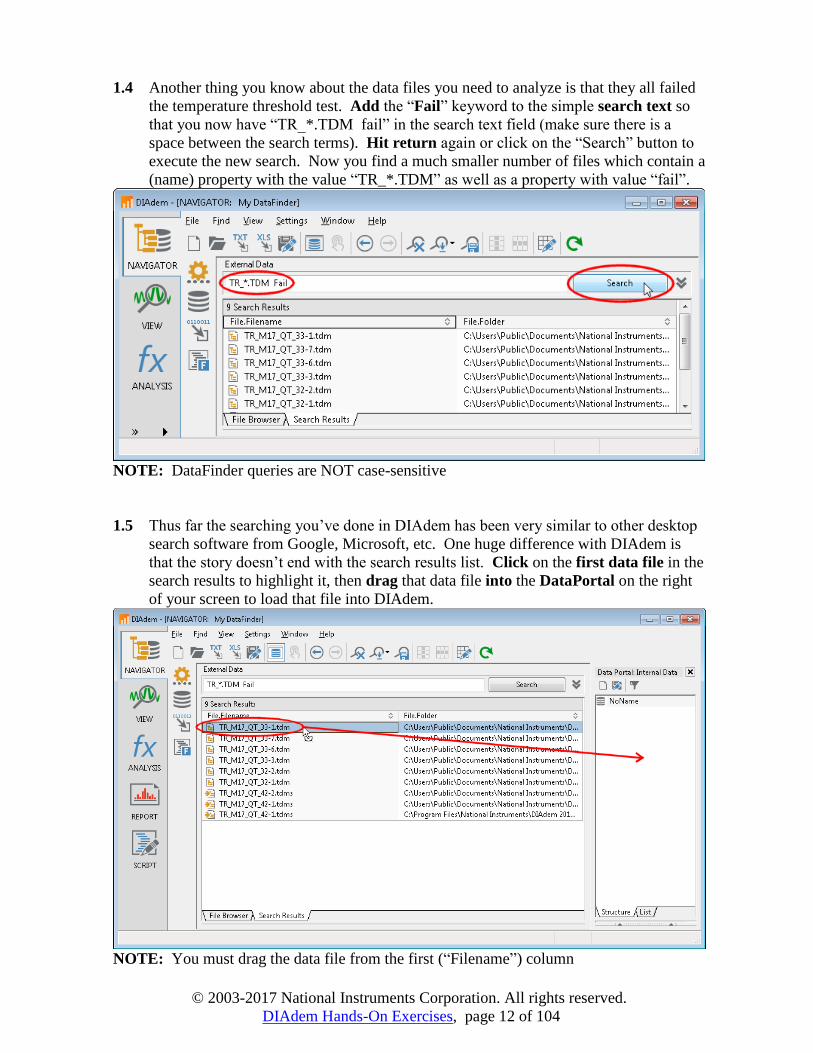
1.4 Another thing you know about the data files you need to analyze is that they all failed
the temperature threshold test. Add the “Fail” keyword to the simple search text so
that you now have “TR_*.TDM fail” in the search text field (make sure there is a
space between the search terms). Hit return again or click on the “Search” button to
execute the new search. Now you find a much smaller number of files which contain a
(name) property with the value “TR_*.TDM” as well as a property with value “fail”.
NOTE: DataFinder queries are NOT case-sensitive
1.5 Thus far the searching you’ve done in DIAdem has been very similar to other desktop
search software from Google, Microsoft, etc. One huge difference with DIAdem is
that the story doesn’t end with the search results list. Click on the first data file in the
search results to highlight it, then drag that data file into the DataPortal on the right
of your screen to load that file into DIAdem.
NOTE: You must drag the data file from the first (“Filename”) column
© 2003-2017 National Instruments Corporation. All rights reserved.
DIAdem Hands-On Exercises, page 13 of 104
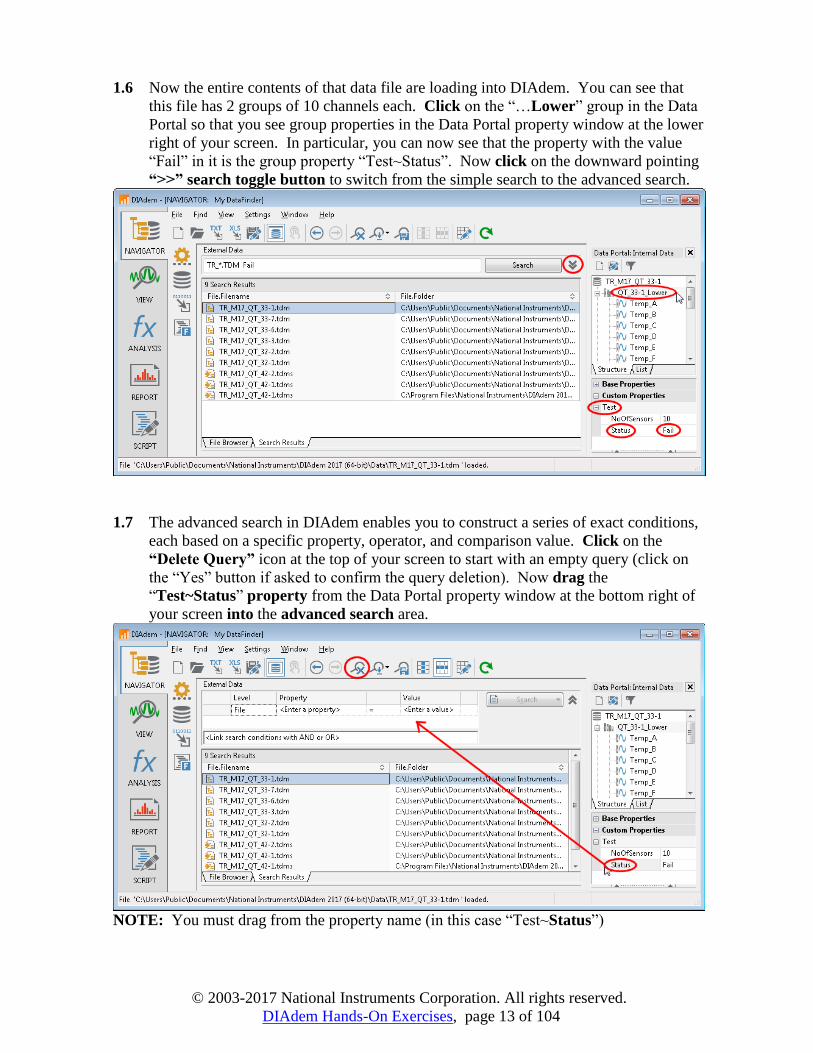
1.6 Now the entire contents of that data file are loading into DIAdem. You can see that
this file has 2 groups of 10 channels each. Click on the “…Lower” group in the Data
Portal so that you see group properties in the Data Portal property window at the lower
right of your screen. In particular, you can now see that the property with the value
“Fail” in it is the group property “Test~Status”. Now click on the downward pointing
“>>” search toggle button to switch from the simple search to the advanced search.
1.7 The advanced search in DIAdem enables you to construct a series of exact conditions,
each based on a specific property, operator, and comparison value. Click on the
“Delete Query” icon at the top of your screen to start with an empty query (click on
the “Yes” button if asked to confirm the query deletion). Now drag the
“Test~Status” property from the Data Portal property window at the bottom right of
your screen into the advanced search area.
NOTE: You must drag from the property name (in this case “Test~Status”)

© 2003-2017 National Instruments Corporation. All rights reserved.
DIAdem Hands-On Exercises, page 14 of 104
1.8 If you do not see the text “Fail” in the automatically inserted query condition, as
pictured below, click on that field and type in “Fail” so that you do (You could have
loaded a test file with one group that failed and a second group that passed). So far
you have always returned a list of files that matched your query conditions, but
DIAdem can also query the structure inside the files. Click on the far right of the
“Search” button so that you see the below drop list, then select “Search for Groups”
from that drop list. Now the query will only return a list of groups that failed.
NOTE: DIAdem always inserts an empty “File” condition at the bottom of your query.
1.9 Your search has returned a list of all failed groups from various files located across
any number of directories. You can configure which property columns appear in the
Search Results list and other items of interest. In the below screenshot you’re happy to
see the “File.File name” column, but the “File.Folder” column is just cluttering the
display. Click on the “Configure Results List” icon in order to pop-up the Search
Results configuration dialog.

© 2003-2017 National Instruments Corporation. All rights reserved.
DIAdem Hands-On Exercises, page 15 of 104
1.10 Here you see a list of all the property columns you have configured to appear in the
Search Results list. Click the “File.Folder” row to select it, then click the “Delete”
icon at the top right of the dialog to delete that row/property column. Check the
“Automatically determine property columns from search” checkbox at the lower
left of this dialog, if it is not already checked. This causes the “Group.Test~Status”
and any further properties used in queries to automatically appear as property columns
in the Results List. Finally, increase the “Maximum results returned by the search”
to 2000 and click the “OK” button to accept all these changes.
1.11 Now you can clearly see that all the groups returned by your query did indeed fail by
looking at the “Group.Test~Status” property column. Some of the data files have 2
groups which failed, while other data files have only 1 group that failed. The advanced
search in DIAdem enables you to return matching files, matching groups, or matching
channels for a particular query.
© 2003-2017 National Instruments Corporation. All rights reserved.
DIAdem Hands-On Exercises, page 16 of 104
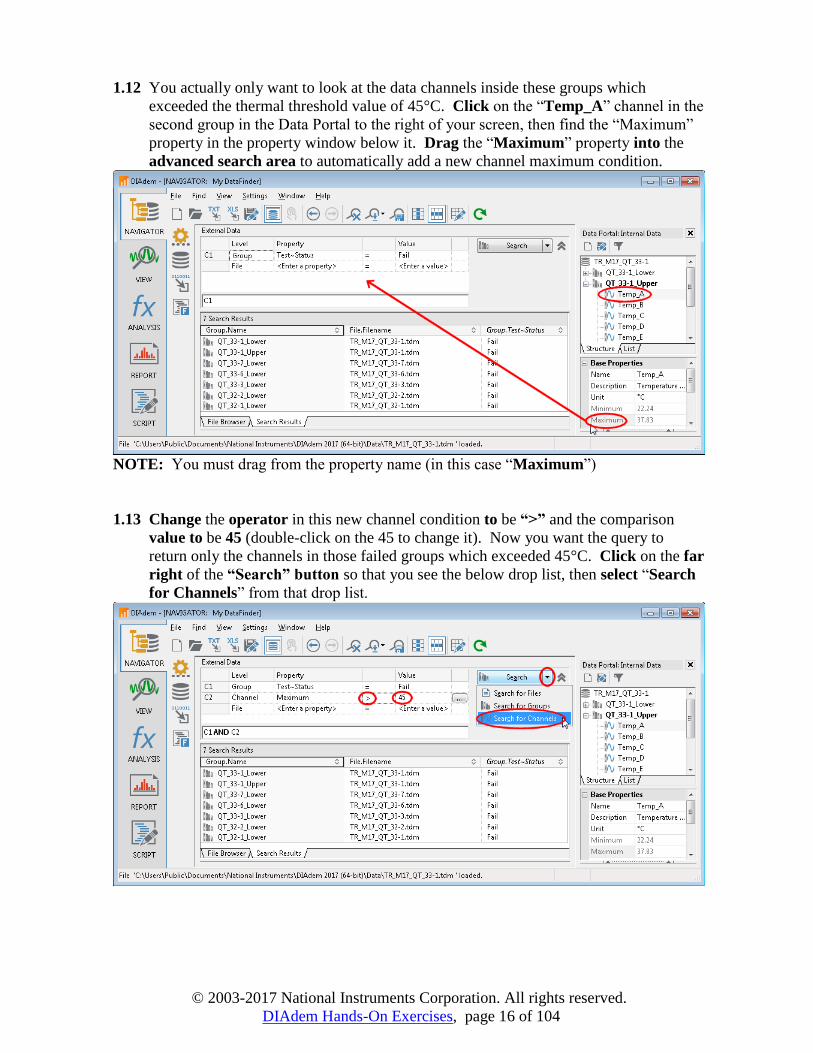
1.12 You actually only want to look at the data channels inside these groups which
exceeded the thermal threshold value of 45°C. Click on the “Temp_A” channel in the
second group in the Data Portal to the right of your screen, then find the “Maximum”
property in the property window below it. Drag the “Maximum” property into the
advanced search area to automatically add a new channel maximum condition.
NOTE: You must drag from the property name (in this case “Maximum”)
1.13 Change the operator in this new channel condition to be “>” and the comparison
value to be 45 (double-click on the 45 to change it). Now you want the query to
return only the channels in those failed groups which exceeded 45°C. Click on the far
right of the “Search” button so that you see the below drop list, then select “Search
for Channels” from that drop list.
© 2003-2017 National Instruments Corporation. All rights reserved.
DIAdem Hands-On Exercises, page 17 of 104
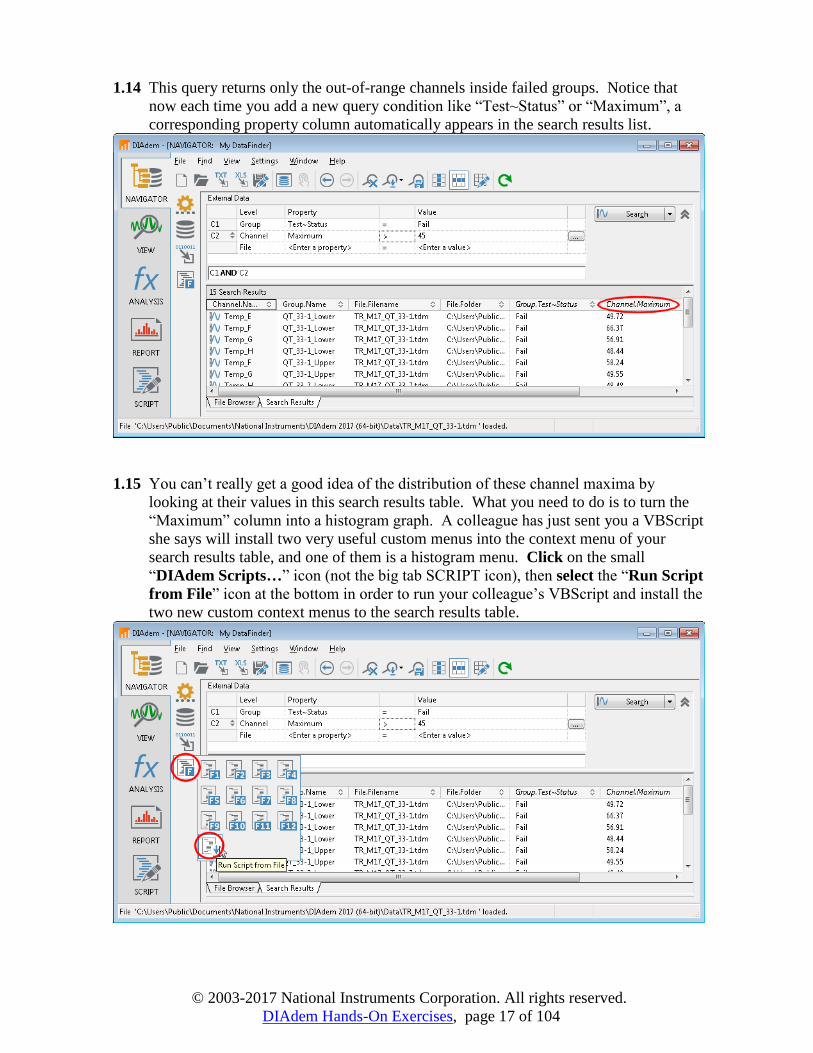
1.14 This query returns only the out-of-range channels inside failed groups. Notice that
now each time you add a new query condition like “Test~Status” or “Maximum”, a
corresponding property column automatically appears in the search results list.
1.15 You can’t really get a good idea of the distribution of these channel maxima by
looking at their values in this search results table. What you need to do is to turn the
“Maximum” column into a histogram graph. A colleague has just sent you a VBScript
she says will install two very useful custom menus into the context menu of your
search results table, and one of them is a histogram menu. Click on the small
“DIAdem Scripts…” icon (not the big tab SCRIPT icon), then select the “Run Script
from File” icon at the bottom in order to run your colleague’s VBScript and install the
two new custom context menus to the search results table.

© 2003-2017 National Instruments Corporation. All rights reserved.
DIAdem Hands-On Exercises, page 18 of 104
1.16 Navigate to the “…\Program Files\National Instruments\DIAdem
2017\Examples\Documents\” directory and select your colleague’s
“ResultsList_Menus_Add.VBS” (Note the “_Add” suffix) script file. If you don’t
see this VBScript file, double-check that the “Documents” directory is in fact under
“Program Files”. Finally, click on the “Load” button to run the VBScript that adds
her two custom menus.
(if you’re running in 32bit, you must start with “C:\Program Files (x86)\...”)
1.17 Whoops! It looks like that VBScript not only installed the custom context menus, it
also loaded up your colleague’s favorite query. Don’t worry, though, DIAdem stores
every query that you’ve run— click on the blue “back arrow” icon at the top of your
screen in order to retrieve your last query, the one YOU configured.

© 2003-2017 National Instruments Corporation. All rights reserved.
DIAdem Hands-On Exercises, page 19 of 104
1.18 Now you have recovered the query you configured. Click on the “Search” button to
re-run this query.
1.19 Now right-click on the “Channel.Maximum” property column heading and select the
custom “Histogram” menu that your colleague’s script just inserted. The DIAdem
environment can be adapted and customized in many ways to make your everyday
activities much more streamlined and convenient. This “Histogram” menu
automatically loads the “Maximum” column values as a new channel in the Data
Portal, calculates the histogram of this channel, and configures a histogram report of
the data and a table of the search conditions which defined it.
© 2003-2017 National Instruments Corporation. All rights reserved.
DIAdem Hands-On Exercises, page 20 of 104
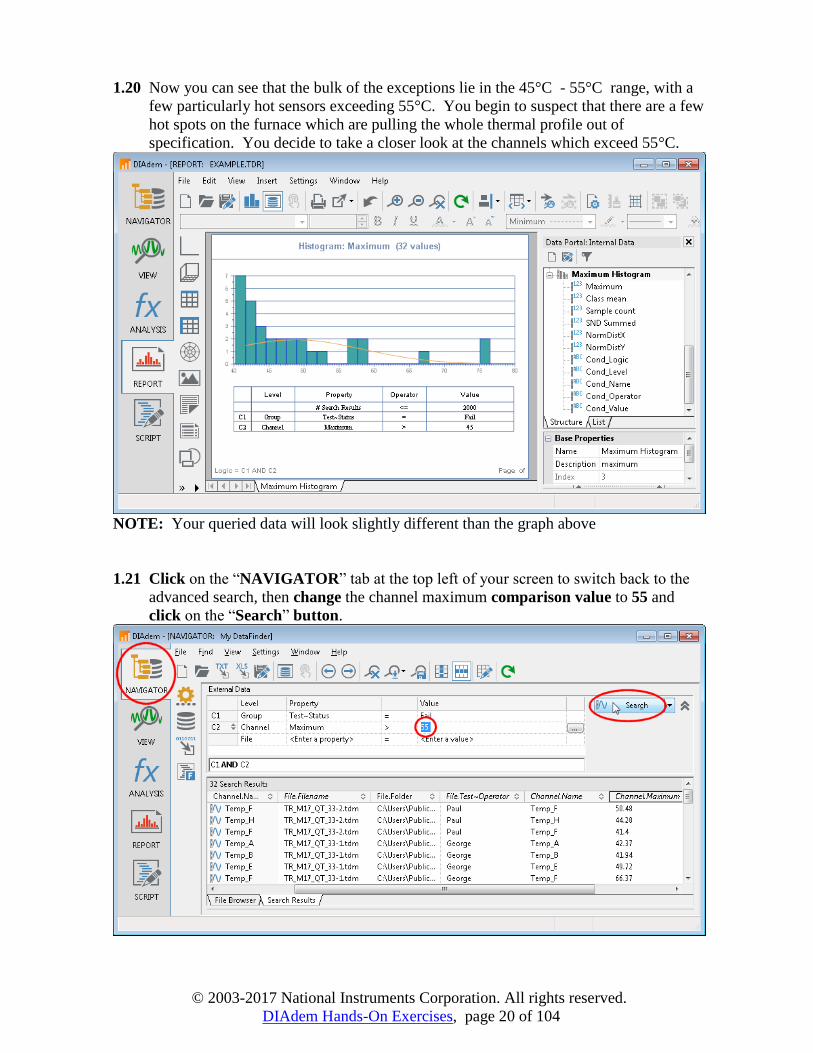
1.20 Now you can see that the bulk of the exceptions lie in the 45°C - 55°C range, with a
few particularly hot sensors exceeding 55°C. You begin to suspect that there are a few
hot spots on the furnace which are pulling the whole thermal profile out of
specification. You decide to take a closer look at the channels which exceed 55°C.
NOTE: Your queried data will look slightly different than the graph above
1.21 Click on the “NAVIGATOR” tab at the top left of your screen to switch back to the
advanced search, then change the channel maximum comparison value to 55 and
click on the “Search” button.

© 2003-2017 National Instruments Corporation. All rights reserved.
DIAdem Hands-On Exercises, page 21 of 104
1.22 Now you see that there are only a few of these suspected hot spots among the original
out-of-range channels. Right-click on the “Channel.Maximum” column heading and
select the “Histogram” menu again to automatically create a histogram report of these
hot spot channels.
1.23 You see that you have indeed isolated the hottest channels. Note that each time you
run the “Histogram” menu, the property column you selected is loaded into a new
channel in a new group in the Data Portal, and the histogram and normal distribution
are calculated from the loaded channel.
NOTE: Your queried data will look slightly different than the graph above

© 2003-2017 National Instruments Corporation. All rights reserved.
DIAdem Hands-On Exercises, page 22 of 104
1.24 Click on the “NAVIGATOR” tab at the top left of your screen to switch back to the
advanced search. You want to plot all of these out-of-range data channels, but first
you need to highlight them all. Right-click on the first “Channel.Name” column
header, then choose the “Select All” menu.
1.25 Now right-click on a cell in the first “Search Results” column and select the “Data
Report” menu. The first “Search Results” column represents the array of data in each
channel. The “Data Report” menu is the second custom menu that your colleague’s
script added to the DIAdem environment, along with the “Histogram” menu.

© 2003-2017 National Instruments Corporation. All rights reserved.
DIAdem Hands-On Exercises, page 23 of 104
1.26 This custom “Data Report” menu automatically loads and plots the selected channels
on a standard report. Now you have your initial results, and you need to email these
back to your boss, who doesn’t have DIAdem installed. Click on the “Export” icon at
the top of your screen and select the “PDF Export…” option to send your 3 page
report to a new 3 page PDF file.
NOTE: Your queried data will look slightly different than the graph above
1.27 In the “Save PDF File As” dialog, Navigate to the Desktop, name the new file
“Temp Report.pdf”, then click on the “Save” button to create the new PDF report. If
asked whether to overwrite a previous “Temp Report.pdf” file, select “Yes”.

© 2003-2017 National Instruments Corporation. All rights reserved.
DIAdem Hands-On Exercises, page 24 of 104
1.28 Open your Windows Explorer, navigate to the Desktop, then double-click on the
newly created “Temp Report.pdf” file to open it up in a PDF file reader, in order to
verify that the file is correct before sending it.
1.29 Here are the 3 report pages you just created in DIAdem, faithfully encoded in a
manager-friendly PDF file. Notice the names of the furthest-out-of-range sensors
pictured below (on the 3rd page of your report). You have “Temp_F”, “Temp_G”,
“Temp_H” and “Temp_J”. Sensors A – E are on the left side of your furnace, and
sensors F – K are on the right side of your furnace. It doesn’t look like only one
sensor is to blame, but rather almost all the sensors on the right side of the furnace.

© 2003-2017 National Instruments Corporation. All rights reserved.
DIAdem Hands-On Exercises, page 25 of 104
Exercise #2 Data Mining and Interactive Reporting
Scenario: You have been asked to hand-craft a special report of the excessively hot furnace
temperatures in recent test runs. Your boss is particularly concerned that the
furnaces could have been damaged by these unexpectedly high thermal profiles.
You need to create a report that shows the raw data from all over-limit channels, a
table of possibly pertinent properties to look for the cause, and proof that no part
of any furnace had a temperature swing of more than 60°C. You will use the
DataFinder to locate all the out-of-range temperature data. You will manually
import both the raw data and the properties from the DataFinder into channels in
the Data Portal. You will calculate the temperature swing of each out-of-range
channel and manually create graphs of the data traces and a table of the property
values. Finally, you will output this report to an HTML page so that you can post
your findings for others to view.
2.1 First get ready to search in DIAdem. Make sure that the “NAVIGATOR” tab at the
top left of your screen is selected. Next make sure the “File Browser” tab is selected
at the bottom left of your screen. Finally, if you don’t see the simple search bar
(pictured below with the text “<Enter text to find in search areas>”), then click on the
toggle button at the top right of your screen to switch back to the simple search shown
below.
© 2003-2017 National Instruments Corporation. All rights reserved.
DIAdem Hands-On Exercises, page 26 of 104
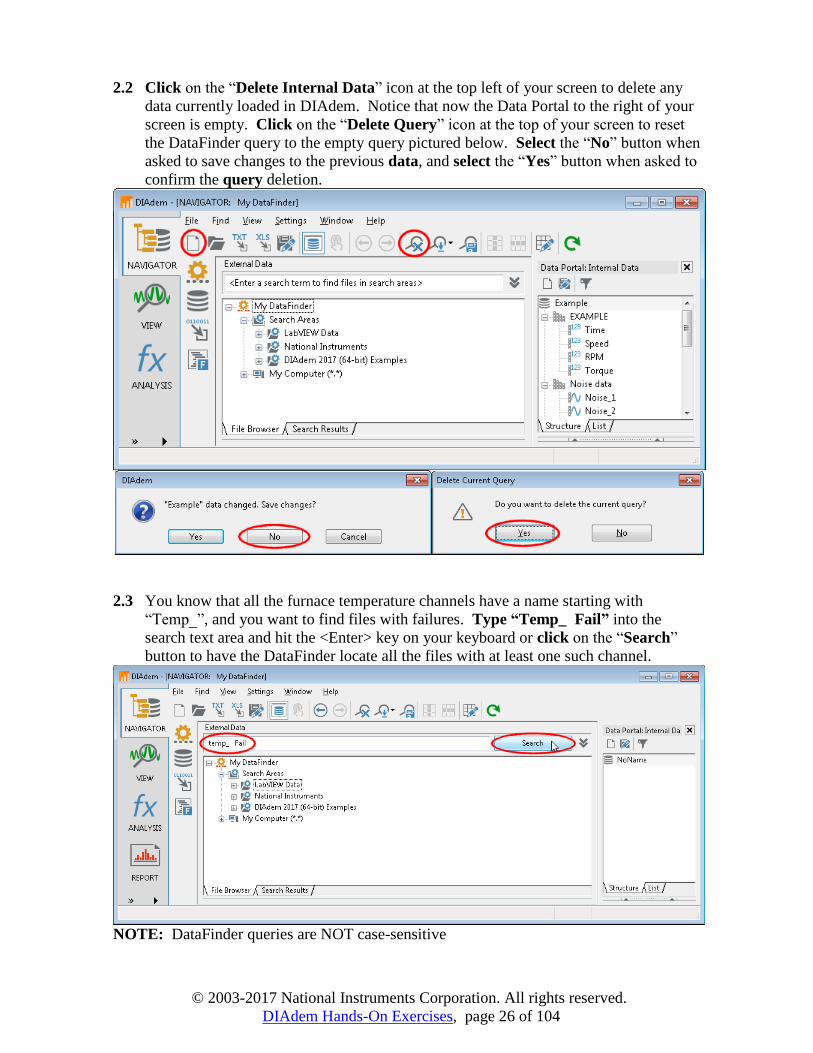
2.2 Click on the “Delete Internal Data” icon at the top left of your screen to delete any
data currently loaded in DIAdem. Notice that now the Data Portal to the right of your
screen is empty. Click on the “Delete Query” icon at the top of your screen to reset
the DataFinder query to the empty query pictured below. Select the “No” button when
asked to save changes to the previous data, and select the “Yes” button when asked to
confirm the query deletion.
2.3 You know that all the furnace temperature channels have a name starting with
“Temp_”, and you want to find files with failures. Type “Temp_ Fail” into the
search text area and hit the <Enter> key on your keyboard or click on the “Search”
button to have the DataFinder locate all the files with at least one such channel.
NOTE: DataFinder queries are NOT case-sensitive

© 2003-2017 National Instruments Corporation. All rights reserved.
DIAdem Hands-On Exercises, page 27 of 104
2.4 The DataFinder simple text search always returns a list of files in the search results
table, even if the text searched for was found in a group or channel property. You can
look inside any of these files without loading them into DIAdem by finding them in the
NAVIGATOR file browser. Right-click on the first TDM file that has a name starting
with “TR_” and select the “Display in File Browser” menu in order to automatically
find this file in the NAVIGATOR file browser.
NOTE: The first column of the Search Results list is different from the others. The first
column (pictured above with the heading “File.Filename”) represents all the data arrays
stored inside the file— the actual measured values. Every other column (such as the
“File.Folder” column pictured above) represents a single scalar property stored with every
file. You will likely have a different number of search results than pictured.
2.5 Here is the first “TR_...TDM” file you found with the simple search shown in the
NAVIGATOR file browser. Note that when a file is highlighted in the tree view you
can see its file properties in the property table at the bottom of your screen. Now you
can click on the “+” sign to the left of this file to open it up and display all the groups
inside it in the NAVIGATOR tree view.

© 2003-2017 National Instruments Corporation. All rights reserved.
DIAdem Hands-On Exercises, page 28 of 104
2.6 Here you see that this “TR_...TDM” file has two groups, corresponding to the sensors
on the lower half of the furnace and those on the upper half of the furnace. Select the
“…_Lower” group in order to review its properties in the property window at the
bottom of your screen. You want to search for all sensor groups where Test~Status =
Fail. For this, you need the DataFinder advanced search, which you can get if you
click on the downward facing “>>” icon near the top right of your screen.
2.7 The easiest way to add this query condition is to drag the “Test~Status” property from
the property window at the bottom of your screen into the search conditions table at
the top of your screen.
NOTE: You must drag the property from its property name field (in this case the
“Test~Status” field).

© 2003-2017 National Instruments Corporation. All rights reserved.
DIAdem Hands-On Exercises, page 29 of 104
2.8 Now you see that there is a new condition inserted in the search conditions table which
exactly matches the group “Test~Status” property you dragged from the property
window. If you happened to drag from a Group that had the property state
Group.Test~Status = “Pass”, change that value to “Fail” as pictured below.
2.9 You noticed in your earlier search results that a number of non-TDM files appeared,
which you would like to exclude. Click on the “<Enter a property>” field in the
“Property” column and select the “DataPlugin name” file property in the drop list to
manually configure the property name of a new file property condition.

© 2003-2017 National Instruments Corporation. All rights reserved.
DIAdem Hands-On Exercises, page 30 of 104
2.10 To complete the DataPlugin name condition, you need to require that it equal “TDM”,
so double-click in the “Value” field to the right of the “DataPlugin name” condition
and type in “TDM”, then hit the <Enter> key on your keyboard. You can alternatively
click on the […] button to the right of the “Value” field and select from a drop list of
indexed DataPlugin names.
2.11 Now click on the “+” sign to the left of the first group in the tree view to open it up
and display all the channels inside. In this way you can browse the entire hierarchy
(File >> Groups >> Channels) and property structure of the file without ever having to
load it into DIAdem. This is particularly useful when the file is very large and would
take a long time to load.
© 2003-2017 National Instruments Corporation. All rights reserved.
DIAdem Hands-On Exercises, page 31 of 104
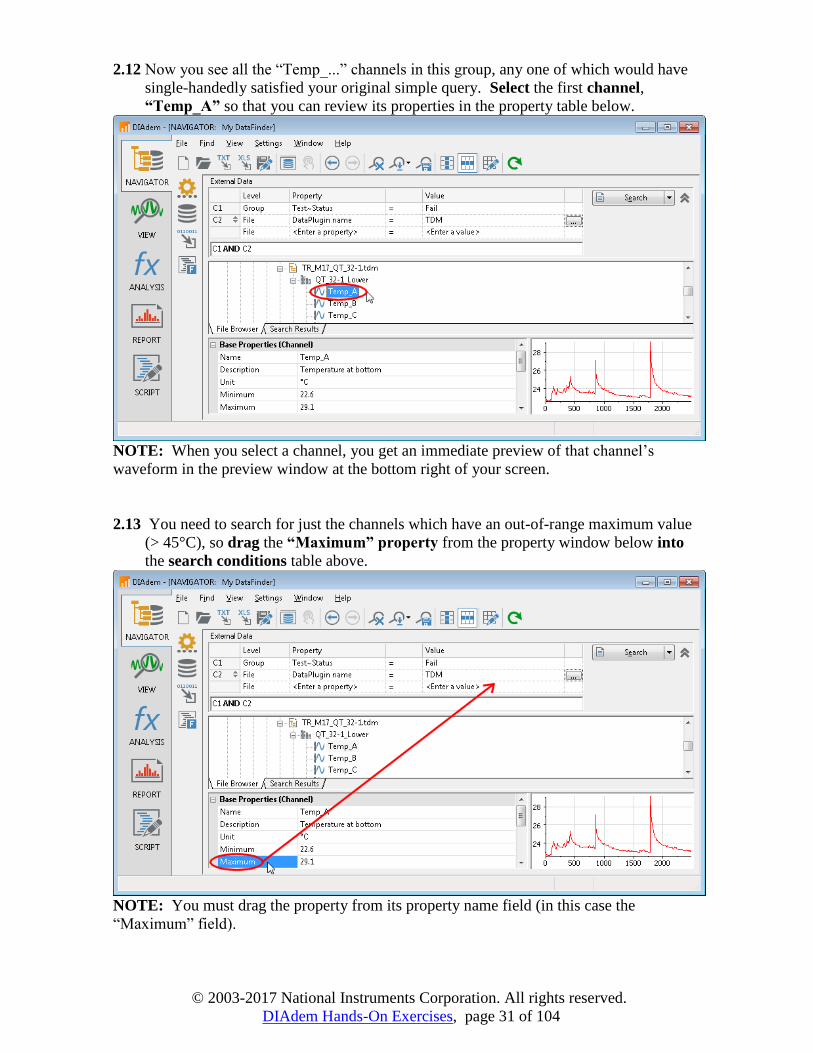
2.12 Now you see all the “Temp_...” channels in this group, any one of which would have
single-handedly satisfied your original simple query. Select the first channel,
“Temp_A” so that you can review its properties in the property table below.
NOTE: When you select a channel, you get an immediate preview of that channel’s
waveform in the preview window at the bottom right of your screen.
2.13 You need to search for just the channels which have an out-of-range maximum value
(> 45°C), so drag the “Maximum” property from the property window below into
the search conditions table above.
NOTE: You must drag the property from its property name field (in this case the
“Maximum” field).

© 2003-2017 National Instruments Corporation. All rights reserved.
DIAdem Hands-On Exercises, page 32 of 104
2.14 This time neither the comparison operator nor the property value of the new condition
are quite right. Change the channel maximum operator from “=” to “>”, then
change the comparison value to 45 (°C). Click on the enumeration icon at the far
right of the “Search” button and select “Search for Channels” to search for all the
channels with a maximum value > 45°C which are stored in a TDM group that failed.
2.15 You need to select all of these out-of-range temperature traces so that you can load
them into DIAdem. Right-click the first “Search Results” column and choose the
“Select All” menu.

© 2003-2017 National Instruments Corporation. All rights reserved.
DIAdem Hands-On Exercises, page 33 of 104
2.16 Now drag all the selected channels from the search results table in the center of your
screen into the Data Portal on the right side of your screen. This loads all the data
values for these channels.
NOTE: You must drag from the first column as shown above or you will lose your channel
selection.
© 2003-2017 National Instruments Corporation. All rights reserved.
DIAdem Hands-On Exercises, page 34 of 104
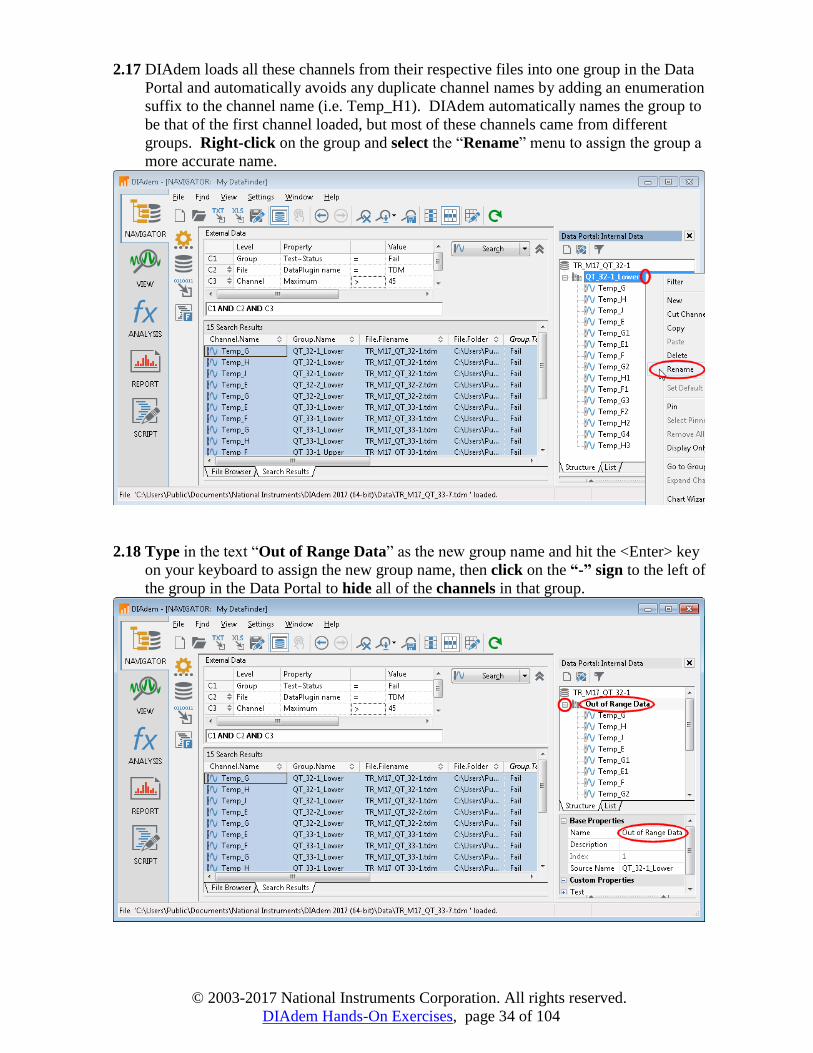
2.17 DIAdem loads all these channels from their respective files into one group in the Data
Portal and automatically avoids any duplicate channel names by adding an enumeration
suffix to the channel name (i.e. Temp_H1). DIAdem automatically names the group to
be that of the first channel loaded, but most of these channels came from different
groups. Right-click on the group and select the “Rename” menu to assign the group a
more accurate name.
2.18 Type in the text “Out of Range Data” as the new group name and hit the <Enter> key
on your keyboard to assign the new group name, then click on the “-” sign to the left of
the group in the Data Portal to hide all of the channels in that group.

© 2003-2017 National Instruments Corporation. All rights reserved.
DIAdem Hands-On Exercises, page 35 of 104
2.19 Now that all the temperature traces are loaded, the next step is to load all the
measurement properties for the out-of-range data. It will be convenient for these
properties to go to channels in a new group. Right-click on the group in the Data
Portal and select the “New>>Group” menu.
2.20 Type in “Out of Range Properties” to name the new group, make sure the “Set
default group” checkbox is checked, then click on the “OK” button.

© 2003-2017 National Instruments Corporation. All rights reserved.
DIAdem Hands-On Exercises, page 36 of 104
2.21 Notice that the new “Out of Range Properties” group you just created is in bold type,
while the old “Out of Range Data” group is in normal type. This tells you that the “Out
of Range Properties” group is the default group in the Data Portal, and any newly
imported channels will be assigned to it, which is exactly what you want. If the “Out
of Range Properties” group happens not to be bold, you need to right-click on the “Out
of Range Properties” group and select the “Set Default Group” menu.
2.22 The properties you want to import should show up in the search results table as
columns, like the Channel.Maximum property. Click on the “Configure Search
Results” icon at the top of your screen in order to specify exactly the property columns
you want to see in the Search Results.

© 2003-2017 National Instruments Corporation. All rights reserved.
DIAdem Hands-On Exercises, page 37 of 104
2.23 By default, any search conditions you enter automatically result in that property
showing up in the search results table as a new property column. Uncheck that
checkbox in the lower left of this dialog to cancel this effect. Check the checkbox
directly underneath it to show only the property name in each column header. Also
increase the maximum search results from the default 200 to 2000.
2.24 None of the remaining properties are ones you care about in building your report.
Select all but the <Enter a property> row in the below table and click on the red X
“Delete” icon to remove these unneeded property columns.
© 2003-2017 National Instruments Corporation. All rights reserved.
DIAdem Hands-On Exercises, page 38 of 104
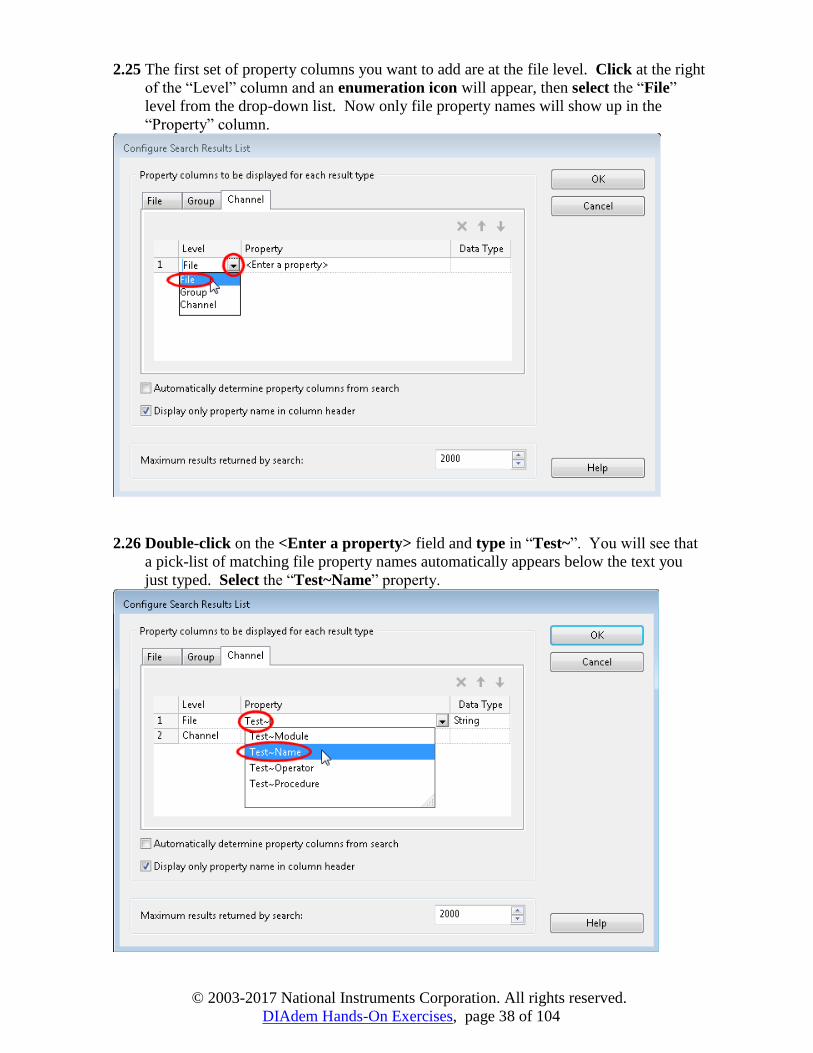
2.25 The first set of property columns you want to add are at the file level. Click at the right
of the “Level” column and an enumeration icon will appear, then select the “File”
level from the drop-down list. Now only file property names will show up in the
“Property” column.
2.26 Double-click on the <Enter a property> field and type in “Test~”. You will see that
a pick-list of matching file property names automatically appears below the text you
just typed. Select the “Test~Name” property.

© 2003-2017 National Instruments Corporation. All rights reserved.
DIAdem Hands-On Exercises, page 39 of 104
2.27 In the same way as above, add the file properties “Test~Operator” and
“Test~Procedure”. Next leave the default “Channel” level in the first column of row
4, then type in “Sensor” in the “Property” column of row 4 and select the
“Sensor~ID” property name.
2.28 Place your mouse at the top of the dialog and drag the dialog taller to make room for
a few more property column definitions. Then in the same way as above add the
channel properties “Name”, “Maximum”, and “Minimum”. Click on the “OK”
button to accept all these property column edits.

© 2003-2017 National Instruments Corporation. All rights reserved.
DIAdem Hands-On Exercises, page 40 of 104
2.29 Observe that now all of your configured property columns appear in the search results
table. Select all 8 of these columns (but NOT the first column) by clicking on the
columns headings and using the <Shift> key and the scroll bar, then drag them
together into the Data Portal. This loads all 8 of these property columns as new Data
Portal channels into the default “Out of Range Properties” group. You could
alternatively right-click and choose the menu, “Load Property As Channel”. Click
“OK” when DIAdem suggests a column-oriented query for faster column loading.
NOTE: You must drag from a column heading or you will lose your column selection.
2.30 Now that you have found and loaded both the out-of-range data and their properties
into DIAdem as new channels in the Data Portal, you can begin looking at this data.
Click on the VIEW icon at the far left of your screen to switch to the VIEW panel of
DIAdem.

© 2003-2017 National Instruments Corporation. All rights reserved.
DIAdem Hands-On Exercises, page 41 of 104
2.31 DIAdem VIEW is where you can get a quick look at the data in the Data Portal. First
click on the “New Layout” icon at the top left of your screen to clear the VIEW panel,
then select “Assigned Worksheet Partitions” and “2D Axis Systems Horizontal” in
order to set up your VIEW workspace with two vertically stacked graph areas.
2.32 Drag the “Out of Range Data” group from the Data Portal into the top graph area in
order to quickly and easily graph all of the out-of-range temperature traces.

© 2003-2017 National Instruments Corporation. All rights reserved.
DIAdem Hands-On Exercises, page 42 of 104
2.33 Drag the “Maximum” channel from the “Out of Range Properties” group in the Data
Portal into the bottom graph in order to plot all the maximum values.
NOTE: Your queried data may look slightly different than the graph above
2.34 Drag the “Minimum” channel from the “Out of Range Properties” group in the Data
Portal into the bottom graph in order to plot all the minimum values.
NOTE: Your queried data may look slightly different than the graph above
© 2003-2017 National Instruments Corporation. All rights reserved.
DIAdem Hands-On Exercises, page 43 of 104
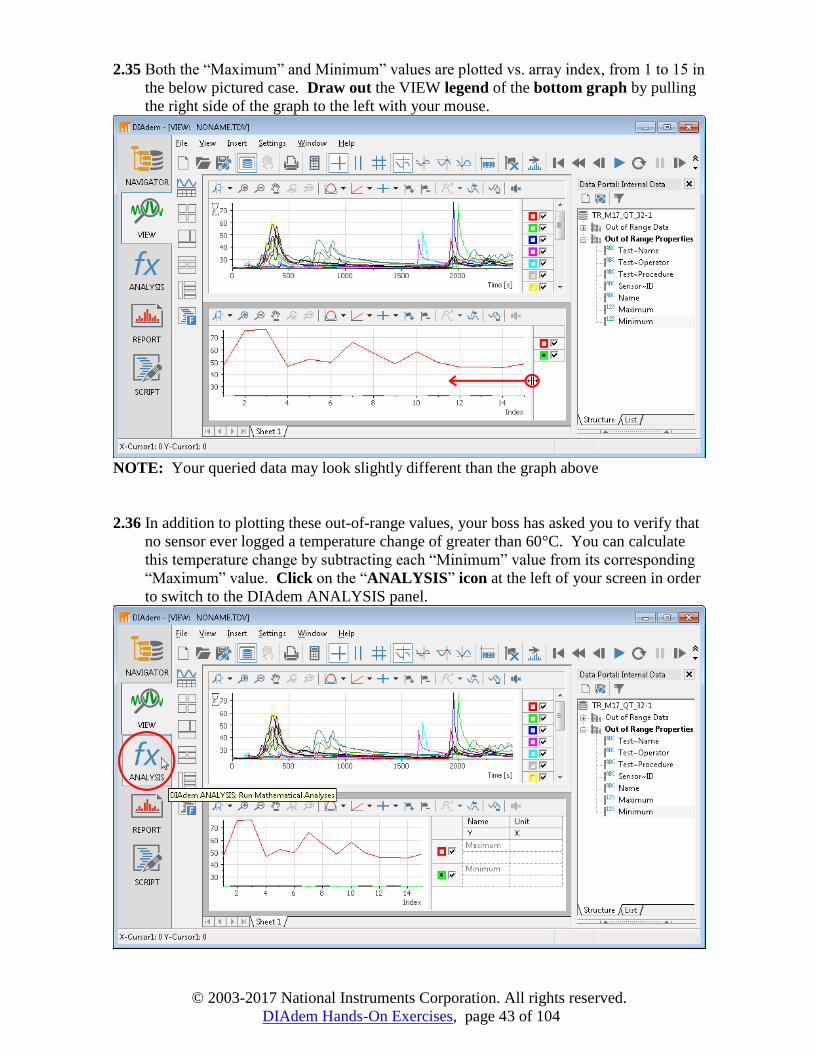
2.35 Both the “Maximum” and Minimum” values are plotted vs. array index, from 1 to 15 in
the below pictured case. Draw out the VIEW legend of the bottom graph by pulling
the right side of the graph to the left with your mouse.
NOTE: Your queried data may look slightly different than the graph above
2.36 In addition to plotting these out-of-range values, your boss has asked you to verify that
no sensor ever logged a temperature change of greater than 60°C. You can calculate
this temperature change by subtracting each “Minimum” value from its corresponding
“Maximum” value. Click on the “ANALYSIS” icon at the left of your screen in order
to switch to the DIAdem ANALYSIS panel.

© 2003-2017 National Instruments Corporation. All rights reserved.
DIAdem Hands-On Exercises, page 44 of 104
2.37 DIAdem ANALYSIS is where you go in DIAdem to make calculations based on
channels you have loaded in the Data Portal. Click on the “Basic Mathematics” icon
and select the “Subtract” function.
2.38 Each function in DIAdem ANALYSIS pops up a configuration dialog where you select
the Data Portal channels to use and any additional function parameters. In this case
you just need to select the two channels to subtract one from the other. You can select
the channels by choosing from the enumerated drop-lists in the dialog or by dragging
channels from the Data Portal. Drag the “Maximum” channel from the Data Portal
into the first channel field and the “Minimum” channel from the Data Portal into the
second channel field, as shown below.

© 2003-2017 National Instruments Corporation. All rights reserved.
DIAdem Hands-On Exercises, page 45 of 104
2.39 This function has no further parameters to configure, it will just subtract each minimum
value from its matching maximum value and create a new channel of difference values
in the Data Portal. Click on the “OK” button to run the function and exit the dialog.
2.40 Notice that the output of this “Subtract” function is a new channel in the Data Portal
called “Subtracted”. Right-click on this new “Subtracted” channel and select the
“Rename” menu.

© 2003-2017 National Instruments Corporation. All rights reserved.
DIAdem Hands-On Exercises, page 46 of 104
2.41 Type in “Temp Delta” and hit the <Enter> key on your keyboard to name the
difference between the minimum and maximum appropriately. Now you are ready to
look at the channel you created, so click on the “VIEW” icon at the left of your screen
to switch back to DIAdem VIEW.
2.42 Drag the new “Temp Delta” channel from the Data Portal into the bottom graph to
plot it alongside the temperature “Maximum” and “Minimum” values.

© 2003-2017 National Instruments Corporation. All rights reserved.
DIAdem Hands-On Exercises, page 47 of 104
2.43 Now you can see that the “Temp Delta” values for each out-of-range sensor never
exceeded 60°C (although they came close), so all your furnaces should still be OK.
Your boss will be so pleased. Now you want to turn these graphs into a report you can
share with others. In order to re-use what you have here in VIEW, click on the
“Transfer to REPORT” icon at the top of your screen.
NOTE: Your queried data may look slightly different than the graph above
2.44 The REPORT panel in DIAdem is where you create publication quality reports by
dragging and dropping and configuring different report objects. The transfer from
VIEW you just selected automatically re-creates the static report you had in VIEW
with fully configurable REPORT objects. You don’t really need the legend for the top
graph, so right-click on the top legend and select the “Delete…” menu. Click on
“Yes” when asked to confirm the deleting of the top legend.

© 2003-2017 National Instruments Corporation. All rights reserved.
DIAdem Hands-On Exercises, page 48 of 104
2.45 If you have other sheets in the REPORT panel that were created prior to the one you
just transferred from VIEW, right-click on each old sheet and select the “Delete”
menu. Click on the “Yes” button when asked to confirm the sheet deletion.

© 2003-2017 National Instruments Corporation. All rights reserved.
DIAdem Hands-On Exercises, page 49 of 104
2.46 The default sheet name “VIEW-REPORT” is not very helpful in describing the out-of-
range data graphs you’ve created. Right-click on the “VIEW-REPORT” sheet and
select the “Rename” menu.
2.47 Type “Out of Range Data” to rename the group and hit the <Enter> key on your
keyboard. Each component of this REPORT sheet is an independent object that can be
moved or configured at will, unlike in VIEW. To see how this works, click on the
legend, then drag it to move it to the left.

© 2003-2017 National Instruments Corporation. All rights reserved.
DIAdem Hands-On Exercises, page 50 of 104
2.48 You need to add a table of the measurement properties to this report, but there is no
more room on this sheet, so you should add a second REPORT sheet. Right-click on
the “Out of Range Data” sheet and select the “New” menu. You could also just
double-click on the gray space to the right of the last sheet to add a new one.
2.49 Right-click on the new sheet and select the “Rename” menu, as before to customize
the name of the new sheet.

© 2003-2017 National Instruments Corporation. All rights reserved.
DIAdem Hands-On Exercises, page 51 of 104
2.50 Type in “Out of Range Properties” and hit the <Enter> key on your keyboard to
give this new sheet a descriptive name. Now you want to insert a table object onto this
new sheet. Select the “2D Tables” icon at the left of your screen, then select the “2D
Table with Horizontal and Vertical Separators” icon.
2.51 Now hold the mouse button down while dragging the mouse from the top left to the
bottom right of your screen to outline the desired location of the new table object.

© 2003-2017 National Instruments Corporation. All rights reserved.
DIAdem Hands-On Exercises, page 52 of 104
2.52 Drag the “Out of Range Properties” group in the Data Portal at the right of your
screen into the new table object in order to assign the table columns.
2.53 Now you see the out-of-range properties for the first 10 measurements, because the
table object defaults to show only the first 10 rows. Right-click on the table and select
the “Display…” menu in order to change the table configuration.
© 2003-2017 National Instruments Corporation. All rights reserved.
DIAdem Hands-On Exercises, page 53 of 104
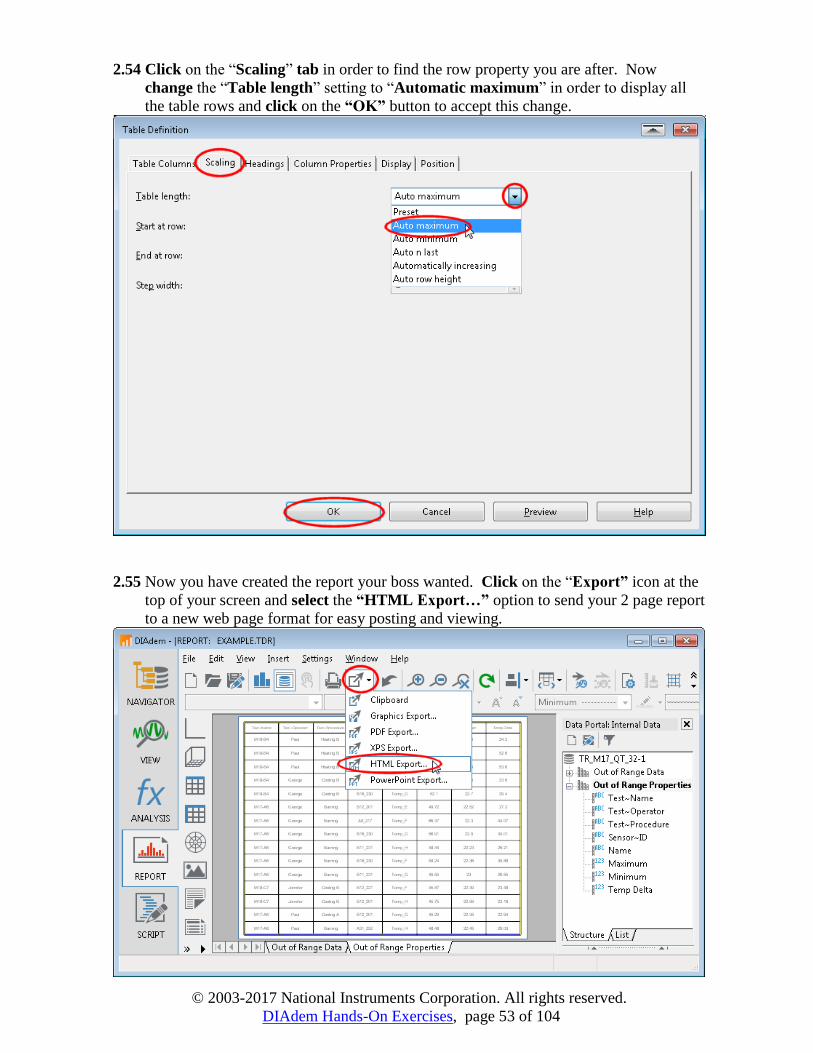
2.54 Click on the “Scaling” tab in order to find the row property you are after. Now
change the “Table length” setting to “Automatic maximum” in order to display all
the table rows and click on the “OK” button to accept this change.
2.55 Now you have created the report your boss wanted. Click on the “Export” icon at the
top of your screen and select the “HTML Export…” option to send your 2 page report
to a new web page format for easy posting and viewing.

© 2003-2017 National Instruments Corporation. All rights reserved.
DIAdem Hands-On Exercises, page 54 of 104
2.56 Select to save the file to the Desktop, name the file “Temp Report.htm”, then click
on the “Save” button to save this two page report to HTML format. Click “Yes” if
asked to confirm overwriting an HTML file of the same name.
2.57 Open Windows Explorer, navigate to the Desktop, find the “Temp Report.htm”
file you just created, and double-click on it to review your HTML report in your
default internet browser before posting it.

© 2003-2017 National Instruments Corporation. All rights reserved.
DIAdem Hands-On Exercises, page 55 of 104
2.58 This is your final report— notice how the sheet tab names in REPORT automatically
became section headers in the HTML report as each REPORT sheet was appended
below the previous one in the continuous HTML page format.
NOTE: Your graph and table may look somewhat different from those pictured above.

© 2003-2017 National Instruments Corporation. All rights reserved.
DIAdem Hands-On Exercises, page 56 of 104
Exercise #3 Create Automated Analysis and Reporting
Scenario: Your group is rolling out a new low frequency acoustic data test rig— you
already have three data files with many more coming in soon, and you will be in
charge of reporting all this data. You need to look at this early data, determine
the best way to analyze and report it, then develop an automatic reporting process
so that you can quickly create reports as more and more data come in. You will
load the first data set in NAVIGATOR, take a quick look at the data in VIEW,
apply a digital filter to the data in ANALYSIS, then create a custom display of the
data in REPORT. Once you have gone through these steps interactively for the
first data set, you will repeat them with the VBScript recorder running in SCRIPT
for the second data set, in order to automatically generate your reporting script.
You will then test the new reporting script with the third data set to verify that
you are ready for the full roll-out.
3.1 First get ready to load data into DIAdem. Make sure that the “NAVIGATOR” tab at
the top left of your screen is selected. Next make sure the “File Browser” tab is
selected at the bottom left of your screen. Finally, if you don’t see the simple search
bar (pictured below with the text “<Enter text to find in search areas>”), then click on
the toggle button at the top right of your screen to switch back to the simple search
shown below, since it takes up less room (no searching in this exercise).

© 2003-2017 National Instruments Corporation. All rights reserved.
DIAdem Hands-On Exercises, page 57 of 104
3.2 Click on the “Delete Internal Data” icon at the top left of your screen in order to clear
out the Data Portal and start with a clean slate. Click the “No” button if you are asked
if you want to save changes to the data in the Data Portal.
3.3 Open up the “National Instruments” folder under the “Search Areas” node and
navigate down to the “DIAdem 2017\Data\” directory. Drag the file “Demo1.tdm”
from the file browser on the left into the Data Portal on the right of your screen. This
loads the data, properties, and hierarchy of that data file into DIAdem memory.
© 2003-2017 National Instruments Corporation. All rights reserved.
DIAdem Hands-On Exercises, page 58 of 104
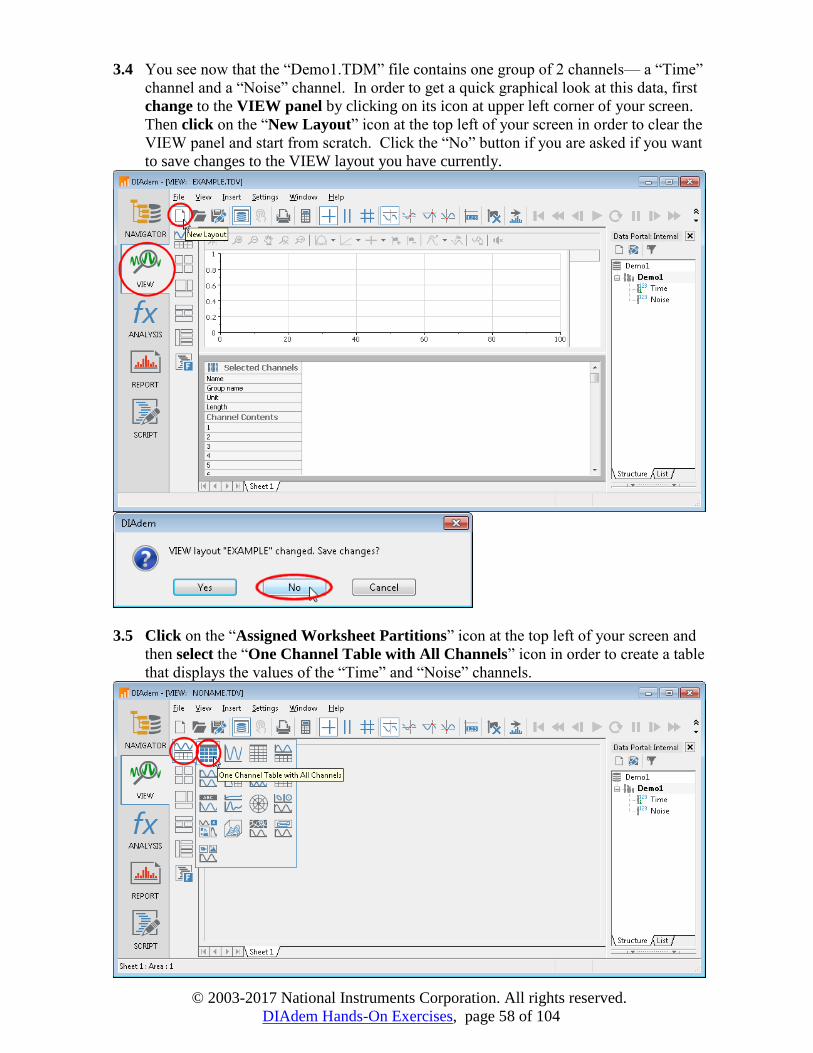
3.4 You see now that the “Demo1.TDM” file contains one group of 2 channels— a “Time”
channel and a “Noise” channel. In order to get a quick graphical look at this data, first
change to the VIEW panel by clicking on its icon at upper left corner of your screen.
Then click on the “New Layout” icon at the top left of your screen in order to clear the
VIEW panel and start from scratch. Click the “No” button if you are asked if you want
to save changes to the VIEW layout you have currently.
3.5 Click on the “Assigned Worksheet Partitions” icon at the top left of your screen and
then select the “One Channel Table with All Channels” icon in order to create a table
that displays the values of the “Time” and “Noise” channels.
© 2003-2017 National Instruments Corporation. All rights reserved.
DIAdem Hands-On Exercises, page 59 of 104
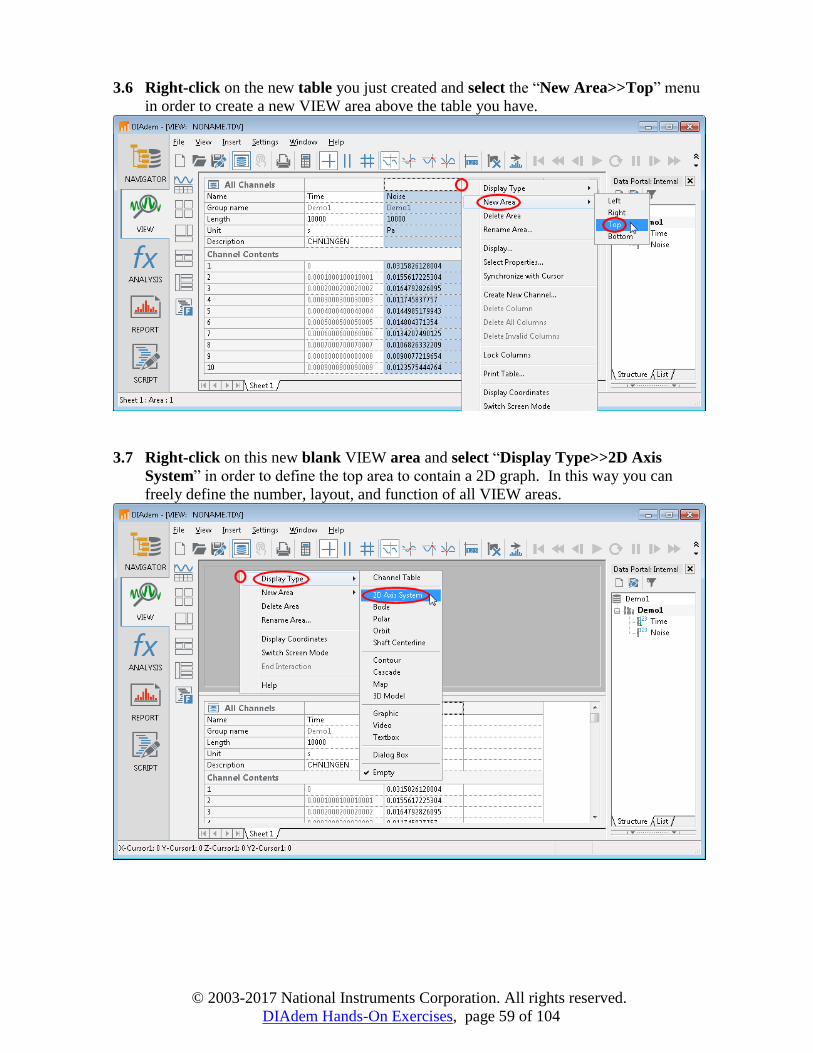
3.6 Right-click on the new table you just created and select the “New Area>>Top” menu
in order to create a new VIEW area above the table you have.
3.7 Right-click on this new blank VIEW area and select “Display Type>>2D Axis
System” in order to define the top area to contain a 2D graph. In this way you can
freely define the number, layout, and function of all VIEW areas.

© 2003-2017 National Instruments Corporation. All rights reserved.
DIAdem Hands-On Exercises, page 60 of 104
3.8 Select the “Demo1” group in the Data Portal at the right of your screen and drag it
into the top VIEW area. Dragging the entire group will automatically graph the
“Noise” channel on the Y-axis vs. the “Time” channel on the X-axis.
3.9 Now you see the acquired signal from your “Demo1.TDM” file in both graphical and
tabular fashion. You suspect there is high frequency noise in this signal, so you decide
to try to remove this unwanted noise by applying a digital low-pass filter.
© 2003-2017 National Instruments Corporation. All rights reserved.
DIAdem Hands-On Exercises, page 61 of 104
3.10 Click on the ANALYSIS tab icon at the left of your screen in order to switch to the
ANALYSIS panel, then click on the “Signal Analysis” icon at the left of your screen
and select the “Digital Filters” function to launch its configuration dialog.
3.11 Note that the “Time” and “Noise” channels are automatically selected in the “Time
channel” and “Signal channel” fields, respectively. Make sure the “Filter mode” field
is set to “Lowpass” and type in “100” for the “Limit frequency [Hz]” value. Finally
click on the “IIR Parameters” tab to set additional filter details.
© 2003-2017 National Instruments Corporation. All rights reserved.
DIAdem Hands-On Exercises, page 62 of 104
3.12 Make sure the “Filter type” is set to the default “Bessel” value, then check the “Force
zero phase” checkbox— this will make the filtered waveform a better fit of the raw
signal. Now select the “OK” button to execute the digital filter function.
3.13 You can see that the resulting filtered signal is stored as a new channel in the Data
Portal called “FilteredSignal”. The ANALYSIS panel also shows a log of the digital
filter calculation you just executed.
© 2003-2017 National Instruments Corporation. All rights reserved.
DIAdem Hands-On Exercises, page 63 of 104
3.14 Click on the VIEW icon to switch back to VIEW. Then click on the “Time” channel
in the Data Portal and hold down the <Ctrl> button while clicking on the
“FilteredSignal” channel in the Data Portal— this selects only those two channels.
Now drag the two selected channels into the top VIEW area to plot the newly
calculated FilteredSignal channel vs. the original Time channel on the top graph.
3.15 Now you can see the raw signal and the filtered signal side by side, but it is hard to see
the difference at the full graph scale. Click on the “Band Zoom” icon at the top left of
your screen, then click on the graph and drag the mouse to the right to outline a small
time region in order to zoom into it.

© 2003-2017 National Instruments Corporation. All rights reserved.
DIAdem Hands-On Exercises, page 64 of 104
3.16 Now you see only the region you just highlighted with the mouse— and you see that
the green digitally filtered signal is nearly the same as the red raw data signal, just
much less noisy. You decide this is just the signal processing you need, and now you
want to create a report of this data.
3.17 Click on the “REPORT” icon in order to switch to the REPORT panel, then click on
the “New Layout” icon at the top left of your screen in order to clear the REPORT area
of any previous sheets or REPORT objects. Click on the “No” icon if asked if you
want to save your changes to the current REPORT layout.
© 2003-2017 National Instruments Corporation. All rights reserved.
DIAdem Hands-On Exercises, page 65 of 104
3.18 Click on the “2D Axis Systems” icon at the top left of your screen and select the “2D-
axis systems with grid” to insert a new REPORT graph object.
3.19 Click and drag your mouse from the top left to the bottom right of the REPORT area
in order to outline the location of the new REPORT graph object.
© 2003-2017 National Instruments Corporation. All rights reserved.
DIAdem Hands-On Exercises, page 66 of 104
3.20 Drag the “Demo1” group from the Data Portal at the right of your screen into the new
graph object. This automatically plots the “Noise” and “FilteredSignal” channels on
the Y-axis vs. the “Time” channel on the X-axis.
3.21 Click on the “Graphics” icon at the left of your screen, then select “Graphic 1” in order
to add a company logo to the report.

© 2003-2017 National Instruments Corporation. All rights reserved.
DIAdem Hands-On Exercises, page 67 of 104
3.22 Click and drag your mouse where you want the logo to be— outline an area in the
bottom right of the REPORT area, then release the left mouse button.
3.23 Click on the “Noise” channel in the Data Portal to select it, then look at its properties
in the property table below it. Click on the “Minimum” property, then hold the
<Shift> key down while selecting the “Maximum” property as well. Now drag both
properties onto the bottom of the REPORT area.

© 2003-2017 National Instruments Corporation. All rights reserved.
DIAdem Hands-On Exercises, page 68 of 104
3.24 Click on the new textbox object that was automatically added to your REPORT area,
then change the value of the “Font Size” field to 3.6 and click the “Bold” icon at the
top of your screen to make the minimum and maximum values stand out.
3.25 Click on the “Source file” property name, then drag it onto the bottom left of the
REPORT area to add the file name to the REPORT layout.
© 2003-2017 National Instruments Corporation. All rights reserved.
DIAdem Hands-On Exercises, page 69 of 104
3.26 Click on the file name textbox object that was automatically added to your REPORT
area, then change the value of the “Font Size” field to 5 and click the “Bold” icon at
the top of your screen to again make it stand out.
3.27 Now the report looks like you want it. What you really need is to quickly and easily
create this sort of report for every new data set that comes in. To save this report
template for future use, click the “Save Layout As” icon at the top left of the screen.

© 2003-2017 National Instruments Corporation. All rights reserved.
DIAdem Hands-On Exercises, page 70 of 104
3.28 Navigate to the Desktop, name the file “Auto Report.TDR” and click the “Save”
button. Click “Yes” if asked to confirm overwriting a file of the same name.
3.29 Now you will use the VBScript Recorder in DIAdem to easily retrace your analysis and
reporting steps and turn them into a reporting script. First click on the “New Layout”
icon to start from scratch in the REPORT panel.

© 2003-2017 National Instruments Corporation. All rights reserved.
DIAdem Hands-On Exercises, page 71 of 104
3.30 Click on the “NAVIGATOR” icon in order to switch to the NAVIGATOR panel, then
Click on the “Delete Internal Data” icon at the top left of your screen in order to clear
out the Data Portal and start with a clean slate. Click the “No” button if you are asked
if you want to save changes to the data in the Data Portal.
3.31 Drag the “Demo2.tdm” data file from the File Browser on the left into the Data Portal
on the right, in order to load the data from the second test run into DIAdem.
© 2003-2017 National Instruments Corporation. All rights reserved.
DIAdem Hands-On Exercises, page 72 of 104
3.32 Click the “SCRIPT” icon at the left of your screen in order to switch to the SCRIPT
panel. Click the “Enable Recording Mode” icon at the top of your screen in order to
start the VBScript Recorder session.
3.33 Select the “Absolute path” radio button and click the “OK” button. This instructs the
Script Recorder to include the full file path to any resource files loaded or saved (in this
case the REPORT layout file you saved).
© 2003-2017 National Instruments Corporation. All rights reserved.
DIAdem Hands-On Exercises, page 73 of 104
3.34 Now everything you do interactively will be automatically turned into VBScript code.
Click on the “ANALYSIS” icon at the left of your screen to return to the ANALYSIS
panel, click the “Signal Analysis” icon and select the “Digital filters” function to pop
up the digital filter configuration dialog.
3.35 Verify that all your settings are the same from the last digital filter you ran, then click
on the “OK” button to execute the digital filtering for this second data set. A new
command line will now automatically appear in the VBScript you are recording which
calculates a “FilteredSignal” channel from the “Time” and “Noise” channels with the
below parameters.
© 2003-2017 National Instruments Corporation. All rights reserved.
DIAdem Hands-On Exercises, page 74 of 104
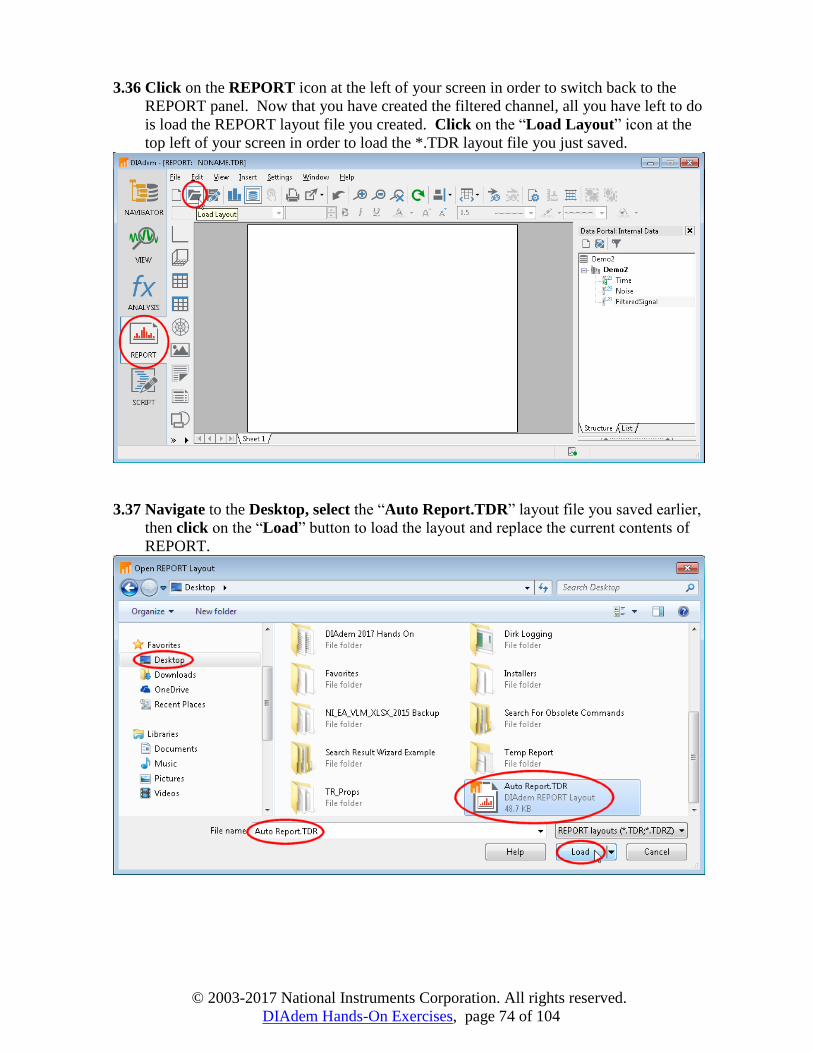
3.36 Click on the REPORT icon at the left of your screen in order to switch back to the
REPORT panel. Now that you have created the filtered channel, all you have left to do
is load the REPORT layout file you created. Click on the “Load Layout” icon at the
top left of your screen in order to load the *.TDR layout file you just saved.
3.37 Navigate to the Desktop, select the “Auto Report.TDR” layout file you saved earlier,
then click on the “Load” button to load the layout and replace the current contents of
REPORT.
© 2003-2017 National Instruments Corporation. All rights reserved.
DIAdem Hands-On Exercises, page 75 of 104
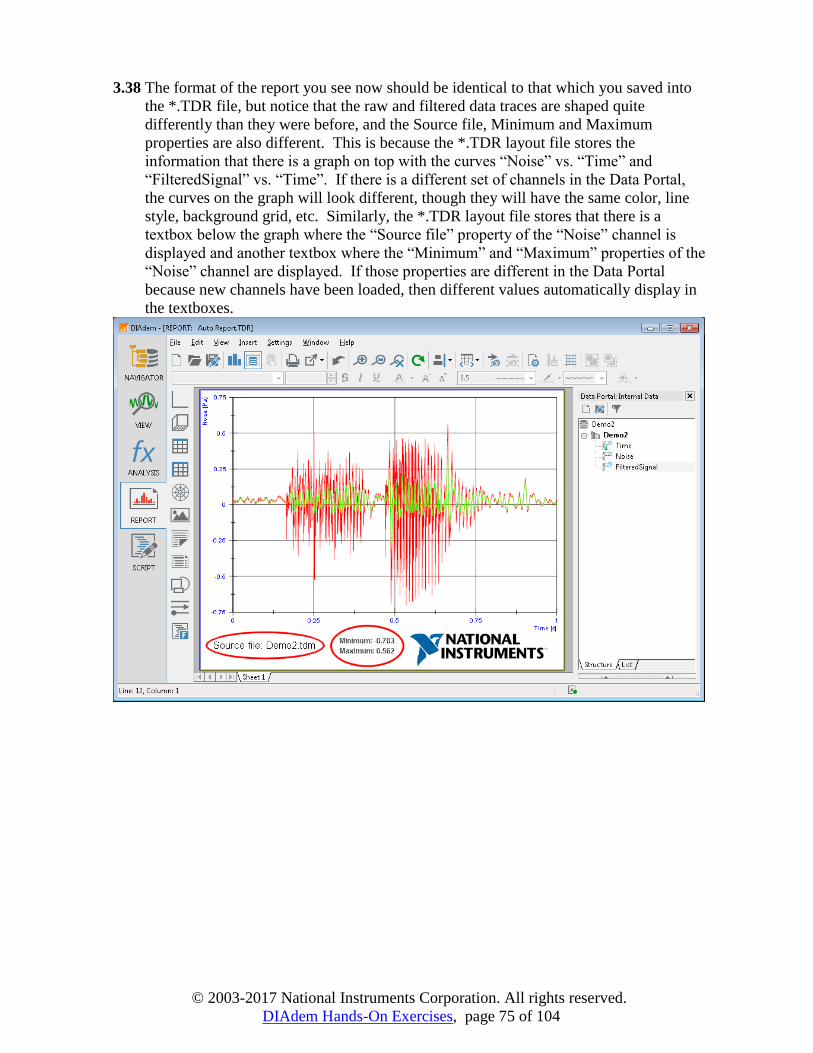
3.38 The format of the report you see now should be identical to that which you saved into
the *.TDR file, but notice that the raw and filtered data traces are shaped quite
differently than they were before, and the Source file, Minimum and Maximum
properties are also different. This is because the *.TDR layout file stores the
information that there is a graph on top with the curves “Noise” vs. “Time” and
“FilteredSignal” vs. “Time”. If there is a different set of channels in the Data Portal,
the curves on the graph will look different, though they will have the same color, line
style, background grid, etc. Similarly, the *.TDR layout file stores that there is a
textbox below the graph where the “Source file” property of the “Noise” channel is
displayed and another textbox where the “Minimum” and “Maximum” properties of the
“Noise” channel are displayed. If those properties are different in the Data Portal
because new channels have been loaded, then different values automatically display in
the textboxes.

© 2003-2017 National Instruments Corporation. All rights reserved.
DIAdem Hands-On Exercises, page 76 of 104
3.39 Now you are done recording your report script. Click on the “SCRIPT” icon at the
left of your screen in order to switch back to the SCRIPT panel, then click on the
“Disable Recording Mode” icon at the top of your screen in order to stop your
VBScript Recorder session. Notice that you now have a VBScript with 3 red/brown
DIAdem commands in it— the first line calculates the “FilteredSignal” channel, the
second line loads the *.TDR layout file, and the third line refreshes the report.
3.40 You will want to use this VBScript again, so click on the “Save File As” icon at the top
left of your screen in order to save it. Notice that during the Script Recorder session a
corresponding icon appeared in the bottom right of your screen so that you can always
tell at a glance whether the Script Recorder has been turned on— its absence means the
Script Recorder is done.
© 2003-2017 National Instruments Corporation. All rights reserved.
DIAdem Hands-On Exercises, page 77 of 104
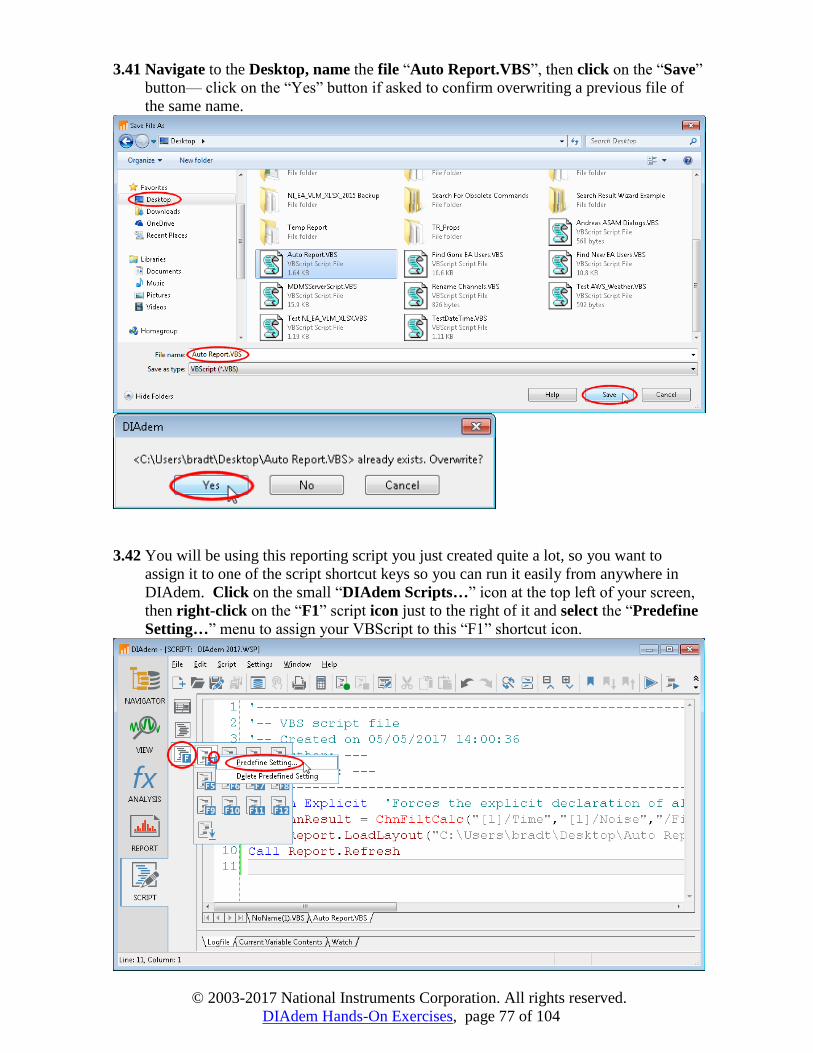
3.41 Navigate to the Desktop, name the file “Auto Report.VBS”, then click on the “Save”
button— click on the “Yes” button if asked to confirm overwriting a previous file of
the same name.
3.42 You will be using this reporting script you just created quite a lot, so you want to
assign it to one of the script shortcut keys so you can run it easily from anywhere in
DIAdem. Click on the small “DIAdem Scripts…” icon at the top left of your screen,
then right-click on the “F1” script icon just to the right of it and select the “Predefine
Setting…” menu to assign your VBScript to this “F1” shortcut icon.
© 2003-2017 National Instruments Corporation. All rights reserved.
DIAdem Hands-On Exercises, page 78 of 104
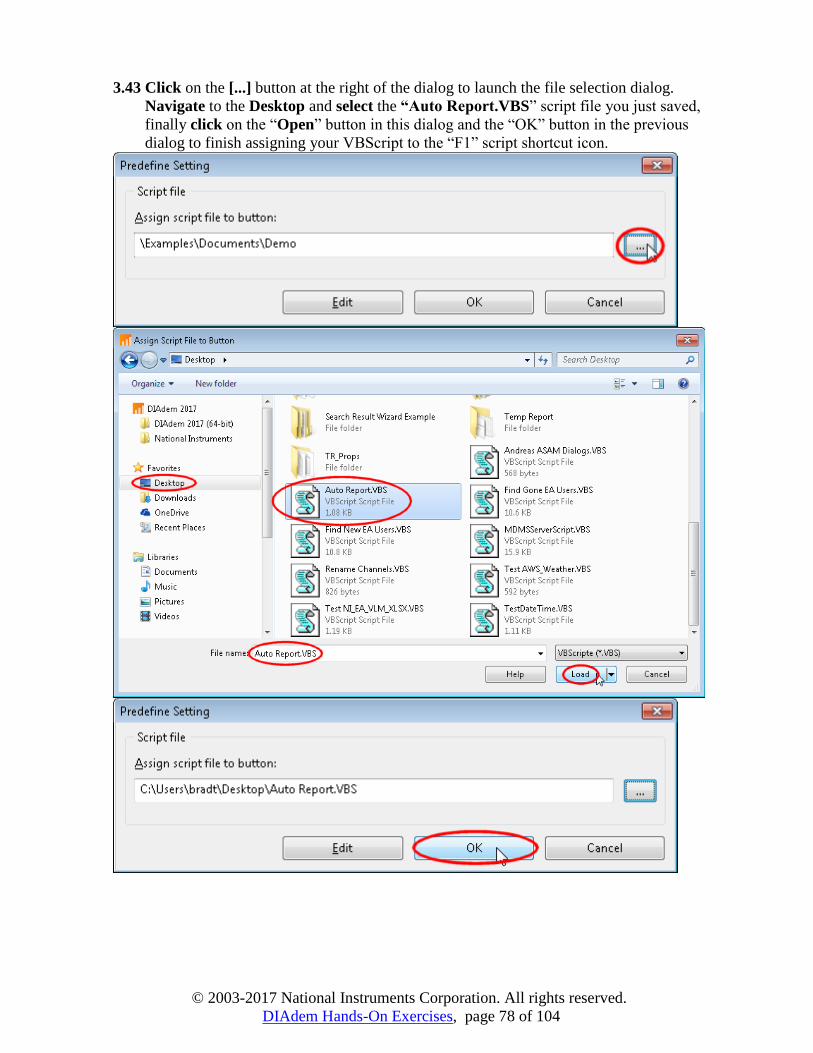
3.43 Click on the [...] button at the right of the dialog to launch the file selection dialog.
Navigate to the Desktop and select the “Auto Report.VBS” script file you just saved,
finally click on the “Open” button in this dialog and the “OK” button in the previous
dialog to finish assigning your VBScript to the “F1” script shortcut icon.

© 2003-2017 National Instruments Corporation. All rights reserved.
DIAdem Hands-On Exercises, page 79 of 104
3.44 Now you can practice using your new reporting script with the third data set. Click on
the “NAVIGATOR” icon in order to switch back to the NAVIGATOR panel, then
click on the “Delete Internal Data” icon at the top of the Data Portal to delete the
channels from the second data set. Click on the “No” button when asked if you want
to save the changes you made to the second data set. Finally, drag the “Demo3.tdm”
file into the Data Portal to load it.

© 2003-2017 National Instruments Corporation. All rights reserved.
DIAdem Hands-On Exercises, page 80 of 104
3.45 Click on the “DIAdem Scripts” icon at the left of your screen, then select the F1
“Auto Report.VBS” script icon to easily run your reporting script on this third data
set. (The keyboard sequence <Shift F1> also launches this VBScript shortcut)
3.46 Notice that the reporting script automatically calculated the “FilteredSignal” channel
and displayed the new data traces as well as the new file name and min/max values.
Try repeating the last two steps with each of the “Demo#.TDM” data files and verify
that you can quickly and easily generate this report, and that while the form of the
report is the same every time, the detailed content is different every time. You are now
ready for the new test rig roll-out and all those data files you know are coming.
© 2003-2017 National Instruments Corporation. All rights reserved.
DIAdem Hands-On Exercises, page 81 of 104
Exercise #4 ASCII DataPlugin and Interactive Analysis
Scenario: You have downloaded some ASCII weather data files from the internet, and you
need to graph the measured temperatures across multiple months and find the
lowest temperature for that period, in °F. First you need to teach DIAdem how to
automatically find and load these ASCII files, then once the data is loaded you
need to graph the temperatures from multiple data files to find the global
minimum. You will use DIAdem’s DataPlugin Wizard to interactively create a
DataPlugin that will load these weather data files. You will then graph the
temperature data in VIEW from multiple files and find the minimum temperature.
Finally, you will convert the loaded temperature data channels from °C to °F
using DIAdem’s built-in unit management features.
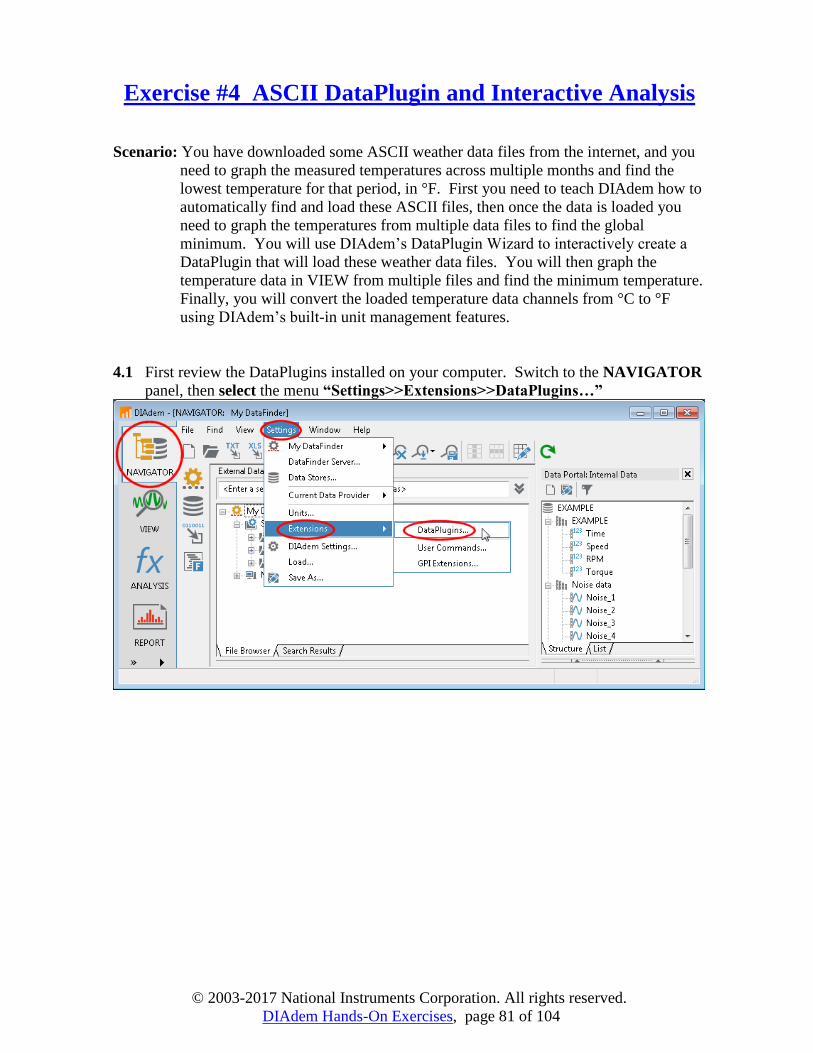
4.1 First review the DataPlugins installed on your computer. Switch to the NAVIGATOR
panel, then select the menu “Settings>>Extensions>>DataPlugins…”

© 2003-2017 National Instruments Corporation. All rights reserved.
DIAdem Hands-On Exercises, page 82 of 104
4.2 In this exercise you will be creating a DataPlugin called “Weather_ASC”. If you
already have a DataPlugin called “Weather_ASC” in your DataPlugin list, select it and
click on the red “X” icon to delete it. If you are asked to confirm deletion of the
“Weather_ASC” DataPlugin, then click the “OK” button. In any case click on the
“Close” button to exit the dialog.
4.3 The DataPlugin Wizard will create the new DataPlugin for you, then automatically use
that DataPlugin to load the data file you select. Click on the “Delete Internal Data”
icon at the top left of your screen to clear the Data Portal.
© 2003-2017 National Instruments Corporation. All rights reserved.
DIAdem Hands-On Exercises, page 83 of 104
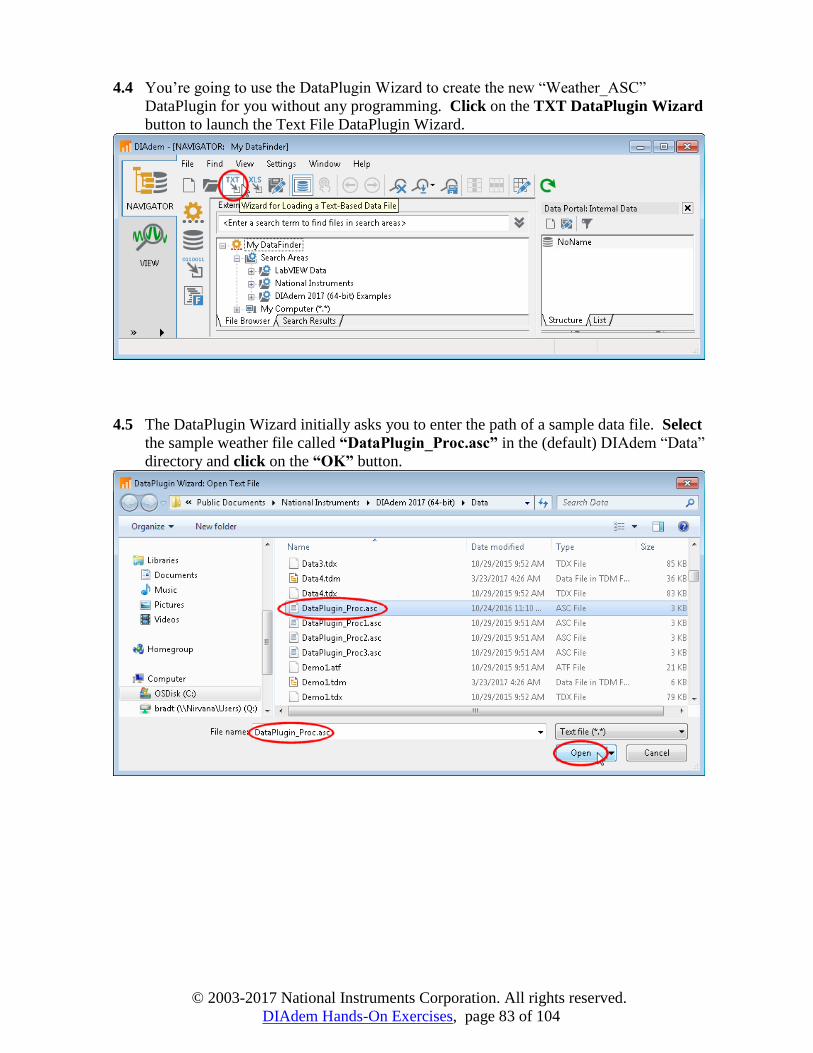
4.4 You’re going to use the DataPlugin Wizard to create the new “Weather_ASC”
DataPlugin for you without any programming. Click on the TXT DataPlugin Wizard
button to launch the Text File DataPlugin Wizard.
4.5 The DataPlugin Wizard initially asks you to enter the path of a sample data file. Select
the sample weather file called “DataPlugin_Proc.asc” in the (default) DIAdem “Data”
directory and click on the “OK” button.

© 2003-2017 National Instruments Corporation. All rights reserved.
DIAdem Hands-On Exercises, page 84 of 104
4.6 This is the 1st of 5 steps in the DataPlugin Wizard. In Step 1 you get a preview of the
sample data file you selected, and your task in this step is to designate which rows
contain group properties, channel properties or data, and which rows should be ignored
altogether. The DataPlugin Wizard has correctly determined most of the rows for you.
You will, however, need to change the “Type” column values of lines 1, 2, 7 from
“Channel” to “Group”, because these property values do not pertain to any one data
channel but rather to the file as a whole. You change each “Type” column value by
left-clicking just to the right of the “Channel” text. Once you have rows 1, 2, 7
switched over to type “Group”, click on the “Next” button to proceed to Step 2 of 5.
NOTE: Look at the “Preview” column in the above screenshot. These data files have
standard (SI) scientific channel units (°C, mm) and a European date format which starts with
the day of the month and uses a decimal between the elements (DD.MM.YYYY). You will
need to remember this date/time format for “DataPlugin Wizard Step 4 of 5”.
© 2003-2017 National Instruments Corporation. All rights reserved.
DIAdem Hands-On Exercises, page 85 of 104
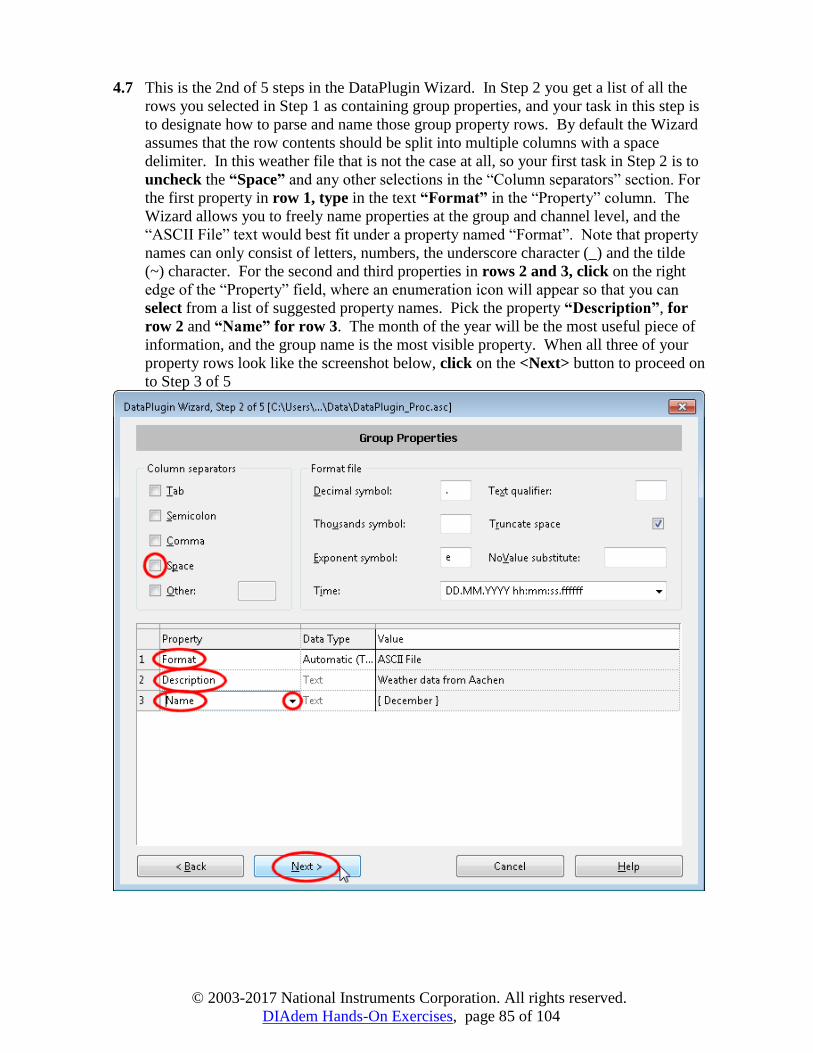
4.7 This is the 2nd of 5 steps in the DataPlugin Wizard. In Step 2 you get a list of all the
rows you selected in Step 1 as containing group properties, and your task in this step is
to designate how to parse and name those group property rows. By default the Wizard
assumes that the row contents should be split into multiple columns with a space
delimiter. In this weather file that is not the case at all, so your first task in Step 2 is to
uncheck the “Space” and any other selections in the “Column separators” section. For
the first property in row 1, type in the text “Format” in the “Property” column. The
Wizard allows you to freely name properties at the group and channel level, and the
“ASCII File” text would best fit under a property named “Format”. Note that property
names can only consist of letters, numbers, the underscore character (_) and the tilde
(~) character. For the second and third properties in rows 2 and 3, click on the right
edge of the “Property” field, where an enumeration icon will appear so that you can
select from a list of suggested property names. Pick the property “Description”, for
row 2 and “Name” for row 3. The month of the year will be the most useful piece of
information, and the group name is the most visible property. When all three of your
property rows look like the screenshot below, click on the <Next> button to proceed on
to Step 3 of 5

© 2003-2017 National Instruments Corporation. All rights reserved.
DIAdem Hands-On Exercises, page 86 of 104
4.8 This is the 3rd of 5 steps in the DataPlugin Wizard. In Step 3 you get a list of all the
rows you selected in Step 1 as containing channel properties, and your task in this step
is to designate how to parse and name those channel property rows. In the previous
step you turned off all column delimiters— which was correct for the group properties,
but these channel properties are separated by semicolons. Check the “Semicolon”
checkbox in the “Column separators” section and uncheck any others in order to use
only semicolon column delimiters for these channel properties. Now that the correct
column delimiters are being used, you see each channel’s property values displayed in
a column with that channel number as the column heading. You selected 2 channel
property rows in Step 1, and the Wizard has correctly guessed the first property as the
“Name” property of each channel, but the second property should be the unit, not the
description. For this second property in row 2, click on the right edge of the
“Property” field, where an enumeration icon will appear so that you can select from a
list of suggested property names. Pick the property “Unit”, then click on the <Next>
button to progress on to Step 4 of 5.
© 2003-2017 National Instruments Corporation. All rights reserved.
DIAdem Hands-On Exercises, page 87 of 104
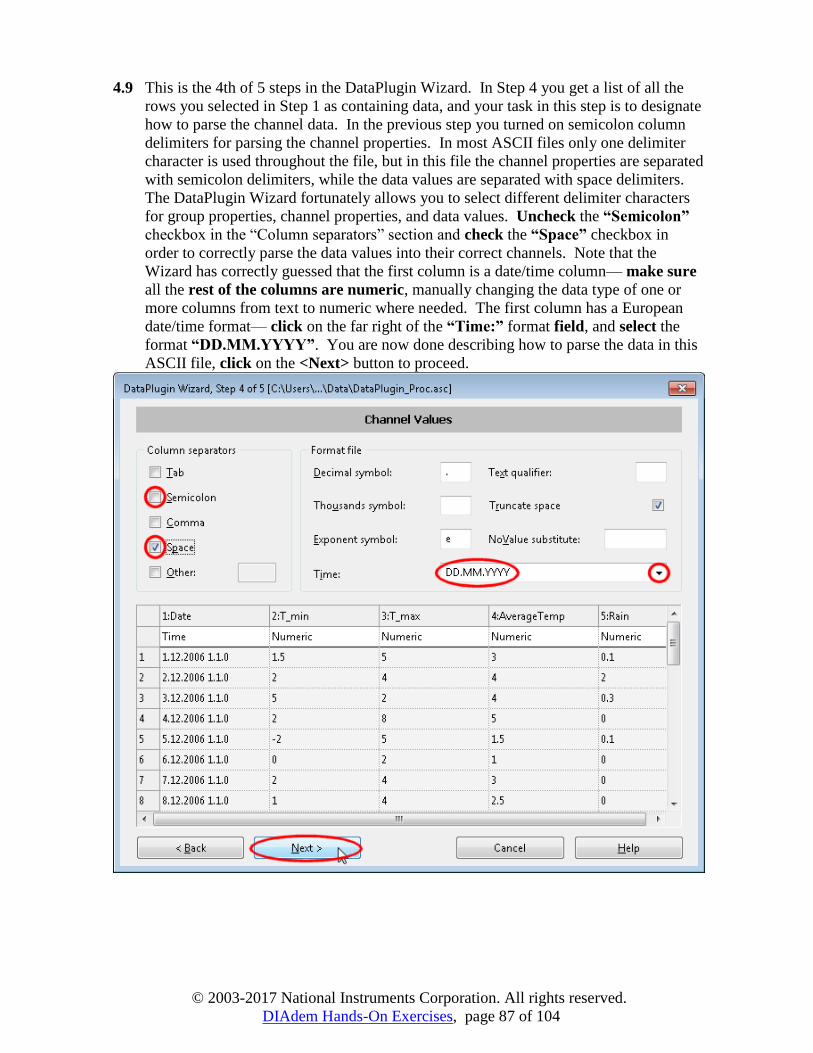
4.9 This is the 4th of 5 steps in the DataPlugin Wizard. In Step 4 you get a list of all the
rows you selected in Step 1 as containing data, and your task in this step is to designate
how to parse the channel data. In the previous step you turned on semicolon column
delimiters for parsing the channel properties. In most ASCII files only one delimiter
character is used throughout the file, but in this file the channel properties are separated
with semicolon delimiters, while the data values are separated with space delimiters.
The DataPlugin Wizard fortunately allows you to select different delimiter characters
for group properties, channel properties, and data values. Uncheck the “Semicolon”
checkbox in the “Column separators” section and check the “Space” checkbox in
order to correctly parse the data values into their correct channels. Note that the
Wizard has correctly guessed that the first column is a date/time column— make sure
all the rest of the columns are numeric, manually changing the data type of one or
more columns from text to numeric where needed. The first column has a European
date/time format— click on the far right of the “Time:” format field, and select the
format “DD.MM.YYYY”. You are now done describing how to parse the data in this
ASCII file, click on the <Next> button to proceed.

© 2003-2017 National Instruments Corporation. All rights reserved.
DIAdem Hands-On Exercises, page 88 of 104
4.10 This is the 5th of 5 steps in the DataPlugin Wizard. In Step 5 you specify the name of
the new DataPlugin you have been defining as well as one or more file extensions
DIAdem should automatically associate it with. The Wizard has already guessed that
you want to use the “*.asc” file extension of the sample weather data file you selected.
Change the DataPlugin Name to “Weather_ASC”. Hereafter, any time you drag and
drop a file with an “*.asc” file extension from the NAVIGATOR tree view into the
Data Portal, DIAdem will automatically use this new “Weather_ASC” DataPlugin to
load the data from that file. Additionally, any time you add a file with an “*.asc” file
extension to a Search Area, DIAdem will also use the “Weather_ASC” DataPlugin to
index that data file into the DataFinder data base. Now click on the <Finish> button to
complete the creation of the new “Weather_ASC” DataPlugin and the loading of your
sample data file with it.

© 2003-2017 National Instruments Corporation. All rights reserved.
DIAdem Hands-On Exercises, page 89 of 104
4.11 Now that the “Weather_ASC” DataPlugin has been automatically created and
registered for you, DIAdem goes ahead and uses this new DataPlugin to load the
sample ASCII file you used into the Data Portal. Click on the newly loaded group
“{ December }” in order to select it in the Data Portal at the right of your screen. Now
look at the property table at the bottom right of your screen, where you will see exactly
the group properties you defined in Step 2 of 5 in the DataPlugin Wizard: “Name”,
“Description”, and “Format”. Navigate in the tree view to “My
DataFinder>>Search Areas>>National Instruments>>DIAdem 2017>>Data”. Notice that the 4 data files starting with the file name “DataPlugin_Proc…” now appear
in the NAVIGATOR tree view under the “Data” directory. Before they did not appear
because there was no DataPlugin for data files with the file extension “*.asc”. If you
don’t see these “DataPlugin_Proc…” files yet, click on the “Refresh” icon at the top
of your screen to refresh the NAVIGATOR panel and cause them to appear with a “+”
icon in front of them like the other standard DIAdem data files.
NOTE: When a data file has been successfully indexed by a DataPlugin created with the
ASCII DataPlugin Wizard, it will by default show a “piece of paper” icon in the
NAVIGATOR tree view. The “hourglass” icons you see above denote that the files are
slated for indexing but are not officially indexed yet.

© 2003-2017 National Instruments Corporation. All rights reserved.
DIAdem Hands-On Exercises, page 90 of 104
4.12 Now DIAdem has recognized the “*.asc” files as data files for which there is a
DataPlugin, but it has not yet indexed them— that is why you see the hourglass icon in
front of the 4 “DataPlugin_Proc…” files. Click on the “+” icon to the left of each of
these 4 files, one after the other, to open each up to the group level— this forces only
those 4 files to be re-indexed.

© 2003-2017 National Instruments Corporation. All rights reserved.
DIAdem Hands-On Exercises, page 91 of 104
4.13 Now you can see the advantage of mapping the “{ Month }” text in each of these
weather files to the group name property— it is now very easy to pick the month of
data you want to load interactively from the NAVIGATOR tree view. You specifically
wanted to look at the data for December and January on the same graph, since they are
typically two of the coldest months of the year and probably contain the coldest day of
the winter. Drag the “{ January }” group from the tree view on the left into the Data
Portal on the right in order to load the January data also.

© 2003-2017 National Instruments Corporation. All rights reserved.
DIAdem Hands-On Exercises, page 92 of 104
4.14 Now you have both the December and January data loaded into the Data Portal. In
order to actually look at the data values, click on the big VIEW icon at the top left of
your screen in order to switch to the VIEW panel in DIAdem. Your DIAdem VIEW
may look different than the picture below, depending on what previous work you’ve
already done. You want to create a custom VIEW layout to display this data, so start
off by deleting the VIEW areas previously configured. Click on the “New Layout”
icon at the top left of your screen in order to clear the VIEW panel and start with a
blank layout. If a confirmation dialog pops up, click on the “No” button to avoid
saving the old layout.
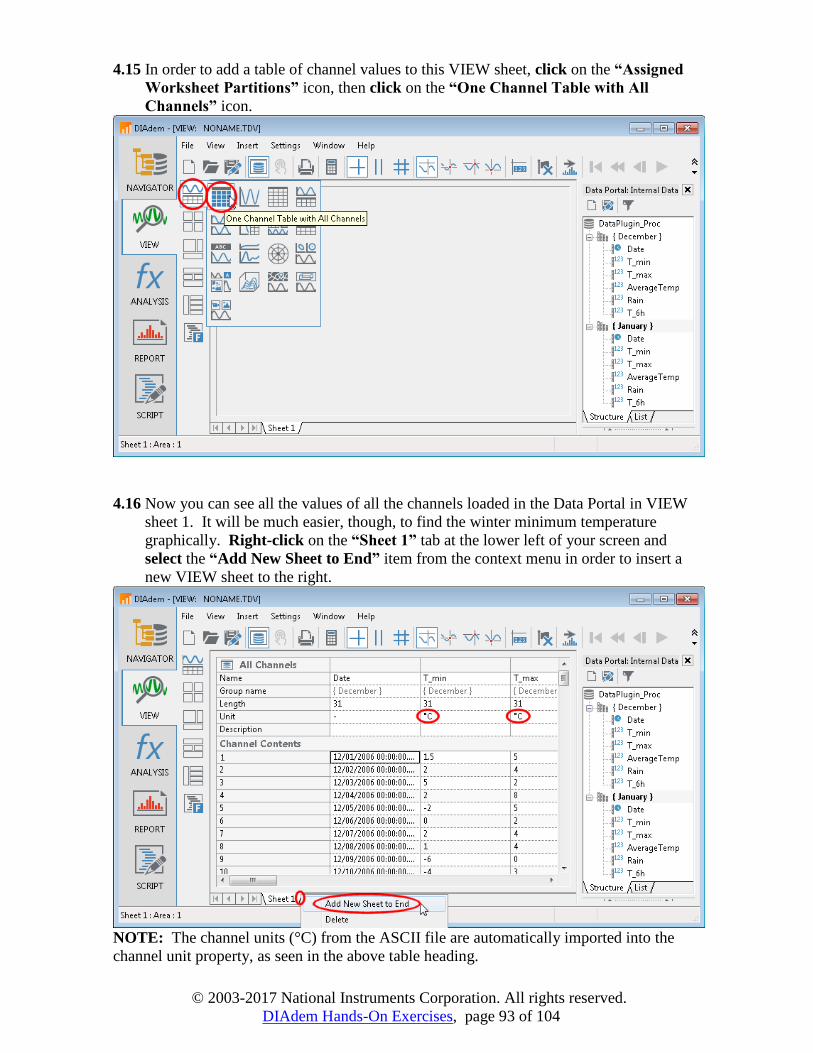
© 2003-2017 National Instruments Corporation. All rights reserved.
DIAdem Hands-On Exercises, page 93 of 104
4.15 In order to add a table of channel values to this VIEW sheet, click on the “Assigned
Worksheet Partitions” icon, then click on the “One Channel Table with All
Channels” icon.
4.16 Now you can see all the values of all the channels loaded in the Data Portal in VIEW
sheet 1. It will be much easier, though, to find the winter minimum temperature
graphically. Right-click on the “Sheet 1” tab at the lower left of your screen and
select the “Add New Sheet to End” item from the context menu in order to insert a
new VIEW sheet to the right.
NOTE: The channel units (°C) from the ASCII file are automatically imported into the
channel unit property, as seen in the above table heading.

© 2003-2017 National Instruments Corporation. All rights reserved.
DIAdem Hands-On Exercises, page 94 of 104
4.17 Click on the “Regular Worksheet Partitions” icon, then click on the “Two Areas”
icon in order to automatically divide this sheet into 2 equal, vertically stacked areas,
one for December and one for January.
4.18 Drag the “{ December }” group from the Data Portal on the right into the top VIEW
area, then select “2D Axis System” from the automatic pop-up menu, so that the
December channels are displayed in a graph instead of in a value table like in Sheet 1.
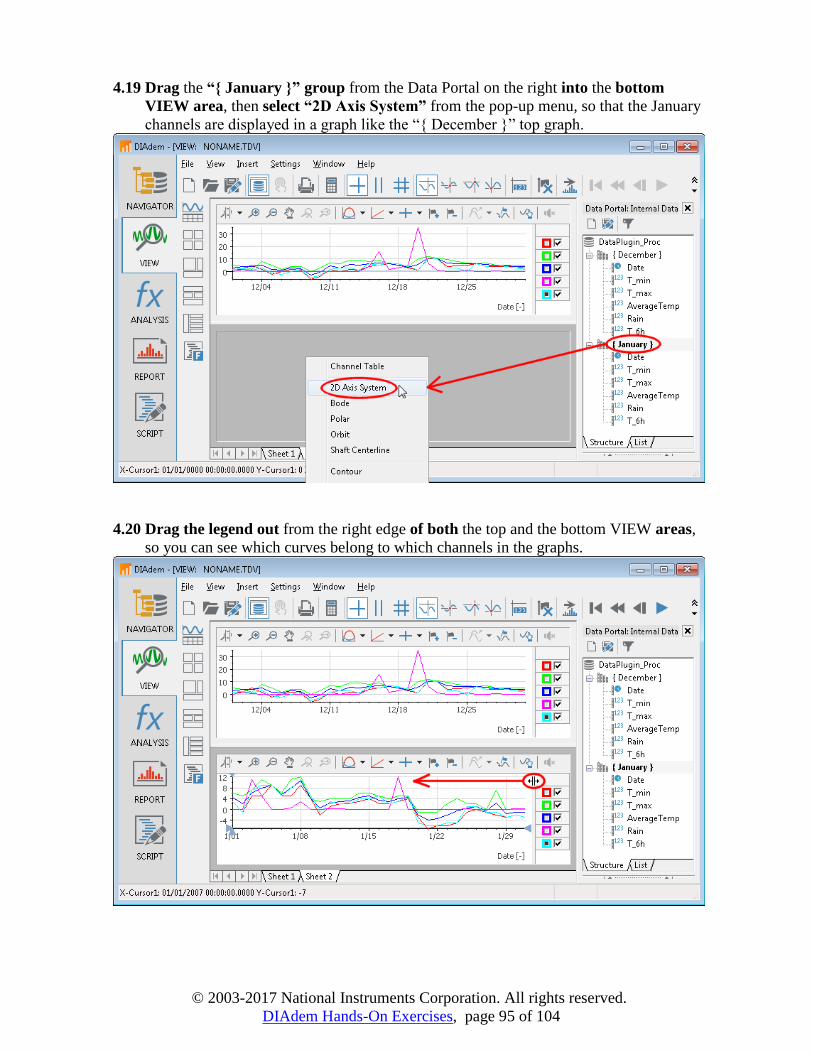
© 2003-2017 National Instruments Corporation. All rights reserved.
DIAdem Hands-On Exercises, page 95 of 104
4.19 Drag the “{ January }” group from the Data Portal on the right into the bottom
VIEW area, then select “2D Axis System” from the pop-up menu, so that the January
channels are displayed in a graph like the “{ December }” top graph.
4.20 Drag the legend out from the right edge of both the top and the bottom VIEW areas,
so you can see which curves belong to which channels in the graphs.

© 2003-2017 National Instruments Corporation. All rights reserved.
DIAdem Hands-On Exercises, page 96 of 104
4.21 You confirm from the graph of all the data what you expected from the names of the
channels— that the minimum temperature will indeed by contained in the red “T_min”
curves. Double-click just to the right of the “Sheet 2” tab to add a new VIEW sheet in
which to graph the “T_min” curves side by side.
4.22 Select the “Date” channel, hold down the <Shift> key, then select the “T_min”
channel from the “{ December }” group and drag them together into the new VIEW
area— again select “2D Axis System”, this time to graph these 2 channels as a single
XY curve.

© 2003-2017 National Instruments Corporation. All rights reserved.
DIAdem Hands-On Exercises, page 97 of 104
4.23 Select both the “Date” channel and the “T_min” channel again, this time from the
“{ January }” group, and drag them together into the new VIEW area.
4.24 Now you see the minimum daily temperature plotted for both December and January.
The minimum temperature during this whole period was -7 °C on January 21. But
before you go back to your boss with this answer, you decide you’d better check the
February and March data just to make sure. Click on the NAVIGATOR icon at the
top left of your screen in order to switch to the NAVIGATOR panel.

© 2003-2017 National Instruments Corporation. All rights reserved.
DIAdem Hands-On Exercises, page 98 of 104
4.25 Select the “{ February }” data group, hold down the <Ctrl> key, select the final
“{ March }” data group, then drag them both into the Data Portal alongside the data
you already have from December and January.
4.26 Now you have data from the coldest 4 months of the year in the Data Portal. Click on
the big VIEW icon at the left of your screen in order to switch back to the VIEW panel
to graph the new data.

© 2003-2017 National Instruments Corporation. All rights reserved.
DIAdem Hands-On Exercises, page 99 of 104
4.27 Select both the “Date” channel and the “T_min” channel from the “{ February }”
group (holding down the <Shift> key) and drag them together into the graph.
4.28 Select both the “Date” channel and the “T_min” channel from the “{ March }”
group (holding down the <Shift> key) and drag them together into the graph.

© 2003-2017 National Instruments Corporation. All rights reserved.
DIAdem Hands-On Exercises, page 100 of 104
4.29 Here you have your conclusive answer. December had the closest other cold day at -6
°C, but it turns out that the low of -7 °C on January 21 is definitely the coldest day of
that winter. But for the audience you’re reporting this result to, you need to convert the
temperature channels measured in °C to temperature measured in °F. The easiest way
to select the temperature channels is to filter the Data Portal display. If you don’t
already see the group and channel filter fields in the Data Portal, click on the “funnel”
icon at the top of the Data Portal called “Filter” to show them.
4.30 Type the text “T_m” into the channel filter field in the Data Portal underneath the
group filter field. Notice how as you type the displayed channels become successively
fewer as the filter text gets longer. The channels you no longer see are still loaded in
the Data Portal, they’re just temporarily hidden by your channel filter.
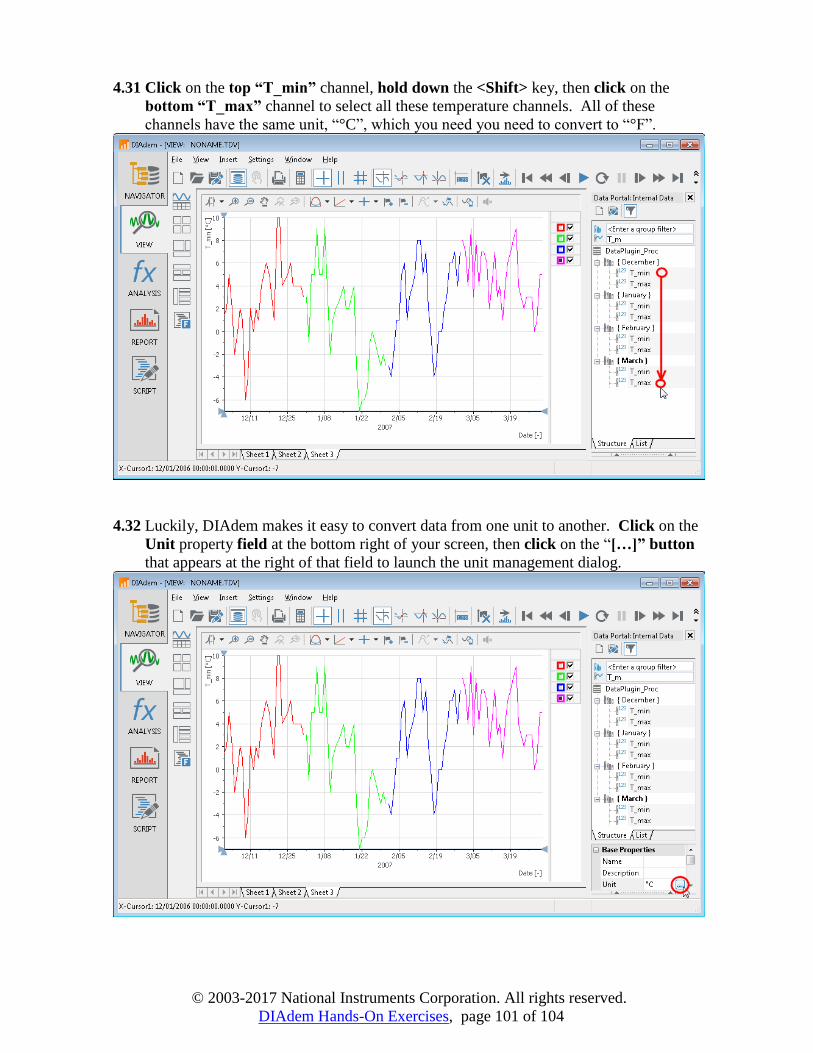
© 2003-2017 National Instruments Corporation. All rights reserved.
DIAdem Hands-On Exercises, page 101 of 104
4.31 Click on the top “T_min” channel, hold down the <Shift> key, then click on the
bottom “T_max” channel to select all these temperature channels. All of these
channels have the same unit, “°C”, which you need you need to convert to “°F”.
4.32 Luckily, DIAdem makes it easy to convert data from one unit to another. Click on the
Unit property field at the bottom right of your screen, then click on the “[…]” button
that appears at the right of that field to launch the unit management dialog.

© 2003-2017 National Instruments Corporation. All rights reserved.
DIAdem Hands-On Exercises, page 102 of 104
4.33 Select the “[°F ] degree Fahrenheit” unit and click on the “Convert” button to
change the unit string AND convert the channel values for all the selected channels in
the Data Portal. (You MUST click on the “Convert” button or you will not convert the
channel values)
4.34 Note that the unit property in the Data Portal now reads “°F” and the values graphed on
the Y axis range from 20 to 50. So both the unit string and the channel values have
been converted from “°C” to “°F”.

© 2003-2017 National Instruments Corporation. All rights reserved.
DIAdem Hands-On Exercises, page 103 of 104
4.35 Finally, Select the “T_min” channel in the second “{ January }” group you loaded.
Now look in the Data Portal property table at the bottom right of your screen and see
that the lowest temperature recorded that winter was 19.4 °F, just as it appears in the
VIEW graph at the left of your screen.
4.36 When you create your own DataPlugin, like you did in this exercise with the ASCII
DataPlugin Wizard, you gain much more than the ability to load data files of that type
into DIAdem. You gain all the indexing and querying abilities you saw in the previous
four exercises, now applicable to this ASCII file format. You also gain all the custom
loading options that DIAdem offers, such as selective channel loading, loading with
data reduction, and loading with appending. We’ll briefly show this last feature
working with your new DataPlugin. Click the “Filter” and “Delete Internal Data”
icons at the top of the Data Portal in order to start with a clean slate. (Answer “No”
when prompted to save the changes you made in the Data Portal)

© 2003-2017 National Instruments Corporation. All rights reserved.
DIAdem Hands-On Exercises, page 104 of 104
4.37 Click on the NAVIGATOR icon at the left of your screen in order to switch back to
the NAVIGATOR panel. Make sure the Data Portal is empty (required!), then select
the 4 “DataPlugin_Proc…” files in the tree view, right-click and choose the menu
“Append Data”. This will load these 4 segmented files stitched together in the Data
Portal as if the data had been saved to 1 big data file instead of 4 smaller ones.
4.38 Click on the VIEW icon at the left of your screen in order to switch back to the VIEW
panel. Notice that indeed all 4 ASCII files have now been loaded into 1 group in the
Data Portal with channels that are 4 times longer than they were for any given month.
The existing red curve, which still points to the first group in the Data Portal, now
shows all the data from all 4 months. You can use your new DataPlugin to easily
concatenate multiple ASCII data files and view their data combined.
Note: The name of the 1 resulting group in the Data Portal is that of the first data file
selected for append loading (in this case the December file). The channels in the group
really do contain all the data from all 4 files, there’s just no place to put the group names
(and other properties) for the remaining 3 files that were append loaded.