handout 2: introduction to surveys and sampling techniques...
TRANSCRIPT

Handout 2: Introduction to Surveys and Sampling Techniques STAT 335 – Fall 2016
1
The previous handout provided an overview of study designs. The two broad classifications
discussed were randomized experiments and observational studies. In this handout, we will
briefly introduce a specific type of observational study: a survey. Specific issues regarding
survey design will be discussed in future handouts. Here, we will discuss various sampling
techniques that can be used to select potential respondents to a survey.
INTRODUCTION TO SURVEYS
These days, surveys are used everywhere and for many reasons. For example, surveys are
commonly used to track the following:
Issues of Concern to the Government (http://www.census.gov/programs-surveys.html)
Business/Industry
Opinions (http://www.gallup.com)
Surveys (and observational studies, in general) can be broadly classified into two types:
Broad Classifications of Survey/Observational Studies
Descriptive – The objective of a descriptive survey study is simply to obtain certain
information about a population of interest.
Analytical – The objective of an analytical survey study is to make comparisons between
different subgroups of a population.
Note that many surveys will provide data that can serve both of the above purposes.
SOME TERMINOLOGY
Terminology Used in Survey Studies
Target Population – Ask yourself the following question: to whom do you want to generalize
the results? This group is the target population. Ideally, this is the group from which you’d
like to sample.
Study Population - Sometimes, the target population is hard to access, and only some of the
target population will be available for the study. This (typically nonrandom) subset of the
target population is known as the study population (or the accessible population).
Sampling Frame - The sampling frame is a list of all elements (called sampling units) of the
study population that will be used for sampling. Sometimes this is people, sometimes it is
households, etc. This is needed so that every sampling unit in the population is identified so
they will have an equal opportunity for selection.

Handout 2: Introduction to Surveys and Sampling Techniques STAT 335 – Fall 2016
2
Terminology Used in Survey Studies
Sample – The sample consists of the elements from the study population that are actually
selected to participate in the study. When a survey study involves people, these elements are
typically referred to as subjects or participants. Finally, note that not necessarily all of the
subjects selected for a sample will choose to participate in the study!
All of these terms are summarized in the following figure.
The following examples provide some context to this terminology.
Target
Population Study Population Sampling Frame
Example 1:
All
institutionalized
elderly persons
with Alzheimer’s
All institutionalized
elderly persons with
Alzheimer’s in Winona
county nursing homes
A list of all institutionalized
elderly persons with
Alzheimer’s in Winona
county nursing homes
Example 2:
School-age
children with
asthma
School-age children with
asthma treated in pediatric
asthma clinics in
university-affiliated
medical centers in the
Midwest
A list of all school-age
children with asthma
treated in pediatric asthma
clinics in university-
affiliated medical centers in
the Midwest
Example 3:
All American
adults (age 18 or
older)
All American adults age 18
or older who have a
telephone
A list of traditional land-
line and cell phone numbers
of American adults

Handout 2: Introduction to Surveys and Sampling Techniques STAT 335 – Fall 2016
3
STEPS INVOLVED IN PLANNING A SURVEY
In his book Sampling Techniques, William G. Cochran outlines the many steps that are involved
in planning a survey.
Define the objectives of the survey study
Define the target population and the study population (hopefully they coincide)
Determine what data must be collected to address the objectives of the survey study
(e.g., are any questions unnecessary? Are all questions that need to be asked included?)
Decide on a sample size
Decide on the method of measurement (e.g., will the survey be self-administered,
interview, mail, telephone, etc.?)
Create the sampling frame
Select the sample
Do a “pre-test” with the survey
Organize the field work
Collect and summarize/analyze the results
Note lessons learned for the future
In future handouts, we will discuss in detail many aspects of designing a survey. For now,
however, we fill focus primarily on the sampling process.
SAMPLING METHODS
Our overall objective when sampling is as follows:
The goal is to obtain a good sample so that we can draw sound conclusions about the
population. It is essential that our sample be representative of the population!
Example: The Literary Digest and Presidential Elections
“The Literary Digest conducted polls regarding the presidential elections in 1920, 1924, 1928,
and 1932, making correct predictions of the winner for each. In the 1936 election they decided
to conduct their most ambitious poll and collected responses from over two million people.
Using this information they predicted that Alf Landon would win the 1936 presidential
election over Franklin Roosevelt. Franklin Roosevelt, however, ended up winning the
presidency with 61 percent of the votes. The Literary Digest was left wondering what went
wrong. There was also a gentleman named George Gallup who also conducted a poll and
correctly predicted that Roosevelt would win the presidency. You might wonder what
George Gallup did to end up with a correct prediction while the Literary Digest seemed to
bobble after years of correct predictions. It turns out the difference in the polls conducted
was the manner in which the samples were chosen. The Literary Digest used telephone
directories and lists of automobile owners to select their participants who consisted mostly of

Handout 2: Introduction to Surveys and Sampling Techniques STAT 335 – Fall 2016
4
Example: The Literary Digest and Presidential Elections
wealthy individuals, whereas Gallup tried to get a sample which represented characteristics
of the population. Most of the lower class individuals voted in favor of Roosevelt because he
was proposing the New Deal recovery program, which was very desirable since the country
was just coming out of the worst economic recession they had seen at the time.“
Source: Babbie, Earl. The Basics of Social Research, 5th Edition. 2011. Wadsworth, p. 204 – 205.
The key to making a correct prediction in the 1936 presidential election was the ability to get a
representative sample of the population of interest. Sampling theory makes the process of
obtaining a representative sample and then estimating parameters of interest extremely
efficient. Methods of sample selection and estimation have been developed to provide the most
precise estimates at the lowest cost. Next, we will discuss some of these sampling techniques.
Two types of sampling exist, in general.
Broad Classifications of Sampling
Probability Sampling – This uses some form of random selection, and each unit is drawn
from the population with a known, non-zero probability.
Nonprobability Sampling – This does not involve random selection, and the probability of
selecting each unit from the population is either unknown or, in some cases, zero.
Next, we will discuss commonly used probability sampling methods. In general, we’ll use the
following notation:
N = the number of units in the sampling frame
n = the number of units in the sample
Probability Sampling Methods
The simplest and most common probability sample is known as a simple random sample (SRS).
Simple Random Sampling
When obtaining a simple random sample, researchers select n units from N objects such that
each possible sample of size n has an equal chance of being selected.

Handout 2: Introduction to Surveys and Sampling Techniques STAT 335 – Fall 2016
5
Questions:
1. One example of simple random sampling is as follows. Suppose researchers intend to
survey 100 employees out of a business with 1,000 employees. How could this be
accomplished?
2. Suppose a professor takes the first 10 students on the class list (which is organized
alphabetically) and surveys them to find out their opinions of the course so far. Is this a
simple random sample?
3. What if the professor uses the class list but this time randomly chooses a letter from the
English alphabet and selects for the sample those students whose last name begins with
that letter?
4. Suppose that instead of using the class list, the professor picks a digit at random and
selects for the sample those students with phone numbers ending in that digit. Is this a
simple random sample?
In general, simple random sampling is simple to accomplish and easy to explain. It is a fair
sampling method, and it’s reasonable to assume the sample is representative of the population
(and therefore we can generalize the results from the sample back to the population). This
method, however, is not the most efficient method of sampling. Also, by luck of the draw in
some cases, we may not get a good representation of the subgroups in the population. To deal
with these issues, alternative sampling methods are often used.
The next method ensures that we get a good representation of the subgroups in the population.
Stratified Random Sampling
A stratified random sample is obtained by first dividing the population into homogeneous
subgroups (called strata) and then taking a simple random sample from each subgroup.
Variables often used to create strata include age, gender, ethnicity, socioeconomic status,
diagnosis, geographic region, etc.

Handout 2: Introduction to Surveys and Sampling Techniques STAT 335 – Fall 2016
6
There are two approaches to obtaining stratified random samples: proportionate and
disproportionate.
Two Approaches for Stratified Random Sampling
To obtain a proportionate stratified random sample, the subgroup sample sizes are set equal
to the proportions of the subgroup within the study population.
For example, Winona State University consists of about 40% males and 60% females. If we
were to survey 100 WSU students and felt that they might answer questions differently based
on their sex, we might want to randomly select and survey 40 males and 60 females.
To obtain a disproportionate stratified random sample, the subgroup sample sizes would not
be set equal to the proportions of the subgroup in the study population.
For example, in some studies, researchers may want to oversample minority groups so that
they can ensure enough minority subjects are obtained to draw conclusions about those
subgroups. Note that when obtaining overall estimates regarding the population, the
researchers would adjust the estimates based on the fact that some groups were oversampled.
This type of complex analysis is beyond the scope of this course, but it’s important to
recognize that it is used by statisticians with expertise in surveys and sampling.
The stratified random sampling procedure comes with the following advantages and
disadvantages.
Advantages of Stratified Random Samples
They ensure that the sample is representative of the population in terms of the
stratification variable. Essentially, they “protect” us from the unlikely but still possible
scenario of obtaining a biased sample through simple random sampling.
They generally lead to more precision on estimates than do simple random samples, as
long as the groups are homogeneous. How much the stratification helps depends on the
relationship between the variable(s) used to create strata and the outcomes of interest in
the study. The stronger this relationship, the more we gain from using a stratified
sampling method.
They allow us to obtain estimates with a certain precision for specific subgroups of the
population.
Disadvantages of Stratified Random Samples
They are more complex and require slightly more effort than simple random samples
The strata must be carefully defined

Handout 2: Introduction to Surveys and Sampling Techniques STAT 335 – Fall 2016
7
Example: Stratified Random Sample of Nurse/Midwives
Questions:
1. What stratification variable was used?
2. Why would the researchers choose to use this variable?
Questions: What stratification variable(s) might be used for the following situations?
1. Researchers want to conduct a poll to estimate the percentage of registered voters in MN
that will vote for the democratic presidential candidate in the upcoming election.
2. Researchers want to estimate the amount of money students spend on textbooks in a
given semester. They plan to conduct an email survey.

Handout 2: Introduction to Surveys and Sampling Techniques STAT 335 – Fall 2016
8
The next sampling method we’ll discuss is another example of a probability sampling method.
Systematic Random Sampling
A systematic random sample is obtained by first numbering the units in the sampling frame
from 1 to N. Once the researcher has decided on the n that is needed, they calculate k = N / n.
Finally, they randomly select an integer from 1 to k and then select every kth observation from
that point on.
Note that if the units in the sampling frame are randomly ordered, this is essentially the same as
simple random sampling. In this case, we could safely assume the sample is representative of
the population. The main advantage of systematic random sampling is that it can be quickly
and easily implemented; the main disadvantage is that the method might lead to bias if there
are hidden periodicities in the sampling frame.
The final basic probability sampling method is discussed below.
Cluster Random Sampling
A cluster random sample is obtained by first dividing the study population into clusters
(typically geographically). Once clusters have been formed, a simple random sample of
clusters is taken. All units within the sampled clusters then form the sample.
Main Advantage of Cluster Random Samples
They make the sampling process much more efficient, especially when the population is
dispersed across a wide geographic region.
Disadvantages of Cluster Random Samples
They are the least representative of the population out of all of the types of probability
samples discussed so far. Units within a cluster may have similar characteristics, which
could lead to an over- or under-representation of certain characteristics in the sample.
They are typically associated with high sampling errors.
They lead to a violation of the assumption of independence, so the analysis of data
collected from cluster sampling methods is slightly more complex.
Now that we have discussed the four basic types of probability sampling, consider one last
probability sampling approach: multi-stage random sampling.

Handout 2: Introduction to Surveys and Sampling Techniques STAT 335 – Fall 2016
9
Multi-Stage Random Sampling
The four previously discussed probability sampling methods are the simplest random
sampling strategies. In most real, applied research, the sampling methods used are more
complex. The previously discussed methods can be combined in a variety of ways to create
what the researchers feel is the most efficient and effective sampling method. When
sampling methods are combined, this is called multi-stage sampling.
Example: Multi-Stage Sample of U.S. Physicians Counseling Adolescents About Smoking

Handout 2: Introduction to Surveys and Sampling Techniques STAT 335 – Fall 2016
10
Main Advantage of Probability Sampling Methods, Overall
Probability sampling methods allow us to estimate sampling errors.
Definition
A sampling error is the discrepancy between the sample statistic and the population
parameter of interest that is due to random fluctuations in the data that occur when the
sample is selected.
When a probability sampling method is used, we can obtain an estimate of the sampling error
which represents the magnitude of the uncertainty regarding the obtained parameter estimate.
In general, for simple random samples, the sampling error is computed as follows (note that
this was probably called the standard error in your introductory statistics course):
n
Variance Sample Error Sampling
Once this has been calculated, it can be used to construct a confidence interval. Once again, this
standard formula for calculating the sampling error is based on the assumption that the sample
was drawn using simple random sampling. When another probability sampling method has
been used, the sampling error may actually be slightly higher (or lower) than indicated by the
standard formula. For example, the sampling error for cluster sampling will be higher than the
sampling error for simple random sampling. For stratified designs, on the other hand, the
sampling error will be lower. The overall message is this: care should be taken to use the
correct standard errors in an analysis. Once again, these analyses are beyond the scope of this
course; however, you should recognize the importance of their use by professional statisticians.
Nonprobability Sampling Methods
As mentioned previously, nonprobability sampling methods do not involve any element of
randomness. With these types of sampling procedures, some elements in the population have a
zero probability of being selected or an unknown probability of being selected. This doesn’t
automatically imply that the samples obtained aren’t representative of the population, but it is
much more difficult to justify that they are than it is for probability samples. The bigger issue is
this: traditional probability theory does not apply to these samples, and so the sampling error
can’t be estimated. Therefore, no valid confidence intervals can be obtained, either! Probability
sampling methods give us much more confidence that we have represented the population
well, and they allow for the estimation of sampling errors (and thus margins of error and
confidence intervals). Sometimes, however, it is not feasible to take probability random
samples. In such cases, the researchers may use one of the following nonprobability sampling
methods.
Handout 2: Introduction to Surveys and Sampling Techniques STAT 335 – Fall 2016
11
Convenience Sampling
Obtaining a convenience sample involves selecting the most readily available elements of a
population for a study.
For example, in a clinical study, researchers may use patients that are easily accessed. Or, a
study may ask for (or even recruit and provide monetary compensation to) volunteers. In such
cases, there is concern about whether these samples are representative of the population (and
maybe even suspicion that they are not). For example, one concern regarding opinion polls is
that people who volunteer might tend to be more interested in (and therefore more
knowledgeable or opinionated about) the survey topic than the general public.
Purposive Sampling
When obtaining a purposive sample, researchers “hand-pick” units from the study
population that they believe to be representative of the population.
For example, in order to study consumer preferences of Caucasian females age 30-40 years old,
market researchers may go to a shopping mall and seek out individuals who seem to fit this
category. Or, suppose researchers want to estimate the average amount a shopper spends in one
visit to the Mall of America. If purposive sampling is used, the researcher will look around and
use their own judgment to sample shoppers who they feel are representative of the population.
Purposive sampling allows researchers to reach a targeted sample quickly; however, samples
may not be representative of the population because the sample is likely to overweight
subgroups of the population that are more readily available.
Snowball Sampling
This is a variant of purposive sampling. To obtain a snowball sample, a few members of the
population who meet criteria for inclusion in the study are selected, and they are asked to
provide names of further subjects they know who also meet the criteria.
This will most likely yield unrepresentative results; in some cases, however, it may be the only
way to reach a population that is hard to access.
Handout 2: Introduction to Surveys and Sampling Techniques STAT 335 – Fall 2016
12
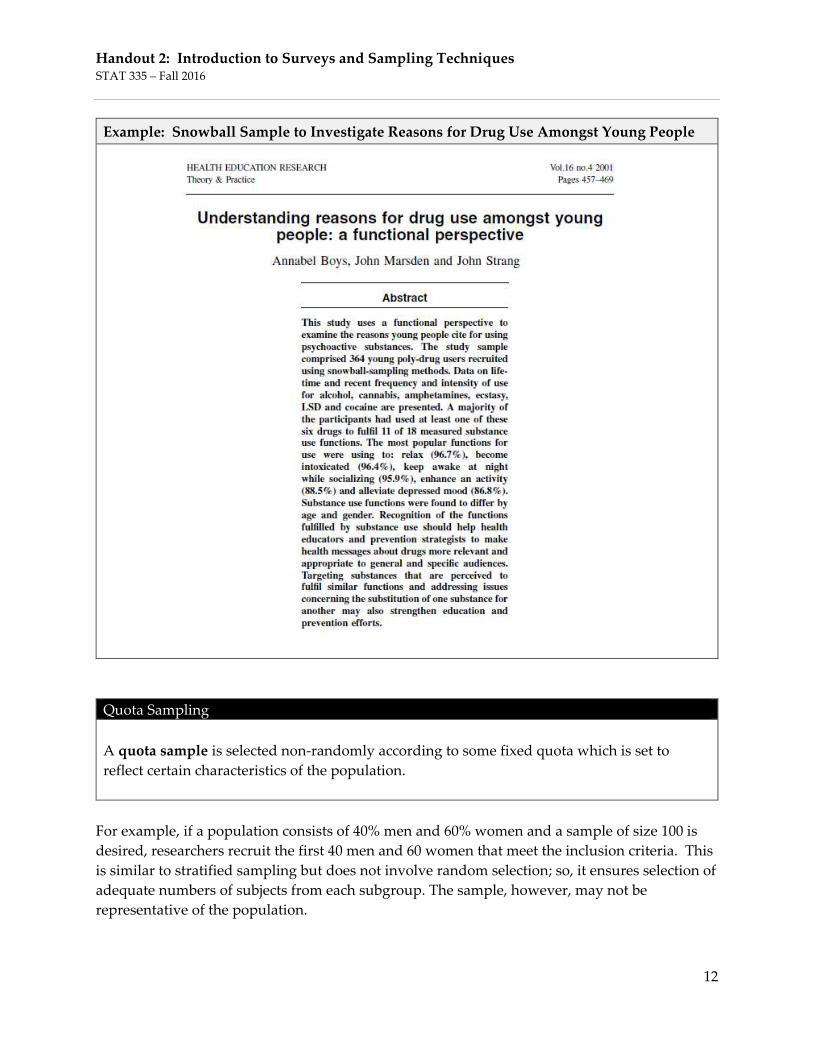
Example: Snowball Sample to Investigate Reasons for Drug Use Amongst Young People
Quota Sampling
A quota sample is selected non-randomly according to some fixed quota which is set to
reflect certain characteristics of the population.
For example, if a population consists of 40% men and 60% women and a sample of size 100 is
desired, researchers recruit the first 40 men and 60 women that meet the inclusion criteria. This
is similar to stratified sampling but does not involve random selection; so, it ensures selection of
adequate numbers of subjects from each subgroup. The sample, however, may not be
representative of the population.

Handout 2: Introduction to Surveys and Sampling Techniques STAT 335 – Fall 2016
13
TYPES OF ERRORS THAT OCCUR IN SURVEY STUDIES
There are two types of errors that typically occur with survey studies:
Broad Classifications of Errors
Sampling Errors – As discussed earlier, when parameters of a population are estimated from
a subset of that population (the sample), the statistics calculated from the sample data will
generally differ from the parameters of the entire population. This type of error is
unavoidable, but it decreases as the sample size increases.
Non-sampling Errors – This refers to any other deviations from the population parameters
that are not due to sampling error. These are much harder to quantify.
Next, we will discuss some commonly encountered non-sampling errors.
Non-sampling Errors
Coverage Error – This includes both undercoverage and overcoverage. Undercoverage
occurs when some members of the population are inadequately represented in the sample. A
classic example of undercoverage is the Literary Digest voter survey, which predicted that
Alfred Landon would beat Franklin Roosevelt in the 1936 presidential election. The survey
sample suffered from undercoverage of low-income voters, who tended to be Democrats.
Also, in many surveys of households, subgroups such as members of the military or persons
who are institutionalized tend to be undercovered. Overcoverage occurs when some
members of the population are overly represented in the sample. The classic example of this
is when the data frame contains duplicate records.
Some researchers just ignore these types of error, which isn’t necessarily a good idea. Others
are careful to redefine their study population or make corrections to their sampling frame.
Finally, some consult with professional statisticians with survey expertise who can use
advanced statistical techniques to adjust for coverage errors.
Non-Response Error - Sometimes, individuals chosen for the sample are unwilling or unable
to participate in the survey. Nonresponse bias is the bias that results when respondents differ
in meaningful ways from nonrespondents. The Literary Digest survey illustrates this problem,
as well. Respondents tended to be Landon supporters; and nonrespondents were Roosevelt
supporters. Since only 25% of the sampled voters actually completed the mail-in survey,
survey results overestimated voter support for Alfred Landon.
Again, some researchers just ignore this type of error, which isn’t necessarily a good idea.
Others consult with professional statisticians with survey expertise who can use advanced
statistical techniques (such as data imputation) to adjust for non-response errors.

Handout 2: Introduction to Surveys and Sampling Techniques STAT 335 – Fall 2016
14
Voluntary Response Error - This occurs when individuals select themselves to participate in
a poll. In this case, we obtain information from only those who feel strongly enough to
respond. An example would be call-in radio shows that solicit audience participation in
surveys on controversial topics (abortion, affirmative action, gun control, etc.). The resulting
sample tends to over-represent individuals who have strong opinions.
Measurement Error – This type of error occurs when surveys do not measure what they were
intended measure. This can happen when the respondent doesn’t understand the question,
doesn’t answer it truthfully, or the interviewer makes a mistake when recording the
respondent’s answers. This could also happen if the survey suffers from the effects of
question wording.
The following diagram shows how where these errors appear in the sampling process.