handling qualities of the xb-70 airplane in the landing
TRANSCRIPT

HANDLING QUALITIES
IN THE LANDING APPROACH OF THE XB-70 AIRPLANE
,' \
f i 'I, .\ I 'I5. \ i /
4 ' * by Donald T. Berry and Bruce G. Powers i I
Flight Research Center Edwards, Cali$
N A T I O N A L A E R O N A U T I C S A N D S P A C E A D M I N I S T R A T I O N W A S H I N G T O N , D . C. F E B R U A R Y 1970

TECH LIBRARY KAFB, NM
LANDING APPROACH
I 111111 lllll lllll lllll1lll1 lllll lllll Ill1 111
6. Performing Organization Code
0132520
Edwards, Calif. 93523
2. Sponsoring Agency Name and Address National Aeronautics and Space Administration
13. Type of Report and Period Covered
Technical Note
7. Author(s) 8. Performing Organization Report NO. I H-587
7. Key Words Suggested by Author(s) XB-70 airplane - Landing approach - Handling qualities
Donald T. Berry and Bruce G. Powers 10. Work Unit No.
18. Dislribiition Statement
Unclassified - Unlimited
3 . Performing Organization Name and Address NASA Flight Research Center P. 0. Box 273
9. Security Classif. (of this report) 20. Security Classif. (of this page) Pages
Unclassified Unclassified
I 720 -51 -00 -01 -24 11. Contract o r Grant No.
22. Price
$3. oo*
5. Supplementary Notes
6 . Abstract
Approaches and landings during the XB-70 program were performed at various approach speeds, glide-slope angles, gross weights, runway offsets, and operational conditions. Representative time histories, pilot comments, and pilot ratings were obtained from these maneuvers. Stability and control data and limited correlations with predictions and handling-qualities c r i te r ia were also obtained.
The XB-70 flight experience indicated that the height of the cockpit above the runway in combination with nose-high landing attitudes and high approach speeds made the landing task more difficult than that for current subsonic jet transports. Three-degree glide slopes were considered unsatisfactory at the 200-knot indicated airspeed approaches required by the XB-70. time available to accomplish the flare and, therefore, increased the possibility of a hard landing. cause of the high control effectiveness.
The high rate of descent reduced the
Large changes in lift due to elevon deflection w e r e satisfactory be-
Laterally, the aircraft was sensitive to turbulence. Lateral-offset maneuvers simulating breakout from an overcast w e r e not difficult; however, because of the higher approach speeds, excessive runway distances would be covered prior to touchdown and the adverse yaw accompanying aileron deflection was considered excessive. simple technique.
Sidestep maneuvering performance was adequately predicted by a
T o r sale by the Clearinghouse for Federal Scientific and Technical Information, Springfield, Virginia 22151.
HANDLING QUALITlES OF THE XB-70 AIRPLANE IN THE LANDING APPROACH
I INTRODUCTION
By Donald T. Berry and Bruce G. Powers Flight Research Center
As part of a continuing effort to document the significant characteristics of advanced aircraft for the benefit of aeronautical researchers and designers, the NASA Flight Research Center directed the joint NASA/USAF night tests of the XB-70 aircraft from March 1967 to December 1968. the XB-70 put it in the same class as proposed supersonic transports, therefore there is much interest in the characteristics of the XB-70 and the applicability of this infor- mation to the proposed supersonic transport as well as to large subsonic jet transports.
The size, weight, and operational envelope of
An area of concern for such large, high-performance aircraft is the handling qualities during landing approach. These aircraft are typified by long fuselages and high gross weights, which result in a large pitch inertia and long distances between the cockpit and main landing gear. Delta wings also contribute to nose-high attitudes, relatively large lift changes with pitch-control deflection, and adverse yaw due to aileron deflection. These characteristics have been studied on ground-based and airborne simulators (e. g. , refs. 1. to 3), but flight with a vehicle of this class had not been possible before the XB-70 program.
Although the study of landing-approach handling qualities was not a primary objective of the XB-70 flight research program, data were obtained from approaches and landings made at various approach speeds, glide-slope angles , gross weights , runway offsets , and varying operational conditions such as crosswinds and light-to- moderate turbulence. Consequently, sufficient data were gathered to provide a useful compilation of landing-approach characteristics for this class of airplane.
This report presents pilot comments and rating data, representative time histories , stability and control data, and a limited correlation of flight results with predictions and handlingqualities criteria.
SYMBOLS
normal acceleration at pilot’s location, g units %P
longitudinal acceleration at center of gravity, g units Sk
lateral acceleration at pilot’s location, g units “YP

b wing span, feet (meters)
CL Lift lift coefficient, - GS
, per degree lift-curve slope, - acL aa Q!
CL
6e CL
CZ
, per degree aCL variation of lift coefficient with elevon deflection, - ''e
Rolling moment rolling -moment coefficient , @b
, per radian damping-in-roll derivative, - z2 P c Z
E2 per radian - - -
'2r 2v
c lP , per degree effective dihedral derivative, - z Z
aP
, per degree ac2
roll-control derivative, - @a
C 1%
acZ '6, 86,
, per degree c =-
Cm Pitching moment pitching-moment coefficient ,
GSC
, per radian acrn
pitch-damping derivative, a(q +
2v mwdc C
"6, C
cN
, per degree a c m static pitch-stability derivative,
, per degree pitch-control derivative, ~
acm
''e
normal -force coefficient, Normal force , (approximately equal to cL) is
2

Z N - - - - , per radian
' ~ q a E 2v
, per degree
, per degree
aCN c ~ , act
8% CN - 6, "e
-- -
--
Cn Yawing moment yawing -moment coefficient ,
Cra
, per radian - K n -
'np a$ 2v
, per radian acn
--
CnP , per degree =n
static directional -stability derivative, - afl
Lateral force lateral -force coefficient ,
6s
, per degree 3 c = yp ap
c =- , per degree Y6,. '6,
- C
d
mean aerodynamic chord, feet (meters)
lateral-offset distance from runway, feet (meters)
thrust , pounds (newtons) Fn
3

IXZ
'C/ L
L 'e
'C/ M
'e M
m
'e NZ
act ele rat ion of gravity, fe et/s ec ond2 (met e r s/s ec ond2)
pressure altitude, feet (meters)
moments of inertia about X-, Y-, and Z-body axes, respectively,
product of inertia referred to the body X- and Z -axes, slug-foot2
dimensional lift -curve slope, 57.3 as C
slug-foot2 (kilogram-meter2)
(kilogram -meter2)
per second mv L a
dimensional variation of lift coefficient with control -column deflection,
, radians /s econd/inc h ( r adians/se c ond/c ent imeter ) ss 6e mV ' ~ 6 ~
dimensional variation of lift coefficient with elevon deflection,
E mV ' ~ 6 ~ 9 radians/second/degree
qsc 'e Iy c"'eq/' dimensional pitch -sensitivity derivative ,
radians/second2/inch (radians/second2/centimeter)
57.3 qsc cm'e, dimensional pitch -control derivative, IY
degrees/second2/degree
mass, slugs (kilograms)
V normal acceleration change per unit angle of attack, ; La, g per radian
normal acceleration change due to elevon deflection, !L' , g per degree g e
body-axis roll rate, pitch rate, and yaw rate, respectively,
dynamic pressure - pV2, pounds/foot2 (newtons/meter2)
radians/second unless otherwise indicated
1 2
wing area, feet 2 (meters 2 )
time, seconds
4
111 I
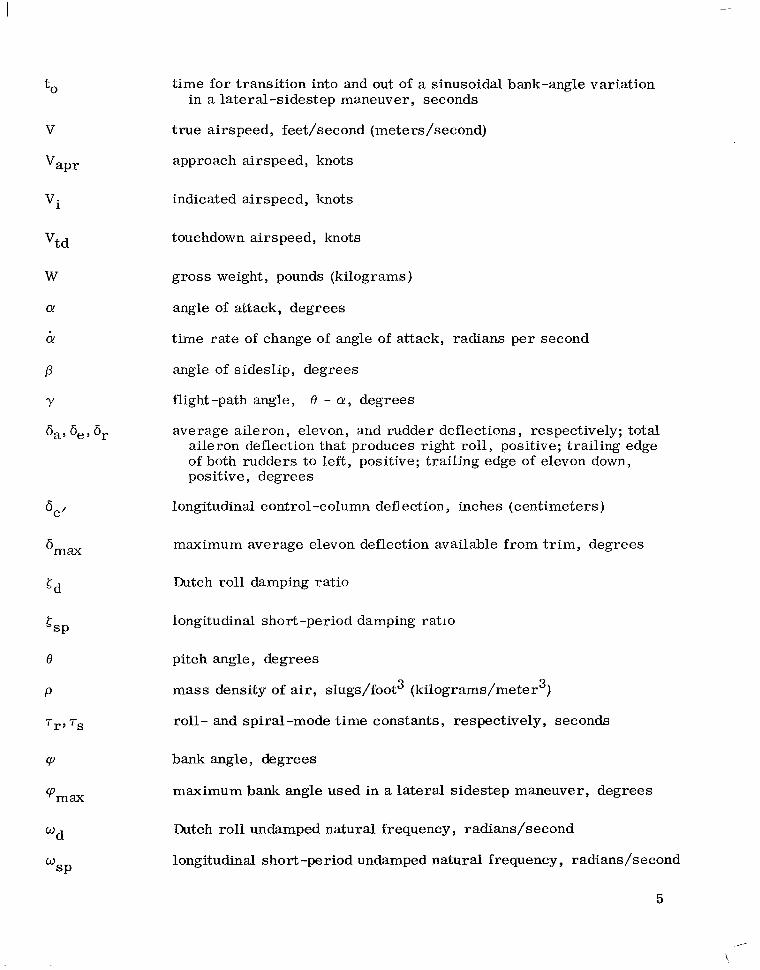
t0 time for transition into and out of a sinusoidal bank-angle variation in a lateral-sidestep maneuver, seconds
true airspeed, feet/second (meters/second)
approach airspeed , knots
indicated airspeed , knots
touchdown airspeed, knots
gross weight, pounds (kilograms)
angle of attack, degrees
time rate of change of angle of attack, radians per second
angle of sideslip, degrees
flight-path angle,
average aileron, elevon, and rudder deflections , respectively; total aileron deflection that produces right roll, positive; trailing edge of both rudders to left, positive; trailing edge of elevon down, positive, degrees
8 - a , degrees
longitudinal control-column deflection, inches (centimeters}
maximum average elevon deflection available from tr im, degrees
Dutch roll damping ratio
longitudinal short-period damping ratio
pitch angle, degrees
mass density of air, slugs/foot3 (kilograms/meter3)
roll- and spiral-mode time constants, respectively, seconds
bank angle, degrees
maximum bank angle used in a lateral sidestep maneuver, degrees
Dutch roll undamped natural frequency, radians/second
longitudinal short-period undamped natural frequency, radians/second
5
.
\
cp w constant term in numerator of the -!E transfer function 6a
DESCRIPTION O F AIRPLANE
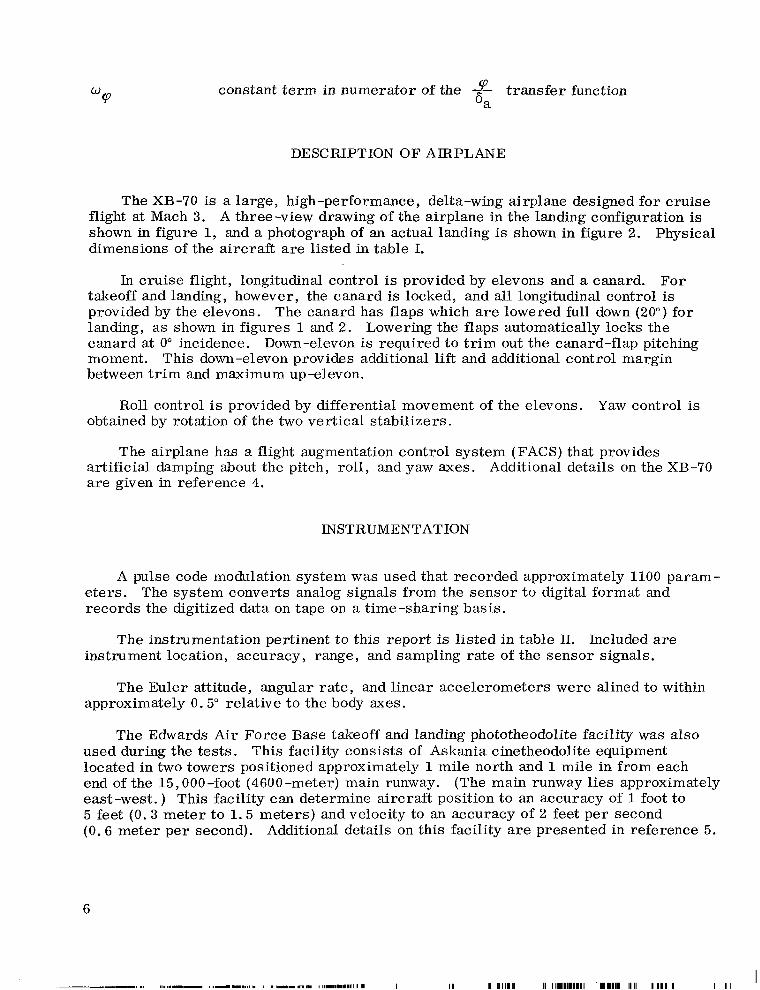
The XB-70 is a large, high-performance, delta-wing airplane designed for cruise flight at Mach 3. A three-view drawing of the airplane in the landing configuration is shown in figure 1, and a photograph of an actual landing is shown in figure 2. dimensions of the aircraft are listed in table I.
Physical
In cruise flight, longitudinal control is provided by elevons and a canard. takeoff and landing, however, the canard is locked, and all longitudinal control is provided by the elevons. landing, as shown in figures 1 and 2. Lowering the flaps automatically locks the canard at 0" incidence. moment. This down-elevon provides additional lift and additional control margin between t r im and maximum up-elevon.
For
The canard has flaps which are lowered full down (20") for
Down-elevon is required to t r im out the canard-flap pitching
Roll control is provided by differential movement of the elevons. Yaw control is obtained by rotation of the two vertical stabilizers.
The airplane has a flight augmentation control system (FACS) that provides artificial damping about the pitch, roll, and yaw axes. are given in reference 4.
Additional details on the XB-70
INSTRUMENTATION
A pulse code modulation system was used that recorded approximately 1100 param- eters. The system converts analog signals from the sensor to digital format and records the digitized data on tape on a time-sharing basis.
The instrumentation pertinent to this report is listed in table II. Included are instrument location, accuracy, range, and sampling rate of the sensor signals.
The Euler attitude, angular rate, and linear accelerometers were alined to within approximately 0.5" relative to the body axes.
The Edwards Air Force Base takeoff and landing phototheodolite facility was also used during the tests. located in two towers positioned approximately 1 mile north and 1 mile in from each end of the 15,000-foot (4600-meter) main runway. east-west.) This facility can determine aircraft position to an accuracy of 1 foot to 5 feet (0.3 meter to 1 .5 meters) and velocity to an accuracy of 2 feet per second (0.6 meter per second).
This facility consists of Askania cinetheodolite equipment
(The main runway lies approximately
Additional details on this facility are presented in reference 5.
6

CONDUCT O F TESTS
In the initial phases of the XB-70 testing, experience was gained primarily with routine approaches on shallow glide slopes of 1" to 2" and near the recommended approach speeds (e. g. , 199 knots for 300,000 pounds (136,000 kilograms) gross weight), The main, 15,000-foot (4600-meter) runway was normally used. In the latter phases of the program, landing approaches and touchdowns were made from a 3" glide slope using a visual glide-slope-indicator light system.
A typical landing pattern for the XB-70 is illustrated in figure 3. Landing-pattern speeds were referenced to the recommended flare speed, which was a function of gross weight (table 111). On most flights the landing weight was approximately 300,000 pounds (136,000 kilograms), and the center of gravity was between 23 percent and 24 percent of the mean aerodynamic chord. Typical speeds used on the downwind leg were 240 to 250 knots indicated airspeed (KIAS). Speeds on the base leg were 220 to 230 knots indicated airspeed, and final approach speeds were 200 to 210 knots. speeds were typically 175 to 185 knots indicated airspeed. reduced at flare initiation.
Touchdown Thrust was normally
Also performed were ILS approaches , lateral- and vertical-offset approaches , and approaches at speeds 20 knots below the recommended final-approach speed. Through- out the program, there were several instances of turbuience and crosswinds during landing, as noted in table IV.
Because the ILS beam at Edwards intersected the runway 2400 feet (730 meters) from the approach end, a visual glide-slope indicator was used for all 3" glide-slope landings and most of the 3" glide-slope approaches. This enabled touchdowns to be made nearer the runway threshold so that more runway was available for runout in the event of brake or tire failure. The visual glide-slope indicator consisted of a unit installed approximately 800 feet (240 meters) from the approach end and 15 feet ( 4 . 6 meters) to the left of the runway. A high-intensity light source was projected on a concave mir ror and beamed through a ser ies of amber, white, and red filters. The center beam, which was white and approximately one-half degree in depth, served as the glide-path reference. The amber light indicated aircraft position above the glide path, and the red light indicated aircraft position below. Under typical weather condi- tions the light was detectable as far away as 8 miles.
Data were obtained from full-stop landings, touch-and-go landings, and low approaches. Tables IV(a), IV(b), and IV(c) summarize the landing and approach maneuvers performed during the program. sets and handling -qu alities evaluations we re performed at representative approach speeds at altitudes of 8000 feet to 15,000 feet (3000 meters to 4600 meters). test conditions are summarized in table IV(d). Stability and control sets generally consisted of a pull-up and release, wind-up turn, double aileron pulse, double rudder pulse, and steady sideslip. Some phugoid oscillations were also obtained. The handling-qualities maneuvers included altitude changes of plus and minus 2000 feet (610 meters) and lateral-directional maneuvers. consisted of a roll into a turn at a normal rate followed by a 20" heading change utilizing a 25" bank angle. turn. The maneuver was performed both coordinated and uncoordinated.
In addition, stability and control maneuver
These
The lateral-directional maneuvers
A relatively high roll rate was used to recover from the In addition,
7

some aileron roll maneuvers were obtained.
Occasionally, landings were made on a dry lakebed adjacent to the main runway because of emergencies such as hydraulic failure. The lakebed provided a runway approximately 7 miles long with unrestricted approaches. These landings were not typical of normal landings, but they did contribute to the pilots' background and experience.
Four pilots participated in the flight-research program with the XB-70 airplane. Two of these pilots (A and B) participated in the Air Force envelope-expansion program and were qualified in the airplane before the NASA/USAF program began. The other two pilots (C and D) were checked out in the vehicle during the NASA/USAF program.
Pilot ratings and comments were obtained throughout the program by using the rating scale of table V (from ref. 6) and the questionnaires of tables VI and VI1 as guidelines. characteristics for civil transport missions.
Ratings and comments were based on the suitability of the observed
The indicated airspeeds listed in table N were obtained from the pilot's reports where possible. When these speeds were not reported, data recorded onboard the airplane were analyzed to obtain the information. A cross-check of speeds reported by the pilot, onboard recorded data, and speeds determined by the phototheodolite facility was made for several landings. *5 knots.
All three speeds usually agreed within
RESULTS AND DISCUSSION
Longitudinal and lateral-directional handling qualities are discussed in this section. General comments and typical time histories are presented, as well as pilot comments and ratings and criteria and quantitative results. The criteria and nominal character- istics were calculated from flight-determined stability derivatives.
Longitudinal Handling Qualities
Table N presents approach and landing conditions for several XB-70 landings.
It can be seen that the pilots were successful in attaining low sink rates. Estimates of sink rates at touchdown obtained from phototheodolite data are also included.
Most of the approaches were flown near the recommended approach speeds (fig. 4), However, the recommended with touchdown speeds also near the recommended speeds.
approach speeds in figure 4 are 8 knots higher than the original estimates obtained from the Pilot's Handbook, and the minimum touchdown speeds are 12 knots higher. These increments were added early in the XB-70 program to allow for uncertainties in the airspeed indication resulting from instrument and position e r r o r and to provide additional insurance against hard landings. Thus, during normal approaches and landings, the XB-70 indicated approach and touchdown speeds were 10 to 20 knots higher than originally estimated. Some landings were made on the lakebed runway with an indicated touchdown speed equal to o r slightly less than the original minimum value. However, these were emergency landings on which shallow glide slopes were used
8
I II I I II 11111111111 I 1111111111 11111111111 111111111 I

and the airplane was often allowed to "float" for a considerable distance before touching down.
Later tests in the XB-70 program indicated that the airspeed position e r r o r during approach and landing was approximately 5 knots; that is , actual airspeeds were 5 knots higher than the airspeeds presented to the pilot. If this is taken into account, XB-70 approach and landing speeds were 15 to 25 knots higher than the original estimates.
Figure 5 is a time history of a typical landing from a 3" glide-slope approach. Elevon deflection varies from the approach-speed t r im value of approximately 10" trailing edge down to approximately 1" in the flare. Angle of attack varies from the t r im value of 7.5" to a peak of about 9" in the flare. The pilots had a tendency on the steeper approaches to "duck under" the reference glide slope as they got near the run- way. This enabled them to perform the last part of the approach at a somewhat reduced glide slope and touch down nearer the runway threshold.
which was approximately 15 knots below the recommended speed shown in table I11 and approximately 7 knots below the speed originally recommended (fig. 4). If position e r r o r is considered, however, these approaches were within 2 knots of the original recommended approach speed. A time history of one of these approaches is shown in figure 6. Since a touchdown was not made, a flare was not performed. angle of attack was approximately 10". Although speed was held fairly constant until power was increased for a go-around at approximately 45 seconds, much more throt- tle activity was used in these approaches than in normal landings, as shown in figure 7. This figure presents time histories of the throttle activity from the landing and ap- proach maneuvers in figures 5 and 6. required when the approach was made at 185 knots than a t the normal speed of 210 knots.
Two approaches (without touchdown) were made on a 3" glide slope at 185 knots,
The t r im
A s shown, much larger throttle changes were
An ILS approach with a vertical offset was flown to evaluate the handling qualities of the airplane when descending to intercept the normal ILS glide slope after crossing the outer marker higher than the prescribed altitude. The outer marker was located 7.0 nautical miles from the runway and should have been intercepted 2300 feet (700 meters) above the runway elevation. For this test the outer marker was inter- cepted 3150 feet (960 meters) above the runway elevation; however, the airplane was reestablished on the correct glide slope by the time it was 1000 feet (300 meters) above the runway.
Pilot .. comments __- and ratings. - Pilot comments on the longitudinal handling qualities ~
The maneuver was considered routine.
are summarized in table VIII. Detailed comments are presented in the appendix. Generally, the pilots had high praise for the longitudinal handling qualities of the XB-70 in the landing approach. Speed stability and engine response were described as "excellent;" control response was described as "very good. '' The pilots also felt that ground effect assisted them in making smooth landings. commented on the difficulty of judging height during the shallow approaches and landings, and pilots A and B commented on this factor during 3" glide-slope approaches and landings. The comments also indicated that the difficulty in judging height was related to the high approach speed and height of the pilot above the ground at touchdown. Pilot A provided an insight to the relative difficulty of these factors by rating the various tasks in his comments on shallow approaches and landings. He rated speed control 1 to 2, longitudinal control 2 to 4, and height judgment 7; thus, except for the height-judgment problem, pilot A would have given the longitudinal characteristics of the XB-70 a high overall rating. Steeper approaches and the associated higher descent rates allowed
However, pilots A and C
9

less time to judge height, as reflected in pilot A's comment that the "chances of mis- judging height in the flare are too great" from a 3" glide slope. possibility of a hard landing.
This increased the
Pilots B and C also commented on the difficulty of judging height, but did not seem to give it the same weight that pilot A did. However, pilot C did not perform any 3" glide-slope approaches. Although pilots A and B both had extensive experience in the XB-70 (table IV), pilot B appeared to have developed a better than average ability to judge the height of the airplane above the ground. This was evidenced on several flights by his accurate call out of f lare heights and landing without altitude callouts from escort aircraft. The difference in outlook between pilots A and By therefore, is con- sidered to be a good representation of the range of capabilities to be found in any group of highly qualified pilots. Considering the overall pilot population, due regard must be given to the more pessimistic ratings.
The ILS approach with vertical offset was easily accomplished because of the excellent thrust response and longitudinal control of the aircraft. Height judgment was not a factor, since the aircraft was returned to the correct flight path considerably before the flare.
Pilot ratings of the longitudinal handling qualities are summarized in figure 8. These ratings represent an overall average for each pilot weighted with the aid of pilot comments. Most of the ratings apply to the relatively favorable weather conditions that existed during the tests. The ratings designated by squares, however, represent an extrapolation by the pilots of their experience in this program to the more adverse weather and visibility conditions that would be encountered in everyday airline operations.
Pilot A rated the shallow approaches poorer than pilots B and Cy as indicated in the pilot comments (table VIII). Overall, however, these maneuvers were considered satisfactory. For the 3" glide -slope approaches , the difference between the overall ratings of pilots A and B was greater than the difference in their overall ratings for the shallow approaches. This reflects pilot A's concern for the increased demands placed on height judgment by the increased rate of descent. The incremental rating applied by pilots A and B to allow for adverse-weather operation, however, was the same. The adverse-weather ratings fa l l in the unsatisfactory but acceptable category for pilot By and in the unacceptable category for pilot A. Nevertheless, these ratings are close to the satisfactory boundary (pilot rating (PR) = 3.5) for pilot B and the acceptable boundary (PR = 6 . 5 ) for pilot A. It is concluded, therefore, that 3" glide- slope landings are unsatisfactory for the XB-70 for adverse-weather o r visibility operation, o r both, because of the high approach speed (200 KIAS o r more) and the height of the pilot above the ground at touchdown. However, as noted previously, due regard must be given to the more pessimistic ratings when considering the average pilot, To make operation satisfactory, approach speeds must be reduced without a deterioration in handling qualities o r glide slopes must be limited to approximately 2", o r both. An indication of the necessary reduction in glide-slope and approach speeds can be deduced from the comment of pilot B that landings will never be as easy as in a 707 aircraft because of cockpit height. glide slopes, o r both, for a vehicle in the XB-70 class must be the same o r somewhat less than those used for subsonic jet transports to maintain the same level of safety, unless improved displays or pilot aids are incorporated.
This implies that the approach speeds or
10

The rating for the vertical-offset approach by pilot B was the same as his ratings for the shallow and steep approaches made at the same speed, and reflects the excellent longitudinal and speed control of the XB-70. For the slow 3" glide-slope approaches, however, the rating drops to the unsatisfactory level because of the decrease in speed control and visibility plus increased pilot workload at this approach speed. It should be noted that these slow approaches were within 2 knots of the original recommended approach speed.
It should also be noted that the preceding discussion applies to the airplane with the longitudinal FACS on o r off. sufficiently high at landing-approach speeds that the influence of the FACS was barely noticeable to the pilot. Moderate-to-heavy turbulence, however, did cause a rough ride and make airspeed and altitude control difficult.
The basic longitudinal damping of the XB-70 is
Criteria and quantitative results. - The nominal longitudinal airplane landing- approach characteristics are presented in table M and the corresponding flight - determined stability derivatives in table X. speeds, the dynamic pressure was fairly high. characteristics despite the high inertia.
Because of the relatively high approach This contributed to good airplane
Table M also presents the nominal landing characteristics for a subsonic jet transport from reference 7. are not too different from those of the XB-70. The main difference is in steady-state normal acceleration per unit of angle of attack N Z - the XB-70 had almost twice the a' Nz,, (as the subsonic jet).
to change flight path on the XB-70 than on the subsonic jet.
It can be seen that longitudinal frequency and damping
This implies that smaller attitude excursions a re required
Two key longitudinal control parameters in the landing approach are the maximum control power available from t r im and the change in lift associated with this control power. Figure 9 compares XB-70 control power and change in lift associated with this control power to that of subsonic jets and a minimum boundary (unpublished) suggested by the Boeing Company for aircraft in the supersonic transport class. elevon deflection limits are -+ZOO. t r im at normal approach speeds was approximately 10" trailing edge down, out of ground effect. elevator deflection is required to t r im out ground effects. observed in the actual landings was about 0"; however, this includes the elevon deflection required to flare. Because of the uncertainties in ground-effects measurements , a conservative estimate of 20" deflection available between the limit and t r im was used to estimate XB-70 control power.
The XB-70 During landing the elevon deflection required for
Unpublished flight data indicate that an incremental 4" trailing-edge -up The maximum up-elevator
As shown in figure 9, the XB-70 control power greatly exceeds the minimum values based on supersonic-transport studies and also exceeds those for typical subsonic jets. The acceleration due to the lift change with elevon deflection is also large. The pilots rated the longitudinal control for the XB-70 satisfactory at the points shown, indicating that large NZ effects a r e satisfactory if control effectiveness is high.
6e
Another important factor in longitudinal control is control sensitivity. Figure 10 shows a tentative boundary (ref. 2) for longitudinal control for airplanes in the large- transport category in terms of the lift change and moment change per inch of column
11
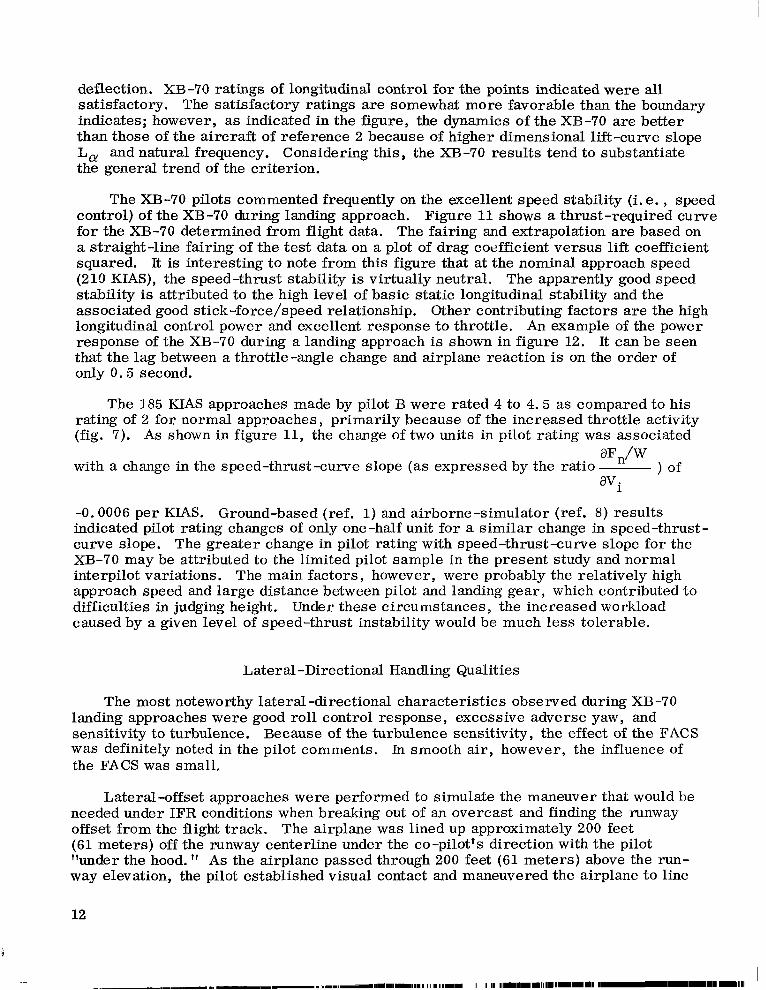
deflection. XB-70 ratings of longitudinal control for the points indicated were all satisfactory. The satisfactory ratings are somewhat more favorable than the boundary indicates; however, as indicated in the figure, the dynamics of the XB-70 are better than those of the aircraft of reference 2 because of higher dimensional lift-curve slope L, and natural frequency. Considering this, the XB-70 results tend to substantiate the general trend of the criterion.
The XB-70 pilots commented frequently on the excellent speed stability (i. e. , speed Figure 11 shows a thrust-required curve control) of the XB-70 during landing approach.
for the XB-70 determined from flight data. The fairing and extrapolation are based on a straight-line fairing of the test data on a plot of drag coefficient versus lift coefficient squared. It is interesting to note from this figure that at the nominal approach speed (210 KIAS), the speed-thrust stability is virtually neutral. The apparently good speed stability is attributed to the high level of basic static longitudinal stability and the associated good stick-force/speed relationship. Other contributing factors are the high longitudinal control power and excellent response to throttle. An example of the power response of the XB-70 during a landing approach is shown in figure 12. It can be seen that the lag between a throttle-angle change and airplane reaction is on the order of only 0.5 second.
The 185 KIAS approaches made by pilot B were rated 4 to 4.5 as compared to his rating of 2 for normal approaches, primarily because of the increased throttle activity (fig. 7). As shown in figure 11, the change of two units in pilot rating was associated
aFn/w avi
with a change in the speed-thrust-curve slope (as expressed by the ratio ) of
-0.0006 per KIAS. indicated pilot rating changes of only one-half unit for a similar change in speed-thrust- curve slope. The greater change in pilot rating with speed-thrust-curve slope for the XB-70 may be attributed to the limited pilot sample in the present study and normal interpilot variations. The main factors , however, were probably the relatively high approach speed and large distance between pilot and landing gear, which contributed to difficulties in judging height. Under these circumstances , the increased workload caused by a given level of speed-thrust instability would be much less tolerable.
Ground-based (ref. 1) and airborne-simulator (ref. 8) results
Lateral-Directional Handling Qualities
The most noteworthy lateral -directional characteristics observed during XB-70 landing approaches were good roll control response, excessive adverse yaw, and sensitivity to turbulence. Because of the turbulence sensitivity, the effect of the FACS was definitely noted in the pilot comments. In smooth air, however, the influence of the FACS was small.
Lateral -offset approaches were performed to simulate the maneuver that would be needed under IFR conditions when breaking out of an overcast and finding the runway offset from the flight track. The airplane was lined up approximately 200 feet (61 meters) off the runway centerline under the co-pilot's direction with the pilot 'lunder the hood. " As the airplane passed through 200 feet (61 meters) above the run- way elevation, the pilot established visual contact and maneuvered the airplane to line
12

up with the runway. The lateral maneuver itself was not considered difficult; however, the high approach speeds and turbulence made rapid control inputs necessary to aline with the runway in time. The rapid control inputs made the adverse-yaw effects more pronounced. As a result, the pilots usually held the airplane at about 50 feet (15 meters) altitude with power until alinement with the runway was assured before they proceeded with the flare. This caused estimated touchdown points to be 5000 to 6000 feet (1500 to 1800 meters) down the runway.
A typical time history of a lateral-offset maneuver is shown in figure 13. Light- to-moderate turbulence existed during this maneuver. A high degree of aileron activity is evident, and the bank angle is oscillatory. These factors are probably related to the acherse yaw and turbulence.
Several landings were made in turbulence and crosswinds. The most severe is illustrated in figures 14(a) to 14(d), time histories of a landing that was made in moderate-to-heavy turbulence and crosswinds of 20 knots with gusts to 30 knots, 55" to the runway. More aileron deflection was used during this landing than at any other time in the XB-70 flight-test program. were used, and peak roll rates near 10 deg/sec were experienced. Right bank was used to stop the drift to the left. experienced.
Peak aileron deflections of approximately 12"
Difficulties in controlling speed accurately were also
Crosswind landings were not considered difficult in the XB-70 except when accompanied by turbulence. cancel the drift. to slight wing down from flare to touchdown was used; however, bank angles of less than 5" were usually adequate. were not rated, the pilot comments indicate that the airplane characteristics were satisfactory.
The usual technique was to fly with one wing down to In gusty crosswinds a crab down final approach with a transition
Although crosswind landings in calm-to-light turbulence
The crosswind landing in moderate-to-heavy turbulence (fig. 14), on the other hand, was considered unsatisfactory by pilot D for a landing at Edwards and unacceptable for landing on runways of normal length in adverse visibility. These comments, however, relate to the overall airplane characteristics , not just lateral-directional. The work- load imposed by difficult airspeed control and the rough ride was also a factor.
Only one set of aileron rolls was performed in the landing configuration. Figure 15 presents the XB-70 response to the maximum aileron deflection used in aileron roll maneuvers. verse sideslip generated. As a result of the interaction between the adverse-yaw effects
Larger aileron inputs were not used because of the magnitude of the ad-
and dihedral , roll -rate reversal tendencies also occurred. The parameter %is a Wd w .
Y As was shown in table My the - Wd
good indicator of roll-rate-reversal tendencies.
value for the XB-70 is approximately 0.68. Reference 9 shows that when % is less than 0.7, there is a tendency for roll-rate reversal to occur.
Time histories of a typical lateral-directional handling-qualities -evaluation maneuver are presented in figures 16(a) and 16(b). These maneuvers are much smoother than the aileron rolls because of the smaller and gentler inputs. A typical roll rate
13

used for a moderate-rate turn entry was on the order of 2 . 5 deg/sec. turn entry, about 5 deg/sec were used. The pilots considered these rates representa- tive of normal transport-aircraft maneuvering. Under these circumstances the adverse - yaw characteristics of the XB-70 were not bothersome, in that significant roll reversals did not occur, and the sideslip angles in uncoordinated turns were not large. However, the effort required to coordinate turns was excessive, and attention to bank angle and yaw often resulted in heading overshoots. The pilots concluded that it was best not to try to coordinate the rudder-aileron control.
For a "fast"
Pilot comments-ind ratings, - Pilot comments on the lateral-directional handling qualities are summarized in table XI. appendix.
Detailed pilot comments are included in the
Pilot ratings of the lateral-directional characteristics are summarized in figure 17.
The square is an extrapolation by the pilot to the more adverse visibility The data are for landing conditions as they existed at Edwards A i r Force Base, except for one point. and runway conditions that would be encountered in airline operations.
The ratings for the straight-in approaches show good agreement among pilots A, B, and C. With the FACS on, the airplane's lateral-directional characteristics were satisfactory in smooth o r rough air. was still rated satisfactory. unsatisfactory. rated because of adverse yaw.
In smooth air and with the FACS off, the airplane In turbulence with the FACS off, however, the rating was
Yaw oscillations could not be damped out, and the airplane was down-
Comments on the lateral-offset approaches also show the influence of adverse yaw, turbulence sensitivity, and the FACS. off in turbulence. straight-in approaches. It appears that the suitability of the XB-70 handling character- istics for lateral-offset maneuvers could be estimated from experience with straight-in approaches.
Overcontrol tendencies were noted with the FACS The trend of the ratings is quite similar to that obtained from the
The lateral-directional maneuvers were rated the same with the FACS on and off, which reflects the fact that the maneuvers were smooth and gentle and were performed in smooth air.
Criteria and quantitative _- . results. - The nominal lateral-directional characteristics are presented in table IX , and the corresponding flight-determined stability derivatives are presented in table X. subsonic jet transport.
jet transport is in the value of - ' . TheXB-70 value is much less than 1 . 0 , indicat-
ing, as previously discussed, higher adverse-yaw effects than for the subsonic jet transport.
Also shown in table M are the characteristics of a typical The principal difference between the XB-70 and the subsonic
w
wd
The study of reference 10 theorized that the sidestep maneuver involves, ideally, a sinusoidal variation in bank angle. developed a formula for the time required to accomplish a sidestep as a function of the maximum bank angle used. quired to perform a sidestep maneuver can be calculated. Figure 18 compares XB-70
On the basis of this assumption, reference 10
With this time and the average speed, the distance re-
14
flight results with this prediction technique. The formula, as indicated in the figure, includes a time to to allow for a transition into and out of the sinusoidal bank-angle variation.
This technique gave good results when applied to Viscount, DC-6, and 707 aircraft. It is interesting to note that it applies fairly well to the XB-70 also, despite the air- plane's adverse-yaw characteristics and slender, delta geometry. In turbulence, how- ever, there is some indication that the correlation deteriorates, probably because of the adverse yaw and resultant overcontrol tendencies that cause the bank-angle variation to deviate from a pure sinusoid. function of turbulence.
This could be compensated for by increasing to as a
CONCLUDING REMARKS
Flight experience with the XB-70 airplane provided information pertinent to the landing-approach characteristics of large , advanced aircraft.
The height of the cockpit above the runway in combination with nose-high landing attitudes and high approach speeds made the landing task more difficult than that presented by a subsonic jet transport. considered unsatisfactory for routine operation of the XB-70 at its approach speed of 200 knots indicated airspeed o r greater. both, for a vehicle in the XB-70 class must be the same o r somewhat less than those used for subsonic jet transports to maintain the same level of safety, unless improved displays o r pilot aids are incorporated.
Because of these factors, 3" glide slopes were
The approach speeds o r glide slopes, o r
Large changes in lift due to elevon deflection were satisfactory when accompanied The longitudinal control sensitivity bound- by good elevon pitch control effectiveness.
ary proposed in NASA CR-635 shows general agreement with XB-70 flight results.
Good longitudinal control and fast power response to throttle a r e important factors in apparent speed stability.
A greater change in pilot rating with speed-thrust-curve slope was observed during XB-70 flight tests than in previous simulator studies of other airplanes. sensitivity is believed to be the result of the complicating factors of nose-high attitude, height of the cockpit above the runway, and high approach speeds. circumstances , a speed-thrust instability would have been less tolerable.
This
Under these
Longitudinally, turbulence caused a rough ride which made speed and attitude control difficult. to adverse yaw.
Laterally, turbulence caused yawing oscillations and overcontrol due
Crosswind landings without turbulence were relatively easy because the drift could be compensated for by small bank angles.
Ground effects helped the pilots make a smooth touchdown.
Lateral-offset maneuvers simulating breakout from an overcast were not difficult; however, because of the higher approach speeds , excessive runway distances would be
15

covered prior to touchdown. approach was adequately predicted by the simple formula presented in British A. R. C. R. & M. No. 3347.
Ability to correct for a lateral offset during landing
Flight Research Center, National Aeronautics and Space Administration,
Edwards, Calif., October 30, 1969.
16

APPENDIX
DETAILED PILOT COMMENTS
Flight 55, Pilot A
General comments. - Landings a r e easy and enjoyable, except that lateral- directional control in gusty a i r is not good, rated 5; speed control, longitudinal control, and t r im a r e rated 2.
Flight 57, Pilot A
Aileron rolls.- Two aileron rolls to the left were performed at 234 and 238 KLAS.
These were not comfortable and represented near the Eighteen degrees left-wheel-down aileron were applied at a moderate ra te , which generated 4" to 4.4" right yaw. maximum rate I would want to apply this amount of aileron. Overall rating of the maneuver is 6 .
Flight 58, Pilot A
General comments. - My biggest landing problem is judging height above the ground from the threshold to touchdown. prevents this from being an exacting science for me. I maintain a safe height and speed until I'm over concrete and let it settle in from there. usually 2500 feet from the end of the runway. transport; I rate this particular phase of the landing 7. the landing were: speed control, 1; longitudinal control, 4; and lateral-directional control, 5.
The cockpit height and distance to the main gear
Therefore, my touchdown is
The individual task ratings for This is unacceptable for a commercial
Flight 58, Pilot B
ILS approaches from copilot seat.- The first approach was flown with all augmen- tation on:- A concentrated attempt was made to keep all observations inside the cockpit, and the runway was not observed until the call was received to go around at 50 feet elevation. Speed was held with the throttle, and the elevator was used to hold the glide slope. Speed control and pitch control were excellent, and the lateral control was satisfactory. With the smooth air that existed, the airplane was easily flown down the glide slope and on the centerline. Yaw angles produced by lateral-control inputs were under lo, since the required control inputs were small. The "ILS mode" selection, which shows displacement from centerline and glide slope, was used for the approach. The aim airspeed of 220 knots was held very close throughout the approach, and the workload required to hold the centerline was low. easily from below a ceiling of 200 feet o r less. ILS task were 2 for longitudinal control and 3 for lateral-directional control.
The airplane could have been landed The Cooper ratings assigned for this
The second ILS approach was flown with all augmentation off and using the "ILS approach mode" selection, which shows the rate of correction to make to return to
17

I 1111 I I 111 I ,1..111 .I.._. -I ,.. ..... . ... . ~
glide slope o r centerline. There was only a slight observable difference between this approach and the previous approach, since the air was very smooth and the airplane did not tend to make random deviations from the desired path. The yaw angles produced by lateral-control inputs were slightly higher and occasionally reached 1 1/2". The workload to hold the center- line and glide slope was still low. The approach had to be discontinued when approxi- mately 400 feet above the ground because of a traffic conflict, but it was felt that under the existing smooth-air conditions , the airplane could have again been landed from below a ceiling of 200 feet. for longitudinal control and 3.5 for lateral-directional control.
The same techniques were used as on the f i rs t ILS approach.
The ratings assigned for this FACS-off ILS were again 2
Very good ILS approach handling qualities were exhibited under smooth-air conditions.
Flight 60, Pilot B
Approach and landing. - Light turbulence and crosswind (wind 270 " , 18 knots gusting to 28, using runway 22). sideslip near runway-touched down on one wheel. ailerons not present. Crosswind not nearly as much problem as turbulence.
Fly with sideslip on approach-switch to one wing down, no Overcontrolling tendency with the
Flight 60, Copilot A
Descent and landing. - The landing runway was 22 with the wind from 270 " at 18 to 28 hxts. Best flare speed was 189 KIAS for a gross weight of 298,000 pounds. The gusty crosswind required crab down final and slight right wing down from flare to touchdown. A l l augmentation was on for the landing. 1000 feet of the runway, right gear f i rs t , at 180 K U S , was a very nice one. bulence experienced on final created considerable bouncing around in the cockpit and greater than normal pilot effort.
The touchdown, within the first The tur-
Flight 62, Pilot €3
Lateral-directional -. - maneuver .- A lateral-directional maneuver at 2 60 knots was performed where ailerons only were applied at a normal ra te to establish a 25" bank. Af te r turning for approximately 30 seconds, the airplane was rolled out on a desired heading using only the ailerons which were applied at a fast rate. The maneuver was then repeated in the opposite direction using coordinated rudder and ailerons for the bank entry and exit. The ailerons only bank establishment caused 1" of adverse yaw which built up slowly and then stabilized at 2/3" during the turn. the wings was done with approximately 14 O wheel movement and generated 1 1/4 O of yaw. The roll-in was rated 3 and the roll-out 3.5. produced 1/4" adverse yaw but required high rudder force. result in a coordinated maneuver. too quickly for proper rudder coordination as the roll-out was started, and the yaw excursion went to 2" to 2.5" as the wings were leveled. It was too difficult to properly coordinate the rudder with the aileron. ra te and 4.5 at the fast rate. The overall lateral-control rating was 3. 5.
ILS offset approach.- The flare speed was computed to be 190 knots for the ILS offset approach, and the final approach was flown at 210 knots. Turbulence was moderate during the approach and *1 O of sideslip was frequently encountered without
The rapid leveling of
The coordinated roll-in at a normal rate The fast roll-out did not
The rapid aileron input caused the yaw to increase
The lateral control was rated 2 at the normal
18

APPENDIX
any pilot input to the controls. The glide slope was flown using the glide-path indicator, and the copilot gave heading instructions to place the airplane approximately 200 feet to the right of the runway centerline. started to line up with the runway and be in a position to land. breaking out below an overcast. initial lateral-control input, and the runway centerline was crossed before getting lined up with the runway.
At 200 feet above the ground, a correction was
Approximately 2" of adverse yaw occurred during the This was to simulate
The airplane could have been easily landed, although the touchdown would have been farther down the runway than desired. glide-slope interception point at 2400 feet from the approach end of the runway. When maneuvering close to the ground in a large airplane, there is always (or should be) a strong awareness of the reduced ground clearance of the wing when banking. This maneuver was more comfortable in the XB-70 than when practiced a day earlier in the larger-span B-52 (185 feet versus 105 feet for the XB-70). ver was 4 and was based primarily on the adverse yaw developed during the initial correction.
This was due, in part, to the Edwards ILS
The rating for this maneu-
Landing. - With 26,000 pounds of fuel remaining, the flare speed was computed as 187 knots. The airplane encountered fairly heavy turbulence on final approach, and strong lateral oscillations were felt in the cockpit. airplane response to turbulence on the final approach, which was contrasted by docile handling qualities during the flare and landing. touchdown at about 185 knots, and the airplane was held off until a smooth touchdown came at 170 knots.
It was interesting to note the strong
Power was reduced to idle prior to
Flight 65, Pilot A
Lateral-directional maneuver. - A lateral-directional turn maneuver was completed at 220 KIAS and 8000 feet. both coordinated and uncoordinated. initiation. waste of time to attempt coordination. turbulence. Rated 2. Holding speed was also rated 2, but the overall maneuver rating was 3 due to the coordination effort required and yaw generated by use of ailerons.
Twenty-degree heading changes were made using 20" banks, The usual 2" of yaw was observed during turn
Coordination is not easy, and for such short periods of turn I consider it a Altitude hold -+lo0 feet was easy, even in the
Overall approach. - Light turbulence with occasional moderate chop. responded very well to correct the lateral disturbances in the turbulence.
The aircraft Rated 3 to 4.
Flight 65, Copilot D
General comments. - The single most impressive observation during the flight was the severity of the aircraft response to low-altitude turbulence. an apparent 1 to 2 cps "snaking" lateral-directional mode (almost entirely directional, with hardly any accompanying roll) was of such amplitude and frequency as to com- promise pilot capabilities in accomplishing routine cockpit duties. It appeared to be poorly damped, FACS on o r off, and the pilot does not have much capability to damp the oscillation.
At 250 to 300 KIAS,
19
APPENDIX
Flight 68, Pilot B
Descent and landing.- After the airplane was slowed below 260 knots , the landing gear was extended a t approximately 25,000 feet. 190 knots. A straight-in approach was made to runway 4 on a 3 " glide slope using the glide-slope approach lights. The 3" glide slope was slightly steeper than most XB-70 approaches but was a comfortable angle. The light source which was located 800 feet from the end of the runway was easy to follow, and the XB-70 remained in the 1/2" beam until approximately 100 to 150 feet above the ground. The airplane was then flared and touchdown occurred approximately 1,400 feet down the runway. Touchdown speed was near 180 knots. The drag chute was deployed, but the brakes were not used until the speed was decreased to approximately 25 knots when an apparent brake fade was noted.
The flare speed was computed as
Additional comments.- Light-beam glide-slope approach (3 "). Picked up light 3 to 4 miles out. throttle before flare. Touched down at about 180 knots, 1400 feet down runway. Landing was routine. It would never be as easy as a 707 because of the cockpit height, but this is a problem that can be coped with. Radar altimeter would enhance safety. This light system is easier to fly than the ILS. B-58 because of better centering and better control system. Rated 2.
Flew on white light (center beam &O. 25 ") to 100 to 150 feet. Chopped
Landing the XB-70 is easier than the
Flight 70, Pilot B
Three-degree app-roa-ch. angle and full-stop landing.- The final landing approach was This was the second use flown using glide-slope approach lights set to give a 3" angle.
of a 3" app zch angle in the XB-70 by this pilot. A s on flight 1-68, the approach appeared a Ale steep but was comfortable. The light source was followed down to approximat2.y 100 feet above the ground. A t that time the power was reduced slightly and the descL;I angle increased to "duck" down to the runway. A flare was initiated 25 to 30 feet above the ground and power reduced to idle just before touchdown. effect cushimed th-. airplane nicely, and a smooth touchdown occurred 1500 feet down the runway. Thic, touchdown point was within 100 feet of the touchdown point of flight 68 in which the s,r,le 3" approach light system was used. The speed at touchdown was not observed, since attention was concentrated outside the airplane during the steeper than normal flare.
The ground
The touchdown speed was estimated to be 180 knots.
A 3"-glide-slope final approach appears to be acceptable for the XB-70.
Flight 70, Copilot C
Landing approaches.- A low approach was made from Rosamond Dry Lake to runway 4. The lowest altitude on the low approach was 30 feet, as noted by the chase. The handling qualities in the lateral and longitudinal mode were considered good, and there was no tendency to overcontrol in either axis. I did not monitor the yaw needle, but there was no obvious yaw with roll inputs. Roll and pitch inputs were moderate in the landing-approach maneuver. An estimated glide slope of 1.5 " to 2 " was flown. It appeared that the 3" approach as indicated by the special NASA approach light was rather steep, and I did not desire to fly the XB-70 on that angle for my first approaches. The lower approach angle seemed more comfortable. The chase pilot's callouts of gear
20
APPENDIX
height above the ground were helpful because accurate judgment of gear position is a little difficult. I have noticed this on earlier flights when just observing another pilot land.
The next approach was made similar to the first, with the addition of a touch-and- go landing at the completion of the approach. The approach was similar to the other, and it was noted that speed control was good. The approach speed used was 210 knots; the computed flare speed was 190 knots. A s the touchdown was near (about 30 feet), a cushioning effect was noted, and the rate of sink was arrested prior to touchdown. A Cooper rating for the overall landing configuration is 2. The primary problem I noted on the approaches was the judgment of altitude from about 200 feet on to touchdown.
Flight 71, Pilot C
Approach and landing.- Yaw oscillations were noticed in turbulence and could not be damped out. Roll response was good as was longitudinal response. Overall lateral- directional rated 2. 5, longitudinal 1.5 to 2. Lateral-directional downrated for adverse yaw due to aileron input.
Flight 72, Pilot B
Heavyweight offset approach maneuvers .- A l l approaches were flown with the landing gear and flaps extended. The first approach angle was established visually and appeared to be between 2 " and 2.5 ". The second and third approaches were flown using the light source along the runway to establish a 3" glide-slope angle. was computed as 223 knots as the approach was initiated with 170,000 pounds of fuel indicated. line with all FACS on, and, when passing 200 feet elevation, a correction was made to line up with the runway. needed under IFR conditions when breaking out of an overcast and finding the runway offset from the flight track. Approximately 15" of bank was used on the initial correction toward the runway. The airplane responded well, but corrections had to be made without delay since the 240-knot approach speed caused the runway to pass under- neath at a rapid rate.
The flare speed
The airplane was lined up approximately 200 feet right of the runway center-
This condition was to simulate the maneuver that would be
The second major correction which was needed to line up with the runway center- line appeared to be the most critical and difficult to execute properly, since another bank angle of approximately 15" was needed. However, the airplane was close enough to the ground to cause some apprehension. The tendency was to hold about 50 feet of altitude until the airplane was on or close to the centerline of the runway. was then eased down toward the runway. The airplane was not allowed to touch down; however, it appeared that the maneuvering necessary to line up would have resulted in a touchdown approximately 4500 to 5000 feet down the runway. The rapid control inputs necessary to make the required corrections caused yaw oscillations of close to 2". The airplane accelerated slowly but satisfactorily during the military power go-around. The handling characteristics for the offset maneuver were rated 4 and were based on the difficulty in correcting to the centerline, the adverse-yaw characteristics, and the required rapidity of corrections due to the high approach and flare speed.
The airplane
2 1
APPENDM
The second approach was lined up 200 feet to the right of the runway centerline and was very similar to the f i rs t , except that the approach speed was reduced slightly since the gross weight was lower (fuel weight, 155,000 pounds). The 3 O approach angle used did not seem to make any noticeable difference in the maneuver, since the approach angle was slightly reduced after initiating the correction toward the centerline. was required to allow ground clearance during the maneuvering. The airplane became lined up on the runway centerline 2500 to 3000 feet down the runway, and touchdown would have probably occurred 4000 to 4500 feet down the runway. Yaw angles during the maneuvering were very similar to the first approach, and the handling characteris- tics were again rated 4. Military power was satisfactory for the go-around.
This
The third approach was flown with all FACS off and again using the ground light source for establishing a 3" approach angle. 140,000 pounds, and the flare speed computed a s 215 knots. The approach was flown at 230 knots, and the offset was established at 200 feet to the left instead of to the right as on the previous approaches. Considerably more yaw oscillations were noted during this FACS off approach. The light and occasionally moderate turbulence encountered in the XB-70 (reported as only a trace of turbulence in the chase TB-58) seemed to have a greater effect on the handling qualities with the FACS off. Yaw oscillations reached 3 O during some combination of turbulence and lateral-control inputs. During the correction to the centerline, the tendency to overcontrol laterally was greater with FACS off, and some oscillation in bank angle and yaw was apparent. The runway distance required, however, was about the same as for the two previous runs. The airplane could have been landed approximately 4500 feet down the runway. The handling characteristics were rated 5.5. primarily to the increased lateral-control workload and the increased yaw excursions. The cross-cockpit view of the runway when correcting from the left-side offset caused no detectable difference in ability to see the runway o r position the airplane in the desired location.
The total fuel was down to approximately
The deterioration in rating was due
The final approach and landing were flown by the pilot (left seat). Total fuel remaining was 50,000 pounds, and the flare speed was computed a s 193 knots. A 3 O
approach angle was flown by using the external light source positioned 800 feet down and alongside the runway. The airplane was held on the 3 " approach angle until approxi- mately 150 feet above the ground. At that time, power was reduced slightly and the approach angle steepened slightly to cause the touchdown to be on the first part of the runway. Chase altitude callouts were not utilized; however, a t approximately 30 feet above the ground, the airplane was flared. When the flare was felt to "take hold, I f
the power was reduced to idle, Touchdown was smooth and occurred approximately 1700 feet down the runway. The ground effect of the XB-70 is very good and makes the landing characteris tics excellent. The time between flare and touchdown was noticeably shorter on the 3" approaches than on flatter approaches. Whereas on flat approaches, airspeed indications during the flare and at touchdown have generally been observed, the airspeeds were not noted during the steeper flares and touchdowns because of the short time span.
Heavyweight landing-approach offset maneuvers will cause the touchdown point to be 4000 to 5000 feet down the runway because of the maneuvering characteristics and the high approach speeds.
22

APPENDIX
The ground cushion (ground effect) of the airplane allows smooth touchdowns to be accomplished easily even with a 3" approach angle. The time between flare and touch- down was noticeably shorter on the steeper approaches than on the shallow approaches used on most previous XB-70 landings.
Flight 73, Pilot A
Landing approaches. - The turn to f ind approach was made over the center of Rosamond Dry Lake at 235 to 240 KIAS at an indicated altitude of 4500 feet. The approach light could be seen at this point, but the color could not be identified. The tower reported that the wind was calm. The 4500-foot altitude was maintained to the east edge of Rosamond Dry Lake where the white sector of the approach light was identified and the approach initiated with the cockpit camera and data on. The approach speed varied between 225 and 230 KIAS, and the tendency was to hold slightly high in the amber sector. quick and positive identification. was 10" and the approach speed was 230 KIAS. The data were evented at the center taxiway. A right turn to downwind for the next approach was initiated. Two main observations were: (1) holding a 3" glide slope at this approach speed and using this approach light was difficult; and (2) transition from the approach to flare at the thresh- old was done with much less comfort than from the 1 1/2" to 2" glide slopes which I prefer with a big, heavy airplane. In short, I did not like the 3" glide-slope approach at the weight and speed flown. The chances of misjudging height in the flare, even under day and good weather conditions, are too great and could easily result in a hard landing o r long touchdown. At lighter gross weights and much slower speeds, I might be more receptive to the 3" glide-slope approach for the XB-70.
The amber and red of the approach light are too similar to permit On the approach to the threshold, the angle of attack
The next 3" glide-slope landing approach to runway 04, with a 200-foot lateral offset to the left of centerline, was initiated from a right-hand closed traffic pattern. The approach light could be seen, but the color was not distinguishable at 4500 feet over the east edge of Rosamond Dry Lake. The tower reported the runway wind calm. sector of the approach light was clearly identified. The intention and attempt was to fly the final approach dined with the runway distance markers to the left of the runway. The approach speed was 225 KIAS, with a rate of descent once observed at 2000 feet per minute. It was difficult to stay in the white sector of the approach light; I again had a tendency to ride high in the amber sector. threshold, I dropped in the red sector, but at one-half mile, where the lateral sidestep was performed, I was up and on the 3" glide slope. The initial offset was greater than 200 feet, but near the 2-mile point the alinement to the left was near optimum. At the threshold, on the 3" glide slope, at 225 KIAS the lateral sidestep maneuver to the right was performed. 3.5. permit landing near the normal touchdown point. 5 to 15 feet of the runway, and the data were evented at the center taxiway at 235 KIAS with a fuel totalizer of 134,000 pounds.
The best flare speed was 214 KIAS. At an indicated altitude of 4000 feet, the white
At approximately 1 mile from the
The lateral maneuver to aline with the runway was not difficult-rated However, the combination of alinement and descending to the runway would not
The approach was continued to within
The most significant observation was that the touchdown would have been between 5000 and 6000 feet down from the approach end of the runway. I certainly would not care to be confronted with a 3" glide-slope instrument approach and, after breakout at the threshold, be required to perform a lateral sidestep to d ine with the runway before
23

APPENDIX
allowing the airplane to slow and settle to touchdown. If I were confronted with this on actual instruments, I would execute a missed approach. If fuel did not permit this, I would hope for a long runway and thrust reversers. Handling the airplane is no big problem, but the runway sacrificed, at 225 KIAS, to achieve a satisfactory touchdown attitude is unacceptable.
slowentry, uncoordinated (aileron only), 20" banked turn to t he right was initiated to make a 20" heading change. The roll-out was also uncoordinated, and, although faster than the entry, the desired heading was overshot by 4". The speed and altitude were virtually unchanged throughout the maneuver. Again, with FACS on, a slow entry, coordinated turn was initiated to the left. Left rudder was applied to hold zero yaw, and again the heading was overshot by 2". The airspeed increase was 2 knots with a loss of 100 feet of altitude. My opinion after these two turns was that 20" banks are excessive for precision 20" heading changes, and the coordinated turn is more difficult and less precise than the uncoordinated maneuver.
The FACS was turned off, and an uncoordinated right turn was established. The aim bank angle of 15" was overshot by 3". A fast, uncoordinated roll-out was accom- plished on the desired heading. An 18" bank, coordinated left turn was initiated, and, as left rudder was applied to zero the yaw needle, the bank angle increased to 22". Attention to bank angle and yaw caused a heading overshoot of 3" in spite of the fast roll-out. At constant power the speed had dropped 5 knots, with an altitude increase of 100 feet. The overall comment remained: coordination requires excessive attention, results in larger yaw excursions than uncoordinated turns, and is more trouble than it is worth for 20" heading changes. off was 2.5. The coordinated turns were rated 4.5.
Lateral-directional maneuvers at 190 KIAS and 15,000 feet. -With FACS on, a
Rating for the uncoordinated turns both FACS on and
General comments. - Three-degree glide-slope approaches are unacceptable for normal operation of an aircraft of the size and weight of the XB-70. Instrument and night approaches for an aircraft of this size, at the high approach speeds (200 to 220 KIAS), should be made on 2" to 2.5" glide slopes.
The high-speed, 200-foot, lateral-offset approach illustrated that the touchdown point would have been 5000 to 6000 feet down the runway.
Flight 73, Copilot B
Vertical-offset ILS approach. -A vertical-offset ILS approach to runway 22 was flown from the copilot seat at a gross weight of approximately 390 , 000 pounds. maneuver was an attempt to assess the ability to descend to and intercept a normal ILS glide slope after crossing the usual intercept point (outer marker) at a higher- than-prescribed altitude. At Edwards the altitude at the outer marker should normally be 2300 feet above the runway elevation; however, for this test the altitude at the outer marker was 3150 feet above the runway elevation. miles from the runway. rate of descent was established to allow interception of the glide slope. 225 KIAS. The excellent longitudinal control and thrust response allowed the airplane to be easily established on the glide slope at a point 1000 feet above the ground and 3.0 nautical miles before reaching the runway (4.0 nautical miles after passing the outer marker). The normal ILS approach was continued until over the runway. was rated 2 for this maneuver.
This
The outer marker is 7 .0 nautical After reaching the outer marker, a slightly higher than normal
Aim speed was
The airplane
24

APPENDIX
Flight 74, Pilot C
Heavyweight characteristics. - The control response in pitch and roll is very good, with no noticeable changes over a lightweight situation. The damping provided with SAS on is good, and only slight excursions in sideslip that occurred with adverse yaw and turbulence were noticeable. The longitudinal characteristics were rated 1.5, roll characteristics 2.0, and yaw characteristics 2.5. One of the more favorable charac- teristics of the XB-70 in the longitudinal axis in this configuration is the "speed stability" or ability to tr im to and hold a given airspeed. response is another very desirable characteristic. weight is low enough to allow operation below military power. positive also, but speeds and weights that require power adjustments between military power and minimum afterburner are awkward and usually result in several engines in afterburner and the others at military or slightly below.
The very positive thrust This is especially t rue when the
Afterburner response is
A characteristic of the XB-70 in the landing configuration that is not related to heavyweight operation only is the visibility and horizon picture or reference to the pilot. With the nose-high attitude characteristics of low-speed flight, the pilot's pitch-attitude reference is poor and his judgment of altitude o r change in attitude by visual reference is difficult; thus, a great deal of time is required for instrument scan o r reference within the cockpit.
Landing. - The fuel was burned off to 130 , 000 pounds , which gave a total vehicle weight of about 400,000 pounds. Lakebed runway 18, north lakebed, was selected for landing. primary attitude control task was in roll, in that some effort was required to keep the wings level in turbulence. Speed control was good. The aircraft weight on final approach called for a best flare speed of 212 KIAS. Touchdown was made at approxi- mately 195 KIAS.
The approach and landing were made in light-to-moderate turbulence, and the
Flight 75, Pilot D, Copilot A
Approach and landing. - Pilot D completed two low approaches with fuel totals of 39,000-and 29,000 pounds. While in the pattern, the TB-58 chase crew reported con- tinuous light, with occasionally moderate , turbulence; the XB-70 crew considered the turbulence continuous moderate and occasionally heavy. The cockpit ride was rough. The wind was 250" to 280" at 20 knots with gusts to 32 knots. appeared to be 5" to 7".
The drift on final
Pilot D completed the final landing. The fuel remaining on base leg was 23,000 pounds. Best flare speed was computed at 186 KIAS; however, because of the gusty surface winds, 210 knots was selected as a minimum final-approach speed. On final approach the left drift was very difficult to kill, and anything close to precise air- speed control seemed next to impossible to achieve. gusty crosswind was considered to be very difficult. demands were lessened closer to the ground; in other words, it appeared that ground effect was a definite help during flare and touchdown.
The overall landing task in the The rough ride and flight control
Touchdown was within the first 2000 feet of the runway.
25

APPENDIX
First landing-initial impression. - In overall consideration of the landing task in the existing wind conditions, the pilot gave the XB-70 a Cooper rating of 6.5 for those conditions a t Edwards A i r Force Base. The same characteristics under similar con- ditions but with the requirement of all-weather operations at a variety of airfields would lower the rating to 8.
Observations and comments.- Cockpit ride at low level was rough and uncomfortable in the moderate and occasionally heavy turbulence experienced. The overall landing task in the conditions of a gusty crosswind 30" to 60" off the runway at 20 knots, gusting to 32 knots, was considered to be very difficult. The pilot rated the difficulty suffi- ciently great to warrant proceeding to an alternate airfield without even attempting to approach with similar surface wind conditions if the destination airport were other than Edwards and had poor weather ceilings and/or visibilities.
Flight 78, Pilot B
Descent, low approach, and landing.- Gear extension was made at 25,000 feet.
With 35,000 pounds of fuel remaining, the normal flare speed was computed as 189 knots. Because of a request by Boeing for lower speed approaches, this approach was flown at 185 knots on a 3" glide slope. There was a noticeable decrease in over- the-nose visibility on the final approach. The most significant item, however, was the reduction in speed stability. Considerably more elevator motion and throttle manipu- lation was required to hold the glide slope and the desired airspeed. After descending to approximately 20 feet above the runway, a go-around was made. The acceleration and climbout were normal.
Flight 79, Pilot B
Descent, low approaches, and landings .- After descending to the pattern, the fuel remaining was 50,000 pounds, and the normal flare speed for that weight was 193 KIAS. The approach was a low-speed approach flown from the copilot seat at 185 KIAS. A 3" approach angle was established by using the light source located along the left side of the runway, 800 feet from the approach end. The approach speed of 185 knots, which was 8 knots below the normal flare speed, caused the airplane nose to be higher than normal. The light source along the runway could not be readily seen from the copilot's seat without moving the head outboard to improve over-the-nose visibility. Visibility was rated 5 under this condition. Speed stability was rated 4.5 because of the elevator and throttle attention required to hold the speed constant. The decrease in final- approach speed caused no detectable change in lateral-directional characteristics. The airplane was flown down to approximately 20 feet above the runway before initiating the go-around. handling qualities appear to be acceptable for accomplishing a landing from a 185-knot approach.
The speed increase was immediate when power was advanced. The
A touch-and-go landing (at normal approach speeds) was performed from the copilot's seat with 41,000 pounds of fuel remaining, and a final- (landing) approach speed of 205 knots. in speed stability.
There was a marked improvement in over-the-nose visibility and
26

APPENDIX
Miscellaneous Comments
Pilot A.- Three-degree landings with the XB-70 at Edwards at high gross weight, rated 5, based primarily on high degree of skill required and small margin for e r ror , rapid closure rate, little time for decision, everything has to come out all right a t the same time. I am afraid of a hard landing, and am not aware of strong ground cushion. My rating is based primarily on the longitudinal task posed by the high descent rate. For an operational situation, considering weather and/or night flying, I would rate it 7. If the airplane were slower, might rate it better.
I feel that if we had 8 to 10 pilots flying 3" glide slopes in the XB-70 program we would exceed 8 ft/sec sink rate before the end of the program. Present success is due to carefully controlled pilot group.
Pilot B.- VFR approaches, FACS on, longitudinal pilot rating of 2, lateral- directional pilot rating of 4, longitudinal rating based primarily on speed control.
Three-degree-glide-slope landings afford better visibility than "normal" approach angles.
Heavyweight approaches a r e similar to lightweight approaches in speed stability and control response. Increased speed is another factor, however.
Although 3 " approaches at 205 to 210 knots a re rated 2 for longitudinal characteris- tics, I might rate i t 4.5 for an airline operational situation because of the high approach speed.
27

REFERENCES
1.
2.
3.
4.
5.
6.
7.
8.
9.
10.
Bray, Richard S. : A Piloted Simulator Study of Longitudinal Handling Qualities of Supersonic Transports in the Landing Maneuver. NASA TN D-2251, 1964.
Condit, Philip M. ; Kimbrel, Laddie G. ; and Root, Robert G. : Inflight and Ground- Based Simulation of Handling Qualities of Very Large Airplanes in Landing Approach. Boeing Company (NASA CR-635), 1966.
Staff of the Langley Research Center: Determination of Flight Characteristics of Supersonic Transports During the Landing Approach With a Large Jet Transport In-Flight Simulator. NASA TN D-3971, 1967.
Wolowicz, Chester H. ; Strutz, Larry W. ; Gilyard, Glenn B. ; and Matheny, Ne i l W. : Preliminary Flight Evaluation of the Stability and Control Derivatives and Dynamic Characteristics of the Unaugmented XB-70 -1 Airplane Including Com- parisons With Predictions. NASA TN D-4578, 1968.
Anon. : AFFTC Test Facilities Handbook. Section V. FTC -TlH-63-2003, Air Force Flight Test Center, U. S. Air Force.
Harper, Robert P. , Jr. ; and Cooper, George E. : A Revised Pilot Rating Scale for the Evaluation of Handling Qualities. AGARD Conference Proceedings 17 , Stability and Control - Part 1, Sept. 1966, pp. 227-245.
Teper, Gary L. : Aircraft Stability and Control Data. Systems Technology, Inc. (NASA CR 96008), Apr. 1969.
Perry, D. H. : A Piloted Flight Simulator Study of Speed Instability During the Landing Approach. Tech. Rep. No. 66138, British R. A. E. , Apr. 1966.
Ashkenas, Irving L. ; and McRuer, Duane T. : The Determination of Lateral Handling Quality Requirements From Airframe -Human Pilot System Studies. WADC Tech. Rep. 59-135, (Contract No. AF33(616)-5661), Wright A i r Dev. Center, U. S. A i r Force, June 1959. (Available from ASTIA as AD 212152. )
Perry, D. H. ; Port, W. G. A. ; and Morrall, J. C. : A Flight Study of the Side- step Manoeuvre During Landing. R. & M. No. 3347, British A. R. C. , 1964.
28
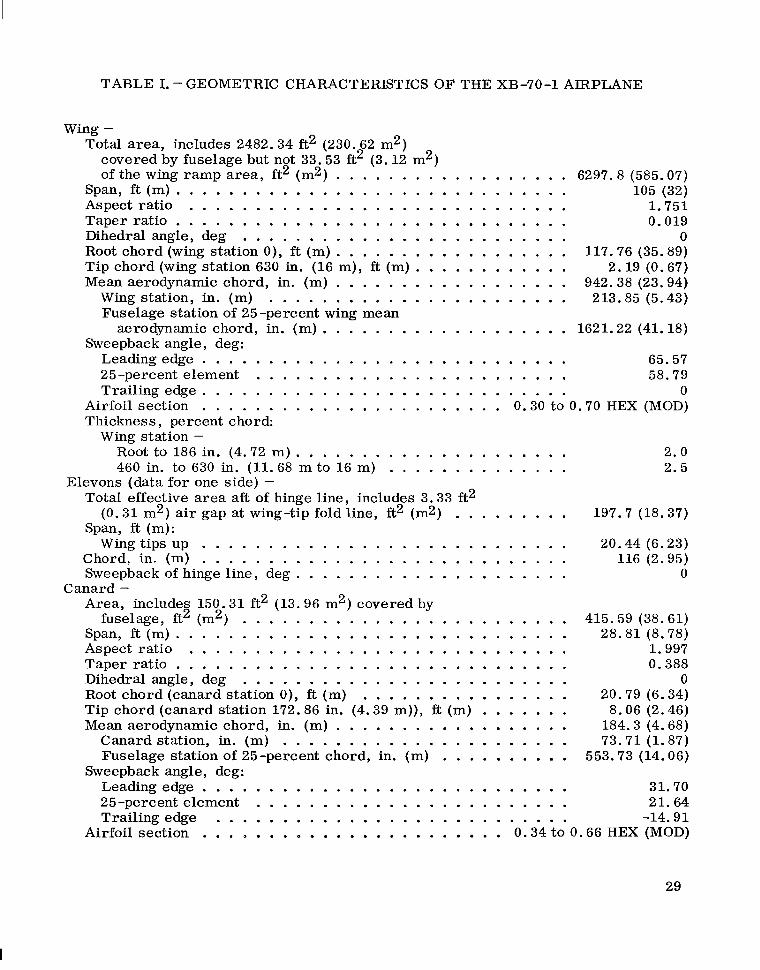
TABLE I. - GEOMETRIC CHARACTERISTICS OF THE XB-70-1 AIRPLANE
Wing - Total area, includes 2482.34 ft2 (230.62 m2)
covered by fuselage but not 33.53 ft2 (3.12 m2) of the wing ramp area, ft2 (m2) . . . . . . . . . . . . . . . . . . 6297.8 (585.07)
Span, f t ( m ) . 105 (32) . . . . . . . . . . . . . . . . . . . . . . . . . . . . . Aspect ratio . . . . . . . . . . . . . . . . . . . . . . . . . . . . . 1.751 Taper ratio . . . . . . . . . . . . . . . . . . . . . . . . . . . . . . 0.019 Dihedral angle, deg . . . . . . . . . . . . . . . . . . . . . . . . . 0 Root chord (wing station 0 ) , ft (m) . . . . . . . . . . . . . . . . . . 117.76 (35.89) Tip chord (wing station 630 in. (16 m), ft (m) 2.19 (0.67) Mean aerodynamic chord, in. (m) . . . . . . . . . . . . . . . . . . 942.38 (23.94)
Wing station, in. (m) . . . . . . . . . . . . . . . . . . . . . . . 213.85 (5.43) Fuselage station of 25-percent wing mean
. . . . . . . . . . . .
aerodynamic chord, in. (m) . . . . . . . . . . . . . . . . . . . 1621.22 (41.18)
Leading edge . . . . . . . . . . . . . . . . . . . . . . . . . . . . 65.57 25 -percent element . . . . . . . . . . . . . . . . . . . . . . . . 58.79 Trailing edge . . . . . . . . . . . . . . . . . . . . . . . . . . . . 0
Sweepback angle, deg:
Airfoil section . . . . . . . . . . . . . . . . . . . . . . . 0.30 to 0.70 HEX (MOD) Thickness , percent chord:
Wing station - Root to 186 in. (4.72 m) . . . . . . . . . . . . . . . . . . . . . 2.0 460 in. to 630 in. (11.68 m to 16 m) . . . . . . . . . . . . . . 2.5
Total effective area aft of hinge line, includes 3.33 ft2 197.7 (18.37)
Span, ft (m):
Chord, in. (m) . . . . . . . . . . . . . . . . . . . . . . . . . . . . 116 (2.95) Sweepback of hinge line, deg . . . . . . . . . . . . . . . . . . . . .
Elevons (data for one side) -
(0.31 m2) a i r gap at wing-tip fold line, ft2 (m2) . . . . . . . . . Wing tips up . . . . . . . . . . . . . . . . . . . . . . . . . . . . 20.44 (6.23)
0 Canard -
Area, includes 150.31 ft2 (13.96 m2) covered by
Span, ft (m) . . . . . . . . . . . . . . . . . . . . . . . . . . . . . . fuselage, ft2 (m2) . . . . . . . . . . . . . . . . . . . . . . . . . 415.59 (38.61) 28.81 (8.78)
Aspect ratio . . . . . . . . . . . . . . . . . . . . . . . . . . . . . 1.997 Taper ratio . . . . . . . . . . . . . . . . . . . . . . . . . . . . . . 0.388 Dihedral angle, deg . . . . . . . . . . . . . . . . . . . . . . . . . 0 Root chord (canard station 0 ) , ft (m) . . . . . . . . . . . . . . . . 20.79 (6.34) Tip chord (canard station 172.86 in. (4.39 m)), ft (m) . . . . . . . 8.06 (2.46) Mean aerodynamic chord, in. (m) . . . . . . . . . . . . . . . . . . 184.3 (4.68)
Sweepback angle, deg:
Canard station, in. (m) . . . . . . . . . . . . . . . . . . . . . . 73.71 (1.87) Fuselage station of 25-percent chord, in. (m) . . . . . . . . . . 553.73 (14.06)
Leading edge . . . . . . . . . . . . . . . . . . . . . . . . . . . . 31.70 25-percent element . . . . . . . . . . . . . . . . . . . . . . . . 21.64
Airfoil section . . . . . . . . . . . . . . . . . . . . . . . 0.34 to 0.66 HEX (MOD) Trailing edge -14.91 . . . . . . . . . . . . . . . . . . . . . . . . . . .
29

TABLE I. -GEOMETRIC CHARACTERISTICS OF THE XB-70-1 AIRPLANE - Concluded
Thickness chord ratio, percent: Root . . . . . . . . . . . . . . . . . . . . . . . . . . . . . . . . 2.5 Tip . . . . . . . . . . . . . . . . . . . . . . . . . . . . . . . . . 2.52
Ratio of canard area t o wing area 0.066
Area (aft of hinge line), ft2 (m2) . . . . . . . . . . . . . . . . . . 54.69 (5.08) Inboard chord canard station 47.93 in. (1.22 m), f t (m) 7.16 (2.18) Outboard chord canard station 172.86 in. (4.39 m), f t (m) . . . . . 3.34 (1.02) Ratio of flap area to canard semiarea . . . . . . . . . . . . . . . . 0.263
Area (includes 8.96 ft2 (0.83 m2) blanketed area), ft2 (m2) . . . . 233.96 (21.74) Span, f t ( m ) . . . . . . . . . . . . . . . . . . . . . . . . . . . . . . 15 (4.57) Aspect ratio . . . . . . . . . . . . . . . . . . . . . . . . . . . . . 1 Root chord (vertical-tail station 0 ) , ft (m) . . . . . . . . . . . . . 23.08 (7.03) Tip chord (vertical-tail station 180 in. (4.57 m)), f t (m) . . . . . . 6.92 (2.11) Taper ratio . . . . . . . . . . . . . . . . . . . . . . . . . . . . . . 0.30 Mean aerodynamic chord, in. (m) . . . . . . . . . . . . . . . . . . 197.40 (5.01)
Vertical -tail st ation, in. (m) 73.85 (1.88) Fuselage station of 25-percent chord . . . . . . . . . . . . . . . 2188.50 (55.59)
Canard flap (data for one side) -
. . . . . .
Vertical tail (one of two) -
. . . . . . . . . . . . . . . . . . . Sweepback angle , deg:
Leading edge . . . . . . . . . . . . . . . . . . . . . . . . . . . . 51.77 25-percent element . . . . . . . . . . . . . . . . . . . . . . . . 45 Trailing edge. . . . . . . . . . . . . . . . . . . . . . . . . . . . 10.89
Airfoil section . . . . . . . . . . . . . . . . . . . . . . . 0.30 to 0.70 HEX (MOD) Thickness chord ratio, percent:
Root . . . . . . . . . . . . . . . . . . . . . . . . . . . . . . . . 3.75 Tip . . . . . . . . . . . . . . . . . . . . . . . . . . . . . . . . . 2.50
Cant angle, deg . . . . . . . . . . . . . . . . . . . . . . . . . . . 0 Ratio of vertical tail to wing area . . . . . . . . . . . . . . . . . . 0.037
191.11 (17.76)
Root chord, vertical-tail station 0, ft (m) . . . . . . . . . . . . . 9.16 (2.79) Tip chord, vertical-tail station 180 in. (4.57 m), f t (m) 6.92 (2.11) Sweepback of hinge line. . . . . . . . . . . . . . . . . . . . . . . . -45.0 Ratio of rudder area to vertical-tail area . . . . . . . . . . . . . . 0.82
Length, f t (m) . . . . . . . . . . . . . . . . . . . . . . . . . . . . 185.75 (56.62) Maximum depth (fuselage station 878 in. (22.30 m)), in. (m) . . . 106.92 (2.72) Maximum breadth (fuselage station 855 in. (21.72 m)), in. (m) . . 100 (2.54)
Planform area, f t (m ) . . . . . . . . . . . . . . . . . . . . . . .1184.78 (110.07)
(approximate), ft (m) . . . . . . . . . . . . . . . . . . . 35 to 40 (10.7 to 12.2)
Rudder - Area, includes 8.66 ft2 (0.81 m2) blanketed area, ft2 (m2) . . . . Span, f t ( m ) . . . . . . . . . . . . . . . . . . . . . . . . . . . . . . 15.00 (4.57)
. . . . . .
Fuselage (includes canopy) -
Side area, ft2 (m2 2 . >. . . . . . . . . . . . . . . . . . . . . . . . Height of cockpit above ground at touchdown
939.72 (87.30)
30

TABLE 11.-XB-70 INSTRUMENTATION PERTINENT TO LANDING-APPROACH STUDIES
I
Sensor location Accuracy, Sampling
range per sec Water percent full Transducer range rate, Fuselage Buttock Parameter
stat ion, plane , Plane , in. (m) in. (m) in. (m)
Central air-data system altitude (coarse)
Central air-data system altitude (fine)
Central air-data system airspeed (coarse)
Central air-data system airspeed (fine)
Angle of attack Angle of sideslip Pitch attitude Bank attitude Pitch rate Roll rate Yaw rate Normal acceleration Transverse acceleration Left-hand canard position Left-hand vertical -stabilizer
Right -hand vertical-stabilizer
Position of individual elevon
position
position
segment
80 (2.03)
80 (2.03)
80 (2.03)
80 (2.03)
92 (2.34) 121 (3.07)
1415 (35.94) 1415 (35.94) 1404 (35.66) 1404 (35.66) 1404 (35.66) 1485 (37.72) 1486 (37.74) - - - - - - - - - - ---- ------
---- ------
- - - - - - - - - -
14 (0.36)
14 (.36)
14 (.36)
14 (.36)
20 (.51) 13 (.33)
-64 (-1.63) -64 (-1.63) -64 (-1.63) -64 (-1.63) -64 (-1.63) -71 (-1.80) -37 (-.94) --_ ------ --_ ------ --_ ------ --_ ------
2.0
1.0
2 .0
2 . 0
. 8
. 8 2.0 2 .0 2 .0 2 .0 2.0 2 .0 2 .0 2.0 1 . 0
1 . 0
1.2
-1000 to 100,000 ft (-305 to 30,480 m)
(152.4 m/rev) 5000 ft/rev
50 to 800 knots
70 knots/rev
-10" to 30" k20" -10" to 40" k45" & l o deg/sec &lo0 deg/sec k10 deg/sec h2g k1g 0" to 6" 512"
k12"
k30"
40
40
40
40
20 20 20 20 20 20 20 20 20 20 20
20
20
w I-'

TABLE 111. -RECOMMENDED XB-70 FINAL-APPROACH, FLARE, AND MINIMUM TOUCHDOWN SPEEDS
Gross weight, 1b (kg)
450,000 (204,000) 400,000 (181,000) 380 , 000 (172 , 000) 360,000 (163,000) 340,000 (153,000) 320 , 000 (144,000) 310,000 (140,000) 300,000 (136,000) 290,000 (131,000) 280,000 (126,000)
Final -approach speed, KIAS
235 224 2 19 2 15 2 10 204 202 199 196 193
Flare speed, KIAS
22 5 2 14 209 205 200 194 192 18 9 186 183
Minimum touchdown speed, KIAS
209 198 193 189 184 178 175 173 170 167
Note: Landing-pattern speeds were: downwind, f lare speed plus 50 knots; base leg, flare speed plus 30 knots; final approach, f lare speed plus 10 knots.
32

TABLE IV.-SUMMARY O F XB-70 TEST CONDITIONS
[Center of gravity = 23.5 percent C] (a) Full-stop landings.
'light
50 5 1 53 55 56 57 58 59 60 6 1 62 63 64 65 66 67 68 69 70 7 1 72 73 74
75 76 77 78 79
:light
70 72 73 76 79
lb
295 x 103 305 301 295 290 295 292 295 300 390 291 292 290 293 293 285 305 284 298 294 3 10 2 94 393
292 294 295 298 300
kg
134 x 103 138 136 134 132 134 132 134 136 177 132 132 132 133 133 129 138 129 135 133 141 133 178
132 133 134 135 136
304 x 103 328 298 298 3 10
138 x 103 149 135 135 141
vapr
KIAS
2 10
220 202 2 12 202 2 10 225 202 230 200 200 2 10 2 10 2 10
205 200 203 2 12 205 202 2 30
2 10 206
_ _ _
_ _ _
- _ _ _ _ _ 200
'td'
:US
174 175 173 174 175
177 180 180 198 170
170 165 180 155 186 173 188 172 185 172 195
183 178 180 180 175
- _ _
_ _ _
Rate 1
t/sec _ _ _ _ _ _ _ _ _ 1.9 2.5
1.6 1.0
.9
.9
_-_
_--
--- _ _ _ _ _ _ _ - _ _-- 2.4
3.2 3.6 2.1 3.4
_ _ _
_ _ _
2.4 1.8 _ _ _ _ _ _ 2 .1
'ilot
~
A B B A B A A B B A B A B A B A B A B C B A C
D C B C D
~
Comments
Light turbulence
Crosswind Crosswind, light turbulence Lakebed landing
Light -to-moderate turbulence Lakebed landing Lakebed landing Lakebed landing 3" glide-slope approach light Lakebed landing 3" glide-slope approach light
3" glide-slope approach light 3" glide-slope approach light Lakebed landing, light -to -moderate
Crosswind, moderate-to -heavy turbulence turbulence
(b) Touch-and-go landings.
'apr.
KIAS
2 10 2 10 200 2 10 205
Vtd, I Rate of sink ~
a t touchdown KIAS ft/sec m/sec
182 187 180 176 168
2.3 1.5
. 8 4.3 2.4
0.70 .46 .24 1.3 .73
I Pilot Comments
C D B B B
3" glide-slope approach light 3" glide-slope approach light
33
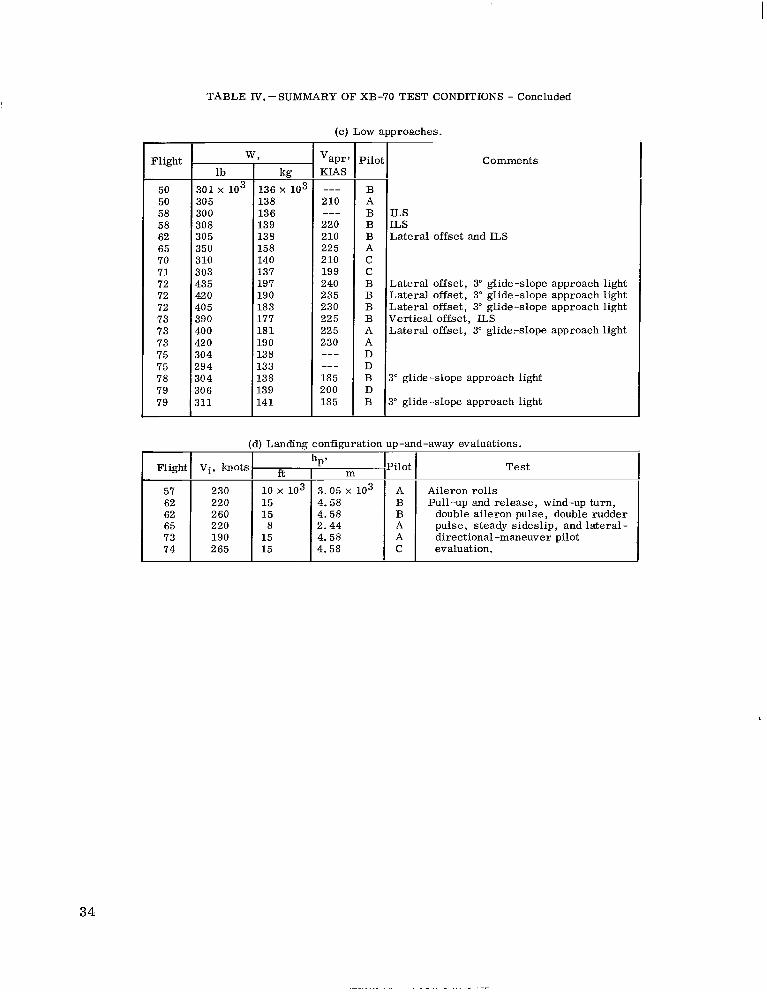
Flight
50 50 58 58 62 65 70 71 72 72 72 73 73 73 75 75 78 79 79
_ _ _ 210
220 210 225 210 199 240 235 230 225 225 230
__-
_ _ _ _ _ _ 185 200 185
I Flighi
B A B B B A c c B B B B A A D D B D B
I lij 74
TABLE IV. -SUMMARY OF XB-70 TEST CONDITIONS - Concluded
(c) Low approaches.
l b
301 lo3 305 300 308 305 350 310 303 435 420 40 5 390 40 0 420 304 294 30 4 306 311
v i , h o t s
230 220 2 60 220 190 2 65
kg 136 x 103 138 136 13 9 138 158 140 137 197 190 183 177 18 1 19 0 13 8 133 13 8 139 14 1
Comments
ILS IL s Lateral offset and ILS
Lateral offset, 3" glide-slope approach light Lateral offset, 3" glide-slope approach light Lateral offset, 3" glide-slope approach light Vertical offset, ILS Lateral offset, 3" glide.-slope approach light
3" glide-slope approach light
3" glide-slope approach light
(d) Landing configuration up-and-away evaluations.
15 15 8 15 15
m
3.05 103 4.58 4. 58 2.44 4.58 4. 58
- 'ilol
A B B A A C
-
-
I Tes t
Aileron rolls Pull-up and release, wind-up turn,
double aileron pulse, double rudder pulse, steady sideslip, and lateral- directional -maneuver pilot evaluation.
34
~~ . . . . - . . - . . . - .

TABLE V.- PILOT RATING SCALE (ref. 6)
SOME MINOR BUT ANNOYING D E F I C I E N C I E S . EFFECT ON PERFORMANCE I S E A S I L Y COMPENSATED FOR BY P I L O T .
IMPROVEMENT I S REQUESTED. Aq
A C C E P T A B L E
MAY HAVE D E F I C I E N C I E S WHICH WARRANT IMPROVEMENT, BUT ADEQUATE FOR MISS I ON.
P I L O T COMPENSATION, I F REQUl RED TO ACH I EVE ACCEPTABLE PERFORMANCE, I S FEASIBLE.
MANAGED I N CONTEX' OF M I S S I O N , WITH AVA I LABLE P I LOT ATTENT I ON
11 N A C C E P T A B L E
VERY OBJECTIONABLE D E F I C I E N C I E S . MAJOR IMPROVEMENTS ARE NEEDED. REQUIRES BEST A V A I L A B L E P I L O T COMPENSATION TO ACHIEVE ACCEPTABLE PERFORMANCE.
MAJOR D E F I C I E N C I E S WHICH REQUIRE MANDATORY IMPROVEMENT FOR ACCEPTANCE. CONTROLLABLE. PERFORMANCE INADEQUATE FOR MISSION, OR P I L O T COMPENSATION REQUIRED FOR MINIMUM ACCEPTABLE PERFORMANCE I N M I S S I O N IS TOO HIGH.
--------I-
CONTROLLABLE WITH D I F F I C U L T Y . AND ATTENTION TO RETAIN CONTROL AN0 CONTINUE MISSION.
REQUIRES SUBSTANTIAL P I L O T S K I L L
MARGINALLY CONTROLLABLE I N MISSION. P I L O T S K I L L AND LTTENTION TO RETAIN CONTROL.
REQUIRES MAXIMUM A V A I L A B L E
--------I-
UNCONTROLLABLE I N MISSION.
D E F l C l ENCl ES WHICH REQUIRE MANDATORY IMPROVEMENT. INADEQUATE PERFORMANCE FOR M I S S I O N EVEN WITH MAXIMUM F E A S I B L E P I L O T COMPENSATION.
~-
A6
u7
- uB
- u9
I O
S A T I S F A C T O R Y
lEETS A L L REQU I REMEN' IND EXPECTATIONS, GO1 iNOUGH WITHOUT IMPROVEMENT
;LEARLY AOEQUATE FOR (I SS I ON.
U N S A T I S F A C T O R Y
IELUCTANTLY ACCEPTAB ) E F I C I ENC I E S WHICH fARRANT IMPROVEMENT. 'ERFORMANCE ADEQUATE :OR M I S S I O N WITH .EAS I B L E P I LOT :OMPENSAT ION.
-I-
--- U N C O N T R O L L A B L E
CONTROL WILL BE LOST DURING SOME PORTION OF MISSION.
EXCELLENT, H IGHLY DESIRABLE A I
~ A2 GOOD, PLEASANT, WELL BEHAVED
FAIR . SOME M I L D L Y UNPLEASANT CHARACTERISTICS. GOOD ENOUGH FOR M I S S I O N WITHOUT IMPROVEMENT.
~ A 3
MODERATELY OBJECTIONABLE D E F I C I E N C I E S . IMPROVEMENT I S NEEDED. REASONABLE PERFORMANCE REQUl RES CONSIDERABLE P I LOT COMPENSATION.
w ul

w Q,
Rating
TABLE VI. - OVERALL PILOT RATING QUESTIONNAIRE
C o mme nt s Longitudinal mode
1 Lateral -directional mode
Trimmability -
angle Ability to hold heading and bank
Maneuverability - Ability to change heading and bank
angle
Response to turbulence
Overall
Control harmony
Trimmability - Ability to hold airspeed, altitude,
and attitude
Maneuverability - Ability to change airspeed, altitude
and load factor ~~
Response to turbulence
1 Response to configuration changes I I 1 Overall 13
I I I I

TABLE VII. - DETAILED PILOT QUESTIONNAIRE - LANDING-APPROACH MANEUVERS
LONGITUDINAL Ease and precision of making small angular correction
Technique Tendency toward pilot -induced oscillations
Stability - Does airplane stay at given pitch angle and airspeed? Tr im well defined? Does longitudinal response affect ability to locate t r im?
Tr im sensitivity
Response to throttle
Turns - Does nose drop in turns? Do you note anything unusual in pitch attitude in a turn?
Forces (level of force)
Gradient
Friction
Suit ability
Stick travel - Suitability?
LATERAL
Ease of initiating turn
Technique Ease of stopping turn on heading
Technique Roll authority
Start lateral roll correction
Stop lateral roll correction
Change heading Pick up wing
Lag - t ime to respond
Tendency to overshoot and oscillate
What control is used for making a heading change? What instrument is used?
ILS TASK Ability to hold altitude (straight and level, in turns)
37

TABLE VII. - DETAILED PILOT QUESTIONNAIRE - LANDING-APPROACH MANE WERS - Concluded
Technique:
Elevator Throttle Elevator and throttle Trim
Why : What is aggravating? What is good?
Ability to establish rate of descent (straight and level, in turns)
How do you do i t ?
Why this way? What aggravates ? What is good?
Ability to hold rate of descent (straight and level, in turns) Technique:
E lev at0 r Throttle Elevator and throttle Trim
Why : What aggravates ?
Ability to hold heading
Prior to localizer intercept What instruments used for intercept? Trim
On localizer (straight and level and during descent) Trim
Are you rushed for time anywhere during approach?
Do you tend to oscillate the airplane in: Where ? Why?
(a) Altitude (b) Attitude (c) Heading (d) Airspeed
How do you stop an oscillation?
FLARE How do you flare the airplane?
Where do you initiate flare? Why?
What is good?
Does the flare require different technique o r different emphasis of technique? How? Why ?
Do you misjudge the flare? How ?
38

w W
Overall 2 , For airline operation 4.5,
1 Operation at Edwards 5. Weather and/or night flying
at conventional airports 7 . Ratings based primarily on
longitudinal task posed by high descent rate.
due to high approach speed.
TABLE VIII. - SUMMARY O F PILOT COMMENTS ON LONGITUDINAL CHARACTERISTICS
Speed held with throttle; elevator held glide slope. Speed and pitch control excellent, Approach appeared a little steep, but was comfortable, Landing is routine, but never as easy as 707 due to cockpit height. This can be coped with. Radar altimeter would enhance safety. The time between flare and touchdown noticeably shorter on steeper approaches. Ground cushion allows smooth touchdowns even with 3" glide slope.
Transition from approach to f lare done with much less com- for t than 1 1/2" glide slope. Chances of misjudging height in f lare a r e too great. The 3" glide slope unacceptable for normal operation at high approach speeds. A t lighter weights and much lower speeds, might be more receptive to 3" glide slope,
- Pilot Ratings Comments - Test
Shallow approaches and landings, y " -1.5", Vapr = 200 to
220 KIAS
3" glide-slope approaches, v = 200 to
220 KIAS, normal weight
aPr
3 O glide-slope approaches, Vapr = 225 to
235 KIAS, heavyweight
ILS approach with vertical offset, Vapr = 225 KIAS
Slow approach, y m -3"
Vapr = 185 KIAS
A
B
C
-
B
- A
B
B
B
-
Speed control 1 to 2. Longitudinal control 2 to 4. Height judgment 7.
Overall 2 (based primarily Excellent speed stability. Rapid engine response. A i r - on speed control).
Landings a r e easy and enjoyable. My biggest problem is judging height above the ground from
threshold to landing.
speed can be held easily within 2 knots.
down. 200 feet to touchdown. Control response very good. Very positive thrust response is very desirable.
Speed control i s good. Cushioning effect noted near touch- Pr imary problem is judgment of altitude from Overall 2.
~
Overall 2 1 Heavyweight approaches s imilar to normal weight in l o n ~ t u d i n a l control response.
Overall 2. Excellent longitudinal control and thrust response allowed airplane to be easily established on glide slope.
Visibility 5. Speed stability 4 to 4 .5
Noticeable decrease in over-the-nose visibility. Reduction in speed stability most significant. Con- siderably more elevator and throttle manipulation re- quired to hold glide slope and airspeed. Longitudinal response good. Handling qualities acceptable for landing.

TABLE E. - NOMINAL LANDING-APPROACH CHARACTERISTICS FOR THE XB-70 AND A SUBSONIC J E T TRANSPORT
~
w, 1b (kg)
Vapr, KIAS Center of gravity, percent C
q, lb/ft2 (N/m2) Trim CL
Trim a, deg Trim 6,, deg
w radians/sec SP’
5SP La, per sec
N Z a , g/radian
wd, radians/sec
[d -rr, sec
r s , sec
Wd Ix, slug-ft2 (kg-m2)
Iy, slug-ft2 (kg-m2)
I z , slug-ft2 (kg-m2)
Ixz, slug-ft2 (kg-m2)
- %
XB -70
300,000 (136,000) 23.5 205
143 (6850) 0.32
7 .5 10
1 .2
0.55
0.77
a. 2a
1.3
0 .13
0 .77
27
0.68
1 ,450 ,000 (1 ,960 ,000)
16 ,000 ,000 (21 ,700 ,000)
17 ,200 ,000 (23,300,000)
-600,ooo ( - a i3 ,000)
Subsonic jet transport (ref. 7 , DC-8)
190,000 (86,000) 15.0 144
7 1 (3400) 0.98
1 . 6
0.55
0 .63
4 .75
1 .0
0 . 1
0 . a 3
77
0.95
40

TABLE X. - XB -70 LANDING -APPROACH-CONFIGURATION STABILITY DERIVATIVES OBTAINED FROM FLIGHT
[Center of grav i ty = 23.5 percent E ; a, = 7.5"]
qgay P e r deg
C p e r deg '6r
CnPy p e r deg
cnPy p e r r ad ian
cnrY p e r r ad ian
c p e r deg
c p e r deg
C p e r deg
C p e r deg
nga
n6r
YP
'6,
1 per deg
Derivat ive
Cms+&, p e r rad ian
C p e r deg mge
C p e r deg I P
Cl p e r r ad ian
C p e r r ad ian P
1r
Value
0.048
1 . 0
0.008
-0.0039
-1.05
-0.0034
-0.0018
-0.15
0.02
0.00066
0.00001
0.0022
-0.08
-0.18
0.00008
-0.0011
-0.0032
-0.0011
0.0021
I
41
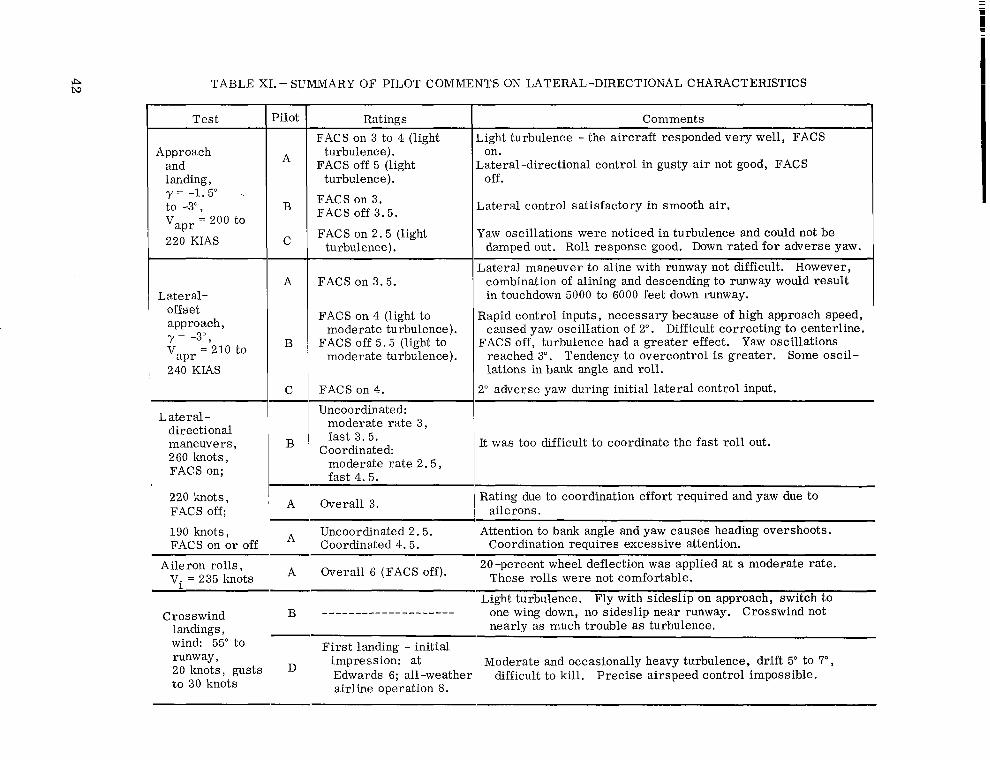
TABLE XI.- SUMMARY OF PILOT COMMENTS ON LATERAL-DIRECTIONAL CHARACTERISTICS
Test
Approach and landing, y = -1.5" . to -3",
220 KIAS
Vapr = 200 to
Lateral- offset approach, y = -3" Vapr = 210 to
240 KIAS
Lateral- directional maneuvers, 260 knots, FACS on;
Pilot
B
Ratings FACS on 3 to 4 (light
turbulence). FACS off 5 (light
turbulence).
FACS on 3. FACS off 3.5.
FAC S on 2.5 (light turbulence).
FACS on 3.5.
FACS on 4 (light to
FACS off 5 .5 (light to moderat e turbulence).
moderate turbulence).
FACS on 4.
Uncoordinated: moderate rate 3, fast 3.5.
Coordinated: moderate rate 2.5, fast 4.5.
' A Overall 3. 220 knots, - FACS off;
190 knots, A Uncoordinated 2.5. FACS on o r off Coordinated 4.5.
Comments Light turbulence - the aircraft responded very well, FACS
Lateral-directional control in gusty air not good, FACS on.
off.
Lateral control satisfactory in smooth air.
Yaw oscillations were noticed in turbulence and could not b damped out. Roll response good. Down rated for adverse yaw.
Lateral maneuver to aline with runway not difficult. However, combination of dining and descending to runway would result in touchdown 5000 to 6000 feet down runway.
Rapid control inputs, necessary because of high approach speed, caused yaw oscillation of 2". Difficult correcting to centerline.
FACS off, turbulence had a greater effect. reached 3". Tendency to overcontrol is greater. Some oscil- lations in bank angle and roll.
Yaw oscillations
2" adverse yaw during initial lateral control input.
It was too difficult to coordinate the fast roll out.
~~
Rating due to coordination effort required and yaw due to ailerons.
Attention to bank angle and yaw cause6 heading overshoots. Coordination requires excessive attention.
20 -percent wheel deflection was applied at a moderate rate.
Light turbulence. Fly with sideslip on approach, switch to
These rolls were not comfortable. A Overall 6 (FACS off). Aileron rolls, Vi = 235 knots -
B _ _ _ _ _ _ _ _ _ _ _ _ _ _ _ _ _ - - _ one wing down, no sideslip near runway. Crosswind not Crosswind landings, wind: 55" to runway , impression: at Moderate and occasionally heavy turbulence, drift 5" to 7", 2o gusts Edwards 6; all-weather difficult to kill, Precise airspeed control impossible. to 30 knots
nearly as much trouble as turbulence. - Firs t landing - initial
airline operation 8.
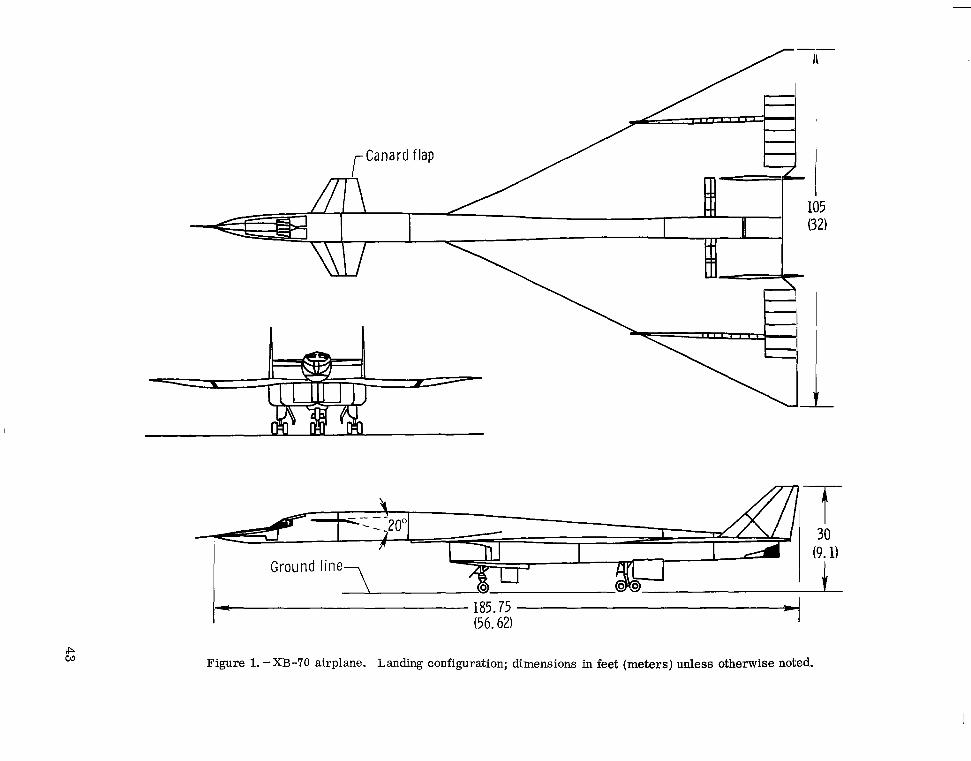
,-Canard flap
I - IUC. I 4
(56.62) -1
Figure 1. - XB-70 airplane. Landing configuration; dimensions in feet (meters) unless otherwise noted.
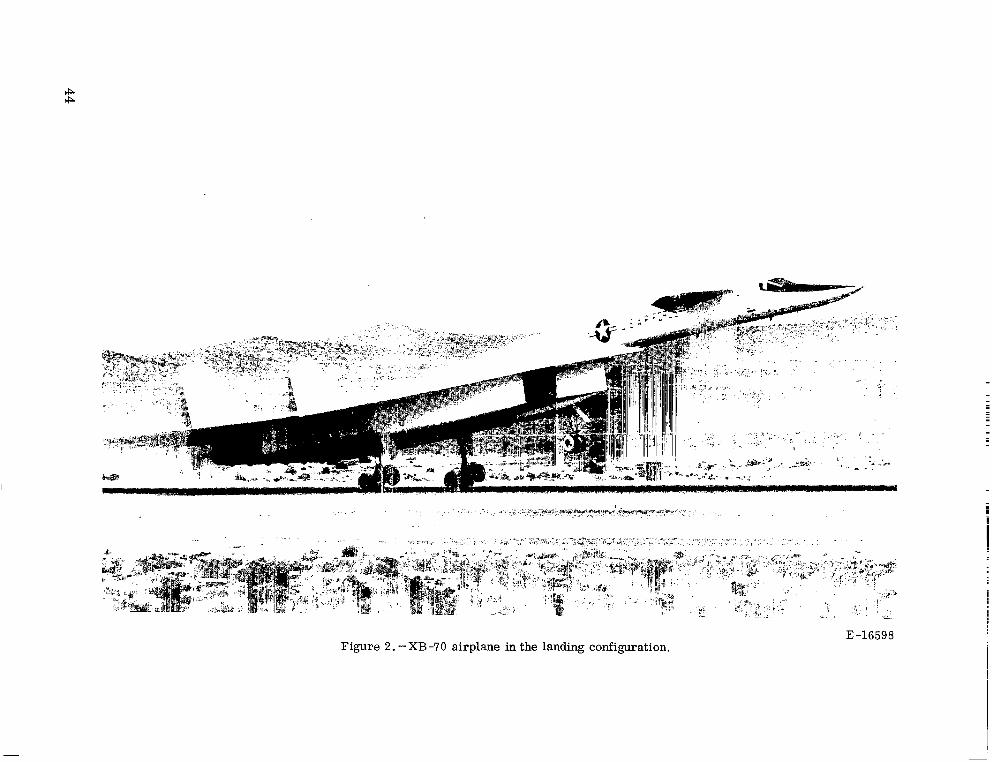
E-16598 Figure 2. -XB-70 airplane in the landing configuration.
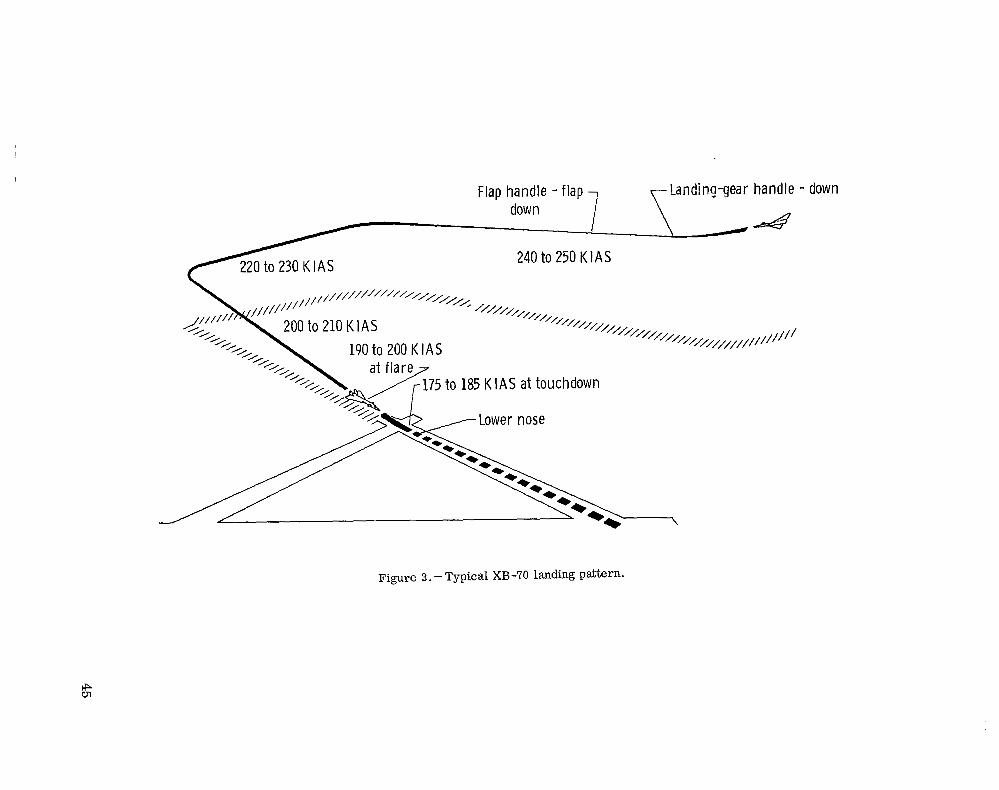
Flap handle - flap La n di n rj -g ea r ha n d 1 e -
- 4 9 down 7 \ 240 to 250 KIAS
down
Figure 3. - Typical XB-70 landing paitern.
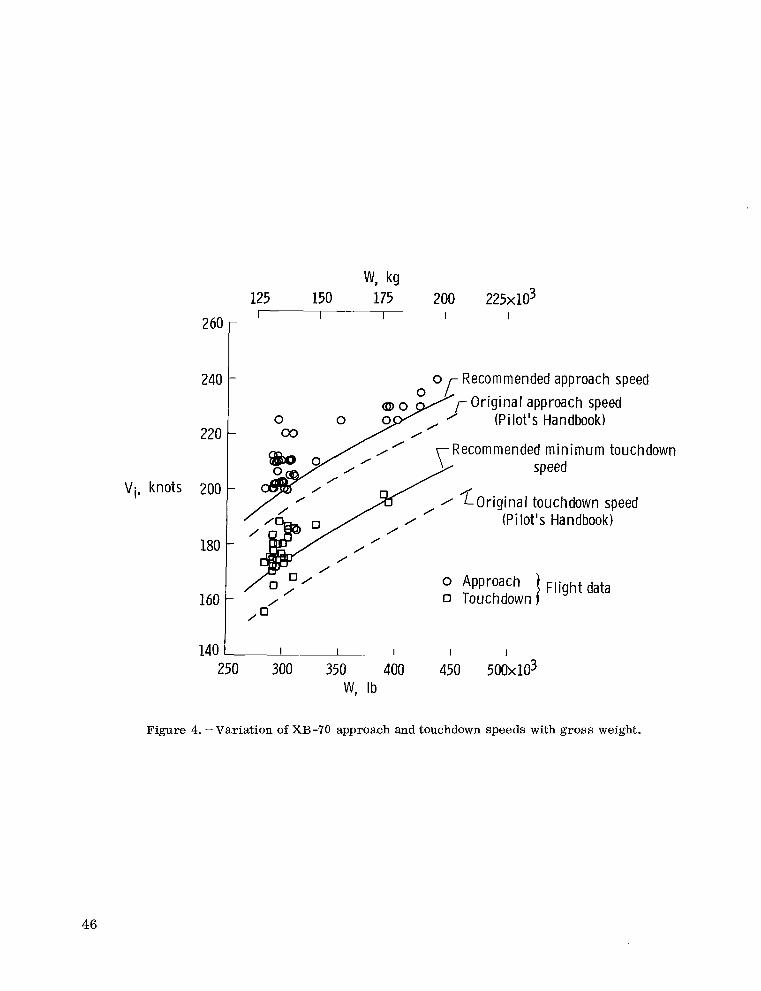
w, kg 125 150 175 200 2 2 5 ~ 1 0 ~
I I I I
Vi, knots 200 2201 l 6O t
Recommended approach speed ,-Original approach speed
0 0 (Pilot's Handbook) a3
/ a'
Recommended m i n i m u m touch J speed
/ / f 0 r i g i n a l touchdown speed (Pi lot's Ha ndbook)
Approach 1 Fl ight data D Touchdown
140 I I I - I 1 I
250 300 350 400 450 5 0 0 ~ 1 0 ~ W, Ib
down
Figure 4. -Variation of XB-70 approach and touchdown speeds with gross weight.
46

15 r I ,
-5 ! I I I I I I I I
200
180 160
220 I - I L I
J I I I I
3000
2800
2600
2400
2200
2000
1800
-4 Touchdown
I I I I I 60 70
I I I
10 20 30 40 50 t, sec
JOO
350
300
750 m Pf
700
550
500
Figure 5. -Time history of typical XB-70 3" glide-slope approach and landing. Vapr = 210 KIAS, W = 310,000 lb (140,000 kg), center of gravity = 23.5 percent E.
47

I
Vi, 200 knots
I 11111111111.1111 I 1 1111. 1111 ,I 1 1 1 1 1 I I 11111-1-...1111.-..11.- ...,-...---
I -
-I - i I
I
l5 r I
220 I- I
I 3200 r 1
--4 Go-around in i t iated
3000
I 2800 k I
2400 1 \ ! \c, I
2000 I I I I I l l I 0 10 20 30 40 50 60
t, sec
Figure 6. - Time history of XB-70 3" glide-slope approach at lower than recommended speed. Vapr = 185 KIAS, W = 311,000 lb (141,000 kg),
center of gravity = 2 3 . 5 percent E.
1000
950
900
850
800
750
700
Pf m
550
I - - 1 1 1 1 1 1 1 1 1 . 1 1 1 . 1 . . .. . . ..-.,.....-. _..... . ... . . . . . ...._..........

Vapr = 210 K l A S
40 r Thrott le angle, :::
deg 10 0 -
Vapr = 185 K l A S
40 r
T h rot t l e
deg 10
I 1 -
0 10 20 30 40 50 t, sec
2ol 1
Figure 7. - Time history of throttle activity during XB-70 landing- approach maneuvers.
49

cn 0
2
4
6 Pilot ra t ing
8
10
0 Smooth a i r o Pi lot extrapolation to adverse weather and vis ib i l i ty conditions
Vert i ca I -off set Slow 3" glide- Shallow 3" glide-slope a p p roach
- 0 0
- 0
- A B C
P i lot
approach 0
0 0
0
L A B Pilot
approach slope approach - 0
I B
P i lot
0
I B
Pi lot
Figure 8. - Summary of pilot ratings of XB-70 longitudinal handling qualities.

Satisfactory I k r 2 0 0 ... 7205 0
... .... ...... . . . . . . . . -. 2 '"z: Boei ng boundary (u n p u bl i s h ed)
185 K l A S N z ~ bmaxl g e U n satisfactory
-. 6 f l i gh t data 235 K l A S
-. 8 0
I 5
I I I 15 20 25
Mbe6,,,, deglsec'
Figure 9. - Comparison of XB-70 control power with unpublished longitudinal- control-power criteria for the landing configuration.
51

radia n s/sec2 bc., cm
.002
0 .005 . 01 .015 .02 .025 .03 .035 I I I I -. 012 I I I I
I I I I I I
-. 010
-
-. 008
Lk., -.002
radianslsec cm
Lk., -. 006 radia n s lsec
in. -. 004
--.001 -. 002
- J - 0 J
0
185 K l A S
Unsatisfactory
J J J J _I
Satisfactory
b 2 0 . 5 5 tsp 2 0.71 wsp 2 0.93
-. 003 1 fsp = 0.55 w z1 .2
SP
radia n s /sec2 in. bp
Figure 10. - Comparison of XB-70 longitudinal-control sensitivity with suggested longitudinal- control-sensitivity criterion for landing configuration.

60 x lo3
- dF, IW
- -0.0006 per K I A S /
58 - \
/ 0
0 -
r equ i red, Ib
260
Thrust
N 250 required,
52 - 1:: 50 I I I I I I I I I
170 180 190 200 210 220 230 240 250 Vi, knots
Figure 11. - XB-70 landing configuration speed-thrust variation. W = 300,000 lb (136,000 kg), center of gravity = 23.5 percent E.
ul w

. 3
.2
a,, g .1
0
-. 1 I
I I I I
T h rott I e angle, deg
40
20
I I I 0 5 10
t, sec
I
15
Figure 12. -XB-70 throttle response during a touch-and-go maneuver.
54

-4 I I I I I I I I
I I I I I 1 I I J-80
- -300
2300
700
680
660 h,,, m
640
620 2000 -
1900 I I I 1 I I I I
0 5 10 15 20 25 30 35 t, sec
Figure 13. -Typical time history of an XB-70 lateral-offset maneuver. W = 446,000 lb (202,000 kg); center of gravity = 23.5 percent E.
55

Vi, knots
2200
I 220 r
I
2 10
200
190
180
170
300C
280C
hp, ft 2600
2400
-
-
I I I I
i I
'I Touchdown I
900
850
300 hp, m
750
700
I [ I 1 1 I 20 30 40 50 60
t, sec
(a) Vi and hp.
Figure 14. - Time histories of XB-70 crosswind landing. Wind 20 knots, gusts t o 30 knots; 55" to runway; turbulence moderate-to-heavy; FACS on; center of gravity = 2 3 . 5 percent E.
56

4 I I I I I I I ,
1.5- I
0 ' -1 I I I I I I
16 I- I
0 ' I I I I I J
Co lumn -:: 1 -2 O Co lumn posit ion, -4 position,
in. -2 -6 cm
0 10 20 30 40 50 60 t, sec
-8 -3
(b) a , s p y he, and column position.
Figure 14. - Continued.
57

10 r I I
P, deglsec
1 I
I rjMn rlv’
.1
aYp’ g 0
-. 1 I
1
-.2 I I I 1 1 I ‘ I
0 10 20 30 40 50 60 t, sec
( c ) qa, P, P, and ”y . P
Figure 14. - Continued.

15 1,- Touchdown
10
deg 5 0
-5
- -1 - 1 1 I I I I , I I -2 -3
Wheel force,
Ib I -10 I I
0 Pedal
posit ion, in. -. 8
-1.2
I I I
t, sec
Pedal position,
cm
(d) 6,, wheel force, 6,, and pedal position.
Figure 14. - Concluded.
59
I

I I I I -50 I
P f 0 - deglsec
lo r . -
I I I
- W
-20 L 0 5
I I 10 15
I 20
tf sec
Figure 15.- Time history of XB-70 rudder-fixed, FACSoff, aileron roll. Vi = 230 knots; hp = 10,000 ft (3050 m); center of gravity = 2 3 . 5 percent E ;
1 anding configuration.
60
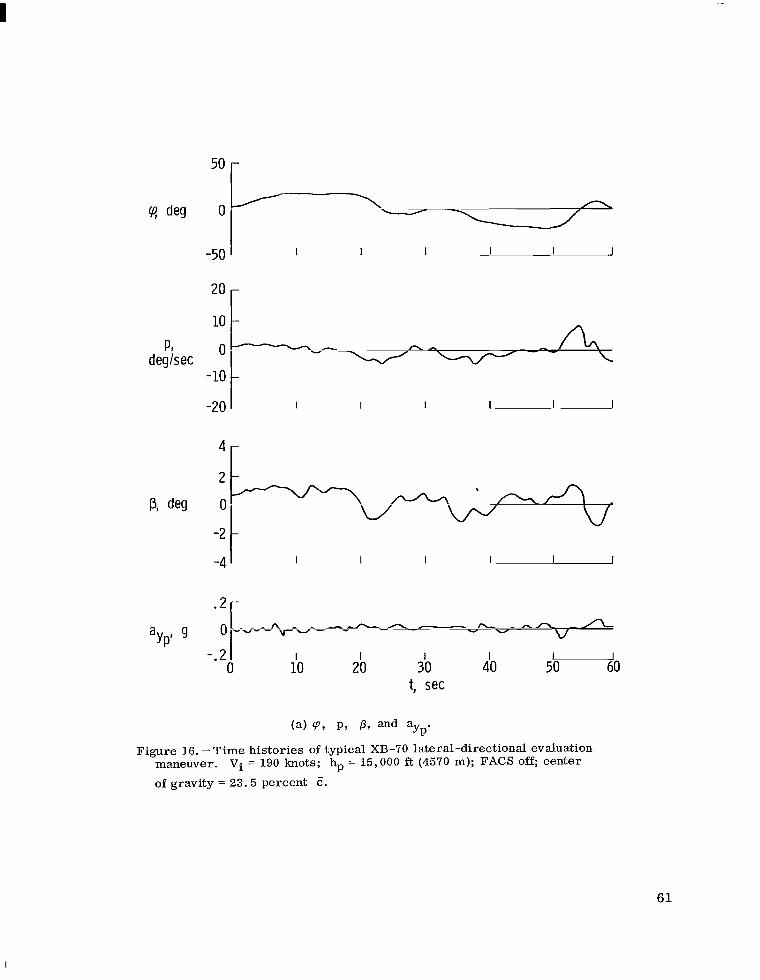
-50 I
10 t
I I I I I I
A
-20 1 1 1 I I I I
-4 I I I I 1-
.+----Ar---------- - 0 10 20 30 do 50 60
t, sec
aYp' g W V
I 1 I I I
(a) v, P, P , and ayp.
Figure 16. -Time histories of typical XB-70 lateral-directional evaluation maneuver. of gravity = 23.5 percent E.
Vi = 190 knots; hp = 15,000 ft (4570 m); FACS off; center
61
I

-20' I I I I I I
P eda I
Ib force,
-100
60 - Wheel
position, 0 . \ - / -
0 -
I I I I I I
41 I I I I I I
(b) 6,, wheel position, 6,, and pedal force.
Figure 16. - Concluded.
62
..-. ...... ,--, ,.. . ,. . .I., I , I., m . 1 1 . 1 . 1 1 1 1 . 1 1 1 I 1 1 1 111 11111111.1..1 I I
500
Pedal 0 force,
N
-500
I
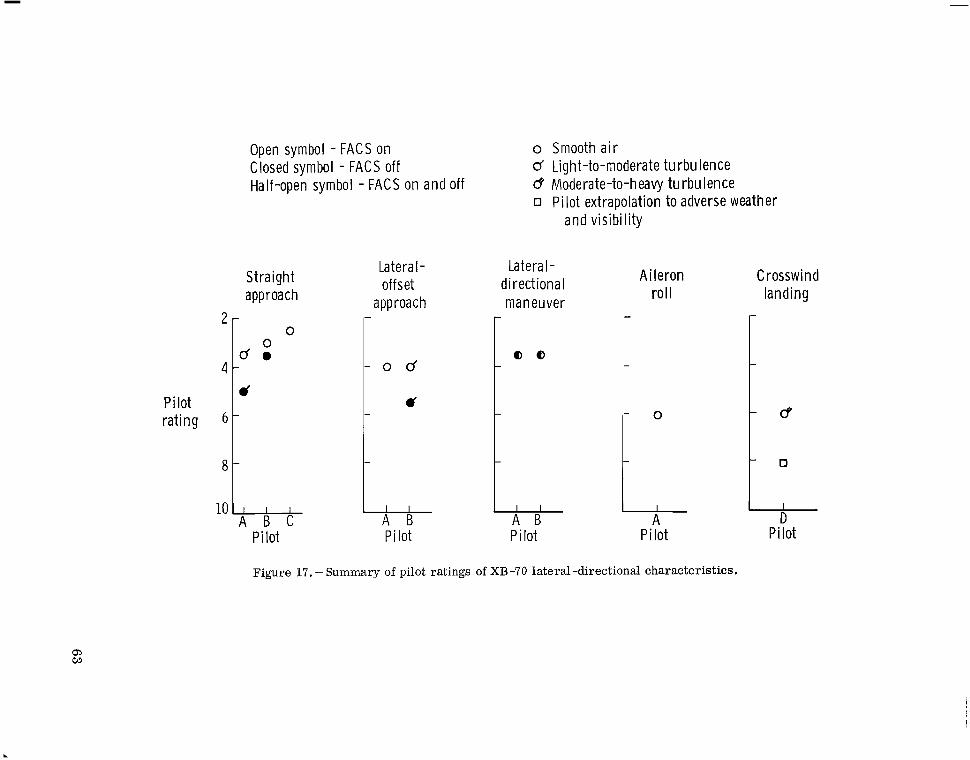
2
4
Pi lot rat ing 6
8
10
- 0
Open symbol - FACS on Closed symbol - FACS off Half-open symbol - FACS on and off
-
- B
Straight a p p r oa ch
0 0
d o
d
u A B C
Pi lot
Latera I - offset
approach
o d
#
L A B Pilot
o Smooth a i r cf Light -to-moderate tu rbu lence d Moderate-to-heavy turbulence o Pilot extrapolation to adverse weather
and visibi l i ty
Ai leron Crosswind r o l l landing
Lateral- directional maneuver . -
0 0
L A B P i lot
t o
D I
A Pilot Pi lot
Figure 17. - Summary of pilot ratings of XB-70 lateral-directional characteristics.
Q, w
.

64
XB-70 Turbu lence f l i gh t data 0 Calm 0 Light-to-moderate 0 Moderate
Flag denotes FACS off
L I 1 I 1 1 1
0 5 10 15 20 25 30 Time fo r maneuver, sec
Figure 18.- Comparison of XB-70 flight results with predictions (ref. 10) of t ime to accomplish a sidestep maneuver during landing approach as a function of maximum bank angle used. 200-foot (61-meter) offset.
NASA-Langley, 1970 - 2 H-587
NATIONAL AERONAUTICS AND SPACE ADMINISTRATION WASHINGTON, D. C. 20546
OFFICIAL BUSINESS FIRST CLASS MAIL
POSTAGE A N D FEES PAID NATIONAL AERONAUTICS A N
SPACE ADMINISTRATION
. . .
P ~ ~ T M ~ S T E R : If Undeliverable (Section 156 Postal Manual ) Do N o t Return
"The aeroizaitticnl dud space activities of the United States shall be conducted so as t o contribute . . . t o the expansion of hitman knozul- edge of pheaoniena i?z the atmosphere and space. The Adniinistrntion shall psovide for the widest practicnble and appiopriate dissenziizntioa of iiafor~iintion coizceriaiizg its activities and the iesirlts thereof."
. * ;.-> . * . 1.
-NATIONAL AERONAUTICS AND SPACE ACT OF 195s . .
NASA SCIENTIFIC AND TECHNICAL PUBLICATIONS
TECHNICAL REPORTS: Scientific and technical information considered important, complete, and a lasting contribution to existing knowledge.
TECHNICAL NOTES: Information less broad in s c o p ~ but nevertheless of importance as a contribuii& to existing knowledge. :.' TECHNIC~L MEMORANDUMS : Informatior;' feceiving limited distribution because of preliminary data, security classifica- tion, or other ieasons.
CONTRACT~~,REPORTS: Scientific and technical information generated under a NASA contract or grant and considered an important contribution to existing knowledge.
TECHNICAL TRANSLATIONS: Information published in a foreign language considered to merit NASA distribution in English.
SPECIAL PUBLICATIONS: Information derived from or of value to NASA activities. Publications include conference proceedings, monographs, data compilations, handbooks, sourcebooks, and special bibliographies.
TECHNOLOGY UTILIZATION PUBLICATIONS: Information on technology used by NASA that may be of particular interest in commercial and other non-aerospace applications. Publications include Tech Briefs, Technology Utilization Reports and Notes, and Technology Surveys.
Details on the availability of these publications may be obtained from:
SCIENTIFIC AND TECHNICAL INFORMATION DIVISION
NATI 0 NA L AER 0 N AUT1 C S AN D SPACE AD M I N I STRATI 0 N Washington, D.C. 20546