handbook of seafood quality, safety and health applications (alasalvar/handbook of seafood quality,...
TRANSCRIPT
P1: SFK/UKS P2: SFKc05 BLBK298-Alasalvar August 5, 2010 15:20 Trim: 244mm×172mm
5 Instrumental analysis of seafood flavour
Hun Kim and Keith R. Cadwallader
5.1 Introduction
The complex flavour of seafood is composed of equally important nonvolatile taste- andaroma-active components. Early investigations on seafood flavour focused mainly on thetaste-active components, which are generally non-volatile and low-molecular-weight extrac-tive components. These may be divided into two broad groups: nitrogenous compoundsincluding amino acids, low-molecular-weight peptides, nucleotides, and organic bases; andnon-nitrogenous compounds including organic acids, sugars, and inorganic constituents suchas mineral salts [1,2]. Study of the taste active constituents has attracted considerable atten-tion and their importance to seafood flavour has been thoroughly reviewed [3–6]. The firststudy of this type was conducted during the early 1900s [7]. Since that time, most investiga-tions in this area have involved the quantitative analysis of extractive components (mainlynucleotides and free amino acids) by wet-chemical and/or liquid chromatographic meth-ods, including ion exchange chromatography and high-performance liquid chromatography[6,8–14].
Volatile (aroma) constituents are key to flavour perception. Without aromas, it is verydifficult to identify the flavour of specific food products including seafood [15]. Seafoodaromas can be formed via several mechanisms, which may be subdivided into four categoriesaccording to a precursor-mechanism relationship:
1) enzyme-mediated conversion of lipids to aromas;2) autoxidative degradation of free fatty acids leading to the formation of volatile carbonyls,
acids, and alcohols;3) enzymatic conversion of sulphur- and nitrogen-containing precursors to volatiles includ-
ing dimethyl sulphide; and4) thermal decomposition of precursors upon processing or cooking [16].
The aroma components may contribute to the development of pleasant (characteristic flavour)or off-flavour characteristics of seafood. The characteristic flavour of seafood has beendescribed as green, melon-like, and iodine-like, while off-flavours include musty, fishy,woody, rancid, and petroleum notes [4,17]. Research on the volatile constituents of seafood
Handbook of Seafood Q uality, Safety and Health Applications
Edited by Cesarettin Alasalvar, Fereidoon Shahidi, Kazuo Miyashita and Udaya Wanasundara
© 2011 Blackwell Publishing Ltd. ISBN: 978-1-405-18070-2
P1: SFK/UKS P2: SFKc05 BLBK298-Alasalvar August 5, 2010 15:20 Trim: 244mm×172mm
Instrumental analysis of seafood flavour 51
has markedly increased since the introduction of gas chromatography (GC) coupled withGC-mass spectrometry (GC-MS) in the mid-1960s. Aroma is one of the most importantdeterminants of seafood quality and can profoundly affect consumer acceptability [1,17,18].As mentioned above, the flavour of seafood is comprised of both volatile aroma-active andnon-volatile taste-active components. The identification of volatile constituents of seafood,therefore, is a key first step to the full understanding of seafood flavour. This chapter focuseson procedures for isolation and extraction of volatile flavour components and describes recentadvances in analytical methodology for characterization of seafood flavour.
5.2 Isolation of volatile flavour compounds
Analysis of volatile flavour components in food is complicated due to the presence ofextremely low levels of volatile solutes in highly complex nonvolatile matrices. Isolation orsampling of volatiles should be conducted by taking advantage of their volatility or nonpolarnature prior to GC analysis [18]. There are numerous methods for isolation of volatiles froma food matrix. Methods most often employed in the analysis of volatile flavour componentsof seafood are summarized in Table 5.1 and discussed below.
5.2.1 Headspace sampling
Headspace sampling techniques take advantage of the volatility of aroma compounds, andinvolve several categories including static headspace, dynamic headspace (purge-and-trap),solid phase microextraction (SPME), solid phase aroma concentration extraction, in-tubesorptive extraction, and headspace sorptive extraction. In each case, however, the same fun-damental principle is employed; only volatile compounds are collected from the atmosphereadjacent to the sample, leaving the actual sample material behind.
5.2.1.1 Static headspace sampling
Static headspace sampling (SHS) is the simplest among the headspace techniques. In SHS,the sample is placed in an airtight vessel (vial) and the volatile components are allowedto come to equilibrium between the sample matrix and the surrounding headspace. Theequilibrium is affected by the temperature of vessel, sample size, and equilibration time, etc.[19]. Following this, the headspace vapour (0.1–2.0 mL) is injected into a GC using a gastightsyringe or by direct transfer to the injection port using a headspace sampler (sampling loop).SHS is covered in greater depth elsewhere [23]. Advantages of SHS include simple samplepreparation, low risk of artifacts, and elimination of reagent or organic solvent. The techniqueallows for the analysis of highly volatile low molecular weight aroma compounds in seafoods,such as acetaldehyde, methanthiol, trimethylamine, dimethyl sulphide, or 2-methylpropanal[36].
SHS has been used to identify volatile compounds in fish oil [37], salmon [38,39], whiteherring [40], and other fish species [41]. However, SHS is mainly used in the field of qualitycontrol or grade classification of seafood products by the analysis of certain target volatilecompounds, such as trimethylamine.

P1: SFK/UKS P2: SFKc05 BLBK298-Alasalvar August 5, 2010 15:20 Trim: 244mm×172mm
52 Seafood Quality, Safety and Health ApplicationsTa
ble
5.1
Met
hods
used
for
the
isol
atio
nof
the
vola
tile
flavo
urco
nstit
uent
sof
seaf
ood
prod
ucts
Isola
tion
meth
od
Pri
nci
ple
sof
the
tech
niq
ue
Ad
van
tag
es
Dis
ad
van
tag
es
Hea
dsp
ace
sam
pli
ng
Stat
iche
adsp
ace
sam
plin
g(S
HS)
Vola
tile
anal
ytes
cont
aine
din
the
head
spac
ega
sph
ase
unde
req
uilib
rium
are
sam
pled
bya
gast
ight
syrin
geor
othe
rm
eans
and
tran
sfer
red
toth
eG
Cco
lum
nfo
ran
alys
is[2
0].
Dire
ctan
dno
n-de
stru
ctiv
ean
alys
isof
the
vola
tile
anal
ytes
[21]
.
Easy
elim
inat
ion
ofin
terf
eren
ces
from
the
com
plex
sam
ple
mat
rix.
Abi
lity
toan
alyz
elo
wm
olec
ular
wei
ght
vola
tiles
with
outt
hepr
esen
ceof
aso
lven
tpe
ak[2
2].
Rela
tive
low
cost
per
anal
ysis
,eas
yau
tom
atio
n,an
dsi
mpl
ean
dfa
stis
olat
ion
ofth
evo
latil
es[2
1,22
].
With
draw
ing
and
tran
sfer
ring
only
smal
lpo
rtio
nof
the
head
spac
e(1
–2m
L)re
sults
inpo
orse
nsiti
vity
for
trac
ele
velv
olat
ilean
alyt
es[2
2,23
].
Not
suita
ble
for
isol
atin
gof
vola
tiles
with
high
boili
ngpo
ints
[22]
.
Dyn
amic
head
spac
esa
mpl
ing
(DH
S)C
arrie
rga
sco
ntai
ning
the
vola
tile
anal
ytes
abov
eth
esa
mpl
e(h
eads
pace
)is
cons
tant
lysw
eptt
hrou
gha
trap
,and
the
vola
tiles
are
reta
ined
onth
etr
ap,w
hich
resu
ltsin
the
conc
entr
atio
nof
the
anal
ytes
[22]
.
DH
Sw
asde
velo
ped
toov
erco
me
the
sam
ple
size
limita
tion
impo
sed
bySH
S[2
1].
Incr
ease
dto
talv
olum
eof
head
spac
e(1
00m
L–1
L),w
hich
may
resu
ltin
high
erre
cove
ryof
the
anal
ytes
and
prov
ides
grea
ter
sens
itivi
tyth
anSH
S[2
2].
Requ
ires
mor
eco
mpl
exan
dex
pens
ive
inst
rum
ents
,suc
has
addi
tiona
lthe
rmal
deso
rptio
nan
dcr
yofo
cusi
ngsy
stem
s.
Leng
thy
anal
ysis
time
due
tom
ore
anal
ytic
alst
eps,
incl
udin
gsa
mpl
epu
rgin
g,tr
apdr
ying
,tr
aptr
ansf
er,a
ndth
erm
alde
sorp
tion
oftr
ap[2
2].
Solid
phas
em
icro
extr
actio
n(S
PME)
The
anal
ytes
inth
eva
pour
phas
ear
eab
sorb
ed/a
dsor
bed
bya
smal
lvol
ume
ofan
extr
actin
gph
ase
(�1
�L)
,whi
chco
nsis
tsof
thin
poly
mer
icfil
ms
coat
edon
tofu
sed
silic
afib
res
prot
ecte
din
ane
edle
ofa
syrin
ge-l
ike
devi
ce[2
4].
Rapi
d,si
mpl
ean
dea
syto
auto
mat
efo
rth
eex
trac
tion
ofbo
thpo
lar
and
non-
pola
rvo
latil
es.
Hig
her
sens
itivi
tyto
war
dsvo
latil
eor
gani
cco
mpo
unds
com
pare
dw
ithSH
Sor
DH
S[2
5].
Adv
anta
geof
dire
ctth
erm
alde
sorp
tion
into
the
GC
inje
ctio
npo
rt.
Smal
lvol
ume
ofth
eex
trac
tion
film
allo
ws
for
only
vola
tiles
havi
nghi
ghpa
rtiti
onco
effic
ient
tobe
extr
acte
dw
ithhi
ghef
ficie
ncy.
SPM
Efib
res
are
rela
tivel
yex
pens
ive,
and
the
poly
mer
coat
ing
isfr
agile
and
easi
lybr
oken
[26]
.
Lim
ited
lifet
ime
ofth
efib
res
(up
to10
0an
alys
es).
Sam
ple
carr
yove
ris
som
etim
esdi
fficu
ltto
elim
inat
e[2
6],a
ndso
me
extr
aneo
uspe
aks
are
form
eddu
eto
part
iald
ecom
posi
tion
offib
reco
atin
g[2
7].

P1: SFK/UKS P2: SFKc05 BLBK298-Alasalvar August 5, 2010 15:20 Trim: 244mm×172mm
Instrumental analysis of seafood flavour 53
Sorp
tive
extr
actio
nSi
mila
rpr
inci
ple
toth
atof
SPM
Eex
cept
usin
ghi
gher
mas
sof
poly
mer
icfil
m(2
5–30
0�
L)[2
8].
Ove
rcom
esth
elim
ited
conc
entr
atio
nca
pabi
lity
ofSP
ME
[28]
.
Hig
her
reco
verie
san
dhi
gher
sam
ple
capa
city
,whi
chle
ads
tolo
wer
dete
ctio
nlim
its(c
apab
ility
ofis
olat
ion
oftr
ace
vola
tiles
)and
bette
rre
peat
abili
tyth
anot
her
head
spac
ete
chni
ques
[29]
.
Lim
ited
num
ber
poly
mer
icex
trac
tion
film
sav
aila
ble,
whi
chre
stric
tsth
em
etho
dto
the
isol
atio
nof
mai
nly
non-
pola
rvo
latil
eco
mpo
unds
(i.e.
only
non-
pola
rco
mpo
unds
are
extr
acte
dw
ithth
eav
aila
ble
PDM
Sco
atin
g)[3
0].
Solv
ent
extr
act
ion
an
dd
isti
lla
tio
nex
tra
ctio
nD
irect
solv
ent
extr
actio
n(D
SE)
The
anal
ytes
are
isol
ated
from
food
mat
rixby
extr
actio
nw
ithor
gani
cso
lven
ttak
ing
adva
ntag
eof
the
diffe
renc
ein
pola
rity.
Sim
ple,
none
edfo
rco
mpl
exeq
uipm
ent
and
larg
ese
lect
ivity
and
flexi
bilit
y[3
1].
Requ
iring
addi
tiona
lcle
an-u
pst
epin
orde
rto
rem
ove
non-
vola
tile
resi
dues
.
Emul
sion
form
atio
n,w
hich
may
lead
tolo
ssof
anal
ytes
,and
requ
ires
com
plic
ated
and
time-
cons
umin
gal
tern
ativ
est
eps
topr
even
tor
min
imiz
e[3
1].
Stea
mdi
still
atio
nex
trac
tion
(SD
E)SD
Eta
kes
adva
ntag
eof
vola
tility
ofth
ean
alyt
esan
dno
n-vo
latil
ityof
othe
rm
ajor
food
cons
titue
nts
[32]
.
Hig
hre
cove
ryof
stea
m-d
istil
labl
evo
latil
es[3
3].
Sim
plic
ityof
oper
atio
n,re
prod
ucib
ility
and
appl
icab
leto
broa
dra
nge
ofsa
mpl
es[3
1].
Poss
ible
deco
mpo
sitio
nof
vola
tiles
orpr
oduc
tion
ofar
tifac
tsdu
eto
pres
ence
ofw
ater
and
high
extr
actio
nte
mpe
ratu
re[3
4].
Poor
reco
very
for
pola
ran
dw
ater
-sol
uble
anal
ytes
[35]
.
Hig
hva
cuum
dist
illat
ion
extr
actio
nTh
epr
essu
reab
ove
the
acqu
eous
sam
ple
mix
ture
tobe
dist
illat
edis
redu
ced
tole
ssth
anits
vapo
urpr
essu
reca
usin
gev
apor
atio
nof
vola
tile
anal
ytes
incl
udin
gso
lven
tor
wat
er.
Hig
hyi
eld
ofvo
latil
esin
clud
ing
pola
rvo
latil
es,a
ndre
cove
ryof
auth
entic
flavo
rex
trac
ts[3
5].
Cha
nce
for
loss
ofth
ehi
ghly
vola
tile
trac
ean
alyt
es.

P1: SFK/UKS P2: SFKc05 BLBK298-Alasalvar August 5, 2010 15:20 Trim: 244mm×172mm
54 Seafood Quality, Safety and Health Applications
5.2.1.2 Dynamic headspace sampling
Dynamic headspace sampling (DHS) or purge-and-trap analysis involves the constant strip-ping of the volatile analytes in the atmosphere surrounding a sample by use of an inertcarrier gas such as nitrogen. The volatiles contained in the carrier gas are then enriched bytrapping onto adsorbent materials (generally porous polymers) or by cryogenic focusing.This technique greatly improves the efficiency of headspace sampling. In general, the term“purge-and-trap” is used when referring to liquid samples analyzed by bubbling the carriergas through the liquid, while DHS is used when the sample is a solid [22]. Tenax
R©(poly-2,6-
diphenyl-p-phenyl oxide) is the most widely used adsorbent material for DHS. However, theadsorbent material can be chosen according to the specificity of the target volatile analytes.The volatile analytes are desorbed (released) by heating the trap (thermal desorption), andthe released volatiles are sent to the analytical GC column for analysis. DHS has many of thesame advantages as SHS. Furthermore, volatiles isolated by DHS may more closely resemblethe actual aroma composition that is perceived during smelling. A major disadvantage ofDHS is that it is not efficient towards components of low volatility [19]. DHS is one of themost popular isolating techniques for seafood flavour analysis. DHS has been used by severalresearchers for the isolation of volatiles from various kinds of seafood, such as sea bream[42], herring [43], cooked lobster tail meat [44,45], boiled crayfish [46] and its waste [47],emerald shiner [48], and pickled fish [49].
5.2.1.3 Solid phase microextraction
Solid phase microextraction (SPME) is a relatively new technique for the rapid, solventlessextraction of volatile compounds based on their partitioning between the sample or sampleheadspace and a polymer-coated fibre. The fibre is attached to a stainless steel plunger,sheathed by a protective needle, which is essentially a modified syringe to enable thermaldesorption of the analytes into a GC injection port. The selectivity of volatile extractionfrom the headspace depends on the choice of the fibre, and two factors, such as polarity andvolatility and molecular weight of target analytes, need to be considered [30]. SPME is anequilibrium technique and therefore the volatile profile one obtains is strongly dependentupon sample composition, and careful control of all sampling parameters is required [15].Comprehensive reviews of SPME have been published elsewhere [50–52]. Recently, solidphase aroma concentration extraction (SPACETM) was introduced as a modification of SPME,with the aim of increasing the area of the adsorbent so as to improve sensitivity (over 30 timesmore than SPME) [30,53]. SPACETM consists of a stainless steel rod coated with a mixtureof adsorbents, mainly graphite carbon [28]. Use of SPME for the analysis of seafood flavouris limited [54], with most applications related to the monitoring of quality control factorssuch as freshness and spoilage indicators rather than analysis of total volatiles [55–60].
5.2.1.4 Sorptive extraction
Among several sorptive extraction methodologies, in-tube sorptive and headspace sorptiveextractions (stir bar sorptive extraction) has recently been employed in the field of foodanalysis [61,62]. Both extraction techniques were developed to overcome the relativelylimited concentration capability of SPME [28].
In-tube sorptive extraction techniques include solid phase dynamic extraction (SPDE),which is also known as “the magic needle” [63]. SPDE employs a thick film (50 �m) of
P1: SFK/UKS P2: SFKc05 BLBK298-Alasalvar August 5, 2010 15:20 Trim: 244mm×172mm
Instrumental analysis of seafood flavour 55
polymer, which is coated onto the inside wall of the stainless steel needle of a gastightsyringe, in order to increase sensitivity. The analytes are accumulated in the polymer coatingby pulling in and pushing out a fixed volume of headspace to be sampled, through the gastightsyringe for an appropriate number of times within a fixed time. The trapped analytes are thenthermally desorbed into the GC injector [28].
In headspace sorptive extraction or stir bar sorptive extraction (commercialized by Gerstel(Mulheim an der Ruhr, Germany, under the name Twister), the headspace analytes arestatically accumulated by suspending a polydimethylsiloxane (25–250 �L) coated glassmagnetic stir bar in the vapour phase. After sampling, the stir bar is placed in a glass tubeand transferred to a thermo-desorption system where the analytes are thermally recoveredand analyzed by GC or GC-MS [28]. Although these techniques have not been used for theanalysis of seafood flavour, they have good potential for this application, especially if theanalysis is focused on the identification of trace level highly volatile or semi-volatile lowmolecular weight of components.
5.2.2 Solvent extraction and distillation extractions
5.2.2.1 Direct solvent extraction
One of the simplest and most efficient techniques for aroma isolation is direct solvent extrac-tion (DSE). DSE takes advantage of the difference in polarity between aroma compoundsand food matrix; most volatile aroma compounds are considerably less polar than aqueousfood matrix material. Solvent extraction can be as simple as putting a food sample into avessel such as a separatory funnel, adding a solvent (diethyl ether or methylene chlorideare good general purpose solvents), and shaking. The solvent phase is collected, dried withanhydrous salt (e.g. anhydrous sodium sulphate), and then concentrated (using distillationor nitrogen gas purging) prior to GC analysis. Another approach is to use liquid-liquid con-tinuous extractors when relatively large amounts of aqueous samples are available. In thecase of solvent extracts prepared from seafood, an additional clean-up step is often requiredin order to separate nonvolatile residues (e.g. lipid) from the volatile material. This can beaccomplished by steam distillation, high vacuum distillation, or DHS. Milo and Grosch [64]performed direct solvent extraction followed by high vacuum distillation for the isolation ofvolatiles from boiled trout, salmon, and cod. An alternative approach is to isolate the volatilecomponents from the sample by distillation, followed by solvent extraction of the aqueousdistillate [15,19].
5.2.2.2 Steam distillation extraction
The most common steam distillation method employs simultaneous distillation-solvent ex-traction (SDE), which is often called the Likens-Nickerson method. In SDE, volatiles aresteam-distillated from the sample (an aqueous solution or slurry of a solid material in water)by heating a sample flask, and simultaneously the solvent is distilled from another separateflask by mild heating. Vapours condense together on a cold finger where the extractionprocess occurs between both liquid films on the condenser surface. Water and solvent (con-taining volatiles) are collected and decanted in the separator, and are finally returned to theirrespective flasks [65]. SDE is often operated under reduced pressure in order to minimize theformation of thermally-induced artifacts. The aroma isolate prepared by SDE contains nearlyall the volatiles in a sample, but their proportions may only poorly represent the true volatile
P1: SFK/UKS P2: SFKc05 BLBK298-Alasalvar August 5, 2010 15:20 Trim: 244mm×172mm
56 Seafood Quality, Safety and Health Applications
profile of the sample. Despite this, the method is still popular due to its ability to recovervolatiles with medium to high boiling points [15]. SDE (atmospheric or reduced-pressureoperation) has been widely used for seafood flavour analysis [45,47,66–73].
5.2.2.3 High vacuum distillation extraction
High vacuum distillation, which is one of the early classical techniques, has been appliedto isolate low level (ppb to ppt) volatile components of food products containing high fatcontent. Volatile analytes are distilled from a sample for several hours under high vacuum(∼10−5 Torr) and mild heat (�60◦C) conditions, with subsequent condensation of volatiles ina series of cold traps. The volatiles compounds are later recovered from the condensed phaseby solvent extraction. Although losses may also occur during extraction and concentrationof solvent extract, this technique enables the isolation of a broad range of mid- to high-boiling trace-level flavour compounds at sufficient quantities for analysis [30]. High vacuumdistillation has been used for the determination of aroma-active compounds in cooked tailmeat of lobster [44]. Engel et al. [74] developed a new technique called solvent-assistedflavour evaporation (SAFE), which allows for faster and more efficient isolation comparedwith classic high vacuum distillation methods. The future prospects are excellent for thewidespread use of SAFE in seafood flavour analysis.
5.3 Instrumental analysis of volatile flavour compounds
Tandem GC-MS has been the technique of choice for the analysis of volatile food flavour. GCis ideally suited to deal with solutes in the vapour phase, such as volatile flavour components[19]. Mass spectrometry is one of the most powerful techniques for identification of unknowncompounds. Most research conducted on seafood flavour in the last few years has dependedon GC-MS as the main analytical tool. The technique is so standard and routine in flavourstudies of seafood that there is no need to describe it any further here [19].
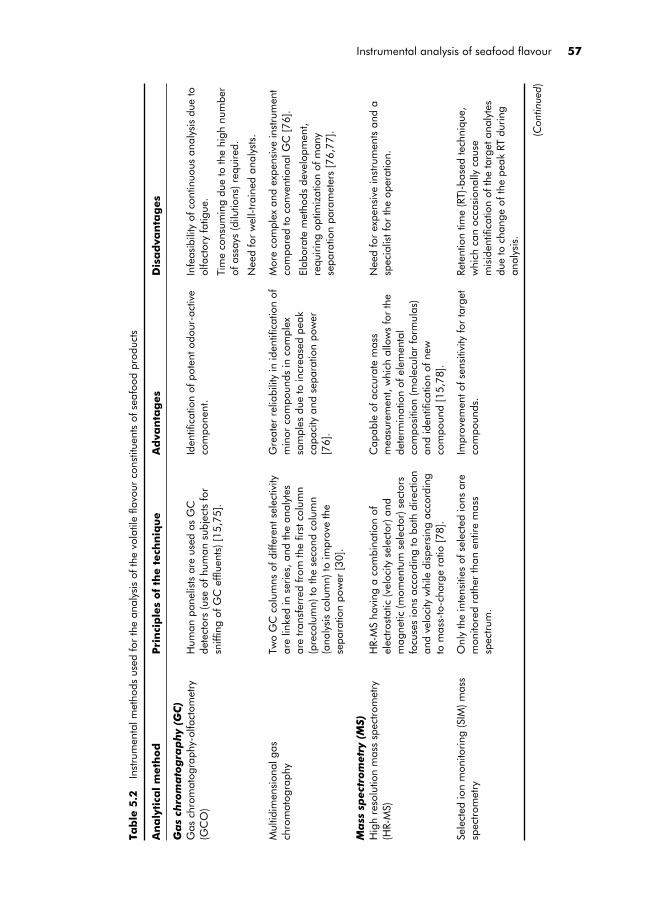
Standard GC-MS used in flavour analysis is considered as fused silica, capillary column GCwith bonded phase, providing high resolution, combined with fast scanning, high-sensitiveMS operating in the electron impact ionization mode [19]. Despite the pre-eminence ofstandard GC-MS in flavour research, there are other approaches, which can provide valuableadditional and/or complementary information to GC-MS. These approaches are summarizedin Table 5.2 and discussed below.
5.3.1 Gas chromatography
5.3.1.1 Gas chromatography-olfactometry (sensory-directed analytical techniques)
A high resolution GC column coupled with a standard GC detector is capable of separatingand detecting hundreds of volatile compounds in a single run. However, it is likely that manyof these components have little or no impact on the actual aroma of the food. The aroma-activecomponents in the volatile isolate can be determined by combining GC with olfactometry(GCO). In GCO, the analytes are first separated by GC and then delivered to an oflactometer(sniffing port) where they are mixed with humidified air. Human “sniffers” continuouslybreathe (nasally) the air emitted from the olfactometer, and record the perceived odourdescriptions and intensities of the detected odorants. There are several excellent reviews
P1: SFK/UKS P2: SFKc05 BLBK298-Alasalvar August 5, 2010 15:20 Trim: 244mm×172mm
Instrumental analysis of seafood flavour 57
Tab
le5.2
Inst
rum
enta
lmet
hods
used
for
the
anal
ysis
ofth
evo
latil
efla
vour
cons
titue
nts
ofse
afoo
dpr
oduc
ts
An
aly
tica
lm
eth
od
Pri
nci
ple
sof
the
tech
niq
ue
Ad
van
tag
es
Dis
ad
van
tag
es
Ga
sch
rom
ato
gra
ph
y(G
C)
Gas
chro
mat
ogra
phy-
olfa
ctom
etry
(GC
O)
Hum
anpa
nelis
tsar
eus
edas
GC
dete
ctor
s(u
seof
hum
ansu
bjec
tsfo
rsn
iffing
ofG
Cef
fluen
ts)[
15,7
5].
Iden
tifica
tion
ofpo
tent
odou
r-ac
tive
com
pone
nt.
Infe
asib
ility
ofco
ntin
uous
anal
ysis
due
tool
fact
ory
fatig
ue.
Tim
eco
nsum
ing
due
toth
ehi
ghnu
mbe
rof
assa
ys(d
ilutio
ns)r
equi
red.
Nee
dfo
rw
ell-
trai
ned
anal
ysts
.
Mul
tidim
ensi
onal
gas
chro
mat
ogra
phy
Two
GC
colu
mns
ofdi
ffere
ntse
lect
ivity
are
linke
din
serie
s,an
dth
ean
alyt
esar
etr
ansf
erre
dfr
omth
efir
stco
lum
n(p
reco
lum
n)to
the
seco
ndco
lum
n(a
naly
sis
colu
mn)
toim
prov
eth
ese
para
tion
pow
er[3
0].
Gre
ater
relia
bilit
yin
iden
tifica
tion
ofm
inor
com
poun
dsin
com
plex
sam
ples
due
toin
crea
sed
peak
capa
city
and
sepa
ratio
npo
wer
[76]
.
Mor
eco
mpl
exan
dex
pens
ive
inst
rum
ent
com
pare
dto
conv
entio
nalG
C[7
6].
Elab
orat
em
etho
dsde
velo
pmen
t,re
quiri
ngop
timiz
atio
nof
man
yse
para
tion
para
met
ers
[76,
77].
Ma
sssp
ectr
om
etry
(MS)
Hig
hre
solu
tion
mas
ssp
ectr
omet
ry(H
R-M
S)H
R-M
Sha
ving
aco
mbi
natio
nof
elec
tros
tatic
(vel
ocity
sele
ctor
)and
mag
netic
(mom
entu
mse
lect
or)s
ecto
rsfo
cuse
sio
nsac
cord
ing
tobo
thdi
rect
ion
and
velo
city
whi
ledi
sper
sing
acco
rdin
gto
mas
s-to
-cha
rge
ratio
[78]
.
Cap
able
ofac
cura
tem
ass
mea
sure
men
t,w
hich
allo
ws
for
the
dete
rmin
atio
nof
elem
enta
lco
mpo
sitio
n(m
olec
ular
form
ulas
)an
did
entifi
catio
nof
new
com
poun
d[1
5,78
].
Nee
dfo
rex
pens
ive
inst
rum
ents
and
asp
ecia
listf
orth
eop
erat
ion.
Sele
cted
ion
mon
itorin
g(S
IM)m
ass
spec
trom
etry
Onl
yth
ein
tens
ities
ofse
lect
edio
nsar
em
onito
red
rath
erth
anen
tire
mas
ssp
ectr
um.
Impr
ovem
ento
fsen
sitiv
ityfo
rta
rget
com
poun
ds.
Rete
ntio
ntim
e(R
T)-b
ased
tech
niqu
e,w
hich
can
occa
sion
ally
caus
em
isid
entifi
catio
nof
the
targ
etan
alyt
esdu
eto
chan
geof
the
peak
RTdu
ring
anal
ysis
.
(Con
tinue
d)
P1: SFK/UKS P2: SFKc05 BLBK298-Alasalvar August 5, 2010 15:20 Trim: 244mm×172mm
58 Seafood Quality, Safety and Health Applications
Tab
le5.2
(Con
tinue
d)
An
aly
tica
lm
eth
od
Pri
nci
ple
sof
the
tech
niq
ue
Ad
van
tag
es
Dis
ad
van
tag
es
Che
mic
alio
niza
tion
mas
ssp
ectr
omet
ry(C
I-M
S)Th
ean
alyt
esar
eio
nize
dby
ion-
mol
ecul
ere
actio
nsw
ithm
ostly
posi
tive
char
ged
reag
entg
asio
ns[7
9].
Not
muc
hfr
agm
enta
tion
ofan
alyt
es,w
hich
isus
eful
toco
nfirm
rela
tive
mol
ecul
arw
eigh
t[80
].
Lim
ited
amou
ntof
stru
ctur
alin
form
atio
n–
addi
tiona
lana
lytic
alte
chni
que
orus
ein
com
bina
tion
with
EIis
requ
ired
inor
der
toov
erco
me
this
limita
tion
[81]
.
Neg
ativ
eio
nch
emic
alio
niza
tion
mas
ssp
ectr
omet
ryTh
epr
inci
ple
ofth
iste
chni
que
isve
rysi
mila
rto
that
ofpo
sitiv
eio
nC
I-M
Son
ly,
exce
ptfo
rus
ing
nega
tivel
ych
arge
dre
agen
tgas
ions
(suc
has
OH
− ).
Hig
her
softn
ess
and
sens
itivi
tyth
anpo
sitiv
eio
nC
I-M
Sin
man
yre
spec
ts[2
1].
Lim
ited
amou
ntof
stru
ctur
alin
form
atio
n–
addi
tiona
lana
lytic
alte
chni
que
orus
ein
com
bina
tion
with
EIis
requ
ired
inor
der
toov
erco
me
this
limita
tion
[81]
.
Tim
e-of
-flig
ht(T
OF)
mas
ssp
ectr
omet
ryC
reat
edio
nsfr
omio
nso
urce
are
acce
lera
ted
byan
elec
tric
field
and
allo
wed
todr
iftth
roug
han
eval
uate
dfie
ld-f
ree
regi
on(fl
ight
tube
)whe
reth
eyse
para
ted
into
grou
ps(is
omas
spa
cket
s)ac
cord
ing
toth
eir
mas
s-to
-cha
rge
ratio
,an
dth
efli
ghtt
ime
ofio
nsre
quire
dto
reac
hth
ede
tect
orth
roug
hfli
ghtp
ath
ism
easu
red
and
used
toca
lcul
ated
mas
s[8
2].
Mea
surm
ento
fall
ofth
eio
nsac
ross
the
m/z
rang
esi
mul
tane
ousl
y,w
hich
resu
ltsin
high
sens
itivi
ty,m
ass
reso
lutio
nan
dm
ass
accu
racy
[82,
83].
Blin
ding
effe
cton
mul
tiple
conc
urre
ntev
ents
inca
setw
oor
mor
eio
nsar
rive
atth
ear
ray
dete
ctor
atth
esa
me
inst
ant,
resu
lting
elec
tric
alpu
lse
tobe
reco
rded
asif
only
one
ion
had
arriv
ed–
adju
stm
entr
equi
red
toco
rrec
tthi
sef
fect
[80]
.
Elec
tro
nic
no
se(e
-no
se)
The
e-no
sefu
nctio
nsby
anal
ysis
ofth
ere
spon
ses
ofa
sens
orar
ray
toa
com
plet
ear
oma
mix
ture
,whi
chm
eans
ther
eis
nose
para
tion
ofar
oma
com
pone
nts
[15]
.
Rapi
dan
alys
isof
flavo
urs
with
out
sepa
ratio
nst
ep,w
hich
isat
trac
tive
for
qual
ityco
ntro
lin
the
food
indu
stry
[15,
84].
Con
tinuo
usan
alys
isw
ithno
sens
ory
fatig
uelik
ew
ithhu
man
subj
ects
.
Doe
sno
tpro
vide
any
spec
ific
deta
iled
chem
ical
info
rmat
ion
that
ispo
ssib
lew
ithG
C-M
Sm
etho
ds[1
5,84
].
Resp
onse
ofth
ese
nsor
sto
war
dno
n-ta
rget
vola
tiles
(i.e.
wat
erva
pour
orC
O2)m
ayal
ter
sens
orre
spon
sepa
ttern
s[1
5].
Nee
dfo
rse
vera
lsen
sors
(3–1
5)fo
rth
ean
alys
isan
dde
terio
ratio
nof
the
sens
ors
with
time
[15]
.
P1: SFK/UKS P2: SFKc05 BLBK298-Alasalvar August 5, 2010 15:20 Trim: 244mm×172mm
Instrumental analysis of seafood flavour 59
dedicated to GCO [75,85]. Some common methods based on GCO include aroma extractdilution analysis (AEDA) [86], Charm [87], and Osme [88]. These methods mainly differ inhow GCO data are recorded and analyzed.
Osme (time-intensity measurement) measures the perceived odour intensity of a compoundin the GC effluent. The subject rates the aroma intensity by using a computerized 16-point scale time-intensity device and indicates the corresponding aroma characteristics.This technique provides an FID-style aromagram called an osmegram [75]. AEDA andCharmAnalysis (dilution techniques) both rely on GCO of a serial dilution series of anaroma extract. In AEDA, each odour-active compound is assigned a flavour dilution (FD)factor, which is based on the highest extract dilution at which the odorant was last detected byGCO. FD factors are proportional to the odour unit values (compound concentration/odour-detection threshold). CharmAnalysis differs from AEDA in that the duration of the perceivedodour is taken into consideration in the calculation of odour unit values. AEDA has beenused to determine potent odorants in hake [89], boiled carp fillet [90], cooked turbot [91],skipjack tuna sauce [92], cooked spiny lobster tail meat [45], and boiled cod [93]. The use ofCharmAnalysis [18] and/or Osme [94] for the evaluation of seafood flavour is limited. Othermiscellaneous GCO techniques have also been used in the study of seafood flavour [40,58].
5.3.1.2 Multidimensional gas chromatography
With samples as complex as those encountered in a typical flavour analysis, even with the besthigh-resolution GC column components sometimes co-elute during GC-MS analysis, pro-ducing mixed mass spectra that are difficult to interpret [19]. Multidimensional GC (MDGC),which utilizes two different GC columns (having different selectivities) in series, termed apre-column and an analytical column, can often overcome this problem [19]. A thoroughdiscussion of MDGC can be found elsewhere [95]. Comprehensive two-dimensional GC,a type of MDGC, was recently developed, which allows greater separation efficiency thantraditional MDGC [30]. MDGC has been used in the identification of specific environmentalpollutant (PCB and dioxin) in seafood (Baltic herring) and seafood products (fish oil) ratherthan in the study of seafood flavour [96,97].
5.3.2 Mass spectrometry
Electron impact mass spectrometry (EI-MS) is the most common mass spectral techniqueused in flavour analysis, but alternative forms of MS may be employed following other massspectral techniques for certain specific problems.
5.3.2.1 High resolution mass spectrometry
Mass spectrometers may be classified as low-resolution (LR) or high-resolution (HR) in-struments. The LR instruments provide mass measurements to the closet whole unit mass.Since many combinations of atoms may give the same unit mass, LR-MS may provide themolecular weight of a compound but does not provide elemental composition. HR instru-ments provide sufficiently accurate mass measurements to permit determination of elementalcomposition [15]. HR-MS has not yet been widely exploited in seafood flavour analysis –currently focused on the analysis of environmental pollutants in seafood [98]. However,with the continuous improvements in the performance of commercial magnetic sector and

P1: SFK/UKS P2: SFKc05 BLBK298-Alasalvar August 5, 2010 15:20 Trim: 244mm×172mm
60 Seafood Quality, Safety and Health Applications
time-of-flight mass spectrometers, especially with regard to sensitivity at high resolution,this method will become more readily available in future [19].
5.3.2.2 Selected ion monitoring mass spectrometry
In the selected ion monitoring (SIM) mode, the MS continuously measures only selected ionsrepresentative of a specific compound, or group of compounds at very short time intervalsthroughout a GC run. The technique is extremely useful in enabling a very high sensitivityassay for the known component or types of components in question, but it does not contributeto the identification of unknown compounds, since full spectra are not recorded. For instance,geosmin ((E)-1,10-dimethyl-(E)-9-decalol), which is an environmental-related off-flavour inseafood products (described as earthy-musty) [99], can be detected at trace levels by selectingm/z 97, 112, and 125 with SIM mode [100].
An alternative approach is “mass chromatography”, which is useful for deconvolutingco-eluted GC peaks [101]. The difference is that complete mass spectra have been recordedthroughout the GC-MS run, rather than selected ions as in SIM. The data analysis system canthen be instructed to select appropriate specific ions from the full recorded spectra of the peak,with the objective of artificially resolving and recognizing the two (or more) components ofthe peak [19].
5.3.2.3 Chemical ionization mass spectrometry
In conventional EI-MS, sometimes no molecular ion peak is obtained in the mass spectrum ofa compound. This may be due to the instability of the molecular ion under the excessive energyimparted by electron impact (an energy of 70 eV is usually employed in EI-MS). If sometarget compounds in a sample are susceptible to the EI, a softer ionization technique shouldbe employed. Chemical ionization (CI) is the most common alternative, softer ionizationapproach in GC-MS. In CI-MS, a reagent gas, such as methane, isobutene, or ammonia,is introduced into the mass spectrometer source to be ionized by broadly conventional EI.A range of positive ions, such as C2H5
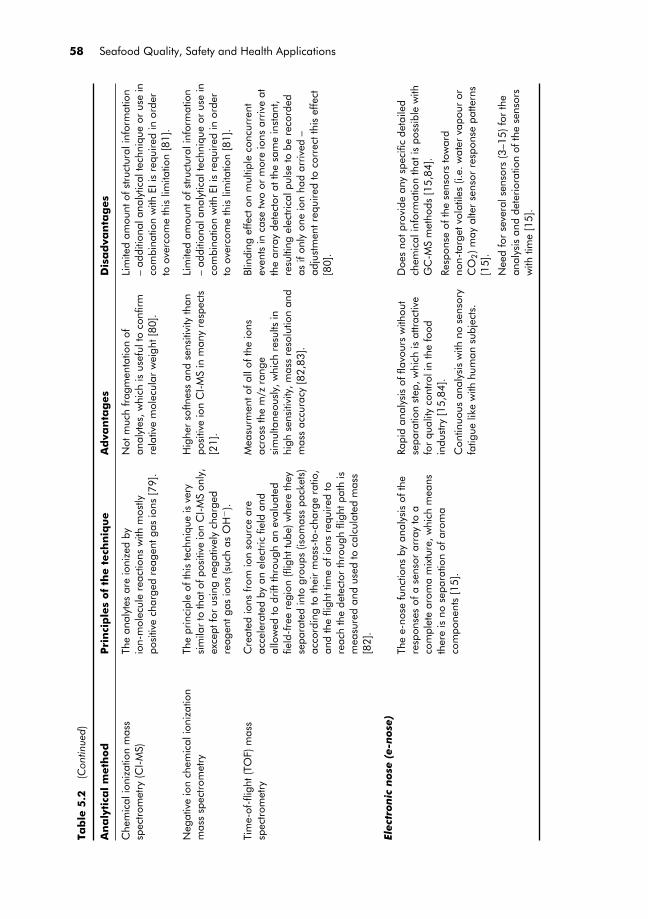
+ from methane, is produced. Sample moleculesare then ionized by ion-molecule reactions with reagent gas species. The result is that so-called pseudo-molecular ions are produced, such as (M+H)+, by proton transfer. Typicallyenergy of only 5 eV is imparted to sample molecules, so usually very little fragmentation isobserved under these conditions. The value of CI-MS in flavour analysis is to complementand supplement the data provided by EI-MS [19]. CI-MS is commonly used in stable isotopedilution analysis and has been applied to the analysis of important seafood aroma compounds[36,64,102].
5.3.2.4 Negative chemical ionization mass spectrometry
In addition to positive ion CI-MS, it is possible to perform negative ion CI-MS, in whichnegatively charged reagent gas ions, such as OH−, undergo similar ion molecule interactionswith sample molecules, but with the result that negatively charged pseudo-molecular ionsare obtained, such as (M-H)−, which is produced by proton abstraction. In many respects,negative ion CI-MS can be superior to positive ion CI-MS, both in terms of sensitivity anddegree of “softness”. Negative ion CI-MS has not been widely used in flavour analysis exceptin the case of target analysis, such as in stable isotope dilution analysis [103].

P1: SFK/UKS P2: SFKc05 BLBK298-Alasalvar August 5, 2010 15:20 Trim: 244mm×172mm
Instrumental analysis of seafood flavour 61
5.3.2.5 Time-of-flight mass spectrometry
The time-of-flight (TOF) mass spectrometer uniquely offers the ability to take a large numberof spectra across a GC peak. This is because TOF instruments employ a detector array forfull range mass detection, which means TOF-MS does not scan but rather measures all of theions across the m/z range simultaneously with a much faster spectra generation rate (50–500spectra/sec) than other types of spectrometers, such as quadrupoles (5–10 spectra/sec) or iontraps (10–15 spectra/sec). Therefore, TOF-MS has improved sensitivity and detection limits.The ability to take many spectra per unit time offers another advantage in facilitating thedeconvolution of mixed spectra that is resolving the MS data from one compound from amixture of compounds that co-elute. If it is required to resolve one compound from anotherto obtain a MS identification, TOF-MS with proper software is able to make identificationsand quantification frequently without the need for peak resolution [15,82]. TOF-MS hasbeen widely used in flavour analysis of foods, such as cooked beans [104], grains [105,106],wines [107,108], olive oil [109], roasted beef [110], and Cheddar cheese [111]. In the fieldof seafood, it has been mainly used for quality control (fish authentication by analysis ofbiomarkers) [112].
5.3.3 Electronic nose
The electronic nose (e-nose) offers a third technique (between instrumental and sensoryanalyses) for analyzing food aroma. E-nose is based on a process similar to the humanolfactometry system in that both e-nose and human olfactory systems consist of an array ofreceptors (sensors), yielding a pattern (signal) of response to any given aroma. The brain,in the case of humans, and the computer, in the case of e-nose, make judgments based on apattern recognition process as to the aroma and its quality [15].
In e-nose, the sample is placed into a glass vessel. Transfer of the headspace vapour to thesensor array can be achieved either by diffusion or by pumping the vapour to the sensors. Thesensors are key components of the e-nose system. Currently, there are several types of sensors,including semiconductor gas sensors, surface acoustic wave devices, biosensors/enzymesensors (designed to measure a specific compound), conducting polymer sensors, and massspectrometry-based sensors [113,114]. In the case of an MS-based e-nose, the analyst canprogramme the system to detect some target sensory-relevant volatile components. The datataken from the e-nose is usually statistically analyzed using software in order to interpretthe e-nose pattern towards the target analyte. Other detail reviews can be found elsewhere[113,114]. The e-nose has been widely employed in the quality control field of seafoods,such as detection of spoiling Alaska Pollack [115] and octopus [116].
5.4 Conclusions
There are numerous methods for the isolation and analysis of the volatile flavour componentsof seafoods and seafood products. Among the various isolation techniques, headspace sam-pling methods are relatively simpler and faster than solvent or distillation extraction methods.Headspace methods also have advantages for the isolation of analytes with low molecularweights and high volatilities. However, for the exhaustive isolation of seafood flavour com-pounds of intermediate and low volatilities, the later techniques are a better choice. In regardto the instrumental analysis of seafood flavour, the classic tandem GC-MS based method is
P1: SFK/UKS P2: SFKc05 BLBK298-Alasalvar August 5, 2010 15:20 Trim: 244mm×172mm
62 Seafood Quality, Safety and Health Applications
predominant. Indeed, for certain specific problems, alternative approaches may sometimesbe superior. Consequently, with a problem as difficult and complex as studying and ana-lyzing the flavour components of seafood and its products, it is recommended to considerall possible techniques and procedures and choose those that are available and which mightyield constructive information.
References
1. Shahidi, F. & Cadwallader, K.R. (1997). Flavor and lipid chemistry of seafoods: an overview. In:Flavor and Lipid Chemistry of Seafoods. Shahidi, F. & Cadwallader, K.R. (eds), ACS SymposiumSeries 674, American Chemical Society, Washington, DC, pp. 1–8.
2. Durnford, E. & Shahidi, F. (1998). Flavour of fish meat. In: Flavor of Meat, Meat Products andSeafoods, 2nd edn. F. Shahidi, F. (ed.), Blackie Academic & Professional, London, UK, pp. 131–158.
3. Konosu, S. & Yamaguchi, K. (1982). The flavor components in fish and shellfish. In: Chemistry &Biochemistry of Marine Food Products. Martin, R.E., Flick, G., Hebard, C.E. & Ward, D.R. (eds), AVIPublishing Company, Westport, CN, pp. 367–404.
4. Lindsay, R.C. (1990). Fish flavors. Food Reviews International, 6, 437–455.5. Kawai, T. (1996). Fish flavor. Critical Reviews in Food Science and Nutrition, 36, 257–298.6. Shirai, T., Hirakawa, Y., Koshikawa, Y. et al. (1996). Taste components of Japanese spiny and shovel-
nosed lobsters. Fisheries Science, 62, 283–287.7. Kato, H., Rhue, M.R. & Nishimura, T. (1989). Role of free amino acids and peptides in food
taste. In: Flavor Chemistry: Trends and Developments. Taranishi, R., Buttery, R. & Shahidi,F. (eds), ACS Symposium Series 388, American Chemical Society, Washington, DC, pp. 158–174.
8. Tarr, H.A.L. & Comer, A.G. (1965). Nucleotides and related compounds, sugars and homarine inshrimp. Journal of the Fisheries Research Board of Canada, 22, 307–311.
9. Porter, R.W. (1968). The acid-soluble nucleotides in king crab muscle. Journal of Food Science, 33,311–314.
10. Jones, N.R. (1969). Meat and fish flavor: significance of ribomononucleotides and their metabolites.Journal of Agricultural and Food Chemistry, 17, 712–716.
11. Hayashi, T., Yamaguchi, K. & Konosu, S. (1981). Sensory analysis of taste-active components in theextract of boiled snow crab meat. Journal of Food Science, 46, 479–483.
12. Burns, B.G. & Ke, P.J. (1985). Liquid-chromatographic determination of hypoxanthine contents in fishtissue. Journal of the Association of Official Analytical Chemists, 68, 444–448.
13. Ryder, J.M. (1985). Determination of adenosine-triphosphate and its breakdown products in fishmuscle by high-performance liquid-chromatography. Journal of Agricultural and Food Chemistry, 33,678–680.
14. Chiou, T.K. & Konosu, S. (1988). Changes in extractive components during processing of dried mulletroe. Nippon Suisan Gakkaishi, 54, 307–313.
15. Reineccius, G. (2006). Flavor Chemistry and Technology, 2nd edn. CRC Press, Taylor & FrancisGroup, Boca Raton, FL.
16. Josephson, DB. (1991). Seafood. In: Volatile Compounds in Foods and Beverages. Maarse, H. (ed.),Marcel Dekker, Inc., New York, pp. 179–202.
17. Schrader, K.K. & Rimando, A.M. (2003). Off-flavors in aquaculture: An overview. In: Off-Flavors inAquaculture. Rimando, A.M. & Schrader, K.K. (eds), ACS Symposium Series 848, American ChemicalSociety, Washington, DC, pp. 1–12.
18. Senger-Emonnot, P., Rochard, S., Pellegrin, F., George, G., Fernaadez, X. & Lizzani-Cuvelier, L.(2006). Odour active aroma compounds of sea fig (Microcosmus sulcatus). Food Chemistry, 97,465–471.
19. Cadwallader, K.R. & Macleod, A.J. (1998). Instrumental methods for analyzing the flavor of musclefoods. In: Flavor of Meat, Meat Products and Seafoods, 2nd edn. Shahidi, F. (ed.), Blackie Academic& Professional, London, UK, pp. 355–372.
20. Ettre, L.S. (2002). The beginning of headspace analysis. LCGC North America, 20, 1120–1129.

P1: SFK/UKS P2: SFKc05 BLBK298-Alasalvar August 5, 2010 15:20 Trim: 244mm×172mm
Instrumental analysis of seafood flavour 63
21. Rouseff, R.L. & Cadwallader, K.R. (2001). Headspace techniques in foods, fragrances and flavors.An overview. In: Headspace Analysis of Foods and Flavors: Theory and Practice. Rouseff. R.L. &Cadwallader, K.R. (eds), Kluwer Academic/Plenum Publishers, New York, pp. 1–8.
22. Wampler, T.P. (1997). Analysis of food volatiles using headspace-gas chromatographic tech-niques. In: Techniques for Analyzing Food Aroma. Marsili, R. (ed.), Marcel Dekker, New York,pp. 27–58.
23. Kolb, B. & Ettre, L.S. (2006). Static Headspace-Gas Chromatography: Theory and Practice, 2nd edn.John Wiley & Sons, New York.
24. Pawliszyn, J. (2001). Solid phase microextraction. In: Headspace Analysis of Foods and Flavors:Theory and Practice, Rouseff, R.L. & Cadwallader, K.R. (eds), Kluwer Academic/Plenum Publishers,New York, pp. 73–87.
25. Rohloff, J. (2004). Essential oil drugs: terpene composition of aromatic herbs. In: Production Practicesand Quality Assessment of Food Crops: Quality Handling and Evaluation, Vol. 3. Dris, R. & Jain, S.M.(eds), Kluwer Academic Publishers, New York, pp. 73–128.
26. Zhang, J., Su, T. & Lee, H.K. (2006). Development and application of microporous hollow fiberprotected liquid-phase microextraction via gaseous diffusion to the determination of phenols andwater. Journal of Chromatography A, 1121, 10–15.
27. Liu, B.-M., Malik, P. & Wu, H.-F. (2004). Single-drop microextraction and gas chromatography/massspectrometric determination of anisaldehyde isomers in human urine and blood serum. Rapid Commu-nications in Mass Spectrometry, 18, 2059–2064.
28. Bicchi, C., Cordero, C., Liberto, E., Sgorbini, B. & Rubiolo, P. (2008). Headspace sampling of thevolatile fraction of vegetable matrices. Journal of Chrmatography A, 1184, 220–233.
29. Guerrero, E.D., Marın, R.N., Mejıas, R.C. & Barroso, C.G. (2006). Optimisation of stir bar sorptiveextraction applied to the determination of volatile compounds in vinegars. Journal of ChromatographyA, 1104, 47–53.
30. McGorrin, R.J. (2007). Flavor analysis of dairy products. In: Flavor of Dairy Products. Cadwallader,K.R., Drake, M. & McGorrin, R.J. (eds), ACS Symposium Series 971, American Chemical Society,Washington, DC, pp. 23–49.
31. Parliment, T. (2002). Solvent extraction and distillation techniques. In: Flavor, Fragrance, and OdorAnalysis. Marsili, R. (ed.), Marcel Dekker, New York, pp. 1–23.
32. Reineccius, G. (1994). Source Book of Flavors, 2nd edn. Chapman & Hall, New York.33. Teranishi, R., Murphy, E.L. & Mon, T.R. (1977). Steam distillation-solvent extraction recovery of
volatiles from fats and oils. Journal of Agricultural and Food Chemistry, 25, 484–488.34. Reineccius, G. (1993). Biases in analytical flavor profiles introduced by isolation method. In: Flavor
Measurement. Ho, C-.T. & Manley, C.H. (eds), Marcel Dekker, New York, pp. 61–76.35. Werkhoff, P., Brennecke, S., Bretschneider, W. & Bertram, H-.J. (2002). Modern methods for isolating
and quantifying volatile flavor and fragrance compounds. In: Flavor, Fragrance and Odor Analysis.Marsili, R. (ed.), Marcel Dekker, New York, pp. 139–204.
36. Milo, C. & Grosch, W. (1995). Detection of odor defects in boiled cod and trout by gas chromatography-olfactometry of headspace samples. Journal of Agricultural and Food Chemistry, 43, 459–462.
37. Medina, I., Satue-Gracia, M., German, J.B. & Frankel, E.N. (1999). Comparison of natural polyphenolantioxidants from extra virgin olive oil with synthetic antioxidants in tuna lipids during thermaloxidation. Journal of Agricultural and Food Chemistry, 47, 4873–4879.
38. Girard, B. & Nakai, S. (1994). Grade classification of canned pink salmon with static headspace volatilepatterns. Journal of Food Science, 59, 507–512.
39. Oliveira, A.C.M., Crapo, C.A., Himelbloom, B., Vorholt, C. & Hoffert, J. (2005). Headspace gaschromatography-mass spectrometry and electronic nose analysis of volatile compounds in cannedAlaska pink salmon having various grades of watermaking. Journal of Food Science, 70, S419–S426.
40. Chung, H.Y., Yeung, C.W., Kim, J.S. & Chen, F. (2007). Static headspace analysis-olfactometry (SHA-O) of odor impact components in salted-dried white herring (Ilisha elongata). Food Chemistry, 104,842–851.
41. Krzymien, M.E. & Elias, L. (1990). Feasibility study on the determination of fish freshness by trimethy-lamine headspace analysis. Journal of Food Science, 55, 1228–1232.
42. Alasalvar, C., Taylor, K.D.A. & Shahidi, F. (2005). Comparison of volatiles of cultured and wild seabream (Sparus aurata) during storage in ice by dynamic headspace analysis/gas chromatography-massspectrometry. Journal of Agricultural and Food Chemistry, 53, 2616–2622.

P1: SFK/UKS P2: SFKc05 BLBK298-Alasalvar August 5, 2010 15:20 Trim: 244mm×172mm
64 Seafood Quality, Safety and Health Applications
43. Aro, T., Tahvonen, R., Koskinen, L. & Kallio, H. (2003). Volatile compounds of Baltic herring analysedby dynamic headspace sampling-gas chromatography-mass spectrometry. European Food Researchand Technology, 216, 483–488.
44. Lee, G.H., Suriyaphan, O. & Cadwallader, K.R. (2001). Aroma components of cooked tail meat ofAmerican lobster (Homarus americanus). Journal of Agricultural and Food Chemistry, 49, 4324–4332.
45. Cadwallader, K.R., Tan, Q., Chen, F. & Meyers, S.P. (1995). Evaluation of the aroma of cooked Spinylobster tail meat by aroma extract dilution analysis. Journal of Agricultural and Food Chemistry, 43,2432–2437.
46. Vejaphan, W., Hsieh, T.C.Y. & Williams, S.S. (1988). Volatile flavor components from boiled crayfish(Procambarus clarkia) tail meat. Journal of Food Science, 53, 1666–1670.
47. Tanchotikul, U. & Hsieh, T.C.-Y. (1989). Volatile flavor components in crayfish waste. Journal of FoodScience, 54, 1515–1520.
48. Josephson, D.B., Lindsay, R.C. & Stuiber, D.A. (1984). Biogenesis of lipid-derived volatile aromacompounds in the emerald shiner (Notropis atherinoides). Journal of Agricultural and Food Chemistry,32, 1347–1352.
49. Josephson, D.B., Lindsay, R.C. & Stuiber, D.A. (1987). Influence of processing on the volatile com-pounds characterizing the flavor of pickled fish. Journal of Food Science, 52, 10–14.
50. Harmon, A.D. (1997). Solid-phase microextraction for the analysis of flavors. In: Techniques forAnalyzing Food Aroma. Marsili, R. (ed.), Marcel Dekker, New York, pp. 81–112.
51. Harmon, A.D. (2002). Solid-phase microextraction for the analysis of aromas and flavor. In: Flavor,Fragrance, and Odor Analysis. Marsili, R. (ed.), Marcel Dekker, New York, pp. 75–106.
52. Marsili, R. (2002). SPME comparison studies and what they reveal. In: Flavor, Fragrance, and OdorAnalysis. Marsili, R. (ed.), Marcel Dekker, New York, pp. 205–227.
53. Ishikawa, M., Ito, M., Ishizaki, S., Kurobayashi, Y. & Fujita, A. (2004). Solid-phase aroma concentrateextraction (SPACETM): A new headspace technique for more sensitive analysis of volatiles. Flavourand Fragrance Journal, 19, 183–187.
54. Ganeko, N., Shoda, M., Hirohara, I. et al. (2008). Analysis of volatile flavor compounds of sardine(Saradinops melanostica) by solid phase microextraction. Journal of Food Science, 73, S83–S88.
55. Bianchi, F., Careri, M., Musci, M. & Mangia, A. (2007). Fish and food safety: Determination offormaldehyde in 12 fish species by SPME extraction and GC-MS analysis. Food Chemistry, 100,1049–1053.
56. Wierda, R.L., Fletcher, G., Xu, L. & Dufour, J.P. (2006). Analysis of volatile compounds as spoilageindicators in fresh king salmon (Oncorhynchus tshawytscha) during storage using SPME-GC-MS.Journal of Agricultural and Food Chemistry, 54, 8480–8490.
57. Chan, S.T., Yao, M.W.Y., Wong, Y.C., Wong, T., Mok, C.S. & Sin, D.W.M. (2006). Evaluation ofchemical indicators for monitoring freshness of food and determination of volatile amines in fish byheadspace solid-phase microextraction and gas chromatography-mass spectrometry. European FoodResearch and Technology, 224, 67–74.
58. Jonsdottir, R., Bragadottir, M. & Arnarson, G.O. (2005). Oxidatively derived volatile compounds inmicroencapsulated fish oil monitored by solid-phase microextraction (SPME). Journal of Food Science,70, C433–C440.
59. Edirisinghe, R.K.B., Graham, A.J. & Taylor, S.J. (2007). Characterisation of the volatiles of yel-lowfin tuna (Thunnus albacares) during storage by solid phase microextraction and GC-MS and theirrelationship to fish quality parameters. International Journal of Food Science and Technology, 42,1139–1147.
60. Duflos, G., Moine, F., Coin, V.M. & Malle, P. (2005). Determination of volatile compounds in whit-ing (Merlangius meralangus) using headspace-solid-phase microextraction-gas chromatography-massspectrometry. Journal of Chromatographic Science, 43, 304–312.
61. Castro, R., Natera, R., DurcLn, E. & Garcca-Barroso, C. (2008). Application of solid phase extractiontechniques to analyse volatile compounds in wines and other enological products. European FoodResearch and Technology, 228, 1–18.
62. Vinas, P., Aguinaga, N., Campillo, N. & Hernandez-Cordoba, M. (2008). Comparison of stir bar sorptiveextraction and membrane-assisted solvent extraction for the ultra-performance liquid chromatographydetermination of oxazole fungicide residue in wines and juices. Journal of Chromatography A, 1194,179–183.
63. Lipinski, J. (2001). Automated solid phase dynamic extraction – Extraction of organics using a wallcoated syringe needle. Fresenius’ Journal of Analytical Chemistry, 369, 57–62.
P1: SFK/UKS P2: SFKc05 BLBK298-Alasalvar August 5, 2010 15:20 Trim: 244mm×172mm
Instrumental analysis of seafood flavour 65
64. Milo, C. & Grosch, W. (1993). Changes in the odorants of boiled trout (Salmo fario) as affected by thestorage of the raw material. Journal of Agricultural and Food Chemistry, 41, 2076–2081.
65. Chaintreau, A. (2001). Simultaneous distillation-extraction: From birth to maturity – Review. Flavourand Fragrance Journal, 16, 136–148.
66. Chung, H.Y., Yung, I.K.S., Ma, W.C.J. & Kim, J.S. (2002). Analysis of volatile components in frozenand dried scallops (Patinopecten yessoensis) by gas chromatography. Food Research International, 35,43–53.
67. Varlet, V., Knockaert, C., Prost, C. & Serot, T. (2006). Comparison of odor-active volatile compoundsof fresh and smoked salmon. Journal of Agricultural and Food Chemistry, 54, 3391–3401.
68. Zhang, H.Z. & Lee, T.C. (1997). Gas chromatography-mass spectrometry analysis of volatile flavorcompounds in mackerel for assessment of fish quality. Flavor and Lipid Chemistry of Seafoods, 674,55–63.
69. Cha, Y.J. & Cadwallader, K.R. (1995). Volatile components in salt-fermented fish and shrimp pastes.Journal of Food Science, 60, 19–24.
70. Chung, H.Y. & Cadwallader, K.R. (1993). Volatile components in blue-crab (Callinectes sapidus) meatand processing by-product. Journal of Food Science, 58, 1203–1207.
71. Chung, H.Y. & Cadwallader, K.R. (1994). Aroma extract dilution analysis of blue-crab meat volatiles.Journal of Agricultural and Food Chemistry, 42, 2867–2870.
72. Cha, Y.J., Cadwallader, K.R. & Baek, H.H. (1993). Volatile flavor components in snow crab cookereffluent and effluent concentrate. Journal of Food Science, 58, 525–530.
73. Baek, H.H. & Cadwallader, K.R. (1996). Volatile compounds in flavor concentrates produced fromcrayfish-processing by-products with and without protease treatment. Journal of Agricultural and FoodChemistry, 44, 3262–3267.
74. Engel, W., Bahr, W. & Schieberle, P. (1999). Solvent assisted flavor evaporation – a new and versatiletechnique for the careful and direct isolation of aroma compounds from complex food matrices.European Food Research and Technology, 209, 237–241.
75. Blank, I. (2002). Gas chromatography-olfactometry in food aroma analysis. In: Flavor, Fragrance, andOdor Analysis. Marsili, R. (ed.), Marcel Dekker, New York, pp. 297–331.
76. Himberg, K., Sippola, E. & Riekkola, M-.L. (1989). Multidimensional gas chromatography: State ofthe art. Journal of Microcolumn Separation, 1, 271–277.
77. van Stee, L.L.P., Beens, J., Vreuls, R.J.J. & Brinkman, U.A.T. (2003). Comprehensive two-dimensionalgas chromatography with atomic emission detection and correlation with mass spectrometrc detection:Principles and application in petrochemical analysis. Journal of Chromatography A, 1019, 89–99.
78. Russell, D.H. & Edmondson, R.D. (1997). High-resolution mass spectrometry and accurate massmeasurements with emphasis on the characterization of peptides and proteins by matrix-assistedlaser desorption/ionization time-of-flight mass spectrometry. Journal of Mass Spectrometry, 32,263–276.
79. Huston, C.K. (1997). Ion trap mass spectrometry for food aroma analysis. In: Techniques for AnalyzingFood Aroma. Marsili, R. (ed.), Marcel Dekker, New York, pp. 209–235.
80. Herbert, C.G. & Johnstone, R.A.W. (2002). Mass Spectrometry Basics. CRC Press, Boca Raton, FL.81. Andrade, F.J., Shelley, J.T., Wetzel, W.C. et al. (2008). Atmospheric pressure chemical ionization
source. 1. Ionization of compounds in the gas phase. Analytical Chemistry, 80, 2646–2653.82. Holland, J.F. & Gardner, B.D. (2002). The advantages of GC-TOFMS for flavor and fragrance analysis.
In: Flavor, Fragrance, and Odor Analysis. Marsili, R. (ed.), Marcel Dekker, New York, pp. 107–138.83. Chernushevich, I.V., Loboda, A.V. & Thomson, B.A. (2001). An introduction to quadrupole-time-of-
flight mass spectrometry. Journal of Mass Spectrometry, 36, 849–865.84. Marsili, R.T. (1999). SPME-MS-MVA as an electric nose for the study of off-flavors in milk. Journal
of Agricultural and Food Chemistry, 47, 648–654.85. Mistry, B.S., Reineccius, T. & Olson, L. (1997). Gas chromatography-olfactometry for the determi-
nation of key odorants in foods. In: Techniques for Analyzing Food Aroma. Marsili, R. (ed.), MarcelDekker, New York, pp. 265–292.
86. Grosch, W. (1993). Detection of potent odorants in foods by aroma extract dilution analysis. Trends inFood Science & Technology, 4, 68–73.
87. Acree, T.E. (1993). Gas chromatography-olfactometry. In: Flavor Measurement. Ho, C.-T. & Manley,C.H. (eds), Marcel Dekker, New York, pp. 77–94.
88. McDaniel, M.R., Miranda-Lopez, R., Watson, B.T., Micheals, N.J. & Libbey, L.M. (1990). Pinot noiraroma: a sensory/gas chromatographic approach. In: Flavors and Off-Flavors: Proceedings of the 6th

P1: SFK/UKS P2: SFKc05 BLBK298-Alasalvar August 5, 2010 15:20 Trim: 244mm×172mm
66 Seafood Quality, Safety and Health Applications
International Flavour Conference. Charalambous, G. (ed.), Elsevier, Amsterdam, The Netherlands,p. 21.
89. Triqui, R. (2006). Sensory and flavor profiles as a means of assessing freshness of hake (Merlucciusmerluccius) during ice storage. European Food Research and Technology, 222, 41–47.
90. Schluter, S., Steinhart, H., Schwarz, F.J. & Kirchgesssner, M. (1999). Changes in the odorants ofboiled carp fillet (Cyprinus carpio L.) as affected by increasing methlionine levels in feed. Journal ofAgricultural and Food Chemistry, 47, 5146–5150.
91. Prost, C., Serot, T. & Demaimay, M. (1998). Identification of the most potent odorants in wild andfarmed cooked turbot (Scophtalamus maximus L.). Journal of Agricultural and Food Chemistry, 46,3214–3219.
92. Cha, Y.J. & Cadwallader, K.R. (1998). Aroma-active compounds in skipjack tuna sauce. Journal ofAgricultural and Food Chemistry, 46, 1123–1128.
93. Milo, C. & Grosch, W. (1996). Changes in the odorants of boiled salmon and cod as affected by thestorage of the raw material. Journal of Agricultural and Food Chemistry, 44, 2366–2371.
94. Pham, A.J., Schilling, M.W., Yoon, Y., Kamadia, V.V. & Marshall, D.L. (2008). Characterization of fishsauce aroma-impact compound using GC-MS, SPME-Osme-GCO, and Stevens’ power law exponents.Journal of Food Science, 73, C268–C274.
95. Wright, D.W. (1997). Application of multidimensional gas chromatography techniques to aroma anal-ysis. In: Techniques for Analyzing Food Aroma. Marsili, R. (eds), Marcel Dekker, New York, pp.113–141.
96. Himberg, K.K. & Sippola, E. (1993). Multidimensional gas-chromatography-mass-spectrometry withNCI detection and C13-labeled internal standards – a novel-approach to the separation and determinationof coplanar PCB congeners. Chemosphere, 27, 17–24.
97. Hoh, E., Lehotay, S.J., Mastovska, K. & Huwe, J.K. (2008). Evaluation of automated direct sample in-troduction with comprehensive two-dimensional gas chromatography/time-of-flight mass spectrometryfor the screening analysis of dioxins in fish oil. Journal of Chromatography A, 1201, 69–77.
98. Hiebl, J., Melcher, J., Gundersen, H., Schlabach, M. & Vetter, W. (2006). Identification and quan-tification of polybrominated hexahydroxanthene derivatives and other halogenated natural products incommercial fish and other marine samples. Journal of Agricultural and Food Chemistry, 54, 2652–2657.
99. Yamprayoon, J. & Noomhorm, A. (2003). Off-flavor in Nile tilapia (Oreochromis niloticus). In: Off-Flavors in Aquaculture. Rimando, A.M. & Schrader, K.K. (eds), ACS Symposium Series 848, AmericanChemical Society, Washington, DC, pp. 235–245.
100. Bagheri, H., Aghakhani, A. & Es-haghi, A. (2007). Sol-gel-based SPME and GC-MS for trace deter-mination of geosmin in water and apple juice samples. Chromatographia, 66, 779–783.
101. Thomas, A.F., Wilhalm, B. & Flament, I. (1984). Some aspects of GC-MS in the analysis of volatileflavors. In: Chromatography and Mass Spectrometry in Nutrition Science and Food Safety. Frigerio,A. & Milon, H, (eds), Elsevier, Amsterdam, The Netherlands, pp. 47–65.
102. Lin, J., Fay, L.B., Welti, D.H. & Blank, I. (2001). Quantification of key odorants formed by autoxidationof arachidonic acid using isotope dilution assay. Lipids, 36, 749–756.
103. Lin, J., Fay, L.B., Welti, D.H. & Blank, I. (1999). Synthesis of trans-4,5-epoxy-(E)-2-decenal and itsdeuterated analog used for the development of a sensitive and selective quantification method basedon isotope dilution assay with negative chemical ionization. Lipids, 34, 1117–1126.
104. Frerot, E., Velluz, A., Bagnoud, A. & Delort, E. (2008). Analysis of the volatile constituents of cookedpetai beans (Parkia speciosa) using high-resolution GC/ToF-MS. Flavour and Fragrance Journal, 23,434–440.
105. Ghiasvand, A.R., Setkova, L. & Pawliszyn, J. (2007). Determination of flavour profile in Iranian fragrantrice samples using cold-fibre SPME-GC-TOF-MS. Flavour and Fragrance Journal, 22, 377–391.
106. Bianchi, F., Careri, M., Conti, C., Musci, M. & Vreuls, R. (2007). Comparison of comprehensivetwo-dimensional gas chromatography time-of-flight mass spectrometry and gas chromatography-massspectrometry for the qualitative characterization of roasted barley by solid phase microextraction.Journal of Separation Science, 30, 527–533.
107. Nasi, A., Ferranti, P., Amato, S. & Chianese, L. (2008). Identification of free and bound volatilecompounds as typicalness and authenticity of non-aromatic grapes and wines through a combined useof mass spectrometric techniques. Food Chemistry, 110, 762–768.
108. Setkova, L., Risticevic, S. & Pawliszyn, J. (2007). Rapid headspace solid-phase microextraction-gaschromatographic-time-of-flight mass spectrometric method for qualitative profiling of ice wine volatilefraction – I. Method development and optimization. Journal of Chromatography A, 1147, 213–223.

P1: SFK/UKS P2: SFKc05 BLBK298-Alasalvar August 5, 2010 15:20 Trim: 244mm×172mm
Instrumental analysis of seafood flavour 67
109. Kanavouras, A., Kiritsakis, A. & Hernandez, R.J. (2005). Comparison study on volatile analysis ofextra virgin olive oil by dynamic headspace and solid phase micro-extraction. Food Chemistry, 90,69–79.
110. Rochat, S., de Saint Laumer, J.Y. & Chaintreau, A. (2007). Analysis of sulfur compounds fromthe in-oven roast beef aroma by comprehensive two-dimensional gas chromatography. Journal ofChromatography A, 1147, 85–94.
111. Gogus, F., Ozel, M.Z. & Lewis, A.C. (2006). Analysis of the volatile components of Cheddar cheeseby direct thermal desorption GC x GC-TOF/MS. Journal of Separation Science, 29, 1217–1222.
112. Mazzeo, M.F., Giulio, B.D., Guerriero, G. et al. (2008). Fish authentication by MALDI-TOF massspectrometry. Journal of Agricultural and Food Chemistry, 56, 11,071–11,076.
113. Hodgins, D. (1997). The electronic nose: Sensor array-based instruments that emulate the human nose.In: Techniques for Analyzing Food Aroma. Marsili, R. (ed.), Marcel Dekker, New York, pp. 331–371.
114. Marsili, R. (2002). Combining mass spectrometry and multivariate analysis to make a reliable andversatile electronic nose. In: Flavor, Fragrance, and Odor Analysis. Marsili, R. (ed.), Marcel Dekker,New York, pp. 349–374.
115. Chantarachoti, J., Oliveira, A.C.M., Himelbloom, B.H., Crapo, C.A. & McLachlan, D.G. (2006).Portable electronic nose for detection of spoiling Alaska pink salmon (Oncorhynchus gorbuscha).Journal of Food Science, 71, S414–S421.
116. Zhang, S., Xie, C., Bai, Z., Hu, M., Li, H. & Zeng, D. (2009). Spoiling and formaldehyde-containingdetections in octopus with an E-nose. Food Chemistry, 113, 1346–1350.