handbook of food fortification and health || micronutrient fortification of school lunch meals in...
TRANSCRIPT

395V.R. Preedy et al. (eds.), Handbook of Food Fortification and Health: From Concepts to Public Health Applications Volume 2, Nutrition and Health, DOI 10.1007/978-1-4614-7110-3_31, © Springer Science+Business Media New York 2013
A. K. Osei , MS, PhD (�) Helen Keller International, Asia Paci fi c Regional Of fi ce , Phnom Penh , Cambodia e-mail: andyko fi [email protected]
I. H. Rosenberg , MD • R. F. Houser , PhD Friedman School of Nutrition Science and Policy, Tufts University , Jaharis Building , Boston , MA , USA
M. Mathews , PhD Bharathiar University , Coimbatore , Tamil Nadu , India
D. H. Hamer , MD, FACP Center for Global Health and Development and Department of International Health, Boston University School of Public Health, Crosstown Center, Boston University Medical Campus , Boston , MA , USA
Chapter 31 Micronutrient Forti fi cation of School Lunch Meals in Himalayan Villages
Akoto K. Osei, Irwin H. Rosenberg, Robert F. Houser, Minnie Mathews, and Davidson H. Hamer
Key Points
Micronutrient de fi ciencies affect millions of schoolchildren in developing countries. • In this review, we describe the effectiveness of forti fi cation of cooked lunch meals with multiple • micronutrient powder at school on anemia and micronutrient status of primary schoolchildren in Tehri Garhwal District of Uttarakhand, India. The micronutrient forti fi ed school lunch meal was well accepted by the schoolchildren. • Schoolchildren who consumed the micronutrient forti fi ed school lunch meals for 8 months had • 43 % reduced odds of vitamin A de fi ciency [OR (odds ratio) (95 % CI): 0.57 (0.33–0.97)], folate de fi ciency of 53 % [OR (95 % CI): 0.47 (0.26–0.84)], and vitamin B
12 de fi ciency of 59 % [OR
(95 % CI): 0.41 (0.22–0.86)] compared to placebo. Iron status of schoolchildren also improved signi fi cantly after consuming the micronutrient forti fi ed • school lunch meals. The mean total body iron (TBI) increased from 148.6 ± 0.1 μ mol/kg to 220.5 ± 0.1 μ mol/kg from baseline to post-intervention in the children who consumed the micronu-trient forti fi ed lunch meal compared to an increase from 148.1 ± 0.1 μ mol/kg to 197.6 ± 0.1 μ mol/kg in the placebo group ( p < 0.05).
Keywords Micronutrient powder • Home forti fi cation • Effectiveness • Schoolchildren • India • Anemia • Iron • Vitamin A • Zinc • Folate • Vitamin B
12

396 A.K. Osei et al.
Abbreviations
CI Con fi dence interval IQR Interquartile range OR Odds ratio RDA Recommended dietary allowance RNI Recommended nutrient intake SD Standard deviation SEM Standard error of the mean TBI Total body iron UL Tolerable upper intake level
Introduction
Micronutrient de fi ciencies affect millions of schoolchildren in developing countries [ 1 ] . Anemia is by far the most widely prevalent and affects about 46 % of schoolchildren in low income countries, with the highest prevalence in South Asia (50 %) [ 1, 2 ] . Vitamin A de fi ciency (serum retinol < 0.7 μ mol/L) also affects 23 % of South Asian schoolchildren [ 3 ] . Children with micronutrient de fi ciencies may experience retarded growth [ 4 ] , reduced immune function [ 5 ] , impaired motor and cognitive develop-ment [ 6 ] , and poor school attendance, academic performance, and achievement [ 7 ] .
Inadequate dietary intake, poor bioavailability, and excessive losses from the body are considered the major direct causes of micronutrients de fi ciencies [ 1 ] . These conditions are widespread in devel-oping countries, mainly because the diet in most parts consists mainly of plant-based staples (with high amounts of micronutrient absorption inhibitors) and a relatively limited intake of animal source foods. Infections are also widespread in most developing countries, particularly in rural areas. Nevertheless, the timely provision of micronutrients through nutrition, in addition to adequate care and other health-related interventions, is essential in preventing and often reversing such de fi ciencies and their associated developmental impairments [ 8 ] . Forti fi cation of cooked food just before con-sumption, using micronutrient powders (also called “home forti fi cation”), is considered one of the most cost-effective interventions for improving micronutrient status of young children. Studies from several countries, including India, have demonstrated that forti fi cation of cooked food with micronu-trient powders just before consumption is ef fi cacious in improving micronutrient status of preschool and schoolchildren [ 9– 11 ] . In addition, a recent systematic review found that home forti fi cation of cooked food using micronutrient powders (containing at least iron, vitamin A, and zinc) signi fi cantly reduced anemia by 31 % and iron de fi ciency anemia by 51 % among children less than 2 years old [ 12, 13 ] . However, there is still limited evidence of the effectiveness of this intervention, particularly among schoolchildren. In this chapter, we present the forti fi cation of cooked lunch meals with a mul-tiple micronutrient powder (whereby the cooking and forti fi cation are done at the school); the accep-tance of the forti fi ed meal by schoolchildren; and the effectiveness of the forti fi ed meal on anemia and micronutrient status of schoolchildren in Tehri Garwal district in Uttarakhand State, India. Tehri Garhwal district is a hilly agrarian community located in the mid-Himalayan ranges of Uttarakhand State, about 250 km northeast of Delhi, the capital city of India (Fig. 31.1 ).

39731 Micronutrient Fortifi cation of School Lunch Meals in Himalayan Villages
The School Feeding Program in India
Since 2001, an order from the Supreme Court of India directs all State governments of the country to implement a school feeding program in all public primary schools. Under this program, commonly known as the “midday meal” scheme, primary schoolchildren receive free lunch meals, cooked and served at school for at least 200 days in a school year. In most States, the program has a standardized menu that consists mainly of rice and dhal (sauce prepared using pulse/lentils) or vegetables. In all the States, the aim of the midday meal scheme is to provide each child with at least 1,884 kJ and 12 g of protein per day. This program was mainly designed to address protein-energy malnutrition and not micronutrient de fi ciencies, therefore the micronutrient content of the lunch meal in most schools is considered less than adequate. Although a revision of the guidelines of the program in 2006 recom-mended that the lunch meal should provide adequate quantities of micronutrients such as iron, vita-min A, and folic acid, little has been done to ensure the successful achievement of this objective. In addition, implementation of the midday meal program has not been uniform across all States and has been faced with logistical challenges including limited funding and shortage of supplies including cereals and cooking fuel. In August 2007 (at the beginning of the research that provided data for the
Fig. 31.1 Map of India showing Tehri Garhwal District, the study location. Source : Created with ArcGIS Desktop software, version 9.0
398 A.K. Osei et al.
review presented in this chapter), there were 1,350 public primary schools with 71,423 children enrolled in all the 9 blocks (subdistrict) in Tehri Garwal district of Uttrakhand. The midday meal program was operational in all the schools, which provided schoolchildren with cooked lunch meals at school 6 days per week. No micronutrient intervention or deworming program was active among schoolchildren in the district. This was not surprising since to date programs for addressing micronu-trient malnutrition in India have focused mainly on preschool children and women of reproductive age. With the exceptions of deworming, iodization of salt, and forti fi cation of commercially available foods, no clear policies exist on addressing micronutrient malnutrition among schoolchildren in most parts of India. Even in places where these policies exist, implementation and coverage of micronutri-ent programs is usually poor in rural areas [ 13 ] . Therefore, there is a need for a simple and easy-to-transfer strategy that can be used to address micronutrient de fi ciencies among schoolchildren in rural communities of India.
Formulation of a Micronutrient Powder for Forti fi cation of the School Lunch Meal
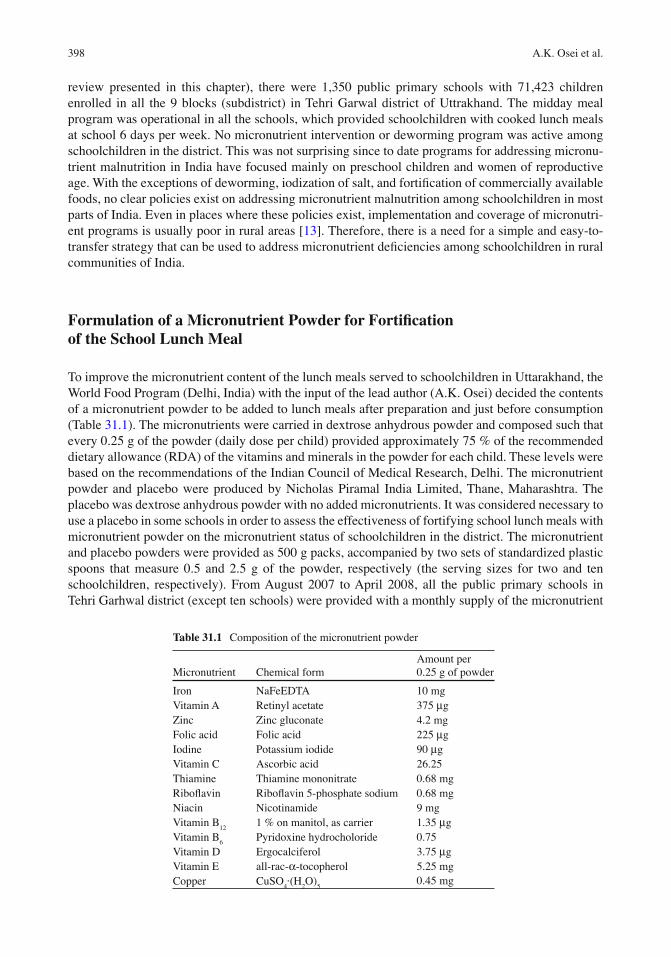
To improve the micronutrient content of the lunch meals served to schoolchildren in Uttarakhand, the World Food Program (Delhi, India) with the input of the lead author (A.K. Osei) decided the contents of a micronutrient powder to be added to lunch meals after preparation and just before consumption (Table 31.1 ). The micronutrients were carried in dextrose anhydrous powder and composed such that every 0.25 g of the powder (daily dose per child) provided approximately 75 % of the recommended dietary allowance (RDA) of the vitamins and minerals in the powder for each child. These levels were based on the recommendations of the Indian Council of Medical Research, Delhi. The micronutrient powder and placebo were produced by Nicholas Piramal India Limited, Thane, Maharashtra. The placebo was dextrose anhydrous powder with no added micronutrients. It was considered necessary to use a placebo in some schools in order to assess the effectiveness of fortifying school lunch meals with micronutrient powder on the micronutrient status of schoolchildren in the district. The micronutrient and placebo powders were provided as 500 g packs, accompanied by two sets of standardized plastic spoons that measure 0.5 and 2.5 g of the powder, respectively (the serving sizes for two and ten schoolchildren, respectively). From August 2007 to April 2008, all the public primary schools in Tehri Garhwal district (except ten schools) were provided with a monthly supply of the micronutrient
Table 31.1 Composition of the micronutrient powder
Micronutrient Chemical form Amount per 0.25 g of powder
Iron NaFeEDTA 10 mg Vitamin A Retinyl acetate 375 μ g Zinc Zinc gluconate 4.2 mg Folic acid Folic acid 225 μ g Iodine Potassium iodide 90 μ g Vitamin C Ascorbic acid 26.25 Thiamine Thiamine mononitrate 0.68 mg Ribo fl avin Ribo fl avin 5-phosphate sodium 0.68 mg Niacin Nicotinamide 9 mg Vitamin B
12 1 % on manitol, as carrier 1.35 μ g
Vitamin B 6 Pyridoxine hydrocholoride 0.75
Vitamin D Ergocalciferol 3.75 μ g Vitamin E all-rac- α -tocopherol 5.25 mg Copper CuSO
4 ·(H
2 O)
5 0.45 mg
39931 Micronutrient Fortifi cation of School Lunch Meals in Himalayan Villages
powder to be added daily to the lunch meals. The remaining ten schools were given the placebo powder during this period, but were switched to receive the micronutrient premix after April 2008. All schools were given a dark brown plastic container for storage after opening the packet of the powder to prevent breakdown of light-sensitive vitamins in the micronutrient powder. Prior to the start of the intervention, the cook and one teacher from each school in the district participated in a half-day training session on the importance of micronutrient forti fi cation, standard procedures of fortifying the school meals (including dosage), and proper handling and storage of the micronutrient and placebo powder.
Forti fi cation of the School Lunch Meals
At each school, a trained school cook prepared and forti fi ed the lunch meals. On each day, the amount of meals prepared was based on the total number of students present at school. After meal preparation, the cook counted the number of students present in school and measured the appropriate number of spoons of the assigned powder (either micronutrient or placebo) to be added to the food. The mea-sured powder was then mixed thoroughly with a small quantity of water before addition to the meal at “room temperature,” in order to reduce the extent of breakdown of heat-sensitive micronutrients.
Retention of the Vitamin and Mineral Content of the Micronutrient Powder
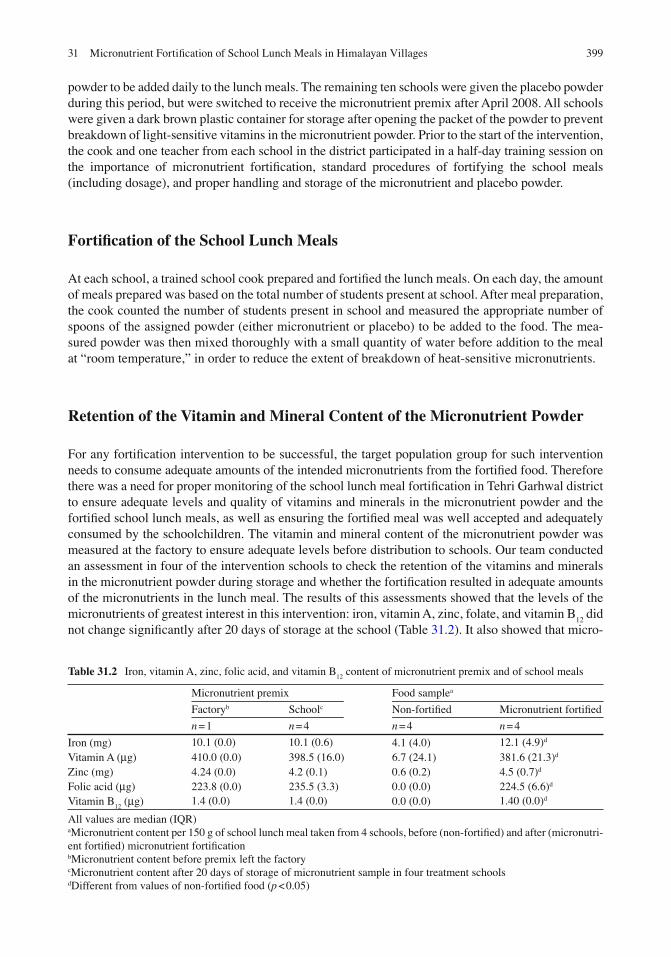
For any forti fi cation intervention to be successful, the target population group for such intervention needs to consume adequate amounts of the intended micronutrients from the forti fi ed food. Therefore there was a need for proper monitoring of the school lunch meal forti fi cation in Tehri Garhwal district to ensure adequate levels and quality of vitamins and minerals in the micronutrient powder and the forti fi ed school lunch meals, as well as ensuring the forti fi ed meal was well accepted and adequately consumed by the schoolchildren. The vitamin and mineral content of the micronutrient powder was measured at the factory to ensure adequate levels before distribution to schools. Our team conducted an assessment in four of the intervention schools to check the retention of the vitamins and minerals in the micronutrient powder during storage and whether the forti fi cation resulted in adequate amounts of the micronutrients in the lunch meal. The results of this assessments showed that the levels of the micronutrients of greatest interest in this intervention: iron, vitamin A, zinc, folate, and vitamin B
12 did
not change signi fi cantly after 20 days of storage at the school (Table 31.2 ). It also showed that micro-
Table 31.2 Iron, vitamin A, zinc, folic acid, and vitamin B 12
content of micronutrient premix and of school meals
Micronutrient premix Food sample a
Factory b School c Non-forti fi ed Micronutrient forti fi ed
n = 1 n = 4 n = 4 n = 4
Iron (mg) 10.1 (0.0) 10.1 (0.6) 4.1 (4.0) 12.1 (4.9) d Vitamin A ( μ g) 410.0 (0.0) 398.5 (16.0) 6.7 (24.1) 381.6 (21.3) d Zinc (mg) 4.24 (0.0) 4.2 (0.1) 0.6 (0.2) 4.5 (0.7) d Folic acid ( μ g) 223.8 (0.0) 235.5 (3.3) 0.0 (0.0) 224.5 (6.6) d Vitamin B
12 ( μ g) 1.4 (0.0) 1.4 (0.0) 0.0 (0.0) 1.40 (0.0) d
All values are median (IQR) a Micronutrient content per 150 g of school lunch meal taken from 4 schools, before (non-forti fi ed) and after (micronutri-ent forti fi ed) micronutrient forti fi cation b Micronutrient content before premix left the factory c Micronutrient content after 20 days of storage of micronutrient sample in four treatment schools d Different from values of non-forti fi ed food ( p < 0.05)
400 A.K. Osei et al.
nutrient content of the unforti fi ed school meal was very low, but the addition of the micronutrient powder signi fi cantly improved the level of micronutrients in the forti fi ed food (Table 31.2 ). These fi ndings were encouraging as it suggests that storing the micronutrient powders under school condi-tions and forti fi cation of the lunch meals by trained school personnel were feasible.
Acceptance of Micronutrient Forti fi ed Lunch Meal by Schoolchildren
To determine the acceptance of the lunch meals forti fi ed with micronutrient powders by schoolchil-dren, we conducted a cross-sectional randomized controlled study among 181 schoolchildren in grades 1–5 in four primary schools in July, 2007. This study has been described in detail elsewhere [ 14 ] . In brief, 91 children were randomized to receive a weighed amount of cooked lunch meal forti fi ed with the micronutrient powder (treatment group) and 90 children received the regular unforti fi ed lunch meal (control group). Just before eating, the children were interviewed to determine if they were hungry, their desire to eat the school meals, and whether they took breakfast at home before coming to school. After having eaten, the children were asked to rate, on a three point Likert scale using “smiley” faces, the pleasantness of smell and taste with the scale ranging from 1 (dislike very much), 2 (like it), to 3 (like it very much). Overall, the micronutrient forti fi ed food was well accepted by the schoolchildren. The addition of a micronutrient powder to cooked lunch meals at the school did not affect the weight of food consumed and therefore acceptance of the meal by the schoolchildren. The mean weight of food consumed by children in the treatment (345.0 ± 114 g) and control (360.0 ± 102.4 g) groups was similar. A fi fth of the children did not fi nish the plate of food served to them and this was not signi fi cantly different between the treatment (25.6 %) and control (16.9 %) groups. Almost one out of every fi ve children in each of the two groups requested more food after fi nishing their fi rst servings (treatment = 21.1 % and control = 20.2 %). Children also highly rated the taste, smell, and general acceptability of the micronutrient forti fi ed and unforti fi ed school meals with no signi fi cant difference between the 2 ratings. No child showed dislike for the taste or smell or general appeal of the micronutrient forti fi ed school lunch meal. Only one child disliked the smell of the unforti fi ed lunch meal. These fi ndings are consistent with results of several studies which have dem-onstrated that foods forti fi ed with a micronutrient powder just before consumption are well accepted by children [ 15 ] . These data also suggest that forti fi cation of school meals has the potential to improve the micronutrient status of schoolchildren in the Himalayan villages of India, because a forti fi ed food needs to be well consumed for it to have impact on micronutrient status of the target population.
Effectiveness of the Micronutrient Forti fi ed School Lunch Meal on Micronutrient Status of Schoolchildren
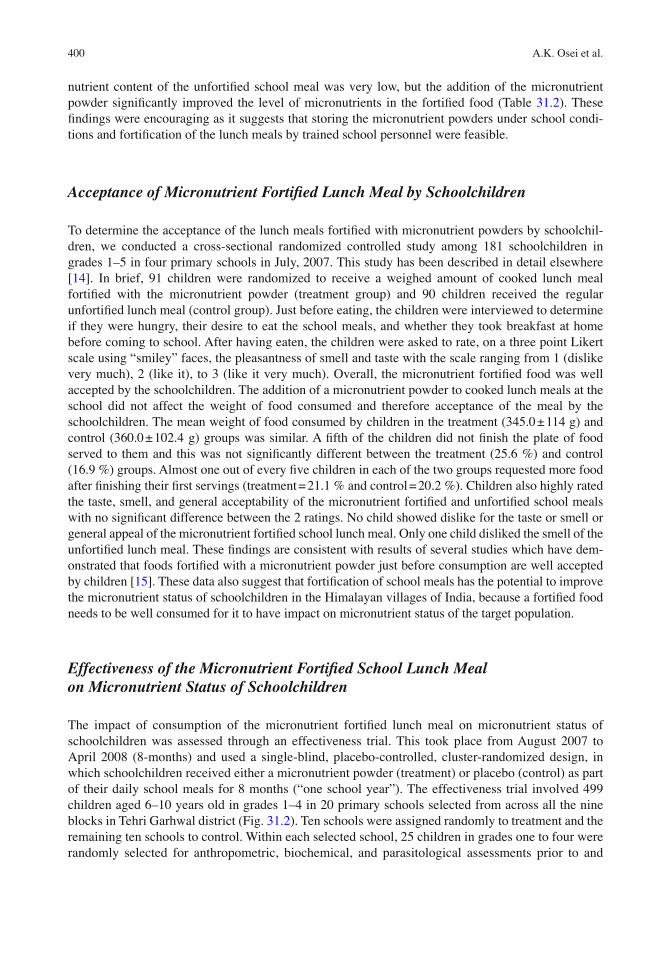
The impact of consumption of the micronutrient forti fi ed lunch meal on micronutrient status of schoolchildren was assessed through an effectiveness trial. This took place from August 2007 to April 2008 (8-months) and used a single-blind, placebo-controlled, cluster-randomized design, in which schoolchildren received either a micronutrient powder (treatment) or placebo (control) as part of their daily school meals for 8 months (“one school year”). The effectiveness trial involved 499 children aged 6–10 years old in grades 1–4 in 20 primary schools selected from across all the nine blocks in Tehri Garhwal district (Fig. 31.2 ). Ten schools were assigned randomly to treatment and the remaining ten schools to control. Within each selected school, 25 children in grades one to four were randomly selected for anthropometric, biochemical, and parasitological assessments prior to and
40131 Micronutrient Fortifi cation of School Lunch Meals in Himalayan Villages
after 8 months of the intervention. The primary caretakers were asked about the child’s morbidity related to occurrence of diarrhea, fever, cough, runny nose, and vomiting in the past 2 weeks. All treatment and control group children who were involved in the assessments were administered an oral dose of 500 mg albendazole before beginning the forti fi cation for the effectiveness trial. All schools in the district, except the ten control schools, were given a micronutrient powder for forti fi cation of lunch meals. The control schools were switched from placebo to micronutrient pow-der at the end of the trial.
Compliance with Intake of Lunch Meals by Schoolchildren Over the 8-Month Period
In an effort to ensure children in this effectiveness study adequately consumed the forti fi ed lunch meal, school headmasters were given a notebook to document the school attendance of children and the number of days that school meals were cooked and forti fi ed. From these registers, it was noted that lunch meals were served on all days that schools were opened during the 8 months of intervention (165 and 166 days for treatment and control schools, respectively). However, in one control school meals were not prepared for 4 days because of shortage of rice. Overall, estimated compliance with intake of the forti fi ed lunch meal, assessed as the ratio of total days of school attendance to the number of days school meal was cooked and forti fi ed during the 8 months of intervention, was 91.2 %, with no difference between children in the treatment (90.7 %) and control groups (91.7 %). This con fi rms the acceptance and adherence of the micronutrient forti fi ed meals by schoolchildren in the district.
Fig. 31.2 Trial Pro fi le for the effectiveness trial on micronutrient forti fi cation of school lunch meals. 1One child was excluded (did not meet inclusion criteria for the study ( n = 1)). 2Twenty-nine children were lost to follow-up since base-line [changed school ( n = 22); travelled out of village ( n = 7)]. 3Fifteen children were lost to follow-up since baseline [changed school ( n = 6); travelled out of village ( n = 7); sick ( n = 1); parents refused blood draw ( n = 1)]

402 A.K. Osei et al.
Impact of the Intervention on Hematologic Indicators and Anemia
Consumption of the forti fi ed school lunch meals for 8 months was not associated with any signi fi cant change in mean hemoglobin concentration within or among the children who received micronutrient forti fi ed and placebo forti fi ed lunch meal. However, iron status of the children improved as a result of the intervention as demonstrated by a signi fi cant improvement in geometric mean serum ferritin con-centrations and increased mean total body iron (TBI) (estimated using the formula by Cook and others [ 16 ] ) in the treatment relative to the control group (Table 31.3 ). Consumption of the micronutrient forti fi ed meals was also associated with a signi fi cant reduction in the prevalence of anemia (hemoglo-bin <115 g/L [ 17 ] ) in bivariate analysis (Fig. 31.3 ), but not in multivariate analysis (see Table 31.4 ). Prevalence of low serum ferritin (<15 μ g/L [ 17 ] ) (Fig. 31.4 ) and iron de fi ciency anemia (both hemo-globin <115 g/L and serum ferritin <15 μ g/L [ 17 ] ) (Fig. 31.5 ) decreased in the children over the study period, with no signi fi cant effect of the intervention.
The lack of a signi fi cant effect on hemoglobin concentration and anemia in multivariate models despite an improvement in iron status in the treatment group can be explained in several ways. The micronutrient forti fi cation is expected to reduce anemia mainly through improvement in iron status,
Table 31.3 Concentrations of hemoglobin and iron status indicators of children at baseline and after 8 months of intervention
Micronutrient Placebo
n = 220 n = 235
Baseline 8 months Baseline 8 months
Hemoglobin (g/L) 122.0 ± 0.1 123.2 ± 0.1 121.7 ± 0.1 122.5 ± 0.1 Ferritin ( μ g/L) 28.6 (25.1–32.7) 34.7 (32.8–36.7) a 30.3 (26.3–34.8) 32.8 (30.9–34.8) sTfR (mg/L) 2.0 ± 0.1 1.2 ± 0.1 a 2.2 ± 0.1 1.3 ± 0.1 a TBI ( μ mol/kg) 148.6 ± 0.1 220.5 ± 0.1 a,b 148.1 ± 0.1 197.6 ± 0.1 a
Values are adjusted mean ± SEM (standard error of the mean), adjusted geometric mean (95 % CI), or percent. Means and geometric means are adjusted for age, sex, and C-reactive protein Anemia was de fi ned as hemoglobin <115 g/L and iron de fi ciency anemia as: hemoglobin <115 g/L and serum ferritin <15 μ g/L a Different from baseline value, p < 0.05 b Different from corresponding placebo value, p < 0.05
Fig. 31.3 Effect of consumption of the forti fi ed school lunch meals on anemia (hemoglobin <115 g/L) prevalence. The histogram shows the proportion of children with anemia (hemoglobin <115 g/L) in the micronutrient and placebo forti fi ed groups, before and after 8 months of the intervention. *8 months value is different from corresponding baseline value, p < 0.05

40331 Micronutrient Fortifi cation of School Lunch Meals in Himalayan Villages
Tabl
e 31
.4
Rep
eate
d m
easu
res
logi
stic
reg
ress
ions
for
ass
essi
ng th
e ef
fect
of
the
mic
ronu
trie
nt f
orti fi
catio
n on
cha
nges
in p
reva
lenc
e of
ane
mia
and
low
ser
um c
once
ntra
tions
of
ferr
itin,
ret
inol
, zin
c, f
olat
e, a
nd v
itam
in B
12 a
fter
8 m
onth
s of
inte
rven
tion
Bin
ary
outc
ome
vari
able
Ane
mia
L
ow s
erum
fer
ritin
V
itam
in A
de fi
cien
cy
Zin
c de
fi cie
ncy
Fola
te d
e fi ci
ency
V
itam
in B
12 d
e fi ci
ency
Tre
atm
ent
0.31
(−
0.08
–0.7
0)
−0.
02 (
−0.
42–0
.46)
0.
16 (
−0.
21–0
.53)
−
0.12
(−
0.50
–0.2
5)
0.43
(0.
03–0
.83)
a 0.
19 (
−0.
29–0
.66)
T
ime
(8 m
onth
s)
−0.
18 (
−0.
52–0
.16)
−
1.63
(−
2.23
to 1
.03)
a −
0.64
(−
1.01
to 0
.28)
a −
0.74
(−
1.09
to 0
.40)
a 0.
06 (
−0.
35–0
.46)
2.
46 (
2.03
–2.9
0) a
Tre
atm
ent ×
tim
e −
0.40
(−
0.90
–0.0
9)
−0.
82 (
−1.
85–0
.22)
−
0.57
(−
1.10
to 0
.03)
a 0.
19 (
−0.
30–0
.68)
−
0.75
(−
1.34
to 0
.17)
a −
0.89
(−
1.49
to 0
.28)
a C
onst
ant
0.31
(−
0.84
–1.4
5)
0.87
(−
0.65
–2.3
9)
0.32
(−
0.69
–1.3
2)
−0.
19 (
−1.
22–0
.83)
1.
21 (
0.26
–2.1
6) a
−1.
20 (
−2.
32 to
0.0
7) a
Val
ues
are
regr
essi
on c
oef fi
cien
ts (
95 %
CI)
, n =
455
for
eac
h m
odel
C
ut-o
ffs
for
de fi n
ition
of
each
dep
ende
nt v
aria
ble
is g
iven
in th
e m
etho
ds s
ectio
n A
ll th
e m
odel
s w
ere
adju
sted
for
the
child
’s a
ge, s
ex, a
nd C
RP
a Sta
tistic
ally
sig
ni fi c
ant,
p <
0.0
5

404 A.K. Osei et al.
because iron is perceived as the most important contributor to anemia among children in developing countries [ 1, 2 ] . The baseline analysis of our sample revealed that anemia in these schoolchildren was related to multiple factors besides iron de fi ciency [ 18 ] . The prevalence of iron de fi ciency anemia in our sample at baseline was low (10.2 %) compared to total anemia prevalence of 36.7 % [ 18 ] . Similar fi ndings, of a high prevalence of anemia but little iron de fi ciency, have been reported in other studies of schoolchildren in Asia [ 19, 20 ] . In populations like this, detecting a larger decrease in total anemia prevalence as a result of improvement in iron status is less likely, since the majority of anemia is not due to iron de fi ciency. Nevertheless, there was some evidence of a high rate of resolution of anemia associated with the intervention in our sample. A subgroup analysis involving only the children who were anemic at baseline (treatment = 87 and control = 77) revealed that 35.6 % of such children in the treatment group remained anemic after 8 months of consuming the forti fi ed food compared to 49.4 %
Fig. 31.4 Effect of consumption of the forti fi ed school lunch meals on prevalence of low serum ferritin concentration (<15 μ g/L). The histogram shows the proportion of children with low serum ferritin concentration (<15 μ g/L) in the micronutrient and placebo forti fi ed groups, before and after 8 months of the intervention. *8 months value is different from corresponding baseline value, p < 0.05
Fig. 31.5 Effect of consumption of the forti fi ed school lunch meals on prevalence of iron de fi ciency anemia (hemoglo-bin <115 g/L and serum ferritin concentration <15 μ g/L). The histogram shows the proportion of children with iron de fi ciency anemia (hemoglobin <115 g/L and serum ferritin concentration <15 μ g/L) in the micronutrient and placebo forti fi ed groups, before and after 8 months of the intervention. *8 months value is different from corresponding baseline value, p < 0.05
40531 Micronutrient Fortifi cation of School Lunch Meals in Himalayan Villages
in the control group (relative risk: 0.74, 95 % CI: 0.54–1.03). This suggests that the risk of continuing to be anemic was reduced by 26 % in the treatment group compared to control group, during the period of the intervention. However, anemia still persisted in the treatment group because for the children who were not anemic at baseline (treatment = 133 and control = 158), the cumulative inci-dence of anemia over the 8 months of intervention was 21.1 % in the treatment group compared to 19.0 % in the control group (relative risk: 1.06; 95 % CI: 0.81–1.40). Thus, despite the high cure rate for anemia, potentially new cases of anemia were about 6 % more likely to happen in the group of children receiving the micronutrient forti fi ed food compared to the group receiving placebo forti fi ed food. All these data suggests that factors other than iron status may in fl uence anemia among school-children in Tehri Garhwal district of Uttarakhand. Our analysis also revealed high prevalence rates of helminth infections including hookworm, Ascaris lumbricoides , Trichuris trichiura, and Taenia sagi-nata among children at both baseline and post-intervention (despite the mass treatment of all the children with albendazole at baseline). Details of these fi ndings are presented elsewhere [ 18, 21 ] . About a third of anemia among schoolchildren in the baseline sample were attributable to helminth infection (attributable fraction of 28 %) [ 18 ] . Thus, the resurgence of helminth infection during the intervention period may have contributed to new cases of anemia and therefore a lack of a signi fi cant effect of the micronutrient forti fi cation of the school lunch meal on total anemia prevalence. As explained below, there was also a high prevalence of other micronutrient de fi ciencies such as vitamins A, B
12 , and folate de fi ciencies among schoolchildren in the district, which may also contribute to
anemia, since such de fi ciencies have been associated with anemia in other studies [ 22, 23 ] . Our data underscore the well-known fact that although micronutrient forti fi cation of lunch meals
for schoolchildren is important in reducing iron de fi ciency anemia, a signi fi cant reduction in total anemia prevalence can be realized only by a comprehensive approach which addresses all other poten-tial causal factors of anemia. Of particular importance is routine mass deworming of schoolchildren in this district as part of strategies to control anemia.
Impact of the Intervention on Vitamin A, Zinc, Folate, and Vitamin B 12 Status
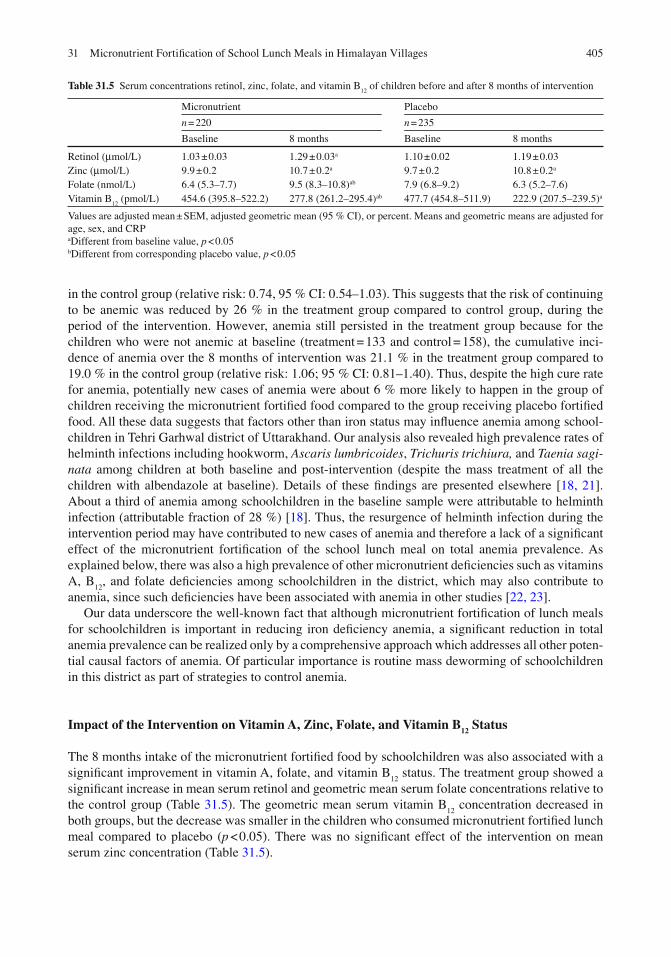
The 8 months intake of the micronutrient forti fi ed food by schoolchildren was also associated with a signi fi cant improvement in vitamin A, folate, and vitamin B
12 status. The treatment group showed a
signi fi cant increase in mean serum retinol and geometric mean serum folate concentrations relative to the control group (Table 31.5 ). The geometric mean serum vitamin B
12 concentration decreased in
both groups, but the decrease was smaller in the children who consumed micronutrient forti fi ed lunch meal compared to placebo ( p < 0.05). There was no signi fi cant effect of the intervention on mean serum zinc concentration (Table 31.5 ).
Table 31.5 Serum concentrations retinol, zinc, folate, and vitamin B 12
of children before and after 8 months of intervention
Micronutrient Placebo
n = 220 n = 235
Baseline 8 months Baseline 8 months
Retinol ( μ mol/L) 1.03 ± 0.03 1.29 ± 0.03 a 1.10 ± 0.02 1.19 ± 0.03 Zinc ( μ mol/L) 9.9 ± 0.2 10.7 ± 0.2 a 9.7 ± 0.2 10.8 ± 0.2 a Folate (nmol/L) 6.4 (5.3–7.7) 9.5 (8.3–10.8) ab 7.9 (6.8–9.2) 6.3 (5.2–7.6) Vitamin B
12 (pmol/L) 454.6 (395.8–522.2) 277.8 (261.2–295.4) ab 477.7 (454.8–511.9) 222.9 (207.5–239.5) a
Values are adjusted mean ± SEM, adjusted geometric mean (95 % CI), or percent. Means and geometric means are adjusted for age, sex, and CRP a Different from baseline value, p < 0.05 b Different from corresponding placebo value, p < 0.05
406 A.K. Osei et al.
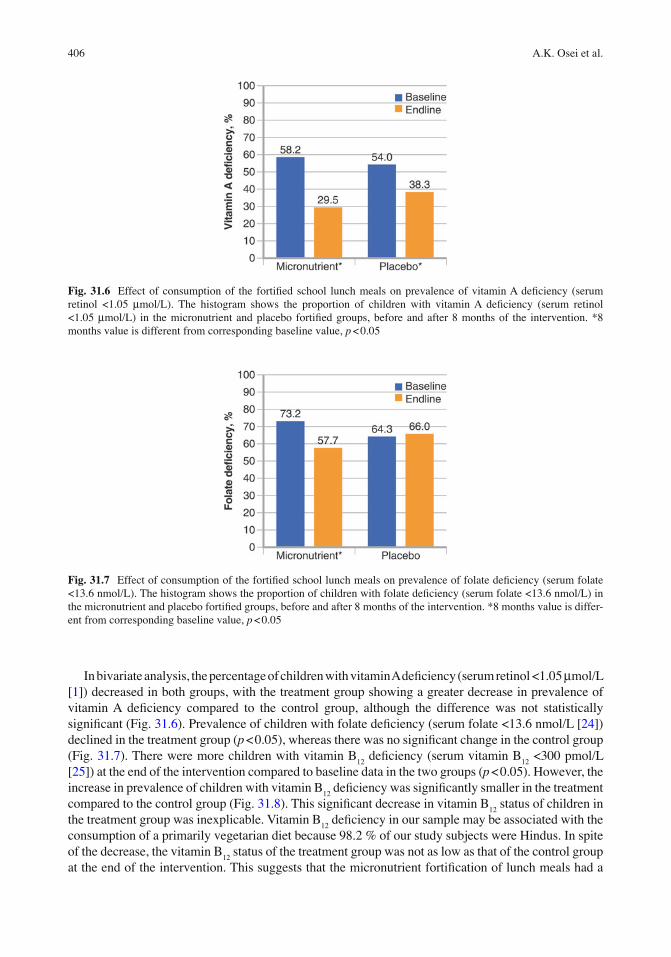
In bivariate analysis, the percentage of children with vitamin A de fi ciency (serum retinol <1.05 μ mol/L [ 1 ] ) decreased in both groups, with the treatment group showing a greater decrease in prevalence of vitamin A de fi ciency compared to the control group, although the difference was not statistically signi fi cant (Fig. 31.6 ). Prevalence of children with folate de fi ciency (serum folate <13.6 nmol/L [ 24 ] ) declined in the treatment group ( p < 0.05), whereas there was no signi fi cant change in the control group (Fig. 31.7 ). There were more children with vitamin B
12 de fi ciency (serum vitamin B
12 <300 pmol/L
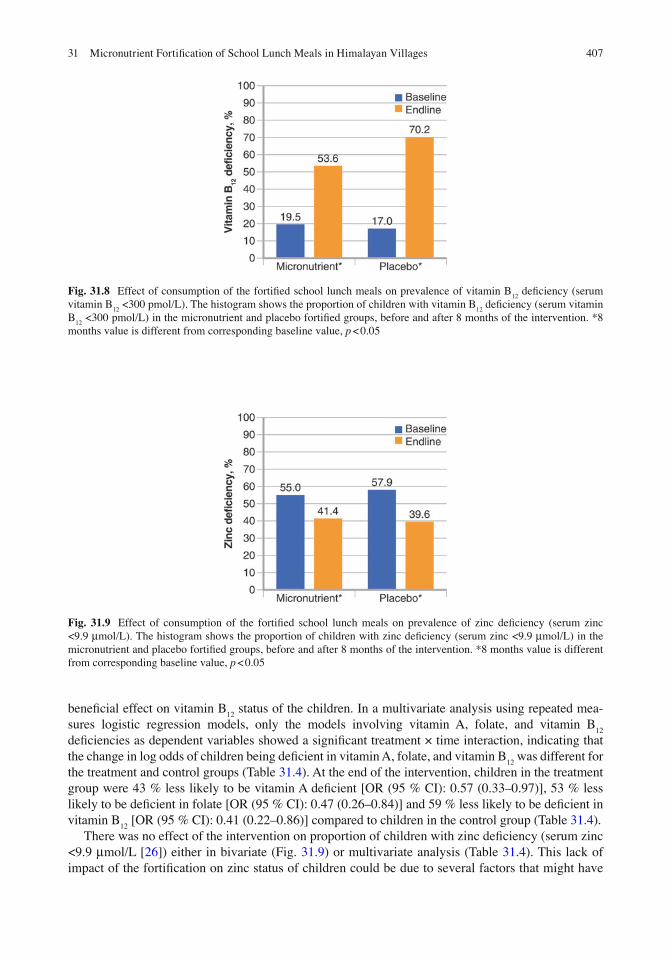
[ 25 ] ) at the end of the intervention compared to baseline data in the two groups ( p < 0.05). However, the increase in prevalence of children with vitamin B
12 de fi ciency was signi fi cantly smaller in the treatment
compared to the control group (Fig. 31.8 ). This signi fi cant decrease in vitamin B 12
status of children in the treatment group was inexplicable. Vitamin B
12 de fi ciency in our sample may be associated with the
consumption of a primarily vegetarian diet because 98.2 % of our study subjects were Hindus. In spite of the decrease, the vitamin B
12 status of the treatment group was not as low as that of the control group
at the end of the intervention. This suggests that the micronutrient forti fi cation of lunch meals had a
Fig. 31.6 Effect of consumption of the forti fi ed school lunch meals on prevalence of vitamin A de fi ciency (serum retinol <1.05 μ mol/L). The histogram shows the proportion of children with vitamin A de fi ciency (serum retinol <1.05 μ mol/L) in the micronutrient and placebo forti fi ed groups, before and after 8 months of the intervention. *8 months value is different from corresponding baseline value, p < 0.05
Fig. 31.7 Effect of consumption of the forti fi ed school lunch meals on prevalence of folate de fi ciency (serum folate <13.6 nmol/L). The histogram shows the proportion of children with folate de fi ciency (serum folate <13.6 nmol/L) in the micronutrient and placebo forti fi ed groups, before and after 8 months of the intervention. *8 months value is differ-ent from corresponding baseline value, p < 0.05
40731 Micronutrient Fortifi cation of School Lunch Meals in Himalayan Villages
bene fi cial effect on vitamin B 12
status of the children. In a multivariate analysis using repeated mea-sures logistic regression models, only the models involving vitamin A, folate, and vitamin B
12
de fi ciencies as dependent variables showed a signi fi cant treatment × time interaction, indicating that the change in log odds of children being de fi cient in vitamin A, folate, and vitamin B
12 was different for
the treatment and control groups (Table 31.4 ). At the end of the intervention, children in the treatment group were 43 % less likely to be vitamin A de fi cient [OR (95 % CI): 0.57 (0.33–0.97)], 53 % less likely to be de fi cient in folate [OR (95 % CI): 0.47 (0.26–0.84)] and 59 % less likely to be de fi cient in vitamin B
12 [OR (95 % CI): 0.41 (0.22–0.86)] compared to children in the control group (Table 31.4 ).
There was no effect of the intervention on proportion of children with zinc de fi ciency (serum zinc <9.9 μ mol/L [ 26 ] ) either in bivariate (Fig. 31.9 ) or multivariate analysis (Table 31.4 ). This lack of impact of the forti fi cation on zinc status of children could be due to several factors that might have
Fig. 31.8 Effect of consumption of the forti fi ed school lunch meals on prevalence of vitamin B 12
de fi ciency (serum vitamin B
12 <300 pmol/L). The histogram shows the proportion of children with vitamin B
12 de fi ciency (serum vitamin
B 12
<300 pmol/L) in the micronutrient and placebo forti fi ed groups, before and after 8 months of the intervention. *8 months value is different from corresponding baseline value, p < 0.05
Fig. 31.9 Effect of consumption of the forti fi ed school lunch meals on prevalence of zinc de fi ciency (serum zinc <9.9 μ mol/L). The histogram shows the proportion of children with zinc de fi ciency (serum zinc <9.9 μ mol/L) in the micronutrient and placebo forti fi ed groups, before and after 8 months of the intervention. *8 months value is different from corresponding baseline value, p < 0.05

408 A.K. Osei et al.
hindered zinc absorption, including the potential interference of iron with zinc and potentially high phytate content of the school meals (since it consist of mainly rice and lentils) [ 26, 27 ] , and the fact that serum zinc is not an adequate indicator of individual zinc status [ 2 ] .
Impact of the Intervention on Infections
There was no bene fi cial effect of the forti fi cation on the prevalence of infectious morbidities among children that was assessed through recall by mothers. The prevalence of diarrhea, fever, cough, runny nose, and vomiting decreased similarly in the treatment and control children between baseline and post-intervention surveys (P, 0.05) (Table 31.6 ). This was not surprising as the limited evidence that exists on impact of home forti fi cation on morbidity outcomes such as diarrhea has been mixed.
Impact of the Intervention on Growth
There was no signi fi cant bene fi t of the lunch meal forti fi cation on the anthropometric indicators of the children. The prevalence of wasting and underweight decreased similarly from baseline to post-inter-vention in the treatment and control groups. Wasting decreased from 12.7 to 8.4 % in the treatment group and control 11.9–7.4 % in the control groups. The prevalence of underweight also decreased from 60.5 to 51.8 % in the treatment group and from 59.6 to 51.5 % in the control group. Again, the lack of impact of the forti fi ed lunch meals on anthropometric indicators of the schoolchildren was not surprising. A systematic review conducted on the impact of home forti fi cation of foods using micro-nutrient powders (containing at least iron, vitamin A, and zinc) on anthropometric indicators of pre-school children, showed no effect of such interventions on the weight-for-age, length-for-age, and weight-for-length Z-score of these children [ 12 ] .
Table 31.6 Morbidity among children before and after 8 months of intervention
Micronutrient Placebo
n = 178 n = 176
Morbidity Diarrhea (%)
Baseline 12.9 15.3 After 8 months 3.4 5.1
Fever (%) Baseline 52.8 44.3 After 8 months 20.8 20.5
Couth (%) Baseline 25.3 19.9 After 8 months 12.9 10.8
Runny nose (%) Baseline 18.0 21.0 After 8 months 2.2 1.7
Vomiting (%) Baseline 7.9 10.2 After 8 months 0.6 2.3
Values are percent
40931 Micronutrient Fortifi cation of School Lunch Meals in Himalayan Villages
Conclusion
In summary, micronutrient forti fi cation of cooked school meals by trained school authorities was effective in improving iron, vitamin A, and folate status and reducing the magnitude of a decrease in vitamin B
12 status of schoolchildren in Himalayan villages of India. School feeding programs can
therefore serve as a suitable vehicle for addressing micronutrient malnutrition among rural school-children. Our fi ndings also add important information to the growing body of evidence that forti fi cation of cooked foods just before consumption is a feasible approach to reduce micronutrient de fi ciencies among children in rural communities.
Guidance on Levels of Micronutrients to be Added in the Powder
The types and amounts of speci fi c nutrients in a micronutrients powder for home forti fi cation inter-ventions are decided based on several factors including the usual nutrient intake, micronutrients status and the recommended nutrient intake (RNI) of the various micronutrients as speci fi ed for the target group, the safety of consuming the forti fi ed food, and the form and levels of the nutrient that will not result in signi fi cant organoleptic changes in the forti fi ed food that can potentially hinder its accep-tance and consumption by the target population [ 28 ] . In general, the nutrient levels in the micronutri-ent powder formulations are composed such that a serving dose of the powder provides at most one RNI of each of the vitamins and minerals per child. It is anticipated that addition of the micronutrient powder to the diet will address the nutrient gap between the usual dietary intake and the RNI of the various micronutrients for individuals in the target population. The combination of the diet and micro-nutrient powders is also expected not to exceed the Tolerable Upper Intake Level (UL) of each micro-nutrient, a level beyond which there is likelihood for potential safety concerns. For almost all the vitamins and minerals in the micronutrient powder formulations for home forti fi cation interventions, the UL is well above the RNI [ 28 ] . Therefore the Home Forti fi cation Technical Advisory Group (HF-TAG) suggests providing a dosage of one RNI of these nutrients solely from the micronutrient powder, in addition to whatever amount being obtained from the diet, is safe for the target populations in home forti fi cation interventions.
Recommendations
Policy makers should therefore consider micronutrient forti fi cation of cooked meals just before con-sumption by trained school authorities as one of the feasible public health strategies for addressing micronutrient de fi ciencies among rural schoolchildren. The addition of micronutrient powder to meals at school has potential advantages of being locally acceptable, sustainable, and has lower implementa-tion cost because it uses the infrastructure of an already existing program. Similar intervention can be considered at home for children not attending schools. However, adoption of this forti fi cation strategy in new areas will require adjustment to the micronutrient levels of the forti fi cant based on the micro-nutrient status and/or consumption pro fi le of the population to avoid excessive intake. Further research is needed to assess the cost-effectiveness of delivering micronutrients through this strategy to schoolchildren.
Acknowledgements We are grateful to Dr. Saraswati Bulusu, Tripti Pantajoshti, Anil Bhutani, and Dr. Rajesh Singh, for assistance with implementation of the intervention and data collection; and to Dr. Ujwala Godbole for laboratory analysis. We appreciate the inputs of Dr. Nevin Scrimshaw and Dr. Gary Gleason for their comments in improving the quality of this work.

410 A.K. Osei et al.
References
1. Ramakrishnan U. Prevalence of micronutrient malnutrition worldwide. Nutr Rev. 2002;60:46S–52. 2. Stoltzfus RJ, Chwaya HM, Tielsch JM, Schulze KJ, Albonico M, Savioli L. Epidemiology of iron de fi ciency
anemia in Zanzibari schoolchildren: the importance of hookworms. Am J Clin Nutr. 1997;65:l53–9. 3. Singh V, West Jr KP. Vitamin A de fi ciency and xerophthalmia among school-aged children in Southeastern Asia.
Eur J Clin Nutr. 2004;58:1342–9. 4. Lawless JW, Latham MC, Stephenson LS, Kinoti SN, Pertet AM. Iron supplementation improves appetite and
growth in anemic Kenyan primary school children. J Nutr. 1994;124:645–54. 5. Thurnham DI. Micronutrient and immune function: some recent developments. J Clin Pathol. 1997;50:887–91. 6. Black MM. Micronutrient de fi ciencies and cognitive functioning. J Nutr. 2003;133:3927–31. 7. Popkin B, Lim-Ybanez M. Nutrition and school achievement. Soc Sci Med. 1982;16:53–61. 8. Jood S, Gupta M, Yadav SK, Khetarpaul N. Effect of supplementation on heamoglobin and serum retinol levels and
nutritional status of school children of northern India. Nutr Health. 2001;15:97–111. 9. Varma JL, Das S, Sankar RS, Mannar MGV, Levinson FJ, Hamer DH. Community-level micronutrient forti fi cation
of a food supplement in India: a controlled trial with pre-school children aged 36–66 months. Am J Clin Nutr. 2007;85:1127–33.
10. Sharieff W, Bhutta Z, Schauer C, Tomlinson G, Zlotkin S. Micronutrients (including zinc) reduce diarrhoea in chil-dren: the Pakistan sprinkles diarrhoea study. Arch Dis Child. 2006;91:573–9.
11. Kumar MV, Rajagopalan S. Impact of a multiple-micronutrient supplement on the nutritional status of schoolchil-dren. Food Nutr Bull. 2006;27:203–10.
12. De-Regil LM, Suchdev PS, Vist GE, Walleser S, Pe fi a-Rosas JP. Home forti fi cation of foods with multiple micro-nutrient powders for health and nutrition in children under 2 years of age. Cochrane Database Syst Rev. 2011;(9):CD008959.
13. Vijayaraghavan K. Control of micronutrient de fi ciencies in India: obstacles and strategies. Nutr Rev. 2002;60(Suppl):73–6.
14. Osei AK, Houser RF, Bulusu S, Hamer DH. Acceptability of micronutrient forti fi ed school meals by schoolchildren in rural Himalayan villages of India. J Food Sci. 2008;73:S354–8.
15. Hyder SMZ, Haseen F, Ip H, Zlotkin S. Acceptability of sprinkles in rural Bangladesh: a new home forti fi cation approach to deliver micronutrients among young children. In: Proceedings of the Federation of American Societies for Experimental Biology (FASEB). San Diego; 2005.
16. Cook J, Flowers CH, Skikne BS. The quantitative assessment of body iron. Blood. 2003;101:3359–64. 17. WHO/UNICEF/UNU. Iron de fi ciency anemia: assessment, prevention and control. A guide for programme manag-
ers. Geneva: WHO; 2001 [Distribution no. 01.3]. 18. Osei AK, Houser RF, Bulusu S, Joshi TP, Hamer DH. Nutritional status of primary schoolchildren in Garhwali
Himalayan villages of India. Food Nutr Bull. 2010;31:221–33. 19. Le HT, Brouwer ID, Verhoef H, Nguyen KC, Kok FJ. Anemia and intestinal parasite infection in school children in
rural Vietnam. Asia Pac J Clin Nutr. 2007;16:716–23. 20. Thurlow RA, Winichagoon P, Green T, Wasantwisut E, Pongcharoen T, Bailey KB, et al. Only a small proportion
of anemia in northeast Thai schoolchildren is associated with iron de fi ciency. Am J Clin Nutr. 2005;82:380–7. 21. Osei AK, Rosenberg IH, Houser RF, Bulusu S, Mathews M, Hamer DH. Community-level micronutrient forti fi cation
of school lunch meals improved vitamin A, folate, and iron status of schoolchildren in Himalayan villages of India. J Nutr. 2010;140:1146–54.
22. Bloem MW, Wedel M, Egger RJ, Speek AJ, Schrijver J, Saowakontha S, et al. Iron metabolism and vitamin A de fi ciency in children in Northeast Thailand. Am J Clin Nutr. 1989;50:332–8.
23. Kraemer K, Zimmermann MB, editors. Nutritional anemia. Switzerland: Sight and life press; 2007. 24. Neumann CG, Bwibo NO, Murphy SP, Sigman M, Guthrie D, Weiss RE, et al. Animal source foods improve dietary
quality, micronutrient status, growth and cognitive function in Kenyan school children: background, study design and baseline fi ndings. J Nutr. 2003;133:3941S–9.
25. Selhub J, Jacques PF, Dallal G, Choumenkovitch S, Rogers G. The use of blood concentrations of vitamins and their respective functional indicators to de fi ne folate and vitamin B-12 status. Food Nutr Bull. 2008;29:67S–73.
26. Hotz C, Brown KH, editors. Assessment of the risk of zinc de fi ciency in populations and options for its control. Food Nutr Bull. 2004;25:132S–62.
27. Hallberg L. Bioavailability of dietary iron in man. Annu Rev Nutr. 1981;1:123–47. 28. Zlotkin SH, Tondeur M. Successful approaches: sprinkles. In: Kraemer K, Zimmermann MB, editors. Nutritional
anemia. Basel, Switzerland: Sight and Life Press; 2007. p. 269–83.