handbook for assessing the impact of a radiological
TRANSCRIPT

HPA-RPD-041
This study was part funded by Defra under contact DWI 70/2/192
© Health Protection Agency Centre for Radiation, Chemical and Environmental Hazards Radiation Protection Division Chilton, Didcot, Oxfordshire OX11 0RQ
Approval: June 2008 Publication: July 2008 £21.00 ISBN 978-0-85951-621-1
This report from HPA Radiation Protection Division reflects understanding and evaluation of the current scientific evidence as presented and referenced in this document.
Handbook for Assessing the Impact of a Radiological Incident on Levels of Radioactivity in Drinking Water and Risks to Operatives at Water Treatment Works: Supporting Scientific Report
J Brown, D Hammond and B T Wilkins
ABSTRACT Incidents or accidents involving radionuclides could lead to contamination of the drinking water supply. If such an event occurred near an open source of supply, then the water would probably pass through an established treatment works prior to being supplied to the consumer. Consequently, any such incident could lead to exposure to radiation for both the consumer of drinking water and the operatives that work in any affected water treatment works. A Handbook has been produced that provides information and guidance for the drinking water industry so that the radiological impact on operatives at treatment works can be quantified and estimates of the likely effectiveness of drinking water treatment in removing radionuclides from water can be made. This supporting scientific report provides a detailed description of how parameter values have been determined for use in estimating the effectiveness of drinking water treatment in removing radionuclides from water. It also describes the methodology used to develop the methodology for assessing doses to operatives working in drinking water treatment works and the input data used.

This work was undertaken under the Environmental Assessment Department’s Quality Management System, which has been approved by Lloyd's Register Quality Assurance to the Quality Management Standards ISO 9001:2000 and TickIT Guide Issue 5, certificate number 956546.
V1.0
ii

iii
EXECUTIVE SUMMARY
Incidents or accidents involving radionuclides could lead to contamination of the drinking water supply. If such an event occurred near an open source of supply, then the water would probably pass through an established treatment works prior to being supplied to the consumer. Consequently, any such incident could lead to exposure to radiation for both the consumer drinking the water and the operatives that work in any affected water treatment works.
The water industry has a responsibility to provide a potable source of drinking water. This Handbook is intended to help the Water Industry in two ways. These are as follows:
• to assess the impact that any radiological incident may have on the drinking water that it supplies;
• to assess the impact that any radiological incident may have on the people carrying out operations at an affected treatment works.
The main focus of the Handbook is to provide a tool for the water industry to manage the potential risks to operatives working with a treatment works. It can be used to help the water industry to make decisions on how the treatment works can be operated in the event of a radiological incident and to manage any radiation exposures to the operatives at the works. It is also expected that the Handbook will be used as a training tool.
Worked examples are included to assist users in both planning for a radiological incident and the management of a radiological incident.
This document is the supporting scientific report that provides a detailed description of how the data have been evaluated and parameter values derived. It also describes the methodology used to develop the calculation tools, contains a review of the effectiveness of drinking water treatment in removing radionuclides from water and gives the input data used for assessing doses to people carrying out operations within drinking water treatment works.

HANDBOOK FOR ASSESSING THE IMPACT OF A RADIOLOGICAL INCIDENT ON LEVELS OF RADIOACTIVITY IN DRINKING WATER AND RISKS TO OPERATIVES AT WATER TREATMENT WORKS: SUPPORTING SCIENTIFIC REPORT
iv

v
CONTENTS
1 Introduction 1 1.1 Radionuclides considered 1
2 Review of treatment processes used in the UK water industry and elsewhere 4 2.1 Water sources 4 2.2 Water treatment processes 5 2.3 Processes involving management of wastes arising from water treatment 9
2.3.1 Maintenance of filters 10 2.3.2 Sludge processing 10
2.4 Factors influencing effectiveness of treatment processes on radionuclide removal 12
2.4.1 Chemical and physical properties of the radionuclides 12 2.4.2 Key treatment steps 13 2.4.3 Raw water quality 13 2.4.4 Types of treatment works 14 2.4.5 Number of treatment steps 14
2.5 Management of raw water sources and strategic resources 14
3 Review of efficiency of drinking water treatment in removing radionuclides from water 15 3.1 Review of literature 16 3.2 Justification for choice of values of water treatment efficiency 17
3.2.1 Impact of physical and chemical characteristics of elements on efficiency of treatment processes 17
3.2.2 Determination of removal efficiency values for water treatment processes 18
3.2.3 Choice of values for elements considered 18 3.3 Use of removal efficiency table 27
4 Estimating activity concentrations in drinking water and waste products 32 4.1 Activity concentrations in treated water 32
4.1.1 Calculation of activity concentration in treated water 32 4.2 Activity concentrations in filter material and waste sludge 34
4.2.1 Calculation of activity concentrations in filter media 35 4.2.2 Calculation of activity concentration in waste sludge 38
4.3 Activity concentrations in waste water 41
5 Assessing doses to operatives working in drinking water treatment works 42 5.1 Operative tasks undertaken in water treatment works 42 5.2 Calculation of doses for the identified generic tasks 46
5.2.1 External doses from gamma-ray emitting radionuclides 47 5.2.2 External dose from beta emitting radionuclides 50 5.2.3 Inadvertent ingestion 52 5.2.4 Inhalation 52
5.3 Overall doses for all relevant exposure pathways 52 5.4 Importance of using site specific data 62 5.5 Discussion of dose factor tables 64

HANDBOOK FOR ASSESSING THE IMPACT OF A RADIOLOGICAL INCIDENT ON LEVELS OF RADIOACTIVITY IN DRINKING WATER AND RISKS TO OPERATIVES AT WATER TREATMENT WORKS: SUPPORTING SCIENTIFIC REPORT
vi
5.5.1 Potentially important tasks 64 5.5.2 Potentially important exposure pathways 65 5.5.3 Sensitivity of doses to choice of removal efficiency factor 70
6 Selection of guidance levels on doses to operatives working in a treatment works in the event of a radiological incident 72 6.1 Application of guidance levels 73
6.1.1 Contingency planning 73 6.1.2 In the event of an incident 73
7 Application of the methodology to the Chernobyl accident 74
8 Concluding remarks 79
9 Acknowledgements 79
10 References 79
APPENDIX A Review of Literature Sources on effectiveness of drinking water treatment 81
A1 Bibliography 81 A2 Summary of content of papers 83

INTRODUCTION
1
1 INTRODUCTION
Incidents or accidents involving radionuclides could lead to contamination of the drinking water supply. If such an event occurred near an open source of supply, then the water would probably pass through an established treatment works prior to being supplied to the consumer. Consequently, any such incident could lead to exposure to radioactive material for both the consumer and the operatives that work in water treatment works. In order to evaluate any radiological impact on the consumer, information needs to be available on the ability of various drinking water treatments to remove radioactivity from water and on the factors that are likely to influence the effectiveness of removal. If water treatment removes radioactivity from the water then this radioactivity will be concentrated in the wastes arising from the treatment carried out or held within the treatment works, either on various surfaces or within filter media. Information is therefore needed to assist the drinking water industry to quantify the radiological impact on operatives in treatment works and to evaluate the likely levels of radioactive contamination that could be in waste generated from the drinking water treatment process.
A Handbook has been produced to provide a tool to assist the drinking water industry evaluate the following in the event of a radiological incident:
a the effectiveness of drinking water treatment processes in removing radioactivity;
b the potential radiation exposures to operatives working within drinking water treatment works for both routine and infrequent tasks;
c those parts of the treatment works where radioactivity may concentrate and the impact of this on radioactivity levels in waste products.
This report is a supporting document to the Handbook. It provides a detailed description of the derivation of parameter values for use in estimating the effectiveness of drinking water treatment in removing radionuclides from water. It also describes the methodology used to develop the calculation tool for assessing doses to operatives working in drinking water treatment works and the input data used.
The use of the methodology to assess doses and the identification of the tasks that are likely to give rise to doses is discussed and then illustrated using data available in the UK following the Chernobyl accident in 1986.
1.1 Radionuclides considered
The following factors were taken into account in the choice of radionuclides for consideration in the Handbook:
a the current use and where the radionuclide can be obtained and/or how it is produced, eg, as a by-product of nuclear reactor operations;

HANDBOOK FOR ASSESSING THE IMPACT OF A RADIOLOGICAL INCIDENT ON LEVELS OF RADIOACTIVITY IN DRINKING WATER AND RISKS TO OPERATIVES AT WATER TREATMENT WORKS: SUPPORTING SCIENTIFIC REPORT
2
b the form of the radionuclide and the ability to contaminate drinking water supplies;
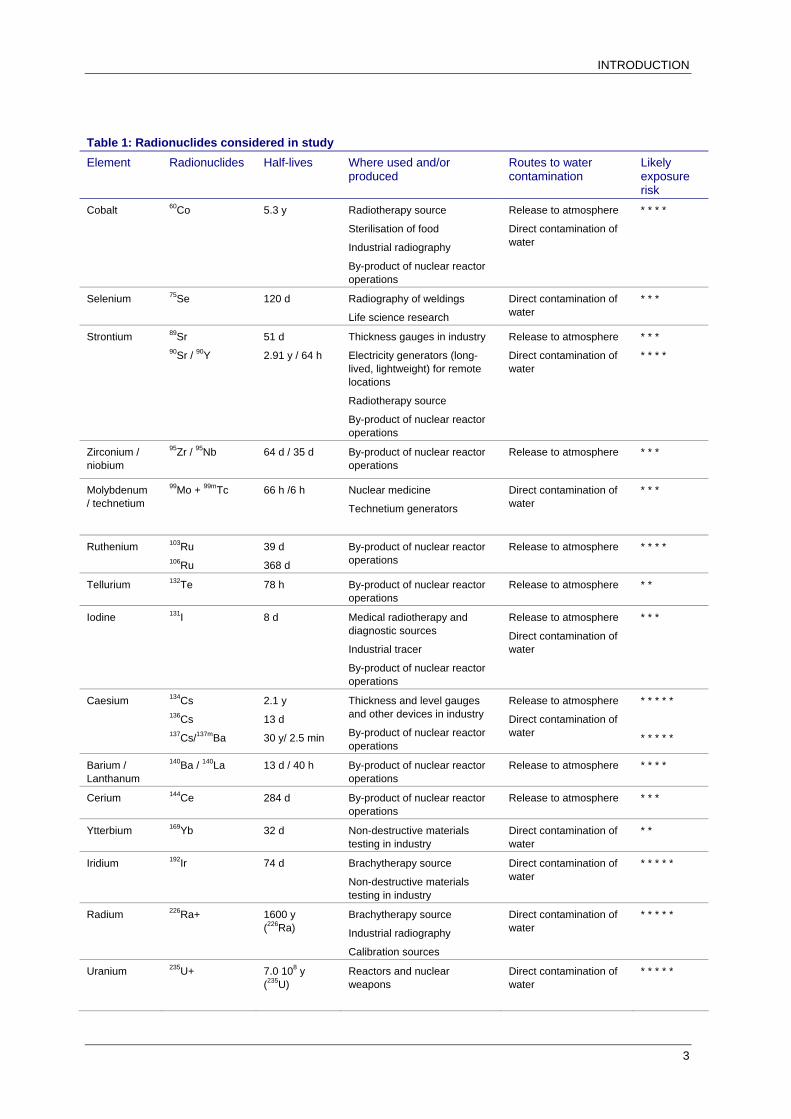
c the likely exposure riska. The radionuclides chosen are listed in Table 1. In addition to the factors listed above, the radionuclides selected also reflect the range of hazards that operatives of drinking water treatment works could be exposed to and exemplify a range of chemical and physical behaviours in drinking water treatment works. Methodologies and illustrative calculations provided in the Handbook will therefore give enough information for the water industry to apply a rigorous approach to assessing potential doses to operatives, even if a specific radionuclide is not considered in detail. In particular, the list covers high-energy beta emitters (eg, 90Sr + daughter 90Y), short-lived high energy beta/gamma emitters (eg, 131I), long-lived high energy beta/gamma emitters (eg, 137Cs and its short-lived decay product 137mBa) and alpha emitters (eg, 239Pu).
a The exposure risk is ranked from * (low risk) to * * * * * (high risk) taking into account both external and internal exposure risks (data taken from Delacroix et al, 2002).
INTRODUCTION
3
Table 1: Radionuclides considered in study Element Radionuclides Half-lives Where used and/or
produced Routes to water contamination
Likely exposure risk
Cobalt 60Co 5.3 y Radiotherapy source
Sterilisation of food
Industrial radiography
By-product of nuclear reactor operations
Release to atmosphere
Direct contamination of water
* * * *
Selenium 75Se 120 d Radiography of weldings
Life science research
Direct contamination of water
* * *
Strontium 89Sr 90Sr / 90Y
51 d
2.91 y / 64 h
Thickness gauges in industry
Electricity generators (long-lived, lightweight) for remote locations
Radiotherapy source
By-product of nuclear reactor operations
Release to atmosphere
Direct contamination of water
* * *
* * * *
Zirconium / niobium
95Zr / 95Nb 64 d / 35 d By-product of nuclear reactor operations
Release to atmosphere
* * *
Molybdenum / technetium
99Mo + 99mTc 66 h /6 h Nuclear medicine
Technetium generators
Direct contamination of water
* * *
Ruthenium 103Ru 106Ru
39 d
368 d
By-product of nuclear reactor operations
Release to atmosphere * * * *
Tellurium 132Te 78 h By-product of nuclear reactor operations
Release to atmosphere * *
Iodine 131I 8 d Medical radiotherapy and diagnostic sources
Industrial tracer
By-product of nuclear reactor operations
Release to atmosphere
Direct contamination of water
* * *
Caesium 134Cs 136Cs 137Cs/137mBa
2.1 y
13 d
30 y/ 2.5 min
Thickness and level gauges and other devices in industry
By-product of nuclear reactor operations
Release to atmosphere
Direct contamination of water
* * * * *
* * * * *
Barium / Lanthanum
140Ba / 140La 13 d / 40 h By-product of nuclear reactor operations
Release to atmosphere * * * *
Cerium 144Ce 284 d By-product of nuclear reactor operations
Release to atmosphere * * *
Ytterbium 169Yb 32 d Non-destructive materials testing in industry
Direct contamination of water
* *
Iridium 192Ir 74 d Brachytherapy source
Non-destructive materials testing in industry
Direct contamination of water
* * * * *
Radium 226Ra+ 1600 y (226Ra)
Brachytherapy source
Industrial radiography
Calibration sources
Direct contamination of water
* * * * *
Uranium 235U+ 7.0 108 y (235U)
Reactors and nuclear weapons
Direct contamination of water
* * * * *

HANDBOOK FOR ASSESSING THE IMPACT OF A RADIOLOGICAL INCIDENT ON LEVELS OF RADIOACTIVITY IN DRINKING WATER AND RISKS TO OPERATIVES AT WATER TREATMENT WORKS: SUPPORTING SCIENTIFIC REPORT
4
Table 1 (continued): Radionuclides considered in study Plutonium 238Pu
239Pu
88 y
2.4 104 y
Power source (satellites, pacemakers)
By-product of nuclear reactor operations
Nuclear weapons (239Pu)
Release to atmosphere
Direct contamination of water
* * * * *
* * * * *
Americium 241Am 432 y Thickness and level gauges and other devices in industry
Medical diagnostics
Research
Smoke detectors
By-product of nuclear reactor operations
Release to atmosphere
Direct contamination of water
* * * * *
2 REVIEW OF TREATMENT PROCESSES USED IN THE UK WATER INDUSTRY AND ELSEWHERE
This Section summarises the main drinking water treatment processes used in the UK. As well as describing normal practices, the flexibility to make changes to these in the event of a radiological incident is discussed. The document also contains information on how normal treatment processes may influence the removal of radionuclides from the drinking water and the importance of the various stages of treatment.
2.1 Water sources
The source of water used depends mainly on its availability with respect to the geographical location of the water treatment works and the size of the area it supplies. The main water sources are: rivers, impounding reservoirs, and groundwater (aquifers).
The raw water quality depends on the level of impurities found in it. Natural impurities such as colour and turbidity (suspended particulate) are the most common and determine the basic level of treatment that is necessary. Other impurities such as bacteria and pesticides can require specific treatment to remove or reduce them.
River water quality can change very quickly and is much more variable than reservoir water. This is because river flows can vary markedly during the year, which can affect factors such as turbidity. In addition, rivers are more susceptible to pollution and run-off from adjoining land, particularly when such land is flooded. Consequently, the extent of treatment needed for river water is often greater than that for reservoirs and groundwater.
Groundwater from deep aquifers is normally very clean and may only require disinfection before it is ready for use as drinking water. However, where it has passed through chalk or limestone it can be very hard, ie, contains high levels of calcium. Groundwater from shallow aquifers can be susceptible to the influence of surface water

REVIEW OF TREATMENT PROCESSES USED IN THE UK WATER INDUSTRY AND ELSEWHERE
5
and may require more treatment. Groundwaters often contain iron and manganese and occasionally ammonia. These require specific treatment for their removal.
2.2 Water treatment processes
There are a number of stages that are used in drinking water treatment and the main processes are shown in Figure 1. In any given treatment works, the number of these main stages that are used depends on the quality of the raw water. The minimum water treatment used is disinfection, which is appropriate for some deep aquifer sources. For clean sources of water from reservoirs or lakes, flocculation and clarification may not be required and treatment would only involve filtration and disinfection. Additional stages in the treatment process would then be added as required. Examples would be further filtration at the raw water inlet or ion exchange for the removal of nitrates.
From the information gathered, the important treatment processes are:
a storage; b primary filtration; c flocculation and coagulation; d clarification; e secondary filtration; f tertiary filtration; g ion exchange; h disinfection; i ozone with or without granulated activated charcoal (GAC).
A description of each of these processes is given in Table 2.

HANDBOOK FOR ASSESSING THE IMPACT OF A RADIOLOGICAL INCIDENT ON LEVELS OF RADIOACTIVITY IN DRINKING WATER AND RISKS TO OPERATIVES AT WATER TREATMENT WORKS: SUPPORTING SCIENTIFIC REPORT
6
Raw water
Flocculation
Clarification
Filtration
Disinfection
Treated water
Figure 1: Main drinking water treatment stages

REVIEW OF TREATMENT PROCESSES USED IN THE UK WATER INDUSTRY AND ELSEWHERE
7
Table 2: Description of important treatment processes used in the UK Treatment Process Description Storage Storage of the raw water prior to treatment allows particulate impurities in the water to sink
naturally by gravity. There is also some biological self-purification.
Primary filtration Raw water entering the treatment works can be passed through coarse filters or strainers to remove large particles such as leaves, twigs, dead animals, etc. In some works, river water is extracted from under river gravel beds into a well which will effectively act as primary filtration.
Flocculation Chemicals such as aluminium sulphate or ferric sulphate are used to remove very fine suspended particles from the input water. The aluminium sulphate forms a precipitate when added to the water, which coagulates with the suspended particles to form a floc. A polyelectrolyte is added to help the coagulation of the floc.
Clarification Clarification is used to separate the floc from the water. The floc is either allowed to sink by gravity or made to float using dissolved air under pressure (dissolved air floatation, DAF). A typical DAF process is shown in Figure 2. There are other specific clarification processes that can be used. Two of these that have been seen during site visits are are ‘Actiflo’ and ‘Sirofloc’.
In the ‘Actiflo’ process aluminium sulphate, a polyelectrolyte and microsand are mixed. Microsand is very small grained clean sand. This mixture goes to a settlement tank (lamella). A high rate of settlement of the floc is achieved by combining the settling benefits of the sand together with the lamella plates.
The ‘Sirofloc’ process makes use of the ionic properties of the ferric oxide, Fe3O4 (commercially known as magnetite). The positively charged magnetite particles attract the negatively charged anions from the impurities and then settle out to form slurry. The slurry is collected and the magnetite regenerated at high pH using sodium hydroxide and recovered using a magnetic drum.
Secondary filtration Secondary filtration involves passing the water through a filtration media. This can be sand, anthracite/carbon or combinations of sand, anthracite and carbon. Alternatively, membrane filters can be used. This process removes particles from the water and usually follows some form of clarification, but not always.
Membrane filtration also removes very fine particles, as small as bacteria, and is effective for removing biological contaminants. Membranes with pore sizes below 1 micron can provide drinking water that does not always need to be disinfected. A typical membrane process (with disinfection) is shown in Figure 3.
Tertiary filtration Tertiary filtration can be a repeat of the secondary filtration but can also be different. Slow sand filters can be used which are either single media (sand) or can comprise a sandwich of anthracite between layers of sand. This further stage of filtration is often used to remove manganese. The soluble manganese (which is in a reduced form) is oxidised and deposited onto the sand as an insoluble layer. Manganese can also be removed using catalytic filter media (such as Polarite).
Ion exchange Ion exchange removes ions from the water by the exchange of cations or anions between the contaminants and the exchange medium. The ion exchange material is usually resin made from a synthetic organic material that contains ionic functional groups to which exchangeable ions are attached. Ion exchange is particularly useful for removing nitrates from water.
Disinfection Disinfection is intended to remove or deactivate micro-organisms from the water, which are not removed by filtration. Disinfection uses agents such as chlorine and ozone. Ozone is added at the beginning of the treatment process, but can also be added just before chlorination at the end of the treatment process. Chlorination occurs in covered storage tanks where there are contact time requirements before the water is released for distribution.

HANDBOOK FOR ASSESSING THE IMPACT OF A RADIOLOGICAL INCIDENT ON LEVELS OF RADIOACTIVITY IN DRINKING WATER AND RISKS TO OPERATIVES AT WATER TREATMENT WORKS: SUPPORTING SCIENTIFIC REPORT
8
Screen filter
Removes leaves, twigs etc.
Lime/sulphuric acid for pH adjustment if
required
Aluminium sulphate -polyelectrolyte
Flash mixer
Flocculation
Floc coagulates
Flotation
Sludge residue thickened, disposed to sewers or
processed
Rapid gravity filter
Dissolved air
Removal of remaining suspended particulates
Contact Tank
Reservoir
Distribution of treated water
Disinfection using chlorine
Final pH adjustment using lime or sulphuric acid, if required
Figure 2: Schematic diagram of a typical DAF water treatment works

REVIEW OF TREATMENT PROCESSES USED IN THE UK WATER INDUSTRY AND ELSEWHERE
9
Figure 3: Schematic diagram of a membrane filtration treatment works
2.3 Processes involving management of wastes arising from water treatment
At various stages during water treatment waste material is produced. This comprises water and sludge. In addition, waste material is generated in the form of spent filter media. All of these wastes have the potential to become contaminated if radioactive material enters the treatment works in the raw water or direct deposition occurs onto the treatment works from aerial contamination. Waste arisings are therefore a key consideration within this project. The processes that generate waste are described below.

HANDBOOK FOR ASSESSING THE IMPACT OF A RADIOLOGICAL INCIDENT ON LEVELS OF RADIOACTIVITY IN DRINKING WATER AND RISKS TO OPERATIVES AT WATER TREATMENT WORKS: SUPPORTING SCIENTIFIC REPORT
10
2.3.1 Maintenance of filters Rapid gravity filter beds are back-washed every few hours to remove trapped particulate matter and maintain their efficiency. These rapid gravity filter beds lose material during the back-washing procedure and so filter media need replenishing periodically when the losses have become significant. The backwash water is usually recycled. The lifetime of a rapid gravity filter bed is normally about 6-8 years, after which time the filter media may need replacing and the beds may need thorough cleaning.
Membrane filters are back-washed approximately every 30 minutes to ensure that they remain efficient. They also undergo chemical cleaning periodically. Typically, this back-wash water is pumped to a sewage treatment works or discharged to rivers as it contains very little sludge.
Membrane filters are periodically inspected and monitored to check for breaks in the micro tubes in the filter cartridges. Each filter cartridge is removed and inspected individually and can be repaired if necessary. Waste water produced during inspection and repairs is pumped to a sewage treatment works or discharged to rivers. Filter cartridges are expected to have a life of about 5-8 years after which they are disposed of to landfill.
Slow sand filters become inefficient when the surface of the filter material becomes clogged. The top 0.1 m of the filter material is removed approximately every 2 months and replenished with clean sand after a significant loss of depth of filter media. The lifetime of a slow sand filter bed is about 20 years, after which time the beds are emptied and cleaned and new filter material inserted. Because large amounts of sand are used in these filters, there is often a facility at the water treatment works for cleaning and regenerating the sand, although this depends on the size of the works and the throughput.
2.3.2 Sludge processing The sludge produced is the floc separated by clarification and particulate material trapped during secondary filtration and subsequently washed off during periodic back-washing. Figure 4 shows the sources of sludge and the processes used to de-water the sludge and its handling as a waste product.
The floc is collected at a number of stages throughout treatment as shown in Figure 4. Floc from the clarification process can be scraped from the surface of floatation tanks following DAF treatment and pumped directly to thickening tanks. Floc from a gravity filtration process is typically pumped to lamella tanks, where it is allowed to settle by gravity. The resultant sludge can be piped or taken by tanker to sewage treatment works or pressed into sludge cake for landfill or soil amendment. Clarified water from the thickening tanks and the lamellas can be returned to the head of the water treatment process for re-treatment to maximise the production of treated water. However, this is not a common practice, especially where surface water is used, because it can result in an increased risk of microbiological contamination (Cryptosporidium). In some cases, the design of the treatment works means that the clarified water can be discharged as waste via outlets to rivers rather than being returned to the head of the process for further treatment.

REVIEW OF TREATMENT PROCESSES USED IN THE UK WATER INDUSTRY AND ELSEWHERE
11
Lamellas or sludge settling
tanks
Thickened sludge and clarified water produced in
thickening tanks
Backwash water from membranes
discharged to waste
Sludge lagoons (returned to nature)
Thickened sludge pressed or centrifuged.
Sludge lagoon as contingency
Temporary on-site storage of sludge or sludge cake
Temporary on-site storage of thickened sludge
Pumped or tankered to sewage treatment works
Landfill Soil amendment
Clarified water returned to head of treatment process or pumped to sewers / water courses as waste
Floc from DAF, Actiflo or Sirofloc
Floc following
clarification
Backwash water from secondary filtration
Figure 4: Schematic diagram of sludge production and management
Wash water from filter back-washing is usually pumped to lamellas or settling tanks and any particulate matter allowed to settle. The settled sludge is pumped to thickening tanks and the remaining water is returned for processing in a similar way to that produced from the clarification process.
Thickened sludge can also be separated using large industrial centrifuges. This does not produce a cake but thick slurry that can be dried or taken directly for landfill.

HANDBOOK FOR ASSESSING THE IMPACT OF A RADIOLOGICAL INCIDENT ON LEVELS OF RADIOACTIVITY IN DRINKING WATER AND RISKS TO OPERATIVES AT WATER TREATMENT WORKS: SUPPORTING SCIENTIFIC REPORT
12
Some sludge is not processed at all, but pumped directly to “sludge lagoons” or to sewage treatment works. The lagoons can be left to “return to nature” or allowed to dry out and emptied at a later date.
Water treatment works can process up to several hundred megalitres of treated water per day depending on their design and size. This can result in up to six tonnes of pressed sludge being produced each day, although this does depend on the amount of turbidity in the raw water, the amount of coagulant used and the throughput.
2.4 Factors influencing effectiveness of treatment processes on radionuclide removal
In general, the normal water treatment processes in place for providing potable drinking water are likely to be effective in removing radionuclides from the water. This is dependent, however, on some key processes being included in the overall treatment scheme (see Section 5.2, below). There are also several factors that could influence the effectiveness of normal water treatment in removing those radionuclides that have been identified so far in this project. These factors can be summarised as:
a chemical and physical properties of the radionuclides; b key treatment steps for removal of radionuclides; c raw water quality; d type of treatment works (open or closed); e number of treatment steps.
This Section summarises our current understanding of the likely behaviour of radioactive contamination during the drinking water treatment processes based on visits to treatment works.
2.4.1 Chemical and physical properties of the radionuclides The chemical and physical properties of the radionuclides are the most important factors influencing the effectiveness of the water treatment processes. For example, any radionuclide attached to particulate matter will be removed by filtration as long as the filter media is fine enough, irrespective of media type. Dissolved gases, such as tritium, will be largely unaffected by treatment. However, dissolved gases may be released, to some extent, by mechanical means (bubbling gases through the water, or vigorous mixing). There is also potential for some species of tritium to become bound to organic material and removed by secondary filtration.
The chemical properties of a particular element or group of elements can determine which process, if any, is most effective for their removal from water. For example, isotopes of the alkali metal caesium have a particular affinity for clay minerals. Such minerals should be present in sand, depending upon its particle size distribution, and so sand filtration would be most effective for removal of caesium. Some chemical forms of iodine are adsorbed by charcoal, so filter beds with a carbon component would be most

REVIEW OF TREATMENT PROCESSES USED IN THE UK WATER INDUSTRY AND ELSEWHERE
13
effective. Those metal ions that have a hydroxide that is insoluble above pH 5 will precipitate when a floc is produced by the addition of lime. This floc would then be removed by the clarification process.
Metal ions will physically associate with the magnetite particles during the “sirofloc” process. When the magnetite is regenerated at high pH (>pH 12.5) by the addition of sodium hydroxide, the metal ions will form insoluble hydroxides that will be treated as waste.
Contact time during filtration is an important factor. The passing of water through slow sand filters allows more time for adsorption of radionuclides on to the sand particles. Rapid gravity filters have a much shorter contact time and might therefore be expected to be less efficient in this respect. However, their effectiveness will be radionuclide-dependent; and so rapid gravity filters might still be a suitable method of decontamination for radionuclides that are very rapidly and effectively adsorbed from solution.
2.4.2 Key treatment steps The treatment steps considered to be of potential importance in removing radionuclides are flocculation and secondary filtration.
Co-precipitation with iron or maganese hydroxides is a common preconcentration step in the analysis of many radionuclides. Flocculation is therefore expected to be particularly important for isolating many radionuclides that attach to solid particulate material. This process will then allow them to be removed later by filtration. The amount of turbidity in the raw water and the amount of coagulant added determine how much floc is produced. The floc acts as a chemical carrier and helps the precipitation of hydroxides. The pH of the solution in the flash mixer is an important factor in producing a good precipitate. The higher the pH the better the precipitate (ie, more salts will precipitate and more precipitate will be formed which will help with settling).
The secondary filtration process will remove any radioactive particulates not removed during the initial clarification. Secondary filtration will also specifically target certain radionuclides, such as isotopes of caesium and some chemical forms of iodine, that will be largely unaffected by flocculation.
In general, treatment works that combine flocculation, clarification and secondary filtration should be effective at removing the majority of radionuclides from drinking water. Treatment works that undertake minimal treatment and do not include these key treatment steps, such as membrane plants, are of more concern in this respect.
2.4.3 Raw water quality Raw water quality determines the level of treatment required. Very clean sources of water require minimal treatment and it is unlikely therefore that there will be any significant removal of radionuclides (see Section 2.4.2). Very clean ground water sources are unlikely to be affected by surface deposition and minimal treatment in the short to medium term is probably acceptable. This would, however, need to be

HANDBOOK FOR ASSESSING THE IMPACT OF A RADIOLOGICAL INCIDENT ON LEVELS OF RADIOACTIVITY IN DRINKING WATER AND RISKS TO OPERATIVES AT WATER TREATMENT WORKS: SUPPORTING SCIENTIFIC REPORT
14
supported by a surveillance monitoring programme. In the longer term, the effect of surface water seepage into the groundwater would need to be assessed and monitored.
Raw water with high levels of impurities requires more extensive treatment, and so are likely to be more resilient in terms of contamination of the raw water with radionuclides.
2.4.4 Types of treatment works Water treatment works can be either enclosed or open to the air. Those works that are open to the air would be vulnerable to airborne deposition in the event of a radioactive plume passing over the treatment works. Water in the treatment works could therefore be subjected to contamination even if the raw water was uncontaminated. Contamination of water prior to filtration but after flocculation could lead to the overall scheme being less efficient in terms of removal of radionuclides. This would depend on the radionuclides of interest. It should be noted that due to cost some water companies are exclusively building treatment works that are open to the atmosphere.
2.4.5 Number of treatment steps Multiple processes will have a cumulative effect on efficiency. For example, if a rapid gravity filter removes 80% of a radionuclide, then passing the water through a second filter will remove 80% of what remains. This would be the case where treatment works had both secondary and tertiary filtration steps.
2.5 Management of raw water sources and strategic resources
Many water treatment works have several sources of raw water. There is often scope for managing the raw waters entering the works but this can be very limited and depends on the size and location of the treatment works, the number of raw water sources and whether the treatment works forms part of an integrated distribution network. It is often possible to take off-line a certain source and compensate by increasing input from another source. This is done already to manage seasonal variations and water levels and flows in rivers and reservoirs. The levels of impurities can vary significantly during the year and it is possible to reduce the amount of impurities by choosing the optimum combination of raw water sources.
Some water treatment works have only one source of raw water or have limited opportunity to manage the raw water inputs into the works. The raw water source might be an impounding reservoir that collects raw water from several sources and the treatment works gets this mixed source input. However, there might be several abstraction points from the reservoir and these could be altered if necessary.
There is usually some scope for taking treatment works off-line temporarily in the case where several treatment works are supplying water for the same area. In this case spare capacity from other treatment works would be used or storage of water in the distribution system could be called upon. It should be noted, however, that if a treatment works is taken off-line, it is not necessarily possible to bring it back on-line quickly. Also, for membrane plants, for example, their efficiency depends on a continuous throughput

REVIEW OF EFFICIENCY OF DRINKING WATER TREATMENT IN REMOVING RADIONUCLIDES FROM WATER
15
of water and large fluctuations can cause damage to the filters. Some treatment works are strategically important and are the only source of drinking water for a certain area. In this case, there is usually a supply of treated water stored in the drinking water system, amounting to a maximum of a few days supply. Any strategically important works could only be off-line for a very short time.
Changing raw water inputs or taking treatment works off-line can be done almost immediately as controls are managed electronically and this is part of contingency planning for a wide range of other contaminants that could affect the water supply.
In many treatment works, back-wash water from rapid gravity filters is recycled and returned to the head of the works, as discussed in Section 2.3.1. The supernatant from the dewatering of sludge can also be recycled (Section 2.3.2). In order to avoid potential recontamination of water entering treatment, it may be possible to divert these waters to the waste stream.
There is very little scope for adding additional processes at treatment facilities. New build for additional processes is expensive and takes a long time to put in place. The building of new process assemblies could be an option if there was a long-term chronic problem with radioactive contamination. In the short-term following an emergency, this is not an option.
Whilst new build is not an option for an emergency situation, it may be possible to add to or change existing processes. For example, anthracite/charcoal could be added to the raw water if an appropriate chemical form of iodine was present. This would be removed during subsequent clarification and filtration.
3 REVIEW OF EFFICIENCY OF DRINKING WATER TREATMENT IN REMOVING RADIONUCLIDES FROM WATER
A review of literature on the effectiveness of drinking water treatment on radionuclide removal has been undertaken, with the purpose of providing a matrix of removal efficiency factors for the radioactive isotopes of a number of elements that may be of concern following a radiological incident. As the water treatments rely on chemical or physical properties, all isotopes of a particular element will behave in the same manner. The matrix of removal efficiency factors produced from this review is therefore element and not radionuclide specific. The matrix only includes chemical removal efficiencies and any removal due to physical properties is not included as it would be purely incidental (eg, any type of filter would remove particulate material if sufficiently large). The water treatments that have been considered are the main processes found in United Kingdom drinking water treatment works. In addition to the main processes, a number of other processes have been considered that are either used less frequently in the UK or could possibly be added to existing treatment works in the event of an emergency.
The effectiveness of ion exchange and reverse osmosis (RO) has been evaluated. These processes are used widely for the decontamination of private water supplies

HANDBOOK FOR ASSESSING THE IMPACT OF A RADIOLOGICAL INCIDENT ON LEVELS OF RADIOACTIVITY IN DRINKING WATER AND RISKS TO OPERATIVES AT WATER TREATMENT WORKS: SUPPORTING SCIENTIFIC REPORT
16
although their use in public treatment facilities is limited. Ion exchange is used in some areas of the UK, for example, to reduce nitrate concentrations and RO is used in desalination plants. It is noted that the installation of these processes would require a large capital investment and they could not be brought on-stream quickly. The effectiveness of lime-soda softening has also been evaluated. Although this process is not in common use at water treatment works in the United Kingdom, it is more widely used in the United States of America, where the removal of radionuclides, most specifically isotopes of strontium, has been evaluated.
The effectiveness of membrane filtration (micro-filtration) has not been specifically evaluated. This process relies on the physical removal of suspended particulate material (down to a few microns in size). The raw water that is treated in this way usually has very low turbidity and colour and there are no chemical processes involved in the treatment. Membrane filtration would therefore have no effect on the removal of soluble radionuclides or radionuclides attached to very small particles (>1 micron).
The addition of clay adsorbers has been included, as it might be possible to add this treatment to existing processes in the event of an emergency. The practicalities of obtaining and transporting large quantities of clay adsorbers to treatment works and their subsequent storage have not been considered. If this is a problem, the addition of clay adsorbers may not be practical in a short-term emergency situation, although this may be a more practical solution for longer term contamination situations.
The information examined in this review gave large variations of removal efficiencies. It was not therefore considered appropriate to derive a single value for the removal of each element by a given treatment. Instead, ranges for removal efficiencies have been given. These broadly take into account the underlying reasons for the variations in values quoted in the literature and provide a robust estimate of removal that covers the majority of situations. The ranges are necessarily large and reflect the uncertainty associated with removal for a particular situation and or element. Justifications for the ranges chosen are given in the report.
Where there is little or no information for a particular element, very cautious estimates of removal, ie, low values, have been given, based on known chemical and physical properties. Justifications for these estimates are provided.
3.1 Review of literature
A literature search was undertaken to identify relevant sources of information on the removal of radionuclides during drinking water treatment. The literature has been reviewed and the salient points have been extracted. The review also took into account whether the information came from laboratory studies or from full-scale plant operations. More weight has been given to information gathered from full-scale plant operations. Some of the publications examined were themselves reviews of other data. In such cases, the original references have been consulted wherever possible and double counting of data has been avoided. A list of the publications cited in this Section is given in Appendix A and not in the list of references to the main text.
REVIEW OF EFFICIENCY OF DRINKING WATER TREATMENT IN REMOVING RADIONUCLIDES FROM WATER
17
Not all of the literature reviewed was relevant to this review, but for completeness all of the references considered have been included. A short review of each of the literature sources considered is given in Appendix A. This includes the type of water treatment for which information and data are given and any values on drinking water treatment efficiency and consideration of the robustness of the data for application to large-scale drinking water treatment in the UK.
It is clear from the papers reviewed that, in general, for each element a large variation in removal efficiencies can be found for most types of treatment. The reasons for the variations are largely due to the physical and chemical characteristics of the elements and the types of raw water used. Also the chemical conditions and types and combinations of the treatments used will effect efficiency. Generally the chemical conditions for treatments are mild (small changes in pH), so only small concentrations of chemicals are required. Extremes of pH are unlikely during water treatment processes due to the effect on pipe work and the excessively large quantities of chemical needed to make the water suitable for drinking. On the other hand, laboratory experiments can make use of extreme chemical conditions to demonstrate and investigate removal. It has to be recognised, therefore, that removal efficiencies observed in treatment works could differ from those observed in many of the laboratory experiments. One study in a treatment works in Belgium concluded that removal efficiencies derived from field measurements were lower than many of the values derived from laboratory experiments [Goossens et al, 1989].
3.2 Justification for choice of values of water treatment efficiency
This section provides removal efficiency factors for a range of elements (and their radioactive isotopes) for drinking water treatment processes and gives the justification for their selection.
3.2.1 Impact of physical and chemical characteristics of elements on efficiency of treatment processes There are some general factors with respect to the physical and chemical characteristics of the radioactive contaminants in the raw water that need to be taken into account when considering the likely efficiency of the various water treatment processes in removing the radioactivity from the water. These are described below and are taken into account in the choice of values for each element.
3.2.1.1 Physical characteristics Radioactive isotopes of some elements can be attached to particulate material in the raw water. In this case, the clarification and filtering processes will largely remove them, depending on settling qualities and particle size. This is discussed further under the information for specific elements below.
Sources of raw water contain varying amounts of suspended particulate matter (turbidity). Water with high turbidity undergoes more extensive treatment than water

HANDBOOK FOR ASSESSING THE IMPACT OF A RADIOLOGICAL INCIDENT ON LEVELS OF RADIOACTIVITY IN DRINKING WATER AND RISKS TO OPERATIVES AT WATER TREATMENT WORKS: SUPPORTING SCIENTIFIC REPORT
18
with low turbidity. Removal efficiencies will be higher for waters undergoing more extensive treatment regimes due to the number and types of treatment used. The presence of large amounts of particulate matter in the water will also aid precipitation processes such as flocculation.
3.2.1.2 Chemical characteristics Elements that form insoluble hydroxides at pH 4-7 will precipitate out during the flocculation process and can be removed. Strontium does have an insoluble hydroxide but requires a pH >7 to precipitate fully. However, it may start to co-precipitate with other elements at lower pH. Compounds and particulates may also be complexed with organic materials and be removed during various treatment processes such as activated carbon filtration. The ionic properties of a molecule will determine whether it can be removed or reduced by ion exchange. For ions with an overall negative charge an anion exchange material is needed, for those with an overall positive charge a cation exchange material is required.
3.2.2 Determination of removal efficiency values for water treatment processes Due to the large variations in efficiencies, it is not appropriate to quote very specific removal efficiencies. Instead, ranges for removal efficiencies have been given that broadly take into account the underlying reasons for the variations in values quoted in the literature and provide a robust estimate of removal that covers the majority of situations. The removal efficiencies quoted have been chosen to provide a cautious estimate of the likely removal of radioactive isotopes of elements by water treatment in the event of a radiological incident. The ranges given are: 0 – 10% (largely ineffective), 10 – 40% (some reduction, but not very efficient), 40 – 70% (significant reduction), >70% (largely effective). It should be noted that for reverse osmosis there are considerable and consistent data to support a removal efficiency value of > 95%.
For the purposes of this study, removal efficiencies for ion exchange assume that a mixed anion and cation exchange medium is used, such as those used in desalination works. Further discussion on ion exchange can be found in Section 3.2.3.
3.2.3 Choice of values for elements considered All of the literature reviewed deals with radionuclide specific removal. However, as the treatments rely on chemical or physical properties, all isotopes of a particular element will behave in the same manner. The removal efficiency matrix produced from the review is therefore element and not radionuclide specific. There are certain situations where a parent radionuclide decays to a short-lived daughter radionuclide and this requires additional consideration. One example is caesium-137 (137Cs), which produces a daughter radionuclide barium-137m (137mBa) having a half-life of 2.5 minutes. These radionuclides reach equilibrium in a very short time. The entire gamma dose is associated with 137mBa. However, if a treatment removed only the caesium parent, there is no support for the barium and within 30 minutes it will have completely decayed. In this case therefore, it is the behaviour of caesium that would be of interest in the present

REVIEW OF EFFICIENCY OF DRINKING WATER TREATMENT IN REMOVING RADIONUCLIDES FROM WATER
19
study. The situation for barium-140 / lanthanum-140 (140Ba/140La) is slightly different. The daughter radionuclide, 140La, has a half-life of about 1.7 days. If the parent radionuclide were separated, the activity of the daughter radionuclide would decrease, but complete decay would effectively take about 12 days.
The radionuclides / elements that are included in this study and the justification for their choice are given in Section 1.1.
Quantitative information on removal efficiencies has been considered so as to arrive at robust estimates of removal efficiency. Where there was little information for particular elements, cautious estimates of removal have been suggested. The justification for the choice of efficiency values for each of the water treatment processes for each of the elements considered is given below. The chosen range categories for each element and treatment process are given in Table 3 in Section 3.3.
Cobalt The effect of the whole water treatment process (flocculation/coagulation/filtration) on the removal of cobalt has been evaluated [Goosens et al, 1989]. A removal efficiency of 61% was found. Another study has also suggested removal for various processes (particularly if cobalt is attached to organic ligands), but no removal efficiencies were quoted [Lettinga, 1972]. A cautious estimate of removal has been chosen for each of the processes considered (see Table 3), based on known chemical characteristics and available information. The mechanisms for the removal of cobalt are considered to be similar to ruthenium [Goosens et al, 1989].
Tellurium and Selenium Tellurium and selenium have similar chemical properties and behave similarly. There is some information on both these elements [Sorg et al, 1980; Thomson et al, 2003], but no removal efficiencies were quoted. Cautious estimates of removal have been chosen based on this and the known chemical properties of these elements and are given in Table 3 in Section 3.3.
Strontium Flocculation/coagulation is not very effective at removing strontium [Haberer, 1989; Culp, 1960; Morton and Straub, 1955; Lettinga, 1972; Eden et al, 1954; Jimenez and De La Montana, 2002]. Measured values of <50% removal have been reported. Strontium forms very soluble salts and does not readily attach to particulate material. Although strontium has an insoluble hydroxide, it requires a pH>7 to precipitate fully. However, strontium will start to co-precipitate at lower pH with the formation of the floc. Based on this information, a removal efficiency in the range category 10 – 40% has been chosen.
Sand filtration is not very effective at removing strontium [Haberer, 1989; Culp, 1960; Morton and Straub, 1955; Lettinga, 1972]. Measured values of <40% have been reported. A removal efficiency in the range category 10 – 40% has therefore been chosen.

HANDBOOK FOR ASSESSING THE IMPACT OF A RADIOLOGICAL INCIDENT ON LEVELS OF RADIOACTIVITY IN DRINKING WATER AND RISKS TO OPERATIVES AT WATER TREATMENT WORKS: SUPPORTING SCIENTIFIC REPORT
20
Ion exchange can be very effective at removing strontium [Culp, 1960; Haberer, 1989; Morton and Straub, 1955]. Measured values of >90% removal have been reported. However the ion exchange material needs to be specific for strontium, and as measurements have been done under laboratory conditions, it is likely that the efficiency will be less at a treatment works. A removal efficiency in the range category 40 – 70% has therefore been chosen.
Reverse osmosis is effective at removing large ions and molecules [Haberer, 1989] including strontium. Reverse osmosis is used in the de-ionisation of water for a large number of uses. Total ion removal is generally >90% and a removal efficiency in the range category > 70% has therefore been chosen.
The addition of clay adsorbers can greatly increase the removal of strontium [Haberer, 1989; Lettinga, 1972; Culp, 1960; Rudenko et al, 2004]. As much as 90% of the strontium can be removed by the addition of clay during flocculation/coagulation, although it is more typically around 50%. A removal efficiency in the range category 40 – 70% has therefore been chosen.
The effect of activated carbon on strontium has not been widely investigated. A previous review [Kwakman, 2004] suggested removal of <40%, although no data were presented to support this. Based on this information, a cautious removal efficiency in the range category 0 – 10% has been chosen.
Lime-soda softening is effective at removing strontium [Culp, 1960; Haberer, 1989] and a removal efficiency in the range category >70% has been chosen. Further discussion of lime-soda softening can be found in Section 3.3.
Zirconium and Niobium Information on the removal of zirconium and niobium is limited [Morton, 1955; Lettinga, 1972]. In one study, the removal efficiencies were similar to those of cerium [Morton and Straub, 1955]. In general, flocculation/coagulation, sand filtration and ion exchange are all efficient at removing zirconium and niobium. A removal efficiency in the range category >70% has been chosen for these processes. Cautious estimates have been chosen for the other processes, based on chemical properties and similarities to other transition elements (see Table 3 in Section 3.3).
Molybdenum and technetium There is some information on the removal of molybdenum and technetium [Morton and Straub, 1955; Thomson et al, 2000; Kwakman, 2004]. There are large ranges of efficiencies quoted for some treatment processes. For example, one study gave an efficiency removal range of 0 – 60% for chemical coagulation [Morton and Straub, 1955] while another found that there was little effect using natural absorbers but gave no quantitative value of removal efficiency [Thomson et al, 2000]. Cautious estimates of removal efficiencies have been estimated based on the information provided and the known chemical properties and are given in Table 3 in Section 3.3).

REVIEW OF EFFICIENCY OF DRINKING WATER TREATMENT IN REMOVING RADIONUCLIDES FROM WATER
21
Ruthenium Several studies have investigated the removal of ruthenium from drinking water [Goosens et al, 1989; Morton and Straub, 1955; Lettinga, 1972; Culp, 1960, Eden et al, 1954]. One study reported a removal efficiency of 73% for a complete water treatment process, including flocculation/coagulation and rapid sand filtration [Goosens et al, 1989].
Flocculation and coagulation can isolate ruthenium to a significant extent [Morton and Straub, 1955; Culp, 1960]. Removal efficiencies of 43 – 96% have been reported. A removal efficiency in the range category 40 – 70% has therefore been chosen.
There is little information on the effect of sand filtration on the removal of ruthenium. However, one study reported a 73% reduction for a whole treatment process [Goosens et al, 1989] and other studies reported a 43 – 96% reduction for flocculation / coagulation [Morton and Straub, 1955 and Culp, 1960]. This suggests that the removal by sand filtration is probably not very efficient. This is consistent with results from earlier work where a removal of 20% for sand filtration was reported [Eden et al, 1954]. A removal efficiency in the range category 10 – 40% has therefore been chosen.
There is no information on the effect of activated carbon on the removal of ruthenium. However, based on the effectiveness for other transition metals, there could be some limited effect. A cautious estimate of removal in the range category 10 – 40 % has been chosen.
Ion exchange can remove ruthenium almost completely [Morton and Straub, 1955]. A removal efficiency in the range category >70% has been chosen.
Reverse osmosis is effective at removing large ions and molecules [Haberer, 1989] including ruthenium [Kwakman, 2004]. Reverse osmosis is used in the de-ionisation of water for a large number of uses. Total ion removal is generally >90%. A removal efficiency in the range category >70% has been chosen based on this information.
Natural clay adsorbers are likely to have little effect on the removal of ruthenium. This is based on the known chemical properties and the similarity to other elements such as cobalt and technetium. A removal efficiency in the range category 10 - 40% has therefore been chosen.
Iodine Flocculation / coagulation is largely ineffective at removing iodine [Haberer, 1989; Morton and Straub, 1955; Lettinga, 1972; Goosens et al, 1989]. Removal efficiencies of <20% have been reported. One study [Goosens et al, 1989] investigated a full treatment process, including flocculation / coagulation and rapid sand filtration, and found that only 17% of the iodine was removed. This is largely due to iodine forming soluble iodides and iodates and not having an insoluble salt. A removal efficiency in the range category 10 – 40% has been chosen based on the available data.
Sand filtration can have some effect on removing iodine [Haberer, 1989; Morton and Straub, 1955; Lettinga, 1972; Goosens et al, 1989]. Generally <40% removal has been measured. There are differences of opinion on the level of removal between different

HANDBOOK FOR ASSESSING THE IMPACT OF A RADIOLOGICAL INCIDENT ON LEVELS OF RADIOACTIVITY IN DRINKING WATER AND RISKS TO OPERATIVES AT WATER TREATMENT WORKS: SUPPORTING SCIENTIFIC REPORT
22
studies and large ranges of efficiencies (0 – 100%). However, the consensus opinion is that sand filtration is not very effective at removing iodine. A removal efficiency in the range category 10 – 40% has therefore been chosen.
Ion exchange was reported as being effective at removing iodine [Morton and Straub, 1955], although this was for laboratory tests. It is likely that removal efficiencies would be lower at treatment works due to less extreme chemical conditions (Section 3.2.1). However, if the iodine is present as an iodide, then ion exchange will be effective at removing iodine. A removal efficiency in the range category 40 – 70% has therefore been chosen.
Reverse osmosis is effective at removing large ions and molecules [Haberer, 1989] including iodine. Reverse osmosis is used in the de-ionisation of water for a large number of uses. Total ion removal is generally >90% and a removal efficiency in the range category >70% has been chosen.
The addition of clay adsorbers has a limited effect on the removal of iodine. A removal value of <40% has been reported [Haberer, 1989]. A removal efficiency in the range category 10 – 40% has therefore been chosen.
Activated carbon can significantly reduce the amount of iodine in water by 60 – 90% [Haberer, 1989; Lettinga, 1972]. If iodine is present as an organic compound, the removal efficiency is likely to be higher [Lettinga, 1972]. Based on this information a removal efficiency in the range category 40 – 70% has been chosen.
Lime-soda softening is not effective at removing iodine [Haberer, 1989]. A removal efficiency in the range category 0 – 10% has therefore been chosen.
Caesium All papers reviewed have suggested that flocculation/coagulation has little or no effect on caesium removal [Gafvert et al, 2002; Haberer, 1989; Culp, 1960; Lettinga, 1972; Morton and Straub, 1955]. This is probably due to the fact that caesium is a very soluble element and it does not form an insoluble hydroxide. Any observed reduction is probably due to caesium that is attached to particulate material. The addition of fine sand, as in the actiflo process (to aid settling of the floc), is likely to aid removal. One study measured the removal efficiency for a whole treatment process (flocculation / coagulation, sand filtration) and found that the removal efficiency for caesium was 56% [Goosens et al, 1989]. A removal efficiency value in the range category 10 – 40% has been chosen.
Sand filtration has some impact on the removal of caesium [Culp, 1960; Haberer, 1989; Morton and Straub, 1955]. A mixture of laboratory studies and field investigations have shown that removal efficiencies can be as high as 70%, but typically up to 50% and as low as 0% [Gafvert et al, 2002; Culp, 1960; Morton and Straub, 1955; Jones and Castle, 1987]. A removal efficiency in the range category 10 – 40% has been chosen. Once caesium has become entrained in the sand media, it is likely that there will be some subsequent re-mobilisation of the caesium over a long period. It is possible that caesium removed by sand filtration could continue to contaminate “clean” water to a

REVIEW OF EFFICIENCY OF DRINKING WATER TREATMENT IN REMOVING RADIONUCLIDES FROM WATER
23
small degree for a long period. This process could continue for some years until the contaminated sand was removed.
Ion exchange can be very effective at removing caesium [Culp, 1960; Haberer, 1989; Morton and Straub, 1955]. Each of these laboratory studies showed removal efficiencies >90%. It is more likely that under the mild chemical conditions at treatment works, efficiencies would be somewhat reduced, hence a cautious estimate in the range category 40-70% has been chosen.
Reverse osmosis is effective at removing large ions and molecules, including caesium [Haberer, 1989]. Reverse osmosis is used in the de-ionisation of water for a large number of uses. Total ion removal is generally >90% and a removal efficiency in the range category >70% has been chosen.
The use of clay adsorbers (natural zeolite clay minerals) has been studied widely [Haberer, 1989; Lettinga, 1972; Culp, 1960; Rudenko et al, 2004] with particular interest in caesium and strontium. As these elements are not removed efficiently by flocculation / coagulation / filtration, the addition of natural adsorbers has been investigated specifically for decontamination purposes. The removal efficiency for caesium ranges from 35-100%. A removal efficiency in the range category 40 – 70% has therefore been chosen.
The effect of activated carbon on caesium has not been widely investigated. Previous reviews suggested some limited removal <40%, but without any apparent supporting data [Kwakman, 2004; Dionian and Linsley, 1983]. A cautious removal efficiency in the range category 0 – 10% has been chosen.
Lime-soda softening is not effective at removing caesium [Culp, 1960; Haberer, 1989]. Based on the information available, a removal efficiency in the range category 10 – 40% has been chosen.
Barium and lanthanum There is some limited information on the removal of barium and lanthanum [Morton, 1955; Kwakman, 2004]. The removal efficiencies reported support the idea that barium behaves very similarly to strontium and radium, which are in the same Group in the Periodic Table of the Elements. Efficiency removal factors have been chosen that reflect this (see Table 3 in Section 3.3).
Cerium There is information on the removal of cerium [Morton and Straub, 1955; Eden et al, 1954; Culp, 1960; Lettinga, 1972]. Flocculation / coagulation and sand filtration are effective at removing nearly all cerium (>80%). Ion exchange can remove cerium almost completely, removal efficiencies of >98% having been reported [Morton and Straub, 1955]. Based on these data, a removal efficiency in the range category >70% has been chosen for these processes. Removal efficiencies for the other processes have been estimated based on known chemical properties and similarities to other elements such as zirconium and niobium and are given in Table 3 in Section 3.3).

HANDBOOK FOR ASSESSING THE IMPACT OF A RADIOLOGICAL INCIDENT ON LEVELS OF RADIOACTIVITY IN DRINKING WATER AND RISKS TO OPERATIVES AT WATER TREATMENT WORKS: SUPPORTING SCIENTIFIC REPORT
24
Ytterbium There is no information on the removal of ytterbium. Ytterbium and cerium are in the lanthanide series of elements and it is reasonable to assume that ytterbium will behave similarly to cerium. The relationship between ytterbium and cerium is quite tenuous and so very cautious estimates of removal have been chosen consistent with the available information. Values are given in Table 3 in Section 3.3.
Iridium There is no information on the removal of iridium. Iridium chemistry is very similar to that of platinum and rhodium, which do not dissolve easily. However, for the purpose of this review, iridium has been assumed to behave in a similar manner to other transition metals such as ruthenium and cobalt, and therefore be present as a soluble salt. Cautious estimates of removal have been chosen based on this and are given in Table 3 in Section 3.3.
Radium Radium is a naturally occurring element and is formed by the radioactive decay of uranium. Radium can be present in some ground waters at high concentrations. For this reason, radium has been extensively studied [Valentine, 1987; Sorg, 1980; Haberer, 1989; Gafvert et al, 2002; Hurikuri et al, 1998; Vaaramaa et al, 2000; Annanmaki et al, 2000].
Flocculation and coagulation is not very efficient at removing radium and removal efficiencies of <50% have been found [Gafvert et al, 2002; Haberer, 1989]. The range category chosen for the removal efficiency is 10 – 40%.
Sand filtration can have a significant impact on radium removal (Valentine et al, 1987, Gafvert et al, 2002). Removal efficiencies of 40 – 60% have been found at pH 4 – 8. A removal efficiency in the range category 40 – 70% has therefore been chosen.
Ion exchange can have a significant impact on radium removal [Annanmaki et al, 2000; Vaaramaa et al, 2000]. Values of >50% removal have been found. This is dependant on chemical conditions and the use of a cationic exchange resin. An efficiency removal in the range category 40 – 70% has been chosen.
Reverse osmosis is effective at removing large ions and molecules (Haberer 1989) including radium [Huikuri and Salonen, 1998; Sorg et al, 1980]. A removal of >95% has been found for radium. Reverse osmosis is used in the de-ionisation of water for a large number of uses. Total ion removal is generally >90%. Based on this information, a removal efficiency in the range category >70% has been chosen.
There is little information on the effect of activated carbon on radium. Haberer (1989) and Annanmaki et al, (2000) describe removal for radium as “fair”. A cautious removal efficiency in the range category 10 – 40% has therefore been chosen.
There is no information on the use of natural clay adsorbers to remove radium. Radium may behave similarly to strontium (both are Group 2 elements in the periodic table), for which a range of 40 – 70% removal has been chosen. However, due to the uncertainty

REVIEW OF EFFICIENCY OF DRINKING WATER TREATMENT IN REMOVING RADIONUCLIDES FROM WATER
25
regarding radium, a cautious removal efficiency in the range category 10 – 40% has been chosen.
There is some information on the effect of lime-soda softening on the removal of radium [Haberer, 1989]. Significant removal (>90%) was reported. A removal efficiency in the range category >70% has therefore been chosen.
Uranium Uranium is a naturally occurring element and is present in some ground waters in high concentrations. For this reason, uranium has been extensively investigated [Lee and Bondietti, 1983; Hanson et al, 1986; Huikuri and Salonen, 1998 and 2000; Arey et al, 1999; Thomson et al, 2000; Vaaramaa et al, 2000 and Gafvert et al, 2002]. These studies tend to focus on the parts of Scandinavia, North America and elsewhere where high concentrations of uranium in ground waters are found.
Flocculation and coagulation can isolate >80% of any uranium present in drinking water [Lee, 1983; Hanson, 1986; Huikuri and Salonen, 2000 and Gafvert et al, 2002]. However, in situations where there are no other dissolved metal ions present, [Lee, 1983] optimum conditions (pH >8) are required. It is more likely that other metal ions will be present and that uranium will start to co-precipitate with other insoluble metal hydroxides at a much lower pH value of around 4. Therefore, even without optimum conditions a removal efficiency of >80% could still be achieved [Hanson et al, 1986]. Based on this information, a removal efficiency in the range category >70% has been chosen.
Sand filtration has little or no effect on removal of uranium [Haberer, 1989] and a removal efficiency in the range category 0 –10% has therefore been chosen. However, in many water treatment works it is likely that much of the uranium would have been removed or isolated earlier in the overall process via flocculation and coagulation,
Ion exchange can remove uranium almost completely [Lee and Bondietti, 1983; Hanson, et al, 1986; Huikuri and Salonen, 2000; Vaaramaa et al, 2000]. Ion exchange is used extensively to reduce uranium concentrations for some private water supplies. A removal efficiency in the range category >70% has therefore been chosen.
Reverse osmosis is effective at removing large ions and molecules [Haberer, 1989] including uranium [Huikuri and Salonen, 1998]. Reverse osmosis is used in the de-ionisation of water for a large number of uses. Total ion removal is generally >90% and a removal efficiency in the range category > 70% has therefore been chosen.
There is little information on the effect of activated carbon on uranium, removal having been described in one study as “fair” [Annanmaki et al, 2000]. However, as treatments applied prior to carbon filtration are effective at removing uranium, the impact of any removal by activated carbon filtration on the overall removal process would be small. A removal efficiency in the range category 10 - 40% has been chosen.
There is some information on the use of natural adsorbers to remove uranium [Thomson et al, 2000 and Arey et al, 1999]. A removal efficiency of >50% is suggested, although

HANDBOOK FOR ASSESSING THE IMPACT OF A RADIOLOGICAL INCIDENT ON LEVELS OF RADIOACTIVITY IN DRINKING WATER AND RISKS TO OPERATIVES AT WATER TREATMENT WORKS: SUPPORTING SCIENTIFIC REPORT
26
this can be nearer 100%, for phosphate adsorbers. A removal efficiency in the range category 40 – 70% has therefore been chosen.
There is some information on the effect of lime-soda softening on the removal of uranium [Haberer, 1989]. Significant removal (70-90%) was reported. A removal efficiency in the range category >70% has been chosen.
Plutonium Plutonium can largely be isolated by flocculation and coagulation [Lettinga, 1972; Culp, 1960; Haberer, 1989; Gafvert et al, 2002] and can subsequently be removed by clarification. Removal efficiencies of >80% have been quoted. There are two main reasons for this. Plutonium is usually associated with very small particles [Haberer, 1989; Gafvert et al, 2002] and will form part of the floc. Also plutonium (in soluble form) can form an insoluble hydroxide at quite low pH (>4) and so will co-precipitate with the formation of the floc. Flocculation and coagulation is effective at removing or significantly reducing the amount of high valence cationic radionuclides, ie, those with a valency of 3 or more [Lettinga, 1972], including plutonium. Based on these data, a removal efficiency in the range category >70% has been chosen.
Sand filtration may be effective at removing plutonium [Eden et al, 1954; Gafvert et al, 2002]. Laboratory studies have however showed a wide range of removal efficiencies, between 10 and 90%. However, as sand filtration usually follows some form of flocculation / coagulation, where much of the plutonium would be removed, then the impact of any low removal by sand filtration on the overall removal would be of lesser importance. In the case of slow sand filtration, a layer of algae sometimes forms on the surface of the filter media and plutonium could attach to this organic layer in the form of organic complexes. This organic layer will be removed during subsequent cleaning or replenishing of the filter media. For this process a removal efficiency in the range category 10 – 40% has been chosen.
Activated carbon has very little effect on plutonium. However, if plutonium is attached to humic acids then significant removal may be achieved (>40%) [Kwakman, 2004; Haberer, 1989]. It would be reasonable to expect that elements that complex with organic material should be removed by activated carbon filtration.
Ion exchange can remove plutonium very effectively [Lettinga, 1972; Kwakman, 2004]. However, this will depend on the type of exchange media. A mixed anion cation exchange medium (which is considered in Table 3) would be largely effective at removing plutonium (>70%). Ion exchange is used extensively to isolate actinides for radiochemical analysis of radionuclides, although, chemical conditions are usually very acidic (pH <1) compared with the mild conditions at treatment works (pH 4-8). It is likely that significant removal would still be achieved (>70%), but not the 100% that is expected for radiochemical analysis. Based on these data, a removal efficiency value in the range category >70% has been chosen.
Reverse osmosis is effective at removing large ions and molecules [Haberer, 1989] including plutonium. Reverse osmosis is used in the de-ionisation of water for a large

REVIEW OF EFFICIENCY OF DRINKING WATER TREATMENT IN REMOVING RADIONUCLIDES FROM WATER
27
number of uses. Total ion removal is generally >90% and so a removal efficiency value in the range category >70% has been chosen.
There is little information on the use of clay minerals to remove plutonium. However, one study has found that removal of plutonium using apatite was almost 100%, although this was under laboratory conditions [Thomson et al, 2003]. A cautious estimate of removal in the range category 40 - 70% has therefore been chosen.
Americium There is some limited specific information on the removal of americium [eg, Thomson et al, 2003]. However, as americium behaves chemically in a very similar manner to plutonium and uranium, the same removal efficiencies have been chosen. Americium, plutonium and uranium have also been grouped together in another recent review [Kwakman, 2004].
3.3 Use of removal efficiency table
Table 3 provides a matrix of removal efficiencies for the elements and water treatment processes considered in the study. As discussed in Section 3.2.2, the removal efficiencies are quoted as robust ranges which provide a cautious estimate of the likely removal of radioactive isotopes of elements by water treatment in the event of a radiological incident. The treatment processes can be considered separately or treatment processes can be combined.
For a single treatment, the activity concentration of a particular radionuclide in the water following treatment is calculated as follows:
Activity concentration in water post treatment = activity concentration in water pre-treatment x F
where:
F = 1 - (removal efficiency /100).
For combinations of processes, care needs to be taken in the use of the removal efficiency factors in Table 3. For example, if flocculation / coagulation removes nearly all of a particular radionuclide/element, subsequent processes will only have an effect on the fraction of radioactive contamination that is left and not on the total initial contamination levels. Most water treatment works will have more than one of the processes listed in Table 3. Where this is the case, the effective removal for successive treatment steps is multiplicative. This means that if the first process is 50% effective for removal and a subsequent process is also 50% effective, then the total removal would be 75%, as the second process will only act on the fraction of the element that remains.
The overall efficiency for any combination of treatments in removing radioactivity from the water can be estimated in the following way:

HANDBOOK FOR ASSESSING THE IMPACT OF A RADIOLOGICAL INCIDENT ON LEVELS OF RADIOACTIVITY IN DRINKING WATER AND RISKS TO OPERATIVES AT WATER TREATMENT WORKS: SUPPORTING SCIENTIFIC REPORT
28
Activity concentration in water post treatment A = activity concentration in water pre-treatment x FA
Activity concentration in water post treatments A and B = activity concentration in water post treatment A x FB
where:
FA= 1- (removal efficiency /100) for treatment A and
FB = 1- (removal efficiency /100) for treatment B.
There are a number of important factors to note when using the Table of removal efficiency factors (Table 3). These are as follows.
a Table 3 only includes chemical removal. Therefore, any element that is attached to particulate material is not considered in the matrix, as any removal will be due to physical and not chemical properties. This is discussed further below for sand filtration and microfiltration.
b Sand filtration usually follows a flocculation / coagulation / clarification step. This earlier step removes much of the suspended solids present in the raw water and prevents the sand filters from becoming too clogged up and not working efficiently. Sand filtration retains any suspended solids still present after the initial clarification step and these are removed by backwashing for further clarification. The efficiencies reported are for the chemical process related to sand filtration and not the mechanical removal of solids. Secondary filtration, such as that used for manganese removal would have the same removal efficiency for chemical processes as the initial filtration.
c The use of activated carbon has been evaluated. The carbon could be present as granulated activated carbon in filter beds or be added as powdered activated carbon at various points during the treatment in response to contamination.
d Reverse osmosis should not be confused with microfiltration, used at membrane filtration plants. Microfiltration removes particles down to a diameter of a few microns. Microfiltration changes none of the chemical properties of the solution passing through the membrane. Any removal will be due to elements being attached to particles and mechanically stopped by the filter (if the particles are sufficiently large). Reverse osmosis can retain ions and molecules with a molar mass of over a few tens of grammes per mole, and so does change the chemical properties of the solution passing through the membrane.
e The effect of lime-soda softening has been evaluated for some elements, notably strontium. For most elements, the effect of lime-soda softening will be minimal because previous treatment processes, such as flocculation / coagulation / clarification will have already removed most of that element. Therefore, although lime-soda softening is very effective for removal of strontium and radium due to their chemical similarity to calcium, any removal due to softening will only be on the fraction of any element remaining at the point when the water softening takes place.
f For ion exchange, the choice of exchange media is very important. Cationic and anionic exchange media are very selective in the ions they remove. Cation

REVIEW OF EFFICIENCY OF DRINKING WATER TREATMENT IN REMOVING RADIONUCLIDES FROM WATER
29
exchange media remove ions with an overall positive charge and anionic exchange media remove ions with an overall negative charge. For this reason, a mixed cation / anion exchange medium was selected for inclusion in Table 3.

HA
ND
BO
OK
FOR
AS
SE
SS
ING
THE
IMP
AC
T OF A
RAD
IOLO
GIC
AL IN
CID
EN
T ON
LEV
ELS
OF
RA
DIO
AC
TIVITY
IN D
RIN
KIN
G W
ATE
R A
ND
RIS
KS
TO O
PE
RA
TIVE
S A
T WA
TER
TRE
ATM
EN
T W
OR
KS
: SU
PP
OR
TING
SC
IEN
TIFIC R
EP
OR
T
30
Table 3: Water Treatment Removal Efficiencies as a function of element and treatment processa,b
Element Flocculation /coagulation/clarification
Sand Filtrationc (Rapid & Slow)
Activated carbon Lime-soda Softeningd
Natural Zeolites (clay minerals)
Ion-exchangee
(mixed media) Reverse Osmosisf
Key Removal efficiency, % removed
Cobalt XXX XX XX X XX XXX XXXX
Selenium XXX XX XX X XXX XXX XXXX
Strontium XX XX X XXXXg XXX XXX XXXX
Zirconium XXXX XX XX X XXX XXXX XXXX
Niobium XXXX XX XX X XXX XXXX XXXX
Mol/Technetium XXX XXX XX X X XXX XXXX
Ruthenium XXX XX XX X XX XXX XXXX
Iodine XX XX XXX X XX XXX XXXX
Tellurium XXX XX XX X XXX XXX XXXX
Caesium XX XX X XX XXX XXX XXXX
Barium XXXX XXX XX X XXX XXXX XXXX
Lanthanum XXXX XXX XX X XXX XXXX XXXX
Cerium XXXX XXXX XX X XXX XXXX XXXX
Ytterbium XXX XXX X X XX XXX XXXX
Iridium XXX XX XX X XX XXX XXXX
Radium XX XXX XX XXXXg XX XXXX XXXX
Uranium XXXX X XX XXXX XXX XXXX XXXX
Plutonium XXXX XX XXX X XXX XXXX XXXX
Americium XXXX XX XXX X XXX XXXX XXXX
X = 0 – 10%
XX = 10 – 40%
XXX = 40 – 70%
XXXX = >70%

31
RE
VIE
W O
F EFFIC
IEN
CY
OF D
RIN
KIN
G W
ATER
TRE
ATM
EN
T IN R
EM
OV
ING
RA
DIO
NU
CLID
ES
FR
OM
WA
TER
Element Flocculation /coagulation/clarification
Sand Filtrationc (Rapid & Slow)
Activated carbon Lime-soda Softeningd
Natural Zeolites (clay minerals)
Ion-exchangee
(mixed media) Reverse Osmosisf
Key Removal efficiency, % removed
Notes: a) Most water treatment works will have more than one of the processes listed in the Table. Where this is the case, the effective removal from successive processes
is multiplicative. This means that if the first process is 50% effective for removal and a subsequent process is also 50% effective, then the total removal would be 75%, as the second process will only act on the fraction of the element that remains (see Section 3.3 for further information).
b) The values in the Table are only for chemical removal. Therefore, any element that is attached to particulate material is not considered in the matrix, as any removal will be due to physical and not chemical properties.
c) The efficiencies reported are for the chemical process of sand filtration and not the mechanical removal of solids.
d) Where there is no information for a particular element, lime-soda softening has been considered to have little or no effect, as discussed above, and removal efficiencies of <10% have been chosen.
e) Data for ion exchange assume the use of a mixed cation / anion exchange media (see Sections 3.2.3 and 3.3 for further discussion).
f) Reverse osmosis does not include microfiltration, used at membrane filtration plants, which is solely a physical removal process (see discussion in Section 3.3).
g) The addition of lime (calcium oxide) during the flocculation process (for pH adjustment) is likely to increase the removal efficiencies for strontium and radium, because the addition of calcium may act as a carrier and help with co-precipitation. However, there is no information on the extent to which the addition of lime will increase the removal efficiency.

HANDBOOK FOR ASSESSING THE IMPACT OF A RADIOLOGICAL INCIDENT ON LEVELS OF RADIOACTIVITY IN DRINKING WATER AND RISKS TO OPERATIVES AT WATER TREATMENT WORKS: SUPPORTING SCIENTIFIC REPORT
32
4 ESTIMATING ACTIVITY CONCENTRATIONS IN DRINKING
WATER AND WASTE PRODUCTS
4.1 Activity concentrations in treated water
Raw water entering a treatment works may pass through several treatment processes to produce suitable drinking water. Each treatment process may remove some of the radioactive contamination depending on the radionuclide. The effectiveness of each type of treatment has been evaluated (see Section 3) and a removal efficiency matrix produced (Table 3). Due to the uncertainty and variability in the likely amounts removed, a range for the removal efficiency is given for each radionuclide and treatment process rather than a single figure. Where more than one treatment process is used, the combination of each treatment process must be taken into account when determining the activity concentration in the treated water.
A cautious approach is to determine the maximum activity concentration in the treated water; this is done by assuming minimal removal from the water, ie, the minimum removal efficiency is assumed for each treatment process. To determine the likely minimum activity concentration in the treated water, the maximum removal efficiency for each treatment process should be used.
Two common combinations of treatment processes have been considered to illustrate the likely removal of radioactivity by drinking water treatment.
a Combination 1 (2 step process) Flocculation / Clarification followed by Rapid Gravity Filtration (FL/CL + RGF).
b Combination 2 (3 step process) Flocculation / Clarification followed by Rapid Gravity Filtration and Slow Sand Filtration (FL/CL + RGF + SSF).
Removal efficiencies for other treatment processes are also given in Table 3 and can be used to calculate the range of activity concentrations in treated water following other treatment processes.
4.1.1 Calculation of activity concentration in treated water
Combination 1 (Bq l-1 in treated water per Bq l-1 in raw input water):
Highest concentration: Bq l-1 in treated water = Bq l-1 in raw input water x ((1 - min removal (FL/CL)) x (1-min removal (sand filter)))
Lowest concentration: Bq l-1 in treated water = Bq l-1 in raw input water x ((1 - max removal (FL/CL)) x (1-max removal (sand filter)))
Combination 2 (Bq l-1 in treated water per Bq l-1 in raw input water):

ESTIMATING ACTIVITY CONCENTRATIONS IN DRINKING WATER AND WASTE PRODUCTS
33
Highest concentration: Bq l-1 in treated water = Bq l-1 in raw input water x ((1 - min removal (FL/CL)) x (1-min removal (sand filter)) x (1-min removal (sand filter)))
Lowest concentration: Bq l-1 in treated water = Bq l-1 in raw input water x ((1 - max removal (FL/CL)) x (1-max removal (sand filter)) x (1-max removal (sand filter))).
Table 4: Estimated activity concentrations in treated drinking water for 1 Bq l-1 in the input water
Range in estimated activity concentration in water, Bq l-1 in treated water per Bq l-1 in input watera,b
Radionuclide
Floc/clar + RGFc Floc/clar + RGF + SSFc
60Co 1.8 10-1 - 5.4 10-1 1.1 10-1 - 4.9 10-1
75Se 1.8 10-1 - 5.4 10-1 1.1 10-1 - 4.9 10-1 89Sr 3.6 10-1 - 8.1 10-1 2.2 10-1 - 7.3 10-1
90Sr 3.6 10-1 - 8.1 10-1 2.2 10-1 - 7.3 10-1 95Zr 0.0 - 2.7 10-1 0.0 - 2.4 10-1
95Nb 0.0 - 2.7 10-1 0.0 - 2.4 10-1 99Mo 9.0 10-2 - 3.6 10-1 2.7 10-2 - 2.2 10-1 103Ru 1.8 10-1 - 5.4 10-1 1.1 10-1 - 4.9 10-1 106Ru 1.8 10-1 - 5.4 10-1 1.1 10-1 - 4.9 10-1 132Te 1.8 10-1 - 5.4 10-1 1.1 10-1 - 4.9 10-1 131I 3.6 10-1 - 8.1 10-1 2.2 10-1 - 7.3 10-1 131I d 1.1 10-1 - 4.9 10-1 6.5 10-2 - 4.4 10-1
134Cs 3.6 10-1 - 8.1 10-1 2.2 10-1 - 7.3 10-1 136Cs 3.6 10-1 - 8.1 10-1 2.2 10-1 - 7.3 10-1 137Cs 3.6 10-1 - 8.1 10-1 2.2 10-1 - 7.3 10-1 140Ba 0.0 - 1.8 10-1 0.0 - 1.1 10-1
140La 0.0 - 1.8 10-1 0.0 - 1.1 10-1
144Ce 0.0 - 9.0 10-2 0.0 - 2.7 10-2
169Yb 9.0 10-2 - 3.6 10-1 2.7 10-2 - 2.2 10-1
192Ir 1.8 10-1 - 5.4 10-1 1.1 10-1 - 4.9 10-1
226Ra 1.8 10-1 - 5.4 10-1 5.4 10-2 - 3.2 10-1
235U 0.0 - 3.0 10-1 0.0 - 3.0 10-1
238Pu 0.0 - 2.7 10-1 0.0 - 2.4 10-1
239Pu 0.0 - 2.7 10-1 0.0 - 2.4 10-1 241Am 0.0 - 2.7 10-1 0.0 - 2.4 10-1
a) Maximum value in range assumes minimum removal of radionuclides at each process step; minimal value in range assumes maximum removal of radionuclides at each process step (see Table 3 for removal efficiency factors).
b) The estimate of 0.0 Bq l-1 in water arises from the assumption that 100% of radioactivity has been removed from the water due to treatment processes (maximum value in range >70% in Table 3). In reality, it is very unlikely that any treatment will be 100% efficient in removing radioactivity, although the removal could be very high.
c) RGF = rapid gravity filtration; SSF – slow sand filtration.
d) For 131I, if granulated activated charcoal (GAC) is used within the filter beds, activity concentrations in treated water will be lower.
Table 4 gives the range of activity concentrations estimated for the two combinations of processes as a function of radionuclide and an activity concentration in the untreated

HANDBOOK FOR ASSESSING THE IMPACT OF A RADIOLOGICAL INCIDENT ON LEVELS OF RADIOACTIVITY IN DRINKING WATER AND RISKS TO OPERATIVES AT WATER TREATMENT WORKS: SUPPORTING SCIENTIFIC REPORT
34
input water of 1 Bq l-1. Activity concentrations could reasonably be expected to fall within this range for these combinations of processes. Table 4 provides robust values that could be used by the Water Industry to identify those radionuclides for which drinking water treatment is likely to remove a substantial amount of the contamination and those for which treatment is not very effective. However, it must be emphasised that measurements of activity concentrations should always be used in the event of an incident to confirm actual levels in drinking water.
4.2 Activity concentrations in filter material and waste sludge
Radioactive contamination that is removed by flocculation and clarification will accumulate in any waste sludge generated. Any additional contribution to the quantities of sludge produced from back washing of filter material is likely to be relatively small and can be ignored for the purposes of estimating activity concentrations in the waste sludge. The mass of sludge produced will vary depending on the amount of colour and turbidity in the raw water. The level of turbidity will vary depending on the weather and seasonal variations.
For a given level of water throughput, higher levels of turbidity will give rise to more sludge per unit volume of water being produced. Conversely, water with low turbidity produces very small amounts of sludge per unit volume of water. Consequently, for a given activity concentration in the raw input water, the activity concentrations in sludge from water having low turbidity will be higher than those from water with a high turbidity.
Filtration of water containing radionuclides will give rise to the filter media becoming contaminated. The filter beds will accumulate radioactive contamination over the period that contaminated water passes through them. If contaminated water continues to flow through rapid gravity filters over a significant period of time at a constant level, activity concentrations in the filter media may approach those in sludge. This is explained further in Section 2 of the Handbook [Brown et al, 2008]. The contamination levels in filter beds will decrease if the filter media are replaced or as a result of activity concentrations decreasing due to radioactive decay. Every time that backwashing occurs, a small amount of contamination will be leached from the sand into the backwash water; it is the contamination that has been chemically adsorbed onto the filter media that is being leached out. This process is called desorption. This process occurs due to very small changes in chemical conditions over long periods of time. The amount removed by desorption will only be a very small fraction of the activity that is attached to the sand filter media by adsorption and is unlikely to alter the activity concentration in the filter media significantly. For the purposes of estimating activity concentrations in the filter media, this process can therefore be ignored. Typically the contamination will be associated with a very large mass of filter media across a number of filter beds. The activity concentrations in filter media per unit mass are therefore likely to be significantly lower than those that could be expected in sludge for the same activity concentration in the input water.

ESTIMATING ACTIVITY CONCENTRATIONS IN DRINKING WATER AND WASTE PRODUCTS
35
4.2.1 Calculation of activity concentrations in filter media Rapid gravity filtration (RGF) and slow sand filtration (SSF) usually follows some form of flocculation / clarification (FL/CL). Any removal of radioactivity from the water during this process needs to be taken into account when estimating how much activity remains in any given filter medium due to subsequent filtration. To calculate the activity concentration in the filter media following the throughput of contaminated water, the radioactivity removed by the filter media is estimated having first subtracted the amount removed by FL/CL. If SSF follows RGF, then the radioactivity removed by FL/CL and RGF must be subtracted to estimate the radioactivity subsequently removed by the slow sand filter beds.
The activity concentration in the filter bed media, either RGF or SSF can be estimated in the following way:
Activity concentration in the filter media (Bq kg-1 per Bq l-1 in the untreated input water) = A x V x EFF / M
where:
A = Activity concentration of the untreated input water (Bq l-1)
V = volume of water that has passed through the filter (l) = daily throughput x number of days accumulation
M = mass of sand filter media (kg)
EFF = radioactivity removed by filtration step (as a fraction of 1) (Bq removed per Bq in the untreated input water).
For combination 1 (2 step process)
EFF = 1.0 x [1 - EFF1] x EFF2
For combination 2 (3 step process) Bq removed per Bq in the input water
EFF = 1.0 x [1 - EFF1] x [1 - EFF2] x EFF3
where:
EFF1 = amount removed in FL/CL (Bq removed per Bq input)
EFF2 = amount removed in RGF (Bq removed per Bq input)
EFF3 = amount removed in SSF (Bq removed per Bq input)
EFF = amount removed by last filtration step (Bq removed per Bq in the untreated input water).
To provide information on the sensitivity of concentrations in waste materials on the choice of values from the range of removal efficiencies in Table 3, it is necessary to calculate the maximum and minimum removal for each combination of treatment processes for radionuclide.

HANDBOOK FOR ASSESSING THE IMPACT OF A RADIOLOGICAL INCIDENT ON LEVELS OF RADIOACTIVITY IN DRINKING WATER AND RISKS TO OPERATIVES AT WATER TREATMENT WORKS: SUPPORTING SCIENTIFIC REPORT
36
Maximum concentration in filter media (RGF) = minimum removal by FL/CL followed by maximum removal by RGF
Minimum concentration in filter media (RGF) = maximum removal by FL/CL followed by minimum removal by RGF
Similarly, for a 3-step process, where RGF and SSF is used;
Maximum concentration in filter media (SSF) = minimum removal by FL/CL followed by minimum removal by RGF followed by maximum removal by SSF
Minimum concentration in filter media (RGF) = maximum removal by FL/CL followed by maximum removal by RGF followed by minimum removal by SSF
Table 5 gives the range of activity concentrations estimated in filter bed media for the two combinations of processes as a function of radionuclide and an activity concentration in the untreated input water of 1 Bq l-1. A throughput of 100 Ml has been assumed and default values for the mass of filter media required per Ml throughput have been assumed. Rapid gravity filter bed volumes can vary depending on the size of the tank from about 3 - 5 m in width and 8 - 20 m in length and typically have a filter bed depth of 1 - 1.5 m [Twort et.al, 2000]. For the purposes of estimating default activity concentrations in filter bed media within RGFs, a size of a filter bed was assumed to be 5 x 15 x 1 m, which is equal to 75 m3. It was also assumed that for every 100Ml of throughput, that 6 of these generic rapid gravity filters would be required based on observations made at treatment works. This can be converted to a mass of 720,000 kg of filter bed media per 100 Ml water throughput assuming the density of filter media was the same as for sand (1.6 103 kg m-3).
For slow sand filter beds, it was assumed that 20,000 m3 of filter bed volume would be required for every 100 Ml throughput [Twort et.al, 2000] with a typical depth of 1 m. It is recognised that this is a very rough estimate and there can be large variations between treatment works. This can be converted to a mass of 32,000,000 kg of filter bed media per 100 Ml water throughput assuming the density of filter media was the same as for sand (1.6 103 kg m-3).
There is a lot of uncertainty associated with the estimated concentrations as assumptions have been made on the combinations of processes used. The values have also been calculated for a specific size of filter beds and water throughput. However, the values in the table can be scaled to take into account different water throughputs and filter bed size using the equation given below. Estimated activity concentrations are useful to scope the levels that could be expected in filter media requiring disposal. Also they can be used to estimate doses to those operatives working with the contaminated filter bed media. Measurements of activity concentrations should always be used in the event of an incident to confirm actual levels in the filter media.
4.2.1.1 Adjustment of estimates of activity concentrations in filter media for a specific treatment works Scaling factor for throughput of water in period contaminated water enters the treatment works (FW) = throughput of water (Ml) / 100

ESTIMATING ACTIVITY CONCENTRATIONS IN DRINKING WATER AND WASTE PRODUCTS
37
Scaling factor for amount of filter media in rapid gravity filters (FRGF) = 7.2 103 / mass of filter media (kg) per Ml throughput.
Scaling factor for amount of filter media in slow sand filters (FSSF) = 3.2 105 / mass of filter media (kg) per Ml throughput
where mass of filter media = total area of filter beds (m2) x depth (m) x density (kg m-3) per Ml throughput. Density is assumed to be that for sand for all calculations.
Activity concentration in RGF filter bed media (Bq kg-1 per Bq l-1 in untreated input water) = value from Table 5 x FW x FRGF
Activity concentration in SSF filter bed media (Bq kg-1 per Bq l-1 in untreated input water) = value from Table 5 x FW x FSSF

HANDBOOK FOR ASSESSING THE IMPACT OF A RADIOLOGICAL INCIDENT ON LEVELS OF RADIOACTIVITY IN DRINKING WATER AND RISKS TO OPERATIVES AT WATER TREATMENT WORKS: SUPPORTING SCIENTIFIC REPORT
38
Table 5: Estimated activity concentrations in filter bed media for 1 Bq l-1 in the input water Range in estimated activity concentration in filter bed mediab, Bq kg-1 in filter media per Bq l-1 in input watera,c
Radionuclide
Floc/clar + RGFd Floc/clar + RGF + SSFd
60Co 4.2 - 3.3 101 3.8 10-2 - 7.5 10-2
75Se 4.2 - 3.3 101 3.8 10-2 - 7.5 10-2 89Sr 8.3 - 5.0 101 7.5 10-2 - 1.1 10-1
90Sr 8.3 - 5.0 101 7.5 10-2 - 1.1 10-1 95Zr 0.0 - 1.7 101 0.0 - 3.8 10-2
95Nb 0.0 - 1.7 101 0.0 - 3.8 10-2 99Mo 1.7 101- 5.8 101 2.6 10-1 - 5.3 10-1 103Ru 4.2 - 3.3 101 3.8 10-2 - 7.5 10-2 106Ru 4.2 - 3.3 101 3.8 10-2 - 7.5 10-2 132Te 8.3 - 5.0 101 7.5 10-2 - 1.1 10-1 131I 4.2 - 3.3 101 3.8 10-2 - 7.5 10-2 134Cs 8.3 - 5.0 101 7.5 10-2 - 1.1 10-1 136Cs 8.3 - 5.0 101 7.5 10-2 - 1.1 10-1 137Cs 8.3 - 5.0 101 7.5 10-2 - 1.1 10-1 140Ba 0.0 - 2.9 101 0.0 - 2.6 10-1
140La 0.0 - 2.9 101 0.0 - 2.6 10-11
144Ce 0.0 - 4.2 101 0.0 - 6.6 10-1
169Yb 1.7 101- 5.8 101 2.6 10-1 - 5.3 10-1
192Ir 4.2 - 3.3 101 3.8 10-2 - 7.5 10-2
226Ra 3.3 101 - 8.8 101 5.3 10-1 - 7.9 10-1
235U 0.0 - 4.2 101 0.0
238Pu 0.0 - 1.7 101 0.0 - 3.8 10-2
239Pu 0.0 - 1.7 101 0.0 - 3.8 10-2 241Am 0.0 - 1.7 101 0.0 - 3.8 10-2
a) Maximum value in range assumes minimum removal of radionuclides at each previous process step and maximum removal at final filtration step; minimum value in range assumes maximum removal of radionuclides at each previous process step and minimum removal at final filtration step (see Table 3 for removal efficiency factors).
b) A total mass of filter media has been assumed per Ml throughput. For RGF this is assumed to be 7200 kg; for SSF this is assumed to be 320,000 kg. A water throughput of 100 Ml is assumed. If throughput continues over a period of time, activity concentrations in the filter media will increase proportionally to throughput, assuming the activity concentration in the input water remains constant and there is no radioactive decay.
c) The estimate of 0.0 Bq kg-1 in water arises from the assumption that 100% of radioactivity has been removed from the water due to treatment processes (maximum value in range >70% in Table 3). In reality, it is very unlikely that any treatment will be 100% efficient in removing radioactivity, although the removal could be very high.
d) RGF = rapid gravity filtration; SSF – slow sand filtration.
4.2.2 Calculation of activity concentration in waste sludge Assuming that waste sludge is formed from the flocculation and clarification process the activity concentrations in the sludge can be estimated for contaminated input water entering the treatment works.

ESTIMATING ACTIVITY CONCENTRATIONS IN DRINKING WATER AND WASTE PRODUCTS
39
Activity concentration in waste sludge (Bq kg-1 per Bq l-1 in the untreated input water) = A x V x EFF / M
where:
A = Activity concentration of the untreated input water (Bq l-1)
V = throughput of water per day (l)
M = mass of waste sludge produced per day (kg)
EFF = amount of radioactivity removed in flocculation/clarification process (as a fraction of 1) from Table 3.
Removal of radioactivity by flocculation/clarification is a single step process. To estimate the maximum activity concentration in the sludge, the maximum efficiency of removal for flocculation/clarification should be used. For estimating the minimum concentration, the minimum removal efficiency should be used.

HANDBOOK FOR ASSESSING THE IMPACT OF A RADIOLOGICAL INCIDENT ON LEVELS OF RADIOACTIVITY IN DRINKING WATER AND RISKS TO OPERATIVES AT WATER TREATMENT WORKS: SUPPORTING SCIENTIFIC REPORT
40
Table 6: Estimated activity concentrations in sludge for 1 Bq l-1 in the input water
Radionuclide Rangea in estimated activity concentration in sludgeb, Bq kg-1 in sludge per Bq l-1 in input water
60Co 5.7 103 - 1.0 104
75Se 5.7 103 - 1.0 104 89Sr 1.4 103 - 5.7 103
90Sr 1.4 103 - 5.7 103 95Zr 1.0 104 - 1.4 104
95Nb 1.0 104 - 1.4 104 99Mo 5.7 103 - 1.0 104 103Ru 5.7 103 - 1.0 104 106Ru 5.7 103 - 1.0 104 132Te 1.4 103 - 5.7 103 131I 5.7 103 - 1.0 104 134Cs 1.4 103 - 5.7 103 136Cs 1.4 103 - 5.7 103 137Cs 1.4 103 - 5.7 103 140Ba 1.0 104 - 1.4 104
140La 1.0 104 - 1.4 104
144Ce 1.0 104 - 1.4 104
169Yb 5.7 103 - 1.0 104
192Ir 5.7 103 - 1.0 104
226Ra 1.4 103 - 5.7 103
235U 1.0 104 - 1.4 104
238Pu 1.0 104 - 1.4 104
239Pu 1.0 104 - 1.4 104 241Am 1.0 104 - 1.4 104
a) Maximum value in range assumes maximum removal of radionuclides at flocculation / clarification step; minimum value in range assumes minimum removal at flocculation / clarification step (see Table 3 for removal efficiency factors).
b) A default value of 7000 kg of de-watered sludge produced per 100Ml throughput is assumed. A water throughput of 100 Ml is assumed
Table 6 gives the range of activity concentrations estimated in de-watered sludge as a function of radionuclide and an activity concentration in the untreated input water of 1 Bq l-1. A throughput of 100 Ml has been assumed. For the mass of de-watered sludge produced, a default value of 7000 kg per 100 Ml of water throughput has been used. This value was based on information obtained from a range of treatment works in the UK with different daily throughputs of water and different input water quality. It is recognised that sludge may continue to dry out if it is stored prior to disposal. However, any additional loss of water is unlikely to influence the activity concentrations estimated significantly.
There is less uncertainty associated with the estimated concentrations in sludge than those in filter bed media as only one removal process is considered and assumptions on the combinations of processes used in a treatment works are not required. The values have been calculated for a specific sludge production rate. However, for those

ESTIMATING ACTIVITY CONCENTRATIONS IN DRINKING WATER AND WASTE PRODUCTS
41
treatment works that were visited as part of the study that managed sludge on site, the amount produced per unit volume of water did not vary by more than a factor of a few. It is therefore suggested that the values presented in Table 6 could be used to provide a robust estimate of activity concentrations that could be expected in sludge if activity concentrations of the order of 1 Bq l-1 in raw water entered a treatment works. Activity concentrations in sludge can be scaled directly to any different activity concentration in the untreated input water. It is preferable, however, to adjust the values in Table 6 to take into account different sludge production rates. This can be done using the equation given below.
The estimated activity concentrations in Table 6 are useful to scope the levels that could be expected in sludge requiring disposal. Also they can be used to estimate doses to those operatives working with the contaminated sludge. Measurements of activity concentrations should always be used in the event of an incident to confirm actual levels in the sludge, if possible.
4.2.2.1 Adjustment of estimates of activity concentrations in sludge for a specific treatment works Scaling factor for sludge produced (FSL) = 70 / amount of sludge produced per Ml of water
Activity concentration in sludge (Bq kg-1 per Bq l-1 in untreated input water) = value from Table 6 x FSL.
4.3 Activity concentrations in waste water
Waste water is generated from the backwashing of filters or the de-watering of floc. In some treatment works, waste water is recycled to the beginning of the treatment process to minimise losses of water. Any contamination in this water will then contribute to the overall activity concentrations in the waste sludge or in the filter media, although the contribution is likely to be very small compared with the overall input from raw water as this process involves relatively small volumes of water.
Some waste water may be disposed of directly to natural water sources or sewers. The volume of waste water compared with that from the natural source or sewer water is likely to be very small. Consequently, any contamination from this waste water will be significantly diluted. Disposal of this waste water in the event of a radiological incident would need to be considered, but this topic is outside the remit of the present study.

HANDBOOK FOR ASSESSING THE IMPACT OF A RADIOLOGICAL INCIDENT ON LEVELS OF RADIOACTIVITY IN DRINKING WATER AND RISKS TO OPERATIVES AT WATER TREATMENT WORKS: SUPPORTING SCIENTIFIC REPORT
42
5 ASSESSING DOSES TO OPERATIVES WORKING IN DRINKING WATER TREATMENT WORKS
The following steps have been followed in developing a methodology for assessing potential radiation doses to operatives working in drinking water treatment works in the event of a radiological incident.
a Determine tasks undertaken in treatment works. b Identify potential radiation exposure pathways. c Provide method to estimate doses for each identified task and exposure
pathway, including 'look-up' tables of dose factors for each task. d Provide method for Water Industry to assess doses for generic and specific
treatment works. The term dose is used throughout the remaining Sections of the report to mean effective dose unless otherwise specified. Effective dose is the quantity used in radiation protection that incorporates the sensitivity of different types of living tissue to damage by different types of ionising radiation received by the human body. It is a measure of radiation exposure and has the unit, Sv (Sievert). Exposure to radiation can be divided into two broad pathways. These are external irradiation, when the source of the radiation is outside the body, and internal irradiation, when the radioactivity is inside the body, for example following ingestion or inhalation. Consequently, external irradiation occurs only when a person is in relatively close proximity to the source of the radioactivity and for the duration of time that the person remains close to it. In contrast, following the intake of radioactivity into the body, internal irradiation can continue over extended periods whilst the radionuclide remains inside the body, and is often referred to as a committed dose. Calculations of effective dose take account of both external irradiation and the committed dose from intakes of radionuclides. Generally, the doses encountered as a result of radioactivity in the environment are expressed in terms of the microSieverts (μSv), which is one millionth of one Sievert, or the milliSievert (mSv), which is one thousandth of one Sievert.
5.1 Operative tasks undertaken in water treatment works
Information on what tasks people undertake in treatment works and how long they spend doing them is a key input into any assessment of the radiation doses that operatives might receive from radioactive contamination within the works. In this study, both standard operation and regeneration of treatment processes have been considered. In both cases, handling of any waste on site has also been included.
The main operative tasks that have been identified are summarised in Table 7. Based on information gathered from a number of treatment works, values have been estimated of the likely time taken to implement each task, the number of people involved and the frequency the task is likely to be carried out. Not all of these tasks will be carried out at any specific treatment works. For example, many water treatment works run largely unmanned, apart from periodic testing of the water quality and routine maintenance.

ASSESSING DOSES TO OPERATIVES WORKING IN DRINKING WATER TREATMENT WORKS
43
For each of the tasks, the potential radiation exposure pathways have been identified. People could be exposed to radioactive contamination within the treatment works while they are working on either day-to-day tasks or undertaking routine maintenance. The main exposure pathways are as follows:
a external irradiation from gamma-ray emitting radionuclides residing within the treatment works, for example waste sludge or filter media;
b external irradiation from beta emitting radionuclides residing within the treatment works, for example waste sludge or filter media;
c inhalation of contaminated material resuspended into the air from contaminated material residing in the works, for example sludge being dried in bunkers.
In certain cases, other exposure pathways such as the inadvertent ingestion of contamination from tasks involving working with sludge or filter media may warrant consideration. The potential exposure pathways for each identified task are listed in Table 8.
The specific tasks identified were then grouped into 'generic' tasks, reflecting sets of tasks for which any radiation exposure is likely to be similar. This approach has been adopted so that the radiation exposures can be estimated for operatives in any drinking water treatment works. The generic tasks considered in the study are listed in Table 9 together with the exposure pathways considered and typical specific tasks that fit into each generic category. The generic tasks were also split into two categories: relatively frequent day-to-day tasks and routine maintenance tasks. Day-to-day tasks are defined as those that are carried out on at least a weekly basis. These are tasks that it is very difficult to delay or stop, such as sludge press work. Routine maintenance tasks are defined as those whose implementation is planned for and can possibly be delayed if necessary. An example would be the replacement of sand filter media.

HANDBOOK FOR ASSESSING THE IMPACT OF A RADIOLOGICAL INCIDENT ON LEVELS OF RADIOACTIVITY IN DRINKING WATER AND RISKS TO OPERATIVES AT WATER TREATMENT WORKS: SUPPORTING SCIENTIFIC REPORT
44
Table 7: Information collected on tasks undertaken in drinking water treatment works Task Number of
people Time taken Frequency
Water quality testing 1 1 hour Weekly
Inspection of gravity settling plant 1 1 hour Daily
Inspection of dissolved air flotation tanks (DAF) 1 1 hour Daily
Removing/replenishing top 0.1 m of slow sand filters 3 1 -2 days Every 2 months
Emptying/filling sludge pressa 2 1 hour Daily
Maintenance, servicing and cleaning of sludge press 1 or 2 2 hours Every 2 days
Repairing / checking membrane filters 2 4 days Every 2 months
General plant maintenance, servicing equipment (presses, centrifuges and pumps, ion exchange media etc)
1 or 2 As required
Working with stored sludge 1 or 2 3 hours 3 days per week
Emptying sludge storage bunkers 1 or 2 1 Every 2 days
Driving waste sludge to landfill, sewage works 1 2 hours 3 times per week
Emptying and replacing rapid gravity filters 3 1 week Every 7 - 20 years
Emptying and replacing slow sand filters 3 1 month Every 20 years
Cleaning out filters, lamellas, storage tanks 2 or 3 Days - weeks
As required
a) Assumes 1 pressing per day

ASSESSING DOSES TO OPERATIVES WORKING IN DRINKING WATER TREATMENT WORKS
45
Table 8: Operative tasks and potential exposure pathways
Task Type of task Exposure pathway Water quality testing Day-to-day External gamma
Inspection at dissolved air floatation plant Day-to-day External gamma/beta
Inspection at gravity settling plant Day-to-day External gamma
Inspection of backwashing of filters Day-to-day External gamma / beta, inhalation via enhanced resuspension
Emptying sludge press Day-to-day External gamma / beta, ingestion via hands
Filling sludge press Day-to-day External gamma
On site storage of sludge (in bunkers) Day-to-day External gamma/beta (outdoor/ in vehicle), inhalation via enhanced resuspension
Emptying sludge storage bunkers on site Day-to-day External gamma (outdoor / in vehicle), inhalation via enhanced resuspension (higher than for than for storage due to sludge being dry and operatives having to disturb it)
Driving waste sludge to landfill, sewage works and sludge lagoons etc
Day-to-day External gamma (outdoor / in vehicle)
Maintenance, servicing and cleaning of sludge presses
Day-to-day External gamma/beta, ingestion via hands, inhalation via enhanced resuspension
Emptying sludge lagoons Routine maintenance
External gamma (outdoor / in vehicle), inhalation via enhanced resuspension
Cleaning rapid gravity filter tanks (outdoors) Routine maintenance
External gamma / beta, inhalation via enhanced resuspension due to hosing creating an aerosol
Cleaning rapid gravity filter tanks (indoors) Routine maintenance
External gamma / beta, inhalation via enhanced resuspension due to hosing creating an aerosol
Cleaning clarifiers, lamella tanks (indoors or outdoors)
Routine maintenance
External gamma / beta, inhalation via enhanced resuspension due to hosing creating an aerosol
Emptying and replacing rapid gravity filter media (outdoors)
Routine maintenance
External gamma / beta, ingestion via hands, inhalation via enhanced resuspension
Emptying and replacing rapid gravity filter media (indoors)
Routine maintenance
External gamma / beta, ingestion via hands
Emptying and replacing slow sand filter media Routine maintenance
External gamma / beta (outdoor / in vehicle), ingestion via hands, inhalation via enhanced resuspension
Replenishing rapid gravity filters (outdoors) Routine maintenance
External gamma / beta, inhalation via enhanced resuspension
Replenishing rapid gravity filters (indoors) Routine maintenance
External gamma/beta
Removing/replenishing top 0.1 m from slow sand filters
Routine maintenance
External gamma (outdoor / in vehicle), ingestion via hands, inhalation via enhanced resuspension
Maintenance, servicing and cleaning of centrifuges
Routine maintenance
External gamma / beta, ingestion via hands, inhalation via enhanced resuspension
General plant maintenance unspecified, servicing equipment (pumps, valves, pipe work etc)
Routine maintenance
External gamma
Repairing / checking membrane filters Routine maintenance
External gamma / beta due to contact with contaminated water
Replacing ion exchange media Routine maintenance
External gamma / beta
Replacing reverse osmosis membranes Routine maintenance
External gamma / beta

HANDBOOK FOR ASSESSING THE IMPACT OF A RADIOLOGICAL INCIDENT ON LEVELS OF RADIOACTIVITY IN DRINKING WATER AND RISKS TO OPERATIVES AT WATER TREATMENT WORKS: SUPPORTING SCIENTIFIC REPORT
46
Table 9: Generic Tasks Generic task Potential exposure pathways Typical tasks included
Water quality testing
Inspection of gravity settling plant
General plant maintenance unspecified
General maintenance / inspection
External gamma
Inspection of flocculation/clarification units (not DAF)
Inspection of back-washing of filter beds
External gamma, external beta, inhalation of resuspended spray and filter media
Maintenance of DAF unitsa External gamma + beta Inspection at dissolved air floatation (DAF) plant
Replenishing rapid gravity filters (indoor / outdoor)
Cleaning rapid gravity filters (indoor / outdoor)
Emptying and replacing rapid gravity filter media (indoor / outdoor)
Removing/replenishing top 0.1 m from slow sand filter media
Filter bed maintenance External gamma / beta, inhalation in dry conditions or if windy outdoors or if hosing
Emptying and replacing slow sand filter media
Cleaning lamellas (indoor/outdoor) Cleaning settling tanks External gamma/beta, inhalation in dry conditions or if windy outdoors or if hosing
Cleaning settling tanks / clarifiers
Transporting sludge External gamma (outdoor in vehicle) Driving sludge to storage bunkers / landfill / lagoons / sewage works etc
Emptying on site storage of sludge bunkers
Emptying sludge lagoons
Working with processed sludge
External gamma / beta *, ingestion via hands, inhalation if sludge is air dried in bunkers or lagoons
Working with stored sludge
Emptying sludge press
Maintenance, servicing and cleaning of sludge press
Operating sludge press External gamma / beta, ingestion via hands, inhalation via enhanced resuspension if dry or using pressure hose
Maintenance, servicing and cleaning of centrifuges
Repairing/checking membrane filters
Replacing ion exchange media
Membrane/ reverse osmosis / ion exchange unit maintenance
External gamma / beta
Replacing reverse osmosis membranes
a) Also relevant to other works where floc forms a layer on top of the water during flocculation/clarification stage.
5.2 Calculation of doses for the identified generic tasks
To calculate doses to drinking water treatment operatives, three major pieces of information are required:
a the activity concentration of the contaminated material that operatives are exposed to;

ASSESSING DOSES TO OPERATIVES WORKING IN DRINKING WATER TREATMENT WORKS
47
b the length of time that operatives are exposed to contaminated material; c dose factors that give the radiation dose per unit of activity concentration for
each generic task for each exposure pathway per hour of exposure, ie. in a specific exposure situation. Dose factors are expressed in terms such as mSv h-1 / Bq kg-1 or mSv h-1 / Bq l-1.
The activity concentrations in each media that the operatives could be exposed to have been estimated as described in Section 4.
For the 'day-to-day' tasks, default values have been assigned to the time spent per day undertaking each of the more typical tasks and these are given in Table 10. It should be noted that these values are only intended as a guide and for use where no specific information is available for a treatment works. For routine maintenance tasks, default values have not been selected as the tasks and the time spent undertaking them are very variable across treatment works. The time taken for each routine maintenance task should be determined on a site specific basis for estimating potential dose for undertaking these tasks. Some indication of the time taken based on a few treatment works is given in Table 7.
The dose factors are given later in this Section. The method used for their calculation is described below in Sections 5.2.1- 5.2.4.
5.2.1 External doses from gamma-ray emitting radionuclides For each of the generic tasks, dose factors for estimating external doses from gamma-emitting radionuclides have been calculated using one of two models, either GRANIS [Kowe et al, 2007] or Microshield [Negin, 1986]. The model used has depended on the scenario being modelled; a description of the assumptions made for each generic task is given below.
Where external exposure is from a source of unspecified size and dimension, GRANIS has been used to calculate the dose factors for external gamma doses [Kowe et al, 2007]. This model assumes that exposure arises from a source of known depth, but infinite lateral size. Typically, most of the external dose (> 95%) comes from exposure to the contaminated material that is within a few tens of metres of the subject [Andersson, 1996]. Therefore, assuming an infinite lateral size is not very conservative for the situations being modelled in this study and will not significantly overestimate the dose.
Where exposure is from a source of known dimensions, Microshield has been used to calculate dose factors. Microshield can also take into account any shielding provided between the contamination and the operative.
Dose factors have been calculated for each of the generic tasks. The dose factors are expressed as mSv h-1 for a unit activity concentration in the contaminated material that gives rise to the exposure, ie, either 1 Bq l-1 for water or 1 Bq kg-1 for filter media, floc and sludge. The densities that have been assumed for the various materials that could give rise to exposures are given in Table 11.

HANDBOOK FOR ASSESSING THE IMPACT OF A RADIOLOGICAL INCIDENT ON LEVELS OF RADIOACTIVITY IN DRINKING WATER AND RISKS TO OPERATIVES AT WATER TREATMENT WORKS: SUPPORTING SCIENTIFIC REPORT
48
Table 10 Day-to-day tasks undertaken in drinking water treatment works Generic Task name Specific task Default value for time
spent per day, h General maintenance / inspection Water quality testing
Inspection of gravity settling plant
Inspection of flocculation / clarification units (not DAF)
0.14
1.0
1.0
Inspection of back-washing of filters 0.5
Maintenance of DAF unitsa Inspection at dissolved air floatation (DAF) plant
1.0
Transporting sludge Driving sludge to storage bunkers / landfill / lagoons / sewage works etc
1.0
Working with processed sludge Emptying on site storage of sludge bunkers
Working with stored sludge
0.5
1.3
Operating sludge press Emptying sludge press
Maintenance, servicing and cleaning of sludge press
1.0
1.0
a) Also relevant to other works where floc forms a layer on top of the water during flocculation/clarification stage.
Table 11: Densities of materials assumed in the study Material Density, kg m-3
Filter media (assumed to be sand) 1600
Sludge 1500
Floc 200
Floc/sludge in settling tanks or lamellasa 1000
Water 1000
a) Assumed to be 95% water and 5% floc and to have the same density as water
Generic task: General maintenance / inspection
It is assumed that a person is standing 1 m above a tank of water. The tank is assumed to be 3 m deep and to be infinite in surface area. This is a cautious assumption and will provide a robust estimate of dose irrespective of the size of the tank. It is also assumed that there is no partitioning between phases (ie, water and filter media or water and floc) and no account has been taken of any shielding from tank walls.
ASSESSING DOSES TO OPERATIVES WORKING IN DRINKING WATER TREATMENT WORKS
49
The water is assumed to be contaminated at the same activity concentration as that in the untreated input water. This may be a conservative assumption for inspection that occurs at point in the works where some treatment of the water has taken place. However, the dose factors will give a robust idea of the levels of exposure that could arise. The uncertainty due to the difference between activity concentrations in the water and those in the input water is likely to be small compared with that from the broad assumptions made in modelling this generic task.
Generic tasks: Inspection of back-washing of filters
Any exposure results from operatives being in close proximity to the filter media. It is assumed that a person is standing 1 m above a slab of filter media (eg, sand or carbon or both) of 1 m thickness and infinite surface area. The radioactivity is assumed to be evenly distributed throughout the filter media.
Generic task: Maintenance of DAF units
Any exposure of the operatives results from the floc lying on top of the clarification tanks. It is assumed that a person is standing 1 m above a 20 mm layer of floc of dimension 5 x 15 m (tank surface area). It is also assumed that the floc has the same activity concentration as that in the resultant waste sludge. However, at this stage in the treatment, the floc will be very wet and will have a much lower density than de-watered sludge. A density of 200 kg m-3 has been assumed. This means that the activity concentration per kg of floc is much lower than that in the de-watered sludge produced.
For flocculation / clarification units where the floc settles on the bottom of the tank, it is assumed that there is no exposure from the contaminated floc. For inspection of these tanks, the generic task 'general maintenance / inspection’ should be used to represent this task (see Table 9).
Generic task: Filter bed maintenance
Any exposure results from contamination in the filter media. It is assumed that a person is standing 1 m above a slab of filter media (eg, sand or carbon or both) of 1 m thickness and infinite surface area. The radioactivity is assumed to be evenly distributed throughout the filter media.
Generic task: Cleaning settling tanks
Any exposure results from contamination in the floc/sludge in the bottom of the tanks. For this calculation, it is assumed that all of the sludge in the settling tanks is at the bottom of the tanks. The sludge is assumed to be 95% water and 5% floc and the material has been assumed to have the same density as water (see Table 11). It is assumed that a person is standing 1 m above a 50 mm layer of floc/sludge.

HANDBOOK FOR ASSESSING THE IMPACT OF A RADIOLOGICAL INCIDENT ON LEVELS OF RADIOACTIVITY IN DRINKING WATER AND RISKS TO OPERATIVES AT WATER TREATMENT WORKS: SUPPORTING SCIENTIFIC REPORT
50
Generic task: Transporting sludge
Any exposure results from contamination in the waste sludge. It is assumed that sludge is transported in a vehicle such as a lorry having a separate cab for the driver. The person inside the driver’s cab is exposed to a block of contaminated material, eg, sludge, of 1.5 x 2 x 5 m which is in a trailer and about 1 m from the driver. It is assumed that the driver’s cab is made of steel 2 mm thick and this offers the driver some shielding from the contaminated waste sludge.
Generic task: Working with processed sludge
Any exposure results from contamination in the waste sludge. It is assumed that a person is standing 1 m above a 1 m layer of sludge of infinite surface area. If operatives are working in vehicle, then some shielding may be provided between the waste sludge and the operative. No shielding has been taken into account in the default dose factors provided: an appropriate shielding factor to use is a reduction in dose rate of 20%, ie, the operative receives 80% of the dose over the period he is in the vehicle. If the person is in a vehicle, then the shielding factor from the driver’s cab can be assumed to be 20 %.
Generic task: Operating sludge press
Any exposure results from contamination in the waste sludge. It is assumed that an operative is standing 0.5 m away from a block of sludge of dimensions 1.5 x 1.5 x 10 m and that there is no shielding.
Generic task: Membrane / reverse osmosis / ion exchange unit maintenance
Any exposure results from contamination in the water. The water is assumed to be contaminated at the same activity concentration as that in the untreated input water. This may be a conservative assumption for inspection that occurs at points in the works where some treatment of the water has taken place. However, the dose factors will give a robust idea of the levels of exposure that could arise. The uncertainty due to any difference between activity concentrations in the treated water and those in the input water is likely to be small compared with that from the broad assumptions made in modelling this generic task.
It is assumed that an operative is standing 0.5 m away from a contaminated object of dimensions 1 m long by 0.3 m diameter for maintenance of membrane cartridges. For reverse osmosis or ion exchange units, the dimensions of the contaminated object are assumed to be 3 m long by 1m diameter.
5.2.2 External dose from beta emitting radionuclides For most of the radionuclides considered, there are contributions to the effective dose from both beta and gamma-ray emissions. If there is uniform exposure of the skin,

ASSESSING DOSES TO OPERATIVES WORKING IN DRINKING WATER TREATMENT WORKS
51
rather than irradiation of small areas, then the effective dose includes the contribution from the dose to the skin. In this way the risk of skin cancer is covered if the effective dose is used. In most cases the contribution from the beta emissions to doses to the skin can be ignored. For 90Sr and its daughter, 90Y, which is a strong beta emitter, effective doses have been estimated for external exposure for those generic tasks where operatives can come into very close contact with potentially contaminated materials within the treatment works. These generic tasks are: maintenance of DAF units, filter bed maintenance, cleaning settling tanks, working with processed sludge, operating sludge press and maintenance of membranes / reverse osmosis or ion exchange units. It should be noted that weak beta emitting radionuclides are only likely to be an external hazard if there are very high levels of contamination and the contamination is very close to people.
For 90Sr and its decay product 90Y, both of which only emit beta particles, the skin dose is about a factor of 100 higher than the effective dose. However, for the skin dose to be of concern, ie, to give rise to short term observable tissue effects such as skin ulceration, effective doses in excess of 10 mSv in a year would need to be received. In the event that effective doses at this level were predicted following a radiological incident, specialist radiation protection advice would need to be sought. This is discussed in more detail in Section 6.
External beta dose rates are taken from Holford [1989], where calculated values are presented for a number of different scenarios. Suitable scenarios have been adopted to represent the exposure situations being considered in this study and details of the assumptions and justification of their use are described below. The paucity of published external beta dose data has required the approach of adopting similar exposure situations and media that give rise to the exposure. For estimating external beta doses, an effective height of 0.8 m above the contaminated surface is assumed (the effective height given in Holford, 1989) and no shielding from clothing is taken into account. The derived dose factors are therefore conservative as it is expected that the workforce will be clothed and would be wearing gloves. Both external doses to the skin (estimated at a depth of 70μm) and the effective dose have been estimated.
For the generic tasks 'filter bed maintenance', ‘inspection of back-washing of filters’ and 'working with processed sludge' published data for dose rates above uniformly contaminated soil has been used [Holford, 1989]. The use of these data makes the implicit assumption that filter media and sludge have the same density and composition as soil, which is a reasonable approximation for scoping puposes (see Table 11).
For the generic tasks 'maintenance of DAF units', 'cleaning settling tanks' and 'operating sludge press' data for dose rates above a contaminated surface have been used [Holford, 1989]. This assumes that all of the contamination is on the surface and does not take into account distribution with depth of the contamination. This is a robust approach, which again is reasonable for scoping purposes.
For the generic tasks 'membrane, reverse osmosis or ion exchange unit maintenance', dose rate data from Holford (1989) have been used for immersion of the body in water. This is a robust approach and is likely to overestimate the external beta dose rates as only the hands and arms are likely to be immersed in water.

HANDBOOK FOR ASSESSING THE IMPACT OF A RADIOLOGICAL INCIDENT ON LEVELS OF RADIOACTIVITY IN DRINKING WATER AND RISKS TO OPERATIVES AT WATER TREATMENT WORKS: SUPPORTING SCIENTIFIC REPORT
52
Clothing and the use of gloves will also protect operatives from doses to the skin from contamination residing on the skin, for example in the form of wet sludge. This exposure pathway has not been considered further as these doses will not be significant compared with those from other exposure pathways. These doses can, in any case, be avoided if overalls and gloves are worn.
5.2.3 Inadvertent ingestion For the generic tasks where inadvertent ingestion of contaminated material is possible, dose factors to operatives have been estimated. These tasks are 'working with processed sludge' and ‘operating sludge press'. Any exposure results from contamination in the waste sludge. The calculations are based on an inadvertent ingestion rate of 5 mg h-1 of sludge [Smith and Jones, 2003].
5.2.4 Inhalation For the generic tasks where inhalation of contaminated material is possible, dose factors to operatives have also been estimated. These tasks are 'filter bed maintenance', 'inspection of back-washing of filters' and 'cleaning settling tanks', 'working with processed sludge' and 'operating sludge press'. Any exposure results from contamination in the waste sludge or filter media. The calculations are based on an inhalation rate of 1.2 m3 h-1 [Smith and Jones, 2003]. For working with dry sludge and filter media a dust loading of 10 mg m-3 is assumed [Titley et al, 2000]. It is recognised that this is a cautious value for the dust loading; however, it has been chosen so that doses are not underestimated for situations where operatives could be working in very dusty environments. The value is therefore appropriate for scoping the potential doses to operatives.
The action of back washing filters will generate an aerosol. This material will consist mainly of water but will also contain a fraction of the particulate material that has been dislodged by the backwashing process and a very small amount of fine particulate filter media. Due to the high pressure used for back-washing a dust loading of 10 mg m-3 has been used, ie, representative of very dusty environments. This is applied to the contamination in the filter media, ie, it is assumed that all of the inhaled material is sand. It is recognised that this is likely to be a conservative approach, both due to the dust loading assumed and the fact that not all of the aerosol will consist of filter media. Again, this approach is considered appropriate for scoping potential doses to operatives. The alternative approach of assuming that the aerosol comprises only of water may underestimate doses to operatives because the filter media will accumulate contamination over time and may still be contaminated after contaminated water has stopped entering the works.
5.3 Overall doses for all relevant exposure pathways
For each of the generic tasks listed in Table 9, default dose factors have been calculated to assist in the estimation of doses to operatives undertaking these tasks.
ASSESSING DOSES TO OPERATIVES WORKING IN DRINKING WATER TREATMENT WORKS
53
The dose factors are presented in Table 12 - Table 20. For each generic task, two sets of dose factors are given. These are as follows:
• the dose per hour of exposure per unit activity concentration in the media containing the contamination, ie, water, filter media or sludge;
• the dose per hour of exposure for a unit activity concentration in the raw input water entering the works.
Dose factors are given for each radionuclide considered in the study. For the reasons given at the beginning of Section 5, in each case, both external and internal irradiation have been considered and a breakdown is given by exposure pathway for each generic task to enable the user to see which exposure pathway contributes most to the doses received. For the dose factors per unit activity concentration in the raw input water, a range of values is given that reflects the range in removal efficiency factors for each treatment process. In this way they take into account the range in activity concentrations in sludge or filter media that could be expected for a given input of radioactivity into the treatment works.
In order to estimate the potential dose to an operative from undertaking a task over a given period, eg, a week, the following equation can be used:
D = Dc x Ac x T
where:
D = Effective dose received from undertaking a task over period of interest, Sv
Dc = Dose factor (summed over all relevant exposure pathways), mSv h-1 per Bq kg-1 in the contaminated media
Ac = Activity concentration giving rise to the exposure, Bq kg-1 in solid media or Bq l-1 in raw input water.
T = time spent on task over period of interest, h.
If an operative undertakes a number of tasks, the doses from each of these tasks can be summed.
The Handbook introduces the concept of a 'critical individual'. This is a notional individual who carries out all of the day-to-day tasks undertaken during a week. The estimated dose to this 'critical individual' provides a conservative estimate of the dose that could be received by an individual who carries out all of the day-to-day tasks identified for a given treatment works. It is very unlikely that any individual would receive a radiation dose higher than this value.
The dose to the 'critical individual' can be estimated by summing the doses over all of the day-to-day tasks carried out in the period of interest.
The derived dose factors are given in Table 12 - Table 20. For each generic task, the most important exposure pathway for each radionuclide is given in bold text. It is worth

HANDBOOK FOR ASSESSING THE IMPACT OF A RADIOLOGICAL INCIDENT ON LEVELS OF RADIOACTIVITY IN DRINKING WATER AND RISKS TO OPERATIVES AT WATER TREATMENT WORKS: SUPPORTING SCIENTIFIC REPORT
54
repeating that the parameters in these Tables are dose factors and are therefore expressed in units such as mSv h-1 / Bq kg-1. The resultant numerical values are in many cases very small.
For planning purposes and for scoping potential doses to operatives, it is recommended that the maximum dose factors are used, ie, those calculated using the maximum predicted activity concentration in the media that the operatives are being exposed to.
Table 12: Default dose factors for generic task 'general maintenance / inspection'a
Dose factors per unit activity concentration in media giving rise to the exposure, mSv h-1 / Bq l-1 in water
Radionuclide
External gamma Totala
Dose factors per unit activity concentration in untreated input water, mSv h-1 / Bq l-1 in waterb
60Co 5.5 10-07 5.5 10-7 5.5 10-7 75Se 8.7 10-8 8.7 10-8 8.7 10-8 89Sr 1.8 10-11 1.8 10-11 1.8 10-11 90Sr 6.5 10-15 6.5 10-15 6.5 10-15 95Zr 1.6 10-7 1.6 10-7 1.6 10-7 95Nb 1.6 10-7 1.6 10-7 1.6 10-7 99Mo 6.2 10-8 6.2 10-8 6.2 10-8 103Ru 9.8 10-8 9.8 10-8 9.8 10-8 106Ru 4.3 10-8 4.3 10-8 4.3 10-8 132Te 4.8 10-8 4.8 10-8 4.8 10-8 131I 8.1 10-8 8.1 10-8 8.1 10-8 134Cs 3.3 10-7 3.3 10-7 3.3 10-7 136Cs 4.6 10-7 4.6 10-7 4.6 10-7 137Cs 1.3 10-7 1.3 10-7 1.3 10-7 140Ba 5.5 10-7 5.5 10-7 5.5 10-7 140La 5.1 10-7 5.1 10-7 5.1 10-7 144Ce 1.1 10-8 1.1 10-8 1.1 10-8 169Yb 6.5 10-8 6.5 10-8 6.5 10-8 192Ir 1.8 10-7 1.8 10-7 1.8 10-7 226Ra 3.3 10-7 3.3 10-7 3.3 10-7 235U 3.5 10-8 3.5 10-8 3.5 10-8 238Pu 1.3 10-11 1.3 10-11 1.3 10-11 239Pu 1.5 10-11 1.5 10-11 1.5 10-11 241Am 4.4 10-9 4.4 10-9 4.4 10-9
Bold indicates dominant exposure pathway
a) The only exposure pathway considered for this generic task is external gamma dose from being in close proximity to contaminated water. This means that the sum of the dose factors (total) is the same as that from external gamma exposure.
b) The dose factors per unit activity concentration in untreated input water are the same as those per unit activity concentration in media giving rise to the exposure because, in the former case, the media giving rise to the exposure is assumed to be untreated input water.
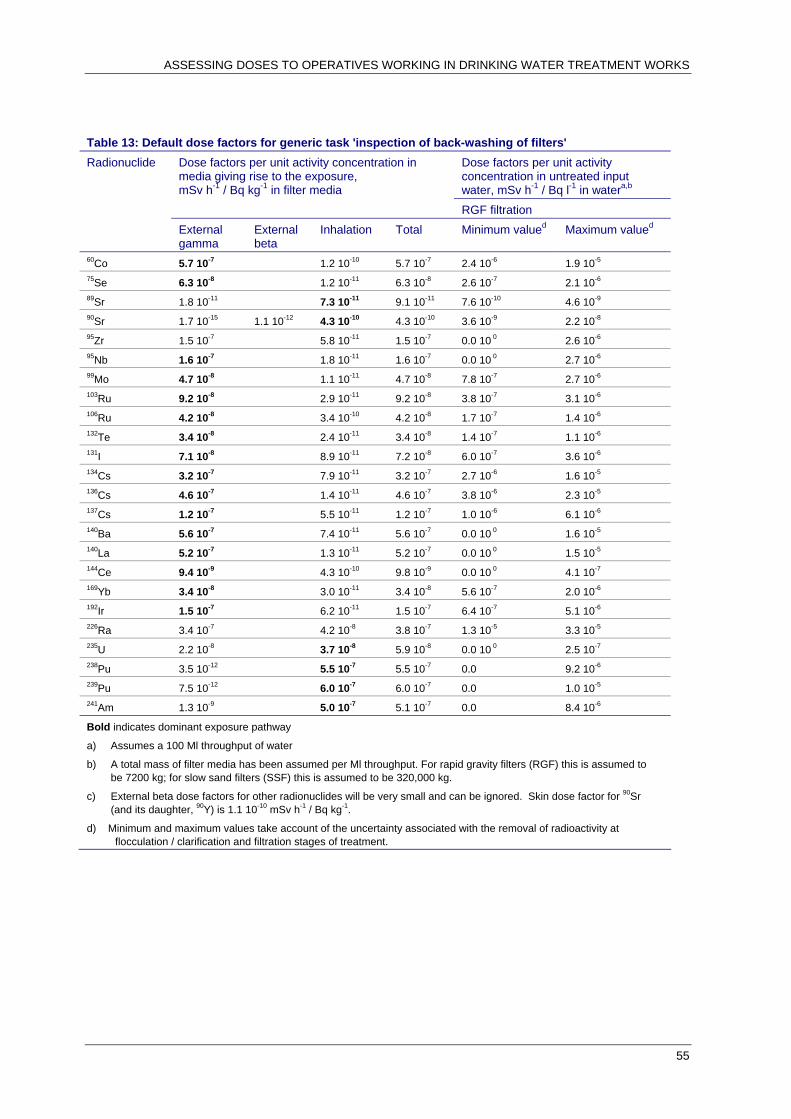
ASSESSING DOSES TO OPERATIVES WORKING IN DRINKING WATER TREATMENT WORKS
55
Table 13: Default dose factors for generic task 'inspection of back-washing of filters' Dose factors per unit activity concentration in untreated input water, mSv h-1 / Bq l-1 in watera,b
Dose factors per unit activity concentration in media giving rise to the exposure, mSv h-1 / Bq kg-1 in filter media
RGF filtration
Radionuclide
External gamma
External beta
Inhalation Total Minimum valued Maximum valued
60Co 5.7 10-7 1.2 10-10 5.7 10-7 2.4 10-6 1.9 10-5 75Se 6.3 10-8 1.2 10-11 6.3 10-8 2.6 10-7 2.1 10-6 89Sr 1.8 10-11 7.3 10-11 9.1 10-11 7.6 10-10 4.6 10-9 90Sr 1.7 10-15 1.1 10-12 4.3 10-10 4.3 10-10 3.6 10-9 2.2 10-8 95Zr 1.5 10-7 5.8 10-11 1.5 10-7 0.0 10 0 2.6 10-6 95Nb 1.6 10-7 1.8 10-11 1.6 10-7 0.0 10 0 2.7 10-6 99Mo 4.7 10-8 1.1 10-11 4.7 10-8 7.8 10-7 2.7 10-6 103Ru 9.2 10-8 2.9 10-11 9.2 10-8 3.8 10-7 3.1 10-6 106Ru 4.2 10-8 3.4 10-10 4.2 10-8 1.7 10-7 1.4 10-6 132Te 3.4 10-8 2.4 10-11 3.4 10-8 1.4 10-7 1.1 10-6 131I 7.1 10-8 8.9 10-11 7.2 10-8 6.0 10-7 3.6 10-6 134Cs 3.2 10-7 7.9 10-11 3.2 10-7 2.7 10-6 1.6 10-5 136Cs 4.6 10-7 1.4 10-11 4.6 10-7 3.8 10-6 2.3 10-5 137Cs 1.2 10-7 5.5 10-11 1.2 10-7 1.0 10-6 6.1 10-6 140Ba 5.6 10-7 7.4 10-11 5.6 10-7 0.0 10 0 1.6 10-5 140La 5.2 10-7 1.3 10-11 5.2 10-7 0.0 10 0 1.5 10-5 144Ce 9.4 10-9 4.3 10-10 9.8 10-9 0.0 10 0 4.1 10-7 169Yb 3.4 10-8 3.0 10-11 3.4 10-8 5.6 10-7 2.0 10-6 192Ir 1.5 10-7 6.2 10-11 1.5 10-7 6.4 10-7 5.1 10-6 226Ra 3.4 10-7 4.2 10-8 3.8 10-7 1.3 10-5 3.3 10-5 235U 2.2 10-8 3.7 10-8 5.9 10-8 0.0 10 0 2.5 10-7 238Pu 3.5 10-12 5.5 10-7 5.5 10-7 0.0 9.2 10-6 239Pu 7.5 10-12 6.0 10-7 6.0 10-7 0.0 1.0 10-5 241Am 1.3 10-9 5.0 10-7 5.1 10-7 0.0 8.4 10-6
Bold indicates dominant exposure pathway
a) Assumes a 100 Ml throughput of water
b) A total mass of filter media has been assumed per Ml throughput. For rapid gravity filters (RGF) this is assumed to be 7200 kg; for slow sand filters (SSF) this is assumed to be 320,000 kg.
c) External beta dose factors for other radionuclides will be very small and can be ignored. Skin dose factor for 90Sr (and its daughter, 90Y) is 1.1 10-10 mSv h-1 / Bq kg-1.
d) Minimum and maximum values take account of the uncertainty associated with the removal of radioactivity at flocculation / clarification and filtration stages of treatment.

HANDBOOK FOR ASSESSING THE IMPACT OF A RADIOLOGICAL INCIDENT ON LEVELS OF RADIOACTIVITY IN DRINKING WATER AND RISKS TO OPERATIVES AT WATER TREATMENT WORKS: SUPPORTING SCIENTIFIC REPORT
56
Table 14: Default dose factors for generic task 'maintenance of DAF unit' Dose factors per unit activity concentration in media giving rise to the exposure, mSv h-1 / Bq kg-1 in floc
Dose factors per unit activity concentration in untreated input water, mSv h-1 / Bq l-1 in watera
Radionuclide
External gamma
External beta c Total Minimum valued Maximum valued
60Co 9.1 10-9 9.1 10-9 5.2 10-5 9.1 10-5 75Se 1.6 10-9 1.6 10-9 9.4 10-6 1.6 10-5 89Sr 3.5 10-13 3.5 10-13 5.1 10-10 2.0 10-9 90Sr 1.6 10-15 5.1 10-14 5.3 10-14 7.5 10-11 3.0 10-10 95Zr 6.2 10-9 6.2 10-9 6.2 10-5 8.9 10-5 95Nb 3.1 10-9 3.1 10-9 3.1 10-5 4.5 10-5 99Mo 1.1 10-9 1.1 10-9 6.5 10-6 1.1 10-5 103Ru 1.9 10-9 1.9 10-9 1.1 10-5 1.9 10-5 106Ru 7.8 10-10 7.8 10-10 4.5 10-6 7.8 10-6 132Te 1.6 10-9 1.6 10-9 9.3 10-6 1.6 10-5 131I 9.5 10-9 9.5 10-9 1.4 10-5 5.4 10-5 134Cs 6.1 10-9 6.1 10-9 8.8 10-6 3.5 10-5 136Cs 7.9 10-9 7.9 10-9 1.1 10-5 4.5 10-5 137Cs 2.0 10-9 2.0 10-9 2.9 10-6 1.2 10-5 140Ba 8.8 10-9 8.8 10-9 8.8 10-5 1.3 10-4 140La 8.1 10-9 8.1 10-9 8.1 10-5 1.2 10-4 144Ce 1.9 10-10 1.9 10-10 1.9 10-6 2.7 10-6 169Yb 1.3 10-9 1.3 10-9 7.3 10-6 1.3 10-5 192Ir 3.2 10-9 3.2 10-9 1.9 10-5 3.2 10-5 226Ra 5.2 10-9 5.2 10-9 7.4 10-6 2.9 10-5 235U 6.8 10-10 6.8 10-10 6.8 10-6 9.7 10-6 238Pu 1.2 10-12 1.2 10-12 1.2 10-8 1.8 10-8 239Pu 6.9 10-13 6.9 10-13 6.9 10-9 9.8 10-9 241Am 1.1 10-10 1.1 10-10 1.1 10-6 1.6 10-6
Bold indicates dominant exposure pathway
a) Assumes a 100 Ml throughput of water
b) Assumes that 70 kg of sludge is produced per Ml throughput.
c) External beta dose factor for other radionuclides will be very small and can be ignored. Skin dose factor for 90Sr (and its daughter, 90Y) is 5.1 10-12 mSv h-1 / Bq kg-1.
d) Minimum and maximum values take account of the uncertainty associated with the removal of radioactivity at flocculation / clarification stage of treatment.

ASSESSING DOSES TO OPERATIVES WORKING IN DRINKING WATER TREATMENT WORKS
57
Table 15: Default dose factors for generic task 'filter bed maintenance' Dose factors per unit activity concentration in untreated input water, mSv h-1 / Bq l-1 in watera,b
Dose factors per unit activity concentration in media giving rise to the exposure, mSv h-1 / Bq kg-1 in filter media RGF filtration RGF and SSF filtration
Radionuclide
External gamma
External betac
Inhalation Total Minimum valued
Maximum valued
Minimum valued
Maximum valued
60Co 5.7 10-7 1.2 10-10 5.7 10-7 2.4 10-6 1.9 10-5 2.1 10-8 4.3 10-8 75Se 6.3 10-8 1.2 10-11 6.3 10-8 2.6 10-7 2.1 10-6 2.4 10-9 4.7 10-9 89Sr 1.8 10-11 7.3 10-11 9.1 10-11 7.6 10-10 4.6 10-9 6.9 10-12 1.0 10-11 90Sr 1.7 10-15 1.1 10-12 4.3 10-10 4.3 10-10 3.6 10-9 2.2 10-8 3.2 10-11 4.9 10-11 95Zr 1.5 10-7 5.8 10-11 1.5 10-7 0.0 10 0 2.6 10-6 0.0 10 0 5.8 10-9 95Nb 1.6 10-7 1.8 10-11 1.6 10-7 0.0 10 0 2.7 10-6 0.0 10 0 6.0 10-9 99Mo 4.7 10-8 1.1 10-11 4.7 10-8 7.8 10-7 2.7 10-6 1.2 10-8 2.4 10-8 103Ru 9.2 10-8 2.9 10-11 9.2 10-8 3.8 10-7 3.1 10-6 3.5 10-9 6.9 10-9 106Ru 4.2 10-8 3.4 10-10 4.2 10-8 1.7 10-7 1.4 10-6 1.6 10-9 3.1 10-9 132Te 3.4 10-8 2.4 10-11 3.4 10-8 1.4 10-7 1.1 10-6 1.3 10-9 2.5 10-9 131I 7.1 10-8 8.9 10-11 7.2 10-8 6.0 10-7 3.6 10-6 5.4 10-9 8.1 10-9 134Cs 3.2 10-7 7.9 10-11 3.2 10-7 2.7 10-6 1.6 10-5 2.4 10-8 3.6 10-8 136Cs 4.6 10-7 1.4 10-11 4.6 10-7 3.8 10-6 2.3 10-5 3.4 10-8 5.1 10-8 137Cs 1.2 10-7 5.5 10-11 1.2 10-7 1.0 10-6 6.1 10-6 9.2 10-9 1.4 10-8 140Ba 5.6 10-7 7.4 10-11 5.6 10-7 0.0 10 0 1.6 10-5 0.0 10 0 1.5 10-7 140La 5.2 10-7 1.3 10-11 5.2 10-7 0.0 10 0 1.5 10-5 0.0 10 0 1.4 10-7 144Ce 9.4 10-9 4.3 10-10 9.8 10-9 0.0 10 0 4.1 10-7 0.0 10 0 6.4 10-9 169Yb 3.4 10-8 3.0 10-11 3.4 10-8 5.6 10-7 2.0 10-6 8.8 10-9 1.8 10-8 192Ir 1.5 10-7 6.2 10-11 1.5 10-7 6.4 10-7 5.1 10-6 5.7 10-9 1.1 10-8 226Ra 3.4 10-7 4.2 10-8 3.8 10-7 1.3 10-5 3.3 10-5 2.0 10-7 3.0 10-7 235U 2.2 10-8 3.7 10-8 5.9 10-8 0.0 10 0 2.5 10-7 0.0 0.0 10 0 238Pu 3.5 10-12 5.5 10-7 5.5 10-7 0.0 9.2 10-6 0.0 2.1 10-8 239Pu 7.5 10-12 6.0 10-7 6.0 10-7 0.0 1.0 10-5 0.0 2.3 10-8 241Am 1.3 10-9 5.0 10-7 5.1 10-7 0.0 8.4 10-6 0.0 1.9 10-11
Bold indicates dominant exposure pathway
a) Assumes a 100 Ml throughput of water
b) A total mass of filter media has been assumed per Ml throughput. For rapid gravity filters (RGF) this is assumed to be 7200 kg; for slow sand filters (SSF) this is assumed to be 320,000 kg.
c) External beta dose factor for other radionuclides will be very small and can be ignored. Skin dose factor for 90Sr (and its daughter, 90Y) is 1.1 10-10 mSv h-1 / Bq kg-1.
d) Minimum and maximum values take account of the uncertainty associated with the removal of radioactivity at flocculation / clarification and filtration stages of treatment.

HANDBOOK FOR ASSESSING THE IMPACT OF A RADIOLOGICAL INCIDENT ON LEVELS OF RADIOACTIVITY IN DRINKING WATER AND RISKS TO OPERATIVES AT WATER TREATMENT WORKS: SUPPORTING SCIENTIFIC REPORT
58
Table 16: Default dose factors for generic task 'cleaning storage tanks Dose factors per unit activity concentration in media giving rise to the exposure, mSv h-1 / Bq kg-1 in sludge
Dose factors per unit activity concentration in untreated input water, mSv h-1 / Bq l-1 in watera,b
Radionuclide
External gamma
External betac
Inhalation Total Minimum valued Maximum valued
60Co 2.0 10-7 1.2 10-10 2.0 10-7 1.2 10-3 2.0 10-3 75Se 3.9 10-8 1.2 10-11 3.9 10-8 2.2 10-4 3.9 10-4 89Sr 7.0 10-12 7.3 10-11 8.0 10-11 1.0 10-8 4.0 10-8 90Sr 6.5 10-15 2.0 10-14 4.3 10-10 4.3 10-10 9.3 10-12 3.7 10-11 95Zr 6.2 10-8 5.8 10-11 6.2 10-8 6.2 10-4 8.9 10-4 95Nb 6.5 10-8 1.8 10-11 6.5 10-8 6.5 10-4 9.2 10-4 99Mo 2.7 10-8 1.1 10-11 2.7 10-8 1.5 10-4 2.7 10-4 103Ru 4.1 10-8 2.9 10-11 4.1 10-8 2.4 10-4 4.1 10-4 106Ru 1.8 10-8 3.4 10-10 1.8 10-8 1.0 10-4 1.8 10-4 131I 2.2 10-8 2.4 10-11 2.2 10-8 1.3 10-4 2.2 10-4 132Te 3.5 10-8 8.9 10-11 3.5 10-8 5.0 10-5 2.0 10-4 134Cs 1.3 10-7 7.9 10-11 1.3 10-7 1.9 10-4 7.5 10-4 136Cs 1.8 10-7 1.4 10-11 1.8 10-7 2.6 10-4 1.0 10-3 137Cs 5.1 10-8 5.5 10-11 5.1 10-8 7.3 10-5 2.9 10-4 140Ba 1.9 10-7 7.4 10-11 1.9 10-7 1.9 10-3 2.7 10-3 140La 1.9 10-7 1.3 10-11 1.9 10-7 1.9 10-3 2.7 10-3 144Ce 4.7 10-9 4.3 10-10 5.2 10-9 4.7 10-5 6.7 10-5 169Yb 3.5 10-8 3.0 10-11 3.5 10-8 2.0 10-4 3.5 10-4 192Ir 7.5 10-8 6.2 10-11 7.5 10-8 4.3 10-4 7.5 10-4 226Ra 1.2 10-7 4.2 10-8 1.6 10-7 1.7 10-4 7.0 10-4 235U 1.6 10-8 3.7 10-8 5.3 10-8 1.6 10-4 2.3 10-4 238Pu 1.1 10-11 5.5 10-7 5.5 10-7 1.1 10-7 1.6 10-7 239Pu 8.9 10-12 6.0 10-7 6.0 10-7 8.9 10-8 1.3 10-7 241Am 2.7 10-9 5.0 10-7 5.1 10-7 2.7 10-5 3.9 10-8
Bold indicates dominant exposure pathway
a) Assumes a 100 Ml throughput of water
b) Assumes that 70 kg of sludge is produced per Ml throughput.
c) External beta dose factor for other radionuclides will be very small and can be ignored. Skin dose factor for 90Sr (and its daughter, 90Y) is 2.0 10-12 mSv h-1 / Bq kg-1.
d) Minimum and maximum values take account of the uncertainty associated with the removal of radioactivity at flocculation / clarification stage of treatment.

ASSESSING DOSES TO OPERATIVES WORKING IN DRINKING WATER TREATMENT WORKS
59
Table 17: Default dose factors for generic task 'transporting sludge' Dose factors per unit activity concentration in media giving rise to the exposure, mSv h-1 / Bq kg-1 in sludge
Dose factors per unit activity concentration in untreated input water, mSv h-1 / Bq l-1 in watera,b
Radionuclide
External gamma Totalc Minimum valued Maximum valued
60Co 1.3 10-7 1.3 10-7 7.7 10-4 1.3 10-3 75Se 1.3 10-8 1.3 10-8 7.3 10-5 1.3 10-4 89Sr 4.9 10-12 4.9 10-12 6.9 10-9 2.8 10-8 90Sr 3.6 10-39 3.6 10-39 5.1 10-36 2.0 10-35 95Zr 8.0 10-8 8.0 10-8 8.0 10-4 1.1 10-3 95Nb 4.0 10-8 4.0 10-8 4.0 10-4 5.7 10-4 99Mo 7.4 10-9 7.4 10-9 4.2 10-5 7.4 10-5 103Ru 2.1 10-8 2.1 10-8 1.2 10-4 2.1 10-4 106Ru 9.3 10-9 9.3 10-9 5.3 10-5 9.3 10-5 132Te 1.7 10-8 1.7 10-8 9.7 10-5 1.7 10-4 131I 1.2 10-7 1.2 10-7 1.7 10-4 6.6 10-4 134Cs 7.6 10-8 7.6 10-8 1.1 10-4 4.4 10-4 136Cs 1.0 10-7 1.0 10-7 1.4 10-4 5.7 10-4 137Cs 2.4 10-8 2.4 10-8 3.4 10-5 1.4 10-4 140Ba 1.2 10-7 1.2 10-7 1.2 10-3 1.8 10-3 140La 1.2 10-7 1.2 10-7 1.2 10-3 1.7 10-3 144Ce 1.8 10-9 1.8 10-9 1.8 10-5 2.6 10-5 169Yb 4.7 10-9 4.7 10-9 2.7 10-5 4.7 10-5 192Ir 3.2 10-8 3.2 10-8 1.8 10-4 3.2 10-4 226Ra 7.9 10-8 7.9 10-8 1.1 10-4 4.5 10-4 235U 3.7 10-9 3.7 10-9 3.7 10-5 5.2 10-5 238Pu 1.1 10-13 1.1 10-13 1.1 10-9 1.6 10-9 239Pu 1.4 10-12 1.4 10-12 1.4 10-8 2.0 10-8 241Am 1.6 10-11 1.6 10-11 1.6 10-10 2.2 10-7
Bold indicates dominant exposure pathway
a) Assumes a 100 Ml throughput of water
b) Assumes that 70 kg of sludge is produced per Ml throughput.
c) The only exposure pathway considered for this generic task is external gamma dose from being in close proximity to contaminated sludge. This means that the sum of the dose factors (total) is the same as that from external gamma exposure.
d) Minimum and maximum values take account of the uncertainty associated with the removal of radioactivity at flocculation / clarification and filtration stages of treatment.

HANDBOOK FOR ASSESSING THE IMPACT OF A RADIOLOGICAL INCIDENT ON LEVELS OF RADIOACTIVITY IN DRINKING WATER AND RISKS TO OPERATIVES AT WATER TREATMENT WORKS: SUPPORTING SCIENTIFIC REPORT
60
Table 18: Default dose factors for generic task 'working with processed sludge' Dose factors per unit activity concentration in media giving rise to the exposure, mSv h-1 / Bq kg-1 in sludge
Dose factors per unit activity concentration in untreated input water, mSv h-1 / Bq l-1 in watera,b
Radionuclide
External gamma
External betac
Inhalation Ingestion Total Minimum valued
Maximum valued
60Co 5.5 10-7 1.2 10-10 1.7 10-11 5.5 10-7 3.1 10-3 5.5 10-3 75Se 6.1 10-8 1.2 10-11 1.3 10-11 6.1 10-8 3.5 10-4 6.1 10-4 89Sr 1.7 10-11 7.3 10-11 1.3 10-11 1.0 10-10 1.5 10-7 5.9 10-7 90Sr 2.1 10-15 1.1 10-12 4.3 10-10 1.4 10-10 5.7 10-10 8.2 10-7 3.3 10-6 95Zr 1.5 10-7 5.8 10-11 4.8 10-12 1.5 10-7 1.5 10-3 2.1 10-3 95Nb 1.6 10-7 1.8 10-11 2.9 10-12 1.6 10-7 1.6 10-3 2.2 10-3 99Mo 4.5 10-8 1.1 10-11 3.0 10-12 4.5 10-8 2.6 10-4 4.5 10-4 103Ru 8.9 10-8 2.9 10-11 3.7 10-12 8.9 10-8 5.1 10-4 8.9 10-4 106Ru 4.0 10-8 3.4 10-10 3.5 10-11 4.0 10-8 2.3 10-4 4.0 10-4 132Te 3.3 10-8 2.4 10-11 1.9 10-11 3.3 10-8 1.9 10-4 3.3 10-4 131I 6.9 10-8 8.9 10-11 1.1 10-10 6.9 10-8 9.9 10-5 4.0 10-4 134Cs 3.1 10-7 7.9 10-11 9.5 10-11 3.1 10-7 4.4 10-4 1.8 10-3 136Cs 4.9 10-7 1.4 10-11 1.5 10-11 4.9 10-7 7.0 10-4 2.8 10-3 137Cs 1.2 10-7 5.5 10-11 6.5 10-11 1.2 10-7 1.7 10-4 6.8 10-4 140Ba 5.4 10-7 7.4 10-11 2.3 10-11 5.4 10-7 5.4 10-3 7.7 10-3 140La 5.0 10-7 1.3 10-11 1.0 10-11 5.0 10-7 5.0 10-3 7.2 10-3 144Ce 9.1 10-9 4.3 10-10 2.6 10-11 9.6 10-9 9.6 10-5 1.4 10-4 169Yb 3.3 10-8 3.0 10-11 3.6 10-12 3.3 10-8 1.9 10-4 3.3 10-4 192Ir 1.5 10-7 6.2 10-11 7.0 10-12 1.5 10-7 8.4 10-4 1.5 10-3 226Ra 3.3 10-7 4.2 10-8 1.4 10-9 3.7 10-7 5.3 10-4 2.1 10-3 235U 2.1 10-8 3.7 10-8 2.4 10-10 5.9 10-8 5.9 10-4 8.4 10-4 238Pu 4.1 10-12 5.5 10-7 1.2 10-9 5.5 10-7 5.5 10-3 7.9 10-3 239Pu 7.6 10-12 6.0 10-7 1.3 10-9 6.0 10-7 6.0 10-3 8.6 10-3 241Am 1.3 10-9 5.0 10-7 1.0 10-9 5.1 10-7 5.1 10-3 7.2 10-3
Bold indicates dominant exposure pathway
a) Assumes a 100 Ml throughput of water
b) Assumes that 70 kg of sludge is produced per Ml throughput.
c) External beta dose factors for other radionuclides will be very small and can be ignored. Skin dose factor for 90Sr (and its daughter, 90Y) is 1.1 10-10 mSv h-1 / Bq kg-1.
d) Minimum and maximum values take account of the uncertainty associated with the removal of radioactivity at flocculation / clarification and filtration stage of treatment.

ASSESSING DOSES TO OPERATIVES WORKING IN DRINKING WATER TREATMENT WORKS
61
Table 19: Default dose factors for generic task 'operating sludge press' Dose factors per unit activity concentration in media giving rise to the exposure, mSv h-1 / Bq kg-1 in sludge
Dose factors per unit activity concentration in untreated input water, mSv h-1 / Bq l-1 in watera,b
Radionuclide
External gamma
External betac
Inhalation Ingestion Total Minimum valued
Maximum valued
60Co 4.0 10-7 1.2 10-10 1.7 10-11 4.0 10-7 2.3 10-3 4.0 10-3 75Se 6.5 10-8 1.2 10-11 1.3 10-11 6.5 10-8 3.7 10-4 6.5 10-4 89Sr 1.5 10-11 7.3 10-11 1.3 10-11 1.0 10-10 1.4 10-7 5.8 10-7 90Sr 1.4 10-18 1.3 10-14 4.3 10-10 1.4 10-10 5.7 10-10 8.2 10-7 3.3 10-6 95Zr 2.6 10-7 5.8 10-11 4.8 10-12 2.6 10-7 2.6 10-3 3.7 10-3 95Nb 1.3 10-7 1.8 10-11 2.9 10-12 1.3 10-7 1.3 10-3 1.8 10-3 99Mo 4.5 10-8 1.1 10-11 3.0 10-12 4.5 10-8 2.6 10-4 4.5 10-4 103Ru 7.6 10-8 2.9 10-11 3.7 10-12 7.6 10-8 4.3 10-4 7.6 10-4 106Ru 3.2 10-8 3.4 10-10 3.5 10-11 3.2 10-8 1.8 10-4 3.2 10-4 132Te 6.5 10-8 2.4 10-11 1.9 10-11 6.5 10-8 3.7 10-4 6.5 10-4 131I 3.9 10-7 8.9 10-11 1.1 10-10 3.9 10-7 5.5 10-4 2.2 10-3 134Cs 2.5 10-7 7.9 10-11 9.5 10-11 2.5 10-7 3.6 10-4 1.4 10-3 136Cs 3.3 10-7 1.4 10-11 1.5 10-11 3.3 10-7 4.7 10-4 1.9 10-3 137Cs 8.2 10-8 5.5 10-11 6.5 10-11 8.2 10-8 1.2 10-4 4.7 10-4 140Ba 3.8 10-7 7.4 10-11 2.3 10-11 3.8 10-7 3.8 10-3 5.5 10-3 140La 3.6 10-7 1.3 10-11 1.0 10-11 3.6 10-7 3.6 10-3 5.1 10-3 144Ce 7.3 10-9 4.3 10-10 2.6 10-11 7.8 10-9 7.8 10-5 1.1 10-4 169Yb 3.7 10-8 3.0 10-11 3.6 10-12 3.7 10-8 2.1 10-4 3.7 10-4 192Ir 1.3 10-7 6.2 10-11 7.0 10-12 1.3 10-7 7.4 10-4 1.3 10-3 226Ra 2.4 10-7 4.2 10-8 1.4 10-9 2.8 10-7 4.0 10-4 1.6 10-3 235U 2.5 10-8 3.7 10-8 2.4 10-10 6.2 10-8 6.2 10-4 8.9 10-4 238Pu 1.7 10-12 5.5 10-7 1.2 10-9 5.5 10-7 5.5 10-3 7.9 10-3 239Pu 8.2 10-12 6.0 10-7 1.3 10-9 6.0 10-7 6.0 10-3 8.6 10-3 241Am 1.8 10-9 5.0 10-7 1.0 10-9 5.1 10-7 5.1 10-3 7.2 10-3
Bold indicates dominant exposure pathway
a) Assumes a 100 Ml throughput of water
b) Assumes that 70 kg of sludge is produced per Ml throughput.
c) External beta dose factors for other radionuclides will be very small and can be ignored. Skin dose factor for 90Sr (and its daughter, 90Y) is 1.3 10-12 mSv h-1 / Bq kg-1.
d) Minimum and maximum values take account of the uncertainty associated with the removal of radioactivity at flocculation / clarification and filtration stage of treatment.

HANDBOOK FOR ASSESSING THE IMPACT OF A RADIOLOGICAL INCIDENT ON LEVELS OF RADIOACTIVITY IN DRINKING WATER AND RISKS TO OPERATIVES AT WATER TREATMENT WORKS: SUPPORTING SCIENTIFIC REPORT
62
Table 20: Default dose factors for generic task 'membrane / reverse osmosis / ion exchange unit maintenance' Dose factors per unit activity concentration in media giving rise to the exposure, mSv h-1 / Bq l-1 in water
Dose factors per unit activity concentration in untreated input water, mSv h-1 / Bq l-1 in water
Membrane maintenance Reverse osmosis /ion exchange maintenance
Radionuclide
External gamma
External betaa
Total External gamma
External betaa
Total
Membrane maintenance
Reverse osmosis /ion exchange maintenance
60Co 3.5 10-8 3.5 10-8 1.9 10-7 1.9 10-7 3.5 10-8 1.9 10-7 75Se 8.7 10-9 8.7 10-9 4.0 10-8 4.0 10-8 8.7 10-9 4.0 10-8 89Sr 1.4 10-12 1.4 10-12 7.2 10-12 7.2 10-12 1.4 10-12 7.2 10-12 90Sr 3.0 10-15 3.5 10-16 3.4 10-15 7.7 10-15 3.5 10-16 8.0 10-15 3.0 10-15 7.7 10-15 95Zr 2.5 10-8 2.5 10-8 1.3 10-7 1.3 10-7 2.5 10-8 1.3 10-7 95Nb 1.2 10-8 1.2 10-8 6.3 10-8 6.3 10-8 1.2 10-8 6.3 10-8 99Mo 5.9 10-9 5.9 10-9 2.7 10-8 2.7 10-8 5.9 10-9 2.7 10-8 103Ru 8.1 10-9 8.1 10-9 3.9 10-8 3.9 10-8 8.1 10-9 3.9 10-8 106Ru 3.3 10-9 3.3 10-9 1.6 10-8 1.6 10-8 3.3 10-9 1.6 10-8 132Te 7.3 10-9 7.3 10-9 3.5 10-8 3.5 10-8 7.3 10-9 3.5 10-8 131I 3.9 10-8 3.9 10-8 2.0 10-7 2.0 10-7 3.9 10-8 2.0 10-7 134Cs 2.5 10-8 2.5 10-8 1.2 10-7 1.2 10-7 2.5 10-8 1.2 10-7 136Cs 3.2 10-8 3.2 10-8 1.6 10-7 1.6 10-7 3.2 10-8 1.6 10-7 137Cs 8.4 10-9 8.4 10-9 4.2 10-8 4.2 10-8 8.4 10-9 4.2 10-8 140Ba 3.5 10-8 3.5 10-8 1.9 10-7 1.9 10-7 3.5 10-8 1.9 10-7 140La 3.2 10-8 3.2 10-8 1.7 10-7 1.7 10-7 3.2 10-8 1.7 10-7 144Ce 9.5 10-10 9.5 10-10 4.5 10-9 4.5 10-9 9.5 10-10 4.5 10-9 169Yb 7.9 10-9 7.9 10-9 3.2 10-8 3.2 10-8 7.9 10-9 3.2 10-8 192Ir 1.5 10-8 1.5 10-8 7.1 10-8 7.1 10-8 1.5 10-8 7.1 10-8 226Ra 2.1 10-8 2.1 10-8 1.1 10-7 1.1 10-7 2.1 10-8 1.1 10-7 235U 4.0 10-9 4.0 10-9 1.8 10-8 1.8 10-8 4.0 10-9 1.8 10-8 238Pu 2.7 10-12 2.7 10-12 7.7 10-12 7.7 10-12 2.7 10-12 7.7 10-12 239Pu 2.3 10-12 2.3 10-12 8.3 10-12 8.3 10-12 2.3 10-12 8.3 10-12 241Am 7.1 10-10 7.1 10-10 2.6 10-9 2.6 10-9 7.1 10-10 2.6 10-9
Bold indicates dominant exposure pathway
a) External beta dose factors for other radionuclides will be very small and can be ignored. Skin dose factor for 90Sr (and its daughter, 90Y) is 3.5 10-14 mSv h-1 / Bq l-1.
5.4 Importance of using site specific data
There are two sets of parameters that can have a significant impact on the estimation of doses to operatives working in drinking water treatment works. The first are those that define the main characteristics of the works in terms of water throughput, the amount of sludge produced and, to a lesser extent, the size and number of the filter beds used. The second set is those parameters that characterise the tasks that are undertaken by operatives and the time spent undertaking these tasks.

ASSESSING DOSES TO OPERATIVES WORKING IN DRINKING WATER TREATMENT WORKS
63
The dose factors given in Table 12 - Table 20 have been calculated assuming generic characteristics for the treatment works. These are:
• a throughput of water of 100 Ml;
• the production of 70 kg of de-watered sludge per Ml of water throughput;
• masses of filter media of 7200 kg per Ml throughput and 320,000 kg per Ml throughput for rapid gravity and slow sand filters, respectively.
For estimating doses from tasks involving working with sludge, it is important to take account of how much sludge is produced per Ml of water throughput. This is because, for a given throughput of contaminated water with a given activity concentrations, the resultant concentration in sludge (in Bq kg-1) will increase as the amount of sludge produced decreases. As doses from tasks involving working with sludge tend to give rise to the highest doses, it is important that adjustment is made for this parameter, particularly if the amount of de-watered sludge produced is significantly lower that the default value. If the amount of de-watered sludge produced is variable, it is recommended that a value to the lower end of the range of values is used. This will ensure that it is unlikely that the doses from tasks involving working with the produced sludge will be underestimated. The values used for the overall throughput of water over a given time and the mass of filter media influence the activity concentration in filter media that operatives could be exposed to. As the mass of filter media is very large, activity concentrations in Bq kg-1 are small and much smaller than those that could be expected in sludge. Doses to operatives from tasks involving exposure to filter media are therefore typically much lower than those to operatives working with sludge. Small adjustments in filter mass per Ml of water throughput do not, therefore, influence the estimates of doses significantly. It is important, however, to adjust for water throughput if it is significantly higher over the period of concern, for example, if doses are estimated over a week then the throughput for a week should be used (see Section 4.2.1). This is because the filter beds will accumulate radionuclides over the period that contaminated water passes through them and so the higher the throughput of water, the larger the resultant activity concentration in the filter media.
Although some default times for the time spent in a week undertaking tasks are suggested in Table 7, it is not recommended that these times are used unless no other information is available for a specific treatment works or, indeed, a particular type of works operated by a Water Company. This is because the potential doses received are directly proportional to the hours spent undertaking a task or group of tasks.
For planning purposes, if doses are estimated to the 'critical individual', ie, a notional person that undertakes all of the day-to-day tasks carried out in a week of operation of the works, then it may be appropriate to use general data that a Water Company believes is representative of the works it operates. This is because it is unlikely that any individual will undertake all of these tasks and so is unlikely to receive doses as high as the value derived for the 'critical individual'.

HANDBOOK FOR ASSESSING THE IMPACT OF A RADIOLOGICAL INCIDENT ON LEVELS OF RADIOACTIVITY IN DRINKING WATER AND RISKS TO OPERATIVES AT WATER TREATMENT WORKS: SUPPORTING SCIENTIFIC REPORT
64
5.5 Discussion of dose factor tables
A number of general points can be drawn from the tables of dose factors given in Section 5.3. These are discussed below.
5.5.1 Potentially important tasks The dose factor tables in Section 5.3 show that, in general, for all tasks involving working close to contaminated materials within a treatment works, either sludge or filter media, the doses per unit activity concentration in the material are fairly similar. The differences tend to be due to the assumptions made on the proximity of operatives to the contamination and whether or not they could inhale contaminated dust or inadvertently ingest activity. However, radioactive contamination will not uniformly partition between filter media and sludge. For the majority of radionuclides, flocculation and clarification and filtration remove a substantial fraction of the radionuclides in the raw input water and the activity is concentrated in the waste sludge produced. Although radioactivity can accumulate in sand filters, particularly if contamination enters the filters over a long period of time, the radioactivity is diluted over a very large mass of filter media and so activity concentrations are very much lower than those that could be expected in waste sludge. Table 6 shows that for raw input water entering the works at 1 Bq l-1, activity concentrations in sludge in the range of 1000 - 10,000 Bq kg-1 are estimated. In contrast, activity concentrations in sand filter media (for a throughput of 100 Ml of water) are estimated having a maximum of a few tens of Bq kg-1 for rapid gravity filtration following flocculation and clarification and 100 times lower if slow sand filtration is also used. Therefore, for a given input activity concentration in the raw input water entering the works, the tasks that give rise to the highest doses are those involving working with sludge, predominantly from operating sludge presses and working with processed sludge. If contaminated water continues to flow through rapid gravity filters at a constant level over a significant period of time (about 6 months) and no replenishment of filter media takes place, activity concentrations in the filter beds will approach those in waste sludge. In this case, for each hour worked, doses to operatives working close to these filter beds will be similar to those to operatives working with sludge. This scenario is, however, very unlikely. For operatives working close to slow sand filters, doses will always be significantly lower due to the dilution of radioactivity in such a large mass of filter media.
There are other tasks that may give rise to high exposures for certain radionuclides, notably the inspection of the back-washing of rapid gravity filters. This process can give rise to a significant level of spray that will contain water and some fine sand particles. Operatives could inhale this spray. Table 13 shows that, for a unit activity concentration in the filter media, doses for a one-hour exposure are most significant for isotopes of plutonium and americium. For other radionuclides, the doses are at least an order of magnitude lower, a consequence of the higher contribution to the overall dose from inhalation for plutonium and americium. However, when compared with the doses from other tasks such as the handling of contaminated sludge, those from inspection of back-washing are still likely to be very low. This is illustrated in the worked scenario B2 in the Handbook. It should also be recognised that the assumptions made in estimating doses for this task are very conservative (see Section 5.2.4).

ASSESSING DOSES TO OPERATIVES WORKING IN DRINKING WATER TREATMENT WORKS
65
5.5.2 Potentially important exposure pathways The exposure pathways considered for each generic task are listed in Table 9. The importance of these exposure pathway in contributing to the overall dose to an operative undertaking that task depends on the radionuclide being considered, as shown in Table 21. This is also illustrated in Table 12 – Table 20 where the dominant exposure pathway is marked in bold for each radionuclide for each generic task.
For gamma-ray emitting radionuclides (see Table 21), the dominant exposure pathway is external exposure from contaminated material within the treatment works for all the tasks considered. In contrast, for alpha-emitting radionuclides, the dominant exposure pathway is from material being taken into the body via inhalation or inadvertent ingestion.
For tasks where operatives are not in direct contact with sludge or filter media, operatives will only receive external exposure from being in close proximity to contaminated water or waste floc. This is the case, for example, for general maintenance and inspection of the works.
For tasks involving close working with sludge or filter media, exposures can be received from inadvertently taking material into the body via inhalation or ingestion as well as from being in close proximity to them. Doses arising from contaminated sludge or filter media being on the skin are not significant relative to the other exposure pathways (see Section 5.2.2). These doses can in any case be avoided if the normal practice of wearing gloves is followed. Inhalation doses could arise if the sludge or filter media being handled is dry. This is mainly of concern for alpha emitting radionuclides (isotopes of U, Pu, Am) and isotopes of strontium, for which inhalation of dust resuspended into to air is the dominant exposure pathway. If the sludge or filter media is wet, inhalation doses will not be significant and the overall doses will be dominated by external exposure for all radionuclides, except for isotopes of plutonium where inadvertent ingestion of sludge is the dominant exposure pathway.
For the dose assessment methodology provided in the Handbook, it has been assumed that the sludge and filter media being handled are dry. For gamma ray emitting radionuclides, this assumption does not influence the overall doses as they are dominated by external exposure. This can be illustrated using the dose factors for the generic task 'operating sludge press' (Table 19) where, for the radionuclide 137Cs, the dose from external exposure is 3 orders of magnitude higher than that from inhalation or inadvertent ingestion. However, for alpha-emitting radionuclides, such as isotopes of plutonium and also isotopes of strontium (see Table 21), this assumption is likely to lead to a considerable overestimate of the overall doses if the sludge being handled is wet rather than dry. As the objective of the Handbook is to provide a scoping tool to assist the water industry estimate potential doses to operatives, it is prudent to assume that the sludge is dry, even if this is not the case at all works and for all tasks within a works. In this way doses will not then be underestimated. However, it is important that users of the Handbook can remove the contribution from inhalation if they are confident that the sludge being handled is wet and that resuspension of dust from the sludge into the air

HANDBOOK FOR ASSESSING THE IMPACT OF A RADIOLOGICAL INCIDENT ON LEVELS OF RADIOACTIVITY IN DRINKING WATER AND RISKS TO OPERATIVES AT WATER TREATMENT WORKS: SUPPORTING SCIENTIFIC REPORT
66
Table 21: Important exposure pathways for radionuclides included in the Handbook Internal b External c
Radionuclide a Alpha Beta Gamma
60Co Cobalt-60 - x 75Se Selenium-75 - - 89Sr Strontium-89 - - 90Sr Strontium-90 - - 95Zr Zirconium-95 - x 95Nb Niobium-95 - x 99Mo Molybdenum-99 - S 103Ru Ruthenium-103 - x 106Ru Ruthenium-106 - S 132Te Iodine-131 - x 131I Iodine-131 - x 134Cs Caesium-134 - x 136Cs Caesium-136 - x 137Cs Caesium-137 - x 140Ba Barium-140 - x 140La Lanthanum-140 - x 144Ce Cerium-144 - S 169Yb Ytterbium-169 - x 192Ir Iridium-192 - x 226Ra Radium-226 x 235U Uranium-235 x g 238Pu Plutonium-238 - g 239Pu Plutonium-239 - g 241Am Americium-241 - g
Key: dominant exposure pathway
S external dose-rate to skin may need to be considered
x minor contribution to exposure. Can be ignored
g minor contribution to exposure from gamma-ray emissions. Can be ignored compared with internal pathway. However, note that if resuspension is not present, a small external dose will be received.
- no exposure from this pathway
a) All radioactive daughters are taken into account
b) Inhalation doses from resuspension
c) Beta and gamma-ray emitters may also give rise to small resuspension doses
does not occur. This can be done using the breakdown of doses by exposure pathway in Table 12 - Table 20. For example, for the generic task 'working with processed sludge' in Table 18, for 239PU the dose from inhalation dominates the overall dose factor (5.5 10-7 mSv h-1 per Bq kg-1 in sludge). If the dose from inhalation is removed, the

ASSESSING DOSES TO OPERATIVES WORKING IN DRINKING WATER TREATMENT WORKS
67
overall dose factor would become 1.2 10-9 mSv h-1 per Bq kg-1 in sludge and the dose would be dominated by inadvertent ingestion.
If it is anticipated that Inhalation doses could be received from working with dry sludge or filter media, doses from inhalation could be minimised by the use of respirators or face masks, if required. Further information can be found on the likely effectiveness of this type of protection and factors that can influence the effectiveness in Section 5.5.2.1 below.
5.5.2.1 Protection of workers If it is suspected that operatives may be subject to higher doses due to the nature of their work, then it is important that the risks of undertaking this work are assessed and appropriate measures taken to reduce exposures if necessary. The Water Company should seek specialist radiation protection advice in this event. The information given below can be used for background information on the types of personal protection that is available and its use.
The use of personal protection should not be seen as the first step in keeping exposures to the workforce as low as possible. In general, the order of the stages of protection to be considered is:
a engineering controls; b administrative controls; c personal protection. Wherever reasonably practicable engineering and design features and administrative controls should be used to restrict the levels of exposure. These may include shielding, warning signals, containment, ventilation systems, time restrictions, etc. However, it is recognised that engineering controls may not be practicable in many cases in the event of a radiological incident.
If necessary, those working with ionising radiations should be provided with and use personal protective equipment (PPE) appropriate to the type of work with ionising radiations being undertaken. The potential exposure pathways that operatives could be exposed to are discussed above and in Section 5.1.
The types of PPE that could be used are listed below in Table 22.
Table 22: Types of PPE that could be used and the protection they offer Type of PPE Provides protection against: Gloves Skin contact doses (beta), external skin beta doses to hands
Overalls External skin beta doses
Respiratory protective equipment (RPE)
Inhalation of resuspended material and ‘hot particles’, ingestion of ‘hot particles’ and other contamination
Use of respiratory protective equipment (RPE) RPE protects against the breathing in of contaminated material, ie, in this situation, to reduce doses from inhalation of resuspended material. Some background information is given here on the range of RPE available, its likely effectiveness, the factors that will

HANDBOOK FOR ASSESSING THE IMPACT OF A RADIOLOGICAL INCIDENT ON LEVELS OF RADIOACTIVITY IN DRINKING WATER AND RISKS TO OPERATIVES AT WATER TREATMENT WORKS: SUPPORTING SCIENTIFIC REPORT
68
influence the effectiveness of the protection offered and the impact that use of RPE may have on the rate at which people can work [HSE, 1990].
There are many types of RPE available and care is needed to choose the right type for a particular situation. Effective protection is only obtained if the RPE is in good condition and is worn properly by someone who has been trained to use it. Respiratory protective equipment includes a very wide range of devices, from simple respirators offering basic protection against low levels of dusts or gases to self-contained breathing apparatus of the type used by fire services and other emergency services where the wearer would not be able to survive without the equipment.
RPE can be divided into two major classes according to the basic principle by which protection is given to the wearer. These are as follows.
a Equipment such as face masks with filters and powered respirators that take in contaminated air from the environment and filter or clean it before it is inhaled. All such devices are called respirators.
b Equipment such as air-fed hoods and self-contained breathing apparatus that deliver uncontaminated air from an independent source to the wearer.
It is assumed that, for drinking water treatment works operatives, the use of RPE requiring the provision of uncontaminated air for breathing via an independent source, either via hose to an air supply or via compressed air cylinder, is not appropriate. This type of equipment is not discussed further. Table 23 shows the types of respirator that could be used and provides some indicative levels of protection that could be achieved if the equipment is used effectively. There are a number of factors that will influence the choice of RPE used and the length of time that the equipment can be used by the wearer. The main factors that can influence the use of RPE are summarised in Table 24.
The use of RPE may also affect the rate at which people can work and this would need to be taken into account. As an example, Morgan [1987], suggests that the work rate could be three times slower, ie, people achieve three times less work in an hour when RPE is worn. It should be noted, however, that this factor is probably conservative for the situation being considered in this study as it is based on the difference between working in radioactive areas compared with non-radioactive areas. This factor therefore takes into account the need to pass through health checks, travelling to the point of work, time to take meals outside of the active area and a reduction in working speed owing to working with RPE.

ASSESSING DOSES TO OPERATIVES WORKING IN DRINKING WATER TREATMENT WORKS
69
Table 23: Types of respirator and indicative levels of effectivenessa
Respirator type Type of protection Indicative level of protection (reduction in exposure from inhalation)b,c
Disposable filtering face pieces <5 – 50
Half-masks and filters <5 – 50
Simple filtering respirator
Full facemasks and filters <5 – 1000
Half-masks No data given. Full face masks usually preferred
Full facemasks 20 – 2000
Powered respirators
Hoods and helmets 10 – 500
a) HSE [1990]
b) Range of protection against dust and other particles. Protection depends on type of filter used.
c) Protection = dose without use of RPE / dose with use of RPE.
Table 24: Factors influencing effectiveness of respirators Factor Effects Comments and recommendations Fit of equipment Face shape and size, facial hair and
spectacles and contact lenses can affect the fit of the respirator and will determine which type of respirator is most appropriate, eg, full face masks vs half-masks.
Have available a selection of different models of RPE.
Length of time RPE is to be worn
Facemasks become very uncomfortable when worn properly for long periods.
Filters will only be efficient until they become saturated (either with moisture or contaminated particles).
For wear times > 1 hour, increased face seal leakage becomes more likely. Hoods, helmets etc are preferred.
Physical work rate Breathing rate increases with work rate. High work rates produce increased perspiration.
Simple filtering respirators impose an additional physiological load. For high work rates, powered respirators are recommended as long as they can provide sufficient air flow.
Perspiration may cause discomfort inside facemasks. If possible, RPE that doesn’t rely on a face seal should be used.
Mobility Work involving considerable movement can cause leakage at face seals.
Hoods, helmets etc are preferred where a high degree of movement is needed.
Visibility All RPE restricts vision to some extent. Reduced visibility may cause problems where close work is required.
Where visibility is important for safety, allow for close supervision and additional precautions such as 2 man working, etc.
Communication All RPE inhibits normal voice communication to some degree.
It is important to be able to communicate in emergencies. Radio communication may be needed.

HANDBOOK FOR ASSESSING THE IMPACT OF A RADIOLOGICAL INCIDENT ON LEVELS OF RADIOACTIVITY IN DRINKING WATER AND RISKS TO OPERATIVES AT WATER TREATMENT WORKS: SUPPORTING SCIENTIFIC REPORT
70
5.5.3 Sensitivity of doses to choice of removal efficiency factor If doses are estimated from activity concentrations in the material that operatives are being exposed to, the use of removal efficiency factors is not required. This is because the measured activity concentration implicitly includes any removal that from the raw input water that has taken place. The use of measured activity concentrations is therefore preferable and should provide a more realistic estimate of the potential doses to operatives. It should be noted that care has to be taken to ensure that the samples of materials collected are representative of those to which the operatives are being exposed. Further guidance on this is given in Section 5 of the Handbook [Brown et al, 2008].
Doses can be calculated on the basis of activity concentrations in the raw input water or doses for a particular task can be estimated by extrapolating from activity concentrations in one material to those in the material that the operatives are being exposed to. In such cases removal efficiency factors are needed to estimate the activity concentrations in the relevant material, eg, sludge and filter media. The choice of removal efficiency factor will influence the predicted activity concentrations in sludge and filter media and consequently the predicted doses to operatives. It is therefore helpful to explore to what extent the choice of removal efficiencies within the ranges of values given influences the estimated of potential doses that operatives could receive.
The removal efficiencies for each type of water treatment are given as robust ranges that provide a cautious estimate of the likely removal of radioactive isotopes of elements by water treatment in the event of a radiological incident (Section 3.3). These ranges have been interpreted to provide maximum and minimum activity concentrations in treated water, sludge and filter media for use in a methodology to estimate doses to operatives working within a contaminated works (see Section 4).
If filtration occurs with or without flocculation / clarification, then for most radionuclides a significant fraction of the contamination in the raw input water can be removed. This can be seen in the predicted activity concentrations in treated water in Table 4. If sludge is produced from flocculation / clarification, then again for most radionuclides a significant fraction of the total contamination entering the works will be removed (Table 3). The range between the minimum and maximum activity concentrations predicted in the sludge is typically less than a factor of 2 for most radionuclides, and the maximum range is about a factor of 4, (Table 6). The choice of removal efficiency factor from the range of values given will therefore not significantly affect the doses predicted from undertaking sludge-related tasks given all the other uncertainties in the estimating of doses. What can be of more importance is the adjustment of the generic assumptions made in the default data in the Handbook for the quantity of de-watered sludge produced per Megalitre of water throughput. As discussed in Section 5.4, this can lead to large differences in the predicted activity concentrations. It is particularly important to make this adjustment if the quantities of de-watered sludge produced are lower than the default value. In this case, if the default value is used, activity concentrations and consequently doses to operatives undertaking tasks involving the handling of sludge could be significantly underestimated.

ASSESSING DOSES TO OPERATIVES WORKING IN DRINKING WATER TREATMENT WORKS
71
If filtration occurs after flocculation / clarification, the estimated range between minimum and maximum values of activity concentrations can be up to an order of magnitude and is very dependent on the radionuclide involved. In some cases, maximum removal from the water by flocculation / clarification and filtration leads to an estimate of zero activity concentration in the filter media. An activity concentration of zero is predicted when it is assumed that 100% of the radioactivity in the raw input water has been removed by water treatment. In reality, it is very unlikely that any combination of water treatment will remove all of radioactivity in the water, although for some elements the removal could be very high. The use of 100% removal is an indication of the very high removal efficiency for use within this methodology and, as such, is a modelling artefact. However, due to the large variation in removal, the estimated doses from working with contaminated filter bed media can vary markedly, depending on the choice of removal efficiency factors. It should be noted, however, that doses from generic tasks involving working with contaminated filter bed media are typically much lower than those from working with contaminated sludge unless there is a prolonged incident with activity concentrations in the input water remaining at a constant level.
If only filtration occurs as a single process (not a default scenario considered in the Handbook), removal of contamination from the raw input water will be lower than that from flocculation, clarification and filtration, as shown in Table 3. For any single radionuclide it can be expected that the range between the minimum and maximum activity concentrations predicted in the filter media would be no more than a factor of 2 for most radionuclides. The choice of removal efficiency factor from the range of values given will therefore not significantly affect the doses predicted from undertaking tasks involving working with filter bed media given all the other uncertainties in estimating doses to operatives.
In summary, the magnitude of the predicted ranges in estimated potential doses is very dependent upon the radionuclide of concern and the magnitude of the removal during each treatment process. For example, the range in doses estimated for the generic task 'operating sludge press' is about a factor of 2 between the minimum and maximum value for most radionuclides, expressed in terms of mSv h-1 per Bq l-1 in the raw input water. This is a reflection of the range in activity concentrations in sludge. However, for the generic task 'filter bed maintenance' assuming rapid gravity filtration, the range in doses estimated is up to an order of magnitude between the minimum and maximum value and, dependent on the choice of value of removal efficiency, doses for some radionuclides could be predicted as being zero.
For planning purposes and for scoping potential doses to operatives, it is recommended that if doses are estimated based on activity concentrations in the raw input water, the maximum values for the dose factors are used. In this way the calculated doses will be based on the maximum predicted activity concentration in the media that the operatives are being exposed to. If possible, in the event of a radiological incident, measured activity concentrations in sludge and filter media should be used as soon as they are available and in preference to those in the raw input water. Further guidance on monitoring priorities and the use of measurements in sludge and filter media is given in Section 5 of the Handbook [Brown et al, 2008].

HANDBOOK FOR ASSESSING THE IMPACT OF A RADIOLOGICAL INCIDENT ON LEVELS OF RADIOACTIVITY IN DRINKING WATER AND RISKS TO OPERATIVES AT WATER TREATMENT WORKS: SUPPORTING SCIENTIFIC REPORT
72
6 SELECTION OF GUIDANCE LEVELS ON DOSES TO OPERATIVES WORKING IN A TREATMENT WORKS IN THE EVENT OF A RADIOLOGICAL INCIDENT
As discussed in Section 5, to bring the effects of different radionuclides and different exposure pathways on to a common basis requires the use of the concept of effective dose [ICRP, 1991, ICRP, 2007]. In the present context, a water treatment works could receive a range of different radionuclides, either singly or in combination. For this reason, guidance levels on doses have been derived in terms of effective dose.
Radioactivity and radiation of natural origin are all around us. On average, a person in the UK receives a dose of about 2.2 mSv each year from natural sources [Watson et al, 2005]. Any guidance levels on doses applied to situations such as those considered in this report relate to doses that may be received in addition to these natural values.
Exposure to radiation at work is regulated by the Ionising Radiation Regulations 1999, often referred to as IRR99 [HSE, 1999]. Under normal circumstances, operatives in water treatment works would be considered as “other persons” and so are subject to a dose limit of 1 mSv in a year. For operatives that are routinely exposed to ionising radiation as a result of their work, the IRR99 specify that people that are likely to receive 6 mSv or more over a period of a year should be designated as classified persons. The exposure of such people should be closely monitored. Workers receiving lower doses do not require this individual monitoring. However, there is a general requirement that doses should be kept as low as reasonably practicable (ALARP).
This study deals with doses that might be received in the aftermath of a radiological incident. In such situations, dose limits set for normal circumstances are not applicable. Nevertheless, a projected dose of 6 mSv over a period of a year acts as a useful starting point on which to develop guidance on the need for the application of added precautions and the need for specialist advice from a radiation protection advisor (RPA). Other work in progress at HPA-RPD has introduced a safety factor of 3 for operatives in other industries who, as a result of carrying out their normal work, could become exposed to radiation during an incident. On this basis, a value of 2 mSv, over a period of a year, would form a guidance level for dose received by an operative for the situation covered in this study.
The information gathered during this study indicated that, following an incident, the operatives at a water treatment works would generally be exposed to radiation for a discrete period. In most cases, these exposures are likely to only continue over timescales of up to a few months, while some may only continue for a few days. For this reason, the primary guidance level was chosen to be 2 mSv received over a period of up to one year. It should be emphasised that this primary guidance level relates to a projected dose, ie, doses that could be received in the future. Predictions of the projected doses to operatives should be compared with the guidance level in order to gauge the urgency with which precautions and specialist advice are needed.
For the situation being considered in this study, most day-to-day tasks are undertaken over a period of a week. Consequently, for the purposes of contingency planning it

SELECTION OF GUIDANCE LEVELS ON DOSES TO OPERATIVES WORKING IN A TREATMENT WORKS IN THE EVENT OF A RADIOLOGICAL INCIDENT
73
would be helpful if guidance levels were expressed in terms of the projected dose received in a week. If it is conservatively assumed that exposures could continued for up to 20 weeks at a constant level, then the primary guidance level of 2 mSv can be expressed as a subsidiary value of 0.1 mSv to an operative in a week. For convenience the 0.1 mSv value is referred to as the secondary guidance level in the remainder of this report and in the Handbook.
If exposures were expected to continue for periods of greater than one year, or were likely to arise discretely some years into the future, then it would be appropriate to consider each year or part of a year separately. The predicted doses for each year or part of a year would then be compared with the 2 mSv guidance level. Infrequent maintenance tasks such as the replacement of sand filters are an example of where this approach might be needed.
6.1 Application of guidance levels
6.1.1 Contingency planning As part of contingency planning, the water companies can estimate the potential dose to an operative carrying out different day-to-day tasks at the water treatment works in a week per unit activity in the material that they are exposed to and per unit activity in the input water to the works. This can be done using either the default parameter values given in this report or actual site-specific values. This is described in detail in Section 4 of the Handbook and the worked examples in Appendix A of the Handbook. If an incident did occur, then these estimated ‘dose in a week per unit activity’ values for each of the day-to-day tasks could be combined with measured activity concentrations to give the likely doses to an operative for a week of operation of the treatment works.
6.1.2 In the event of an incident Measured activity concentrations in water, sludge or filter media can be combined with the dose in a week per unit activity concentration values calculated as part of contingency planning. The resulting estimated doses to a 'critical individual' (notional person carrying out all day-to-day tasks in a week) can then be compared with the secondary guidance level of 0.1 mSv.
• Dose below 0.1 mSv in a week
If, in the event of an incident, the potential dose in a week to the 'critical individual' is estimated to be lower than 0.1 mSv and it was not anticipated that the exposure of the operatives would continue for more than 4 months, then from the radiological protection point of view the treatment works could continue to function as normal. A final decision would be a matter for the regulator. It would still be reasonable to expect the Water Industry to seek specialist RPA advice, but this would not be urgent.
• Dose above 0.1 mSv in a week or exposure lasting more than 4 months
If the potential doses to the 'critical individual' in a week are estimated to exceed 0.1 mSv or if it is anticipated that the exposure of the operatives would continue for
HANDBOOK FOR ASSESSING THE IMPACT OF A RADIOLOGICAL INCIDENT ON LEVELS OF RADIOACTIVITY IN DRINKING WATER AND RISKS TO OPERATIVES AT WATER TREATMENT WORKS: SUPPORTING SCIENTIFIC REPORT
74
more than 4 months, then an assessment of the overall dose to each operative or groups of operatives doing very similar jobs from the incident should be carried out as a matter of urgency. This second assessment is in effect an adjustment to the dose per unit activity values taking into account the information immediately available on the specific incident and the jobs undertaken by specific individuals. It should for example include any estimate of the duration or anticipated duration of an incident, any more detailed knowledge on the amount of time individuals spend undertaking their tasks and any available information on possible changes in activity concentrations as time progresses. Tasks that are not urgent should be postponed until this second assessment is complete.
As this second assessment is looking at the overall dose to an operative from the incident, not just the weekly dose, the relevant guidance level for comparison is 2 mSv in any one year.
• Revised assessment of dose below 2 mSv
If after this second assessment the estimated dose from the incident to an operative is less than 2 mSv in any one year, then the works should continue to function as normal. However, it would be reasonable to expect the Water Industry to seek specialist RPA advice in the short term and to maintain an appropriate monitoring programme so that the estimated doses can be reassessed frequently.
• Revised assessment of dose above 2 mSv
If the estimated dose to an operative is higher than 2 mSv in any one year, then specialist RPA advice must be sought urgently. Non-urgent tasks should not be performed before specialist RPA advice is available. The Water Industry should also consider reducing the hours spent by an individual on the tasks giving rise to the highest doses until specialist RPA advice is available.
In the unlikely event that estimates of both the dose in a week and the overall dose in any one year exceed 2 mSv, then the Regulator could reasonably consider closing the treatment works down until specialist RPA advice is available.
The application of these guidance levels within a framework for different types of radiological incident is described in detail in Section 5 of the Handbook and is illustrated in the worked examples in Appendix B of the Handbook [Brown et al, 2008].
7 APPLICATION OF THE METHODOLOGY TO THE CHERNOBYL ACCIDENT
Following the reactor accident at one of the reactors at Chernobyl in the Ukraine, North West Water collected a variety of water samples from the major catchments and water supplies under their control [Jones and Castle, 1987]. In addition, sludge samples were taken from a number of water treatment works and were analysed for radionuclide content. The measured activity concentrations in sludge from this monitoring programme have been used in this report to demonstrate the use of the methodology

APPLICATION OF THE METHODOLOGY TO THE CHERNOBYL ACCIDENT
75
provided in the Handbook. The measurements have also been used to illustrate the effectiveness of water treatment in removing radionuclides and the impact that dilution of contamination in the drinking water sources is likely to have on the contamination levels within a treatment works. A number of other measurements of gross activity in surface waters and rainwater are given in the paper. These have not been used to estimate doses because there is not enough information to link the measurements to raw water entering a treatment works and it would be unreasonable to make a chain of assumptions to extrapolate from these data to activity concentrations within a given treatment works. It is also not possible to derive radionuclide specific activity concentrations from gross beta measurements.
Jones and Castle [2005] found that the levels of gross beta activity recorded on samples of treated water were significantly lower than those recorded for samples of raw water. This indicated that water treatment was effective in removing radionuclides from the water supply. Measurements made in sludge showed that the radionuclides removed concentrated in the sludge and that the activity concentrations could be high. For example, activity concentrations of several thousand Bq kg-1 were found in sludge cake at the Arnfield treatment works for 103Ru, 131I and 137Cs. The treatment works where measurements were made mainly had the treatment processes of flocculation and filtration. The paper states that the processes of flocculation and filtration were particularly effective for removing isotopes of ruthenium. At one works, where water treatment consisted of rapid gravity filtration without flocculation, the filtration was found to be effective in removing 137Cs from the raw water.
Using the water treatment removal efficiencies in Table 3, it can be estimated that flocculation and sand filtration could remove in the range of 45-80% of ruthenium isotopes and 20 - 75% of caesium isotopes. For sand filtration on its own, a removal of 10-40% could be expected. These values are consistent with the findings by Jones and Castle.
The highest activity concentrations in filter sludge were found at the Arnfield treatment works. Using these measured values, potential doses to operatives undertaking tasks where they are in close proximity to sludge can be estimated using the methodology given in the Handbook.
The works was assumed to have the treatment processes flocculation followed by rapid gravity sand filtration. For this illustrative calculation it was assumed that the works has the default throughput of 100 Ml per day, 7000 kg of sludge is produced per 100 Ml throughput and the mass of sand in the filters is 32000 tonnes (see Section 4.2.2 for a justification of these values).
The potential doses to a 'critical individual', ie, a person carrying out all of the day-to-day tasks during a week estimated (see below) were lower than the guidance levels of 0.1 m Sv in a week and 2 mSv in a year (Section 6.1.2). In Jones and Castle [2005], the authors note that there was concern initially about the radiation risks posed to employees dewatering machinery or cleaning out sludge tanks. Investigations carried out using portable radiation meters showed that there was very little associated external irradiation dose associated with these activities. Also, as the sludge cake was kept damp during normal working practices and no dust was produced, inhalation doses were

HANDBOOK FOR ASSESSING THE IMPACT OF A RADIOLOGICAL INCIDENT ON LEVELS OF RADIOACTIVITY IN DRINKING WATER AND RISKS TO OPERATIVES AT WATER TREATMENT WORKS: SUPPORTING SCIENTIFIC REPORT
76
minimised. Taking the measured values with the methodology given in the Handbook supports these findings. For the radionuclides of concern during the Chernobyl incident, external gamma doses dominated the dose received (see Table 12 - Table 19). Even if the sludge cake being handled had been dry, doses from the inhalation of dust would have been small compared with those from external irradiation.

77
AP
PLIC
ATIO
N O
F THE
ME
THO
DO
LOG
Y TO
THE
CH
ER
NO
BY
L AC
CID
EN
T
Assumptions about Arnfield treatment works
Sludge is handled on site.
Inspection of back-washing of rapid gravity filters occurs. However, no alpha emitters have been released so measurements in filter media are not a priority.
No routine maintenance is imminent.
Measurements of 103Ru, 131I, 137Cs, 132Te and 134Cs made in sludge cake on 14th May 1986. 131I, 103Ru and 132Te are short-lived gamma-ray emitting radionuclides. 134Cs and 137Cs are long-lived gamma-ray emitting radionuclides.
Measured activity in sludge are as follows: 103Ru 7600 Bq kg-1
131I 3800 Bq kg-1
134Cs 230 Bq kg-1
137Cs, 1260 Bq kg-1
132Te 570 Bq kg-1
Day-to-day tasks Dose, mSv in a week
103Ru 131I 134Cs 137Cs 132Te
Filling and emptying sludge press 8.7 10-3 2.2 10-2 8.6 10-4 1.6 10-3 5.6 10-4
Shovelling sludge to bunkers 2.4 10-3 9.2 10-4 2.5 10-4 5.3 10-4 6.6 10-5
Transporting sludge 2.4 10-4 6.8 10-4 2.6 10-5 4.5 10-5 1.5 10-5
DAF checking 7.2 10-5 1.8 10-4 7.0 10-6 1.3 10-5 4.6 10-6
'Critical individual' 1.1 10-2 2.4 10-2 1.2 10-3 2.1 10-3 6.4 10-4
'Critical individual' (total) 2.8 10-2 mSv
Step 2: Using measured activity concentrations in sludge, estimate potential future doses for 'critical individual' carrying out all day-to-day tasks Adjust for predicted time incident will carry on for and operatives may be exposed
The contaminated plume from the Chernobyl accident passed over the UK over a period of several days. However, due to run-off from catchment contaminated water continued entering the works for some time. Jones and Castle reported gross beta measurements in raw water sources in October 1986. For the purposes of this illustrative calculation, it is assumed that contaminated water continued to enter the works for 1 year. Adjustment should be made for radioactive half-life for the short-lived radionuclides. It is assumed that activity concentrations of 131I will have dropped to very low levels after 6 weeks, 103Ru after 6 months and 132Te after 4 weeks (see Table 9 of Handbook [Brown et al, 2008] ). A duration of 1 year is assumed for the other radionuclides.
Using these durations, the estimated dose to the 'critical individual' is calculated as 3.2 10-1 mSv.
Step 3: Check to see if doses exceed 0.1 mSv in a week and 2 mSv in a year
Using initial measurements in sludge, dose estimated to a 'critical individual' for 1 week does not exceed the 0.1 mSv secondary guidance level.
The dose to the 'critical individual' taking into account the estimated duration of the incident is below the 2 mSv in a year primary guidance level. It should be noted that this estimated dose is likely to be conservative as it assumes no dilution of activity concentrations in the raw water over the period.
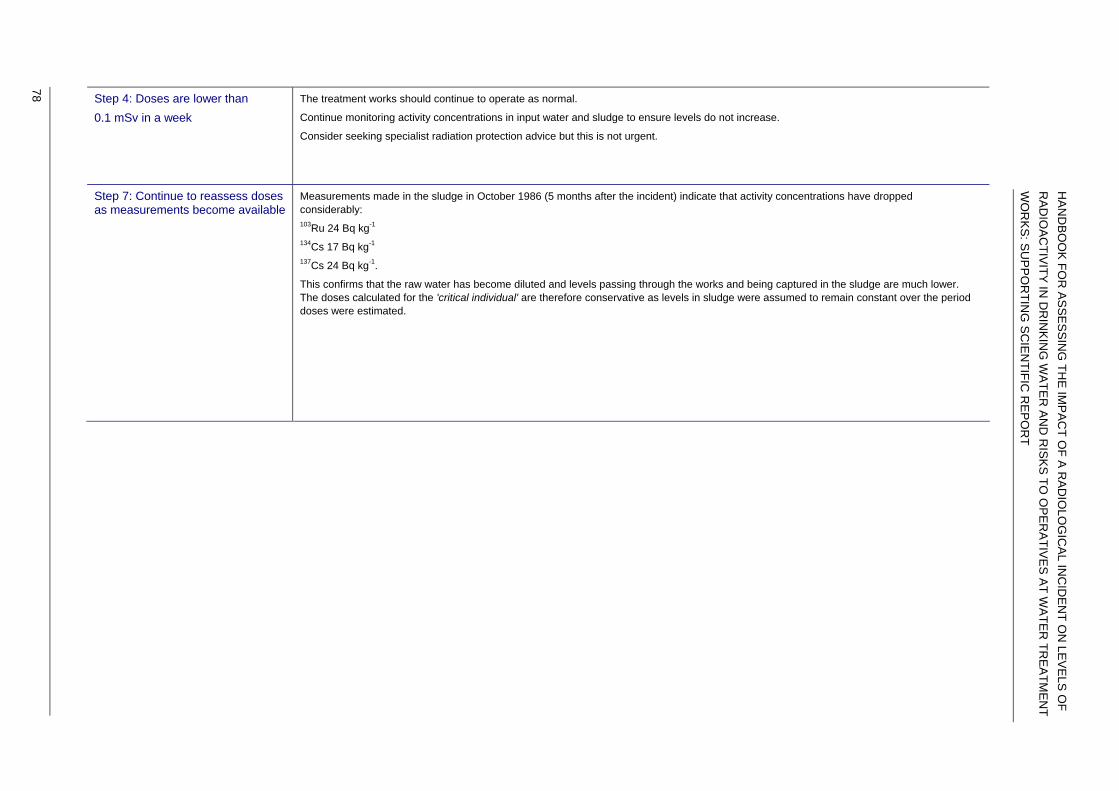
HA
ND
BO
OK
FOR
AS
SE
SS
ING
THE
IMP
AC
T OF A
RAD
IOLO
GIC
AL IN
CID
EN
T ON
LEV
ELS
OF
RA
DIO
AC
TIVITY
IN D
RIN
KIN
G W
ATE
R A
ND
RIS
KS
TO O
PE
RA
TIVE
S A
T WA
TER
TRE
ATM
EN
T W
OR
KS
: SU
PP
OR
TING
SC
IEN
TIFIC R
EP
OR
T
78 Step 4: Doses are lower than 0.1 mSv in a week
The treatment works should continue to operate as normal.
Continue monitoring activity concentrations in input water and sludge to ensure levels do not increase.
Consider seeking specialist radiation protection advice but this is not urgent.
Step 7: Continue to reassess doses as measurements become available
Measurements made in the sludge in October 1986 (5 months after the incident) indicate that activity concentrations have dropped considerably: 103Ru 24 Bq kg-1 134Cs 17 Bq kg-1
137Cs 24 Bq kg-1.
This confirms that the raw water has become diluted and levels passing through the works and being captured in the sludge are much lower. The doses calculated for the 'critical individual' are therefore conservative as levels in sludge were assumed to remain constant over the period doses were estimated.

REFERENCES
79
8 CONCLUDING REMARKS
Information on the treatment of drinking water has been compiled and used to develop a radiological assessment methodology for the operatives of treatment works. This report contains the basic information that has been gathered and how this has been used to develop the methodology. It is intended primarily for DWI and those within the water industry with responsibility for contingency planning and emergency response. The accompanying Handbook provides a tool for the water industry to help in the management of potential risks to water treatment operatives in the event of a radiological incident. The Handbook could also be used as a training tool.
9 ACKNOWLEDGEMENTS
The technical information provided by DWI and the water industry is gratefully acknowledged. We also thank those water companies that accommodated us on site visits, in particular John Haley from Yorkshire Water, Charmian Abbott from United Utilities and John Welch from South West Water. These visits provided us with the ancillary information on which to derive some of the default parameter values used in the assessment methodology
10 REFERENCES
Andersson KG (1996). Evaluation of early phase nuclear accident clean-up procedures for Nordic residential areas, NKS Report NKS/EKO-5(96)18, ISBN 87-550-2250-2.
Brown J, Hammond DH and Wilkins BT (2008). Handbook for assessing the impact of a radiological incident on levels of radioactivity in drinking water and risks to operatives at water treatment works, Chilton, HPA-RPD-040.
Delacroix D et al (2002). Radionuclide and Radiation Protection Data handbook 2002, Rad Prot Dosim, 98 (1).
Holford RM (1989) Supplement to dose conversion factors for air, water, soil and building materials. Report AECL 9825-1, Atomic Energy of Canada Ltd. Chalk River Laboratories, Chalk River, Ontario.
HPA (2005). UK Recovery Handbook for Radiation Incidents: 2005, Chilton, HPA-RPD-002, hpa.org.uk.
HSE (1990). Respiratory protective equipment - a practical guide for users. Health and Safety Executive, UK.
HSE (1999). Ionising Radiations Regulations, 1999. Statutory Instrument No 1333. HMSO, London.
Jones F and Castle RG (1987). Radioactivity monitoring of the water cycle following the Chernobyl accident, J Inst Water Poll, 205-217.
Kowe R, Carey AD, Jones JA and Mobbs SF (2007). GRANIS : a model for the assessment of external photon irradiation from contaminated media of infinite lateral extent. Chilton, HPA-RPD-032, hpa.org.uk.

HANDBOOK FOR ASSESSING THE IMPACT OF A RADIOLOGICAL INCIDENT ON LEVELS OF RADIOACTIVITY IN DRINKING WATER AND RISKS TO OPERATIVES AT WATER TREATMENT WORKS: SUPPORTING SCIENTIFIC REPORT
80
ICRP (1991). 1990 Recommendations of the ICRP. ICRP Publication 60. Ann ICRP, 21 (1-3). Pergamon Press.
ICRP (2007). The 2007 Recommendations of the ICRP. ICRP Publication 103, Ann ICRP, 37 (2-4). Elsevier Ltd.
Morgan CJ (1997). Methods and cost of decontamination and site restoration following dispersion of plutonium in a weapon accident. Aldermaston, AWE, SCT Laboratory.
Negin CA (1986). MICROSHIELD - A Microcomputer Program for Analyzing Dose Rate and Gamma Shielding. CONF-861102, ISSN 0003-018X CODEN TANSA. Trans Am Nucl Soc, 53, 421-422.
Smith KR and Jones AL (2003). Generalised habit data for radiological assessments. Chilton, NRPB-W41.
Titley JG, Carey AD, Crockett GM et al (2000). Investigation of the sources and fates of radioactive discharges to public sewers. Environment Agency R & D Technical Report P288, London.
Twort AC, Ratnayaka DD and Brandt MJ (2000). Water Supply (5th edition). Published by IWA Publishing.
Watson S, Jones AL, Oatway WB and Hughes JS (2005). Ionising Radiation Exposure of the UK Population: 2005 Review. Chilton, HPA-RPD-001, hpa.org.uk.

APPENDIX A
81
APPENDIX A : Review of Literature Sources on effectiveness of drinking water treatment
A1 BIBLIOGRAPHY
Annanmäki M, Turtiainen T, Jungclas H and Rausse Ch (2000). Disposal of radioactive waste arising from water treatment: Recommendations for the EC. Final report of the WP 8 of the TENAWA Project. .STUK-A175, April 2000.
Arey JS, Seaman JC and Bertsch PM (1999). Immobilization of Uranium in contaminated sediments by hydroxyapatite addition. Environ Sci Technol, 33, 337.
Culp R (1960). Will Treatment Plant Processes Remove Radioactivity in Water? Water Works Engineering, 113.
Dionian J and Linsley GS (1983). Models for the Transfer of Radionuclides from Atmosphere to Drinking Water. Chilton, NRPB-M90.
Eden GE, Elkins GHJ and Truesdale GA (1954). Removal of Radioactive Substances From Water By Biological Treatment Processes. Atomics, 5.
Gafvert T, Ellmark C and Holm E (2002). Removal of radionuclides at a Waterworks. J Environ Radioact, 63, 105-115.
Goossens R, Delville A, Genot J, Halleux R and Masschelein WJ (1989). Removal of the Typical Isotopes of the Chernobyl Fall-out by Conventional Water Treatment. Wat Res, 23 (6), 693-697.
Haberer K (1989). Radioactivity - Requirements and Possibilities of the water Treatment. Water Supply, 7, 201-205.
Hanson SW, Wilson DB and Gunaj NN (1986). Removal of uranium from drinking water by ion exchange and chemical clarification. New Mexico State University, Las Cruces, New Mexico.
Hocking MB (2005). Handbook of Chemical Technology and Pollution Control (Third Edition), Academic Press.
Huang CP, Allen HE and Wang J (2000). Chemical Characteristics and Solids Uptake of Heavy Metals in Wastewater Treatment. Water Environment Research Foundation (University of Delaware). Project 93-CTS-1.
Huikuri P, Salonen L and Raff O (1998). Removal of natural radionuclides from drinking watet by point of entry reverse osmosis. Desalination, 119, 235-239.
Huikuri P and Salonen L (2000). Removal of uranium from Finnish groundwaters in domestic use with a strong anion resion. J Radioanal and Nucl Chem, 245 (2), 385-393.
Jimenez A and De La Montana M (2002). Effect of water purification on its radioactive content. Wat Res, 36, 1715.
Jones F and Castle RG (1987). Radioactivity monitoring in the water cycle following the Chernobyl accident. J Inst Water Poll, 205-217.
Kwakman PJM (2004). Drinkingwaterzuivering na een Kernongeval, Een Literatuurstudie. RIVM/LSO briefrapport 445/04.
Lauderdale RA and Eliassen R (1956). The removal of radioactive fall-out from water by municipal and industrial water treatment plants. Sedgwick Laboratories of Sanitary Science.
Lee SY and Bondietti EA (1983). Removing uranium from drinking water by metal hydroxides and anion exchange resin. American Water Works Assoc, 75, 536-540.
Lettinga G (1972). Radioactivity and water supplies. Luxembourg CEC, EUR-4866.
Liu N, Luo S, Tyang Y, Zhang T, Jin J and Liao J (2002). Biosorption of Am-241 by Saccharomyces Cerevisiae. J Radioanal Nuclear Chem, 252, 187.

HANDBOOK FOR ASSESSING THE IMPACT OF A RADIOLOGICAL INCIDENT ON LEVELS OF RADIOACTIVITY IN DRINKING WATER AND RISKS TO OPERATIVES AT WATER TREATMENT WORKS: SUPPORTING SCIENTIFIC REPORT
82
Möller T, Harjula R and Paajanen A (2003). Removal of 85Sr, 134Cs, and 57Co radionuclides from acidic and neutral waste solutions by metal doped antimony silicates. Separation Science and Technology, 38, 2995.
Morton RJ and Straub CP (1955). Removal of Radionuclides from Water by Water Treatment Processes. J American Water Works Assoc, 48, 545.
Reid GW, Lassovsky P and Hatherway S (1985). Treatment, waste management and cost for removal of radioactivity from drinking water. Health Phys, 48, 671.
Rudenko LI, Sklyar VY and Khan VE (2004). Treatment of liquid radioactive waste from the shelter object to remove transuranic elements, radiostrontium en -emitters. Radiochem, 46, 198. Notes: Translated from Radiokhimiya, 46, 184.
Rulyov NN (1999). Application of ultra-flocculation and turbulent micro-flotation to the removal of fine contaminants from water. Physicochem and Engineering Aspects, 151, 283.
Sorg TJ, Forbes RW and Chambers DS (1980). Removal of Radium-226 From Sarasota County, Fla., Drinking Water by Reverse Osmosis. American Water Works Assoc, 72, 230-237.
Thomson BM, et al (2003). Removal of metals and radionuclides using apatite and other natural sorbents. J Env Engineering, 492.
Turtianinen T, Salonen L and Myllymaki P (2000). Radon removal from different types of groundwater applying granular activated carbon filtration. J Radioan and Nucl Chem, 243 (2), 423-432.
Vaaramaa K, Lehto J and Jaakola T (2000). Removal of 234U, 238U, 226Ra, 210Po and 210Pb from drinking water by ion exchange. Radiochimica Acta, 88, 361.
Valentine RL, Mulholland TS and Splinter RC (1987). Radium removal using sorption to filter sand. American Water Works Assoc, 79, 170-176.

APPENDIX A
83
A2 SUMMARY OF CONTENT OF PAPERS
A2.1 (Annanmäki et al, 2000) This Finnish review was part of a joint European project on drinking water and dealt mostly with natural radioactivity in groundwater and the generation of contaminated waste. Techniques considered were.
• Aeration for the removal of radon – 95% of radon is removed with an air-to water ratio of 10.
• Granular activated carbon (GAC) filtration – 100% of 210Pb formed by the radioactive decay of radon was retained on the GAC. GAC filters also remove uranium and 226Ra, although the removal efficiencies are only described as “fair”.
• Ion exchange techniques – Generally uranium is removed using an anion exchanger and radium (and lead) is removed using a cation exchanger. The removal efficiencies vary depending on the type of ion exchange material used. Generally ion exchange removes >50% of these radionuclides.
• Reverse osmosis – Most dissolved ions are removed by reverse osmosis.
Review summary
This paper provides useful values for uranium and radium for consideration in the efficiency matrix, although values for ion exchange and GAC filtration are wide ranging (50 – 100%). The original references have been reviewed.
A2.2 (Arey et al, 1999) This was a laboratory study looking at the effectiveness of hydroxyapatite (Ca5(PO4)3OH) to chemically immobilise uranium. 92.6 ± 6% of uranium was extracted. The soluble uranium precipitates as an insoluble phosphate and can be physically removed.
Review summary
This study confirms the general findings in Thomson et al, 2003 and gives a quantitative value for the reduction in uranium concentration.
A2.3 (Culp, 1960) This paper describes laboratory experiments to evaluate removal efficiencies of water treatments on radionuclides. It also gives removal efficiencies for added processes such as the addition of clay or precipitation using phosphates.
Review summary
This is a mixture of laboratory experiments and observed concentrations at water treatment works. There are removal efficiency tables for various processes, which look compatible with other tables in other papers. The efficiencies will be taken into account in the efficiency matrix.

HANDBOOK FOR ASSESSING THE IMPACT OF A RADIOLOGICAL INCIDENT ON LEVELS OF RADIOACTIVITY IN DRINKING WATER AND RISKS TO OPERATIVES AT WATER TREATMENT WORKS: SUPPORTING SCIENTIFIC REPORT
84
A2.4 (Dionian and Linsley, 1983) This is a review of water treatment processes carried out by the National Radiological Protection Board (NRPB) and contains a removal efficiency table. The efficiency table took account of the earlier work done by Morton et al, Eden et al, Lettinga and Culp. Each of these studies put forward decontamination efficiencies for various radionuclides using different drinking water treatments.
Review summary
This study is still relevant today, although the efficiency table is radionuclide and not element specific. The original references have also been reviewed.
A2.5 (Eden et al, 1954) This study evaluated the use of slow sand filtration on radionuclide removal. This was a laboratory experiment. The radionuclides studied were 106Ru, 90Sr, 131I, 239Pu and 144Ce. Removal efficiencies were measured.
Review summary
This is a useful evaluation of slow sand filtration. The laboratory experiment is a close approximation of a real slow sand filter. The other topics covered in the paper are mainly to do with wastewater treatment and are not relevant.
A2.6 (Gafvert et al, 2002) Removal efficiencies were determined for uranium, plutonium, thorium, polonium, radium, caesium, and strontium at a water treatment works, following water treatment. The works had two treatment lines (alum, and ferric chloride) and both were evaluated. There was little difference between the two treatment types. Results are particularly interesting for caesium and strontium which show little removal by flocculation, coagulation and rapid and slow sand filtration. Removal for uranium was about 85% and for plutonium was >95% following coagulation and flocculation.
Review summary
The numbers for uranium and plutonium will contribute towards the efficiency matrix. Although caesium and strontium were hardly removed at all, it is suggested that this is more to do with the chemical form of the isotopes (ionic, rather than attached to particulates) and also the fact that the raw water was low in turbidity.
A2.7 (Goossens et al, 1989) A full-scale treatment process at the Tailfer plant (Brussels Water Board) was evaluated. The process included flocculation/coagulation and rapid sand filtration. The radionuclides 131I, 58Co, 134Cs and 103Ru were added to raw water as chlorides. The percentage removal for the complete treatment process is given. The percentage removal was 17% for 131I, 61% for 58Co, 56% for 134Cs and 73% for 103Ru. The study makes the point that these values are lower than for many of the laboratory experiments.

APPENDIX A
85
Review summary
Although the values given for removal are lower than many laboratory experiments, the radionuclides used were in a very soluble chloride form, which may not always be the case in the environment where radionuclides could be less soluble or attached to particulate or organic material. In such cases removal factors could well be larger. However, this paper does provide lower limits for radionuclide removal for the whole treatment process
A2.8 (Haberer, 1989) This is a review of United States literature and contains an early efficiency removal table. The main treatment steps are covered for several radionuclides.
Review summary
This was a review of drinking water treatments. The efficiency table provides ranges for several radionuclides of interest, notably uranium, caesium, strontium and iodine. The original references from the Journal of American Water Works Association have also been reviewed. This review is in broad agreement with other reviews [Dionian and Linsley, 1983, Kwakman, 2004].
A2.9 (Hanson et al, 1986) This paper describes a pilot study evaluating the effectiveness of ion exchange and chemical clarification (flocculation using ferric chloride and floatation or settling) on the removal of uranium from drinking water. A purpose built system was transported by van to different well sites used for private water supplies and installed. Measurements were made before, during and after treatment.
Review Summary
Four different anion exchange resins were evaluated. The removal efficiency for all resins was >99%. The flocculation and floatation or settling removed >82% of the uranium irrespective of floatation or settling.
A2.10 (Hocking, 2005) Some information on water treatment and quality standards for drinking water is provided.
Review summary
This study is a useful general reference but not relevant to this review.
A2.11 (Huang et al, 2000) This is a study looking at the removal of heavy metals from wastewater treatment works. Most heavy metals are associated with sludge particulates and removed by secondary clarification in wastewater treatment.

HANDBOOK FOR ASSESSING THE IMPACT OF A RADIOLOGICAL INCIDENT ON LEVELS OF RADIOACTIVITY IN DRINKING WATER AND RISKS TO OPERATIVES AT WATER TREATMENT WORKS: SUPPORTING SCIENTIFIC REPORT
86
Review summary
This study is not directly relevant to this review. However, it gives indications of behaviour of heavy metals, some of which might be expected to behave similarly to some of the elements being considered in this review.
A2.12 (Huikuri et al, 1998) This study considers the potential for reverse osmosis (RO) to remove natural radioactivity using a point of entry (at the tap or just outside a dwelling) use RO unit. Uranium and radium removal was >99%. This was a robust experiment with some definitive conclusions. Measurements had been made before and after RO.
Review summary
This paper confirms that removal efficiencies for reverse osmosis are very high.
A2.13 (Huikuri and Salonen, 2000) This paper deals with the use of ion exchange filters to remove uranium from private water supplies intended for domestic use. Ion exchange filters were installed in six private homes to treat all household water or the kitchen water. The removal of uranium using strong anion exchange filters was >95% at all locations.
Review summary
This is confirmation that anion exchange removes uranium to a great extent (>95%) and will be considered for the review.
A2.14 (Jimenez and De La Montana, 2002) This is a Spanish study looking at radionuclide concentrations before and after water treatment (flocculation/coagulation/clarification/filtration/disinfection). 17 treatment works were used in the investigation. In general, the treatment processes used were effective at reducing the amount of plutonium, uranium and radium in water. However, for strontium the processes used provided little reduction.
Review summary
This is an interesting paper on radionuclide removal. The results indicate removal. No values for removal efficiencies are quoted, the information being mostly qualitative. However, the theories put forward can be used to support some of the conclusions suggested in the review.
A2.15 (Jones, 1987) This paper is a review of a radioactivity monitoring programme undertaken following the Chernobyl accident. Measurements of gross beta and gamma activity in samples of raw and treated water from the north west of England were taken and tabulated. The results

APPENDIX A
87
show that ruthenium was largely removed by flocculation and sand filtration was able to remove caesium.
Review summary
The results for ruthenium removal are in agreement with other papers reviewed. The results for caesium suggest that sand filtration is more effective at removing caesium than reported in the other papers reviewed. If the caesium was attached to particulate material, then sand filtration will be effective at removing caesium. As caesium from the Chernobyl accident had been in the environment for some time, it is more than likely that it will have attached to particulate material and was therefore subsequently removed by sand filtration.
A2.16 (Kwakman, 2004) This is a literature review looking at the removal of radionuclides from drinking water. A removal efficiency table is provided, giving ranges off removal efficiencies for many radionuclides and different treatment processes.
Review Summary
The author of this paper has provided ranges for removal efficiencies, rather than quote definitive numbers. This reflects the large variations in removal efficiencies given in the papers reviewed and also provides a more robust estimate of the efficiency of any given treatment to remove radionuclides and should be used as indicative and not definitive. The original references have been reviewed.
A2.17 (Lauderdale and Eliassen, 1956) This was an American study looking at reduction of fall-out (following nuclear weapons testing) from municipal and industrial water treatment works. Gross beta measurements were made before and after treatment at 20 treatment works. The results showed that between 50 and 75% of activity was removed by treatment.
Review summary
This study suggested that different types of treatment and raw water had minimal effect on removal. This may be because only total beta activity was measured and most of the activity was attached to particulate material and could be easily isolated.
A2.18 (Lee and Bondietti, 1983) This paper describes a laboratory experiment to evaluate coagulation and anion exchange on the removal of uranium from drinking water. The main conclusion is that conventional coagulation using ferric chloride or aluminium sulphate removes more than 85% of uranium. Anion exchange removes >99% of uranium.

HANDBOOK FOR ASSESSING THE IMPACT OF A RADIOLOGICAL INCIDENT ON LEVELS OF RADIOACTIVITY IN DRINKING WATER AND RISKS TO OPERATIVES AT WATER TREATMENT WORKS: SUPPORTING SCIENTIFIC REPORT
88
Review summary
The authors make the point that, although anion exchange is effective at removing uranium, capital investment would be required to install suitable equipment at treatment works. However, anion exchange would be more suitable for private supplies. The effect of chemical coagulation is in agreement with Hanson et al (1986).
A2.19 (Lettinga, 1972) This study investigated the use of organic material (peat) and granulated activated charcoal and clay to remove radionuclides from water contaminated with radioactivity. Also the effectiveness of other water treatments has been evaluated. Measurements have been made before and after treatments and removal efficiencies have been given for iodine, strontium, cobalt, ruthenium, caesium, cerium, zirconium and phosphorus.
Review summary
This paper describes some early work on removal of radionuclides from drinking water contaminated with fall-out. The removal efficiencies have been measured and the range of radionuclides and treatments is very useful for the review. The removal efficiencies will be considered in the review.
A2.20 (Liu et al, 2002) This paper considers bio-adsorption of 241Am from radioactive wastewater.
Review summary
This study is not relevant to this review.
A2.21 (Möller et al, 2003) This paper deals with the removal of caesium, cobalt and strontium from nuclear waste solutions using antimony silicates.
Review summary
This study is not relevant to this review.
A2.22 (Morton and Straub, 1955) This paper describes a laboratory experiment to evaluate the effectiveness of water treatments and has provided removal efficiency tables for the main processes and many radionuclides of interest. For ion exchange, cationic and anionic exchange material was evaluated. Removal efficiencies were generally >90%.
Review summary
The information on the removal efficiency tables is largely in agreement with other studies. However, the measurements observed are for Jar Test studies and so might not reflect the real situation at a treatment works. Conditions for the laboratory

APPENDIX A
89
experiments were different (more extreme) from water treatment works and therefore removal efficiencies might be overestimated. The removal efficiencies warrant consideration and comparison with the other efficiency tables.
A2.23 (Morton and Straub, 1955) This paper is a review of the effectiveness of drinking water treatments in removing naturally occurring radionuclides. The paper concludes that ion exchange, lime softening and reverse osmosis are effective at removing radium and uranium. The cost of implementing these processes on small and large scale has also been evaluated.
Review summary
This paper summarises the conclusions of a number of individual papers on the effectiveness of removal by water treatment. The individual papers cited have been reviewed independently in this document.
A2.24 (Rudenko et al, 2004) This is a laboratory experiment looking at the decontamination of liquid radioactive waste from Chernobyl. Decontamination efficiencies of >95% were achieved using floatation, filtration through fibrous materials, adsorption onto natural zeolites and ion exchange.
Review summary
There is little experimental detail regarding conditions and concentrations of chemicals used. The experimental conditions are probably too extreme for use in decontaminating drinking water on a large scale at treatment works. Floatation using micro bubbles was used to separate particulate material.
A2.25 (Rulyov, 1999) This paper looks at the mechanisms of flocculation, floatation and adsorption. There is no quantitative information on removal efficiencies.
Review summary
This study is not directly relevant to this review. However, some background is given for the reasons why these processes work.
A2.26 (Sorg et al, 1980) Eight reverse osmosis (RO) units were evaluated for the removal of radium and other dissolved solids. The RO units were in use at private well supplies in the state of Florida (USA). A removal of radium of >95% was measured at all sites. Removal of selenium was also measured and this was >80% at all sites.

HANDBOOK FOR ASSESSING THE IMPACT OF A RADIOLOGICAL INCIDENT ON LEVELS OF RADIOACTIVITY IN DRINKING WATER AND RISKS TO OPERATIVES AT WATER TREATMENT WORKS: SUPPORTING SCIENTIFIC REPORT
90
Review Summary
This study indicated almost total removal of radium but only 80% for selenium. However, no selenium was measured in the treated water, and limits of detection were used to calculate the removal. Therefore 80% corresponds to a lower limit for removal of selenium.
A2.27 (Thomson and et al, 2003) This study investigated the use of natural sorbents to treat plutonium, uranium, technetium and americium. Almost total removal of plutonium and uranium using apatite, tri-calcium phosphate, and bone char was observed. Technetium in water was largely unaffected. However, no percentage efficiencies were given.
Review summary
The results of this study show that phosphate based adsorbents have a very high sorption capacity for americium, plutonium, uranium and barium. It is not known which of these absorbents are being used in treatment facilities in the UK but the data merited inclusion in the efficiency matrix.
A2.28 (Turtianinen et al, 2000) This is a Finnish study investigating radon removal using GAC-filters. Radon was removed effectively by all combinations of filters (>98%). Radon is not in the list of elements for consideration in this review.
Review summary
Not directly relevant to this review
A2.29 (Vaaramaa et al, 2000) This study used laboratory experiments to evaluate the removal of natural radioactivity (uranium, radium, polonium/lead) by ion exchange. In summary – a strong basic anion exchanger was best for removal / reduction of total alpha and total beta.
Review summary
This paper comes to the same conclusions as Annanmäki et al [Annanmäki, Turtainen et al, 2000] about the use of cation and anion exchangers for the removal of uranium and radium. The paper provides qualitative information on removal, but provides no quantitative data.
A2.30 (Valentine et al, 1987) This was a batch study to investigate the sorption of radium onto filter sand.

APPENDIX A
91
Review summary
This study showed that radium removal using filter sand was between 40 and 60% at pH 4-8, which is the range of pH that would normally be associated with water treatment.