hamptons 1q 2021 home sales report - town & country …
TRANSCRIPT

HAMPTONSHEAT MAPBASED ON THE NUMBEROF TOTAL SALES
WESTHAMPTON
AMAGANSETT
EAST HAMPTON
BRIDGEHAMPTON
SOUTHAMPTON
HAMPTON BAYS
MONTAUKSAG HARBOR
SHELTER ISLAND
THE NORTH FORK
0 342
TOTAL SALES
HAMPTONS 1Q 2021HOME SALES REPORT
“Keeping in mind all real estate reports are, what I call, a look in the rearview mirror, in so far as the statistics are based on contracts signed 60-90 days prior to recording. That said, this report, does not reflect the affect the pandemic initially had on our home sales as March 2020 was the start of the shutdown. Looking at All Hamptons Markets Combined and several statistics jump off the page. While the Median Home Sales Price rose to $1,412,500, the price range of $2M-$3.49M more than doubled with 76 transfers. The other colossal movement was in the $10M-$19.99M price range which tanked 90% (from 10 down to 1). But fret not, the rest of this year will make up for that!”
Judi Desiderio, CEO | [email protected] | 631.324.8080
THE
HA
MPT
ON
SA
LL M
ARK
ETS
CO
MB
INED
# OF HOME SALES
TOTAL HOME SALES
VOLUME
MEDIAN HOME
SALES PRICE
# SALES UNDER $500K
# SALES $500K - $999K
# SALES $1M -
$1.99M
# SALES $2M -
$3.49M
# SALES $3.5M - $4.99M
# SALES $5M -
$9.99M
# SALES #10M -
$19.99M
# SALES $20M+
1Q 2021 342 793,551,755 1,412,500 13 105 100 76 23 21 1 3
CHANGE +40% +25.51% +13.00% -50% +33% +67% +105% +44% +62% -90% -
1Q 2020 244 632,257,397 1,250,000 26 79 60 37 16 13 10 3
To view all reports visit: https://www.townandcountryhamptons.com/market-reportsAll information is deemed reliable and correct. Information is subject to errors, omissions and withdrawal without prior notice. (Source: The Real Estate Report Inc.)
EAST HAMPTON BRIDGEHAMPTON SOUTHAMPTON WESTHAMPTON BEACH MONTAUK MATTITUCK GREENPORT TOWNANDCOUNTRYHAMPTONS.COM

HAMPTONS 1Q 2021HOME SALES REPORT
TOTAL # OF HOME SALES
MEDIAN HOME SALES PRICE
To view all reports visit: https://www.townandcountryhamptons.com/market-reportsAll information is deemed reliable and correct. Information is subject to errors, omissions and withdrawal without prior notice. (Source: The Real Estate Report Inc.)
EAST HAMPTON BRIDGEHAMPTON SOUTHAMPTON WESTHAMPTON BEACH MONTAUK MATTITUCK GREENPORT TOWNANDCOUNTRYHAMPTONS.COM
$0
$200,000
$400,000
$600,000
$800,000
$1,000,000
$1,200,000
$1,400,000
$1,600,000
q1 median home sales price
0
100
200
300
400
500
600
q1 total # of home sales
0
50
100
150
200
250
300
350
400
450
500
q1 hamptons home sales at each price point
# Sales $20M+
# Sales #10M - $19.99M
# Sales $5M - $9.99M
# Sales $3.5M - $4.99M
# Sales $2M - $3.49M
# Sales $1M - $1.99M
# Sales $501K - $999K
# Sales Under $500K
SALES TRENDS

HAMPTONS 1Q 2021HOME SALES REPORT
AM
AG
AN
SETT
# OF HOME SALES
TOTAL HOME SALES
VOLUME
MEDIAN HOME
SALES PRICE
# SALES UNDER $500K
# SALES $500K - $999K
# SALES $1M -
$1.99M
# SALES $2M -
$3.49M
# SALES $3.5M - $4.99M
# SALES $5M -
$9.99M
# SALES #10M -
$19.99M
# SALES $20M+
1Q 2021 10 34,325,000 2,037,500 - 1 4 2 1 2 - -
CHANGE +11% +4.00% -41.79% - - +33% +100% -67% - - -
1Q 2020 9 33,005,000 3,500,000 - - 3 1 3 2 - -
THE END“In Montauk, both the Total Home Sales Volume and Median Home Sales Price rose greater than 55% with only an 8% increase in the Number of Home Sales. Glancing over at the 8 different price ranges monitored by Town & Country and you note a 500% increase in the Number of Home Sales in the $2M-$3.49M price range. That certainly moves the needle. Amagansett real-ized a 42% drop in Median Home Sales Price, obviously due to less home sales at the higher end. When we consider the 8 different price ranges monitored by Town & Country you see a 67% drop in home sales in the $3.5M-$4.99M range.”
Judi Desiderio, CEO | [email protected] | 631.324.8080
MO
NTA
UK
# OF HOME SALES
TOTAL HOME SALES
VOLUME
MEDIAN HOME
SALES PRICE
# SALES UNDER $500K
# SALES $500K - $999K
# SALES $1M -
$1.99M
# SALES $2M -
$3.49M
# SALES $3.5M - $4.99M
# SALES $5M -
$9.99M
# SALES #10M -
$19.99M
# SALES $20M+
1Q 2021 14 37,249,500 2,111,250 - 2 4 6 1 1 - -
CHANGE +8% +55.59% +57.56% -100% -33% -43% +500% - - - -
1Q 2020 13 23,940,888 1,340,000 1 3 7 1 - 1 - -
$5,250,000Web# 872927
To view all reports visit: https://www.townandcountryhamptons.com/market-reportsAll information is deemed reliable and correct. Information is subject to errors, omissions and withdrawal without prior notice. (Source: The Real Estate Report Inc.)
EAST HAMPTON BRIDGEHAMPTON SOUTHAMPTON WESTHAMPTON BEACH MONTAUK MATTITUCK GREENPORT TOWNANDCOUNTRYHAMPTONS.COM

HAMPTONS 1Q 2021HOME SALES REPORT
EAST
HA
MPT
ON
V
ILLA
GE
# OF HOME SALES
TOTAL HOME SALES
VOLUME
MEDIAN HOME
SALES PRICE
# SALES UNDER $500K
# SALES $500K - $999K
# SALES $1M -
$1.99M
# SALES $2M -
$3.49M
# SALES $3.5M - $4.99M
# SALES $5M -
$9.99M
# SALES #10M -
$19.99M
# SALES $20M+
1Q 2021 13 102,643,767 3,850,000 - 2 3 1 3 3 - 1
CHANGE +63% +172.63% +5.12% - - - -75% +200% +50% -100% -
1Q 2020 8 37,650,018 3,662,509 - - - 4 1 2 1 -
EAST
HA
MPT
ON
ARE
AIN
CLU
DES
WA
INSC
OTT
# OF HOME SALES
TOTAL HOME SALES
VOLUME
MEDIAN HOME
SALES PRICE
# SALES UNDER $500K
# SALES $500K - $999K
# SALES $1M -
$1.99M
# SALES $2M -
$3.49M
# SALES $3.5M - $4.99M
# SALES $5M -
$9.99M
# SALES #10M -
$19.99M
# SALES $20M+
1Q 2021 81 137,931,000 1,300,000 - 27 31 19 2 2 - -
CHANGE +53% +105.61% +42.86% -100% +13% +72% +375% +100% +100% - -
1Q 2020 53 67,085,052 910,000 5 24 18 4 1 1 - -
EAST HAMPTON“The East Hampton Area, which includes Wainscott, closed the greatest Number of Home Sales at 81 home sales in the first three months of 2021. More than a 53% increase from the prior year. Nine of the twelve markets within the Hamptons saw their Total Home Sales Volume swell. In fact, three markets logged in more than 100% year over year increase, with East Hampton Village taking home the crown at 173% greater Total Home Sales Volume. East Hampton Village also scored Top Producer with a Median Homes Sale price of $3,850,000.”
Judi Desiderio, CEO | [email protected] | 631.324.8080
$4,550,000Web# 872738
To view all reports visit: https://www.townandcountryhamptons.com/market-reportsAll information is deemed reliable and correct. Information is subject to errors, omissions and withdrawal without prior notice. (Source: The Real Estate Report Inc.)
EAST HAMPTON BRIDGEHAMPTON SOUTHAMPTON WESTHAMPTON BEACH MONTAUK MATTITUCK GREENPORT TOWNANDCOUNTRYHAMPTONS.COM

HAMPTONS 1Q 2021HOME SALES REPORTSO
UTH
AM
PTO
N A
REA
INC
LUD
ES N
ORT
H S
EA
# OF HOME SALES
TOTAL HOME SALES
VOLUME
MEDIAN HOME
SALES PRICE
# SALES UNDER $500K
# SALES $500K - $999K
# SALES $1M -
$1.99M
# SALES $2M -
$3.49M
# SALES $3.5M - $4.99M
# SALES $5M -
$9.99M
# SALES #10M -
$19.99M
# SALES $20M+
1Q 2021 32 62,586,658 1,498,125 1 9 12 6 2 2 - -
CHANGE +23% +72.27% +74.96% -50% -31% +200% - +100% - - -
1Q 2020 26 36,331,300 856,250 2 13 4 6 1 - - -
SOU
THA
MPT
ON
V
ILLA
GE
# OF HOME SALES
TOTAL HOME SALES
VOLUME
MEDIAN HOME
SALES PRICE
# SALES UNDER $500K
# SALES $500K - $999K
# SALES $1M -
$1.99M
# SALES $2M -
$3.49M
# SALES $3.5M - $4.99M
# SALES $5M -
$9.99M
# SALES #10M -
$19.99M
# SALES $20M+
1Q 2021 18 58,976,250 1,963,125 1 2 6 5 1 2 - 1
CHANGE +64% -58.82% -71.96% - - +500% +67% - +100% -100% -67%
1Q 2020 11 143,211,960 7,000,000 1 - 1 3 - 1 2 3
SOUTHAMPTON“The Southampton Area, which includes North Sea, experienced a considerable uptick in higher priced homes. Notably, there were two sales $5M-$9.99M in 2021 where there were none the prior year. There was also a 200% increase in home sales in the $1M-$1.99M price range -- from 4 in 2020 up to 12 in 2021. This increase in higher end home sales is reflected in the increase in Median Home Sales Price (+75%) and Total Home Sales Volume (+72%). Southampton Village had declines of 59% in Total Home Sales Volume and 72% for Median Home Sales Price. Back in the first quarter 2020, Southampton Village broke a record with a Median Home Sales Price of $7M, but even taking that off the table, the Village ordinarily scores a Median Home Sales Price in step with East Hampton Village and Bridgehampton, which includes Water Mill and Sagaponack, both of which were well over $3M.”
Judi Desiderio, CEO | [email protected] | 631.324.8080
$4,699,999Web# 874020
To view all reports visit: https://www.townandcountryhamptons.com/market-reportsAll information is deemed reliable and correct. Information is subject to errors, omissions and withdrawal without prior notice. (Source: The Real Estate Report Inc.)
EAST HAMPTON BRIDGEHAMPTON SOUTHAMPTON WESTHAMPTON BEACH MONTAUK MATTITUCK GREENPORT TOWNANDCOUNTRYHAMPTONS.COM

HAMPTONS 1Q 2021HOME SALES REPORT
BRIDGEHAMPTON & SHELTER ISLAND“Bridgehampton, which includes Water Mill and Sagaponack, saw a whopping $168,155,188 trade hands in home sales — impressive. Shelter Island closed 11 deals in the first quarter of 2021, 57% more than the same time period in 2020. But the Total Home Sales Volume dipped 13.4% and the Median Home Sales Price decreased 3%. There were no sales $3.5M and up for the entire quarter on Shelter Island.”
Judi Desiderio, CEO | [email protected] | 631.324.8080
BRID
GEH
AM
PTO
NIN
CLU
DES
WA
TER
MIL
L &
SA
GA
PON
AC
K
# OF HOME SALES
TOTAL HOME SALES
VOLUME
MEDIAN HOME
SALES PRICE
# SALES UNDER $500K
# SALES $500K - $999K
# SALES $1M -
$1.99M
# SALES $2M -
$3.49M
# SALES $3.5M - $4.99M
# SALES $5M -
$9.99M
# SALES #10M -
$19.99M
# SALES $20M+
1Q 2021 37 168,155,188 3,500,000 - 1 4 13 10 7 1 1
CHANGE +61% +30.57% -1.27% - - -20% +160% +233% +75% -80% -
1Q 2020 23 128,785,690 3,545,000 - 1 5 5 3 4 5 -
SHEL
TER
ISLA
ND
# OF HOME SALES
TOTAL HOME SALES
VOLUME
MEDIAN HOME
SALES PRICE
# SALES UNDER $500K
# SALES $500K - $999K
# SALES $1M -
$1.99M
# SALES $2M -
$3.49M
# SALES $3.5M - $4.99M
# SALES $5M -
$9.99M
# SALES #10M -
$19.99M
# SALES $20M+
1Q 2021 11 14,656,250 795,000 - 7 1 3 - - - -
CHANGE +57% -13.44% -2.93% - +75% - +200% - - -100% -
1Q 2020 7 16,932,500 819,000 - 4 1 1 - - 1 -
$15,9500,000 Web# 873656
To view all reports visit: https://www.townandcountryhamptons.com/market-reportsAll information is deemed reliable and correct. Information is subject to errors, omissions and withdrawal without prior notice. (Source: The Real Estate Report Inc.)
EAST HAMPTON BRIDGEHAMPTON SOUTHAMPTON WESTHAMPTON BEACH MONTAUK MATTITUCK GREENPORT TOWNANDCOUNTRYHAMPTONS.COM

HAMPTONS 1Q 2021HOME SALES REPORT
SAG
HA
RBO
R A
REA
INC
LUD
ES N
OYA
CK
& N
ORT
H H
AVEN # OF
HOME SALES
TOTAL HOME SALES
VOLUME
MEDIAN HOME
SALES PRICE
# SALES UNDER $500K
# SALES $500K - $999K
# SALES $1M -
$1.99M
# SALES $2M -
$3.49M
# SALES $3.5M - $4.99M
# SALES $5M -
$9.99M
# SALES #10M -
$19.99M
# SALES $20M+
1Q 2021 21 47,994,049 1,835,000 - 6 5 7 1 2 - -
CHANGE - -1.75% +46.80% - -14% -44% +250% - - -100% -
1Q 2020 21 48,846,992 1,250,000 - 7 9 2 - 2 1 -
SAG
HA
RBO
R V
ILLA
GE
# OF HOME SALES
TOTAL HOME SALES
VOLUME
MEDIAN HOME
SALES PRICE
# SALES UNDER $500K
# SALES $500K - $999K
# SALES $1M -
$1.99M
# SALES $2M -
$3.49M
# SALES $3.5M - $4.99M
# SALES $5M -
$9.99M
# SALES #10M -
$19.99M
# SALES $20M+
1Q 2021 12 29,193,000 2,349,000 - - 4 7 1 - - -
CHANGE +71% +118.32% +40.24% - -100% +100% +250% - - - -
1Q 2020 7 13,371,679 1,675,000 - 2 2 2 1 - - -
SAG HARBOR“Nearly every market monitored by Town & Country saw an increase in the Number of Home Sales, except the Sag Harbor Area, which includes Noyack and North Haven, which was flat at 21. Sag Harbor Village, on the other hand, had the greatest statistical increase at 71% comparing Q1 2020 to Q1 2021.”
Judi Desiderio, CEO | [email protected] | 631.324.8080
$3,000,000Web# 871264
To view all reports visit: https://www.townandcountryhamptons.com/market-reportsAll information is deemed reliable and correct. Information is subject to errors, omissions and withdrawal without prior notice. (Source: The Real Estate Report Inc.)
EAST HAMPTON BRIDGEHAMPTON SOUTHAMPTON WESTHAMPTON BEACH MONTAUK MATTITUCK GREENPORT TOWNANDCOUNTRYHAMPTONS.COM
HAMPTONS 1Q 2021HOME SALES REPORT
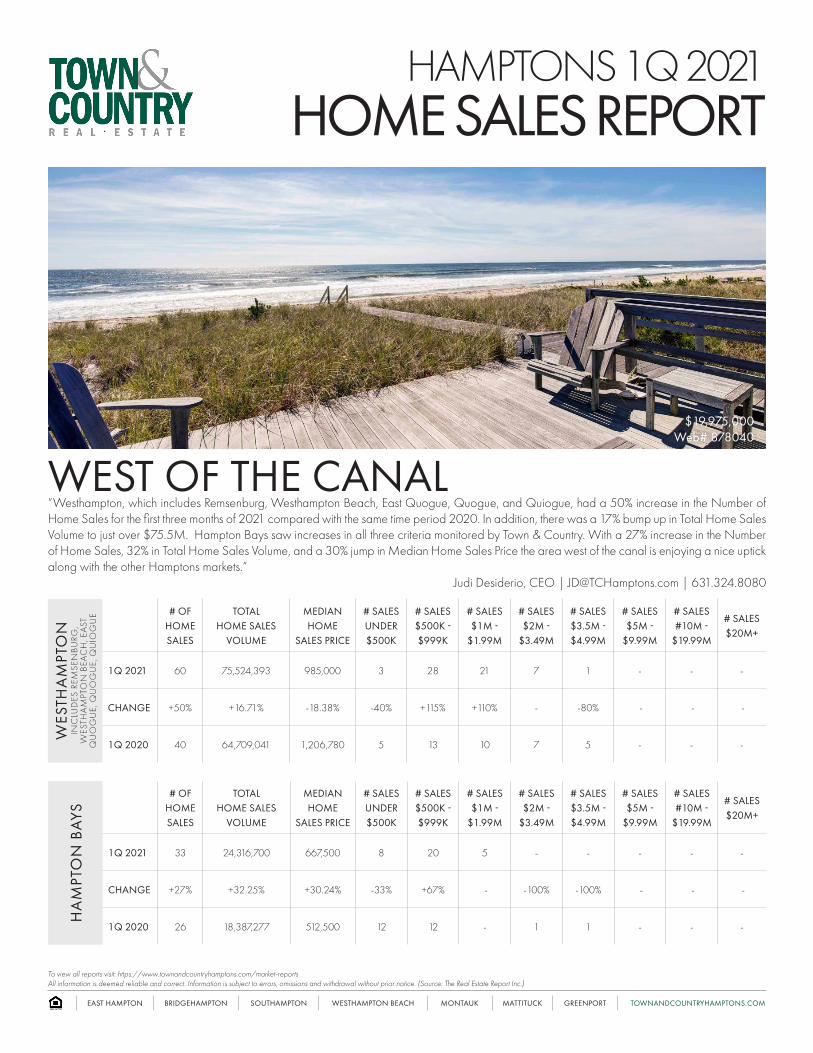
WES
THA
MPT
ON
INC
LUD
ES R
EMSE
NB
URG
, W
ESTH
AM
PTO
N B
EAC
H, E
AST
Q
UO
GU
E, Q
UO
GU
E, Q
UIO
GU
E # OF HOME SALES
TOTAL HOME SALES
VOLUME
MEDIAN HOME
SALES PRICE
# SALES UNDER $500K
# SALES $500K - $999K
# SALES $1M -
$1.99M
# SALES $2M -
$3.49M
# SALES $3.5M - $4.99M
# SALES $5M -
$9.99M
# SALES #10M -
$19.99M
# SALES $20M+
1Q 2021 60 75,524,393 985,000 3 28 21 7 1 - - -
CHANGE +50% +16.71% -18.38% -40% +115% +110% - -80% - - -
1Q 2020 40 64,709,041 1,206,780 5 13 10 7 5 - - -
HA
MPT
ON
BA
YS
# OF HOME SALES
TOTAL HOME SALES
VOLUME
MEDIAN HOME
SALES PRICE
# SALES UNDER $500K
# SALES $500K - $999K
# SALES $1M -
$1.99M
# SALES $2M -
$3.49M
# SALES $3.5M - $4.99M
# SALES $5M -
$9.99M
# SALES #10M -
$19.99M
# SALES $20M+
1Q 2021 33 24,316,700 667,500 8 20 5 - - - - -
CHANGE +27% +32.25% +30.24% -33% +67% - -100% -100% - - -
1Q 2020 26 18,387,277 512,500 12 12 - 1 1 - - -
WEST OF THE CANAL“Westhampton, which includes Remsenburg, Westhampton Beach, East Quogue, Quogue, and Quiogue, had a 50% increase in the Number of Home Sales for the first three months of 2021 compared with the same time period 2020. In addition, there was a 17% bump up in Total Home Sales Volume to just over $75.5M. Hampton Bays saw increases in all three criteria monitored by Town & Country. With a 27% increase in the Number of Home Sales, 32% in Total Home Sales Volume, and a 30% jump in Median Home Sales Price the area west of the canal is enjoying a nice uptick along with the other Hamptons markets.”
Judi Desiderio, CEO | [email protected] | 631.324.8080
$19,975,000Web# 878040
To view all reports visit: https://www.townandcountryhamptons.com/market-reportsAll information is deemed reliable and correct. Information is subject to errors, omissions and withdrawal without prior notice. (Source: The Real Estate Report Inc.)
EAST HAMPTON BRIDGEHAMPTON SOUTHAMPTON WESTHAMPTON BEACH MONTAUK MATTITUCK GREENPORT TOWNANDCOUNTRYHAMPTONS.COM