hampshire county council statement of accounts 2011/12
TRANSCRIPT

Hampshire County Council Statement of Accounts 2011/12
Contents Page 2 Summary Statement of Accounts 5 Explanatory Foreword 11 Annual Governance Statement 35 Statement of Responsibilities for the Statement of Accounts 36 Independent Auditor’s Report to the Members of Hampshire County
Council 41 Movement in Reserves Statement 43 Comprehensive Income and Expenditure Statement 45 Balance Sheet 47 Cash Flow Statement 48 Notes to the Core Financial Statements 138 Pension Fund Accounts 140 Notes to the Pension Fund Accounts 175 Glossary Contact Details For further copies of this report or questions about it, please contact: The Director of Corporate Resources Hampshire County Council, The Castle, Winchester, Hampshire, SO23 8UB Telephone (01962) 847519 Email [email protected] For a large-print version of this report please phone (01962) 847519 You may also request Braille, audio cassette and other language versions. For general enquiries about Hampshire County Council: Telephone 0845 603 5638* Textphone 0845 603 5625* E-mail [email protected] Calls to 0845 numbers are free on some BT call plans but will cost between 4p (local rate) and 6p (national rate) per minute for BT customers not on a plan. Calls made using other service providers or mobiles may cost more. Alternatively call 01329 225398 - standard and local call rates may apply to this number
1
Summary Statement of Accounts
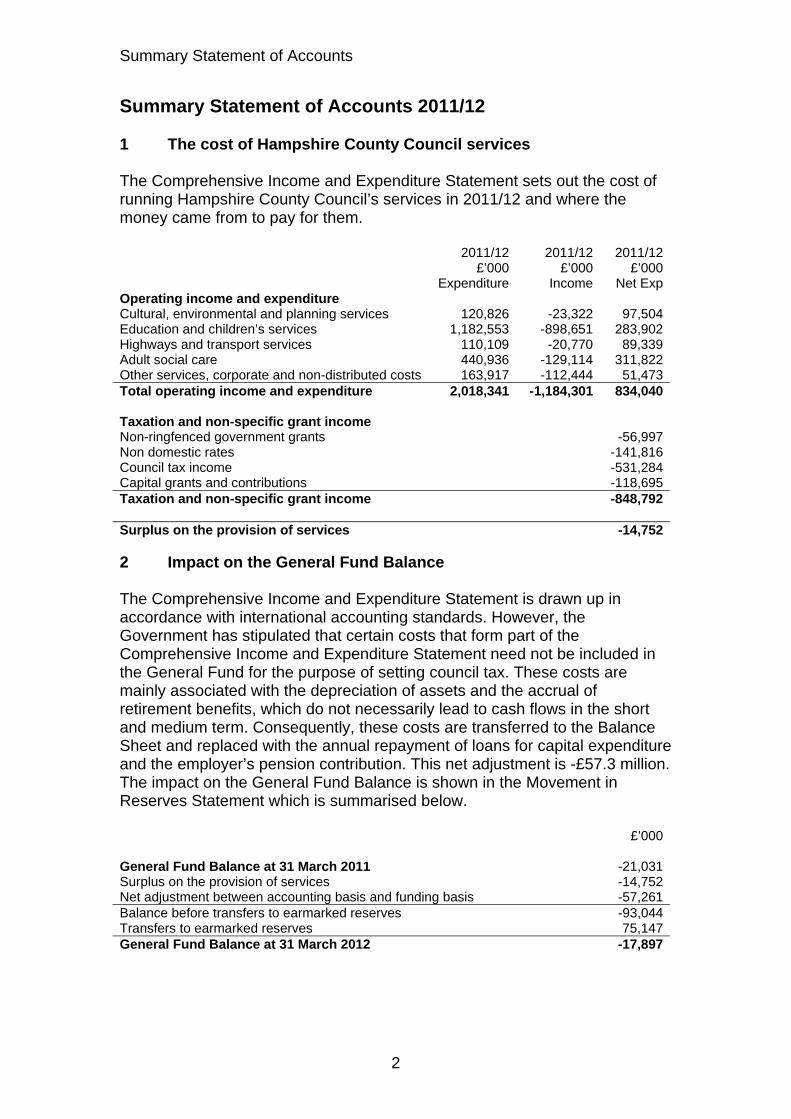
Summary Statement of Accounts 2011/12 1 The cost of Hampshire County Council services The Comprehensive Income and Expenditure Statement sets out the cost of running Hampshire County Council’s services in 2011/12 and where the money came from to pay for them. 2011/12 2011/12 2011/12 £’000 £’000 £’000 Expenditure Income Net ExpOperating income and expenditure Cultural, environmental and planning services 120,826 -23,322 97,504Education and children’s services 1,182,553 -898,651 283,902Highways and transport services 110,109 -20,770 89,339Adult social care 440,936 -129,114 311,822Other services, corporate and non-distributed costs 163,917 -112,444 51,473Total operating income and expenditure 2,018,341 -1,184,301 834,040 Taxation and non-specific grant income Non-ringfenced government grants -56,997Non domestic rates -141,816Council tax income -531,284Capital grants and contributions -118,695Taxation and non-specific grant income -848,792 Surplus on the provision of services -14,752 2 Impact on the General Fund Balance The Comprehensive Income and Expenditure Statement is drawn up in accordance with international accounting standards. However, the Government has stipulated that certain costs that form part of the Comprehensive Income and Expenditure Statement need not be included in the General Fund for the purpose of setting council tax. These costs are mainly associated with the depreciation of assets and the accrual of retirement benefits, which do not necessarily lead to cash flows in the short and medium term. Consequently, these costs are transferred to the Balance Sheet and replaced with the annual repayment of loans for capital expenditure and the employer’s pension contribution. This net adjustment is -£57.3 million. The impact on the General Fund Balance is shown in the Movement in Reserves Statement which is summarised below. £’000 General Fund Balance at 31 March 2011 -21,031Surplus on the provision of services -14,752Net adjustment between accounting basis and funding basis -57,261Balance before transfers to earmarked reserves -93,044Transfers to earmarked reserves 75,147General Fund Balance at 31 March 2012 -17,897
2
Summary Statement of Accounts
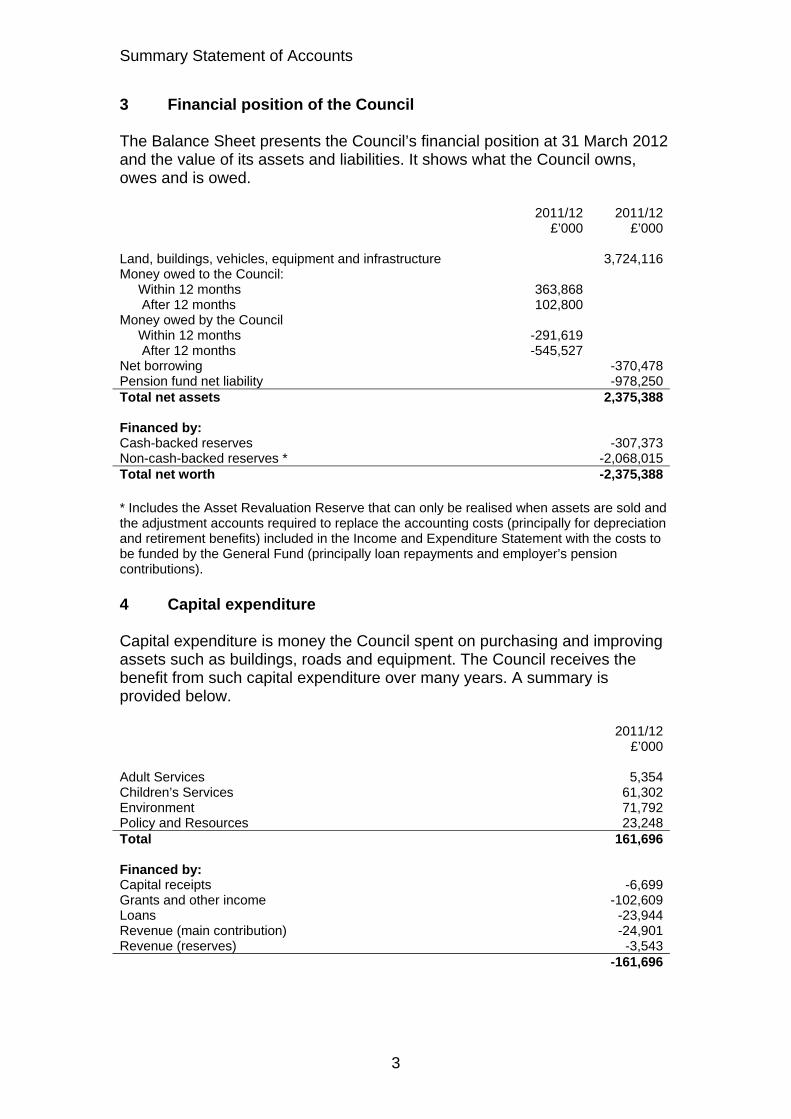
3 Financial position of the Council The Balance Sheet presents the Council’s financial position at 31 March 2012 and the value of its assets and liabilities. It shows what the Council owns, owes and is owed. 2011/12 2011/12 £’000 £’000 Land, buildings, vehicles, equipment and infrastructure 3,724,116Money owed to the Council: Within 12 months 363,868 After 12 months 102,800 Money owed by the Council Within 12 months -291,619 After 12 months -545,527 Net borrowing -370,478Pension fund net liability -978,250Total net assets 2,375,388 Financed by: Cash-backed reserves -307,373Non-cash-backed reserves * -2,068,015Total net worth -2,375,388 * Includes the Asset Revaluation Reserve that can only be realised when assets are sold and the adjustment accounts required to replace the accounting costs (principally for depreciation and retirement benefits) included in the Income and Expenditure Statement with the costs to be funded by the General Fund (principally loan repayments and employer’s pension contributions). 4 Capital expenditure Capital expenditure is money the Council spent on purchasing and improving assets such as buildings, roads and equipment. The Council receives the benefit from such capital expenditure over many years. A summary is provided below. 2011/12 £’000 Adult Services 5,354Children’s Services 61,302Environment 71,792Policy and Resources 23,248Total 161,696 Financed by: Capital receipts -6,699Grants and other income -102,609Loans -23,944Revenue (main contribution) -24,901Revenue (reserves) -3,543 -161,696
3

Summary Statement of Accounts
4
5 Pension Fund
The County Council administers the Pension Fund that is open to all non-teaching employees of Hampshire County Council, Portsmouth and Southampton City Councils and the 11 district councils in Hampshire and a range of other scheduled and admission bodies. A summary of the pension fund accounts is given below. 2011/12 £’000 Pension contributions 228,540Transfers in from other pension funds 31,388Benefits paid -201,410Payments to and on account of leavers -9,963Administrative expenses -2,632Net additions from dealings with members and employers 45,923 Returns on investments 182,739Investment management expenses and taxes on income -9,841 Increase in the net assets available for benefits during the year 218,821Add opening net assets of the Fund 3,558,420Closing net assets of the Fund 3,777,241

Explanatory Foreword
Explanatory Foreword 1 Introduction This document contains Hampshire County Council’s Statement of Accounts for the year ended 31 March 2012. The pattern of presentation of the statement is laid down by a code of practice, which the County Council is legally required to follow. This foreword gives: a summary of the various statements that make up the County Council’s
2011/12 accounts a broad picture of where the money comes from and what it is spent on a summary of revenue expenditure on services and capital expenditure on
new assets over the course of the year. 2 Summary of Statement of Accounts The accounts for 2011/12 are set out on pages 35 to 174. They consist of: Statement of Responsibilities for the Statement of Accounts Movement in Reserves Statement – analyses the change in net worth
between the General Fund, other useable reserves and unusable reserves Comprehensive Income and Expenditure Statement – shows the
accounting cost in the year of providing services measured in accordance with international accounting standards rather than on the basis of the costs that are required to be financed from taxation
Balance Sheet – this sets out assets and liabilities at 31 March 2012 compared with 31 March 2011
Cash Flow Statement – this summarises the movement in cash and cash equivalents during the course of the year
Notes to the Accounts – which explain some of the key items and disclosures in the accounts
Pension Fund Accounts - these are the accounts of the Pension Fund, which is operated for employees of the County Council, Hampshire unitary and district councils and other bodies.
3 Where the money comes from Since the introduction of the new schools funding arrangements in 2006/07, most of the County Council’s income comes from the Dedicated Schools Grant, general government grants and the council tax. Fees and charges contribute to the cost of some services and interest is earned on day-to-day balances. Government grant and external contributions applied to finance capital expenditure have been excluded from the table below.
5
Explanatory Foreword
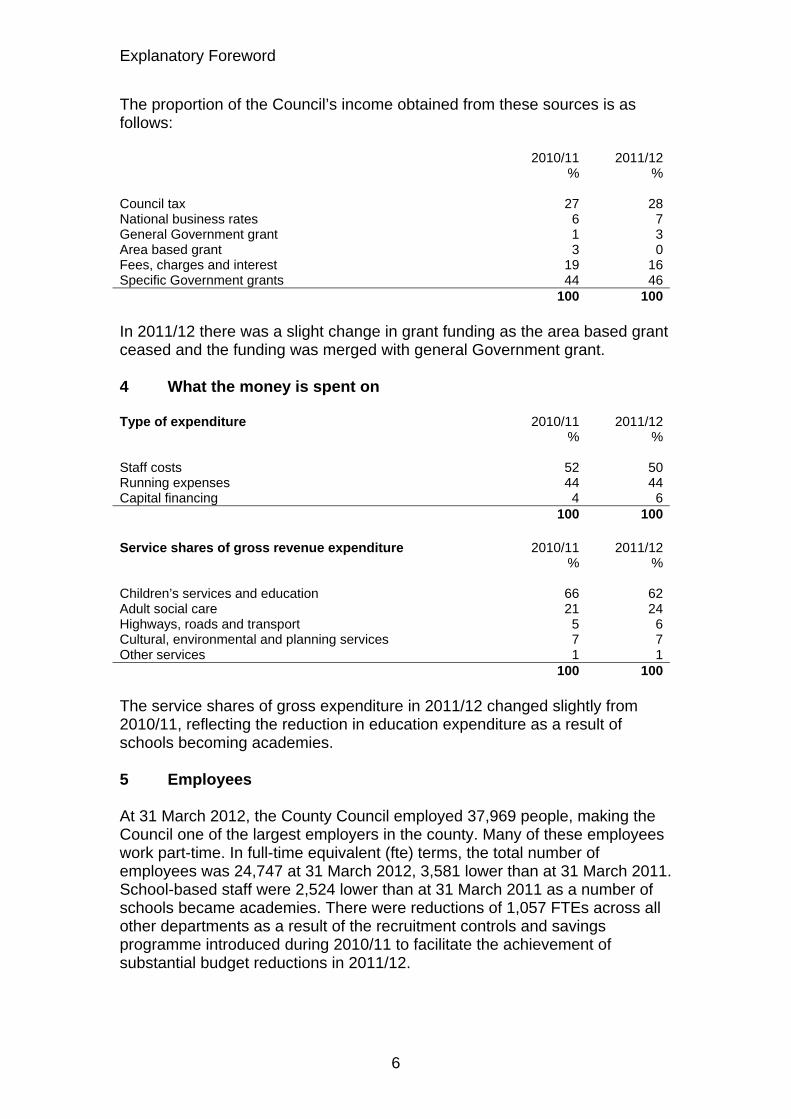
The proportion of the Council’s income obtained from these sources is as follows: 2010/11
% 2011/12
% Council tax 27 28National business rates 6 7General Government grant 1 3Area based grant 3 0Fees, charges and interest 19 16Specific Government grants 44 46 100 100 In 2011/12 there was a slight change in grant funding as the area based grant ceased and the funding was merged with general Government grant. 4 What the money is spent on Type of expenditure 2010/11
% 2011/12
% Staff costs 52 50Running expenses 44 44Capital financing 4 6 100 100 Service shares of gross revenue expenditure 2010/11
% 2011/12
% Children’s services and education 66 62Adult social care 21 24Highways, roads and transport 5 6Cultural, environmental and planning services 7 7Other services 1 1 100 100 The service shares of gross expenditure in 2011/12 changed slightly from 2010/11, reflecting the reduction in education expenditure as a result of schools becoming academies. 5 Employees At 31 March 2012, the County Council employed 37,969 people, making the Council one of the largest employers in the county. Many of these employees work part-time. In full-time equivalent (fte) terms, the total number of employees was 24,747 at 31 March 2012, 3,581 lower than at 31 March 2011. School-based staff were 2,524 lower than at 31 March 2011 as a number of schools became academies. There were reductions of 1,057 FTEs across all other departments as a result of the recruitment controls and savings programme introduced during 2010/11 to facilitate the achievement of substantial budget reductions in 2011/12.
6

Explanatory Foreword
Full-time equivalent employees March 2011
March 2012
School-based 17,627 15,103Other children’s services 2,893 2,606Adult Services 3,198 2,774Economy, Environment and Transport 773 672Culture, Communities and Business Services 2,838 2,641Central services 999 951 28,328 24,747
6 Summary of the year – Revenue account The financial year 2011/12 was the first year of the significantly reduced grant settlement announced in October 2010. The emergency budget in June 2010 had indicated that significant reductions in Government grant were likely to be required to eliminate the structural deficit within the public finances and the County Council’s medium term financial strategy took this into account. The scale of reduction was confirmed in October 2010 as a reduction of 28.8% in formula grant in real terms over the period 2011/12 to 2014/15 and was ‘frontloaded’ with a reduction of 20% to take place in the first two years. As a floor authority, the County Council expected a maximum reduction in Government grant. The reduction for 2011/12 was 14.3% followed by a reduction of 10.4% in 2012/13. The budget requirement for 2011/12 was set at £715.6million, which was £26.3m (3.5%) below the adjusted 2010/11 budget. This reflected the reduction in Government grant and enabled the council tax to be frozen at its 2010/11 level allowing the County Council to claim a Government council tax freeze grant of £13.2 million. It also planned to use £3.1m of general reserves and working balances. A budget at this level included unavoidable increases in expenditure from inflation and social care demographic pressures and allowed for other risk contingencies and also included an ambitious cost reduction and efficiency programme to realise savings of £55 million representing a reduction of 8% in service budgets. The Council has continued to demonstrate strong financial stewardship over this extremely challenging period achieving additional savings than planned for the year. This reflects the continuing financial strategy of achieving savings in the early part of the four year grant settlement period, which can then be used to meet the cost of change and invest to save or transformational projects in future years. At the end of 2011/12, service net expenditure was £13.7m lower than budgeted and in accordance with the financial management policy has been transferred to the designated under spending earmarked reserve. Further savings of £8.7m were achieved largely as a result of improved treasury management activity and unused contingencies relating to waste management, concessionary fares, adult social care and other risks. This has been transferred to the capital payments reserve. Other variations are offset by transfers to and from reserves.
7

Explanatory Foreword
General Balances at 31 March 2012 are £17.9m as set out in the February 2012 budget after allowing for the budgeted 2011/12 contribution from balances of £3.1m. This represents 2.5% of the County Council’s Budget Requirement in line with the current policy. This movement in the General Fund balance is shown in the table below. The presentation follows the format of the statement of accounts, which is different to that used for setting the budget. For example, the cost of services includes items that are not managed as part of service budgets; a reconciliation of actual income and expenditure for these is included in note 19 to the accounts.
Original budget
Revised budget
Actual Variation from
revised
Budget
£million £million £million £millionCost of services 853.9 820.9 798.3 -22.6 (Surpluses)/deficits on trading units 1.7 0.7 -0.4 -1.1Net interest payable and investment property income
- 23.4 20.8 -2.6
Investment property gains/losses - -0.8 -0.8 -Loss/(gain) on disposal of assets - -3.7 -3.7 - Pension interest cost and expected return on pensions assets
19.8
19.8 19.8
-
Net operating and financing expenditure 875.4 860.3 834.0 -26.3 Amount to be met from non-specific Government grant and local taxpayers
Council tax precept income -529.9 -531.3 -531.3 -General Government grant (including Area Based Grant)
-57.0 -57.0 -57.0 -
Non-domestic rates -141.8 -141.8 -141.8 -Capital grants and contributions -74.1 -83.7 -118.7 -35.0 -802.8 -813.8 -848.8 -35.0 (Surplus)/Deficit on the provision of services
72.6 46.5 -14.8
-61.3
Adjustments between accounting and funding basis under regulations
Contribution to capital 63.2 51.2 46.1 -5.1Excess of depreciation, impairment net of grant over statutory provision for debt repayment
-88.0 -112.9 -112.9
-
Actuarial loss on pension fund assets and liabilities
- 226.0 226.0 -
Contribution to pensions reserve -51.4 -224.3 -224.3 -Net cost of soft loans, reversal of disposal gain, collection fund and compensated absences adjustment
- 7.9 7.9
-
Contribution to/(from) earmarked reserves 6.7 8.7 75.1 66.4Movement in General Fund Balance 3.1 3.1 3.1 - General Fund Balance Brought forward 1 April 2011 21.0 21.0 21.0 -Carried forward 31 March 2012 17.9 17.9 17.9 -
8
Explanatory Foreword
7 Summary of the year – capital expenditure In 2011/12 the County Council spent £161.7 million on capital projects, £4.9 million less than the revised budget. Capital receipts of £7.8 million were received. This was lower than the estimate of £37.2 million primarily because the disposal of land in Basingstoke is now expected to be completed in 2012/13. Capital expenditure has been funded by Government capital grant together with contributions from developers and outside agencies and available capital receipts. Funding from these sources totalled £124.4 million. In accordance with the agreed criteria for the use of borrowing, new loans totalling £18.7 million were taken out. Adding planned revenue contributions to capital of £59.8 million gave a total of £202.9 million. This has allowed £9.9 million of prudential borrowing to be repaid and a transfer of £31.3 million to reserves to fund future capital expenditure. Potential outstanding borrowing for capital purposes to be serviced by the County Council now amounts to £683.7 million at 31 March 2012, together with extra debt of £36.3 million for services transferred to the unitary and other authorities. The Council may borrow on a day-to-day basis from internal resources, such as the revenue account and earmarked reserve balances. Internal resources were higher in 2011/12 than in the previous year, so that net of temporary investments, £212.2 million (a reduction of £72.1 million on the previous year) was owed to external lenders at 31 March 2012. 8 Pension Fund liability The County Council’s net pension liability has increased from £754 million at 31 March 2011 to £978.2 million at 31 March 2012. This overall actuarial loss arises partly because the actual return on assets was less than expected, but mainly because of changes in assumptions underlying the present value of pension liabilities, for example a lower discount rate. The loss is shown in the Comprehensive Income and Expenditure Statement and then transferred to the Pension Reserve and does not impact on the General Fund balance. 9 Changes There were no significant changes to the County Council’s range of functions in 2011/12, however during the year 23 schools became academies. This has resulted in a transfer of cash balances of £7.8 million. In addition building and furniture and equipment assets valued at £130 million and net pension liabilities of £6 million have been transferred. These transfers are not cash backed and increase the total deficit on the Comprehensive Income and Expenditure Statement by £124 million. This represents a movement in unusable reserves and there is no impact on the General Fund balance.
9

Explanatory Foreword
10
The 2011/12 Code of Practice on Local Authority Accounting introduced two main changes. These related to the requirement to identify heritage assets in the statement of accounts and to disclose details of exit packages paid to staff leaving the County Council. These are included as notes 10f and 23c respectively. 10 Further information You can get more information about the accounts from: The Director of Corporate Resources Hampshire County Council, The Castle, Winchester, SO23 8UB Telephone: (01962) 847519 E-mail: [email protected]

Annual Governance Statement
Annual Governance Statement for Hampshire County Council and Hampshire Pension Fund 1 Scope of responsibility Hampshire County Council is responsible for ensuring that: its business is conducted in accordance with the law and to proper
standards public money is safeguarded and properly accounted for, and used
economically, efficiently and effectively pursuant to the Local Government Act 1999 it secures continuous
improvements in the way in which its functions are exercised, having regard to a combination of efficiency, effectiveness and economy
there is a sound system of internal control which facilitates the effective exercise of the County Council's functions and which include arrangements for the management of risk.
The County Council has approved and adopted a code of corporate governance, which is consistent with the principles of the CIPFA/SOLACE Framework ‘Delivering Good Governance in Local Government’. A copy of the Code is available on the County Council’s website. These responsibilities also extend to the administration of the Hampshire Pension Fund, which is undertaken by the Pension Fund Panel. The Panel, which meets regularly, is comprised of County Councillors, representatives of Unitary and District Councils, pensioners and pension contributor’s representatives. The Panel is also advised by an external independent adviser. This Statement explains how the County Council has complied with the Code and meets with the requirements of the Accounts and Audit (England) Regulations 2011 in relation to the publication of an Annual Governance Statement during 2011-2012. 2 The purpose of Corporate Governance The governance framework comprises the systems and processes, and cultures and values, by which the County Council is directed and controlled and its activities through which it accounts to, engages with and leads the community. It enables the County Council to monitor the achievements of the County Council’s strategic objectives and to consider whether those objectives have led to the delivery of appropriate, cost effective services. The system of internal control is a significant part of the framework and is designed to manage risk to a reasonable level. It cannot eliminate all risk of failure to achieve policies, aims and objectives and can therefore only provide reasonable and not absolute assurance of effectiveness. The system of internal control is based on an ongoing process designed to identify and prioritise the risk to the achievement of the County Council’s policies, aims and objectives, to evaluate the likelihood of those risks being realised and the
11

Annual Governance Statement
impact should they be realised, and to manage them efficiently, effectively and economically. The governance framework has been in place at Hampshire County Council for the year ending 31 March 2012 and up to the date of approval of the annual report and the statement of accounts. One of the key elements of the Corporate Governance regime and the production of the Annual Governance Statement is the methodology applied to obtain the necessary assurance. This has included: a detailed questionnaire being sent every year to all Chief Officers consultation with other relevant Officers throughout the County Council. The questionnaires, which are revised and updated on each occasion, cover a wide range of Corporate Governance issues. They refer to the existence, knowledge and application within departments of governance policies generally, but also concentrate on specific issues which have been identified as having greater significance to the County Council. In line with the revised Internal Audit Strategy adopted by the County Council in December 2007, the key elements of the Corporate Governance framework are risk assessed and reviewed periodically by Internal Audit. The Internal Audit Team's work forms the basis of a report to the relevant Chief Officer or Key Corporate Manager for any follow up work necessary, and feeds into this Annual Governance Statement. Departmental Corporate Governance Questionnaires were sent out to Chief Officers in October 2011. 3 Establishing principal statutory obligations and organisational
objectives 3.1 Mechanism established to identify principal statutory obligations The County Council’s Constitution, adopted from 1 September 2001, sets out the processes by which the County Council’s policies are made and decisions taken. It sets out clearly the role of: the County Council the Leader Cabinet arrangements for the performance of regulatory functions arrangements for scrutiny the Standards Committee the role of the Audit Committee key roles of the Chief Officers and Statutory Officers. The Constitution also contains arrangements for the delegation of decision making to the above bodies and also to Chief Officers and others.
12

Annual Governance Statement
In addition, Appendices to the Constitution contain a range of Codes and Protocols including: rules on Financial Regulations rules on Contract Standing Orders Codes of Conduct for Members and Officers Protocol for Member/Officers relations. In order to ensure compliance with policies, procedures and statutory requirements the County Council has a range of controls and processes in place, as set out and reviewed below. These processes also help the County Council ensure the efficient, effective and economical use of resources, to secure continuous improvement in the exercise of its functions, and to provide effective performance management and reporting. The Audit Committee receives regular reports from both external and internal audit, and the minutes of the Audit Committee demonstrate that effective action is taken where issues of non-compliance have been identified. All County Council decisions are made in accordance with the County Council’s Decision Making Protocol (agreed in 2001). The Protocol requires all reports for decisions, whether by the Executive or by Committee to be submitted in advance for both legal and financial consideration. All reports are considered by appropriately qualified legal and finance staff with expertise in the particular function area. Legal staff have direct access to a well equipped library on site, and through the internet to the Lexis Nexis electronic legal information system. Processes and policies within Legal Services have also been quality assured through the award of Lexcel which is the Law Society's quality accreditation scheme, annually reviewed by external independent assessors, and also through Investors In People accreditation. All legal staff have access to training courses, and regular internal sessions are organised for the whole of Legal Services on topics of specific and general relevance to their roles and responsibilities. Senior lawyers within the service have regular meetings with Chief Officers and senior clients to assess performance, review future demands, and identify new legislative demands. An Officer group comprising the Monitoring Officer and representatives from Democratic and Member Services, Legal Services and the Policy and Performance Unit has been established to specifically monitor new legislation. The Legislation Implementation and Review Group meets quarterly and provides an effective mechanism for tracking new legislation and ensuring that the County Council is taking appropriate steps to implement it. During 2011-12 the group focused on the Localism Act, the Health and Social Care Act and the Police Reform and Social Responsibility Act. Hampshire Children's Services Department is formed in strict compliance with Children Act 2004 and revised Statutory Guidance on the Role of the Director of Children's Services and the Lead Member. This encompasses the lead role of the local authority as the principal agency in ensuring and coordinating
13

Annual Governance Statement
services for the protection of the most vulnerable children and the safeguarding of a broader group of children in need. This is conducted through internal operational activities especially with regard to Section 47 of the Children Act 1989. Hampshire County Council Adult Services approach to safeguarding is defined by the ‘No Secrets’ guidance (Department of Health 2000), which is issued under Section 7 of the Local Authority and Social Services Act 1970. Through this legislation, statutory health and social care organisations have a duty of partnership to work together to put in place services which act to prevent abuse of vulnerable adults, provide assessment and investigation of abuse and ensure people are given an opportunity to access justice. The ‘No Secrets’ guidance gives the Local Authority a leadership and co-ordination role to ensure that all those who provide services for our citizens work together to address the safeguarding agenda in Hampshire and this is fully recognised as a corporate responsibility. Adult Services are working closely with external partners through the Safeguarding Adults Board, which is chaired by the Director of Adult Services. In addition, work to focus all internal Hampshire County Council departments in relation to the broader safeguarding agenda, is being delivered through the Cross Departmental Safeguarding Group chaired by the Deputy Director of Children’s Services. The County Treasurer operates a system of Devolved Finance Units, each with a Head of Finance working closely with the relevant Chief Officer and reporting to the Deputy County Treasurer. The Head of Finance, County Treasurer and Deputy County Treasurer work together to ensure that both corporate and departmental financial perspectives are taken into account in all papers for decision, and attend meetings to advise further as appropriate. A clear process of escalation for major issues that arise is in place within the Department ensuring that strategic is sues are dealt with at the appropriate level. 3.2 Mechanism in place to identify principal organisational
obligations The County Council remains committed to the three overall priorities set out in the Corporate Strategy. These priorities are approved by Full Council; and are in place for the life of the administration. Priorities are clearly communicated on the County Council website and through various communications. A new Performance Management Framework was launched in 2011. As part of this, a new County Council Business Plan has been developed, identifying the medium term priorities for the organisation (aligned to the three overarching corporate priorities). The Open for Business Plan 2011-13 encompasses the efficiencies and expenditure reduction work streams; major change areas; and the main departmental priorities (e.g. safeguarding). Priorities are also informed through feedback from service users and
14

Annual Governance Statement
residents; outcome of inspection; performance benchmarking; and national policies and initiatives. The Plan contains actions across finance, workforce, performance and customer focus/communications – securing full integration. Activities and targets are drawn from work stream plans and department level business plans; and cascaded through service plans and Individual Performance Plans. Clear guidance for the preparation of department and service plans is available on Hantsnet; and this is currently being revised in line with the new Performance Management Framework. The Open for Business Plan 2011-13 has been approved by the Corporate Management Team (CMT) and Cabinet. Progress against the Plan is monitored on a quarterly basis, with an annual report providing a full evaluation of performance. Areas for improvement will be incorporated in a refresh of the Plan for 2012/13. The Open for Business Plan links to the following partnership plans, outlining the local authority contribution to these cross-cutting areas of work: Hampshire’s Children and Young People’s Plan, which is the overarching
strategy for services for children and young people in the county. The emerging Joint Health and Well-being Strategy, the strategy of
Hampshire’s Health and Well-being Board. Priorities are communicated internally and externally through integration with all communications activity. Business and Financial Planning take into account the service and budgetary impact of working with external partners. The County Council has recognised that this is an area of increasing risk for the future as partnerships expand and as greater reliance is placed on securing and maintaining partner contributions to support service provision. The 2012/13 budget contains separate contingency provision to reflect this risk and close financial planning is undertaken with key partners, particularly Health given the changes arising from the restructuring of the NHS and the move to Clinical Commissioning Groups (CCG’s). 3.3 Effective Corporate Governance arrangements are embedded
within the County Council The County Council adopted a Code of Corporate Governance that complies with the Chartered institute of Public Finance and Accountancy (CIPFA) and the Society of Local Authority Chief Executives and Senior managers (SOLACE) guidance at a meeting of the Governance Committee on 27 March 2008. The Monitoring Officer and the Chief Internal Auditor (for the Section 151 Officer) have close working relationships both between themselves, and with the Standards Committee, and the Audit Committee. An Officer Corporate Governance Group was establish in 2009. The group includes the Monitoring Officer, the Chief Internal Auditor and other officers
15
Annual Governance Statement
involved in corporate governance. The role of the groups is to support the work of the Audit Committee and its terms of reference include: review of the County Council’s Corporate Governance Framework participation in the preparation of the County Council’s Annual
Governance Statement review of the implementation of the Action Plan set out in the Annual
Governance Statement identification of actions to be included in the following year’s Action Plan. The Standards Committee has responsibility for maintaining high standards of probity amongst Members through the provision of advice and training and by carrying out investigations of complaints received. The Audit Committee has audit focused terms of reference and in accordance with CIPFA/SOLACE guidance the Chairman of the Audit Committee is not a member of the Executive. In addition no other members of the Audit Committee are members of the Executive. Responsibility for overseeing Corporate Governance is formally delegated and documented through the Constitution to the Audit Committee. The terms of reference for the Audit Committee are contained within the Constitution. Internal Audit is required to comply with the CIPFA Code of Practice for Internal Audit in Local Government in the UK 2006 and its prescribed professional standards. Assurance that these standards are met is provided through the annual review of the ‘Effectiveness of the System of Internal Audit’ and ISO quality accreditation. The Audit Committee approved the Internal Audit Strategy and Plan for 2011/2012 (March 2011) and continues to monitor performance and the progress of significant issues, including the implementation of management actions. This plan was based on a revised Internal Audit Strategy for 2011 to 2014, as approved by the Audit Committee at its meeting in December 2010. The Chief Internal Auditor submitted an Annual Audit Report and Opinion to the June 2012 Audit Committee on the effectiveness of the control framework. 3.4 Performance management arrangements are in place As outlined above, a new Performance Management Framework was launched in 2011, and it provides a robust and coherent way of managing and improving services across the organisation. It is based on a cycle of continuous improvement. Key components are as follows: (a) Planning: County Council priorities (the three corporate aims, as described above) County Council Business Plan (as described above)
16

Annual Governance Statement
(b) Doing: Department Business Plans (as described above) (c) Monitoring Monthly reporting on efficiencies Quarterly reporting on performance against the Open for Business Plan, to
CMT and Cabinet Annual departmental self-assessment County Council Annual Performance Report Transparent processes are in place for regular reporting to CMT and Cabinet. CMT are responsible for providing support and challenge, in order to management performance against the Open for Business Plan. In addition, departments have robust mechanisms for performance management. Performance management arrangements are enhanced by a thorough and fully embedded system of budget forecasting and monitoring which focuses on: annually updated three year budget projections and a three year capital
programme detailed quarterly budget monitoring reports on revenue and capital to the
relevant executive Member development of capital themes as part of the 2012/13 budget leading to
the corporate prioritisation of new capital investment of £244 million a risk based approach to budget monitoring ensuring that reduced
resources within the Treasurer’s Department are targeted to high risk areas
ability of Select Committees to scrutinise monitoring reports overall budget monitoring report to Cabinet on a quarterly basis. Performance information is published online and easily accessible for staff, partners and the public, together with transparency data which is compliant with the Government’s guidance. Children’s Services Department activities are governed by the operational structures and the Scheme of Delegations. They are controlled through a range of supervisory and quality assurance arrangements. They are validated through a range of performance data and particularly by the external inspection from Ofsted. The external responsibilities are governed through the oversight of the Hampshire Safeguarding Children Board (HSCB) which is independently chaired but reports back to the Children's Trust Board, the Corporate Management Team, the Lead Member and the respective executive arrangements of other statutory partners. The county wide Efficiency Cost Reduction and Transformation programme began in July 2010 and is the principal means by which the County Council is addressing its grant reduction and improving efficiency. The County Council
17
Annual Governance Statement
achieved savings of all but £2.5 million of the £55 million target in 2011-2012 and separate detailed monitoring was put in place reporting monthly to CMT, and then on to Cabinet in reports in the latter part of the year, ensuring high levels of focus and commitment to securing the savings that had been proposed. The shortfall was met from contingencies that had been put aside for that purpose. A further £45 million target is required for 2012-2013 and after the full year effect of 2011/12 savings have been taken into account, only £21.7m of new proposals are required to be implemented in 2012/13, as approved by Cabinet in February 2012. A similar arrangement for the monitoring of the achievement of savings during the year will continue for 2012/13. Forward financial planning for 2015/16 onwards has already begun in light of Government announcements about the prospects for a further difficult Comprehensive Spending Review in 2014. Changes in respect of the Local Government Resource Review, the transfer of Public Health, the localisation of Council Tax Benefits and other strategic financial issues are being reviewed constantly by the County Council in partnership with Hampshire District Councils, Chief Financial Officers and with colleagues in Health and other County Council’s. The financial reductions across the County Council led to a review of the central support functions of the County Council. The review considered how Corporate Services are organised, what they do, and how they do it. The primary purpose of this review was to create a modern business function providing integrated management capacity to a large democratic organisation capable of higher performance and lower cost than existing financial provision. The expectation is that implementation of the review will lead to significant cost reduction and greater effective integration whilst providing capacity and flexibility to support future initiatives such as shared and traded services. External consultants were engaged to ensure that the County Council considered the best options from both the public and private sectors. 4.1 Focusing on the purpose of the County Council and on outcomes
for the community and creating and implementing a vision for the local area
The County Council has a clear vision and purpose, articulated through the three priorities and the Open for Business Plan. The Plan (described above) provides a coherent, shared vision for the organisation. Implementation of these ambitions is through department business plans and efficiency/transformation work streams. The vision of the County Council, as embodied in the three priorities, is reviewed with each political administration. Open for Business priorities are expected to last three years, but are reviewed on an annual basis and refreshed as necessary.
18

Annual Governance Statement
Partnerships are underpinned by a common vision, that is understood and agreed by all partners. Clear governance structures are also in place. For example, the Hampshire Senate has brought together all key partners in Hampshire with five aims: to deliver the 2008-11 Local Area Agreement (now concluded); to bring people together to keep government as local as possible; to add value to, and reduce the costs of, public service through working
with all the public services and partners; to act as a strong local voice for Hampshire; to secure extra government funding for our infrastructure needs. Other examples include: the emerging Health and Well-being Board; the Children’s Trust; the Local Safeguarding Children Board; the Safeguarding Adults Board. The Performance Management Framework establishes how the quality of services for users is to be measured and reviewed on a regular basis. This includes quarterly reporting of progress against the Open for Business Plan and an annual self-assessment, to be completed by departments. The County Council’s Annual Performance Report is published on the website and publicised through targeted communications activities. The Report includes key achievements and a summary of performance, as well as the financial position. The County Council has an effective and comprehensive department and corporate complaints system which allows for any failures in service delivery to be properly dealt with; and lessons learnt. Areas for improvement identified through service user feedback and complaints are addressed through the department and service planning processes. The County Council considers that the achievement of value for money in the delivery of its services is fundamental. The County Council's performance against this criteria can be demonstrated by the following factors: benchmarking of spend compared with service quality i.e. lower quartile
council tax and `excellent' rated performance; all post-Gershon targets for efficiency gains exceeded and broad
achievement of meeting four years worth of CSR 2010 savings over 2 years;
integrated planning which links corporate priorities and areas for improvement to the budget setting decision process;
high levels of capital investment which shows that short term gains are not pursued at the expense of long term value for money and investment in ‘invest to save’ projects such as extra care and the development of an energy strategy;
19

Annual Governance Statement
the Annual Audit Letter 2011 (2010/11 conclusion) commented positively on the County Council’s Value For Money arrangements stating: “I issued an unqualified audit conclusion on your arrangements to secure economy, efficiency and effectiveness in the use of resources. My work in support of this conclusion found that as a Council, you: prepared your accounts on time and complied with the accounting code of
practice for Local Government; delivered your 2010/11 budget; approved a balanced 2011/12 budget and responded promptly to the
government’s spending review; set a challenging target to deliver savings in costs over two years that will
meet the funding cuts that have been announced for the four year period to 31 March 2015;
started on the implementation of a significant transformation programme to more effectively deliver key priorities and services within a tighter financial envelope; and
established levels of reserves that, subject to the strategy outlined in the medium term financial plan, provide a stable financial position.”
The Annual Audit letter also identified the importance of the following: importance of keeping medium term financial plans under review given
uncertainties in the overall economy; ensuring robust risk management systems and performance management
are in place; delivering the level of planned savings; maintaining the level and standard of services with reduced workforce
capacity. The County Council is also keen to ensure that it measures the environmental impact of policies, plans and decisions. The standard template for all decision reports examines the wider impacts of decisions on a range of issues, and where appropriate the County Council commissions specific environmental impact studies to inform the decision making process. The County Council continues to meet the expected standards, delivering good outcomes for local people. 4.2 Members and Officers working together to achieve a common
purpose with clearly defined functions and roles The County Council has a comprehensive Constitution, accessible on its website, which sets out the roles of the Council, Cabinet, Executive Members, Committees, the Chief Executive who is allocated the role of Head of Paid Service, Chief Officers and other senior Officers. The Constitution also allocates the statutory roles of Section 151 Officer to the County Treasurer and that of the Monitoring Officer to the Head of
20

Annual Governance Statement
Governance. Details and descriptions of both roles and their responsibilities are contained within the Constitution. In 2010 the Chartered Institute of Public Finance and Accountancy issued a Statement on the Role of the Chief Financial Officer in Local Government, outlining the principles that define the core activities and behaviours that belong to the role of the Chief Financial Officer and the governance requirements needed to support them. A self-assessment confirms that the County Council’s financial management arrangements conform with the governance requirements of the CIPFA Statement as outlined below: the County Treasurer is a key member of the Corporate Management
Team, helping it to develop and implement strategy and to resource and deliver the County Council’s strategic objectives sustainably and in the public interest
the County Treasurer is actively involved in, and able to bring influence to bear on, all material business decisions to ensure immediate and longer term implications, opportunities and risks are fully considered, and alignment with the Medium Term Financial Strategy
the County Treasurer leads the promotion and delivery by the County Council of good financial management so that public money is safeguarded at all times and used appropriately, economically, efficiently and effectively
the County Treasurer leads and directs a finance function that is adequately resourced to be fit for purpose
the County Treasurer is professionally qualified and suitably experienced. The relationship between Members and Officers is enforced by an established Member/Officer Protocol. The County Council has appointed and maintains an Independent Remuneration Panel pursuant to the requirements of the Local Authorities (Members Allowances) (England) Regulations 2003 which meets in open session and carry out an annual review of the Member’s Allowance Scheme. The Panel makes recommendations to the Employment in Hampshire County Council (EHCC) Committee who, having considered the IRP’s recommendations, makes recommendations to the County Council. Should any amendments be required to the Council’s adopted Scheme throughout the year, the same consideration/approval process is followed. The Members’ Allowances Scheme for 2012/13 was approved by the County Council on 23 February 2012 and is published on Hantsweb as part of the Council’s Constitution. Administration of the Scheme is overseen by the Head of Member Services and supported by effective and robust business processes For Officers, all issues relating to remuneration and terms and conditions are managed by the Council’s Employment in Hampshire County Council Committee (EHCC) which is advised by the County Treasurer, Director of HR and Head of Workforce Projects, Planning & Remuneration.
21

Annual Governance Statement
Performance management arrangements and the respective roles of officers and Members in monitoring service delivery are described above. In relation to partnership working, the County Council has published guidance on governance and roles and responsibilities for officers and members alongside other information and advice on partnership working. See: http://intranet.hants.gov.uk/partnerships.htm. A corporate group which includes representatives from all departments reviews this guidance. Additionally, linked to the County Council’s risk management, regular audits of the County Council’s partnership approach are carried out. 4.3 Promoting values for the County Council and demonstrating the
values of good Governance through upholding high standards of conduct and behaviour
The County Council's Constitution is founded on it operating in an open and transparent way, and for the Leader of the County Council and the Chief Executive to set the tone for the organisation by creating a climate and culture of openness, support, and respect. The County Council is committed to the highest ethical standards and has adopted a wide range of policies to re-enforce this philosophy as well as procedures to investigate them should the need arise. These policies and procedures include: Members and Officers Codes of Conduct Member/Officer protocol Standards Committee Complaints Procedures Anti fraud and corruption policy Standing Orders governing the conduct of Council business Contract Standing Orders Financial Regulations Guidance on Partnerships Performance Management system Investors in People and a system of individual performance plan appraisal. An effective Standards Committee is in place, which has taken on in accordance with the Standards Committee (England) Regulations 2008, responsibility from the Standards Board for England for the local initial assessment (and where appropriate investigation and determination) of complaints against Members of the County Council. Major corporate partnerships have terms of reference and receive regular performance updates. The partnership guidance as detailed above provides information and protocols for officers and members when working in partnership.
22
Annual Governance Statement
4.4 Taking informed and transparent decisions which are subject to effective scrutiny and managing risk
The County Council's Constitution together with its Decision Making Protocol ensures that appropriate legal and financial advice is given and also that decisions made are open and transparent. The County Council determined several years ago that openness in the individual Executive Members decision making would go beyond minimum Statutory requirements by ensuring that, subject to confidential items, all such decisions would be made in public. A Report Writing Guide is available on the intranet following a recent review which informs those preparing reports. All decision reports whether by the Executive or by committee are submitted in advance for both legal and financial consideration. A decision making record clearly documents the decision(s) made together with other considerations in accordance with legislative requirements. All decision reports and decision records are published on dedicated pages on the web in accordance with well established business practices. Exemptions from publication in the case of confidential or exempt reports are approved by the Monitoring Officer. All decisions are made in accordance with the County Council’s Decision Making Protocol. A corporate decision making report template is available to download to ensure that a consistent approach is taken across all departments in terms of report preparation together with the inclusion of timely and relevant information/evidence to inform the decision maker. All reports go through a robust QA process. Within portfolios/areas of service responsibility, Executive Members, Committee Chairmen and Vice-Chairman, Minority Group Spokespersons and local members are routinely briefed in relation to pending business. Advice is available to Members from the Monitoring Officer and Deputy Monitoring Officer on any aspects of the Members Code of Conduct or conflicts of interest that may arise either before or at the point where a decision is to be made. Within their own areas of responsibility, Executive Members, Committee Chairmen and Vice Chairmen, Minority Group Spokespersons and Local Members are routinely briefed in relation to pending business. After County Council elections, all Members take part in a comprehensive New Member Induction Programme, both generic and specific, to support them in the exercise of their duties as County Councillors. The Members’ Induction Programme includes a module on decision making. Ongoing training is additionally available through the County Council's own established monthly Briefing Programme and via external seminars, conferences and briefings. A Member Development Working Group has recently been established to promote continuous development with the assistance of Hampshire Learning Centre and other organisations such as South East Employers and the Improvement and Development Agency.
23

Annual Governance Statement
Executive decisions are recorded in accordance with the requirements of the Local Authorities (Executive Arrangements) (Access to Information) (England) Regulations 2000. Internal protocols govern legal and financial requirements by way of consultation internally, as indicated with the Head of Legal Services and the County Treasurer. Internal protocols also govern the preparation and publication of the County Council's Forward Plan, and the publication of all County Council, Cabinet, Executive Member and Committee Agenda, Reports Decision Records and Minutes. The maintenance of an effective scrutiny function is supported by a dedicated resource for scrutiny by designated officers located in the Democratic and Member Services Unit. Reviews are regularly shared with Executive Members and partner agencies as appropriate and resulting action monitored. Working arrangements with District Authorities are in place as are wider networks for health overview and scrutiny. Scrutiny of the safeguarding work of the Hampshire Safeguarding Adults Board and the Adult Services Department is provided through the Safe and Healthy Select Committee. There is a well established Reporting Concerns at Work (whistle blowing) Policy in place which is published on the County Council’s Web site. The role of Monitoring Officer, supported by other members of Legal Services, is also critical in ensuring that all decisions made are legally and soundly based. There is a comprehensive risk management framework in place with effective processes for reporting on risk. Through the Risk Management Board, chaired by the Deputy Chief Executive, risk management is embedded into the culture of the County Council so as to better influence decision making. Regular briefings on risk are made to the Executive Member with responsibility for risk management. Assessments of risk to the County Councils major change programmes are regularly reported to the Cabinet and Executive Members. 4.5 Developing the capacity and capabilities of Members and Officers
to be effective All new Officers and Members joining the County Council undergo an Induction Programme. For Officers the Corporate Induction Programme is underpinned by a service-specific induction. The Individual Performance Planning (IPP) process ensures that Officers identify and update their knowledge and skills on a regular basis. In addition IPP facilitates the identification of training requirements. This is subsequently used to develop departmental training and development plans. The skills required by Officers to undertake their roles are identified within the person specification for the particular job in question, and an assessment is made of the individual's competence against these during the selection process. Further skills assessment for Officers is undertaken during the
24

Annual Governance Statement
annual IPP process and these are incorporated within service and departmental training plans. The County Council’s Management and Leadership Competencies form the basis of how managers and leaders within the County Council need to develop themselves and others to be even more effective. Implicit within the Competencies is a recognition that to be fully effective, individuals need to be able to positively challenge and scrutinise information presented to them. The "Vision and Direction" and "Stakeholders' and Partnerships” Competencies also identify the need to work with others, particularly when expertise is not available internally. The County Council’s IPP process has been further developed to ensure that individual development needs can be identified and on the basis of this, departmental training plans developed. The range of training and development programmes available within the County Council has also increased and can be accessed both on-line and face to face delivery. In particular, an emphasis has been placed on management and leadership training with the introduction of the “Essentials of Leadership” development programme which has been well attended and equally well received. Corporately, officer development is managed through the learning & development board and significant work is being undertaken on “Priority Leadership Skills” which is designed to equip senior managers with the necessary skills to meet the future aspirations of the Council. For officers there are succession planning arrangements within departments and a Talent Management strategy will be introduced in 2011/12 to strengthen the corporate approach. The induction programme for members was overhauled for the 2009 elections and there are now ongoing member briefings to ensure continuous development. Member induction has been significantly strengthened and there are also now member briefings which address generic development needs. A member’s development group has also been developed looking at more focused development needs. The member development group continues to co-ordinate activity and is overseeing the County Council’s application for charter status for member development. The assessment for this will take place on 3rd October 2012. The revised Performance Management Framework will be integrated with workforce development initiatives, building capacity and securing the skills needed to drive transformational change within the County Council. A Corporate Governance e-learning module was developed and launched in July 2010. The e-learning module is available to all County Council staff and forms part of the mandatory corporate induction programme.
25

Annual Governance Statement
4.6 Engaging with local people and other stakeholders to ensure robust public accountability
The County Council undertakes a programme of consultation with residents, business and other key organisations on a wide range of issues. The findings are disseminated across the whole organisation, influencing policy and the decision-making process. For both consultation and communications, the County Council draws on a number of strategies and documents: Hampshire Now publication Communications Strategy Best practice guidance Community Involvement Strategy E-consultation database Public accountability is further enhanced by the system of publicly accessible scrutiny committees. A wide range of documents are published to ensure that the County Council can be held to account: County Council and partnership strategies and plans Financial Statements and Accounts Select Committee reports Annual reporting to the wider public via special articles being published in the Council's newsletter Hampshire Now. 5 Identify principal risks to achievement of objectives 5.1 The County Council has robust systems and processes in place
for the identification and management of strategic and operational risk
The County Council has a comprehensive risk management framework in place, that includes partnership risks, with effective processes for reporting on risk. The County Council’s risk management strategy was reviewed and updated in 2011. A network of risk registers focusing on strategic and operational risk is in place, with regular reporting to senior management at both corporate and departmental levels. Business continuity arrangements are in place for all critical services, and tested. Performance standards are used to improve the delivery and effectiveness of risk management. Through the Risk Management Board, chaired by the Deputy Chief Executive, risk management is embedded through the culture of the County Council so as to better influence decision making. Regular briefings on risk are made to the Executive Member with responsibility for risk management and regular reports have been made to the relevant scrutiny
26

Annual Governance Statement
committees. The County Council has developed and uses a performance management framework that measures the maturity of its risk management arrangements. It provides assurance that: there is top down commitment to embedding and integrating risk
management as routine business practice risk policies and strategies are communicated effectively and made to
work through a framework of processes a core group of people have the skills & knowledge to manage risk
effectively approaches for addressing risk with partners have been developed and
implemented there is clear evidence that risk management is being effective and leading
to the production of good results. The County Council benchmarks the performance of its risk management arrangements with other public sector organisations. The County Council largely self-insures against risk, subject to the availability of catastrophic insurance. There is good evidence that the management of claims within Legal Services is in accordance with the Civil Procedure Rules and that appropriate reserves are placed on claims. The claims management arrangements were subject to external audit by the Travellers Insurance Company Limited in February 2012, receiving an excellence rating. Significant claims are regularly reviewed by the Monitoring Officer with the Head of Litigation. The budget for dealing with these claims, and the contributions to be made to that budget by Departments reflects the sums identified within the reserve figures placed on all claims. There is evidence of monitoring the incidence of successful and unsuccessful claims and of feeding that information into the policy for risk financing accordingly. The system of self insurance is subject to internal audit, and review by external insurers. As described above, guidance and the database of partnerships helps to identify and register risks in partnerships. Additionally, major corporate partnerships are included in the risk register. Performance risks are identified and mitigated in line with the established corporate risk management framework. In addition, the Performance Management Framework establishes a transparent cycle of reporting, including quarterly reporting of progress against the Open for Business Plan and an annual self-assessment, completed by departments. 6 Identify key controls to manage risk 6.1 The Authority has robust systems of internal control which
includes systems and procedures to mitigate principal risks. The financial management of the County Council is led by the County Treasurer, and is integrated with and influenced by the processes set out above. It includes processes for forward planning and expenditure, consultation on budget proposals, setting and monitoring income and
27

Annual Governance Statement
budgets, and completion of final accounts. All are intended to be accurate, informative, timely and within statutory requirements. The Cabinet and County Council approve the annual Treasury Management and Investment Strategy together with the midyear review and outturn report and Arlingclose Limited, the County Council’s Treasury Management advisors have confirmed that the County Council fully complies with the Prudential Code. The Audit Committee is responsible for challenging and scrutinising treasury management activity and practices. Financial Regulations and Contract Standing Orders are regularly reviewed with the most recent changes to Financial Regulations having been completed in 2008. A further review of Financial Regulations is planned for 2012 and forms part of the action plan to this Statement. During 2009-10 a review of Standing Orders on Contracts, including reviewing the CIPFA contract procedure rules was undertaken by staff in Legal Services, County Treasurers and the Corporate Procurement network. This review along with The Corporate Services Review on Procurement and recent EU legislation and case law identified a number of issues that need to be addressed in revised Contract Standing Orders. Revised standing Orders were adopted by the County Council in 2010-11. As indicated, there is a Reporting Concerns at Work (whistle-blowing) Policy and Anti-fraud and Corruption Policy embedded into the County Council and fully accessible on the County Council's website. Registers of gifts and hospitality for both Members and Officers are maintained and the member’s register is available for public inspection and on the County Council’s web site. The Monitoring Officer will provide any advice required on whether specific gifts or offers of hospitality should be accepted or politely declined. Any acceptance of hospitality by a member of staff must be subject to discussion and the agreement of that person's Line Manager. The processes in place for maintaining these Registers are monitored. A revised Members Code of Conduct was adopted by the County Council in 2007 and signed up to by all Members. Training sessions on the new Code were offered by the Monitoring Officer to all Members including co-opted Members. A high level scheme of delegation is contained within the Constitution, and this is supplemented within each Department whereby the Chief Officer authorises other senior Officers to carry out allocated functions on their behalf. Revised Contract Standing Orders were adopted by the County Council in 2010-11. The County Council’s current corporate procurement strategy (CPS) was formally approved by Cabinet in November 2009 following previous versions in 2006 and 2003. The CPS is currently under review and a further iteration is planned in 2012, subject to the implementation requirements of the current Corporate Services Review and of the work exploring potential
28

Annual Governance Statement
collaboration between Hampshire Constabulary (HC), Hampshire Fire and Rescue Service (HFRS) and Hampshire County Council (HCC). An internal Best Practice Guide for procurement is maintained for staff and this year the County Council held its first internal conference for procurement staff. The conference in March was developed as part of the Council's plans to improve internal capacity and performance and is intended to be an annual event. On this occasion, the agenda featured best practice, an update on procurement regulations and a briefing on aspects of the 1998 Competition Act. The Corporate Procurement team is directly involved in key corporate initiatives and maintains relevant information on policy and practice on both the County Council’s internal and external websites at: http://intranet.hants.gov.uk/corporateprocurement.htm http://www3.hants.gov.uk/procurement The actions associated with the CPS and the Procurement Improvement Programme (PIP) are reviewed with departmental representatives at regular meetings of the Corporate Procurement Network and PIP Steering Group. Progress on the corporate procurement agenda and key issues continue to be considered by Members on the Buildings, Land & Procurement Panel. Procurement staff across the County Council are actively engaged with the Licensed Procurement Practitioner (LPP) programme and have progressed towards completion of assessments set externally which will give individuals the Award in Public Sector Procurement. The County Council's LPP programme has been adopted by a neighbouring authority and will be rolled out to approximately 40 of their procurement staff. The County Council continues to give significant support to collaborative procurement with local, regional and national partners (for example, on construction with a 'cluster' including Reading Borough Council and Surrey County Council and on commodity goods and services through the Central Buying Consortium, Pro5 and the Hampshire & Isle of Wight Procurement Partnership). The County Council’s Chief Executive continues to influence the future of procurement across local government following roles as Chairman of the National Improvement & Efficiency Partnership for the Built Environment and as the national lead officer for the Procurement, Capital and Shared Assets Productivity work stream. Pro5 includes five of the major local authority purchasing consortia and is building its work plan in accordance with category management principles. Pro5 is collaborating with the Government Procurement Service on a number of contracts and the County Council's procurement team is making a direct contribution to this work. Business continuity arrangements have been embedded into the County Council. Potential critical service areas have been identified and prioritised across the County Council's services against guideline criteria described in the Civil Contingencies Act 2004. Business impact analysis within the critical services has been undertaken and appropriate department and service plans developed as appropriate. A suite of business continuity plans consisting of corporate and incident management plans, together with template department incident are service recovery plans have been prepared and are stored within
29

Annual Governance Statement
a robust system. A scheduled programme of testing is in place, including recovery arrangements for key IT systems Corporate and Departmental risk registers include control measures, which are reviewed and monitored on a regular basis. The Corporate Risk Register is reviewed and reassessed on a quarterly basis by the Risk Management Board. Departmental risks are subject to an annual reassessment. The Corporate Health and Safety Policy is regularly reviewed and signed off by both the Leader and the Chief Executive. Partnership health and safety is covered by specific policy arrangement. The Corporate Health and Safety Policy is available electronically on the intranet and is supported by departmental policies and guidance. Audit programmes are in place across the County Council to review compliance against the policies and procedures. The Corporate Health and Safety policy and supporting policies are covered in health and safety induction and other relevant training courses. A suite of training course for health and safety is in place. There have been no HSE interventions such as Prohibition or Improvement Notices or prosecutions since 2005. The Risk and Safety Executive Group, the Risk Management Board and CMT receive reports on health and safety performance including incidents and positive indicators. The overall health and safety management performance is measured annually against standards defined by the HSE. The County Council has an established Complaints Policy and Procedure which is reviewed on a quarterly basis. The procedure is compliant with all relevant statutory requirements, and details of the operation of the complaints regime can be found on the County Council's website. The County Council’s leaflets and posters which highlight complaints procedures are published and available. All complaints files are kept in locked and secure cabinets with restricted access. An annual report on the Complaints Policy and procedure is submitted to the Audit Committee. As described above, guidance and the database of partnerships helps to identify and register risks in partnerships. Additionally, major corporate partnerships are included in the risk register. Performance risks are identified and mitigated in line with the established corporate risk management framework. In addition, the Performance Management Framework establishes a transparent cycle of reporting, including quarterly reporting of progress against the County Council Business Plan and an annual self-assessment, to be completed by departments. It is a management responsibility to develop and maintain the internal control framework, and to ensure that the County Council's resources are properly applied. Internal audit is an assurance function that primarily provides an
30

Annual Governance Statement
independent and objective opinion to the County Council on the control environment by evaluating its effectiveness in achieving the County Council's objectives. Within the County Council, internal audit assists managers by evaluating and reporting to them the effectiveness of the controls for which they are responsible. The internal audit strategy and terms of reference for internal audit, approved by the Audit Committee, require the regular assessment and review of risks, controls and governance processes; and also the provision of an annual report and opinion from the Chief Internal Auditor. This is a key element of the assurance available to the Monitoring Officer in drafting the Annual Governance Statement. In February 2012 a new shared internal audit service began with Southampton City Council. The Partnership provides for the delivery of an innovative and collaborative internal audit service, benefiting from strengthened resilience, efficient use of resources across both authority’s and economies of scale in service delivery. The Audit Committee reviewed the County Council’s Whistle Blowing and Counter Fraud and Corruption policies at its meeting in December 2009, and the updated and revised procedures are now in place, set out on the website, and have been integrated into the e-learning on corporate governance. A further report was received by the Audit Committee in September 2011 outlining the County Council’s actions to address the implementation of the Bribery Act 2010. 7 Obtain assurances on the effectiveness of key controls 7.1 Appropriate assurance statements are received from designated
internal and external assurance providers Key controls relating to risks, internal control (including financial management), and governance processes are identified by managers as part of the governance framework and recorded on regular returns. These are consolidated into the risk registers at corporate and departmental level and the Corporate Governance questionnaires retained by the Monitoring Officer as part of the assurance framework. Internal Audit, as part of its planned review of internal controls regularly evaluates the key controls to determine their adequacy and also carries out tests to confirm the level of compliance. Together the results of each review enable an audit opinion on effectiveness to be provided to management, and any actions for improvement to be agreed. This assurance is given to each manager in respect of the controls they are responsible for in the form of an audit report and regular summaries are provided for Chief Officers and the Audit Committee to ensure each level of the County Council's management is kept informed of findings and opinions. External sources of assurance include the annual opinion and value for money conclusion by the Audit Commission (as the designated external
31

Annual Governance Statement
auditor), and statutory inspections of adults social care services, and children’s services. These reports are subject to consideration by senior management and Members of the County Council, and appropriate response to any recommendations for improvements are agreed. These reports and responses are normally approved in public and published. 8 Evaluate assurances and identify gaps in control/assurance 8.1 The County Council has made adequate arrangements to identify,
receive and evaluate reports from the defined internal and external assurance providers to identify weaknesses in controls.
The County Council has responsibility for conducting, at least annually, a review of the effectiveness of its governance framework including the system of internal control. The review of effectiveness is informed by the work of the officers within the County Council who have responsibility for the development and maintenance of the governance environment, the Chief Internal Auditor’s annual report, and also by comments made by the external auditors and other review agencies and inspectorates. The Monitoring Officer and the Chief Internal Auditor have evaluated the reports from the internal and external assurance providers which have also been reported to the Audit Committee. This Annual Governance Statement sets out the County Council’s arrangements for receiving reports and identifying weaknesses in Internal control. 9 Action plan to address weaknesses and ensure continuous
improvement of the system of corporate governance The Chief Internal Auditor and the Monitoring Officer will determine a
central point of reference to key governance documents and proactively raise awareness about these documents across the County Council.
The Implementation of the County Council's Procurement Improvement
Programme is planned to continue in 2012/13. The Director of Culture, Communities and Business Services will lead implementation on behalf of the Corporate Management Team pending completion of the new corporate structure. Delivery of the current programme is managed by a corporate steering group, which includes the key corporate stakeholders.
Ahead of the County Council elections in May 2013, a review of the
Members Induction Programme will be undertaken by the Head of Member Services with the Monitoring Officer to identify any improvements in light of experience.
An elections group comprising the Head of Member Services, the
Monitoring Officer, the Head of Performance and Partnerships and the Head of Resources will be established to review the County Council’s election procedures and protocols in advance of the 2013 County elections to identify any improvements in the light of experience.
32
Annual Governance Statement
A new member’s Conduct Advisory panel will be established to advice the County Council on revised Standards Arrangements as required in consequence of the Localism Act 2011.
A review of the suite of democratic protocols will be undertaken by the
Head of Member Services and the Monitoring Officer during 2012-2013. The Review of the County Council's Talent management Strategy is now
being included within the second stage of the Learning and Development review.
A review of Financial Regulations by the County Treasurer will be
undertaken during 2012-2013. As a result of the new freedom for councils to choose their own
governance arrangements provided for in the Localism Act 2011 a review of the County Council’s Governance arrangements will be undertaken during 2011-2012 with a view to making recommendations about revised governance arrangements for 2013-2014.
A review of the Scheme of Delegation will be carried out by the Monitoring
Officer in 2012-2013 as a matter of good governance and to ensure that any changes arising from the Corporate Services Review are fully covered.
The process for obtaining the necessary assurances from Departments
enabling the Annual Governance Statement to be produced will be reviewed by the Monitoring Officer, the Chief Internal Auditor and the Head of Performance and Partnership and potentially combined with the Departmental self assessment process.
10 There is a robust mechanism to ensure than an appropriate action
plan is agreed to address identified control weaknesses and is implemented and monitored.
The Action Plan is kept under regular review by the Officer Corporate Governance Group. In response to the Action Plan identified in the 2009-2010 Annual Governance Statement;- A suite of key Governance policies, protocols and Codes of Practice have
been compiled and reviewed as part of the County Council’s self assessment against the requirements of the Bribery Act 2010. Work is now ongoing to determine clear ownership and a central point of reference for links to these documents to raise awareness and provide transparency and ease of reference to employees
Implementation of the recommendations contained in the Council's Procurement Improvement Programme progressed well during 2011/12. Reports on progress and on procurement issues are made regularly to elected Members. Both implementation and reporting will continue in 2012/13. Priorities will be reviewed in the light of corporate developments around the leadership of strategic procurement and shared services,
33

Annual Governance Statement
34
including procurement, with other public bodies in Hampshire. The findings of an Internal Audit of corporate procurement are also expected in 2012 and this review will provide additional focus on the existing procurement strategy, improvement program and corporate guidance
The first part of the Corporate Review of Learning & Development has been completed and significant progress has been made in bringing greater co-ordination to L&D activities across departments and centrally. The second stage of the review will focus on the structural implications with the implementation of CSR and potential shared services with Hampshire Constabulary and Fire & Rescue service and the longer term development needs of staff given the unprecedented change taking place within the Council
The County Council’s Constitution was comprehensively reviewed and updated and the amended Constitution was adopted by the County Council in 2011
A new Performance Management Framework for the County Council has been implemented. It provides a robust and coherent way of managing and improving services across the County Council, based on a cycle of continuous improvement.
The Communications Strategy for the County Council has evolved during 2011-2012, with new systems in place to improve the quality of communications to Hampshire residents and County Council Staff
Declaration We have been advised on the implications of the result of the review of the governance framework by the Audit Committee and a plan to address weaknesses and ensure continuous improvement of the system is in place. We propose over the coming year to take steps to address the above matters to further enhance our governance arrangements. We are satisfied that these steps will address the need for improvements that were identified in our review of effectiveness and will monitor their implementation and operation as part of our next annual review. Signed: Signed:
Date: 12 September 2012 Date: 13 September 2012 Chief Executive Leader of the County Council

Statement of Responsibilities for the Statement of Accounts
Statement of Responsibilities for the Statement of Accounts 1 The Council's responsibilities The Council is required to: make arrangements for the proper administration of its financial affairs and
to make one of its officers responsible for the administration of those affairs. In this Council, that officer is the Chief Financial Officer
manage its affairs so as to use resources economically, efficiently and effectively and safeguard its assets
approve the Statement of Accounts. 2 The Chief Financial Officer's responsibilities 1 The Chief Financial Officer is responsible for preparing the Council's Statement of Accounts in accordance with proper practices as set out in the CIPFA/LASAAC Code of Practice on Local Authority Accounting in Great Britain. 2 In preparing this Statement of Accounts, the Chief Financial Officer has: selected suitable accounting policies and applied them consistently made judgements and estimates that were reasonable and prudent complied with the Code of Practice.
3 The Chief Financial Officer has also: kept proper accounting records which are up to date taken reasonable steps to prevent fraud and other irregularities. 3 The Chief Financial Officer's statement I certify that the Statement of Accounts presents a true and fair view of the financial position of the County Council as at 31 March 2012 and its income and expenditure for the year ended 31 March 2012.
Carolyn Williamson Chief Financial Officer and Section 151 Officer 27 September 2012 4 The Chairman’s statement I certify that the Statement of Accounts for 2011/12 was considered and approved by the Audit Committee on 27 September 2012.
Councillor Keith Evans Chairman of Audit Committee 27 September 2012
35

Independent Auditor’s Report
Independent Auditor’s Report to the Members of Hampshire County Council Opinion on the Authority financial statements I have audited the financial statements of Hampshire County Council for the year ended 31 March 2012 under the Audit Commission Act 1998. The financial statements comprise the Movement in Reserves Statement, the Comprehensive Income and Expenditure Statement, the Balance Sheet, the Cash Flow Statement, and the related notes. The financial reporting framework that has been applied in their preparation is applicable law and the CIPFA/LASAAC Code of Practice on Local Authority Accounting in the United Kingdom 2011/12. This report is made solely to the members of Hampshire County Council in accordance with Part II of the Audit Commission Act 1998 and for no other purpose, as set out in paragraph 48 of the Statement of Responsibilities of Auditors and Audited Bodies published by the Audit Commission in March 2010. Respective responsibilities of the Chief Financial Officer and auditor As explained more fully in the Statement of the Chief Financial Officer’s Responsibilities, the Chief Financial Officer is responsible for the preparation of the Statement of Accounts, which includes the financial statements, in accordance with proper practices as set out in the CIPFA/LASAAC Code of Practice on Local Authority Accounting in the United Kingdom, and for being satisfied that they give a true and fair view. My responsibility is to audit and express an opinion on the financial statements in accordance with applicable law and International Standards on Auditing (UK and Ireland). Those standards require me to comply with the Auditing Practices Board’s Ethical Standards for Auditors. Scope of the audit of the financial statements An audit involves obtaining evidence about the amounts and disclosures in the financial statements sufficient to give reasonable assurance that the financial statements are free from material misstatement, whether caused by fraud or error. This includes an assessment of: whether the accounting policies are appropriate to the Authority’s circumstances and have been consistently applied and adequately disclosed; the reasonableness of significant accounting estimates made by the Chief Financial Officer; and the overall presentation of the financial statements. In addition, I read all the financial and non-financial information in the explanatory foreword to identify material inconsistencies with the audited financial statements. If I become aware of any apparent material misstatements or inconsistencies I consider the implications for my report.
36

Independent Auditor’s Report
Opinion on financial statements In my opinion the financial statements: give a true and fair view of the financial position of Hampshire County
Council as at 31 March 2012 and of its expenditure and income for the year then ended; and
have been prepared properly in accordance with the CIPFA/LASAAC Code of Practice on Local Authority Accounting in the United Kingdom 2011/12.
Opinion on other matters In my opinion, the information given in the explanatory foreword for the financial year for which the financial statements are prepared is consistent with the financial statements. Matters on which I report by exception I report to you if: in my opinion the annual governance statement does not reflect
compliance with ‘Delivering Good Governance in Local Government: a Framework’ published by CIPFA/SOLACE in June 2007;
I issue a report in the public interest under section 8 of the Audit Commission Act 1998;
I designate under section 11 of the Audit Commission Act 1998 any recommendation as one that requires the Authority to consider it at a public meeting and to decide what action to take in response; or
I exercise any other special powers of the auditor under the Audit Commission Act 1998.
I have nothing to report in these respects. Opinion on the pension fund financial statements I have audited the pension fund financial statements for the year ended 31 March 2012 under the Audit Commission Act 1998. The pension fund financial statements comprise the Fund Account, the Net Assets Statement and the related notes. The financial reporting framework that has been applied in their preparation is applicable law and the CIPFA/LASAAC Code of Practice on Local Authority Accounting in the United Kingdom 2011/12. This report is made solely to the members of Hampshire County Council in accordance with Part II of the Audit Commission Act 1998 and for no other purpose, as set out in paragraph 48 of the Statement of Responsibilities of Auditors and Audited Bodies published by the Audit Commission in March 2010.
37

Independent Auditor’s Report
Respective responsibilities of the Chief Financial Officer and auditor As explained more fully in the Statement of the Chief Financial Officer’s Responsibilities, the Chief Financial Officer is responsible for the preparation of the Authority’s Statement of Accounts, which includes the pension fund financial statements, in accordance with proper practices as set out in the CIPFA/LASAAC Code of Practice on Local Authority Accounting in the United Kingdom, and for being satisfied that they give a true and fair view. My responsibility is to audit and express an opinion on the financial statements in accordance with applicable law and International Standards on Auditing (UK and Ireland). Those standards require me to comply with the Auditing Practices Board’s Ethical Standards for Auditors. Scope of the audit of the financial statements An audit involves obtaining evidence about the amounts and disclosures in the financial statements sufficient to give reasonable assurance that the financial statements are free from material misstatement, whether caused by fraud or error. This includes an assessment of: whether the accounting policies are appropriate to the fund’s circumstances and have been consistently applied and adequately disclosed; the reasonableness of significant accounting estimates made by the Chief Financial Officer; and the overall presentation of the financial statements. In addition, I read all the financial and non-financial information in the explanatory foreword and the annual report to identify material inconsistencies with the audited financial statements. If I become aware of any apparent material misstatements or inconsistencies I consider the implications for my report. Opinion on financial statements In my opinion the pension fund’s financial statements: give a true and fair view of the financial transactions of the pension fund
during the year ended 31 March 2012 and the amount and disposition of the fund’s assets and liabilities as at 31 March 2012, other than liabilities to pay pensions and other benefits after the end of the scheme year; and
have been properly prepared in accordance with the CIPFA/LASAAC Code of Practice on Local Authority Accounting in the United Kingdom.
Opinion on other matters In my opinion, the information given in the explanatory foreword and the content of the Annual Report for the financial year for which the financial statements are prepared is consistent with the financial statements.
38

Independent Auditor’s Report
Conclusion on Authority’s arrangements for securing economy, efficiency and effectiveness in the use of resources Respective responsibilities of the Authority and the auditor The Authority is responsible for putting in place proper arrangements to secure economy, efficiency and effectiveness in its use of resources, to ensure proper stewardship and governance, and to review regularly the adequacy and effectiveness of these arrangements. I am required under Section 5 of the Audit Commission Act 1998 to satisfy myself that the Authority has made proper arrangements for securing economy, efficiency and effectiveness in its use of resources. The Code of Audit Practice issued by the Audit Commission requires me to report to you my conclusion relating to proper arrangements, having regard to relevant criteria specified by the Audit Commission. I report if significant matters have come to my attention which prevent me from concluding that the Authority has put in place proper arrangements for securing economy, efficiency and effectiveness in its use of resources. I am not required to consider, nor have I considered, whether all aspects of the Authority’s arrangements for securing economy, efficiency and effectiveness in its use of resources are operating effectively. Scope of the review of arrangements for securing economy, efficiency and effectiveness in the use of resources I have undertaken my audit in accordance with the Code of Audit Practice, having regard to the guidance on the specified criteria, published by the Audit Commission in October 2011, as to whether the Authority has proper arrangements for: securing financial resilience; and challenging how it secures economy, efficiency and effectiveness. The Audit Commission has determined these two criteria as those necessary for me to consider under the Code of Audit Practice in satisfying myself whether the Authority put in place proper arrangements for securing economy, efficiency and effectiveness in its use of resources for the year ended 31 March 2012. I planned my work in accordance with the Code of Audit Practice. Based on my risk assessment, I undertook such work as I considered necessary to form a view on whether, in all significant respects, the Authority had put in place proper arrangements to secure economy, efficiency and effectiveness in its use of resources.
39

Independent Auditor’s Report
40
Conclusion On the basis of my work, having regard to the guidance on the specified criteria published by the Audit Commission in October 2011, I am satisfied that, in all significant respects, Hampshire County Council put in place proper arrangements to secure economy, efficiency and effectiveness in its use of resources for the year ended 31 March 2012.
Certificate
I certify that I have completed the audit of the accounts of Hampshire County Council in accordance with the requirements of the Audit Commission Act 1998 and the Code of Audit Practice issued by the Audit Commission.
K.L.Handy Officer of the Audit Commission
Collins House Bishopstoke Road Eastleigh Hampshire SO50 6AD
27 September 2012
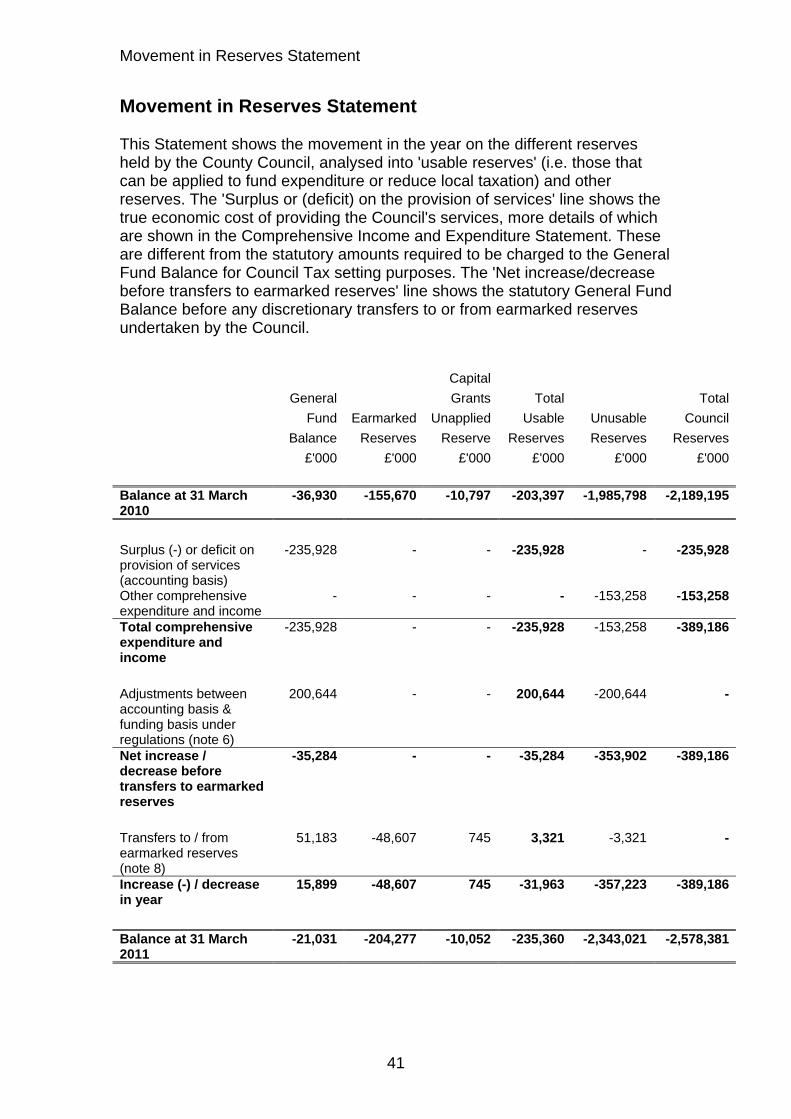
Movement in Reserves Statement
Movement in Reserves Statement This Statement shows the movement in the year on the different reserves held by the County Council, analysed into 'usable reserves' (i.e. those that can be applied to fund expenditure or reduce local taxation) and other reserves. The 'Surplus or (deficit) on the provision of services' line shows the true economic cost of providing the Council's services, more details of which are shown in the Comprehensive Income and Expenditure Statement. These are different from the statutory amounts required to be charged to the General Fund Balance for Council Tax setting purposes. The 'Net increase/decrease before transfers to earmarked reserves' line shows the statutory General Fund Balance before any discretionary transfers to or from earmarked reserves undertaken by the Council.
Capital
General Grants Total Total
Fund Earmarked Unapplied Usable Unusable Council
Balance Reserves Reserve Reserves Reserves Reserves
£'000 £'000 £'000 £'000 £'000 £'000
Balance at 31 March 2010
-36,930 -155,670 -10,797 -203,397 -1,985,798 -2,189,195
Surplus (-) or deficit on provision of services (accounting basis)
-235,928 - - -235,928 - -235,928
Other comprehensive expenditure and income
- - - - -153,258 -153,258
Total comprehensive expenditure and income
-235,928 - - -235,928 -153,258 -389,186
Adjustments between accounting basis & funding basis under regulations (note 6)
200,644 - - 200,644 -200,644 -
Net increase / decrease before transfers to earmarked reserves
-35,284 - - -35,284 -353,902 -389,186
Transfers to / from earmarked reserves (note 8)
51,183 -48,607 745 3,321 -3,321 -
Increase (-) / decrease in year
15,899 -48,607 745 -31,963 -357,223 -389,186
Balance at 31 March 2011
-21,031 -204,277 -10,052 -235,360 -2,343,021 -2,578,381
41

Movement in Reserves Statement
42
Capital
General Grants Total Total
Fund Earmarked Unapplied Usable Unusable Council
Balance Reserves Reserve Reserves Reserves Reserves
£'000 £'000 £'000 £'000 £'000 £'000
Balance at 31 March 2011
-21,031 -204,277 -10,052 -235,360 -2,343,021 -2,578,381
Surplus (-) or deficit on provision of services (accounting basis)
-14,752 - - -14,752 - -14,752
Other comprehensive expenditure and income
- - - - 217,745 217,745
Total comprehensive expenditure and income
-14,752 - - -14,752 217,745 202,993
Adjustments between accounting basis & funding basis under regulations (note 6)
-57,261 - - -57,261 57,261 -
Net increase before transfers to earmarked reserves
-72,013 - - -72,013 275,006 202,993
Transfers to / from earmarked reserves (note 8)
75,147 -40,165 -34,982 - - -
Increase (-) / decrease in year
3,134 -40,165 -34,982 -72,013 275,006 202,993
Balance at 31 March 2012
-17,897 -244,442 -45,034 -307,373 -2,068,015 -2,375,388

Comprehensive Income and Expenditure Statement
Comprehensive Income and Expenditure Statement This Statement shows the accounting cost in the year of providing services in accordance with generally accepted accounting practices, rather than the amount to be funded from taxation. Authorities raise taxation to cover expenditure in accordance with regulations; this may be different from the accounting cost. The taxation position is shown in the Movement in Reserves Statement.
43
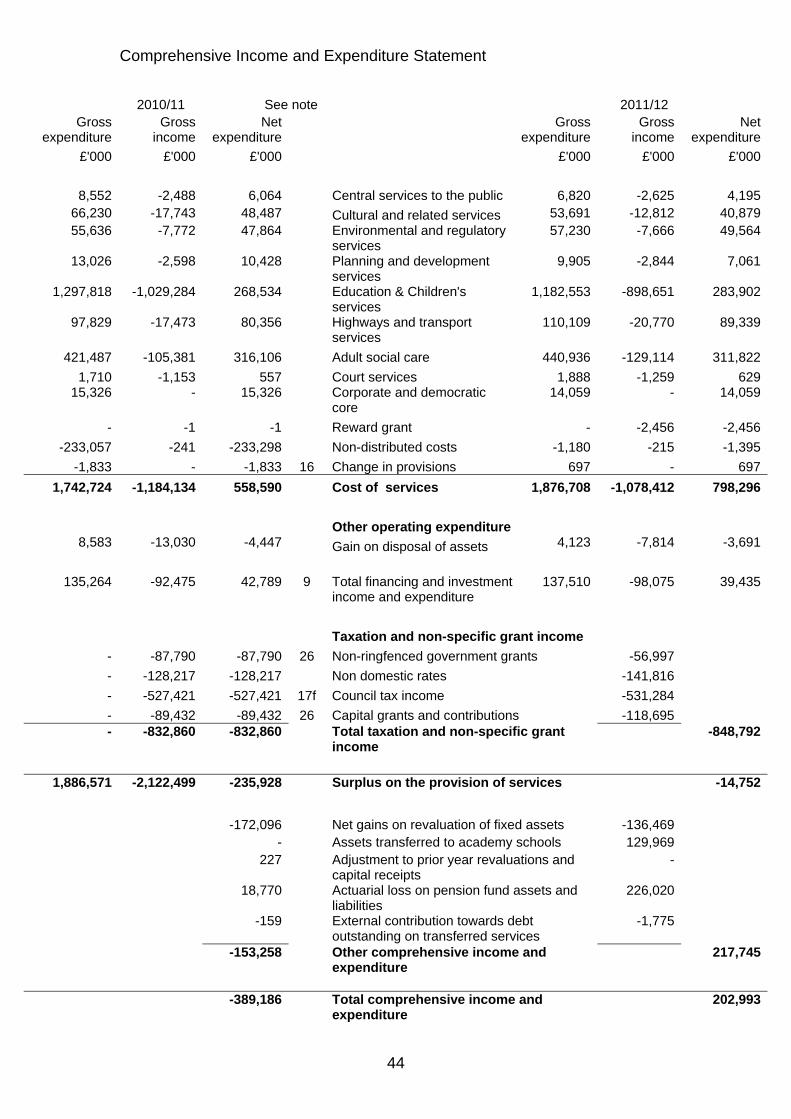
Comprehensive Income and Expenditure Statement
44
2010/11 See note 2011/12 Gross
expenditure Gross
income Net
expenditure Gross
expenditure Gross
income Net
expenditure
£'000 £'000 £'000 £'000 £'000 £'000
8,552 -2,488 6,064 Central services to the public 6,820 -2,625 4,19566,230 -17,743 48,487 Cultural and related services 53,691 -12,812 40,87955,636 -7,772 47,864
Environmental and regulatory services
57,230 -7,666 49,564
13,026 -2,598 10,428
Planning and development services
9,905 -2,844 7,061
1,297,818 -1,029,284 268,534 Education & Children's services
1,182,553 -898,651 283,902
97,829 -17,473 80,356
Highways and transport services
110,109 -20,770 89,339
421,487 -105,381 316,106 Adult social care 440,936 -129,114 311,822
1,710 -1,153 557 Court services 1,888 -1,259 62915,326 - 15,326
Corporate and democratic core
14,059 - 14,059
- -1 -1 Reward grant - -2,456 -2,456
-233,057 -241 -233,298 Non-distributed costs -1,180 -215 -1,395
-1,833 - -1,833 16 Change in provisions 697 - 697
1,742,724 -1,184,134 558,590 Cost of services 1,876,708 -1,078,412 798,296
Other operating expenditure 8,583 -13,030 -4,447 Gain on disposal of assets 4,123 -7,814 -3,691
135,264 -92,475 42,789 9 Total financing and investment
income and expenditure 137,510 -98,075 39,435
Taxation and non-specific grant income
- -87,790 -87,790 26 Non-ringfenced government grants -56,997
- -128,217 -128,217 Non domestic rates -141,816
- -527,421 -527,421 17f Council tax income -531,284
- -89,432 -89,432 26 Capital grants and contributions -118,695- -832,860 -832,860
Total taxation and non-specific grant income
-848,792
1,886,571 -2,122,499 -235,928 Surplus on the provision of services -14,752
-172,096 Net gains on revaluation of fixed assets -136,469
- Assets transferred to academy schools 129,969
227
Adjustment to prior year revaluations and capital receipts
-
18,770
Actuarial loss on pension fund assets and liabilities
226,020
-159
External contribution towards debt outstanding on transferred services
-1,775
-153,258
Other comprehensive income and expenditure
217,745
-389,186
Total comprehensive income and expenditure
202,993

Balance Sheet
Balance Sheet The Balance Sheet shows the value as at the Balance Sheet date of the assets and liabilities recognised by the Council. The net assets of the Council (assets less liabilities) are matched by the reserves held by the Council. Reserves are reported in two categories. The first category of reserves are usable reserves, i.e. those reserves that the Council may use to provide services, subject to the need to maintain a prudent level of reserves and any statutory limitations on their use (for example the Capital Receipts Reserve that may only be used to fund capital expenditure or repay debt). The second category of reserves are those that the Council is not able to use to provide services. This category of reserves includes reserves that hold unrealised gains and losses (for example the Revaluation Reserve), where amounts would only become available to provide services if the assets are sold; and reserves that hold timing differences shown in the Movement in Reserves Statement line “Adjustments between accounting basis and funding basis under regulations”.
45
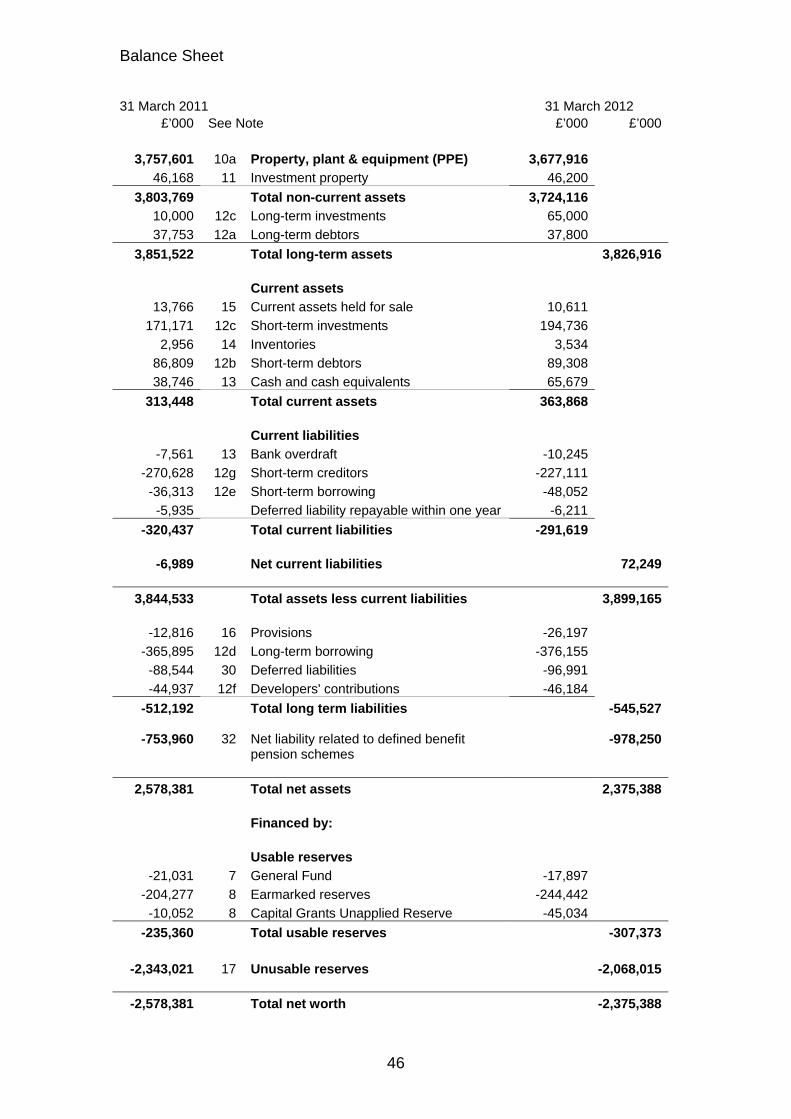
Balance Sheet
46
31 March 2011 31 March 2012 £’000 See Note £’000 £’000
3,757,601 10a Property, plant & equipment (PPE) 3,677,916
46,168 11 Investment property 46,200
3,803,769 Total non-current assets 3,724,116
10,000 12c Long-term investments 65,000
37,753 12a Long-term debtors 37,800
3,851,522 Total long-term assets 3,826,916
Current assets
13,766 15 Current assets held for sale 10,611
171,171 12c Short-term investments 194,736
2,956 14 Inventories 3,534
86,809 12b Short-term debtors 89,308
38,746 13 Cash and cash equivalents 65,679
313,448 Total current assets 363,868
Current liabilities
-7,561 13 Bank overdraft -10,245
-270,628 12g Short-term creditors -227,111
-36,313 12e Short-term borrowing -48,052
-5,935 Deferred liability repayable within one year -6,211
-320,437 Total current liabilities -291,619
-6,989 Net current liabilities 72,249
3,844,533 Total assets less current liabilities 3,899,165
-12,816 16 Provisions -26,197
-365,895 12d Long-term borrowing -376,155
-88,544 30 Deferred liabilities -96,991
-44,937 12f Developers' contributions -46,184
-512,192 Total long term liabilities -545,527
-753,960 32 Net liability related to defined benefit pension schemes
-978,250
2,578,381 Total net assets 2,375,388
Financed by: Usable reserves
-21,031 7 General Fund -17,897
-204,277 8 Earmarked reserves -244,442
-10,052 8 Capital Grants Unapplied Reserve -45,034
-235,360 Total usable reserves -307,373
-2,343,021 17 Unusable reserves -2,068,015
-2,578,381 Total net worth -2,375,388

Cash Flow Statement
Cash Flow Statement The Cash Flow Statement shows the changes in cash and cash equivalents of the Council during the reporting period. The statement shows how the Council generates and uses cash and cash equivalents by classifying cash flows as operating, investing and financing activities. The amount of net cash flows arising from operating activities is a key indicator of the extent to which the operations of the Council are funded by way of taxation and grant income or from the recipients of services provided by the Council. Investing activities represent the extent to which cash outflows have been made for resources which are intended to contribute to the Council's future service delivery. Cash flows arising from financing activities are useful in predicting claims on future cash flows by providers of capital (i.e. borrowing) to the Council.
2010/11 2010/11 See 2011/12
£'000 £'000 Note £'000
Original Restated * -235,928 -235,928 Net surplus (-) or deficit (+) on the provision of
services -14,752
126,785 13,948 18a Adjustments to net surplus or deficit on the
provision of services for non-cash movements -218,262
-21,673 114,793 18a Adjustment for items included in the net
surplus or deficit on the provision of services that are investing and financing activities
126,372
-130,816 -107,187 Net cash inflow from Operating Activities -106,642
56,169 90,832 18b Investing Activities 99,757
71,771 13,479 18c Financing Activities -17,364
-2,876 -2,876 Net increase (-) or decrease (+) in cash and
cash equivalents -24,249
-28,309 -28,309 Cash and cash equivalents at the beginning of the reporting period
-31,185
-31,185 -31,185 13 Cash and cash equivalents at the end of
the reporting period -55,434
* The 2010/11 analysis of cash movements has been simplified. Details are shown in note 18.
47
Notes to the Core Financial Statements
Notes to the Core Financial Statements Index Page Note 50 1 Accounting policies 69 2 Critical judgements in applying accounting policies 70 3 Uncertainties relating to assumptions and estimates used 71 4 First time adoption of Financial Reporting Standard FRS 30 71 5 Events after the Balance Sheet date 72 6 Adjustments between accounting basis and funding basis under
Regulations 73 7 General Fund 74 8 Transfers to/from earmarked reserves 76 9 Financing and investment income and expenditure 77 10a Property, Plant and Equipment 79 10b Capital commitments 79 10c Valuation of assets 79 10d Impairment losses 80 10e Foundation and aided school assets 80 10f Heritage assets 83 11 Investment properties 84 12 Financial instruments 85 12a Long-term debtors 85 12b Debtors 86 12c Investments 86 12d Long term borrowing 87 12e Borrowing repayable within one year 87 12f Developers' contributions 87 12g Short-term creditors 88 12h Deposits 88 12i Creditors 88 12j Receipts in advance 89 12k Nature and extent of risks arising from financial instruments 92 13 Cash and cash equivalents 93 14 Inventories 94 15 Assets held for sale 94 16 Change in provisions 96 17 Unusable reserves 96 17a Revaluation Reserve 97 17b Capital Adjustment Account 98 17c Financial Instruments Adjustment Account 99 17d Pensions Reserve 99 17e Deferred Capital Receipts Reserve 100 17f Collection Fund Adjustment Account 100 17g Accumulated Absences Account 101 18a Cash Flow Statement - Operating Activities 102 18b Cash Flow Statement - Investing Activities 102 18c Cash Flow Statement - Financing Activities 103 19 Amounts reported for resource allocation decisions
48

Notes to the Core Financial Statements
109 20 Internal trading accounts 110 21 Pooled budgets 111 22 Members' allowances 111 23a Officer remuneration 113 23b Senior employees' remuneration 114 23c Termination agreements 116 24 External audit fees 116 25 Dedicated Schools Grant 117 26 Grant income 120 27 Related party transactions 122 28 Capital financing 123 29a Leases - operating leases - County Council as lessee 123 29b County Council as lessor 124 29c Leases - finance leases 124 30 PFI and service concessions 128 31 Undischarged obligations 128 32 Pensions 129 32a Teachers' Pension Scheme 129 32b Local Government Pension Scheme 132 32c Transactions relating to pension benefits 133 32d Changes to the present value of liabilities during the accounting
period 134 32e Changes to the fair value of assets during the accounting period 134 32f Scheme history 136 32g Net actuarial gain/loss on pensions 136 33 Contingent liabilities 137 34 Trust funds
49
Notes to the Core Financial Statements
Notes to the Core Financial Statements 1 Accounting policies 1.1 General principles The Statement of Accounts summarises the County Council’s transactions for the 2011/12 financial year and its position at the year-end of 31 March 2012. The Council is required to prepare an annual Statement of Accounts by the Accounts and Audit Regulations 2011. These require the accounts to be prepared in accordance with proper accounting practices. These practices primarily comprise the Code of Practice on Local Authority Accounting in the United Kingdom 2011/12 and the Service Reporting Code of Practice 2011/12. The accounting convention adopted in the Statement of Accounts is principally historical cost, modified by the revaluation of certain categories of non-current assets and financial instruments. 1.2 Accruals of income and expenditure Sums due to, or from, the Council during the year are included in the accounts, whether or not the cash has actually been received or paid in the year – that is, on an accruals basis. In particular: fees, charges and rents due from customers are accounted for as income
at the date the council provides the relevant goods or services supplies and services expenditure is recorded as expenditure when they
are consumed. Where there is a gap between the date supplies are received and their consumption they are carried as stock in the Balance Sheet
employee benefits, including pension benefits are accounted for as they are earned
interest payable and receivable on borrowing and lending is accounted for on the basis of an effective interest rate calculated for the relevant financial instrument rather than the actual cash paid or received in accordance with the contract.
However, there are some exceptions, as follows: overtime is accounted for with the basic pay with which it is paid. The total
amount involved at 31 March 2012 is estimated at £3.0 million (£3.5 million in 2010/11).
electricity and other utility companies' quarterly payments are accounted for at the date of meter reading rather than being shared between financial years.
The above exceptions apply every year, so they do not have a material effect on the year's accounts.
50

Notes to the Core Financial Statements
Where revenue and expenditure have been recognised but cash has not been received or paid, a debtor or creditor for the relevant amount is recorded in the Balance Sheet. Where debts may not be settled, the balance of debtors is written down and a charge made to revenue for the income that might not be collected. 1.3 Cash and cash equivalents Cash is represented by cash in hand in the Council’s main bank account, in schools’ local bank accounts and in petty cash accounts held for minor day-to-day expenses by service units, including schools, across the whole county. Cash equivalents are investments that are readily convertible the same day to known amounts of cash with insignificant risk of change in value. In the Cash Flow Statement, cash and cash equivalents are shown net of bank overdrafts that are repayable on demand and form an integral part of the County Council’s cash management. 1.4 Exceptional items When items of income and expense are material, their nature and amount are disclosed separately, either on the face of the Comprehensive Income and Expenditure Statement or in the notes to the accounts, depending on how significant the items are to an understanding of the Council’s financial performance. 1.5 Prior period adjustments, changes in accounting policies and
estimates and errors Prior period adjustments may arise as a result of a change in accounting policies or to correct a material error. Changes in accounting estimates are accounted for prospectively, i.e. in the current and future years affected by the change and do not give rise to a prior period adjustment. Changes in accounting policies are only made when required by proper accounting practices or the change provides more reliable or relevant information about the effect of transactions, other events and conditions on the Council’s financial position or financial performance. Where a change is made, it is applied retrospectively (unless stated otherwise) by adjusting opening balances and comparative amounts for the prior period as if the new policy had always been applied. Material errors discovered in prior period figures are corrected retrospectively by amending opening balances and comparative amounts for the prior period.
51

Notes to the Core Financial Statements
1.6 Employee benefits Benefits payable during employment Short-term employee benefits, such as salaries, paid annual leave, paid sick leave and non-monetary benefits (e.g. leased cars) for current employees, are recognised as an expense in the year in which employees render service to the council. Teachers’ pay is governed by the Burgundy Book, which states that teachers should receive not less than one-third of a year’s salary for each full term’s service. With Hampshire’s policy of a fixed Easter break during April, the spring term’s pay and leave entitlement straddles two financial years. An accrual is made by charging children’s services for the cost of Easter holiday entitlements earned by teachers but not taken until the next financial year. Other staff work under Employment in Hampshire County Council (EHCC) terms and conditions which permit them to carry forward, in exceptional circumstances, up to 5 days (37 hours) annual leave per year, pro-rated for those working part time. In addition, some staff may have flexible working conditions which permit them to accumulate up to a maximum of 40 hours flexi-time. In this case they can theoretically carry forward up to 40 hours flexi-time from one financial year to another. However, the actual amounts of annual leave and flexi-time carried forward are much lower than the maximum amounts and are similar each year, so an accrual for non-teaching staff is not required. These accruals are called Compensated Absences Adjustments and in accordance with statutory regulations are reversed out of the General Fund and charged to the Compensated Absences Adjustment Account within the Movement in Reserves Statement. Termination benefits Termination benefits are amounts payable as a result of a decision by the Council to terminate an employee’s employment before the normal retirement date, or an employee’s decision to accept voluntary redundancy. These costs are charged on an accruals basis to the Comprehensive Income and Expenditure Statement (as part of the cost of services) when a termination notice has been issued to an employee. A provision for termination costs is included in the Comprehensive Income and Expenditure Statement (as part of the cost of services) where there is an agreed business case setting out the estimated termination costs resulting from a proposed restructuring. Where termination benefits involve the enhancement of pensions by way of added years, legislation requires the General Fund Balance to be charged with the amount payable by the council to the pension fund or pensioner in the year, not the amount calculated according to the relevant accounting standards. In the Movement in Reserves Statement, appropriations are required to and from the Pensions Reserve to remove the notional charges for
52

Notes to the Core Financial Statements
termination benefits and replace them with a charge for the actual amounts payable to the former employee and the pension fund. Post employment benefits (retirement pensions) Employees of the Council are members of two separate pension schemes: the Teachers’ Pension Scheme, administered by Capita Teachers’
Pensions on behalf of the Department for Education (DfE) the Local Government Pensions Scheme, administered by Hampshire
County Council. Both schemes provide defined benefits to members (retirement lump sums and pensions), earned as employees worked for the Council. However, the arrangements for the teachers’ scheme mean that liabilities for these benefits cannot ordinarily be identified specifically to the Council. The scheme is therefore accounted for as if it were a defined contribution scheme and no liability for future payments of benefits is recognised in the Balance Sheet. The Children’s and Education Services line in the Comprehensive Income and Expenditure Statement is charged with the employer’s contributions payable to Teachers’ Pensions in the year. The local government pension scheme is accounted for as a defined benefits scheme where: the liabilities of the scheme attributable to the Council are included in the
Balance Sheet on an actuarial basis using the projected unit method (i.e. an assessment of the future payments that will be made in relation to retirement benefits earned to date by employees, based on assumptions about mortality rates, employee turnover rates and projections of earnings for current employees)
liabilities are discounted to their value at current prices using a calculated discount rate based on a series of calculations for high quality corporate bonds over a range of periods
the assets of the pension fund attributable to the Council are included in the Balance Sheet at their fair value: for quoted securities this means the current bid price; for unquoted securities this is based on a professional estimate; for unitised securities this means the current bid price; for property this means an estimate of the market value.
The change in the net pensions liability is analysed into seven components: Current service cost: this is the increase in liabilities as a result of the
number of years of service earned this year. This is shown as a cost in the Comprehensive Income and Expenditure Statement for the service where the employee worked.
Past service cost: this is the increase in liabilities arising from current year decisions whose effect relates to the number of years of service earned in earlier years. This is shown as a non-distributed cost in the Comprehensive Income and Expenditure Statement.
Interest cost: this is the expected increase in the present value of liabilities during the year as they move one year closer to being paid. This is shown as a financing cost within the Comprehensive Income and Expenditure Statement.
53
Notes to the Core Financial Statements
Expected return on assets: this is the annual investment return on the fund assets attributable to the Council, based on an average of the expected long-term return. This is shown as investment income within the Comprehensive Income and Expenditure Statement.
Gains/losses on settlements and curtailments: this is the result of members of the scheme leaving, joining or stopping their contributions to the scheme. These actions relieve the Council of liabilities or reduce the expected future service or accrual of benefits of employees. This is shown as a non-distributed cost in the Comprehensive Income and Expenditure Statement.
Actuarial gains and losses: these are changes in the net pension liability that arise because events have not coincided with assumptions made at the last actuarial valuation or because the actuaries have updated their assumptions. These are shown as other income and expenditure within the Comprehensive Income and Expenditure Statement.
Contributions paid to the Hampshire County Council pension fund: these are amounts paid as employer contributions to the pension fund and are not included within the cost of services.
Statutory provisions limit the council to raising council tax to cover the actual amounts payable by the Council to the pension fund in the year. In the Movement in Reserves Statement an appropriation is made between the General Fund and the Pension Fund Reserve to remove the notional debits and credits for retirement benefits included in the Comprehensive Income and Expenditure Statement and replace them with debits for the actual amounts paid to the pension fund and any amounts due to the fund but unpaid at the year-end. Discretionary benefits The Council also has restricted powers to make discretionary awards of retirement benefits in the event of early retirements. Any liabilities estimated to arise as a result of an award to any member of staff, including teachers, are accrued for in the year of the decision to make the award and accounted for using the same policies as are applied to the Local Government Pension Scheme. 1.7 Events after the balance sheet date Events after the balance sheet date are those events that occur (both favourable and non-favourable) between the date of the Balance Sheet (31 March) and the date the accounts are authorised for issue (30 September). There are two types of event: adjusting events - those that provide evidence of a condition that existed at
the Balance Sheet date – for this type of event the accounts are adjusted to reflect such events.
54

Notes to the Core Financial Statements
non-adjusting events - those that are indicative of conditions that arose after the Balance Sheet date – for this type of event the accounts are not adjusted to reflect such events. However, where the event would have a material effect, disclosure is made in the notes to the accounts of the nature and estimated effect of the event.
Events taking place after the date authorised for issue are not reflected in the Statement of Accounts. 1.8 Financial instruments Financial liabilities Financial liabilities are recognised on the Balance Sheet when the Council becomes a party to the contractual provisions of a financial instrument and are initially measured at fair value and are carried at their amortised cost. Annual charges to the Financing and Investment Income and Expenditure line in the Comprehensive Income and Expenditure Statement for interest payable are based on the carrying amount of the liability, multiplied by the effective rate of interest for the instrument. The effective interest rate is the rate that exactly discounts estimated future cash payments over the life of the instrument to the amount at which it was originally recognised. For most of the borrowings that the Council has, this means that the amount presented in the Balance Sheet is the outstanding principal repayable (plus accrued interest); and interest charged to the Comprehensive Income and Expenditure Statement is the amount payable for the year according to the loan agreement. Gains and losses on the repurchase or early settlement of borrowing are credited and debited to the Financing and Investment Income and Expenditure line in the Comprehensive Income and Expenditure Statement in the year of repurchase/settlement. However, where repurchase has taken place as part of a restructuring of the loan portfolio that involves the modification or exchange of existing instruments, the premium or discount is respectively deducted from or added to the amortised cost of the new or modified loan and the write-down to the Comprehensive Income and Expenditure Statement is spread over the life of the loan by an adjustment to the effective interest rate. Where premiums and discounts have been charged to the Comprehensive Income and Expenditure Statement, regulations allow the impact on the General Fund Balance to be spread over future years. The Council has a policy of spreading the gain or loss over the term that was remaining on the loan against which the premium was payable or discount receivable when it was repaid. The reconciliation of amounts charged to the Comprehensive Income and Expenditure Statement to the net charge required against the General Fund Balance is managed by a transfer to or from the Financial Instruments Adjustment Account in the Movement in Reserves Statement.
55

Notes to the Core Financial Statements
Financial assets Loans and receivables are recognised on the Balance Sheet when the Council becomes a party to the contractual provisions of a financial instrument and are initially measured at fair value. They are subsequently measured at their amortised cost. Annual credits to the Financing and Investment Income and Expenditure line in the Comprehensive Income and Expenditure Statement for interest receivable are based on the carrying amount of the asset multiplied by the effective rate of interest for the instrument. For most of the loans that the Council has made, this means that the amount presented in the Balance Sheet is the outstanding principal receivable (plus accrued interest) and interest credited to the Comprehensive Income and Expenditure Statement is the amount receivable for the year in the loan agreement. However, the Council has made loans at less than market rates (soft loans). When material soft loans are made, a loss is recorded in the Comprehensive Income and Expenditure Statement (debited to the appropriate service) for the present value of the interest that will be foregone over the life of the instrument, resulting in a lower amortised cost than the outstanding principal. Interest is credited to the Financing and Investment Income and Expenditure line in the Comprehensive Income and Expenditure Statement at a higher effective rate of interest than the rate receivable, with the difference serving to increase the amortised cost of the loan in the Balance Sheet. Statutory provisions require that the impact of soft loans on the General Fund Balance is the interest receivable for the financial year – the reconciliation of amounts debited and credited to the Comprehensive Income and Expenditure Statement to the net gain required against the General Fund Balance is managed by a transfer to or from the Financial Instruments Adjustment Account in the Movement in Reserves Statement. Where assets are identified as impaired because of a likelihood arising from a past event that payments due under the contract will not be made, the asset is written down and a charge made to the relevant service (for receivables specific to that service) or the Financing and Investment Income and Expenditure line in the Comprehensive Income and Expenditure Statement. The impairment loss is measured as the difference between the carrying amount and the present value of the revised future cash flows discounted at the asset’s original effective interest rate. Foreign currency translation Where the Council has entered into a transaction denominated in a foreign currency, the transaction is converted into sterling at the exchange rate applicable on the date the transaction was effective. Where amounts in foreign currency are outstanding at the year-end, they are reconverted at the spot exchange rate at 31 March.
56

Notes to the Core Financial Statements
1.9 Government grants and other contributions Whether paid on account, by instalments or in arrears, government grants and third party contributions are recognised as income at the date that the council satisfies the conditions of entitlement to the grant/contribution and there is reasonable assurance that the monies will be received and the expenditure for which the grant has been given has or will be incurred. Amounts recognised as due are not credited to the Comprehensive Income and Expenditure Statement until any conditions attached to the grant or contribution have been satisfied. Conditions are stipulations that specify that the future economic benefits or service potential embodied in the asset acquired using the grant or contribution are required to be consumed by the recipient as specified or future economic benefits or service potential must be returned to the donor. In deciding if developer contribution agreements have conditions attached the Council has applied the substance over form concept and assumed that all agreements have a constructive obligation to repay contributions if not used even if this is not explicit in the agreement. Monies received as grants and contributions for which conditions have not been satisfied are carried in the Balance Sheet as creditors (receipts in advance). When conditions are satisfied, or where there are no conditions attached to the grant or contribution, the income is credited to the Comprehensive Income and Expenditure Statement as follows: to the relevant service for revenue grants and contributions and capital
grants used to fund revenue expenditure funded by capital under statute to the Taxation and Non-Specific Grant Income section for non-ring-fenced
revenue grants and contributions and all other capital grants and contributions.
Where capital grants are credited to the Comprehensive Income and Expenditure Statement, they are reversed out of the General Fund in the Movement in Reserves Statement. Where the grant has yet to be used to finance capital expenditure, it is transferred to the Capital Grants and Contributions Unapplied Reserve. Where it has been applied in the year, it is posted to the Capital Adjustment Account. Amounts in the Capital Grants and Contributions Unapplied Reserve that are subsequently applied in future years will be transferred to the Capital Adjustment Account once they have been applied to fund capital expenditure. Where revenue grants are credited to the Comprehensive Income and Expenditure Statement but are yet to be used, they are transferred to an earmarked reserve in the Movement in Reserves Statement. Once used in subsequent years, they are transferred to the General Fund to fund the revenue expenditure.
57

Notes to the Core Financial Statements
1.10 Intangible assets Intangible assets do not have physical substance but are identifiable and controlled by the Council and bring benefits to the Council for more than one year. Typical examples include software licences, internally developed software and websites developed to deliver services rather than information about services. The Council does not have any material intangible assets. Capital expenditure on immaterial intangible assets is classified as furniture and equipment. 1.11 Interests in companies and other entities The Council does not have any material interests in companies and other entities that have the nature of subsidiaries, associates and jointly controlled entities and would require the Council to prepare group accounts. However, the Council is corporate trustee or the designated treasurer for a number of trust funds and these funds are disclosed in the notes to the accounts. 1.12 Stock and long term contracts Stocks held in the balance sheet are valued according to their differing nature and purpose. For example, County Supplies stock of £1.6 million is valued at the latest buying price. The rest are mainly on an historical cost basis. Spending on consumable items is accounted for in the year of purchase. Long term contracts are accounted for on the basis of charging services with the value of works and services received under the contract during the financial year. The cost of capital schemes that are in progress at the date of the balance sheet are included as assets under construction within Long Term Assets. 1.13 Investment properties Investment properties are those that are used solely to earn rentals and/or for capital appreciation. The definition is not met if the property is used in any way to facilitate the delivery of services or production of goods or is held for sale. Investment properties are measured initially at cost and subsequently at fair value, based on the amount at which the asset could be exchanged between separate and knowledgeable parties. Properties are not depreciated but are revalued annually according to market conditions at the year-end. Gains and losses on revaluation are posted to the Financing and Investment Income and Expenditure line in the Comprehensive Income and Expenditure Statement. The same treatment is applied to gains and losses on disposal.
58

Notes to the Core Financial Statements
Rentals received in relation to investment properties are credited to the Financing and Investment Income line and result in a gain for the General Fund Balance. However, revaluation and disposal gains and losses are not permitted by statutory arrangements to have an impact on the General Fund Balance. The gains and losses are therefore reversed out of the General Fund Balance in the Movement in Reserves Statement and posted to the Capital Adjustment Account and (for any sale proceeds greater than £10,000) the Capital Receipts Reserve. 1.14 Jointly controlled operations The council has pooled budget arrangements with NHS bodies that involve joint use of the assets and resources of each organisation rather than the establishment of a separate entity. The Council recognises on its Balance Sheet the assets that it controls and the liabilities that it incurs and debits and credits the Comprehensive Income and Expenditure Statement with the expenditure it incurs and the share of income it earns from the activity of the operation. 1.15 Leases Leases are arrangements that convey the right to use an asset in return for a payment or series of payments even if the arrangement does not take the legal form of a lease. Leases are classified as either finance leases or operating leases. A finance lease is any arrangement where substantially all of the risks and rewards, incidental to ownership of the asset, transfer from the lessor to the lessee. Leases that do not transfer substantially all of the risks and rewards are classified as operating leases. Where an arrangement includes both land and buildings, the land and buildings elements are considered separately for classification and, in general, leases of land are considered to be operating leases. Extremely long leases of land (say over 250 years) could be treated as finance leases. Lease classifications are determined individually by carrying out a number of qualitative and quantitative tests and then making a judgement based on the overall outcomes of the tests. For the purposes of lease classifications a deminimus level is used equivalent to 1% of the general fund balance. In addition, property leases under 25 years are classified as operating leases. The Council as lessee Finance Leases - Where the Council leases a material asset under a finance lease it is recognised in the accounts as if it were the council’s asset and revalued and depreciated in line with the normal policy for non-current assets. The asset recognised is matched by a liability for the obligation to pay the lessor. The lease payment is apportioned between: a charge for the acquisition of the interest in the property, plant or
equipment – applied to write down the lease liability, and
59

Notes to the Core Financial Statements
a finance charge (debited to the Financing and Investment Income and Expenditure line in the Comprehensive Income and Expenditure Statement).
Operating Leases - Where the Council leases a material asset under an operating lease the asset is not recognised in the balance sheet. Rentals payable under operating leases are charged to the Comprehensive Income and Expenditure Statement as an expense to the services that benefit from use of the leased asset. Charges are made on a straight-line basis over the life of the lease. The Council as lessor Finance leases - Where the Council grants a finance lease over a property or an item of plant or equipment, the relevant asset is written out of the Balance Sheet as a disposal. A gain, representing the Council’s net investment in the lease, is credited to the Other Operating Expenditure line in the Comprehensive Income and Expenditure Statement as part of the gain or loss on disposal (i.e. netted off against the carrying value of the asset at the time of disposal), matched by a lease (long-term debtor) asset in the Balance Sheet. Lease rentals receivable are apportioned between: a charge for the acquisition of the interest in the property – applied to write
down the lease debtor (together with any premiums received) finance income (credited to the Financing and Investment Income and
Expenditure line in the Comprehensive Income and Expenditure Statement).
The gain credited to the Comprehensive Income and Expenditure Statement on disposal is not permitted by statute to increase the General Fund Balance and is required to be treated as a capital receipt. Where a premium has been received, this is posted out of the General Fund Balance to the Capital Receipts Reserve in the Movement in Reserves Statement. Where the amount due in relation to the lease asset is to be settled by the payment of rentals in future financial years, this is posted out of the General Fund Balance to the Deferred Capital Receipts Reserve in the Movement in Reserves Statement. When the future rentals are received, the element for the capital receipt for the disposal of the asset is used to write down the lease debtor. At this point, the deferred capital receipts are transferred to the Capital Receipts Reserve. The written-off value of disposals is not a charge against council tax, as the cost of fixed assets is fully provided for under separate arrangements for capital financing. Amounts are therefore appropriated to the Capital Adjustment Account from the General Fund Balance in the Movement in Reserves Statement. Operating Leases - Where the Council grants an operating lease on an asset it is retained in the Balance Sheet. Rentals receivable are credited to the relevant service area in the Comprehensive Income and Expenditure Statement. Credits are made on a straight-line basis over the life of the lease.
60

Notes to the Core Financial Statements
1.16 Overheads and support services The costs of overheads and support services are apportioned to those services that benefit from the supply or service in accordance with the costing principles of the CIPFA Service Reporting Code of Practice that applies for the relevant year. This means that the full cost of overheads and support services are shared between users in proportion to the benefits received, with the exception of: Corporate and Democratic Core costs (as these relate to the Council’s
status as a multi-functional, democratic organisation). Non-Distributed Costs (as these are the costs of discretionary benefits
awarded to employees retiring early and impairment charges for assets held for sale).
These two cost categories are accounted for as separate headings in the Comprehensive Income and Expenditure Statement, as part of the cost of services. 1.17 Property, plant and equipment (PPE) Material assets that have a physical substance and are held for use in the provision of services or for administrative purposes and that are expected to be used during more than one financial year are classified as Property, Plant and Equipment. Recognition Expenditure on the acquisition, creation or enhancement of PPE assets is capitalised on an accruals basis, provided that it benefits the council and the services that it provides are for more than one financial year. Spending on IT assets and intangible assets (such as software licences) typically yields benefits for a period of less than five years. Such expenditure is capitalised only if it yields benefits of five years or more which is not in accordance with recommended practice. This does not have a material effect in the accounts. Expenditure that maintains, but does not extend, the previously assessed standards of performance of the asset (e.g. repairs and maintenance) is charged to the relevant service area within the Comprehensive Income and Expenditure Statement as it is incurred. Measurement PPE assets are initially measured at cost, comprising all expenditure that is directly attributable to bringing the asset into working condition for its intended use. Assets are then carried in the Balance Sheet using the following measurement bases: Land and Buildings are measured at fair value. For land and buildings this
means Existing Use Value (EUV) for non-specialised properties or Depreciated Replacement Cost (DRC) for specialised properties. For surplus land and buildings this means open market value.
Vehicles, Plant and Equipment are measured at depreciated historical cost (as this is not materially different from the fair value).
61

Notes to the Core Financial Statements
Infrastructure Assets are measured at depreciated historical cost. Community Assets and Assets Under-Construction are measured at
historical cost. PPE assets included in the Balance Sheet at fair value (i.e. land and buildings) are re-valued where there have been material changes in the value, but as a minimum every five years. Increases in valuations are matched by credits to the Asset Revaluation Reserve to recognise unrealised gains. Exceptionally, gains might be credited to the relevant service area within the Comprehensive Income and Expenditure Statement where they arise from the reversal of an impairment loss previously charged to the service area. The Asset Revaluation Reserve only contains revaluation gains recognised since 1 April 2007, the date of its formal implementation. Gains arising before that date form part of the Capital Adjustment Account. Impairment Decreases in value (due to either physical impairment or market prices) are either charged to the Asset Revaluation Reserve (to the extent that it has any balance relating to the specific asset) or to the relevant service area within the Comprehensive Income and Expenditure Statement. Where an impairment loss is reversed subsequently, the reversal is credited to the relevant service line(s) in the Comprehensive Income and Expenditure Statement, up to the amount of the original loss, adjusted for depreciation that would have been charged if the loss had not been recognised. However, revaluation losses and subsequent reversals are not permitted by statutory arrangements to have an impact on the General Fund Balance and therefore any gains or losses are reversed out of the General Fund Balance (in the Movement in Reserves Statement) and are transferred to the Capital Adjustment Account. Depreciation Depreciation is provided for on all PPE assets with a determinable and finite life by allocating the value of the asset in the Balance Sheet over their useful lives. An exception is made for assets without finite lives (e.g. land and community assets), assets that are not yet available for use (e.g. assets under construction) and assets held for sale. Depreciation commences in the year after the year of acquisition and a full year’s depreciation is charged in the year of disposal, except for vehicles disposed of in the first six months of a financial year when no depreciation is charged in the final period.
62

Notes to the Core Financial Statements
Depreciation is calculated on the following bases: Dwellings and other buildings – straight-line allocation over the useful life
of the property as estimated by the valuer * Furniture and equipment 10 years Vehicles between five and 10 years Roads and bridges – reflect an assessment of the useful economic lives of
different parts of road structures New and improved highways:
o major schemes 50 years o minor schemes 40 years
Structural maintenance: o principal roads 20 years o non-principal 50 years
Area strategies and improvements for safety 25 years
Pedestrian facilities, street lighting and cycling facilities 20 years
Traffic calming 10 years * the useful life of a building is the weighted average of all its components. When one or more components are replaced or enhanced incurring capital expenditure in excess of £350,000, all assets on the site are revalued and the useful life of each asset is reassessed to ensure an appropriate rate of depreciation. Depreciation is charged to the relevant revenue service area within the Comprehensive Income and Expenditure Statement. However, depreciation charges are not permitted by statutory arrangements to have an impact on the General Fund Balance and therefore any gains or losses are reversed out of the General Fund Balance (in the Movement in Reserves Statement) and are transferred to the Capital Adjustment Account. Where assets have been re-valued, the revaluation gains held in the Asset Revaluation Reserve are also depreciated, with an amount equal to the difference between current value depreciation charged on assets and the depreciation that would have been charged, based on their historic cost, being transferred each year from the Asset Revaluation Reserve to the Capital Adjustment Account. Disposals and assets held for sale When a material PPE asset is to be disposed of, and meets all of the criteria of an asset held for sale, it is reclassified as Assets Held for Sale. If the carrying amount at the time of reclassification is higher than the fair value less costs to sell the asset, then the asset held for sale will be impaired. This impairment is charged to non-distributed costs in the Comprehensive Income and Expenditure Statement. Assets that are being abandoned or scrapped are written out without being reclassified.
63

Notes to the Core Financial Statements
When the asset is disposed of, or decommissioned, the carrying value of the asset is written out to the Other Operating Income and Expenditure line within the Comprehensive Income and Expenditure Statement as part of the gain or loss on disposal. The written-off value of disposals is not a charge against council tax, as the cost of fixed assets is fully provided for under separate arrangements for capital financing. Amounts are appropriated to the Capital Adjustment Account from the General Fund Balance in the Movement in Reserves Statement. Any revaluation gains accumulated for the asset in the Asset Revaluation Reserve are written out to the Capital Adjustment Account by way of a transfer between the accounts. Amounts received in excess of £10,000 are categorised as capital receipts and are credited to the other operating expenditure line within the Comprehensive Income and Expenditure Statement as part of the gain or loss on disposal. They are then appropriated to the Capital Receipts Reserve from the General Fund Balance within the Movement in Reserves Statement and then can only be used for new capital investment or set aside to reduce the Council’s underlying need to borrow (the capital financing requirement). 1.18 Foundation schools and voluntary aided and voluntary controlled
schools The fixed assets and long term liabilities of foundation schools remain vested in the Governing Bodies and are not included in the Council’s Balance Sheet. In addition, the Council also has voluntary aided schools (VA schools) and voluntary controlled schools (VC schools). The Council owns some of the assets in relation to these schools but some of the assets are the property of another party (e.g. the diocese). The Council recognises the value of the assets it owns in relation to VA schools in the Balance Sheet. All assets of VC schools are recognised by the Council, even those it does not own, as the Council controls the service and economic potential of these assets. 1.19 Heritage assets Heritage assets are assets with historical, artistic, scientific, technological, geophysical or environmental qualities that are maintained principally for their contribution to knowledge and culture. The principal heritage assets owned by the Council are its museum collections, archives collection and a small number of historic buildings and archaeological sites. It is the Council’s opinion that due to the size and variety of the museum and archives collection and the fact that many of the items are unique and irreplaceable, it is not possible to obtain a fair value at a cost commensurate to the benefit derived by the users of the accounts. The historical cost of buildings and archaeological sites, where known, is not material. Therefore, asset values are not included in the balance sheet, but details of heritage assets are given in the notes to the accounts.
64
Notes to the Core Financial Statements
The Council also owns a number of operational heritage assets that, in addition for being held for their contribution to knowledge and culture, are also used for other activities or to provide other services. Operational heritage assets are accounted for as operational assets and valued in the same way as other assets of that type. 1.20 Private Finance Initiative (PFI) and similar contracts PFI and similar contracts are agreements to receive services, where the PFI contractor is responsible for making available the property, plant and equipment needed to provide the services. As the Council is deemed to control the services that are provided under its PFI schemes, and as ownership of the property, plant and equipment will pass to the Council at the end of the contracts for no additional charge, the Council carries the assets used under the contracts on its Balance Sheet as part of Property, Plant and Equipment. The original recognition of these assets at fair value (based on the cost to purchase the property, plant and equipment) is balanced by the recognition of a deferred liability on the balance sheet for amounts due to the scheme operator to pay for the capital investment. Non current assets recognised on the Balance Sheet are revalued and depreciated in the same way as property, plant and equipment owned by the Council. During the life of the assets, any enhancement or replacement costs are added to the asset value and PFI liability. The amounts payable to the PFI operators each year are analysed into three elements: fair value of the services received during the year – debited to the relevant
service in the Comprehensive Income and Expenditure Statement finance cost – an interest charge on the outstanding Balance Sheet
liability, debited to the Financing and Investment Income and Expenditure line in the Comprehensive Income and Expenditure Statement
principle repayment – applied to write down the Balance Sheet liability. 1.21 Provisions Provisions are made where an event has taken place that gives the Council a legal or constructive obligation that probably requires settlement by a transfer of economic benefits or service potential, and a reliable estimate can be made of the amount of the obligation, but the timing of the transfer is uncertain. For example, the County Council makes provision for doubtful debts and also for legal claims that could eventually result in the payment of compensation or other settlement. Provisions are charged to the Comprehensive Income and Expenditure Statement in the year that the Council becomes aware of the obligation, and are measured at the best estimate at the balance sheet date of the expenditure required to settle the obligation, taking into account relevant risks and uncertainties.
65

Notes to the Core Financial Statements
When payments are eventually made, they are charged to the provision carried in the Balance Sheet. Estimated settlements are reviewed at the end of each financial year – where it becomes less than probable that payments will now be required (or a lower settlement than anticipated is made), the provision is reversed and credited back to the Comprehensive Income and Expenditure Statement. 1.22 Carbon reduction commitment scheme The Council is required to participate in the Carbon Reduction Commitment (CRC) Energy Efficiency Scheme. This scheme is currently in its introductory phase which will last until 31 March 2014. The Council is required to purchase and surrender allowances, currently retrospectively, on the basis of emissions i.e. carbon dioxide produced as energy is used. As carbon dioxide is emitted (i.e. as energy is used), a liability and an expense are recognised. The liability will be discharged by surrendering allowances. The liability is measured at the best estimate of the expenditure required to meet the obligation, normally at the current market price of the number of allowances required to meet the liability at the reporting date. The cost to the Council is recognised and reported in the costs of the Council’s services and is apportioned to services on the basis of energy consumption. 1.23 Landfill allowances scheme Landfill allowances, whether allocated by DEFRA or purchased from another Waste Disposal Authority (WDA) are recognised as current assets and are initially measured at fair value. After initial recognition, allowances are measured at the lower of cost and net realisable value. Landfill allowances allocated by DEFRA are accounted for as a government grant. As landfill is used, a liability and an expense are recognised. The liability is discharged by surrendering allowances. The liability is measured at the best estimate of the expenditure required to meet the obligation, normally the market price of the number of allowances required to meet the liability at the reporting date. 1.24 Contingent liabilities A contingent liability arises where an event has taken place that gives the Council a possible obligation whose existence will only be confirmed by the occurrence or otherwise of uncertain future events not wholly within the control of the Council. Contingent liabilities also arise in circumstances where a provision would otherwise be made but either it is not probable that payments will be required or the amount of the payment cannot be measured reliably. Contingent liabilities are not recognised in the Balance Sheet but disclosed in a note to the accounts.
66

Notes to the Core Financial Statements
1.25 Contingent assets A contingent asset arises where an event has taken place that gives the Council a possible asset whose existence will only be confirmed by the occurrence or otherwise of uncertain future events not wholly within the control of the Council. Contingent assets are not recognised in the Balance Sheet but disclosed in a note to the accounts where it is probable that there will be an inflow of economic benefits or service potential. 1.26 Reserves The County Council sets aside specific amounts as reserves for future policy purposes or to cover contingencies. Reserves are created by appropriating amounts out of the General Fund Balance in the Movement in Reserves Statement. When expenditure to be financed from a reserve is incurred, it is charged to the appropriate heading within the Comprehensive Income and Expenditure Statement in that year and is included in the Surplus or Deficit on the Comprehensive Income and Expenditure Statement. The reserve is then appropriated back into the General Fund Balance in the Movement in Reserves Statement so that there is no net charge against council tax for the expenditure. Certain reserves are kept to manage the accounting processes for non-current assets, financial instruments, retirement and employee benefits and do not represent usable resources for the County Council. 1.27 Revenue expenditure funded from capital under statute Legislation allows some expenditure such as grants to external organisations for capital purposes and spending on buildings not owned by the County Council, e.g. foundation schools, to be funded from capital resources. Such expenditure is not carried on the Balance Sheet and is charged to the Income and Expenditure Statement in the year it is incurred. However, so that it does not impact on the year’s council tax, an adjustment is made in the Statement of Movement on the General Fund balance. 1.28 Redemption of debt The Council’s borrowing for capital purposes is controlled under the CIPFA Prudential Code for Capital Finance in Local Authorities. The total borrowing is expressed as the Capital Financing Requirement and is derived from the opening Balance Sheet. With regard to The Local Authority (Capital Finance and Accounting) (England) (Amendment) Regulations 2008, the Council’s policy is to make a minimum revenue provision equal to 4% of the capital financing requirement at the beginning of the year on supported borrowing. For unsupported borrowing incurred after 1 April 2008, minimum revenue provision is made on
67

Notes to the Core Financial Statements
an equal instalment basis that reflects the life of the related asset, using a period that is no longer than used to calculate the corresponding depreciation. For deferred liabilities relating to PFI and service concessions, minimum revenue provision is made on the basis of the principal element of the annuity payment required to write down the liability over the life of the related asset. 1.29 VAT Income and expenditure excludes VAT, as all VAT collected is payable to HM Revenue and Customs (HMRC), and all VAT paid is recoverable from HMRC. 1.30 Accounting standards issued, not adopted There is just one accounting standard that has been issued but not yet adopted. Amendments to IFRS 7 - Financial Instruments: Disclosures (Transfer of financial assets). This applies from 1 April 2012 and is not expected to have a material impact on the financial statements of this Council.
68

Notes to the Core Financial Statements
2 Critical judgements in applying accounting policies In applying the accounting policies set out in note 1, the Council has had to make certain judgements about complex transactions or those involving uncertainty about future events. The critical judgements made in the Statement of Accounts are: 2.1 Asset classifications The County Council has made judgements on whether assets are classified as Investment Property or Property, Plant and Equipment. These judgements are based on the main reason that the council is holding the asset. If the asset is used in the delivery of services or is occupied by third parties who are subsidised by the council they are deemed to be Property, Plant and Equipment assets. If there is no subsidy and/or full market rent is being charged this would indicate that the asset is an Investment Property. Where assets are being held vacant for purposes of future capital appreciation, due to market conditions or planning decisions, these have been classified as Investment Property. The classification determines the valuation and depreciation method to be used. 2.2 Lease classifications The County Council has made judgements on whether its lease arrangements are operating leases or finance leases. These judgements are based on a series of tests designed to assess whether the risks and rewards of ownership have been transferred from the lessor to the lessee. These tests include the following assumptions in the classification of operating leases: land leases under 250 years property leases under 25 years all leases below £330,000. As a result, no material finance leases have been identified. In addition, judgements have been made on whether any contracts for services include embedded leases. None have been identified. 2.3 Providing for potential liabilities The County Council has made judgements about the likelihood of pending liabilities and whether a provision should be made or whether there is a contingent liability. This includes legal claims that could eventually result in the payment of compensation or other settlement. The judgements are based on the degree of certainty around the results of pending legal actions based on experience in previous years or in other local authorities.
69

Notes to the Core Financial Statements
2.4 Future funding for local government There is a high degree of uncertainty about future levels of funding for local government. However, earmarked reserves will provide invest to save funding for a range of efficiency measures to ensure services can continue to be provided at an appropriate level. 2.5 Production of group accounts The Council is sole trustee of a number of trust funds as a result of individuals or executors of an estate seeking to place an asset or assets in a charitable trust and requesting the County Council to act as trustee given that as a statutory corporation, the County Council will provide certainty that the charitable purpose can be sustained. This is an alternative to creating trustees within the family of the individual. As such, these trusts are unconnected with the County Council’s role of providing services funded from taxation. Therefore, in order to assess the Council’s financial position either from year to year or as compared with other authorities, trust funds are excluded from the County Council’s accounting statements, although they are included in a disclosure note. 3 Uncertainties relating to assumptions and estimates used The financial statements contain some estimated figures that are based on assumptions made by the council about the future or that are otherwise uncertain. Estimates are made taking into account historical experience, current trends and other relevant factors. However, because balances cannot be determined with certainty, actual results could be materially different from the assumptions and estimates made. There is one item in the council’s Balance Sheet at 31 March 2012 for which there is a significant risk of material adjustment in the forthcoming financial year and that is the pension liability. Estimation of the net liability to pay pensions depends on a number of complex judgements relating to the discount rate used, the rate at which salaries are projected to increase, changes in retirement ages, mortality rates and expected returns on pension fund assets. A firm of consulting actuaries is engaged to provide the Authority with expert advice about the assumptions to be applied. The effects on the net pensions liability of changes in individual assumptions can be measured. For instance, a 0.5% increase in the discount rate assumption for funded liabilities would result in a decrease in the pension liability of £183.0 million. However, the assumptions interact in complex ways. During 2011/12, the Council’s actuaries advised that for funded liabilities, the net pension liability had increased by £15.9 million as a result of estimates being corrected as a result of experience and increased by £167.0 million attributable to updating of the assumptions.
70

Notes to the Core Financial Statements
4 First time adoption of Financial Reporting Standard FRS 30 The Code of Practice on Local Authority Accounting in the United Kingdom 2011/12 introduced a change in accounting policy in relation to the treatment of heritage assets held by the Council which required adoption from 2011/12. In line with the Council’s accounting policies, no restatement of the accounts is required. 5 Events after the Balance Sheet date The Statement of Accounts was authorised by the Chief Financial Officer on 27 September 2012. In the period since 31 March 2012 until the date the accounts were authorised, 9 schools have transferred to academy status. The balance sheet at 31 March 2012 included assets and liabilities relating to these schools that will transfer during 2012/13. This includes plant, property and equipment valued at £86.8 million at 31 March 2012 and cash backed reserves of £2.9 million. However, the actual value of transfers will be agreed as at the date of transfer.
71

Notes to the Core Financial Statements
6 Adjustments between accounting basis and funding basis under regulations
This note details the adjustments that are made to the total Comprehensive Income and Expenditure Statement recognised by the County Council in the year in accordance with proper accounting practice to the resources that are specified by statutory provisions as being available to the County Council to meet future capital and revenue expenditure. Usable reserves
2011/12
General Fund
Balance
Capital Receipts Reserve
Unusable Reserves
£’000 £’000 £’000Reversal of items included in the Comprehensive Income and Expenditure Statement but required by statute to be excluded when determining the surplus or deficit on the general fund for the year.
Depreciation and impairment of non-current assets -214,699 - 214,699
Movement in the market value of investment property 772 - -772
Revenue expenditure funded by capital under statute -14,091 - 14,091
Book value of non-current assets sold -4,091 - 4,091
Capital grants and contributions applied 83,713 - -83,713
Transferred to Capital Adjustment Account -148,396 - 148,396Transfer cash proceeds from sale of non-current assets
7,814 -6,698 -1,116
Use of capital receipts to finance capital expenditure - 6,698 -6,698Council tax income accrual transferred to Collection Fund Adjustment Account
1,351 - -1,351
Net charges relating to retirement benefits transferred to the Pensions Reserve
-68,962 - 68,962
Effective interest on soft loans transferred to the Financial Instruments Adjustment Account
79 - -79
Employee benefits accrual transferred to the Accumulated Absences Account
1,948 - -1,948
Insertion of items not included in the Comprehensive Income and Expenditure Statement but required by statute to be included when determining the surplus or deficit on the general fund for the year.
Statutory provision for the repayment of debt 33,871 - -33,871Contribution from other authorities for the repayment of debt
-1,746 - 1,746
Capital expenditure funded from the General Fund 46,088 - -46,088
Transferred from Capital Adjustment Account 78,213 - -78,213Employer's contributions payable to the pension Fund transferred from the Pension Reserve 70,692 - -70,692
Total adjustments -57,261 - 57,261
72
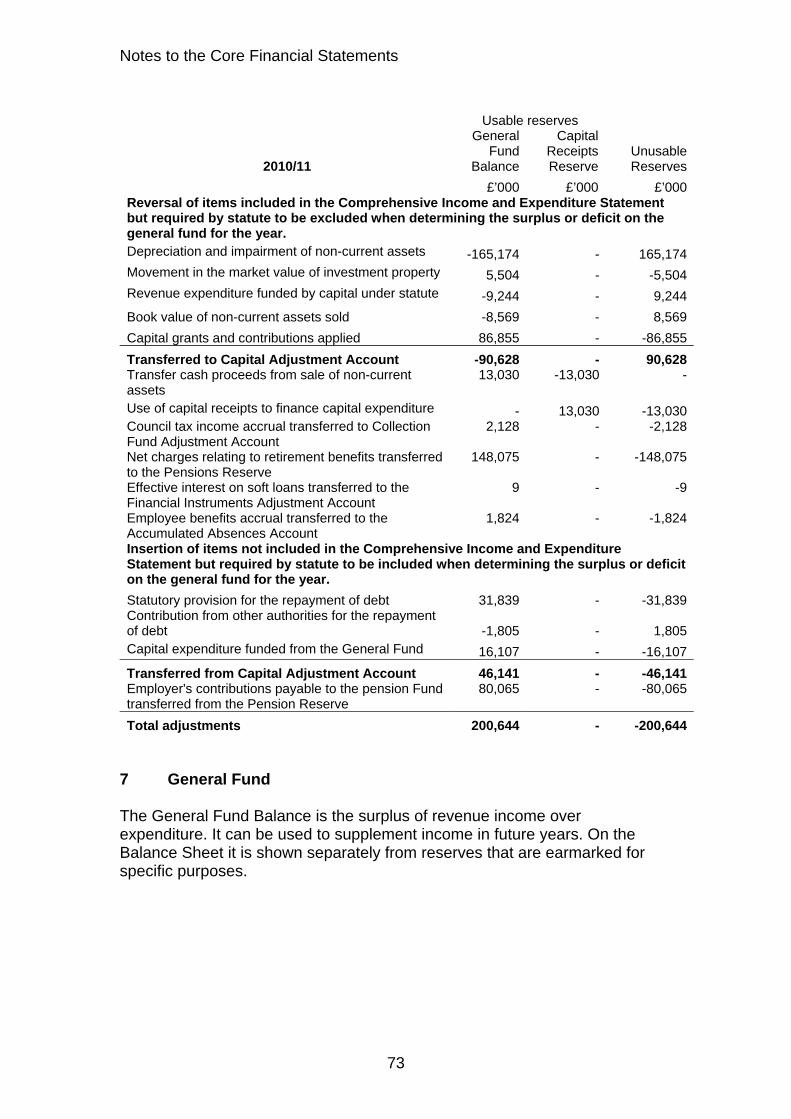
Notes to the Core Financial Statements
Usable reserves
2010/11
General Fund
Balance
Capital Receipts Reserve
Unusable Reserves
£’000 £’000 £’000Reversal of items included in the Comprehensive Income and Expenditure Statement but required by statute to be excluded when determining the surplus or deficit on the general fund for the year. Depreciation and impairment of non-current assets -165,174 - 165,174Movement in the market value of investment property 5,504 - -5,504Revenue expenditure funded by capital under statute -9,244 - 9,244
Book value of non-current assets sold -8,569 - 8,569
Capital grants and contributions applied 86,855 - -86,855
Transferred to Capital Adjustment Account -90,628 - 90,628Transfer cash proceeds from sale of non-current assets
13,030 -13,030 -
Use of capital receipts to finance capital expenditure - 13,030 -13,030Council tax income accrual transferred to Collection Fund Adjustment Account
2,128 - -2,128
Net charges relating to retirement benefits transferred to the Pensions Reserve
148,075 - -148,075
Effective interest on soft loans transferred to the Financial Instruments Adjustment Account
9 - -9
Employee benefits accrual transferred to the Accumulated Absences Account
1,824 - -1,824
Insertion of items not included in the Comprehensive Income and Expenditure Statement but required by statute to be included when determining the surplus or deficit on the general fund for the year.
Statutory provision for the repayment of debt 31,839 - -31,839Contribution from other authorities for the repayment of debt -1,805 - 1,805Capital expenditure funded from the General Fund 16,107 - -16,107
Transferred from Capital Adjustment Account 46,141 - -46,141Employer's contributions payable to the pension Fund transferred from the Pension Reserve
80,065 - -80,065
Total adjustments 200,644 - -200,644
7 General Fund The General Fund Balance is the surplus of revenue income over expenditure. It can be used to supplement income in future years. On the Balance Sheet it is shown separately from reserves that are earmarked for specific purposes.
73

Notes to the Core Financial Statements
8 Transfers to/from earmarked reserves Specific amounts are set aside as reserves for future policy purposes or to cover contingencies. Schools' reserves are made up of net underspendings on budgets managed by governors as adjusted for advances made under the school balances loan scheme. They are not available to other services. The opening and closing balances for each reserve is shown below: Balance Balance
Balance Movement at 31 Movement at 31
at 1 April in March in March
See 2010 2010/11 2011 2011/12 2012
note £’000 £’000 £’000 £’000 £’000
Schools a -33,969 -2,605 -36,574 -598 -37,172
Capital Grants b -10,797 745 -10,052 -34,982 -45,034
Unapplied
Revenue Grants c -1,158 -5,421 -6,579 -6,952 -13,531
Unapplied
Corporate Efficiency d - -10,340 -10,340 -8,411 -18,751
Corporate Policy e -650 -1,758 -2,408 713 -1,695
Designated f -14,481 -3,188 -17,669 -10,033 -27,702
Underspendings
Equal Pay g -41,031 -6,151 -47,182 47,182 -
Capital payments h -469 -17,597 -18,066 -38,331 -56,397
Grant Equalization i -22,415 3,735 -18,680 -13,500 -32,180
Insurance j -12,642 -4,083 -16,725 -964 -17,689
Invest To Save k -4,294 976 -3,318 -2,752 -6,070
Organisational l - -3,511 -3,511 -4,608 -8,119
Change
Local Government m - - - -6,150 -6,150
resource review
Trading Accounts n -12,539 -214 -12,753 -1,508 -14,261
Other o -12,022 1,550 -10,472 5,747 -4,725
-166,467 -47,862 -214,329 -75,147 -289,476 a. The purpose of the Schools reserve is to earmark the balance of unspent delegated budgets. b. The capital grants unapplied reserve is the equivalent to the revenue grants unapplied reserve in respect of capital grants. c. The revenue grants unapplied reserve was established to reflect change in accounting practice under IFRS, requiring grants to be accounted for in advance of the matched spending being incurred, where there is no repayment condition.
74

Notes to the Core Financial Statements
d. The corporate efficiency reserve was established to earmark any corporate efficiency savings achieved in advance of their being required for budgetary purposes. e. The corporate policy reserve is used to redirect corporate efficiency and other savings to front line services, as the public spending outlook becomes more constrained. f. The designated underspendings reserve enables individual services to carry forward underspendings in accordance with the financial management policy. g. The equal pay reserve is to assist in meeting transitional salary protection and equal pay claim costs likely to arise from implementation of the Pay and Benefit Review. h. The capital payments reserve is to assist in matching the timing of the availability of capital financing resources with the timing of capital payments. i. The grant equalisation reserve is to assist in managing the impact of future grant loss. j. The insurance reserve is to cover fire, flood and storm damage reinstatement costs which are already committed and to reserve against adverse trends in liability claims. k. The invest-to-save and modernisation reserve is to provide funding for investment which will generate future cash savings which can be recycled back into the reserve. l. The organisational change reserve was established in 2010/11 from contributions from the corporate policy and invest to save and modernisation reserves to fund the additional cost of the voluntary redundancy scheme implemented to facilitate staffing reductions on a voluntary basis, and provide funding for organisational development. m. The Local Government Resource Review reserve is being established in 2011/12 to cover the risk of reduced income resulting from business rates appeals and localisation of council tax benefit. n. The trading accounts reserve enable business units to carry forward planned surpluses to cover future investment or possible losses. o. Other smaller reserves are sums set aside for specific future purposes.
75
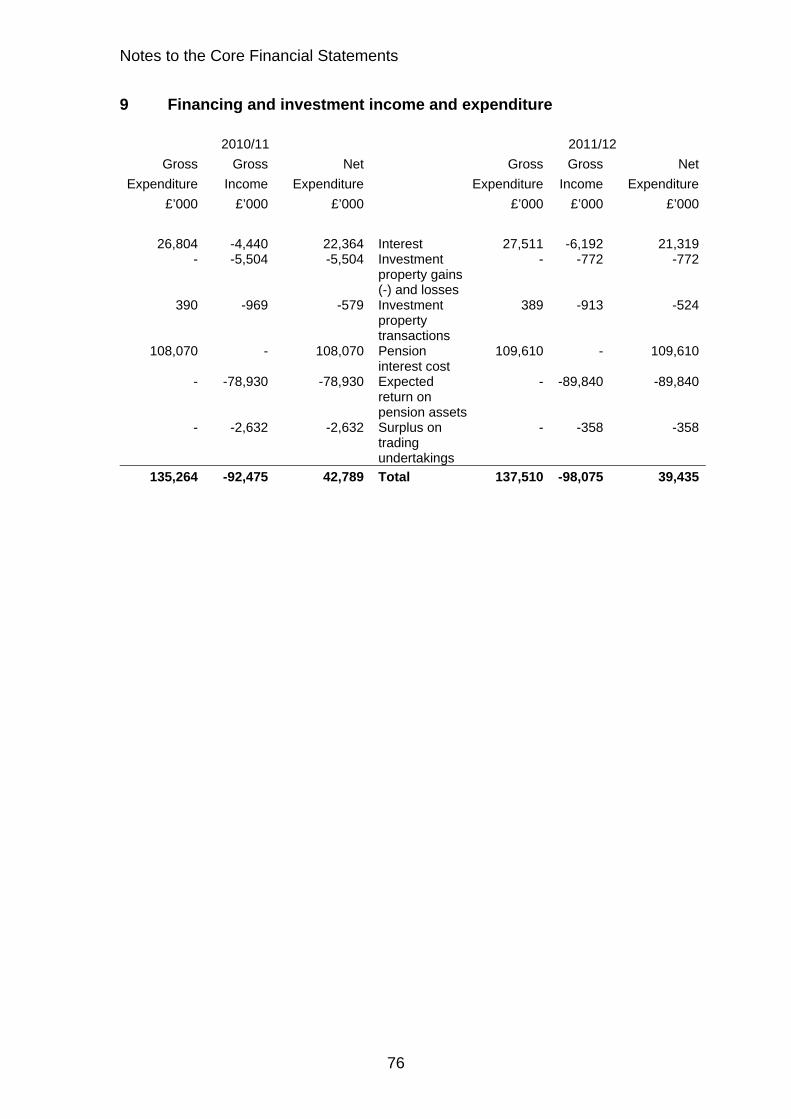
Notes to the Core Financial Statements
9 Financing and investment income and expenditure
2010/11 2011/12
Gross Gross Net Gross Gross Net
Expenditure Income Expenditure Expenditure Income Expenditure
£’000 £’000 £’000 £’000 £’000 £’000
26,804 -4,440 22,364 Interest 27,511 -6,192 21,319- -5,504 -5,504 Investment
property gains (-) and losses
- -772 -772
390 -969 -579 Investment property transactions
389 -913 -524
108,070 - 108,070 Pension interest cost
109,610 - 109,610
- -78,930 -78,930 Expected return on pension assets
- -89,840 -89,840
- -2,632 -2,632 Surplus on trading undertakings
- -358 -358
135,264 -92,475 42,789 Total 137,510 -98,075 39,435
76

Notes to the Core Financial Statements
10a Property, Plant and Equipment (PPE) The movements in property, plant and equipment during 2011/12 were as follows:
Other Vehicles, Infra- Comm- Assets under
Total Property,
land and plant and structure unity Surplus const- Plant and
buildings equipment assets assets assets ruction Equipment
£’000 £’000 £’000 £’000 £’000 £’000 £’000
Cost or valuation 3,733,941 128,857 649,340 14,255 16,214 37,035 4,579,642
at 31 March 2011
Additions 58,605 6,556 60,314 65 269 12,034 137,843
Disposals -597 -92 - - -31 - -720
Transfers to other classes 3,911 -38 366 -654 366 -13,450 -9,499Transfers to foundation schools
- - - - - - -
Changes in certified valuations
480 - - - 328 - 808
Transfer of building assets to Academy schools
-141,165 -2,902 - - - - -144,067
Cost or valuation at 31 March 2012
3,655,175 132,381 710,020 13,666 17,146 35,619 4,564,007
Accumulated depreciation -601,758 -74,033 -136,635 -1 -9,614 - -822,041
at 31 March 2011
Depreciation for the year -75,711 -11,820 -23,165 - - - -110,696
Impairment losses -103,693 - - - -126 - -103,819Disposals- accumulated depreciation
273 80 - - - - 353
Depreciation on transfers 437 12 11 -3 -20 - 437Deprecation on transfers to foundation schools
- - - - - - -
Revaluations - write back depreciation
135,576 - - - - - 135,576
Transfer of building assets to Academy schools
12,046 2,053 - - - - 14,099
Accumulated depreciation -632,830 -83,708 -159,789 -4 -9,760 - -886,091
at 31 March 2012
Net book value (NBV) of fixed assets at 31 March 2011
3,132,183 54,824 512,705 14,254 6,600 37,035 3,757,601
Net book value 3,022,345 48,673 550,231 13,662 7,386 35,619 3,677,916
at 31 March 2012
Nature of asset holding
Owned 2,920,316 48,673 550,231 13,662 7,386 35,619 3,575,887PFI/service concessions (see note 30)
102,029 - - - - - 102,029
3,022,345 48,673 550,231 13,662 7,386 35,619 3,677,916
77
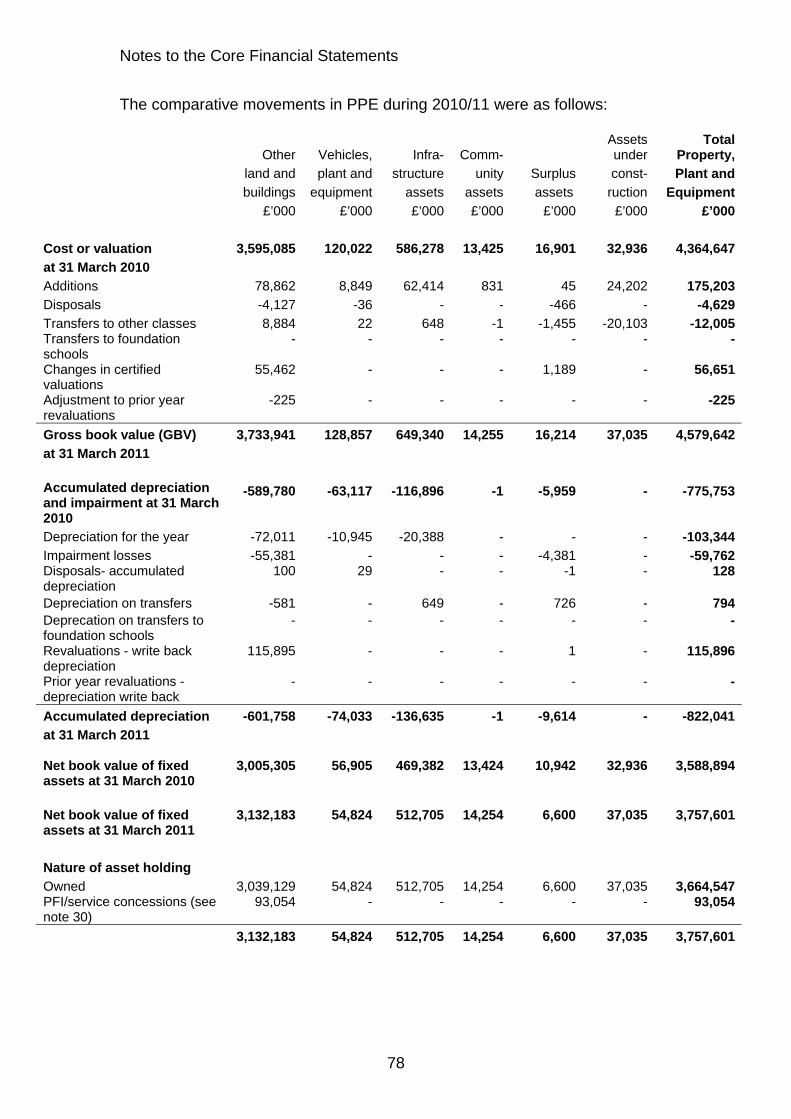
Notes to the Core Financial Statements
The comparative movements in PPE during 2010/11 were as follows:
Other Vehicles, Infra- Comm- Assets under
Total Property,
land and plant and structure unity Surplus const- Plant and
buildings equipment assets assets assets ruction Equipment
£’000 £’000 £’000 £’000 £’000 £’000 £’000
Cost or valuation 3,595,085 120,022 586,278 13,425 16,901 32,936 4,364,647
at 31 March 2010
Additions 78,862 8,849 62,414 831 45 24,202 175,203
Disposals -4,127 -36 - - -466 - -4,629
Transfers to other classes 8,884 22 648 -1 -1,455 -20,103 -12,005Transfers to foundation schools
- - - - - - -
Changes in certified valuations
55,462 - - - 1,189 - 56,651
Adjustment to prior year revaluations
-225 - - - - - -225
Gross book value (GBV) 3,733,941 128,857 649,340 14,255 16,214 37,035 4,579,642
at 31 March 2011
-589,780 -63,117 -116,896 -1 -5,959 - -775,753Accumulated depreciation and impairment at 31 March 2010 Depreciation for the year -72,011 -10,945 -20,388 - - - -103,344
Impairment losses -55,381 - - - -4,381 - -59,762Disposals- accumulated depreciation
100 29 - - -1 - 128
Depreciation on transfers -581 - 649 - 726 - 794Deprecation on transfers to foundation schools
- - - - - - -
Revaluations - write back depreciation
115,895 - - - 1 - 115,896
Prior year revaluations - depreciation write back
- - - - - - -
Accumulated depreciation -601,758 -74,033 -136,635 -1 -9,614 - -822,041
at 31 March 2011 Net book value of fixed assets at 31 March 2010
3,005,305 56,905 469,382 13,424 10,942 32,936 3,588,894
Net book value of fixed assets at 31 March 2011
3,132,183 54,824 512,705 14,254 6,600 37,035 3,757,601
Nature of asset holding
Owned 3,039,129 54,824 512,705 14,254 6,600 37,035 3,664,547PFI/service concessions (see note 30)
93,054 - - - - - 93,054
3,132,183 54,824 512,705 14,254 6,600 37,035 3,757,601
78

Notes to the Core Financial Statements
10b Capital commitments Commitments for major contracts entered into up to 31 March 2012 are estimated at £12.7 million (£37 million in 2010/11). This comprises £3.8 million (£9.4 million in 2010/11) for highways and £8.9 million (£27.6 million in 2010/11) for buildings. 10c Valuation of assets The freehold and leasehold properties of the Council's property portfolio, including investment properties, have been valued, under a rolling programme, by the County Council's property services staff. Valuations were carried out in accordance with the methodologies and bases of estimation set out in the professional standards of the Royal Institute of Chartered Surveyors. IAS 16 requires the dates and amounts of valuations to be analysed across each of the classes of assets carried at current value. No analysis is required for assets valued at historic cost. Other land Vehicles, Infra- Community Surplus
and plant and structure assets assets
buildings equipment
Valuation £’000 £’000 £’000 £’000 £’000
Valued at historic cost - 48,673 550,231 13,662 -
Pre 2007/08 2,920 - - - 59
2007/08 303,864 - - - 330
2008/09 530,100 - - - 647
2009/10 655,588 - - - 1,220
2010/11 821,689 - - - 2,862
2011/12 708,184 - - - 2,268
Total 3,022,345 48,673 550,231 13,662 7,386 10d Impairment Losses During 2011/12, the County Council has recognised impairment losses of £104m (£61.8m in 2010/11). Of this, £0.18m relates to assets held for sale reflecting a fall in the anticipated market value, £0.12m relates to land and buildings valued on the basis of existing use, again reflecting changes in market conditions and £103.7m relates to land and buildings that are valued on a depreciated replacement cost (DRC) basis. DRC is based on the instant build of a modern equivalent asset, depreciated to reflect its age and physical deterioration. As such the DRC valuation can be lower than the initial recognition of actual capital expenditure.
79

Notes to the Core Financial Statements
10e Foundation and aided school assets The fixed assets of foundation schools are vested in the governing bodies of the schools, so the value of the assets has not been included in this Balance Sheet. On 31 March 2012 there were 17 foundation schools (28 in 2010/11). The fixed assets of Aided schools are vested in the governing bodies of the schools, so the value of the assets has not been included in this Balance Sheet. On 31 March 2012 there were 55 aided schools (56 in 2010/11). 10f Heritage Assets Land/building heritage assets The County Council owns a number of historical buildings and archaeological sites that are classified as heritage assets. These include several archaeological sites of Iron Age and Roman settlements in Hampshire, such as Silchester Roman town. Operational heritage assets (held within PPE) include the Great Hall, a 13th century hall built as part of Winchester Castle, with the 5.5m medieval Round Table on the west wall. This is also used for operational meetings, exhibitions and wedding ceremonies. Access to these assets is permitted to members of the public. Sometimes an entrance charge may be payable – the proceeds of this are used to help run and maintain the site and to provide visitor information. Detailed information about opening hours, entrance fees, access and facilities is available through the Council’s website: http://www.hants.gov.uk/ Records of these assets form part of the Archaeology & Historic Buildings Record, which is available online and supplemented by a computer database linked to a digital mapping system, and by a paper-based archive which includes fieldwork and survey reports, articles, images, and aerial photographs. There have been no material acquisitions, disposals or impairments of heritage assets in the past two years. It is not practicable to provide information for accounting periods before then.
80

Notes to the Core Financial Statements
Museum collections Archaeology The archaeology collections consist of excavation and fieldwork archives from around the county. The largest collection is the Danebury collection, which relates to the Danebury Hill Fort and is the main source of exhibits for the Museum of the Iron Age in Andover. Notable pieces in the archaeology collection include the Alton buckle, a decorative Anglo-Saxon belt buckle and the Selbourne cup, a Roman enamelled bronze vessel. Art and design The art and design collections comprises of more than 100,000 items. Historic dress and textiles are well represented, with embroideries from the 17th century and dress and accessories from the 18th century onwards. A significant display of these items is at the Red House Museum. The art and design collections also contain many examples from the decorative arts, including around 8,500 ceramic items dating from 1250 onwards, many of which are on display at the Allen Gallery in Alton. There are also printed maps, topographical pictures and many local photographs. Social and industrial history The social and industrial history collections contain items that provide material evidence of everyday life and work in Hampshire, from 1500 to the present day. The collection consists of military, social and domestic items, transport, technology and rural life material. The collection forms one of the core elements of the Milestones Museum displays. Material is also on display throughout local Community Museums in Hampshire. Natural science The biology collection consists of approximately 125,000 specimens of preserved plants and animals, mainly from the British Isles. These date from 1737 onwards, although most were collected in the past 150 years. They provide important supporting evidence for the biodiversity of the county. The geology collection consists of over 25,000 Hampshire rocks and fossils (mainly collected in the past 50 years). It also includes numerous rocks, minerals and fossils from elsewhere in the British Isles and a comprehensive library containing books, publications, borehole logs, maps, site plans and photographs. Important geological material is on display in a special gallery at Gosport Discovery Centre. Records, access and collecting policy When an item is accepted into a museum collection, it is logged onto the accessions register. The record is entered onto a database, and will contain a
81

Notes to the Core Financial Statements
detailed physical description, deposit information and collections management details. Some of this information is also accessible through the County Council’s website as online searchable databases at http://www3.hants.gov.uk/museum/collections-2 A significant proportion of the County Council’s museum collection is on display at various museums and other community sites across Hampshire. The Museums Service also organises touring exhibitions and may loan items to other museums. Items not currently on display are stored at Chilcomb House in Winchester, and may be viewed for research purposes by appointment. The collection and disposal policy is available through the County Council’s website: http://www3.hants.gov.uk/museums-collecting-policy.pdf Archives The Archives and Local Studies service at Hampshire Record Office in Winchester collects, preserves and makes accessible archives and local studies material relating to Hampshire and Hampshire families, and film and sound archives relating to central southern England. The collections held date from the 12th century to the present and comprise nearly 8 miles of shelving. The archives have been designated by the Museums, Libraries and Archives Council as an outstanding collection of national and international importance. Their scope and importance is summarised in the following document: http://www.hants.gov.uk/rh/archives/designation-statement.pdf. The Winchester Bishopric Pipe Rolls are on the UNESCO UK Memory of the World Register. Many of the items in the archives are not owned by the County Council, but have been deposited with the Record Office by a range of public bodies and private institutions and individuals. Accessions, cataloguing and conservation data about the collections are maintained on a database; public online access to the catalogue is provided via the website. Signed deposit agreement/ gift forms are maintained. The deposit agreement form is accessible on the website: http://www3.hants.gov.uk/archives/hals-deposit-conditions.htm The County Council takes all reasonable precautions to preserve the assets from loss, theft or damage, but does not insure its archive collection. Insurance for any items deposited in the Record Office is the responsibility of the owner. It is the County Council’s policy not to value these items, due to their unique and irreplaceable nature. Access to the records is available at the Record Office, which is open six days a week: http://www3.hants.gov.uk/archives/visiting-hals.htm. Access to particularly fragile, and to sensitive archives is restricted.
82

Notes to the Core Financial Statements
Hampshire Record Office’s policies, including Collecting, Appraisal, Preservation, and Access and Learning, are accessible via the County Council’s website: http://www3.hants.gov.uk/archives/hro-policies.htm A list of new accessions is sent annually to The National Archives who publish this on their website. The latest complete list for is for 2010: http://www.nationalarchives.gov.uk/accessions/2010/10returns/10ac41.htm 11 Investment properties The following items of income and expense have been accounted for in the Financing and Investment Income and Expenditure line in the Comprehensive Income and Expenditure Statement. 2010/11 2011/12
£’000 £’000
Rental income from investment property -969 -913
Direct operating expenses arising from investment property 390 389
Net (gain) -579 -524 There are no restrictions on the County Council's ability to realise the value inherent in its investment property or on the County Council's right to the remittance of income and the proceeds of disposal. The County Council has no contractual obligations to purchase, construct or develop investment property or repairs, maintenance or enhancement. The following table summarises the movement in the fair value of investment properties over the year. 2010/11 2011/12
£’000 £’000
Balance at start of the year 42,032 46,168
Additions:
- purchases - -
- construction - -
- subsequent expenditure 507 116
Disposals -1,875 -420
Net gains/losses from fair value adjustments 5,504 772
Transfers:
- to/from Inventories - -250
- to/from Property, Plant and Equipment - -186
Balance at end of the year 46,168 46,200
83

Notes to the Core Financial Statements
12 Financial Instruments The term 'financial instrument' covers both financial assets and liabilities and includes debtors, creditors, the Council's borrowings, PFI liabilities and investment transactions. The financial assets and liabilities disclosed in the Balance Sheet are analysed across the following categories: Long term Current
31 March 31 March 31 March 31 March
see 2011 2012 2011 2012
note £’000 £’000 £’000 £’000
Loans and receivables at amortised cost:
Long-term debtors 12a 1,438 1,456 - -
Debtors 12b - - 77,472 82,188
Short-term investments 12c - - 171,171 194,736
Long-term investments 12c 10,000 65,000 - -
11,438 66,456 248,643 276,924Loans and receivables at amortised cost
Financial liabilities at amortised cost:
Long-term borrowing 12d -365,895 -376,155 - -
Short-term borrowing 12e - - -36,313 -48,052
Developers' contributions 12f -44,937 -46,184 - -
Deposits 12h - - -679 -881
Creditors 12i - - -173,881 -165,385
Receipts in advance 12j - - -96,068 -60,845
PFI & finance lease liabilities 30 -88,544 -96,991 -5,935 -6,211
-499,376 -519,330 -312,876 -281,374Financial liabilities at amortised cost All financial instruments are carried in the Balance Sheet at amortised cost, although the fair value of investments and borrowings are included in disclosure notes 12c, 12d and 12e.
84
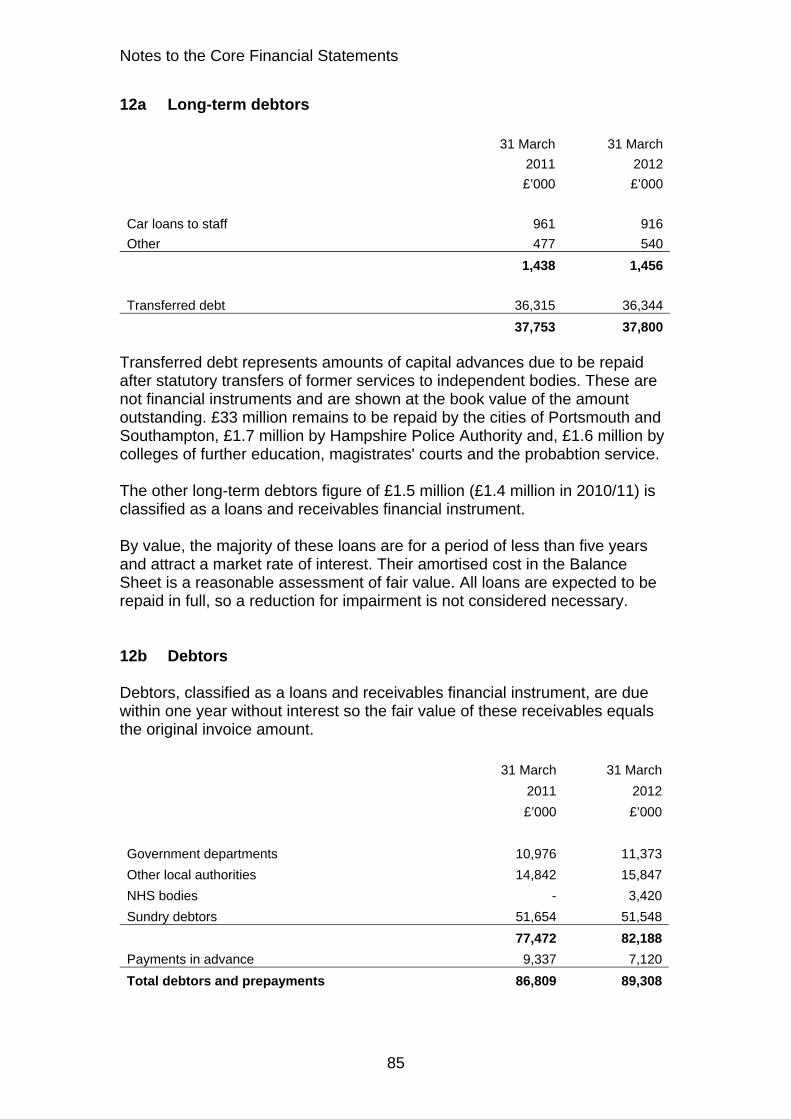
Notes to the Core Financial Statements
12a Long-term debtors 31 March 31 March
2011 2012
£’000 £’000
Car loans to staff 961 916
Other 477 540
1,438 1,456
Transferred debt 36,315 36,344
37,753 37,800 Transferred debt represents amounts of capital advances due to be repaid after statutory transfers of former services to independent bodies. These are not financial instruments and are shown at the book value of the amount outstanding. £33 million remains to be repaid by the cities of Portsmouth and Southampton, £1.7 million by Hampshire Police Authority and, £1.6 million by colleges of further education, magistrates' courts and the probabtion service. The other long-term debtors figure of £1.5 million (£1.4 million in 2010/11) is classified as a loans and receivables financial instrument. By value, the majority of these loans are for a period of less than five years and attract a market rate of interest. Their amortised cost in the Balance Sheet is a reasonable assessment of fair value. All loans are expected to be repaid in full, so a reduction for impairment is not considered necessary. 12b Debtors Debtors, classified as a loans and receivables financial instrument, are due within one year without interest so the fair value of these receivables equals the original invoice amount. 31 March 31 March
2011 2012
£’000 £’000
Government departments 10,976 11,373
Other local authorities 14,842 15,847
NHS bodies - 3,420
Sundry debtors 51,654 51,548
77,472 82,188
Payments in advance 9,337 7,120
Total debtors and prepayments 86,809 89,308
85

Notes to the Core Financial Statements
12c Investments Surplus cash balances are lent to borrowers on the Council's approved list. Short term investments are due to be repaid within a year and so their amortised cost in the Balance Sheet is a reasonable assessment of their fair value. Long term investments are not due to be repaid until after a year from the Balance Sheet date. The fair value of the Council's long term investments are as follows: 31 March 2011 31 March 2012
Amortised Fair Amortised Fair
cost value cost value
£’000 £’000 £’000 £’000
Market investments 10,000 10,059 65,000 66,381 The fair value is more than the amortised cost as the Council's portfolio of investments includes a number of fixed rate investments where the interest rate receivable is higher than the rates that would be achieved on the balance sheet date. 12d Long term borrowing Long-term borrowing is carried in the Balance Sheet at amortised cost. The fair value can be assessed by calculating the present value of the cash flows that will take place over the remaining term of the instruments, using premature repayment interest rates from the Public Works Loan Board (PWLB). For market loans, in the absence of information requested from the lender, the Council's Treasury Adviser calculated the fair value based on equivalent swap rates at the Balance Sheet date.
31 March 2011 31 March 2012
Amortised Fair Amortised Fair
cost value cost value
£’000 £’000 £’000 £’000
Public Works Loan Board -292,583 -328,894 -302,967 -377,478Market loans -73,312 -77,564 -73,188 -89,596
-365,895 -406,458 -376,155 -467,074 The fair value is more than the amortised cost because the Council's portfolio of loans includes a number of fixed-rate loans where the interest rate payable is higher than the rates that would be applied to calculate the premiums if the loans were repaid on the Balance Sheet date. This commitment to pay interest above the current market rates increases the amount that the County Council would have to pay if it repaid the loans early.
86

Notes to the Core Financial Statements
12e Borrowing repayable within one year Long-term borrowing repayable within one year is shown at its fair value, which is assessed by calculating the present value of the cash flows that will take place over the remaining term of the instruments using premature repayment interest rates from the Public Works Loan Board (PWLB). For all other loans due to be repaid within a year, their amortised cost in the Balance Sheet is a reasonable assessment of their fair value. 31 March 2011 31 March 2012
Amortised Fair Amortised Fair
cost value cost value
£’000 £’000 £’000 £’000
Long-term borrowing repayable within one year
-10,936 -11,271 -12,314 -12,910
Other short-term borrowing -25,377 -25,377 -35,738 -35,738
-36,313 -36,648 -48,052 -48,648 12f Developers' contributions Developers' contributions arise mainly as a result of agreements under Section 106 of the Town and Country Planning Act 1990 and also Section 278 of the Highways Act 1980 if a development derives special benefit from highway works, developers can be required to contribute towards the costs. Before being applied, deposits are credited with interest on the basis of market rates. Therefore the carrying amount is a reasonable assessment of the fair value of the financial liability. 2010/11 2011/12
Highways Other Total Highways Other Total
£’000 £’000 £’000 £’000 £’000 £’000
Balance at 1 April -33,172 -1,051 -34,223 -39,496 -5,441 -44,937
Income -13,727 -5,441 -19,168 -8,935 -6,044 -14,979
Contributions applied 7,403 1,051 8,454 7,068 6,664 13,732
Balance at 31 March -39,496 -5,441 -44,937 -41,363 -4,821 -46,184 12g Short-term creditors Short-term creditors includes deposits, creditors and receipts in advance as detailed below.
87

Notes to the Core Financial Statements
12h Deposits 31 March 31 March
2011 2012
£’000 £’000
Capital deposits and unapplied contributions -424 -695
Other -255 -186
-679 -881 12i Creditors The County Council's policy is to pay creditors within 30 days of the date shown on the invoice. Therefore, the invoice amount is a reasonable assessment of the fair value of the financial liability. 31 March 31 March
2011 2012
£’000 £’000
HM Revenue and Customs and Government departments -23,627 -22,242
NHS Bodies - -7,098
Other local authorities -14,917 -17,169
Sundry creditors -135,337 -118,876
-173,881 -165,385 12j Receipts in advance 31 March 31 March
2011 2012
£’000 £’000
Grants (see note 26 for breakdown) -79,038 -50,601
Other receipts and contributions -17,030 -10,244
-96,068 -60,845
88
Notes to the Core Financial Statements
12k Nature and extent of risks arising from financial instruments The Council has adopted CIPFA’s Revised Code of Practice on Treasury Management and complies with The Revised Prudential Code of Capital Finance for Local Authorities (both updated in November 2011). As part of the adoption of the Treasury Management Code, the Council approves a Treasury Management Strategy before the commencement of each financial year. The Strategy sets out the parameters for the management of risks associated with financial instruments. The Council also produces Treasury Management Practices specifying the practical arrangements to be followed to manage these risks. The Treasury Management Strategy includes an Annual Investment Strategy in compliance with the Government's Investment Guidance for local authorities. This Guidance emphasises that priority is to be given to security and liquidity, rather than yield. The Council’s Treasury Strategy, together with its Treasury Management Practices are based on seeking the highest rate of return consistent with the proper levels of security and liquidity. The main risks covered are: Credit risk: the possibility that banks and financial institutions will fail to meet their contractual obligations, causing a loss to the Council. Liquidity risk: the possibility that the Council will be unable to raise funds to meet its payment commitments as they fall due. Market risk: the possibility that the value of an instrument will fluctuate because of changes in interest rates, market prices etc. Credit risk The Council manages credit risk by ensuring that investments are placed with the UK Government’s Debt Management Office, other local authorities, AAA-rated money market funds or banks and building societies having sufficiently high credit worthiness as set out in the Council’s Annual Investment Strategy. A maximum investment limit of £60 million is placed on the amount of money that can be invested with a single counterparty. No more than £120 million in total can be invested for a period longer than 364 days, although the maximum investment being placed with one institution will be restricted to £20 million. The Council has no historical experience of counterparty default. It should be noted that although credit ratings remain a key source of information, the Council recognises that they have limitations and investment decisions are based on a range of market intelligence. All investments have been made in line with the Council’s Annual Investment Strategy for 2011/12, approved by Full Council on 24 February 2011.
89

Notes to the Core Financial Statements
Until February 2012, the minimum criteria for new investments was a long term rating of A+. Following downgrades to a number of systemically important financial institutions in autumn 2011, a lower minimum credit rating criteria of A- was adopted by the Council once the revised Treasury Strategy was approved by Full Council. The table below summarises the nominal value of the Council’s investment portfolio at 31 March 2012, and confirms that all investments were made in line with the Council’s approved credit rating criteria:
Counterparty
Credit rating
criteria met when
investment placed?
Credit rating
criteria met on 31 March 2012?
Balance invested as at 31 March 2012 Total
Yes/No Yes/No Up to 1 month
> 1 month
and < 6 months
> 6 months
and < 12 months
> 12 months
£000 £000 £000 £000 £000
Banks - UK Yes Yes 45,000 77,500 - 15,000 137,500
Building Societies - UK Yes Yes - 45,000 - - 45,000
Other local authorities Yes Yes - 20,000 5,000 50,000 75,000
Call accounts Yes Yes 62,450 - - - 62,450
Total 107,450 142,500 5,000 65,000 319,950 Invoiced debtors risk The invoiced debtors have been reviewed by age to determine an appropriate provision for debts that are likely to be uncollectable. A provision of £4.9 million (£2.2 million in 2010/11) has been estimated.
Outstanding debt raised in
Outstanding balance due at 31
March 2012
Individually assessed
impairment
Collectively assessed
impairment Total
provision
£’000 £’000 £’000 £’000
2011/12 15,166 - 1,737 1,737
2009/10 & 2010/11 2,431 789 1,395 2,184
before 2009/10 949 237 712 949
18,546 1,026 3,844 4,870 Liquidity risk As the Council has ready access to borrowing through the Public Works Loan Board, other local authorities and commercial banks, there is no perceived risk that the Council will be unable to raise finance to meet its commitments under financial instruments. Instead, the risk is that the Council will be bound
90
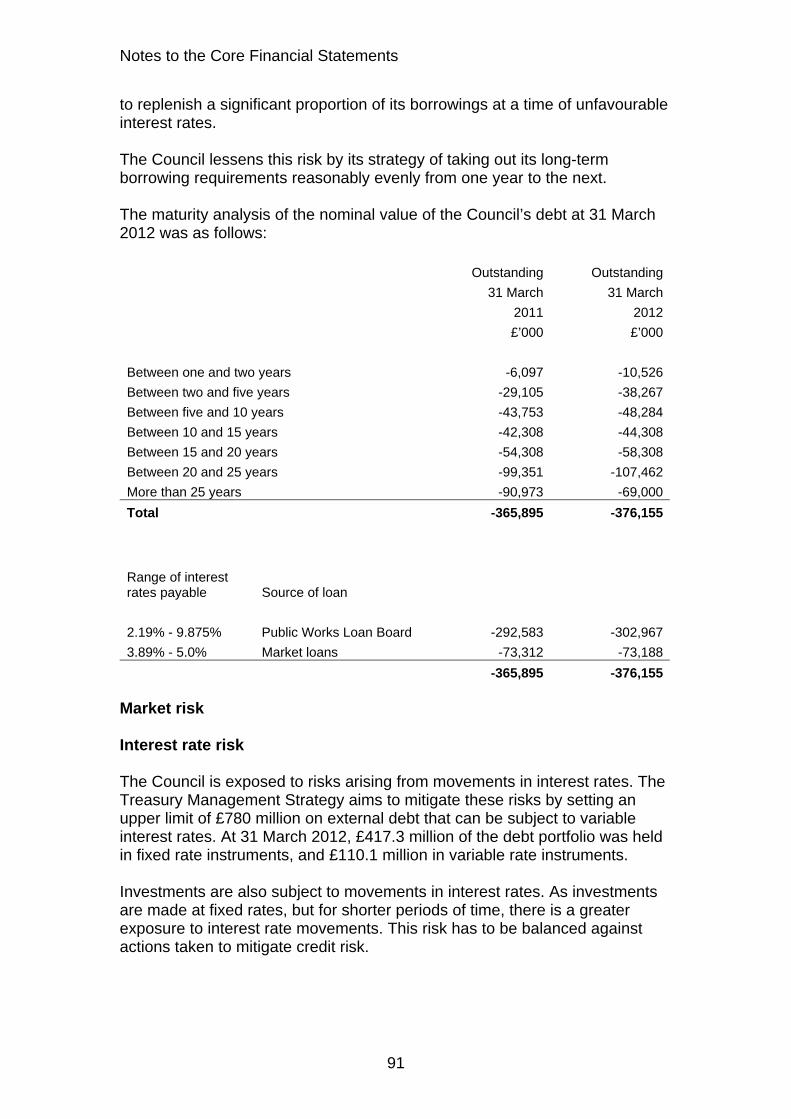
Notes to the Core Financial Statements
to replenish a significant proportion of its borrowings at a time of unfavourable interest rates. The Council lessens this risk by its strategy of taking out its long-term borrowing requirements reasonably evenly from one year to the next. The maturity analysis of the nominal value of the Council’s debt at 31 March 2012 was as follows: Outstanding Outstanding
31 March 31 March
2011 2012
£’000 £’000
Between one and two years -6,097 -10,526
Between two and five years -29,105 -38,267
Between five and 10 years -43,753 -48,284
Between 10 and 15 years -42,308 -44,308
Between 15 and 20 years -54,308 -58,308
Between 20 and 25 years -99,351 -107,462
More than 25 years -90,973 -69,000
Total -365,895 -376,155
Range of interest rates payable Source of loan
2.19% - 9.875% Public Works Loan Board -292,583 -302,967
3.89% - 5.0% Market loans -73,312 -73,188
-365,895 -376,155 Market risk Interest rate risk The Council is exposed to risks arising from movements in interest rates. The Treasury Management Strategy aims to mitigate these risks by setting an upper limit of £780 million on external debt that can be subject to variable interest rates. At 31 March 2012, £417.3 million of the debt portfolio was held in fixed rate instruments, and £110.1 million in variable rate instruments. Investments are also subject to movements in interest rates. As investments are made at fixed rates, but for shorter periods of time, there is a greater exposure to interest rate movements. This risk has to be balanced against actions taken to mitigate credit risk.
91

Notes to the Core Financial Statements
If all interest rates had been 1% higher (with all other variables held constant) the financial effect would be: £’000
Increase in interest payable on variable rate borrowing 1,168
Increase in interest receivable on variable rate investments -3,516
Net cost/(saving) -2,348 The impact of a 1% fall in interest rates would be as above but with the movements being reversed. Price risk The Council does not invest in equity shares and has no shareholdings in joint ventures or local industry. There is, therefore, no exposure to price risk. Foreign exchange risk The Council has no material financial assets or liabilities denominated in a foreign currency. It therefore has no exposure to loss arising as a result of adverse movements in exchange rates. 13 Cash and cash equivalents Cash comprises cash on hand and demand deposits. Balances classified as 'Cash Equivalents' fit the definition of being short-term, highly liquid investments that are readily convertible to known amounts of cash and which are subject to an insignificant risk of changes in value. The balance of Cash and Cash Equivalents is made up of the following elements at the Balance Sheet date: 31 March 31 March
2011 2012
£’000 £’000
Cash in hand 5,196 3,229
Call accounts (same day access funds) 33,550 62,450
Total cash and cash equivalents 38,746 65,679
Bank overdraft -7,561 -10,245
Net cash and cash equivalents 31,185 55,434
92

Notes to the Core Financial Statements
14 Inventories 31 March Purchases Expense Written 31 March
2011 in the off 2012
year balances
£’000 £’000 £’000 £’000 £’000
Stocks
Catering stock 429 7,128 -7,104 -5 448
County Supplies general 1,363 6,760 -6,538 -5 1,580
247 525 -486 -23 263Culture, Communities & Business Services sales stocks
Salt stock - 431 -191 - 240Other (including landfill allowances)
337 6,642 -6,569 -8 402
2,376 21,486 -20,888 -41 2,933
Construction contracts Work not Value of Income Value of
recharged
atnew work
donereceived
in work not
recharged
2011 2011/12 2011/12 2012
£’000 £’000 £’000 £’000
Highway rechargeable works 520 981 -914 587
Other 60 -46 14
580 981 -960 601
Total stocks and work in progress
2,956 22,467 -20,888 -1,001 3,534
Closing stock valuations have been assessed using the latest purchase price. This does not accord with the International Accounting Standard 2 which requires stock to be valued at the lower of the original purchase price and current value but the differences in the valuations are not material.
93

Notes to the Core Financial Statements
15 Assets held for sale 2010/11 2011/12
£’000 £’000
Balance outstanding at start of year 8,432 13,766
Assets newly classified as held for sale:
- property, plant and equipment 9,863 -
- other assets/liabilities in disposal groups 184 250
Revaluation gains and losses -450 84
Impairment losses -2,067 -184
Assets declassified as held for sale - -
Assets sold -2,196 -3,305
Balance outstanding at year-end 13,766 10,611 16 Change in provisions 31 March Change in 2011/12 31 March 2011 Central Service 2012 Provision Provision £’000 £’000 £’000 £’000 Insurance claims a -6,921 1,303 -2,134 -7,752Contract terminations b -249 - - -249
c -5,636 - -387 -6,023Non school employee related expenditure
c - - -5,673 -5,673School employee related expenditure Tax liabilities d - - -5,521 -5,521Other e -10 - -969 -979Provisions identified in -12,816 1,303 -14,684 -26,197the Balance Sheet Provision for doubtful debts (included with debtors in the Balance Sheet) -2,200 -2,000 -670 -4,870
- -697 -15,354 -Net change included in the Comprehensive Income and Expenditure Statement
a. The insurance provision represents an assessment of the likely cost of liability claims known to the Council at 31 March 2012. The risks covered are as follows: Liabilities Employer's liability, public liability and professional indemnity up to a total loss of £14 million in any one year. Should this limit ever be exceeded, the maximum liability for any one claim would be £5 million.
94

Notes to the Core Financial Statements
Property Reinstatement of buildings for loss or damage as a result of fire, lightning, explosion and (for schools only) major storm and flood. This applies to buildings owned by the Council and those leased to it where the lease allows. Contents owned by the Council for loss or damage as a result of fire, lightning, explosion and theft, all-risk cover for IT equipment in the computer suite, and for cash on premises and in transit (limits depending on location). Additional cover Personal accident of staff on duty Fidelity guarantee Vessels b. Council departments currently continue to perform services on contract where functions have been transferred from the Council. The contract termination provision recognises that the Council is likely to incur certain costs when these arrangements eventually end. c. As a result of its efficiency and transformation programme, and historic conclusions regarding prior reviews, the Council has made provision for likely payments due to individual employees. d. Linked to the provision for employee related costs, the Council has provided for the probable resulting tax liability. e. This provision covers other liabilities, including that relating to the need to purchase allowances to offset the Councils carbon dioxide emissions through its use of energy.
95

Notes to the Core Financial Statements
17 Unusable reserves Movements in the Council's reserves are detailed in the Movement in Reserves Statement. Unusable reserves are detailed in the table below. See Balance Net Balance
note 1 April movement 31 March
2011 in the year 2012
£’000 £’000 £’000
Reserve
Revaluation reserve 17a -719,507 -77,917 -797,424
Capital adjustment account 17b -2,386,840 133,127 -2,253,713Financial instrument adjustment account
17c 79 -79 -
Pensions reserve 17d 753,960 224,290 978,250
Deferred capital receipts reserve 17e - -1,116 -1,116
Collection fund adjustment account 17f -6,656 -1,351 -8,007
Accumulated absences account 17g 15,943 -1,948 13,995
-2,343,021 275,006 -2,068,015 17a Revaluation Reserve The Revaluation Reserve contains the gains made by the County Council arising from increases in the value of its Property, Plant and Equipment. The balance is reduced when assets with accumulated gains are: revalued downwards or impaired and the gains lost used in the provision of services and the gains are consumed through
depreciation, or disposed of and the gains are realised. The reserve contains only revaluation gains accumulated since 1 April 2007, the date that the reserve was created. Accumulated gains arising before that date are consolidated into the balance on the Capital Adjustment Account. 2010/11 2011/12
£’000 £’000
Balance at 1 April -567,025 -719,507Surplus or deficit on revaluation of non-current assets not posted to the Surplus or Deficit on the Provision of Services
-172,096 -136,469
Difference between fair value depreciation and historical cost depreciation
16,097 20,346
Adjustments to prior year revaluations - -
Write off net gains for assets transferred to Academy schools - 38,040Accumulated gains on assets sold, scrapped or transferred to/from current assets
3,517 166
Amount written off to the Capital Adjustment Account 19,614 58,552
Balance at 31 March -719,507 -797,424
96

Notes to the Core Financial Statements
17b Capital Adjustment Account The Capital Adjustment Account absorbs the timing differences arising from the different arrangements for accounting for the consumption of non-current assets and for financing the acquisition, construction or enhancement of those assets under statutory provisions. This account contains expenditure financed from revenue and capital receipts together with the statutory amount required to provide for the repayment of external loans less the amounts included for depreciation, impairment and revenue expenditure financed by capital under statute and the historic cost of asset disposals. The reserve is not cash backed. The movement in the account is analysed below: 2010/11 2011/12
£’000 £’000
Balance brought forward 1 April -2,395,430 -2,386,840 Reversal of items relating to capital expenditure debited or credited to the Comprehensive Income and Expenditure Statement:
Charges for depreciation and impairment of noncurrent assets 165,174 214,699
Revenue expenditure funded from capital under statute 9,244 14,091
Assets disposals current value 8,569 4,091
Assets transferred to Academy schools current value 129,969
-2,212,443 -2,023,990
Adjusting amounts written out of Revaluation Reserve: Excess of current value depreciation over historic cost depreciation
-16,097 -20,346
Write off net gains for assets transferred to Academy Schools and to/from current assets
- -37,604
Write out revaluations on asset disposals -3,517 -602
Adjustment to prior year revaluations 227 -
-19,387 -58,552
Net written out amount of the cost of assets consumed in the year -2,231,830 -2,082,542
Capital financing applied in the year
Capital receipts applied -13,030 -6,698
Statutory minimum revenue provision for capital financing -31,839 -33,871
Debt outstanding on transferred services - -1,775
External contribution to minimum revenue provision 1,646 1,746
Revenue contributions to capital expenditure -16,107 -46,088
Capital grants and contributions applied -90,176 -83,713
-149,506 -170,399
Movement in the market value of investment properties -5,504 -772
Balance as at 31 March -2,386,840 -2,253,713
97

Notes to the Core Financial Statements
17c Financial Instruments Adjustment Account The balance on the financial instruments adjustment account at the end of the financial year represents the amount that should have been charged to the Comprehensive Income and Expenditure Statement in accordance with proper accounting practice, but which statutory provisions allow or require to be deferred over future years. The Council uses the account to offset the effective interest rate charged to the Comprehensive Income and Expenditure Statement in respect of one soft loan. One interest-free loan was advanced in 2007/08 to enable a foster carer to purchase a larger house. The amount was £247,597, repayable in monthly instalments within 30 years. The balance of effective interest remaining is now immaterial and has been written down in full by crediting the Comprehensive Income and Expenditure Statement in 2011/12 with £78,788 (£9,215 in 2010/11) calculated at the market rate prevailing when the loan was advanced. The Local Authorities (Capital Financing and Accounting) (Amendment) (England) Regulations 2007 allow this to be transferred to a financial instrument adjustment account so that it does not affect the General Fund. 2010/11 2011/12
£’000 £’000
Balance brought forward 1 April 88 79
Effective interest credited to Income and Expenditure account -9 -79
Balance at 31 March 79 -
98

Notes to the Core Financial Statements
17d Pensions Reserve The pensions reserve absorbs the timing differences arising from the different arrangements for accounting for post employment benefits and for funding benefits in accordance with statutory provisions. The Council accounts for post employment benefits in the Comprehensive Income and Expenditure Statement as the benefits are earned by employees accruing years of service, updating the liabilities recognised to reflect inflation, changing assumptions and investment returns on any resources set aside to meet the costs. However, statutory arrangements require benefits earned to be financed as the Council makes employer's contributions to pension funds or eventually pays any pensions for which it is directly responsible. The debit balance on the Pensions Reserve therefore shows a shortfall in the benefits earned by past and current employees and the resources the Council has set aside to meet them. The statutory arrangements will ensure that funding will have been set aside by the time the benefits come to be paid. 2010/11 2011/12
£’000 £’000
Balance at 1 April 963,330 753,960
Actuarial losses on pensions assets and liabilities 18,770 226,020
-148,075 68,962Reversal of items relating to retirement benefits debited or credited to the Surplus or Deficit on the Provision of Services in the Comprehensive Income and Expenditure Statement Employer's pensions contributions and direct payments to pensioners payable in the year
-80,065 -70,692
Balance at 31 March 753,960 978,250 17e Deferred Capital Receipts Reserve The deferred capital receipts reserve holds the gains recognised on the disposal of non-current assets but for which cash settlement has yet to take place. When the deferred cash settlement eventually takes place, amounts are transferred to the capital receipts reserve. 2010/11 2011/12
£’000 £’000
Balance at 1 April - -
Capital receipts agreed, not yet received - -1,116Transfer to the capital receipts reserve upon receipt of cash - -
Balance at 31 March - -1,116
99

Notes to the Core Financial Statements
17f Collection Fund Adjustment Account The collection fund adjustment account manages the differences arising from the recognition of council tax income in the Comprehensive Income and Expenditure Statement as it falls due from council tax payers compared with the statutory arrangements for paying across amounts to the General Fund from the District Council's Collection Funds. 2010/11 2011/12
£’000 £’000
Balance at 1 April -4,529 -6,656Accrued income in the Comprehensive Income and Expenditure account
-527,421 -531,284
Amount calculated in accordance with statutory requirements
525,294 529,933
Balance at 31 March -6,656 -8,007 17g Accumulated Absences Account The accumulated absences account absorbs the differences that would otherwise arise on the General Fund Balance from accruing for compensated absences earned but not taken in the year, e.g. annual leave entitlement carried forward at 31 March. Statutory arrangements require that the impact on the General Fund Balance is neutralised by transfers to or from the account. 2010/11 2011/12
£000 £000
Balance at 1 April 17,768 15,943Settlement or cancellation of accrual made at the end of the preceding year
-17,768 -15,943
Amounts accrued at the end of the current year 15,943 13,995
-1,825 -1,948
Amount by which officer remuneration charged to the Comprehensive Income and Expenditure Statement on an accruals basis is different from remuneration chargeable in the year in accordance with statutory requirements
Balance at 31 March 15,943 13,995
100
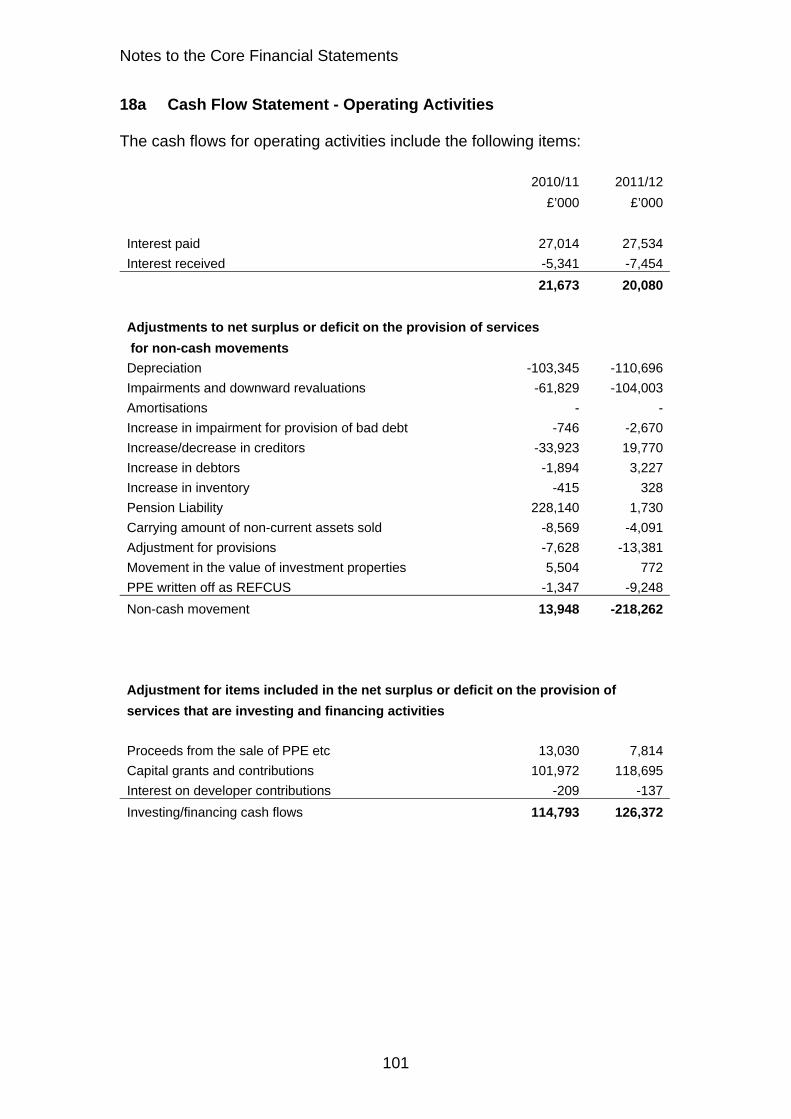
Notes to the Core Financial Statements
18a Cash Flow Statement - Operating Activities The cash flows for operating activities include the following items: 2010/11 2011/12
£’000 £’000
Interest paid 27,014 27,534
Interest received -5,341 -7,454
21,673 20,080
Adjustments to net surplus or deficit on the provision of services
for non-cash movements
Depreciation -103,345 -110,696
Impairments and downward revaluations -61,829 -104,003
Amortisations - -
Increase in impairment for provision of bad debt -746 -2,670
Increase/decrease in creditors -33,923 19,770
Increase in debtors -1,894 3,227
Increase in inventory -415 328
Pension Liability 228,140 1,730
Carrying amount of non-current assets sold -8,569 -4,091
Adjustment for provisions -7,628 -13,381
Movement in the value of investment properties 5,504 772
PPE written off as REFCUS -1,347 -9,248
Non-cash movement 13,948 -218,262
Adjustment for items included in the net surplus or deficit on the provision of
services that are investing and financing activities
Proceeds from the sale of PPE etc 13,030 7,814
Capital grants and contributions 101,972 118,695
Interest on developer contributions -209 -137
Investing/financing cash flows 114,793 126,372
101
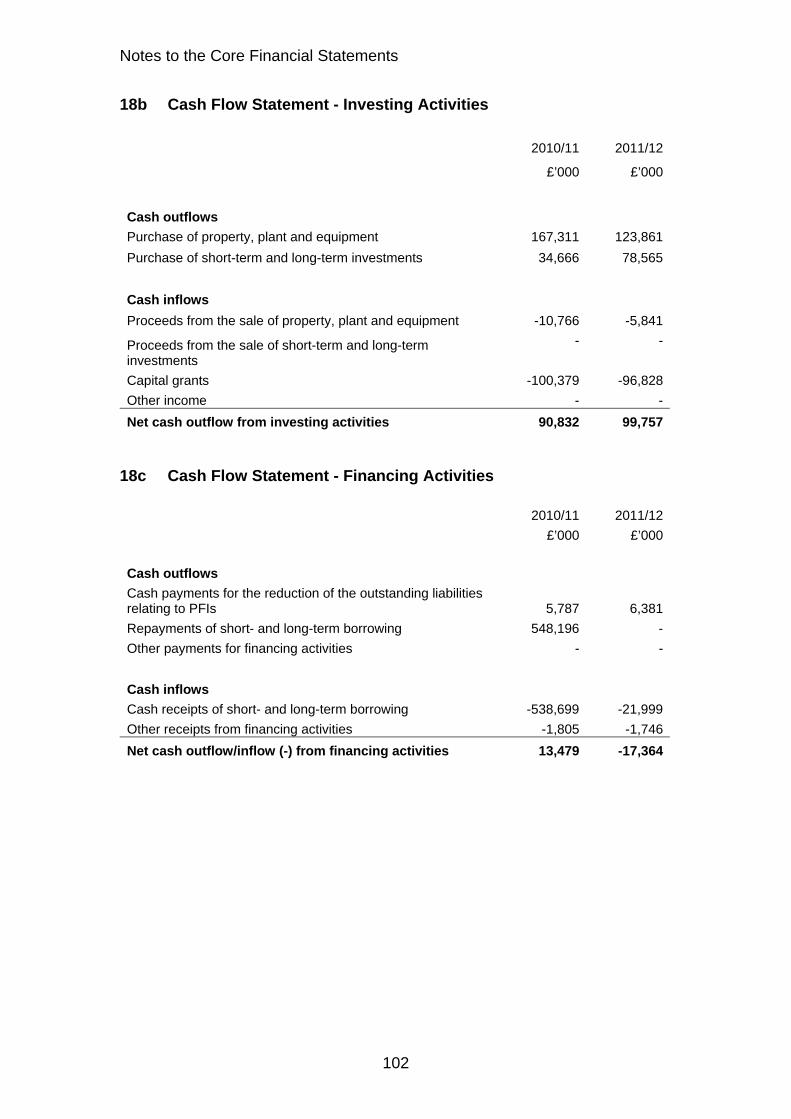
Notes to the Core Financial Statements
18b Cash Flow Statement - Investing Activities
2010/11 2011/12
£’000 £’000
Cash outflows
Purchase of property, plant and equipment 167,311 123,861
Purchase of short-term and long-term investments 34,666 78,565
Cash inflows
Proceeds from the sale of property, plant and equipment -10,766 -5,841
- -Proceeds from the sale of short-term and long-term investments
Capital grants -100,379 -96,828
Other income - -
Net cash outflow from investing activities 90,832 99,757 18c Cash Flow Statement - Financing Activities 2010/11 2011/12
£’000 £’000
Cash outflows
Cash payments for the reduction of the outstanding liabilities relating to PFIs 5,787 6,381
Repayments of short- and long-term borrowing 548,196 -
Other payments for financing activities - -
Cash inflows
Cash receipts of short- and long-term borrowing -538,699 -21,999
Other receipts from financing activities -1,805 -1,746
Net cash outflow/inflow (-) from financing activities 13,479 -17,364
102
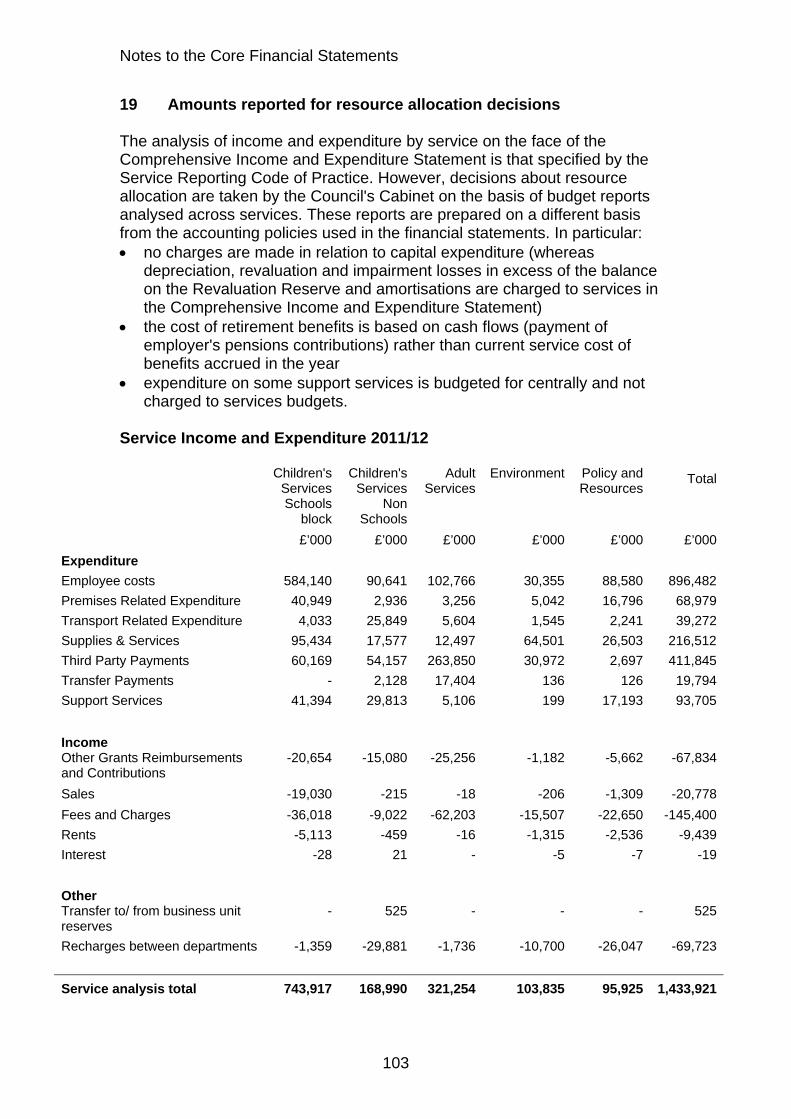
Notes to the Core Financial Statements
19 Amounts reported for resource allocation decisions The analysis of income and expenditure by service on the face of the Comprehensive Income and Expenditure Statement is that specified by the Service Reporting Code of Practice. However, decisions about resource allocation are taken by the Council's Cabinet on the basis of budget reports analysed across services. These reports are prepared on a different basis from the accounting policies used in the financial statements. In particular: no charges are made in relation to capital expenditure (whereas
depreciation, revaluation and impairment losses in excess of the balance on the Revaluation Reserve and amortisations are charged to services in the Comprehensive Income and Expenditure Statement)
the cost of retirement benefits is based on cash flows (payment of employer's pensions contributions) rather than current service cost of benefits accrued in the year
expenditure on some support services is budgeted for centrally and not charged to services budgets.
Service Income and Expenditure 2011/12
Total
Children's Services Schools
block
Children's Services
Non Schools
Adult Services
Environment Policy and Resources
£’000 £’000 £’000 £’000 £’000 £’000
Expenditure
Employee costs 584,140 90,641 102,766 30,355 88,580 896,482
Premises Related Expenditure 40,949 2,936 3,256 5,042 16,796 68,979
Transport Related Expenditure 4,033 25,849 5,604 1,545 2,241 39,272
Supplies & Services 95,434 17,577 12,497 64,501 26,503 216,512
Third Party Payments 60,169 54,157 263,850 30,972 2,697 411,845
Transfer Payments - 2,128 17,404 136 126 19,794
Support Services 41,394 29,813 5,106 199 17,193 93,705
Income Other Grants Reimbursements and Contributions
-20,654 -15,080 -25,256 -1,182 -5,662 -67,834
Sales -19,030 -215 -18 -206 -1,309 -20,778
Fees and Charges -36,018 -9,022 -62,203 -15,507 -22,650 -145,400
Rents -5,113 -459 -16 -1,315 -2,536 -9,439
Interest -28 21 - -5 -7 -19
Other Transfer to/ from business unit reserves
- 525 - - - 525
Recharges between departments -1,359 -29,881 -1,736 -10,700 -26,047 -69,723
Service analysis total 743,917 168,990 321,254 103,835 95,925 1,433,921
103
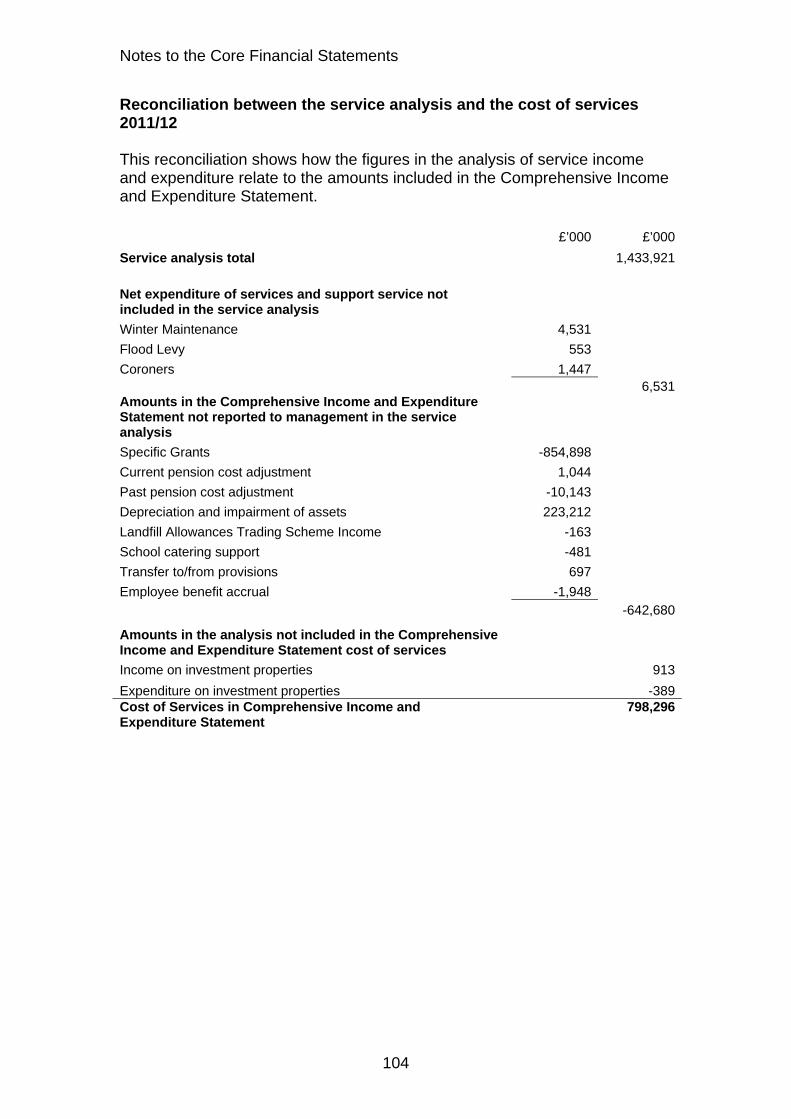
Notes to the Core Financial Statements
Reconciliation between the service analysis and the cost of services 2011/12 This reconciliation shows how the figures in the analysis of service income and expenditure relate to the amounts included in the Comprehensive Income and Expenditure Statement. £’000 £’000
Service analysis total 1,433,921
Net expenditure of services and support service not included in the service analysis
Winter Maintenance 4,531
Flood Levy 553
Coroners 1,447 6,531
Amounts in the Comprehensive Income and Expenditure Statement not reported to management in the service analysis
Specific Grants -854,898
Current pension cost adjustment 1,044
Past pension cost adjustment -10,143
Depreciation and impairment of assets 223,212
Landfill Allowances Trading Scheme Income -163
School catering support -481
Transfer to/from provisions 697
Employee benefit accrual -1,948 -642,680
Amounts in the analysis not included in the Comprehensive Income and Expenditure Statement cost of services
Income on investment properties 913
Expenditure on investment properties -389Cost of Services in Comprehensive Income and Expenditure Statement
798,296
104

Notes to the Core Financial Statements
Reconciliation between service analysis and surplus on the provision of services 2011/12
Service
Analysis
Services not in
Analysis
Not reported to mgmt
Not included in Comprehensive
Income and Expenditure
StatementNet Cost of
Services
Amounts reported
below net cost of
services Total
£’000 £’000 £’000 £’000 £’000 £’000 £’000
Fees, charges & other service income -175,617 -1,259 -163 913 -176,126 - -176,126
-19 - - - -19 -96,390 -96,409
Interest and investment income (including expected return on pension assets) Income from council tax
- - - - - -531,284 -531,284
Government grants and contributions
-67,834 - -854,898 - -922,732 -317,508 -1,240,240
- - - - - -1,296 -1,296Net investment property gains and losses Gain on Disposal of Fixed Assets
- - - - - -3,691 -3,691
Total Income -243,470 -1,259 -855,061 913 -1,098,877 -950,169 -2,049,046
Employee expenses 896,482 624 -11,047 - 886,059 - 886,059Other service expenses
756,402 7,166 -481 -389 762,698 - 762,698
Support Service recharges
23,982 - - - 23,982 - 23,982
Depreciation and impairment of assets
- - 223,212 - 223,212 - 223,212
Interest Payments - - - - - 137,121 137,121Total operating expenses
1,676,866 7,790 211,684 -389 1,895,951 137,121 2,033,072
525 - 697 - 1,222 - 1,222Transfers to/ from reserves and provisions
1,433,921 6,531 -642,680 524 798,296 -813,048 -14,752Surplus or deficit on the provision of services
105

Notes to the Core Financial Statements
Service Income and Expenditure 2010/11
Children's Services Schools
block
Children's Services
Non Schools
Adult Services
Environment Culture, Communities
and Rural Affairs
Policy and Resources
Total
£’000 £’000 £’000 £’000 £’000 £’000 £’000
Expenditure
Employee costs 644,410 112,966 108,163 35,180 30,803 73,832 1,005,354 Premises Related Expenditure
44,198 3,166 2,894 4,812 4,037 12,541 71,648
Transport Related Expenditure
4,003 26,956 6,051 1,609 1,271 1,338 41,228
Supplies & Services 101,071 20,721 16,006 51,583 14,818 12,761 216,960
Third Party Payments 65,839 112,489 248,813 31,049 200 5,180 463,570
Transfer Payments 1,346 1,607 15,151 141 33 59 18,337
Support Services 124,190 66,721 3,346 284 1,382 16,765 212,688
Income
-33,640 -81,678 -37,251 -956 -7,400 -2,577 -163,502Other Grants Reimbursements and Contributions
Sales -19,377 -220 -19 -147 -1,226 -99 -21,088
Fees and Charges -39,936 -9,711 -58,167 -14,577 -8,399 -15,974 -146,764
Rents -5,537 -261 -16 -1,272 -483 -1,993 -9,562
Interest -30 21 -1 -3 -7 - -20
Other
- 130 - - - - 130Transfer to/ from business unit reserves Recharges between departments
-68,246 -79,715 -1,390 -11,982 -1,238 -20,819 -183,390
Service analysis total
818,291 173,192 303,580 95,721 33,791 81,014 1,505,589
106

Notes to the Core Financial Statements
Reconciliation between the service analysis and the cost of services 2010/11 This reconciliation shows how the figures in the analysis of service income and expenditure relate to the amounts included in the Comprehensive Income and Expenditure Statement. £’000 £’000
Service analysis total 1,505,589
Net expenditure of services and support service not included in the analysis
Winter Maintenance 5,392
Flood Levy 557
Coroners 1,324
7,273
Amounts in the Comprehensive Income and Expenditure Statement not reported to management in the service analysis
Specific Grants -865,335
Current pension cost adjustment -3,859
Past pension cost adjustment -253,421
Depreciation and impairment of assets 171,927 Landfill Allowances Trading Scheme Income
-300
School catering support -205
Transfer to/ from provisions -1,833
Employee benefit accrual -1,825
-954,851
Amounts in the analysis not included in the Comprehensive Income and Expenditure Statement cost of services
Income on investment properties 969
Expenditure of investment properties -390Cost of Services in Comprehensive Income and Expenditure Statement
558,590
107

Notes to the Core Financial Statements
Reconciliation between service analysis and surplus on the provision of services 2010/11
Service
Analysis
Services not in
Analysis
Not reported to mgmt
Not included in Comprehensive
Income and Expenditure
StatementNet Cost of
Services
Amounts reported
below net cost of
services Total
£’000 £’000 £’000 £’000 £’000 £’000 £’000
Fees, charges & other service income
-177,414 -2 -300 969 -176,747 - -176,747
-20 - - - -20 -86,002 -86,022
Interest and investment income (including expected return on pension assets) Income from council tax
- - - - - -527,421 -527,421
Government grants and contributions
-163,502 -1,151 -865,335 - -1,029,988 -305,439 -1,335,427
Net investment property gains and losses
- - - - - -6,083 -6,083
Gain on disposal of fixed assets
- - - - - -4,447 -4,447
Total Income -340,936 -1,153 -865,635 969 -1,206,755 -929,392 -2,136,147
Employee expenses 1,005,354 580 -259,105 - 746,829 - 746,829Other service expenses
811,743 7,846 -205 -390 818,994 - 818,994
Support Service recharges
29,298 - - - 29,298 - 29,298
Depreciation and impairment of assets
- - 171,927 - 171,927 - 171,927
Interest Payments - - - - - 134,874 134,874Total operating expenses
1,846,395 8,426 -87,383 -390 1,767,048 134,874 1,901,922
Transfers to/from reserves and provisions
130 - -1,833 - -1,703 - -1,703
Surplus or deficit on the provision of services
1,505,589 7,273 -954,851 579 558,590 -794,518 -235,928
108
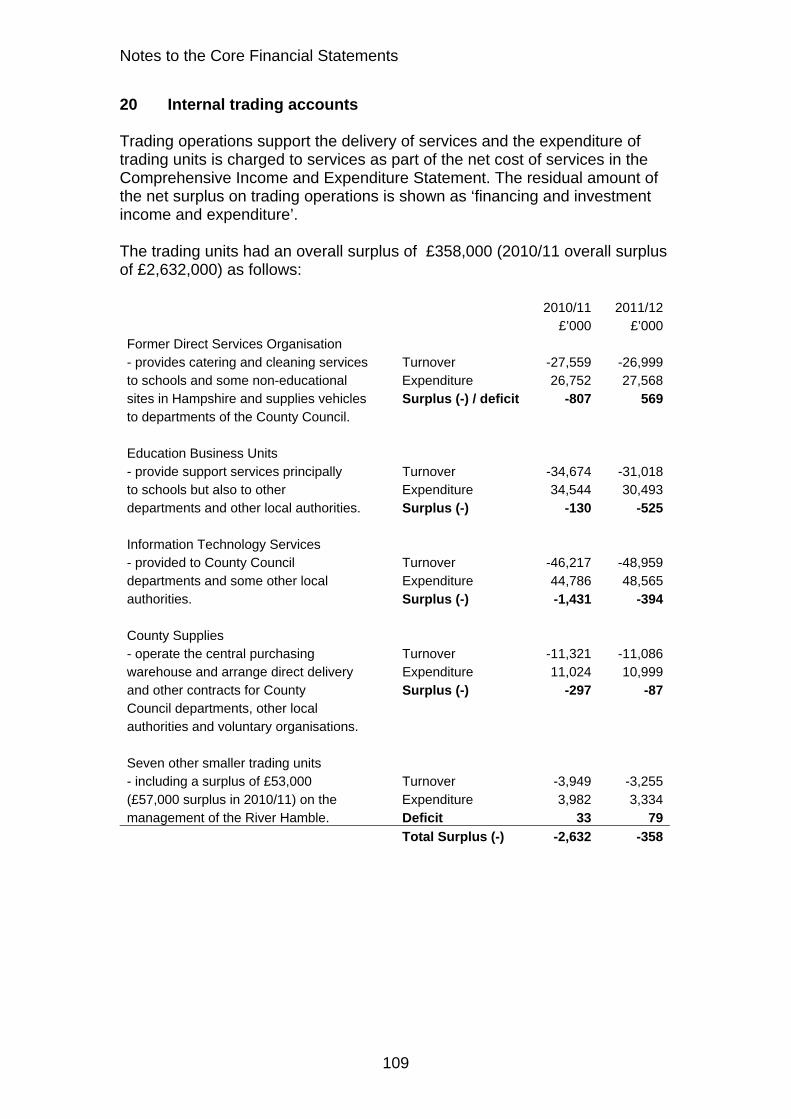
Notes to the Core Financial Statements
20 Internal trading accounts Trading operations support the delivery of services and the expenditure of trading units is charged to services as part of the net cost of services in the Comprehensive Income and Expenditure Statement. The residual amount of the net surplus on trading operations is shown as ‘financing and investment income and expenditure’. The trading units had an overall surplus of £358,000 (2010/11 overall surplus of £2,632,000) as follows: 2010/11 2011/12 £’000 £’000Former Direct Services Organisation - provides catering and cleaning services Turnover -27,559 -26,999to schools and some non-educational Expenditure 26,752 27,568sites in Hampshire and supplies vehicles Surplus (-) / deficit -807 569to departments of the County Council. Education Business Units - provide support services principally Turnover -34,674 -31,018to schools but also to other Expenditure 34,544 30,493departments and other local authorities. Surplus (-) -130 -525 Information Technology Services - provided to County Council Turnover -46,217 -48,959departments and some other local Expenditure 44,786 48,565authorities. Surplus (-) -1,431 -394 County Supplies - operate the central purchasing Turnover -11,321 -11,086warehouse and arrange direct delivery Expenditure 11,024 10,999and other contracts for County Surplus (-) -297 -87Council departments, other local authorities and voluntary organisations. Seven other smaller trading units - including a surplus of £53,000 Turnover -3,949 -3,255(£57,000 surplus in 2010/11) on the Expenditure 3,982 3,334management of the River Hamble. Deficit 33 79
Total Surplus (-) -2,632 -358
109

Notes to the Core Financial Statements
21 Pooled budgets The County Council is a partner in two pooled budget arrangements. The County Council is a partner in Hampshire's CAMHS and other child health joint Commissioning Partnership. The Partnership's purpose is to develop integrated commissioning of Child and Adolescent Mental Health Services in Hampshire under Section 75 of the National Health Service Act 2006. The partner bodies are: Hampshire County Council (host partner) and NHS Hampshire 2010/11 2011/12
£’000 £’000 £’000 £’000
Gross income
Hampshire County Council -1,833 -1,811
NHS Hampshire -7,696 -9,529 -8,133 -9,944
Expenditure 9,510 9,944
Surplus -19 -
Council's share of the net surplus arising on the pooled budget -4 -
The County Council is a partner in the Mid Hampshire Mental Health Services pooled budget. Its objective is to promote the independence of adults with severe mental health problems. The partner bodies are: Hampshire County Council (host partner) and Hampshire Primary Care Trust (PCT) 2010/11 2011/12
£’000 £000 £’000 £’000
Gross income
Hampshire County Council -82 -83
Hampshire Primary Care Trust -927 -1,009 -884 -967
Expenditure 904 814
Surplus -105 -153
Council's share of the net surplus arising on the pooled budget -13 -17
110
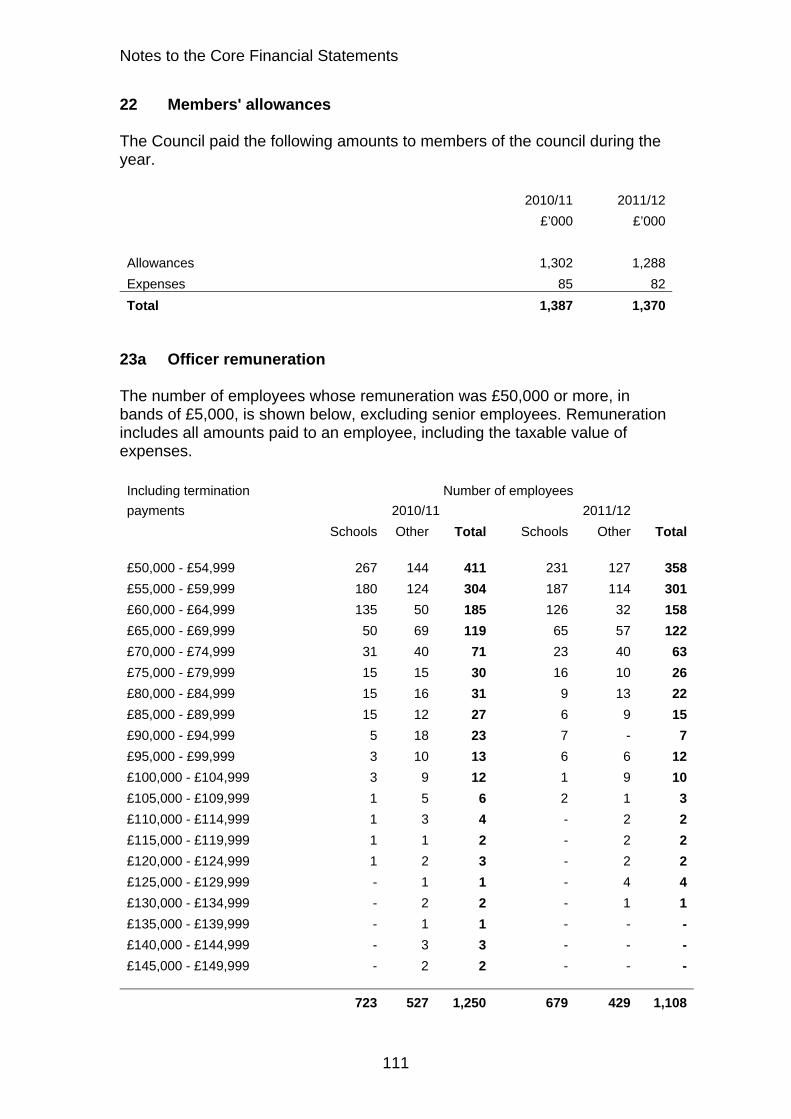
Notes to the Core Financial Statements
22 Members' allowances The Council paid the following amounts to members of the council during the year. 2010/11 2011/12
£’000 £’000
Allowances 1,302 1,288
Expenses 85 82
Total 1,387 1,370 23a Officer remuneration The number of employees whose remuneration was £50,000 or more, in bands of £5,000, is shown below, excluding senior employees. Remuneration includes all amounts paid to an employee, including the taxable value of expenses. Including termination Number of employees
payments 2010/11 2011/12
Schools Other Total Schools Other Total
£50,000 - £54,999 267 144 411 231 127 358
£55,000 - £59,999 180 124 304 187 114 301
£60,000 - £64,999 135 50 185 126 32 158
£65,000 - £69,999 50 69 119 65 57 122
£70,000 - £74,999 31 40 71 23 40 63
£75,000 - £79,999 15 15 30 16 10 26
£80,000 - £84,999 15 16 31 9 13 22
£85,000 - £89,999 15 12 27 6 9 15
£90,000 - £94,999 5 18 23 7 - 7
£95,000 - £99,999 3 10 13 6 6 12
£100,000 - £104,999 3 9 12 1 9 10
£105,000 - £109,999 1 5 6 2 1 3
£110,000 - £114,999 1 3 4 - 2 2
£115,000 - £119,999 1 1 2 - 2 2
£120,000 - £124,999 1 2 3 - 2 2
£125,000 - £129,999 - 1 1 - 4 4
£130,000 - £134,999 - 2 2 - 1 1
£135,000 - £139,999 - 1 1 - - -
£140,000 - £144,999 - 3 3 - - -
£145,000 - £149,999 - 2 2 - - -
723 527 1,250 679 429 1,108
111

Notes to the Core Financial Statements
Excluding termination Number of employees
payments 2010/11 2011/12
Schools Other Total Schools Other Total
£50,000 - £54,999 266 156 422 229 116 345
£55,000 - £59,999 180 125 305 186 97 283
£60,000 - £64,999 134 41 175 124 27 151
£65,000 - £69,999 49 54 103 64 47 111
£70,000 - £74,999 31 31 62 23 37 60
£75,000 - £79,999 15 13 28 16 8 24
£80,000 - £84,999 15 14 29 9 12 21
£85,000 - £89,999 15 4 19 6 3 9
£90,000 - £94,999 5 3 8 6 - 6
£95,000 - £99,999 3 3 6 6 4 10
£100,000 - £104,999 3 3 6 1 4 5
£105,000 - £109,999 1 3 4 1 1 2
£110,000 - £114,999 1 - 1 - 2 2
£115,000 - £119,999 1 - 1 - - -
£120,000 - £124,999 1 1 2 - 1 1
720 451 1,171 671 359 1,030
112
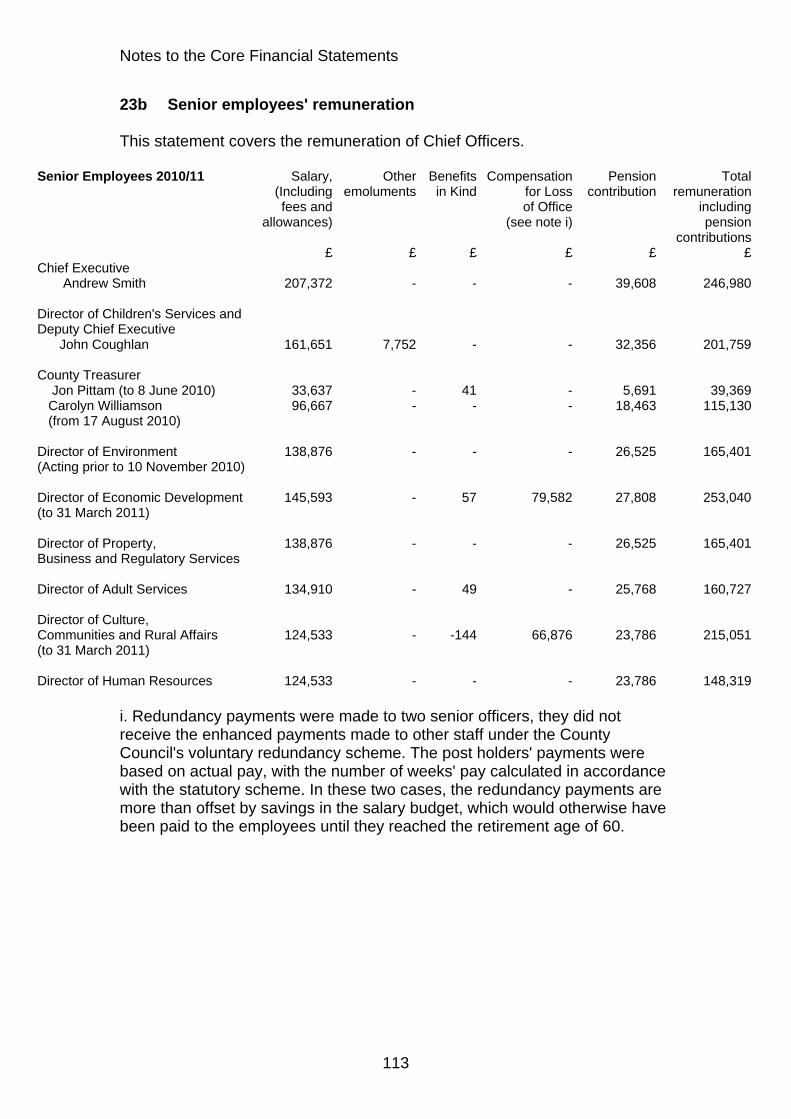
Notes to the Core Financial Statements
23b Senior employees' remuneration This statement covers the remuneration of Chief Officers.
Senior Employees 2010/11 Salary, Other Benefits Compensation Pension Total (Including emoluments in Kind for Loss contribution remuneration fees and of Office including allowances) (see note i) pension contributions £ £ £ £ £ £Chief Executive Andrew Smith 207,372 - - - 39,608 246,980
Director of Children's Services and Deputy Chief Executive John Coughlan 161,651 7,752 - - 32,356 201,759 County Treasurer Jon Pittam (to 8 June 2010) 33,637 - 41 - 5,691 39,369 Carolyn Williamson (from 17 August 2010)
96,667 - - - 18,463 115,130
Director of Environment 138,876 - - - 26,525 165,401(Acting prior to 10 November 2010) Director of Economic Development 145,593 - 57 79,582 27,808 253,040(to 31 March 2011) Director of Property, 138,876 - - - 26,525 165,401Business and Regulatory Services Director of Adult Services 134,910 - 49 - 25,768 160,727 Director of Culture, Communities and Rural Affairs 124,533 - -144 66,876 23,786 215,051(to 31 March 2011) Director of Human Resources 124,533 - - - 23,786 148,319
i. Redundancy payments were made to two senior officers, they did not receive the enhanced payments made to other staff under the County Council's voluntary redundancy scheme. The post holders' payments were based on actual pay, with the number of weeks' pay calculated in accordance with the statutory scheme. In these two cases, the redundancy payments are more than offset by savings in the salary budget, which would otherwise have been paid to the employees until they reached the retirement age of 60.
113

Notes to the Core Financial Statements
Senior employees 2011/12 Salary, Other Benefits Compensation Pension Total (Including emoluments in Kind for Loss contribution remuneration fees and of Office including allowances) pension contributions £ £ £ £ £ £Chief Executive Andrew Smith 207,372 - - - 27,166 234,538 Director of Children's Services and Deputy Chief Executive John Coughlan 167,734 - - - 21,973 189,707 County Treasurer Carolyn Williamson 155,000 - - - 20,305 175,305 Director of Economy, Transport and Environment
138,876 - - - 18,193 157,069
Director of Community, Culture and Business Services
138,876 - - - 18,193 157,069
Director of Adult Services 134,910 - - - 17,673 152,583
Director of Human Resources 124,533 - - - 16,314 140,847 23c Termination agreements The number of exit packages with total cost per band and total cost of the compulsory and other redundancies are set out in the tables below: Schools 2010/11
Exit package cost band
Number of Compulsory
Redundancies
Number of other
departures agreed
Total number of exit
packages by cost band
Total redundancy
costs in each band
£
£0 - £20,000 141 6 147 598,440
£20,001 - £40,000 6 - 6 145,146
£40,001 - £60,000 - - - -
£60,001 + - - - -
147 6 153 743,586
114

Notes to the Core Financial Statements
Non schools 2010/11
Exit package cost band
Number of Compulsory
Redundancies
Number of other
departures agreed
Total number of exit
packages by cost band
Total redundancy
costs in each band
£
£0 - £20,000 60 180 240 1,938,962
£20,001 - £40,000 2 137 139 4,045,040
£40,001 - £60,000 - 61 61 2,752,368
£60,001 + - 12 12 917,888
62 390 452 9,654,258
Schools 2011/12
Exit package cost band
Number of Compulsory
Redundancies
Number of other
departures
Total number of exit
packages by cost band
Total redundancy
costs in each band
£
£0 - £20,000 231 5 236 1,084,402
£20,001 - £40,000 15 - 15 392,578
£40,001 - £60,000 - - - -
£60,001 + - - - -
246 5 251 1,476,980
Non schools 2011/12
Exit package cost band
Number of Compulsory
Redundancies
Number of other
departures agreed
Total number of exit
packages by cost band
Total redundancy
costs in each band
£
£0 - £20,000 50 661 711 5,691,777
£20,001 - £40,000 1 146 147 3,925,792
£40,001 - £60,000 - 20 20 970,989
£60,001 + - 2 2 127,936
51 829 880 10,716,494
115

Notes to the Core Financial Statements
24 External audit fees Fees charged by the Audit Commission to the County Council can be analysed as follows: 2010/11 2011/12
£’000 £’000
Code of Audit Practice 255 238
Grant Claims 4 7
National Fraud Initiative 2 2
261 247 25 Dedicated Schools Grant The Council's expenditure on schools is funded by grants from the Department for Education (DfE), primarily the Dedicated Schools Grant (DSG). DSG is ring-fenced and can only be applied to meet expenditure properly included in the Schools Budget. The Schools Budget includes central expenditure covering education provision and a restricted range of services provided on an authority-wide basis and the Individual Schools Budget (ISB), which is divided into a budget share for each school. Overspends and underspends on the two elements must be accounted for separately. Details of the deployment of DSG receivable for 2011/12 are as follows: Individual
Central Schools
expenditure Budget Total
£’000 £’000 £’000
Final DSG for 2011/12 as issued by the DfE on 19 March 2012 -738,626Brought forward from 2010/11 as agreed with DCSF -22,051Carry forward to 2012/13 agreed in advance with the Schools Forum 20,885
Agreed budgeted distribution in 2011/12 -73,045 -666,747 -739,792
Actual central expenditure 73,045 73,045
Actual ISB deployed to schools 666,747 666,747
Local authority contribution for 2011/12 - - -
Carry forward to 2012/13 - - -Carry forward to 2012/13 agreed in advance with the Schools Forum (as above)
- - -20,885
Total carry forward -20,885
116

Notes to the Core Financial Statements
26 Grant income The Council credited the following grants, contributions and donations to the Comprehensive Income and Expenditure Statement: 2010/11 2011/12 £’000 £’000 Credited to Taxation and Non Specific Grant Income Non-ringfenced Government grants -87,790 -56,997 Capital Grants and Contributions: Social Care IT Infrastructure Grant -322 -Mental Health Grant -290 -Social Care Reform Grant -569 -Improving the Home Care Environment - -118Department of Health Single Capital Pot -731 -Common Assessment Framework -705 -495Community Capacity Building - -2,417Waste Performance and Efficiency Grant -840 -Local Transport Capital Block Funding Grant -1,113 -27,620New Growth Point Fund Grant -175 -Communities Infrastructure Fund Grant -10,729 -3,765Winter Damage Grant - -6,017Transport for South Hampshire Grant - -500Other Highways, Roads and Transport Grants -2,491 -768Havant Public Service Village Grant -4,230 -Bordon Eco Town Grant -1,035 -Safe and Strong Communities Grant -179 -Standard's Fund -42,320 -19,857Sure Start and Early Years Grant -17,332 -Capital Maintenance Grant - -23,952Basic Needs Grant - -18,462Young People's Learning Agency Capital Works Grant -1,015 -155Youth Capital Fund -466 -Aiming High for Disabled Children -1,277 -825Havant Academy - -6,346Other Children's Services and Education Grants -479 -3,613Co-Location Funding -2,266 -3,573Lottery Funding -251 -54Aiming High Funding -311 -Other cultural services funding -219 -7Developer's contributions -6,498 -12,271Other contributions -1,414 -853Contributions from other Local Authorities -4,716 -5,923 Less: Capital income used to fund revenue 12,541 18,896expenditure under statute
117
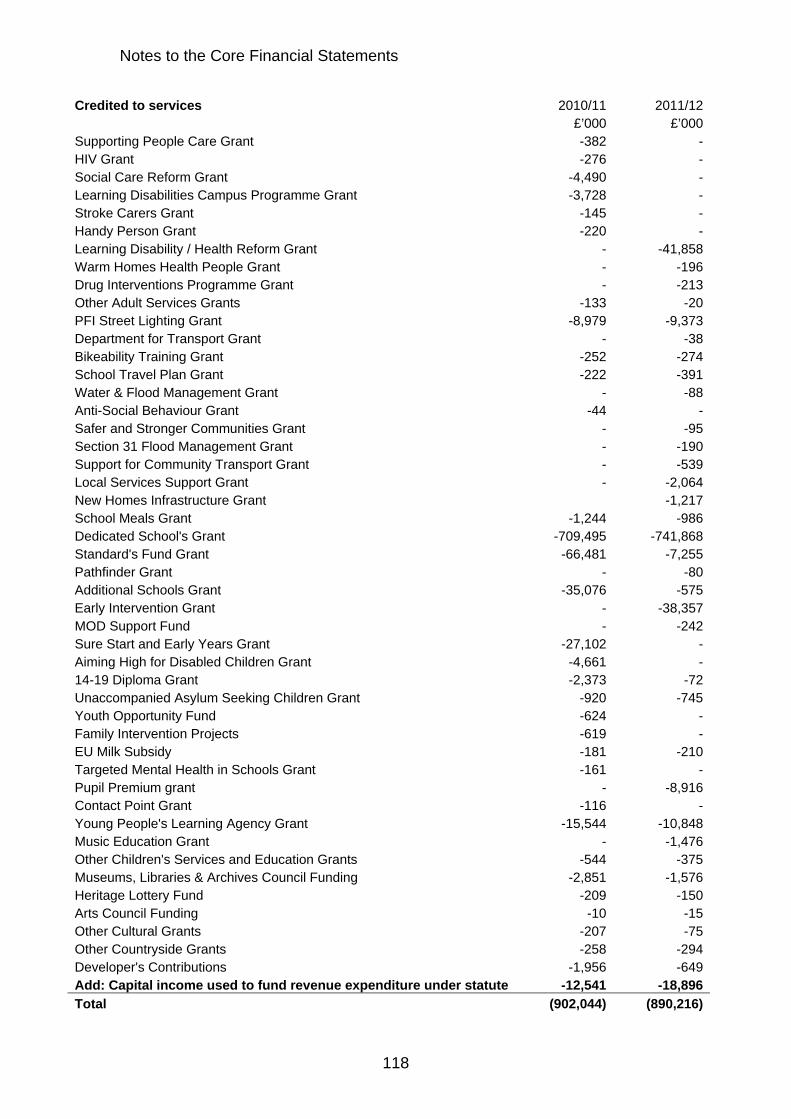
Notes to the Core Financial Statements
Credited to services 2010/11 2011/12 £’000 £’000Supporting People Care Grant -382 -HIV Grant -276 -Social Care Reform Grant -4,490 -Learning Disabilities Campus Programme Grant -3,728 -Stroke Carers Grant -145 -Handy Person Grant -220 -Learning Disability / Health Reform Grant - -41,858Warm Homes Health People Grant - -196Drug Interventions Programme Grant - -213Other Adult Services Grants -133 -20PFI Street Lighting Grant -8,979 -9,373Department for Transport Grant - -38Bikeability Training Grant -252 -274School Travel Plan Grant -222 -391Water & Flood Management Grant - -88Anti-Social Behaviour Grant -44 -Safer and Stronger Communities Grant - -95Section 31 Flood Management Grant - -190Support for Community Transport Grant - -539Local Services Support Grant - -2,064New Homes Infrastructure Grant -1,217School Meals Grant -1,244 -986Dedicated School's Grant -709,495 -741,868Standard's Fund Grant -66,481 -7,255Pathfinder Grant - -80Additional Schools Grant -35,076 -575Early Intervention Grant - -38,357MOD Support Fund - -242Sure Start and Early Years Grant -27,102 -Aiming High for Disabled Children Grant -4,661 -14-19 Diploma Grant -2,373 -72Unaccompanied Asylum Seeking Children Grant -920 -745Youth Opportunity Fund -624 -Family Intervention Projects -619 -EU Milk Subsidy -181 -210Targeted Mental Health in Schools Grant -161 -Pupil Premium grant - -8,916Contact Point Grant -116 -Young People's Learning Agency Grant -15,544 -10,848Music Education Grant - -1,476Other Children's Services and Education Grants -544 -375Museums, Libraries & Archives Council Funding -2,851 -1,576Heritage Lottery Fund -209 -150Arts Council Funding -10 -15Other Cultural Grants -207 -75Other Countryside Grants -258 -294Developer's Contributions -1,956 -649Add: Capital income used to fund revenue expenditure under statute -12,541 -18,896
Total (902,044) (890,216)
118
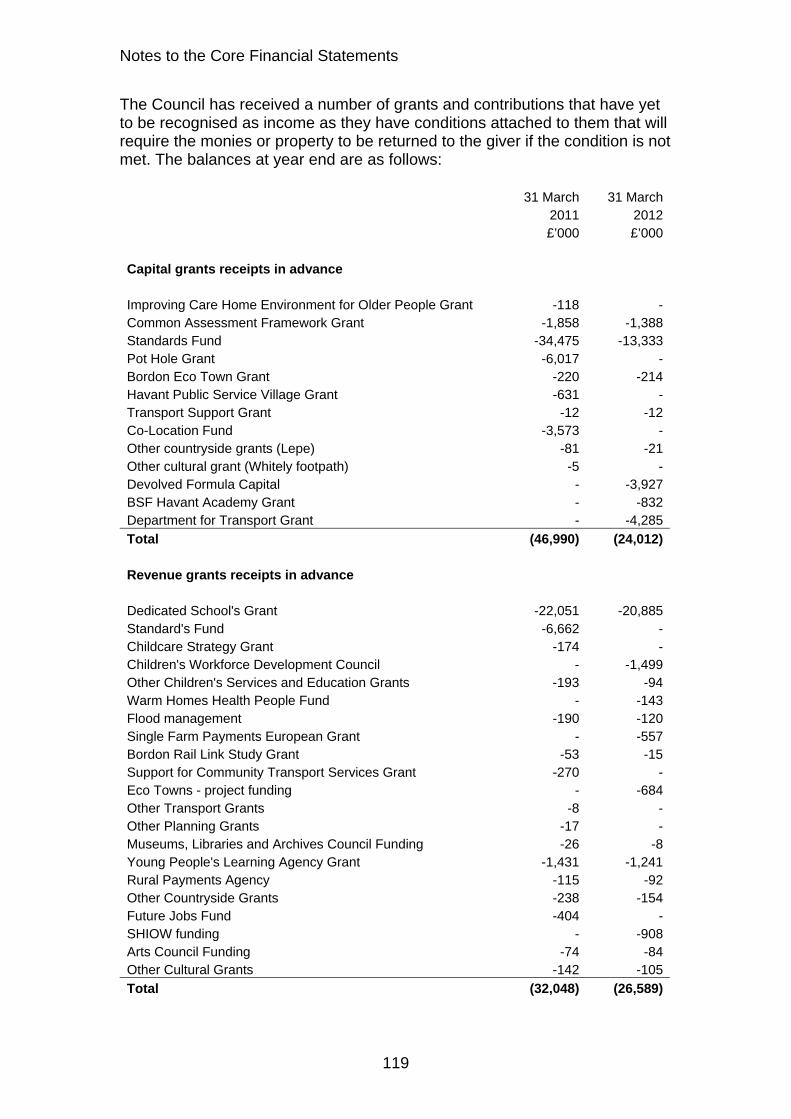
Notes to the Core Financial Statements
The Council has received a number of grants and contributions that have yet to be recognised as income as they have conditions attached to them that will require the monies or property to be returned to the giver if the condition is not met. The balances at year end are as follows: 31 March 31 March 2011 2012 £’000 £’000 Capital grants receipts in advance Improving Care Home Environment for Older People Grant -118 -Common Assessment Framework Grant -1,858 -1,388Standards Fund -34,475 -13,333Pot Hole Grant -6,017 -Bordon Eco Town Grant -220 -214Havant Public Service Village Grant -631 -Transport Support Grant -12 -12Co-Location Fund -3,573 -Other countryside grants (Lepe) -81 -21Other cultural grant (Whitely footpath) -5 -Devolved Formula Capital - -3,927BSF Havant Academy Grant - -832Department for Transport Grant - -4,285
Total (46,990) (24,012) Revenue grants receipts in advance Dedicated School's Grant -22,051 -20,885Standard's Fund -6,662 -Childcare Strategy Grant -174 -Children's Workforce Development Council - -1,499Other Children's Services and Education Grants -193 -94Warm Homes Health People Fund - -143Flood management -190 -120Single Farm Payments European Grant - -557Bordon Rail Link Study Grant -53 -15Support for Community Transport Services Grant -270 -Eco Towns - project funding - -684Other Transport Grants -8 -Other Planning Grants -17 -Museums, Libraries and Archives Council Funding -26 -8Young People's Learning Agency Grant -1,431 -1,241Rural Payments Agency -115 -92Other Countryside Grants -238 -154Future Jobs Fund -404 -SHIOW funding - -908Arts Council Funding -74 -84Other Cultural Grants -142 -105
Total (32,048) (26,589)
119
Notes to the Core Financial Statements
27 Related party transactions The Council is required to disclose material transactions with related parties. Related parties are bodies or individuals that have the potential to control or influence the council or to be controlled or influenced by the council. Disclosing these shows the extent to which the council might have been constrained in its ability to operate independently or might have secured the ability to limit another party's ability to bargain freely with the Council. Central government Central Government has effective control over the general operations of the Council - it is responsible for providing the statutory framework within which the Council operates, provides the majority of its funding in the form of grants and prescribes the terms of many of the transactions that the Council has with other parties. Grants received from government departments are set out in the subjective analysis in note 19. Grant receipts are shown in note 26. Members Members of the Council have direct control over the Council's financial and operating policies. The total of members' allowances paid in 2011/12 is shown in note 22. Before every decision making meeting, members are required to disclose any conflicts of interest. There were 20 related party transactions totalling £16,737.34 arising from disbursements from members' devolved budgets. All such payments were counter signed by a member other than the budget-holding member. Officers There were no related-party transactions involving Chief Officers of the Council. Details of senior officer remuneration are given in note 23b. Other Public Bodies The County Council administers the Hampshire Pension Fund on behalf of its non-teaching employees, those of other local authorities in the county area and 234 other contributing scheduled and admitted bodies (198 in 2010/11). Until 30 September 2010 the Pension Fund invested its surplus cash balances jointly with the County Council's to gain the benefits of scale. Interest was paid to the Pension Fund for the period 1 April to 30 September 2010 based on the actual rate of interest earned. From 1 October 2010, the Pension Fund has operated a separate bank account and invested surplus cash balances in accordance with its treasury management strategy.
120
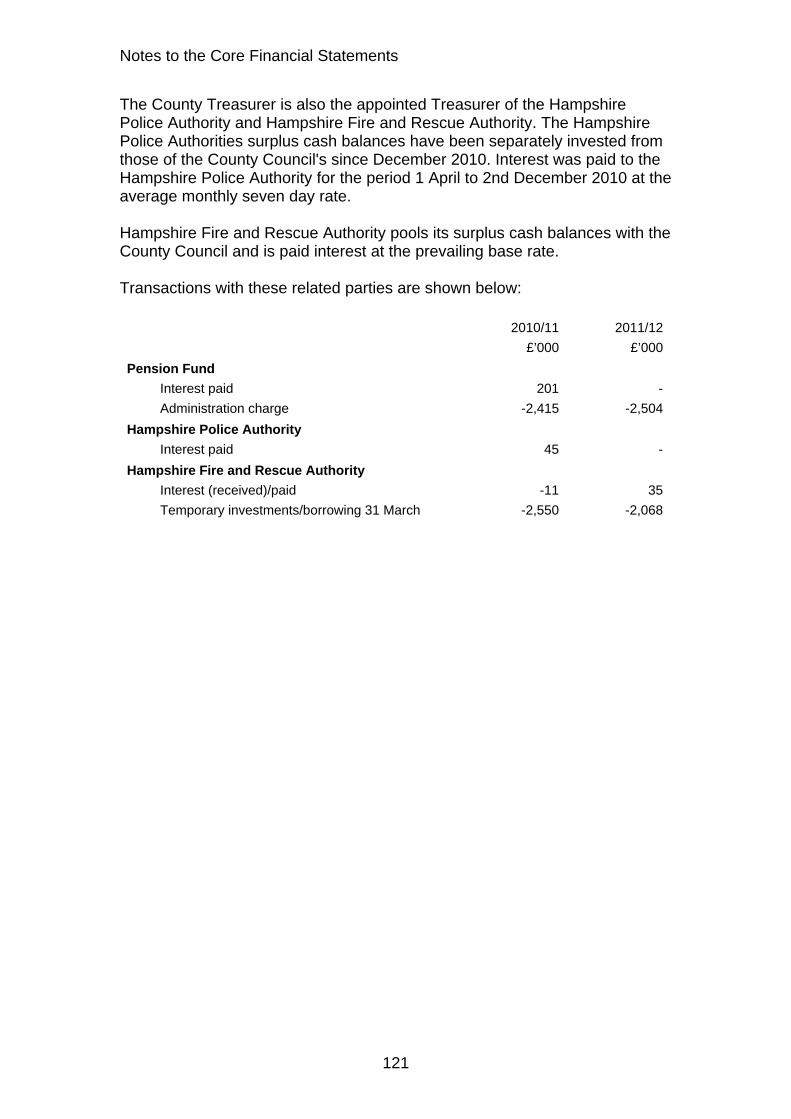
Notes to the Core Financial Statements
The County Treasurer is also the appointed Treasurer of the Hampshire Police Authority and Hampshire Fire and Rescue Authority. The Hampshire Police Authorities surplus cash balances have been separately invested from those of the County Council's since December 2010. Interest was paid to the Hampshire Police Authority for the period 1 April to 2nd December 2010 at the average monthly seven day rate. Hampshire Fire and Rescue Authority pools its surplus cash balances with the County Council and is paid interest at the prevailing base rate. Transactions with these related parties are shown below: 2010/11 2011/12
£’000 £’000
Pension Fund
Interest paid 201 -
Administration charge -2,415 -2,504
Hampshire Police Authority
Interest paid 45 -
Hampshire Fire and Rescue Authority
Interest (received)/paid -11 35
Temporary investments/borrowing 31 March -2,550 -2,068
121

Notes to the Core Financial Statements
28 Capital financing The total amount of capital expenditure incurred in the year is shown in the table (including the value of assets acquired under finance leases), together with the resources that have been used to finance it. Where capital expenditure is to be financed in future years by charges to revenue as assets are used by the Council, the expenditure results in an increase in the Capital Financing Requirement (CFR), a measure of the capital expenditure incurred historically by the Council that has yet to be financed. The CFR is analysed in the second part of this note. 2010/11 2011/12
£’000 £’000
Opening capital financing requirement 714,945 747,584
Capital spending on fixed assets 175,894 137,959
Revenue expenditure funded by capital under statute 20,438 23,738
911,277 909,281
Funded by:
Capital receipts -13,030 -6,698
Grants and other income -102,717 -102,609
Revenue
- main contribution -10,636 -42,545
- reserves -5,471 -3,543
Minimum revenue provision -31,839 -33,871
Closing capital financing requirement 747,584 720,015
Explanation of movements in year
Increase/decrease (-) in borrowing (supported by government financial assistance)
12,994 -20,742
Increase/decrease (-) in borrowing (unsupported by government financial assistance)
10,691 -15,550
Increase/decrease (-) in borrowing related to finance leases
- -
Increase/decrease (-) in borrowing related to PFI/PPP contracts
8,954 8,723
32,639 -27,569Increase/decrease (-) in Capital Financing Requirement
122
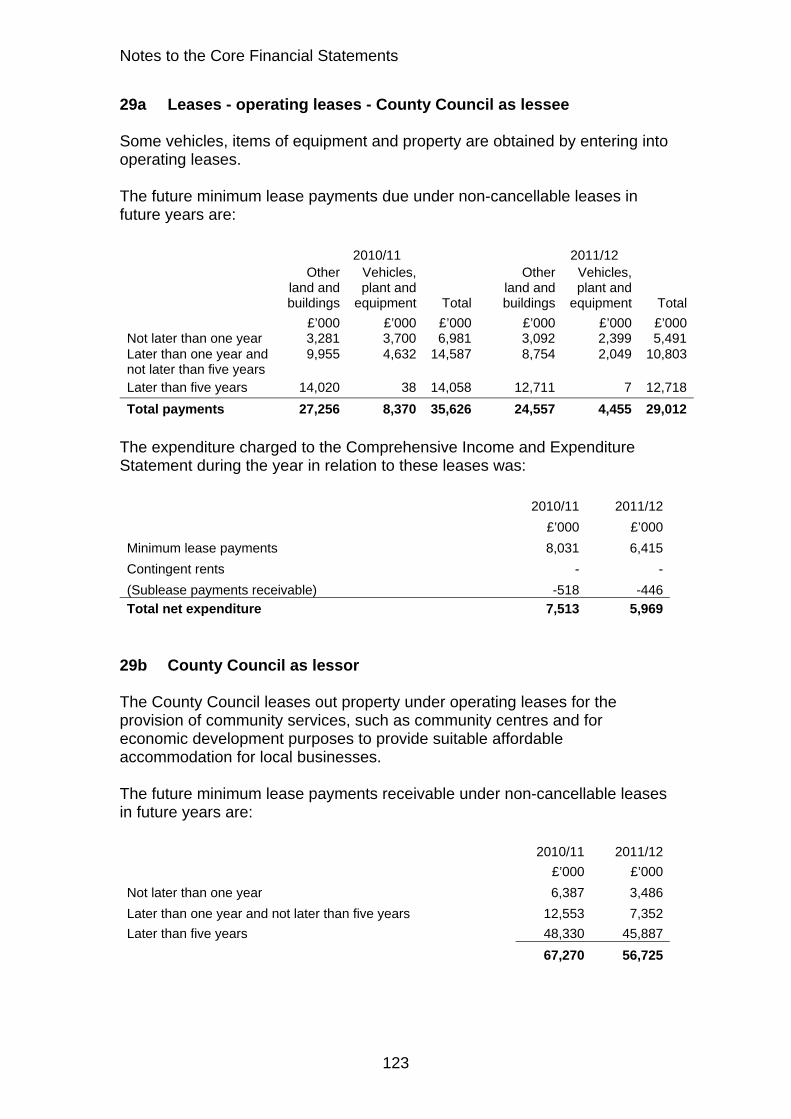
Notes to the Core Financial Statements
29a Leases - operating leases - County Council as lessee Some vehicles, items of equipment and property are obtained by entering into operating leases. The future minimum lease payments due under non-cancellable leases in future years are: 2010/11 2011/12
Other land and buildings
Vehicles, plant and
equipment Total
Other land and buildings
Vehicles, plant and
equipment Total
£’000 £’000 £’000 £’000 £’000 £’000Not later than one year 3,281 3,700 6,981 3,092 2,399 5,491 Later than one year and not later than five years
9,955 4,632 14,587 8,754 2,049 10,803
Later than five years 14,020 38 14,058 12,711 7 12,718
Total payments 27,256 8,370 35,626 24,557 4,455 29,012
The expenditure charged to the Comprehensive Income and Expenditure Statement during the year in relation to these leases was: 2010/11 2011/12
£’000 £’000
Minimum lease payments 8,031 6,415
Contingent rents - -
(Sublease payments receivable) -518 -446
Total net expenditure 7,513 5,969
29b County Council as lessor The County Council leases out property under operating leases for the provision of community services, such as community centres and for economic development purposes to provide suitable affordable accommodation for local businesses. The future minimum lease payments receivable under non-cancellable leases in future years are: 2010/11 2011/12
£’000 £’000
Not later than one year 6,387 3,486
Later than one year and not later than five years 12,553 7,352
Later than five years 48,330 45,887
67,270 56,725
123

Notes to the Core Financial Statements
29c Leases - finance leases At 31 March 2012, the County Council has not taken or granted any material finance leases. 30 PFI and service concessions Project Integra An existing contract for waste management meets the definition of a service concession. The contract with Veolia Environmental Services Hampshire (VESH) is jointly administered by the County Council and Portsmouth and Southampton unitary authorities. The contract began in January 1996 and runs until 2024/25. The contract includes a provision allowing the County Council to extend the contract by a period of up to 10 years from 2024/25. Through a side agreement, Southampton and Portsmouth City Councils commit to paying a proportion of the costs of the scheme, which is broadly based on the proportion of waste contributed by each of the partner Councils. The contract has three phases. During phases 1 and 2 the contractor planned, financed and constructed the three Energy Recovery Facilities, two Material Reprocessing Facilities and three composting sites. The contract is currently in Phase 3 covering the provision of waste disposal services in relation to the newly constructed facilities ending in 2024/25. The contract price mechanism is structured with an annual re-pricing each January linked to the retail price index in the previous October and a step-change increase in the contract price midway through the contract. There have been no major variations to the contract or additional investment in facilities during the 2011/12 financial year. For sites built on County Council land the contract requires their transfer to the County Council at the end of the contract. Other sites on land contributed by Portsmouth or Southampton Councils will transfer to them at contract end. Contractor or third party owned sites may be acquired at contract end through assignment of leases, or options to purchase as negotiated at the time. The County Council’s share of the waste disposal assets constructed under the contract are now included in the balance sheet together with a deferred liability to pay for the assets over the life of the contract.
124

Notes to the Core Financial Statements
The movement in the asset values during the year were as follows: 2010/11 2011/12
Gross book value £’000 £’000
At 1 April 95,227 95,227
Additions - -
Disposals - -
Revaluations - -
Gross book value at 31 March 95,227 95,227
Depreciation
At 1 April -11,276 -16,914
Depreciation for the year -5,638 -5,638
Impairments - -
Depreciation at 31 March -16,914 -22,552
Net book value at 1 April 83,951 78,313
Net book value at 31 March 78,313 72,675 The movement in the deferred liability was: 31 March 31 March
2011 2012
£’000 £’000
Balance brought forward 1 April -85,525 -82,071
Principal repayment in the year 3,454 3,730
Balance at 31 March -82,071 -78,341
Finance lease repayable in one year -3,730 -4,025
Deferred liability -78,341 -74,316
Balance at 31 March -82,071 -78,341 The waste management contract has 14 years to run. The expected payments are shown below. Principal Interest Service Total
repayment Charge
£’000 £’000 £’000 £’000
Next year 4,025 6,270 39,699 49,994
Years two to five 19,602 21,578 179,515 220,695
Years six to 10 34,722 16,753 266,249 317,724
Years 11 to 14 19,992 2,894 166,414 189,300
78,341 47,495 651,877 777,713
125

Notes to the Core Financial Statements
The South Coast Street Lighting PFI The County Council has one PFI contract which is for street lighting. This came into effect from the financial year 2010/11. The South Coast Street Lighting PFI project was procured in partnership between Hampshire County Council, Southampton City Council and West Sussex County Council together with the successful service provider, Tay Valley Lighting. Each council has its own separate contract to deliver individualised lighting requirements under a standard contractual framework. Through the contract, Hampshire County Council is replacing some 78,000 of its 132,000 street lighting columns and modernising the remaining 54,000 lanterns in order to improve energy efficiency, in addition other items of illuminated street furniture such as signs are being replaced or upgraded over a five year core investment period. The long-term contract with Tay Valley Lighting (Hampshire) will run for 25 years, from 1 April 2010, and will also provide for the ongoing maintenance of the council’s street lighting network running until 2035/36. Built into the contract is the agreement that, upon the conclusion of the 25 year term, the new and enhanced street lights are expected to be in a good state of repair which would reasonably see them lasting for 5 years after the end of the contract, at that time the risks relating to the apparatus then pass back to the Council. As part of the PFI contract a Remote Monitoring System (RMS) will be incorporated into every lantern which allows the street lighting levels to be controlled centrally. As lanterns are replaced during the 5 year investment period at the beginning of the contract, the necessary devices for using the RMS are placed within the new lanterns. It is anticipated that this will allow the Council to make efficiencies on electricity costs and vary light outputs as necessary. An annual re-pricing review is undertaken on the anniversary of the start of the contract, 1 April, and this is linked to retail price index. Over the first 5 years of the contract (the investment period) the annual cost of the contract reflects the investment programme which steadily rises until it reaches a peak at year 6 and then stabilises. From year 6 to year 25 the annual cost is determined by inflation and amendments to the inventory. No major changes to the contract occurred during the 2011/12 financial year. Termination clauses are built into the contract documents under clauses 40 to 45 of the project agreement, there are no options for contract renewal.
126
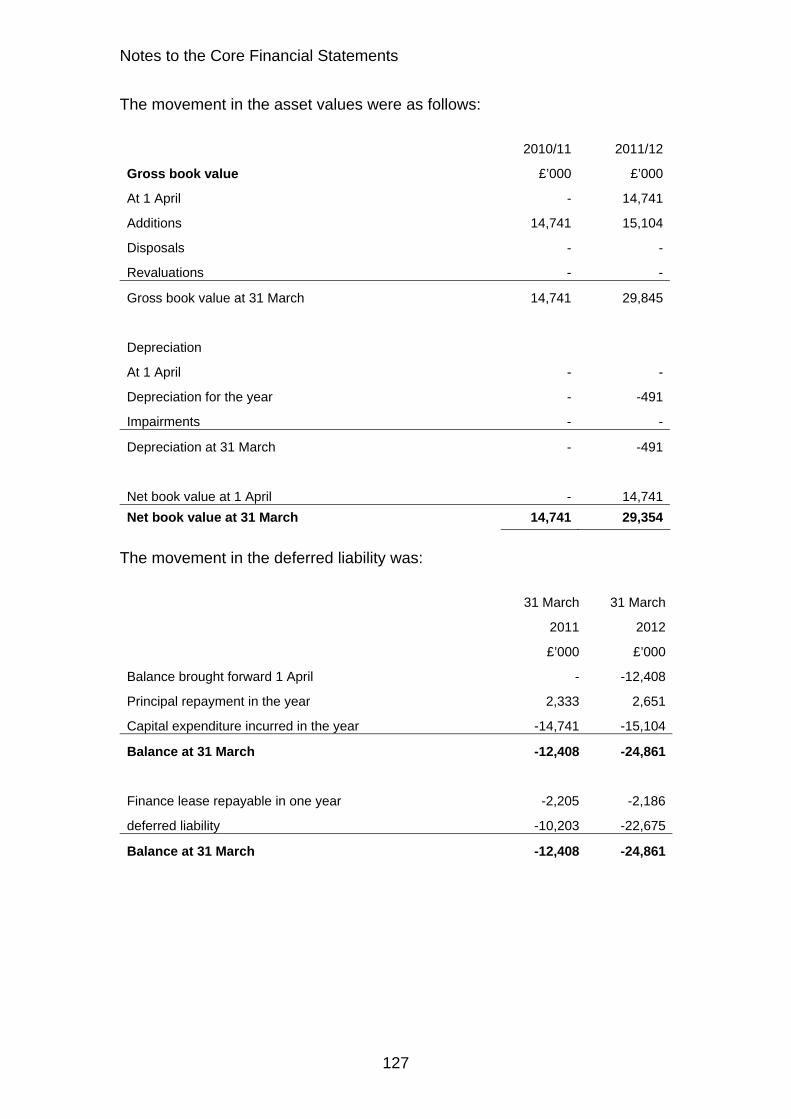
Notes to the Core Financial Statements
The movement in the asset values were as follows:
2010/11 2011/12
Gross book value £’000 £’000
At 1 April - 14,741
Additions 14,741 15,104
Disposals - -
Revaluations - -
Gross book value at 31 March 14,741 29,845
Depreciation
At 1 April - -
Depreciation for the year - -491
Impairments - -
Depreciation at 31 March - -491
Net book value at 1 April - 14,741
Net book value at 31 March 14,741 29,354
The movement in the deferred liability was:
31 March 31 March
2011 2012
£’000 £’000
Balance brought forward 1 April - -12,408
Principal repayment in the year 2,333 2,651
Capital expenditure incurred in the year -14,741 -15,104
Balance at 31 March -12,408 -24,861
Finance lease repayable in one year -2,205 -2,186
deferred liability -10,203 -22,675
Balance at 31 March -12,408 -24,861
127

Notes to the Core Financial Statements
The street lighting contract has 23 years to run. The expected payments are shown below: Principal Interest Service Total
repayment Charge
£’000 £’000 £’000 £’000
Next year 2,186 4,013 9,764 15,963
Years two to five 11,514 27,336 27,343 66,193
Years six to 10 20,174 31,594 36,694 88,462
Years 11 to 15 27,112 24,656 43,828 95,596
Year 16 to 20 36,436 15,333 51,899 103,668
Year 21 to 23 27,629 3,432 35,450 66,511
125,051 106,364 204,978 436,393 A PFI grant of £9 million was received from the Department for Transport to the County Council in 2010/11 with a balance of £216 million due to be received over the remainder of the contract. This grant is expected to be applied to cover the capital and financing costs built into the annual fee. Energy for street lighting is provided through a separate contract. Estimated costs over the remainder of the contract is expected to be £95 million. 31 Undischarged Obligations Hampshire Public Service Network A contract for Hampshire Public Service Network2 (HPSN2) has been entered onto with NTL Telewest. Building on the foundation of the existing HPSN service. HPSN2 will offer improved data, voice and service networks for major partners and affordable solutions for town and parish councils and up to 800 schools. The contract has an initial period of seven years, with an option to extend for a further 3 years. At 31 March 2012 the payments remaining under the contract are estimated to be £7.6m. 32 Pensions As part of the terms and conditions of employment of its staff, the Council provides retirement benefits. These will be paid only when employees retire but (in accordance with IAS 19) the Council must account for the commitments at the time that employees earn their future entitlement. The Council participates in two pension schemes: a) the Teachers’ Pension Scheme for teachers b) the Local Government Pension Scheme (LGPS) for other employees.
128

Notes to the Core Financial Statements
32a Teachers' Pension Scheme This is a defined benefit scheme administered by the Department for Education (DfE). The scheme provides teachers with specified benefits upon their retirement, and the Council contributes towards the costs by making contributions based on a percentage of members' pensionable salaries. The scheme is unfunded so the pensions of past employees are paid from current revenues. The DfE uses a notional fund as the basis for calculating the employers' contribution rate paid by local authorities. However, the Council is not able to identify its share of the underlying financial position and performance of the scheme with sufficient reliability for accounting purposes. So for the purposes of this Statement of Accounts, it is accounted for on the same basis as a defined contribution scheme. In 2011/12 total employer's contributions were £44.91 million representing 14.1% of pensionable pay (£50.91 million representing 14.1% of pensionable pay in 2010/11). The Council is responsible for the costs of any additional benefits awarded upon early retirement outside of the terms of the teachers' scheme. These costs are accounted for on a defined benefit basis and detailed in note 32c. 32b Local Government Pension Scheme This is a funded defined benefit scheme, administered by the Council. Employers and employees pay contributions into a fund at a level estimated to balance pension liabilities with investment assets. Enhanced pensions awarded by the Council are described as unfunded benefits. This is because they are not funded by the assets of the Pension Fund but by the Council when they are paid. In 2011/12, Pension Fund assets and liabilities have been included in the Balance Sheet based on a formal actuarial valuation for 31 March 2010. This valuation has been updated using the assumptions below.
129

Notes to the Core Financial Statements
Principal financial assumptions 2010/11 2011/12
% per year % per year
Rate of discount for scheme liabilities - funded pensions 5.4 4.7
Rate of discount for scheme liabilities - unfunded pensions 5.5 4.6
Rate of increase in salaries 4.95 4.8
Rate of increase in pensions in payment - funded pensions 2.55 2.3
Rate of increase in pensions in payment -unfunded pensions 2.45 2.1
Rate of increase in deferred pensions 2.55 2.3
Proportion of employees opting to take
a commuted lump sum:
for pre 1 April 2008 service 25 25
for post 1 April 2008 service 75 75
RPI inflation - funded pensions 3.45 3.3
RPI inflation - unfunded pensions 3.35 3.1
CPI inflation - funded pensions 2.55 2.3
CPI inflation - unfunded pensions 2.45 2.1 Principal demographic assumptions
Post retirement mortality 2010/11 2011/12
Men Base table
Standard SAPS Normal
Health Light AmountsStandard SAPS Normal
Health Light Amounts
Scaling to above base table rates 100% 100%
Improvements to base table rates
CMI_2009 with along term rate of improvement of
1.25% p.a.
CMI_2009 with along term rate of improvement of
1.25% p.a.
Future lifetime from age 65 (currently aged 65) 23.8 23.9
Future lifetime from age 65 (currently aged 45) 25.6 25.6
Women Base table
Standard SAPS Normal
Health Light AmountsStandard SAPS Normal
Health Light AmountsScaling to above base table rates 100% 100%Improvements to base table rates
CMI_2009 with a long term rate of improvement of
1.25% p.a.
CMI_2009 with a long term rate of improvement of
1.25% p.a.
Future lifetime from age 65 (currently aged 65) 24.8 24.9
Future lifetime from age 65 (currently aged 45) 26.7 26.8
130
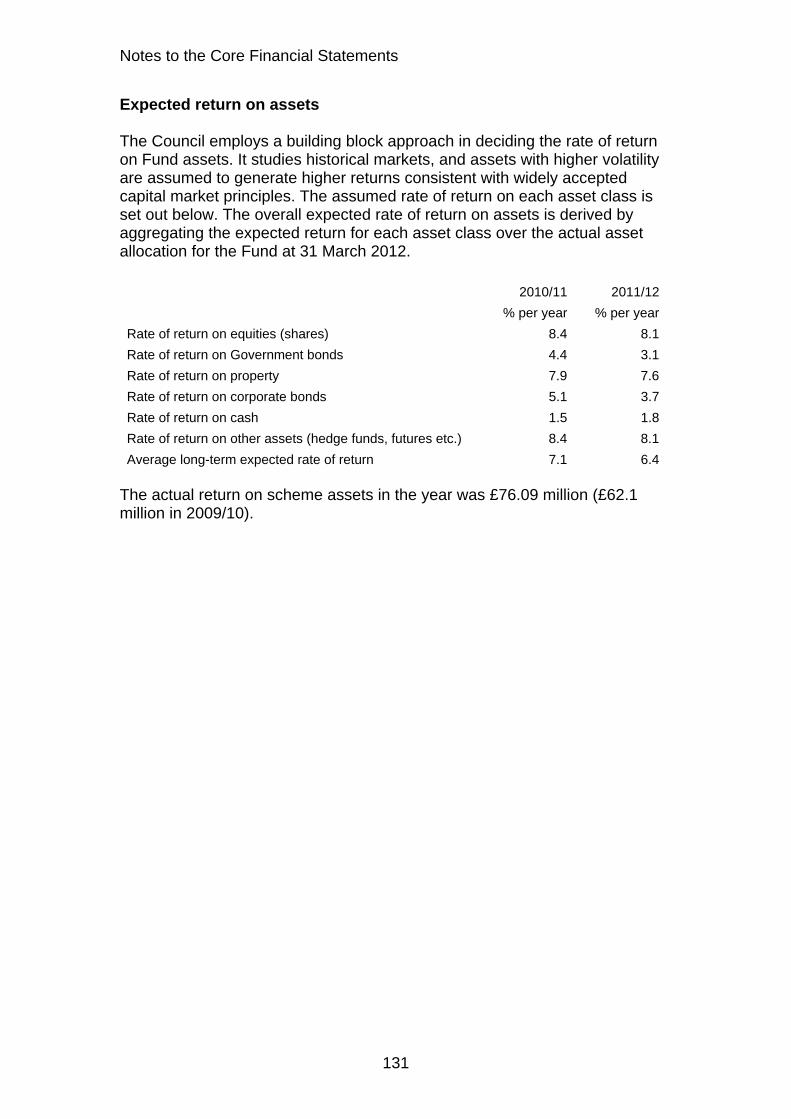
Notes to the Core Financial Statements
Expected return on assets The Council employs a building block approach in deciding the rate of return on Fund assets. It studies historical markets, and assets with higher volatility are assumed to generate higher returns consistent with widely accepted capital market principles. The assumed rate of return on each asset class is set out below. The overall expected rate of return on assets is derived by aggregating the expected return for each asset class over the actual asset allocation for the Fund at 31 March 2012. 2010/11 2011/12
% per year % per year
Rate of return on equities (shares) 8.4 8.1
Rate of return on Government bonds 4.4 3.1
Rate of return on property 7.9 7.6
Rate of return on corporate bonds 5.1 3.7
Rate of return on cash 1.5 1.8
Rate of return on other assets (hedge funds, futures etc.) 8.4 8.1
Average long-term expected rate of return 7.1 6.4 The actual return on scheme assets in the year was £76.09 million (£62.1 million in 2009/10).
131

Notes to the Core Financial Statements
32c Transactions relating to pension benefits The cost of retirement benefits is recognised in the reported cost of services when they are earned by employees, rather than when the benefits are eventually paid as pensions. However, the charge that is required to be made against council tax is based on the cash payable in the year, so the real cost of post employment/retirement benefits is reversed out of the General Fund via the Movement in Reserves Statement during the year:
2010/11 2011/12
£’000 £’000
Included in the Comprehensive Income and Expenditure Statement:
Current service cost of funded LAPS pensions 63,140 51,510
Charge to non-distributed costs for early retirement in the year (note i) -240,355 3,762
Settlement costs - -6,080
Interest cost on pension liabilities
LGPS funded liabilities 104,610 106,390
LGPS unfunded liabilities 1,450 1,340
Teachers' unfunded liabilities 2,010 1,880
108,070 109,610
Expected return on Pension Fund assets -78,930 -89,840Total post employment benefits charges to the surplus/deficit on the provision of services
-148,075 68,962
Actuarial losses 18,770 226,020Total post employment benefits charges to the Comprehensive Income and Expenditure Statement
-129,305 294,982
Movement in reserves statement
209,370 -224,290Reversal of net changes made to the surplus/deficit for the provision of services for post employment benefits in accordance with the Code
Actual amount charged against the General Fund Balance for pensions in the year
Employer's contributions payable to the fund -66,999 -62,671
Added years and early retirement cash flows in the year:
LGPS -10,388 -5,291
Teachers -2,678 -2,730
129,305 -294,982 The cumulative amount of actuarial gains and losses recognised in the Comprehensive Income and Expenditure statement to 31 March 2012 is a loss of £226 million. Note i. Impact of the change during 2010/11 to the basis on which the Government proposes to determine future pensions increases from RPI to CPI.
132

Notes to the Core Financial Statements
32d Changes to the present value of liabilities during the accounting period
Period ended 31 March 2012 LGPS LGPS Teachers' Total
funded Unfunded Unfunded
£’000 £’000 £’000 £’000
Opening present value of liabilities -1,967,590 -25,340 -35,490 -2,028,420
Current service cost -51,510 - - -51,510
Interest cost -106,390 -1,340 -1,880 -109,610
Contributions by participants -21,050 - - -21,050
Actuarial gains/(losses) on liabilities -207,510 -2,100 -2,660 -212,270
Net benefits paid out (note i) 74,230 1,970 2,720 78,920
Past service gain -6,780 - - -6,780
Settlements (note ii) 14,700 - - 14,700
Closing present value of liabilities -2,271,900 -26,810 -37,310 -2,336,020
Period ended 31 March 2011 LGPS LGPS Teachers' Total
funded Unfunded Unfunded
£’000 £’000 £’000 £’000
Opening present value of liabilities -2,074,760 -29,090 -40,430 -2,144,280
Current service cost -63,140 - - -63,140
Interest cost -104,610 -1,450 -2,010 -108,070
Contributions by participants -23,520 - - -23,520
Actuarial gains/(losses) on liabilities -3,740 870 900 -1,970
Net benefits paid out (note i) 63,450 1,940 2,690 68,080
Past service cost 238,730 2,390 3,360 244,480
Settlements (note ii) - - - -
Closing present value of liabilities -1,967,590 -25,340 -35,490 -2,028,420 note i - Consists of net cash flow out of the Fund in respect of the employer, excluding contributions and any death-in-service lump sums paid, and including an approximate allowance for the expected cost of death-in-service lump sums. note ii - Settlements relate to the liabilities transferred to schools that have converted to academy status.
133

Notes to the Core Financial Statements
32e Changes to the fair value of assets during the accounting period 31 March 31 March
2011 2012
£’000 £’000
Opening fair value of assets 1,180,950 1,274,460
Expected return on assets 78,930 89,840
Actuarial gains/(losses) on assets -16,800 -13,750
Contributions by employer 71,310 69,020
Contributions by participants 23,520 21,050
Net benefits paid out (note i) -63,450 -74,230
Settlements (note ii) - -8,620
Closing fair value of assets 1,274,460 1,357,770 note i - Consists of net cash flow out of the Fund in respect of the employer, excluding contributions and any death-in-service lump sums paid, and including an approximate allowance for the expected cost of death-in-service lump sums. note ii - Settlements relate to the liabilities transferred to schools that have converted to academy status. 32f Scheme history The Pension Fund's actuary assessed the share of the assets and liabilities of the Hampshire LGPS attributable to the Council and also the unfunded benefits of LGPS members and teachers. The actuary estimated that the following overall asset and liabilities for pension costs should be included in the balance sheet. 31 March 31 March 31 March 31 March 31 March
2008 2009 2010 2011 2012
£’000 £’000 £’000 £’000 £’000Present value of liabilities in the scheme:
LGPS funded -1,431,240 -1,523,940 -2,074,760 -1,967,590 -2,271,900
Unfunded Liabilities:
LGPS -26,770 -27,020 -29,090 -25,340 -26,810
Teachers -36,280 -37,310 -40,430 -35,490 -37,310
-1,494,290 -1,588,270 -2,144,280 -2,028,420 -2,336,020Fair value of assets in the scheme
1,053,980 860,700 1,180,950 1,274,460 1,357,770
Deficit -440,310 -727,570 -963,330 -753,960 -978,250
134

Notes to the Core Financial Statements
The liabilities show the underlying commitments that the Council has in the long run to pay post employment (retirement) benefits. The net deficit reduces the net worth of the Council as recorded on the balance sheet. However, statutory arrangements for funding the deficit mean that the financial position of the Council remains healthy: the deficit will be made good by increased contributions over the remaining
working life of employees (i.e. before payments fall due), as assessed by the scheme actuary
finance is only required to be raised to cover discretionary (unfunded) benefits when the pensions are actually paid.
The total contributions expected to be made to the LGPS by the council in the year to 31 March 2013 is £62.8 million. Expected contributions for discretionary benefits in the year to 31 March 2013 are £1 million. The proportion of assets by category is shown below: 31 March 31 March
2011 2012
% %
Equities 63.4 55.1
Government bonds 23.3 27.0
Property 7.3 7.7
Corporate bonds 1.7 1.5
Cash 4.3 4.1
Other (hedge funds, currency holdings, futures) - 4.6
100.0 100.0
135

Notes to the Core Financial Statements
32g Net actuarial gain/loss (-) on pensions The actuarial gains/loss (-) identified as movements on the Pensions Reserve in 2011/12 can be analysed into the following categories, measured in absolute amounts and as a percentage of assets or liabilities at 31 March 2012: 2007/08 2008/09 2009/10 2010/11 2011/12
£’000 £’000 £’000 £’000 £’000
Difference between -98,040 -288,800 239,540 -16,800 -13,750
expected and actual -9.3% 33.6% 20.3% -1.3% -1.0%
return on assets
Difference between actuarial assumptions about liabilities and actual experience
LGPS funded 29,220 -5,870 16,660 -26,750 -40,480
2.0% -0.4% 0.8% -1.4% -1.8%
LGPS unfunded -430 -220 1,320 430 -650
-1.6% -0.8% 4.5% 1.7% -2.4%
Teachers unfunded - -400 1,640 240 -630
- - 4.1% 0.7% -1.7%
TOTAL 28,790 -6,490 19,620 -26,080 -41,760
1.9% -0.4% 0.9% -1.3% -1.8%
Changes in assumptions underlying the present value of pension liabilities
LGPS funded 268,020 23,690 -449,550 23,010 -167,030
1.6% 1.6% -21.7% 1.2% -7.4%
LGPS unfunded 2,280 -230 -3,640 440 -1,450
8.5% -0.9% -12.5% 1.7% -5.4%
Teachers unfunded 3,190 -360 -5,080 660 -2,030
8.8% -1.0% -12.6% 1.9% -5.4%
TOTAL 273,490 23,100 -458,270 24,110 -170,510
18.3% 1.5% 21.4% 1.2% -7.3%
204,240 -272,190 -199,110 -18,770 -226,020Net actuarial gain/loss (-)
33 Contingent liabilities The County Council self-insures and therefore handles all its own liability claims. The liabilities are uncertain but to cover them a provision is maintained for known liability claims, assessed at £7.8 million at 31 March 2012 (see note 16).
136

Notes to the Core Financial Statements
137
34 Trust funds The Council has acted as sole trustee for 22 trust funds (23 in 2010/11) and as administrator for 12 other trust funds (12 in 2010/11). They include educational prize funds, funds for financing improvements in education, social care and museum establishments, and musical and sports scholarship funds. The trusts are mainly invested in specialist pooled funds for charities and cash held on deposit with the County Council.
Balance at 31
March 2011 Income Expenditure
Transfer of Trust
Balance at 31
March 2012
£’000 £’000 £’000 £’000 £’000
Sole trustee funds
Educational trusts
Dayas Music Scholarship -95 -5 1 - -99
Michael Austin Harlick Memorial -258 -13 8 - -263
Mace Educational Trust -113 -5 9 - -109
Other -16 - - - -16
Total -482 -23 18 - -487
Social Care trusts Hampshire Mentally Ill Persons Holiday Organisation
-43 - - - -43
Hampshire Old Industrial and Reformatory Schools
-69 -5 - - -74
Green Meadows Older Persons Home -17 -1 - - -18
Total -129 -6 - - -135
Museums trusts
Allen Curtis Museum Trust -23 -3 3 - -23
Red House Museum Trust -50 -4 4 - -50
Total -73 -7 7 - -73
Libraries trust
Julian Davies Foundation -2 - - - -2
Other
Hillier Arboretum trust -11 -44 45 - -10
Total - sole trustee trusts -697 -80 70 - -707
Administrator funds The Eggars Grammar School Alton Site Foundation
-1,974 -82 9 - -2,047
Hampshire Foundation for Young Musicians -68 -4 4 - -68
Other -26 -1 - - -27
Social care trusts -6 - - - -6
Total administrator trusts -2,074 -87 13 - -2,148
Total trust funds -2,771 -167 83 - -2,855
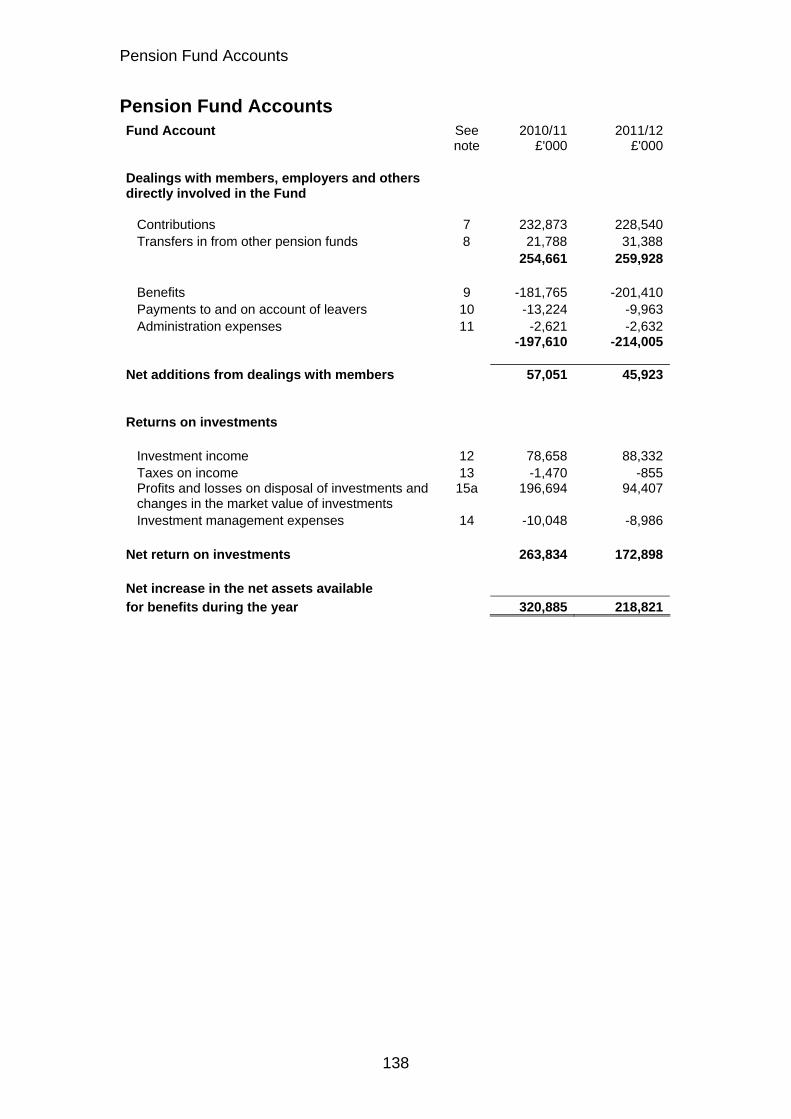
Pension Fund Accounts
Pension Fund Accounts
Fund Account See 2010/11 2011/12 note £'000 £'000 Dealings with members, employers and others directly involved in the Fund Contributions 7 232,873 228,540 Transfers in from other pension funds 8 21,788 31,388 254,661 259,928 Benefits 9 -181,765 -201,410 Payments to and on account of leavers 10 -13,224 -9,963 Administration expenses 11 -2,621 -2,632 -197,610 -214,005 Net additions from dealings with members 57,051 45,923 Returns on investments Investment income 12 78,658 88,332 Taxes on income 13 -1,470 -855 Profits and losses on disposal of investments and changes in the market value of investments
15a 196,694 94,407
Investment management expenses 14 -10,048 -8,986 Net return on investments 263,834 172,898 Net increase in the net assets available
for benefits during the year 320,885 218,821
138

Pension Fund Accounts
139
Net Assets Statement See 31 March 2011 31 March 2012 Note £'000 £'000 Investment assets 15 3,397,656 3,582,683 Cash deposits 15 50,465 60,421 3,448,121 3,643,104 Long term debtors 22 - 13,692 Investment liabilities 15 -6,768 -2,228 Current assets 20 126,389 130,521 Current liabilities 21 -9,322 -7,848 Net assets of the Scheme available to fund Benefits at the period end 3,558,420 3,777,241

Notes to the Pension Fund Accounts
Notes to the Pension Fund Accounts 1 Description of Fund The Hampshire Pension Fund (the ‘Fund’) is part of the Local Government Pension Scheme and is administered by Hampshire County Council. The County Council is the reporting entity for this pension fund. The following description of the Fund is a summary only and supports the information contained at the beginning of this Annual Report and in the underlying statutory powers underpinning the Scheme, namely the Superannuation Act 1972 and the Local Government Pension Scheme (LGPS) Regulations. a) General The Fund is governed by the Superannuation Act 1972. The Fund is administered in accordance with the following secondary legislation: the LGPS (Benefits, Membership and Contributions) Regulations 2007 (as
amended) the LGPS (Administration) Regulations 2008 (as amended) the LGPS (Management and Investment of Funds) Regulations 2009. It is a contributory defined benefit pension scheme to provide pensions and other benefits for pensionable employees of Hampshire County Council, Portsmouth and Southampton City Councils, the 11 district councils in Hampshire County, and a range of other scheduled and admission bodies. Teachers, police officers and firefighters are not included as they come within other national pension schemes. The Fund is overseen by the Pension Fund Panel, which is a committee of Hampshire County Council. b) Membership Membership of the LGPS is voluntary and employees are free to choose whether to join the Scheme, remain in the Scheme or make their own personal arrangements outside the Scheme. Organisations participating in the Hampshire Pension Fund include: Scheduled bodies, which are local authorities and similar bodies whose
staff are automatically entitled to be members of the Fund Admission bodies, which are other organisations that participate in the
Fund under an admission agreement between the Fund and the relevant organisation. Admission bodies include voluntary, charitable and similar bodies or private contractors undertaking a local authority function following outsourcing to the private sector.
140

Notes to the Pension Fund Accounts
There are 248 employer organisations within the Hampshire Pension Fund including the County Council itself, as detailed below: Hampshire Pension Fund 31 March 2011 31 March 2012 Number of employers with active members 212 248 Number of employees in Scheme County Council 22,345 20,911Other employers 25,906 24,722Total 48,251 45,633 Number of pensioners County Council 13,242 14,163Other employers 16,910 18,029Total 30,152 32,192 Deferred pensioners County Council 20,736 22,587Other employers 21,599 23,029Total 42,335 45,616 The significant increase in employer organisations is due to a number of state schools converting to academy status during 2011/12, which are subsequently treated as separate employers to the County Council. c) Funding Benefits are funded by contributions and investment earnings. Contributions are made by active members of the Fund in accordance with the LGPS (Benefits, Membership and Contributions) Regulations 2007 and range from 5.5% to 7.5% of pensionable pay for the financial year ending 31 March 2012. Employee contributions are matched by employers’ contributions which are set based on triennial actuarial funding valuations. The last such valuation was at 31 March 2010. During 2011/12, employer contribution rates for most employers ranged from 19.1% to 19.6% of pensionable pay. d) Benefits Pension benefits under the LGPS are based on final pensionable pay and length of pensionable service, summarised below: Service pre 1 April 2008 Service post 31 March 2008 Pension Each year worked is worth 1/80 x
final pensionable salary. Each year worked is worth 1/60 x final pensionable salary.
Lump sum Automatic lump sum of 3 x salary.
In addition, part of the annual pension can be exchanged for a one-off tax-free cash payment. A lump sum of £12 is paid for each £1 of pension given up.
No automatic lump sum. Part of the annual pension can be exchanged for a one-off tax-free cash payment. A lump sum of £12 is paid for each £1 of pension given up.
141

Notes to the Pension Fund Accounts
There are a range of other benefits provided under the Scheme including early retirement, disability pensions and death benefits. For more details, please refer to the Hampshire Pension Fund’s website: http://www3.hants.gov.uk/pensions Benefits are index-linked in order to keep pace with inflation. In June 2010, the Government announced that the method of indexation would change from the Retail Prices Index (RPI) to the Consumer Prices Index (CPI). This change took effect from 1 April 2011. 2 Basis of preparation The Statement of Accounts summarises the Fund’s transactions for the 2011/12 financial year and its position at year-end as at 31 March 2012. The accounts have been prepared in accordance with the Code of Practice on Local Authority Accounting in the United Kingdom 2011/12 which is based upon International Financial Reporting Standards (IFRS), as amended for the UK public sector. The accounts summarise the transactions of the Fund and report on the net assets available to pay pension benefits. The accounts do not take account of obligations to pay pensions and benefits which fall due after the end of the financial year. The actuarial present value of promised retirement benefits, valued on an International Accounting Standard (IAS) 19 basis, is disclosed at Note 19 of these accounts. 3 Summary of significant accounting policies Fund Account – revenue recognition a) Contribution income Normal contributions, both from the members and from the employer, are accounted for on an accruals basis at the percentage rate recommended by the Fund actuary in the payroll period to which they relate. Employers’ augmentation contributions and pensions strain contributions are accounted for in the period in which the liability arises. Any amount due in year but unpaid will be classed as a current financial asset. Amounts not due until future years are classed as long-term financial assets. b) Transfers to and from other schemes Transfer values represent the amounts received and paid during the year for members who have either joined or left the Fund during the financial year and are calculated in accordance with the Local Government Pension Scheme Regulations (see Notes 8 and 10).
142

Notes to the Pension Fund Accounts
Individual transfers in/out are accounted for when received/paid, which is normally when the member liability is accepted or discharged. Transfers in from members wishing to use the proceeds of their additional voluntary contributions (see section n below) to purchase Scheme benefits are accounted for on a receipts basis and are included in Transfers In (see Note 8). Bulk (group) transfers are accounted for on an accruals basis in accordance with the terms of the transfer agreement. c) Investment income i) Interest income Interest income is recognised in the Fund Account as it accrues, using the effective interest rate of the financial instrument as at the date of acquisition. Income includes the amortisation of any discount or premium, transaction costs or other differences between the initial carrying amount of the instrument and its amount at maturity calculated on an effective interest rate basis. ii) Dividend income Dividend income is recognised on the date the shares are quoted ex-dividend. Any amount not received by the end of the reporting period is disclosed in the Net Assets Statement as a current financial asset. iii) Distributions from pooled funds Distributions from pooled funds are recognised at the date of issue. Any amount not received by the end of the reporting period is disclosed in the Net Assets Statement as a current financial asset. iv) Property-related income Property-related income consists primarily of rental income. Properties held in the UK property portfolio are generally subject to leases with upward-only rent reviews every five years. Rental income from operating leases on properties owned by the Fund is recognised on a straight-line basis over the term of the lease. Any lease incentives granted are recognised as an integral part of the total rental income, over the term of the lease. Contingent rents based on the future amount of a factor that changes other than with the passage of time, such as turnover rents, are only recognised when contractually due. v) Movement in the net market value of investments Changes in the net market value of investments (including investment properties) are recognised as income and comprise all realised and unrealised profits/losses during the year.
143

Notes to the Pension Fund Accounts
Fund Account – expense items d) Benefits payable Pensions and lump-sum benefits payable include all amounts known to be due as at the end of the financial year. Any amounts due but unpaid are disclosed in the Net Assets Statement as current liabilities. e) Taxation The Fund is a registered public service scheme under section 1(1) of Schedule 36 of the Finance Act 2004 and as such is exempt from UK income tax on interest received and from capital gains tax on the proceeds of investments sold. Income from overseas investments suffers withholding tax in the country of origin, unless exemption is permitted. Irrecoverable tax is accounted for as a Fund expense as it arises. f) Administration expenses All administration expenses are accounted for on an accruals basis. All staff costs of the pensions administration team are charged direct to the Fund. Management, accommodation and other overheads are apportioned to the Fund in accordance with Council policy. g) Investment management expenses All investment management expenses are accounted for on an accruals basis. Fees of the external investment managers and custodian are agreed in the respective mandates governing their appointments. Broadly, these are based on the market value of the investments under their management and therefore increase or reduce as the value of these investments change. The cost of obtaining investment advice from external consultants is included in investment management charges. Net Assets Statement h) Financial assets Financial assets are included in the Net Assets Statement on a fair value basis as at the reporting date. A financial asset is recognised in the Net Assets Statement on the date the Fund becomes party to the contractual acquisition of the asset. From this date, any gains or losses arising from changes in the fair value of the asset are recognised by the Fund.
144

Notes to the Pension Fund Accounts
The values of investments as shown in the Net Assets Statement have been determined as follows: i) Market-quoted investments The value of an investment for which there is a readily available market price is determined by the bid market price ruling on the final day of the accounting period. ii) Fixed interest securities Fixed interest securities are recorded at net market value based on their current yields. iii) Unquoted investments The fair value of investments for which market quotations are not readily available is determined as follows: Valuations of delisted securities are based on the last sale price prior to
delisting, or where subject to liquidation, the amount the Fund expects to receive on wind-up, less estimated realisation costs
Securities subject to takeover offer – the value of the consideration offered under the offer, less estimated realisation costs
Directly held investments include investments in limited partnerships, shares in unlisted companies, trusts and bonds. Other unquoted securities typically include pooled investments in property, infrastructure, debt securities and private equity. The valuation of these pools or directly held securities is undertaken by the investment manager or responsible entity and advised as a unit or security price. The valuation standards followed in these valuations adhere to industry guidelines or to standards set by the constituent documents of the pool or the management agreement
Investments in unquoted property and infrastructure pooled funds are valued at the net asset value or a single price advised by the fund manager
Investments in private equity funds and unquoted listed partnerships are valued based on the Fund’s share of the net assets in the private equity fund or limited partnership using the latest financial statements published by the respective fund managers in accordance with standardised methods developed by the British Venture Capital Association and European Venture Capital Association (who have subsequently harmonised their valuation guidelines into the International Private Equity and Venture Capital Valuation (IPEV) guidelines).
iv) Limited partnerships Fair value is based on the net asset value ascertained from periodic valuations provided by those controlling the partnership. v) Pooled investment vehicles Pooled investment vehicles are valued at closing bid price if both bid and offer prices are published; or if single priced, at the closing single price. In the case of pooled investment vehicles that are accumulation funds, change in market value also includes income which is reinvested in the fund, net of applicable withholding tax.
145

Notes to the Pension Fund Accounts
vi) Freehold and leasehold properties The properties were valued on 31 March 2012 by an external valuer, Paul Willis, BSc MRICS of Colliers International. The valuations were in accordance with the requirements of the Royal Institute of Chartered Surveyors’ Valuation – Professional Standards and the International Valuation Standards. The valuation of each property was on the basis of fair value, as defined by the International Accounting Standards Board. All the properties are held for investment purposes and were valued on the assumption that the properties would be sold subject to any existing leases. The valuer’s opinion of fair value was primarily derived using comparable recent market transactions on arm’s length terms. i) Foreign currency transactions Dividends, interest and purchases and sales of investments in foreign currencies have been accounted for at the spot market rates at the date of transaction. End-of-year spot market exchange rates are used to value cash balances held in foreign currency bank accounts, market values of overseas investments and purchases and sales outstanding at the end of the reporting period. j) Derivatives The Fund uses derivative financial instruments to manage its exposure to specific risks arising from its investment activities. The Fund does not hold derivatives for speculative purposes. Derivative contract assets are fair valued at bid prices and liabilities are fair valued at offer prices. Changes in the fair value of derivative contracts are included in change in market value. The value of futures contracts is determined using exchange prices at the reporting date. Amounts due from or owed to the broker are the amounts outstanding in respect of the initial margin and variation margin. The value of exchange traded options is determined using the exchange price for closing out the option at the reporting date. The value of over-the-counter contract options is based on quotations from an independent broker. Where this is not available, the value is provided by the investment manager using generally accepted option-pricing models with independent market data. The future value of forward currency contracts is based on market forward exchange rates at the year-end date and determined as the gain or loss that would arise if the outstanding contract were matched at the year-end with an equal and opposite contract.
146

Notes to the Pension Fund Accounts
k) Cash and cash equivalents Cash comprises cash in hand and demand deposits. Cash equivalents are short-term, highly liquid investments that are readily convertible to known amounts of cash and that are subject to minimal risk of changes in value. l) Financial liabilities The Fund recognises financial liabilities at fair value as at the reporting date. A financial liability is recognised in the Net Assets Statement on the date the Fund becomes party to the liability. From this date any gains or losses arising from changes in the fair value of the liability are recognised by the Fund. m) Actuarial present value of promised retirement benefits The actuarial present value of promised retirement benefits is assessed on a triennial basis by the Scheme actuary in accordance with the requirements of IAS 19 and relevant actuarial standards. As permitted under IAS 26, the Fund has opted to disclose the actuarial present value of promised retirement benefits by way of a note to the Net Assets Statement (Note 19). n) Additional voluntary contributions Hampshire Pension Fund provides an additional voluntary contributions (AVC) scheme for its members, the assets of which are invested separately from those of the Pension Fund. Prudential were appointed as a new additional voluntary contribution (AVC) provider in addition to Zurich with effect from October 2011. AVCs can also be paid to Equitable Life, but only if they are invested in its building society fund or for an additional death-in-service grant. AVCs are paid to the AVC provider by employers and are specifically for providing additional benefits for individual contributors. Each AVC contributor receives an annual statement showing the amount held in their account and the movements in the year. AVCs are not included in the accounts in accordance with section 4(2)(b) of the LGPS (Management and Investment of Funds) Regulations 2009 (SI 2009/3093) but are disclosed as a note only (Note 23).
147

Notes to the Pension Fund Accounts
4 Critical judgements in applying accounting policies Unquoted private equity investments It is important to recognise the highly subjective nature of determining the fair value of private equity investments. They are inherently based on forward-looking estimates and judgements involving many factors. The convention for valuing unquoted private equities uses standardised methods developed by the British Venture Capital Association and European Venture Capital Association (who have subsequently harmonised their valuation guidelines into the International Private Equity and Venture Capital Valuation (IPEV) guidelines). The value of unquoted private equities at 31 March 2012 was £164 million (£150 million at 31 March 2011). Pension fund liability The pension fund liability is calculated every three years by the appointed actuary. The methodology used is in line with accepted guidelines and in accordance with IAS 19. Assumptions underpinning the valuations are agreed with the actuary and are summarised in Note 19. This estimate is subject to significant variances based on changes to the underlying assumptions. 5 Assumptions made about the future and other major sources of
estimation uncertainty The Statement of Accounts contains estimated figures that are based on assumptions made by the Council about the future or that are otherwise uncertain. Estimates are made taking into account historical experience, current trends and other relevant factors. However, because balances cannot be determined with certainty, actual results could be materially different from the assumptions and estimates.
148

Notes to the Pension Fund Accounts
The items in the Net Assets Statement at 31 March 2012 for which there is a significant risk of material adjustment in the forthcoming financial year are as follows: Item Uncertainties Effect if actual results differ
from assumptions Actuarial present value of promised retirement benefits
Estimation of the net liability to pay pensions depends on a number of complex judgements relating to the discount rate used, the rate at which salaries are projected to increase, changes in retirement ages, mortality rates and expected returns on pension fund assets. A firm of consulting actuaries is engaged to provide the Fund with expert advice about the assumptions to be applied.
The effects on the net pension liability of changes in individual assumptions can be measured. For instance, a 0.5% increase in the discount rate assumption would result in a decrease in the pension liability of approximately £460 million. A 0.25% increase in assumed earnings inflation would increase the value of liabilities by approximately £50 million, and a one-year increase in assumed life expectancy would increase the liability by approximately £120 million.
Debtors At 31 March 2012, the Fund had a balance of sundry debtors of £65.1 million. A review of debtor balances suggested that an impairment of £0.008 million was appropriate. However, in the current economic climate, it is not certain that such an allowance would be sufficient.
If collection rates were to deteriorate, a doubling of the amount of the impairment of doubtful debts would require an additional £0.008 million to be set aside as an allowance.
Private equity Private equity investments are valued at fair value in accordance with the International Private Equity and Venture Capital Valuation (IPEV) guidelines. These investments are not publicly listed and as such there is a degree of estimation involved in the valuation.
The total private equity investments in the financial statements are £164 million. There is a risk that this investment may be under- or overstated in the accounts.
Hedge funds Hedge funds are valued at the sum of the fair values provided by the administrators of the funds plus adjustments that the funds’ directors or independent administrators judge necessary. These investments are not publicly listed and as such there is a degree of estimation involved in the valuation.
The total hedge fund value in the financial statements is £43 million. There is a risk that this investment may be under- or overstated in the accounts. The custodian reports a tolerance of +/- 5% around the net asset values on which the hedge fund valuation is based. This equates to a tolerance of +/- £2 million.
6 Events after the Balance Sheet date There have been no events since 31 March 2012, and up to the date when these accounts were authorised, that require any adjustments to these accounts.
149

Notes to the Pension Fund Accounts
7 Contributions receivable By category 2010/11 2011/12 £’000 £’000 Employers 174,551 173,994Members 58,322 54,546Total 232,873 228,540 By authority 2010/11 2011/12 £’000 £’000 Scheduled bodies 224,032 218,734Admission bodies 2,689 2,591Community admission bodies 2,096 2,321Transferee admission bodies 3,130 3,947Resolution bodies 926 947Total 232,873 228,540 8 Transfers in from other pension funds 2010/11 2011/12 £’000 £’000 Group transfers - 15,213Individual transfers 21,788 16,175Total 21,788 31,388 9 Benefits payable By category 2010/11 2011/12 £’000 £’000 Pensions 131,033 145,021Commutation and lump sum retirement benefits 46,347 52,640Lump sum death benefits 4,385 3,749Total 181,765 201,410 By authority 2010/11 2011/12 £’000 £’000 Scheduled bodies 175,887 194,815Admission bodies 2,835 2,896Community admission bodies 1,391 1,992Transferee admission bodies 716 1,034Resolution bodies 936 673Total 181,765 201,410
150

Notes to the Pension Fund Accounts
10 Payments to and on account of leavers 2010/11 2011/12 £’000 £’000 Refunds to members leaving service 57 22Payments for members joining state scheme -18 -17Group transfers 63 -Individual transfers 13,122 9,958Total 13,224 9,963 11 Administration expenses 2010/11 2011/12 £’000 £’000 Pension administration costs 2,403 2,472External audit fees 47 43Internal audit fees 36 33Actuarial fees 86 56Other 49 28Total 2,621 2,632 12 Investment income 2010/11 2011/12 £’000 £’000 Fixed interest securities 6,166 5,849Equity dividends 54,168 58,949Pooled property investments 1,842 3,537Pooled investments – unit trusts and other managed funds
905 1,016
Property 10,624 14,205Interest on cash deposits 1,620 1,479Alternative investment income 2,223 2,671Stock lending 805 449Other 305 177Total 78,658 88,332 13 Taxes on income 2010/11 2011/12 £’000 £’000 Withholding tax – fixed interest securities 17 13Withholding tax – equities 1,453 842Total 1,470 855
151

Notes to the Pension Fund Accounts
14 Investment management expenses 2010/11 2011/12 £’000 £’000 Management fees 8,032 7,085Property managers’ expenses 1,219 1,140Custodian fees 349 311Actuary fees – investment consultancy 20 4Other 428 446Total 10,048 8,986 15 Investments Market value Market value 31 March 2011 31 March 2012 £’000 £’000 Investment assets Fixed interest securities 170,157 175,963Equities 2,011,143 1,736,856Pooled investments 764,452 1,180,216Pooled property investments 74,228 69,152Alternative investments 185,603 206,874Property 189,090 208,790Derivative contracts: - Futures 199 425- Forward currency contracts 2,647 4,258- Purchased/written options 137 149Cash deposits 50,465 60,421Total investment assets 3,448,121 3,643,104Investment liabilities Derivative contracts: - Futures -229 -399- Forward currency contracts -6,074 -1,394- Purchased/written options -465 -390- Spot foreign exchange contracts - -19- Adjustment to variation margins - -26Total investment liabilities -6,768 -2,228Net investment assets 3,441,353 3,640,876
152

Notes to the Pension Fund Accounts
a) Reconciliation of movements in investments and derivatives
Market value
1 April 2011
Purchases during the year and
derivative payments
Sales during the year and
derivative receipts
Change in market
value during the
year
Market value
31 March 2012
£’000 £’000 £’000 £’000 £’000Fixed interest securities 170,157 357,227 -357,838 6,417 175,963Equities 2,011,143 618,065 -803,295 -89,057 1,736,856Pooled investments 764,452 240,549 -6,201 181,416 1,180,216Pooled property investments
74,228 5,482 -4,948 -5,610 69,152
Alternative investments 185,603 38,839 -25,330 7,762 206,874Property 189,090 25,885 - -6,185 208,790 3,394,673 1,286,047 -1,197,612 94,743 3,577,851
Derivative contracts: - Futures -30 12,867 -363 -12,448 26 - Forward currency contracts
-3,427 23,321 -26,851 9,821 2,864
- Purchased/written options
-328 3,649 -5,853 2,291 -241
-3,785 39,837 -33,067 -336 2,649
Other investment balances:
- Cash deposits 50,465 60,421 - Spot foreign exchange contracts
- -19
- Adjustment to variation margin
- -26
Net investment assets 3,441,353 94,407 3,640,876
153

Notes to the Pension Fund Accounts
Market
value 1 April
2010
Purchases during the year and
derivative payments
Sales during the year and
derivative receipts
Change in market
value during the
year
Market value
31 March 2011
£’000 £’000 £’000 £’000 £’000Fixed interest securities 155,063 190,649 -172,766 -2,789 170,157Equities 1,823,228 642,889 -574,462 119,488 2,011,143Pooled investments 714,368 4,390 -6,946 52,640 764,452Pooled property investments
60,656 10,150 -26 3,448 74,228
Alternative investments 128,326 82,855 -33,190 7,612 185,603Property 134,273 51,109 -7,462 11,170 189,090 3,015,914 982,042 -794,852 191,569 3,394,673
Derivative contracts: - Futures 15 117 -235 73 -30 - Forward currency contracts
- 33,684 -40,298 3,187 -3,427
- Purchased/written options
11 1,231 -3,435 1,865 -328
26 35,032 -43,968 5,125 -3,785
Other investment balances:
- Cash deposits 98,098 50,465
Net investment assets 3,114,038 196,694 3,441,353
Transaction costs are included in the cost of purchases and in sale proceeds. These include costs charged directly to the Fund, such as commissions, stamp duty and other fees.
154

Notes to the Pension Fund Accounts
b) Analysis of investments (excluding derivative contracts) 31 March 2011 31 March 2012 £’000 £’000Fixed interest securities UK Public sector quoted 8,142 5,637Corporate quoted 11,927 8,491Overseas Public sector quoted 98,749 115,050Corporate quoted 51,339 46,785 170,157 175,963Equities UK Quoted 967,278 876,124Overseas Quoted 1,043,865 860,732 2,011,143 1,736,856Pooled funds – additional analysis UK Fixed income unit trusts 727,018 880,867Unit trusts 37,434 293,397Overseas Unit trusts - 5,952 764,452 1,180,216 Pooled property investments 74,228 69,152Alternative investments 185,603 206,874Property 189,090 208,790 448,921 484,816 3,394,673 3,577,851 Analysis of derivatives Objectives and policies for holding derivatives Most of the holding in derivatives is to hedge liabilities or hedge exposures to reduce risk in the Fund. Derivatives may be used to gain exposure to an asset more efficiently than holding the underlying asset. The use of derivatives is managed in line with the investment management agreement agreed between the Fund and the various investment managers. All of the derivative future and option contracts are exchange traded, in other words, none are ‘over the counter’ (OTC). The forward foreign currency contracts are all OTC contracts whereby two parties agree to exchange two currencies on a specified future date at an agreed rate of exchange. a) Futures The economic exposure represents the notional value of stock purchased under futures contracts and is therefore subject to market movements.
155

Notes to the Pension Fund Accounts
b) Forward foreign currency In order to maintain appropriate diversification and to take advantage of overseas investment returns, a significant proportion of the Fund’s portfolio is in foreign currency. To reduce the volatility associated with fluctuating currency rates, derivative contracts are used. c) Options The Fund wants to benefit from the potentially greater returns available from investing in equities but wishes to minimise the risk of loss of value through adverse equity price movements. Futures Outstanding exchange traded futures contracts are as follows:
Type Expires Economic exposure
Market value
31 March 2011
Economic exposure
Market value
31 March 2012
£’000 £’000 £’000 £’000Assets Overseas fixed income futures
Less than one year
21,254 185 35,973 301
Overseas fixed income margined options
Less than one year
-10 14 - -
Overseas cash futures Less than one year
- - 48,852 124
Total assets 199 425
Liabilities UK cash futures Less than
one year54,913 -23 - -
UK cash margined options
Less than one year
- -5 - -
Overseas fixed income futures
Less than one year
11,506 -200 -57,030 -399
Overseas fixed income margined options
Less than one year
1 -1 - -
Total liabilities -229 -399
Net futures -30 26
156
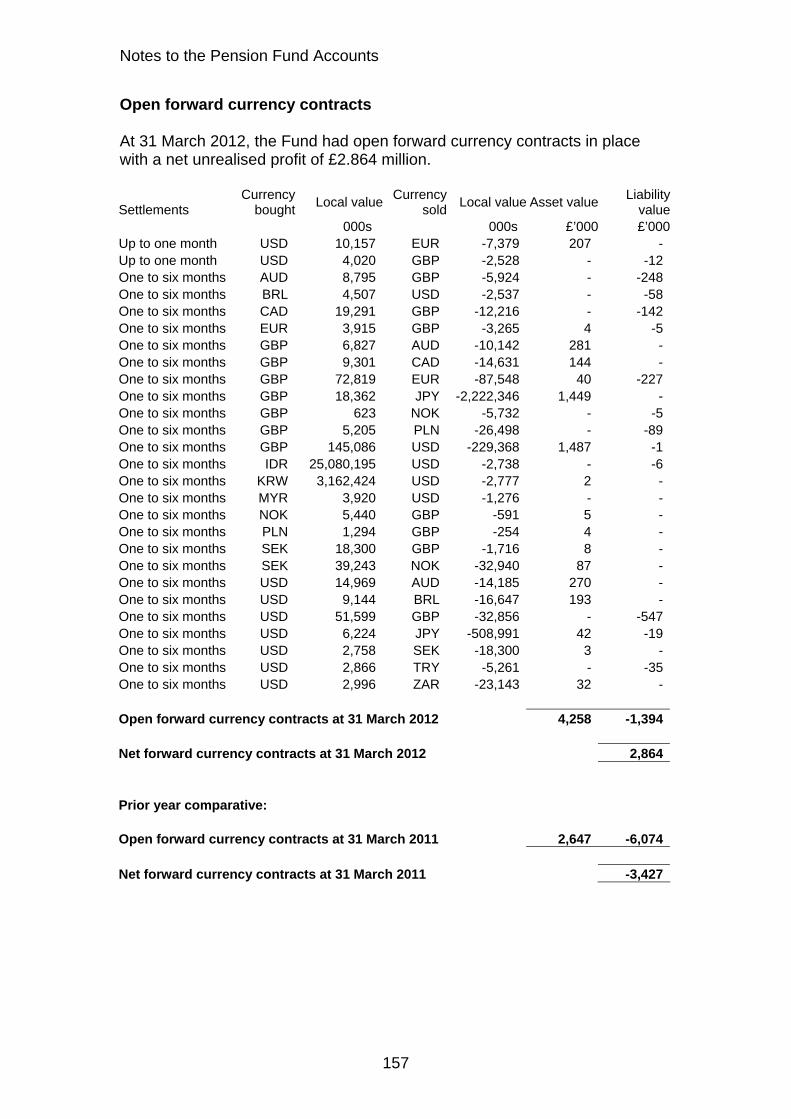
Notes to the Pension Fund Accounts
Open forward currency contracts At 31 March 2012, the Fund had open forward currency contracts in place with a net unrealised profit of £2.864 million.
Settlements Currency
boughtLocal value
Currency sold
Local value Asset valueLiability
value 000s 000s £’000 £’000Up to one month USD 10,157 EUR -7,379 207 -Up to one month USD 4,020 GBP -2,528 - -12One to six months AUD 8,795 GBP -5,924 - -248One to six months BRL 4,507 USD -2,537 - -58One to six months CAD 19,291 GBP -12,216 - -142One to six months EUR 3,915 GBP -3,265 4 -5One to six months GBP 6,827 AUD -10,142 281 -One to six months GBP 9,301 CAD -14,631 144 -One to six months GBP 72,819 EUR -87,548 40 -227One to six months GBP 18,362 JPY -2,222,346 1,449 -One to six months GBP 623 NOK -5,732 - -5One to six months GBP 5,205 PLN -26,498 - -89One to six months GBP 145,086 USD -229,368 1,487 -1One to six months IDR 25,080,195 USD -2,738 - -6One to six months KRW 3,162,424 USD -2,777 2 -One to six months MYR 3,920 USD -1,276 - -One to six months NOK 5,440 GBP -591 5 -One to six months PLN 1,294 GBP -254 4 -One to six months SEK 18,300 GBP -1,716 8 -One to six months SEK 39,243 NOK -32,940 87 -One to six months USD 14,969 AUD -14,185 270 -One to six months USD 9,144 BRL -16,647 193 -One to six months USD 51,599 GBP -32,856 - -547One to six months USD 6,224 JPY -508,991 42 -19One to six months USD 2,758 SEK -18,300 3 -One to six months USD 2,866 TRY -5,261 - -35One to six months USD 2,996 ZAR -23,143 32 - Open forward currency contracts at 31 March 2012 4,258 -1,394 Net forward currency contracts at 31 March 2012 2,864 Prior year comparative: Open forward currency contracts at 31 March 2011 2,647 -6,074 Net forward currency contracts at 31 March 2011 -3,427
157
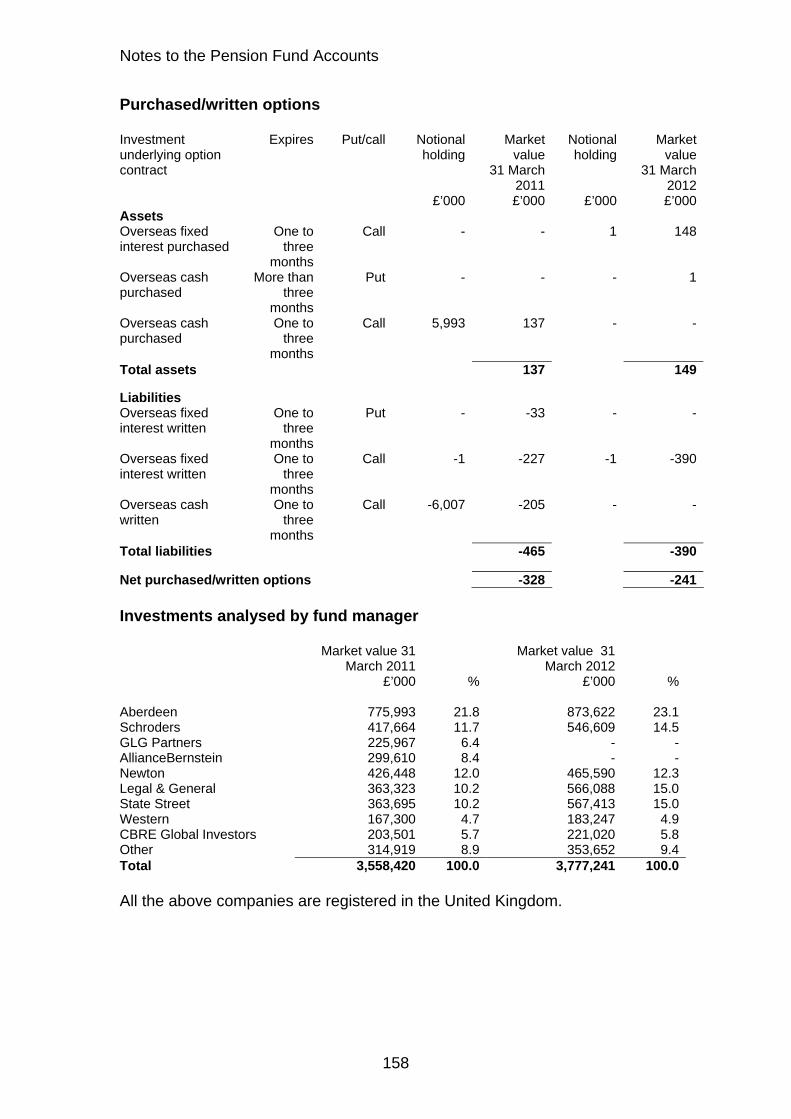
Notes to the Pension Fund Accounts
Purchased/written options Investment underlying option contract
Expires Put/call Notional holding
Market value
31 March 2011
Notional holding
Market value
31 March 2012
£’000 £’000 £’000 £’000Assets Overseas fixed interest purchased
One to three
months
Call - - 1 148
Overseas cash purchased
More than three
months
Put - - - 1
Overseas cash purchased
One to three
months
Call 5,993 137 - -
Total assets 137 149
Liabilities Overseas fixed interest written
One to three
months
Put - -33 - -
Overseas fixed interest written
One to three
months
Call -1 -227 -1 -390
Overseas cash written
One to three
months
Call -6,007 -205 - -
Total liabilities -465 -390
Net purchased/written options -328 -241 Investments analysed by fund manager Market value 31
March 2011Market value 31
March 2012
£’000 % £’000 % Aberdeen 775,993 21.8 873,622 23.1Schroders 417,664 11.7 546,609 14.5GLG Partners 225,967 6.4 - -AllianceBernstein 299,610 8.4 - -Newton 426,448 12.0 465,590 12.3Legal & General 363,323 10.2 566,088 15.0State Street 363,695 10.2 567,413 15.0Western 167,300 4.7 183,247 4.9CBRE Global Investors 203,501 5.7 221,020 5.8Other 314,919 8.9 353,652 9.4Total 3,558,420 100.0 3,777,241 100.0 All the above companies are registered in the United Kingdom.
158
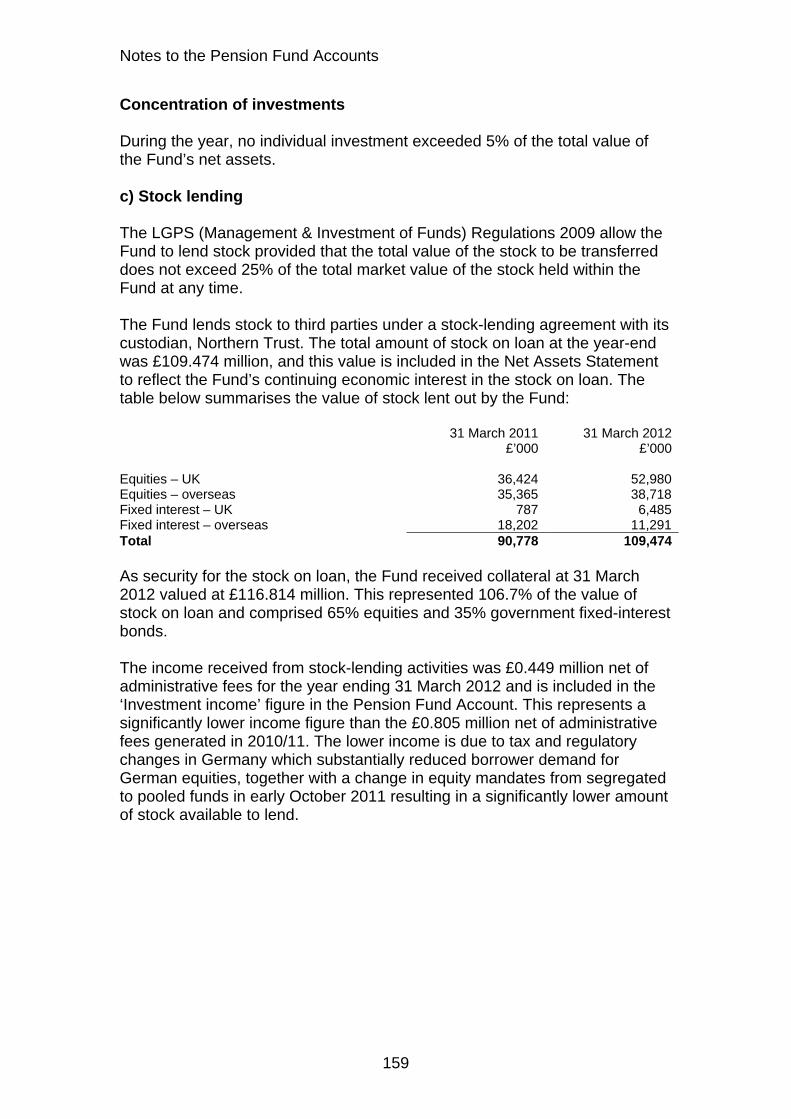
Notes to the Pension Fund Accounts
Concentration of investments During the year, no individual investment exceeded 5% of the total value of the Fund’s net assets. c) Stock lending The LGPS (Management & Investment of Funds) Regulations 2009 allow the Fund to lend stock provided that the total value of the stock to be transferred does not exceed 25% of the total market value of the stock held within the Fund at any time. The Fund lends stock to third parties under a stock-lending agreement with its custodian, Northern Trust. The total amount of stock on loan at the year-end was £109.474 million, and this value is included in the Net Assets Statement to reflect the Fund’s continuing economic interest in the stock on loan. The table below summarises the value of stock lent out by the Fund: 31 March 2011 31 March 2012 £’000 £’000 Equities – UK 36,424 52,980Equities – overseas 35,365 38,718Fixed interest – UK 787 6,485Fixed interest – overseas 18,202 11,291Total 90,778 109,474 As security for the stock on loan, the Fund received collateral at 31 March 2012 valued at £116.814 million. This represented 106.7% of the value of stock on loan and comprised 65% equities and 35% government fixed-interest bonds. The income received from stock-lending activities was £0.449 million net of administrative fees for the year ending 31 March 2012 and is included in the ‘Investment income’ figure in the Pension Fund Account. This represents a significantly lower income figure than the £0.805 million net of administrative fees generated in 2010/11. The lower income is due to tax and regulatory changes in Germany which substantially reduced borrower demand for German equities, together with a change in equity mandates from segregated to pooled funds in early October 2011 resulting in a significantly lower amount of stock available to lend.
159

Notes to the Pension Fund Accounts
16 Financial instruments a) Classification of financial instruments Accounting policies describe how different asset classes of financial instruments are measured, and how income and expenses, including fair value gains and losses, are recognised. The following table analyses the carrying amounts of financial assets and liabilities (excluding cash) by category and net assets statement heading. No financial assets were reclassified during the accounting period.
31 March 2011 31 March 2012 Designated
as fair value through
profit and loss
Loans and receivables
Financial liabilities at amortised
cost
Designated as fair value
through profit and
loss
Loans and receivables
Financial liabilities at amortised
cost
£’000 £’000 £’000 £’000 £’000 £’000 Financial assets
170,157 - - Fixed interest securities
175,963 - -
2,011,143 - - Equities 1,736,856 - -764,452 - - Pooled investments 1,180,216 - - 74,228 - - Pooled property
investments 69,152 - -
185,603 - - Private equity/infrastructure
206,874 - -
189,090 - - Property 208,790 - - 2,983 - - Derivative contracts 4,832 - -
- 144,858 - Cash - 139,583 -- 31,996 - Debtors - 65,051 -
3,397,656 176,854 - 3,582,683 204,634 -
Financial Liabilities -6,768 - - Derivative contracts -2,228 - -
- - -9,322 Creditors - - -7,848-6,768 176,854 -9,322 -2,228 - -7,848
3,390,888 176,854 -9,322 3,580,455 204,634 -7,848
b) Net gains and losses on financial instruments
31 March 2011 31 March 2012£’000 £’000
Financial assets 196,694 Fair value through profit and loss 94,743
Financial liabilities - Fair value through profit and loss -336
196,694 Total 94,407
160

Notes to the Pension Fund Accounts
c) Fair value of financial instruments and liabilities The following table summarises the carrying values of the financial assets and financial liabilities by class of instrument compared with their fair values.
31 March 2011 31 March 2012 Carrying
value Fair value Carrying
value Fair value
£’000 £’000 £’000 £’000 Financial assets 3,397,656 3,397,656 Fair value through profit and loss 3,582,683 3,582,683
176,854 176,854 Loans and receivables 204,634 204,6343,574,510 3,574,510 Total financial assets 3,787,317 3,787,317
Financial liabilities
-6,768 -6,768 Fair value through profit and loss -2,228 -2,228-9,322 -9,322 Financial liabilities at amortised cost -7,848 -7,848
-16,090 -16,090 Total financial liabilities -10,076 -10,076 The Fund has not entered into any financial guarantees that are required to be accounted for as financial instruments. d) Valuation of financial instruments carried at fair value The valuation of financial instruments had been classified into three levels, according to the quality and reliability of information used to determine fair values. Level 1 Financial instruments at Level 1 are those where the fair values are derived from unadjusted quoted prices in active markets for identical assets or liabilities. Products classified as Level 1 comprise quoted equities, quoted fixed securities, quoted index linked securities and unit trusts. Listed investments are shown at bid prices. The bid value of the investment is based on the bid market quotation of the relevant stock exchange. Level 2 Financial instruments at Level 2 are those where quoted market prices are not available; for example, where an instrument is traded in a market that is not considered to be active, or where valuation techniques are used to determine fair value and where these techniques use inputs that are based significantly on observable market data. Level 3 Financial instruments at Level 3 are those where at least one input that could have a significant effect on the instrument’s valuation is not based on observable market data.
161

Notes to the Pension Fund Accounts
Such instruments would include unquoted equity investments and hedge funds, which are valued using various valuation techniques that require significant judgement in determining appropriate assumptions. The following table provides an analysis of the financial assets and liabilities of the pension fund grouped into Levels 1 to 3, based on the level at which the fair value is observable.
Quoted market price
Using observable
inputs
With significant unobservable
inputs
Values at 31 March 2012 Level 1 Level 2 Level 3 Total £’000 £’000 £’000 £’000Financial assets Financial assets at fair value through profit and loss
3,093,035 282,774 206,874 3,582,683
Loans and receivables 204,634 - - 204,634Total financial assets 3,297,669 282,774 206,874 3,787,317
Financial liabilities
Financial liabilities at fair value through profit and loss
- -2,228 - -2,228
Financial liabilities at amortised cost
-7,848 - - -7,848
Total financial liabilities -7,848 -2,228 - -10,076
Net financial assets 3,289,821 280,546 206,874 3,777,241
Quoted market price
Using observable
inputs
With significant unobservable
inputs
Values at 31 March 2011 Level 1 Level 2 Level 3 Total £’000 £’000 £’000 £’000Financial assets Financial assets at fair value through profit and loss
2,945,752 266,301 185,603 3,397,656
Loans and receivables 176,854 - - 176,854
Total financial assets 3,122,606 266,301 185,603 3,574,510
Financial liabilities
Financial liabilities at fair value through profit and loss
- -6,768 - -6,768
Financial liabilities at amortised cost
-9,322 - - -9,322
Total financial liabilities -9,322 -6,768 - -16,090
Net financial assets 3,113,284 259,533 185,603 3,558,420
162
Notes to the Pension Fund Accounts
17 Nature and extent of risks arising from financial instruments Risk and risk management The Fund’s primary long-term risk is that the Fund’s assets will fall short of its liabilities (i.e., promised benefits payable to members). Therefore the aim of investment risk management is to minimise the risk of an overall reduction in the value of the Fund and to maximise the opportunity for gains across the whole Fund portfolio. The Fund achieves this through asset diversification to reduce exposure to market risk (price risk, currency risk, and interest rate risk) and credit risk to an acceptable level. In addition, the Fund manages its liquidity risk to ensure there is sufficient liquidity to meet the Fund’s forecast cash flows. The Pension Fund manages these investment risks as part of its overall pension fund risk management programme. Responsibility for the Fund’s risk management strategy rests with the Pension Fund Panel. Risk management policies are established to identify and analyse the risks faced by the Pension Fund’s operations. Policies are reviewed regularly to reflect changes in activity and in market conditions. a) Market risk Market risk is the risk of loss from fluctuations in equity and commodity prices, interest and foreign exchange rates and credit spreads. The Fund is exposed to market risk from its investment activities, particularly through its equity holdings. The level of risk exposure depends on market conditions, expectations of future price and yield movements and the asset mix. The objective of the Fund’s risk management strategy is to identify, manage and control market risk exposure within acceptable parameters, whilst optimising the return on risk. In general, excessive volatility in market risk is managed through the diversification of the portfolio in terms of geographical and industry sectors and individual securities. To mitigate market risk, the Pension Fund and its investment advisers undertake appropriate monitoring of market conditions and benchmark analysis. The Fund manages these risks in two ways: the exposure of the Fund to market risk is monitored through a factor risk
analysis, to ensure that risk remains within tolerable levels specific risk exposure is limited by applying risk-weighted maximum
exposures to individual investments. Equity futures contracts and exchange traded option contracts on individual securities may also be used to manage market risk on equity investments. It is possible for over-the-counter equity derivative contracts to be used in exceptional circumstances to manage specific aspects of market risk.
163

Notes to the Pension Fund Accounts
Other price risk Other price risk represents the risk that the value of a financial instrument will fluctuate as a result of changes in market prices (other than those arising from interest rate risk or foreign exchange risk), whether those changes are caused by factors specific to the individual instrument or its issuer or factors affecting all such instruments in the market. The Fund is exposed to share and derivative price risk. This arises from investments held by the Fund for which the future price is uncertain. All securities investments present a risk of loss of capital. Except for shares sold short, the maximum risk resulting from financial instruments is determined by the fair value of the financial instruments. Possible losses from shares sold short is unlimited. The Fund’s investment managers mitigate this price risk through diversification and the selection of securities and other financial instruments is monitored by the Pension Fund to ensure it is within limits specified in the Fund investment strategy. Other price risk – sensitivity analysis Following analysis of historical data and expected investment return movement during the financial year, in consultation with WM Company plc, the Pension Fund has determined that the following movements in market price risk are reasonably possible for the 2012/13 reporting period: Asset type Potential market movements (+/-) UK bonds 7.7%Overseas bonds 7.8%UK equities 15.4%Overseas equities 14.4%Property 5.8%Alternative investments 14.4%Cash 0.0% The potential price changes disclosed above are broadly consistent with a one standard deviation movement in the value of the assets. This analysis assumes that all other variables, in particular foreign currency exchange rates and interest rates, remain the same.
164

Notes to the Pension Fund Accounts
Had the market price of the Fund investments increased/decreased in line with the above, the change in the net assets available to pay benefits in the market price would have been as follows (the prior year comparator is shown below):
Asset type Value at 31 March 2012
Percentage change
Value on increase
Value on decrease
£’000 % £’000 £’000UK bonds 894,995 7.7 963,910 826,080Overseas bonds 167,787 7.8 180,874 154,700UK equities 1,169,521 15.4 1,349,626 989,416Overseas equities 860,732 14.4 984,677 736,787Property 277,942 5.8 294,063 261,821Alternative investments 209,478 14.4 239,644 179,312Cash 60,421 0.0 60,421 60,421Total assets 3,640,876 4,073,215 3,208,537
Asset type Value at
31 March 2011Percentage
changeValue on increase
Value on decrease
£’000 % £’000 £’000UK bonds 747,087 7.7 804,613 689,561Overseas bonds 150,088 7.8 161,795 138,381UK equities 1,004,712 15.4 1,159,437 849,986Overseas equities 1,043,865 14.4 1,194,182 893,549Property 263,318 5.8 278,590 248,046Alternative investments 181,818 14.4 208,000 155,636Cash 50,465 0.0 50,465 50,465Total assets 3,441,353 3,857,082 3,025,624
Interest rate risk The Fund invests in financial assets for the primary purpose of obtaining a return on investments. These investments are subject to interest rate risks, which represent the risk that the fair value or future cash flows of a financial instrument will fluctuate because of changes in market interest rates. The Fund’s interest rate risk is routinely monitored by the Pension Fund in accordance with the Fund’s risk management strategy, including monitoring the exposure to interest rates and assessment of actual interest rates against the relevant benchmarks. The Fund’s direct exposure to interest rate movements as at the financial year end is set out below. These disclosures present interest rate risk based on the underlying financial assets at fair value: 31 March 2011 31 March 2012 £’000 £’000 Cash and cash equivalents 94,393 79,162Cash deposits 50,465 60,421Fixed interest securities 897,175 1,062,782Total 1,042,033 1,202,365
165

Notes to the Pension Fund Accounts
Interest rate risk sensitivity analysis The Pension Fund recognises that interest rates can vary and can affect both income to the Fund and the value of the net assets available to pay benefits. A 1% movement in interest rates is consistent with the level of sensitivity applied as part of the Fund’s risk management strategy. The analysis that follows assumes that all other variables, in particular exchange rates, remain constant, and shows the effect in the year on the net assets available to pay benefits of a 1% change in interest rates: Asset type Carrying amount as at 31
March 2012Change in year in the net assets
available to pay benefits +1% -1% £’000 £’000 £’000 Cash and cash equivalents 79,162 792 -792Cash deposits 60,421 604 -604Fixed interest securities 1,062,782 10,628 -10,628Total change in assets available
1,202,365 12,024 -12,024
Asset type Carrying amount as at 31
March 2011Change in year in the net assets
available to pay benefits +1% -1% £’000 £’000 £’000 Cash and cash equivalents 94,393 944 -944Cash deposits 50,465 505 -505Fixed interest securities 897,175 8,971 -8,971Total change in assets available
1,042,033 10,420 -10,420
Currency risk Currency risk represents the risk that the fair value of future cash flows of a financial instrument will fluctuate because of changes in foreign exchange rates. The Fund is exposed to currency risk on financial instruments that are denominated in any currency other than the functional currency of the Fund (GB pounds). The Fund holds both monetary and non-monetary assets denominated in currencies other than GB pounds. The Fund’s currency rate risk is routinely monitored by the Pension Fund in accordance with the Fund’s risk management strategy, including monitoring the range of exposure to currency fluctuations.
166

Notes to the Pension Fund Accounts
The following table summarises the Fund’s currency exposure as at 31 March 2012 and as at the previous period end: Asset value at 31
March 2011Asset value at 31
March 2012 £’000 £’000 Overseas quoted securities 1,043,865 860,732Overseas unit trusts - 5,952Alternative investments 185,603 206,874Overseas pooled property investments 74,228 69,152Overseas public sector bonds (quoted) 98,749 115,050Overseas corporate bonds (quoted) 51,339 46,785Total overseas assets 1,453,784 1,304,545 In consultation with WM Company plc, the Pension Fund considers the likely volatility associated with foreign exchange rate movements to be 7%. This analysis assumes that all other variables, in particular interest rates, remain constant. A 7% strengthening/weakening of the pound against the various currencies in which the Fund holds investments would increase/decrease the net assets available to pay benefits as follows: Asset value as at 31
March 2012Change to net assets available to
pay benefits +7% -7% £’000 £’000 £’000 Total change in assets available
1,304,545 91,318 -91,318
Asset value as at 31
March 2011Change to net assets available to
pay benefits +7% -7% £’000 £’000 £’000 Total change in assets available
1,453,784 101,765 -101,765
b) Credit risk Credit risk represents the risk that the counterparty to a transaction or a financial instrument will fail to discharge an obligation and cause the Fund to incur a financial loss. The market values of investments generally reflect an assessment of credit in their pricing and consequently the risk of loss is implicitly provided for in the carrying value of the Fund’s financial assets and liabilities.
167
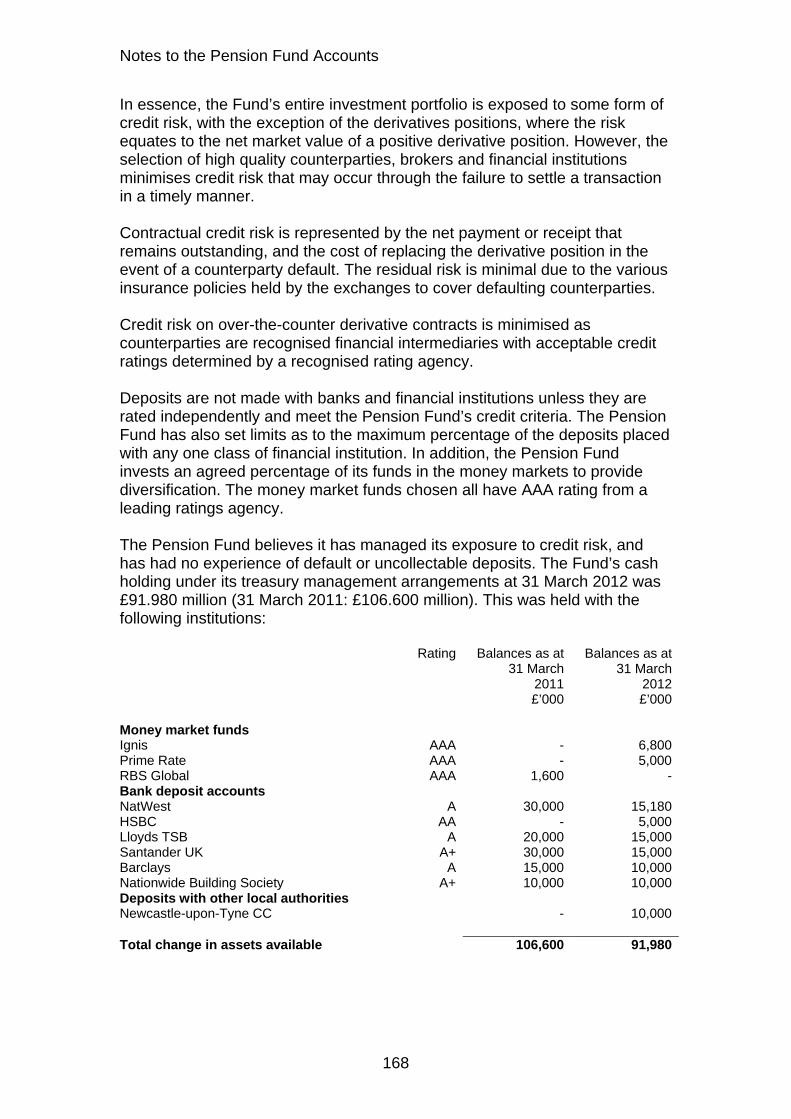
Notes to the Pension Fund Accounts
In essence, the Fund’s entire investment portfolio is exposed to some form of credit risk, with the exception of the derivatives positions, where the risk equates to the net market value of a positive derivative position. However, the selection of high quality counterparties, brokers and financial institutions minimises credit risk that may occur through the failure to settle a transaction in a timely manner. Contractual credit risk is represented by the net payment or receipt that remains outstanding, and the cost of replacing the derivative position in the event of a counterparty default. The residual risk is minimal due to the various insurance policies held by the exchanges to cover defaulting counterparties. Credit risk on over-the-counter derivative contracts is minimised as counterparties are recognised financial intermediaries with acceptable credit ratings determined by a recognised rating agency. Deposits are not made with banks and financial institutions unless they are rated independently and meet the Pension Fund’s credit criteria. The Pension Fund has also set limits as to the maximum percentage of the deposits placed with any one class of financial institution. In addition, the Pension Fund invests an agreed percentage of its funds in the money markets to provide diversification. The money market funds chosen all have AAA rating from a leading ratings agency. The Pension Fund believes it has managed its exposure to credit risk, and has had no experience of default or uncollectable deposits. The Fund’s cash holding under its treasury management arrangements at 31 March 2012 was £91.980 million (31 March 2011: £106.600 million). This was held with the following institutions: Rating
Balances as at 31 March
2011
Balances as at 31 March
2012 £’000 £’000 Money market funds Ignis AAA - 6,800Prime Rate AAA - 5,000RBS Global AAA 1,600 -Bank deposit accounts NatWest A 30,000 15,180HSBC AA - 5,000Lloyds TSB A 20,000 15,000Santander UK A+ 30,000 15,000Barclays A 15,000 10,000Nationwide Building Society A+ 10,000 10,000Deposits with other local authorities Newcastle-upon-Tyne CC - 10,000 Total change in assets available 106,600 91,980
168

Notes to the Pension Fund Accounts
c) Liquidity risk Liquidity risk represents the risk that the Fund will not be able to meet its financial obligations as they fall due. The Pension Fund therefore takes steps to ensure that it has adequate cash resources to meet its commitments. Periodic cash flow forecasts are prepared to understand and manage the timing of the Fund’s cash flows. All financial liabilities at 31 March 2012 are due within one year. Refinancing risk The key risk is that the Pension Fund will be bound to replace on maturity a significant proportion of its financial instruments at a time of unfavourable interest rates. However, the Pension Fund does not have any financial instruments that have a refinancing risk as part of its treasury management and investment strategies. 18 Funding arrangements In line with the LGPS (Administration) Regulations 2008, the Fund’s actuary undertakes a funding valuation every three years for the purpose of setting employer contribution rates for the forthcoming triennial period. The last such valuation took place as at 31 March 2010. The next valuation will take place as at March 2013. The key elements of the funding policy are: to ensure the long-term solvency of the Fund, i.e., that sufficient funds are
available to meet all pension liabilities as they fall due for payment to ensure that employer contribution rates are as stable as possible to minimise the long-term cost of the Scheme by recognising the link
between assets and liabilities and adopting an investment strategy that balances risk and return
to reflect the different characteristics of employing bodies in determining contribution rates where the administering authority considers it reasonable to do so
to use reasonable measures to reduce the risk to other employers and ultimately to the council tax payer from an employer defaulting on its pension obligations.
The aim is to achieve 100% solvency over a period of 25 years from 1 April 2011 and to provide stability in employer contribution rates by spreading any increases in rates over a period of time. Solvency is achieved when the funds held, plus future expected investment returns and future contributions, are sufficient to meet expected future pension benefits payable.
169

Notes to the Pension Fund Accounts
At the 2010 actuarial valuation, the Fund was assessed as 72% funded (77% at the March 2007 valuation). This corresponded to a deficit of £1,256 million (2007 valuation: £891 million) at that time. The actuarial valuation has determined that the contribution rate for the scheduled bodies group of employers will remain unchanged at 19.1% over the three-year period ending 31 March 2014, and the employer contribution rate for the admission bodies group will increase in steps of 0.5% p.a. to 19.6% in 2011/12, 20.1% in 2012/13 and 20.6% in 2013/14. The valuation of the Fund has been undertaken using the projected unit method under which the salary increase for each member is assumed to increase until they leave active service by death, retirement or withdrawal from service. The main actuarial assumptions used for the March 2010 actuarial valuation were as follows: Discount rate for periods In service Scheduled bodies 6.80% a year Admission bodies 6.25% a year After leaving service Scheduled bodies 6.80% a year Admission bodies 4.75% a year Long dated fixed interest gilts 4.50% a year Long dated index linked gilts 0.70% a year Rate of price inflation (RPI) 3.80% a year Rate of price inflation (CPI) 3.30% a year Rate of general pay increases 5.30% a year Rate of increase to pensions in payment 3.30% a year Valuation of assets market value A 65 year old male pensioner in normal health is now assumed on average to live to 88.7 (rather than 86.2 at the previous valuation). And a 65 year old female pensioner in normal health is assumed on average to live to 89.7 (rather than 88.3). Commutation assumption: It is assumed that future retirees will take 25% of the maximum additional tax-free lump sum up to HMRC limits for pre-April 2008 service and 75% of the maximum for post-April 2008 service.
170
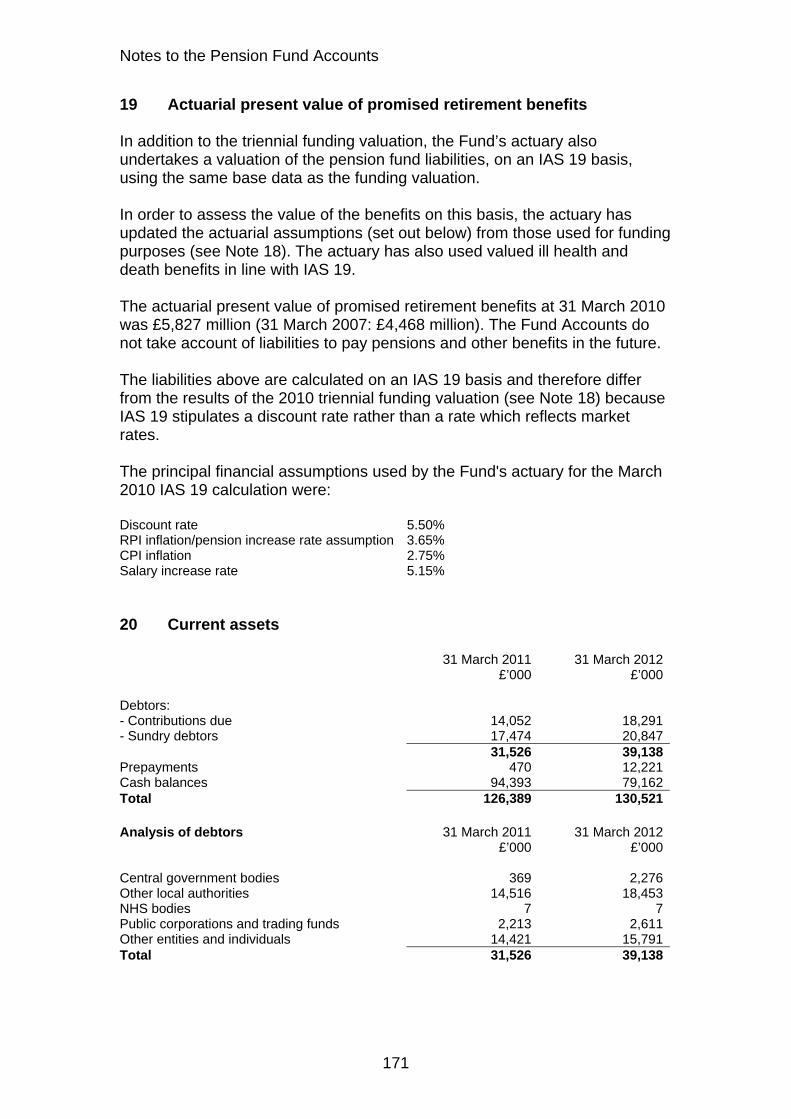
Notes to the Pension Fund Accounts
19 Actuarial present value of promised retirement benefits In addition to the triennial funding valuation, the Fund’s actuary also undertakes a valuation of the pension fund liabilities, on an IAS 19 basis, using the same base data as the funding valuation. In order to assess the value of the benefits on this basis, the actuary has updated the actuarial assumptions (set out below) from those used for funding purposes (see Note 18). The actuary has also used valued ill health and death benefits in line with IAS 19. The actuarial present value of promised retirement benefits at 31 March 2010 was £5,827 million (31 March 2007: £4,468 million). The Fund Accounts do not take account of liabilities to pay pensions and other benefits in the future. The liabilities above are calculated on an IAS 19 basis and therefore differ from the results of the 2010 triennial funding valuation (see Note 18) because IAS 19 stipulates a discount rate rather than a rate which reflects market rates. The principal financial assumptions used by the Fund's actuary for the March 2010 IAS 19 calculation were: Discount rate 5.50% RPI inflation/pension increase rate assumption 3.65% CPI inflation 2.75% Salary increase rate 5.15% 20 Current assets 31 March 2011 31 March 2012 £’000 £’000 Debtors: - Contributions due 14,052 18,291- Sundry debtors 17,474 20,847 31,526 39,138Prepayments 470 12,221Cash balances 94,393 79,162Total 126,389 130,521 Analysis of debtors 31 March 2011 31 March 2012 £’000 £’000 Central government bodies 369 2,276Other local authorities 14,516 18,453NHS bodies 7 7Public corporations and trading funds 2,213 2,611Other entities and individuals 14,421 15,791Total 31,526 39,138
171
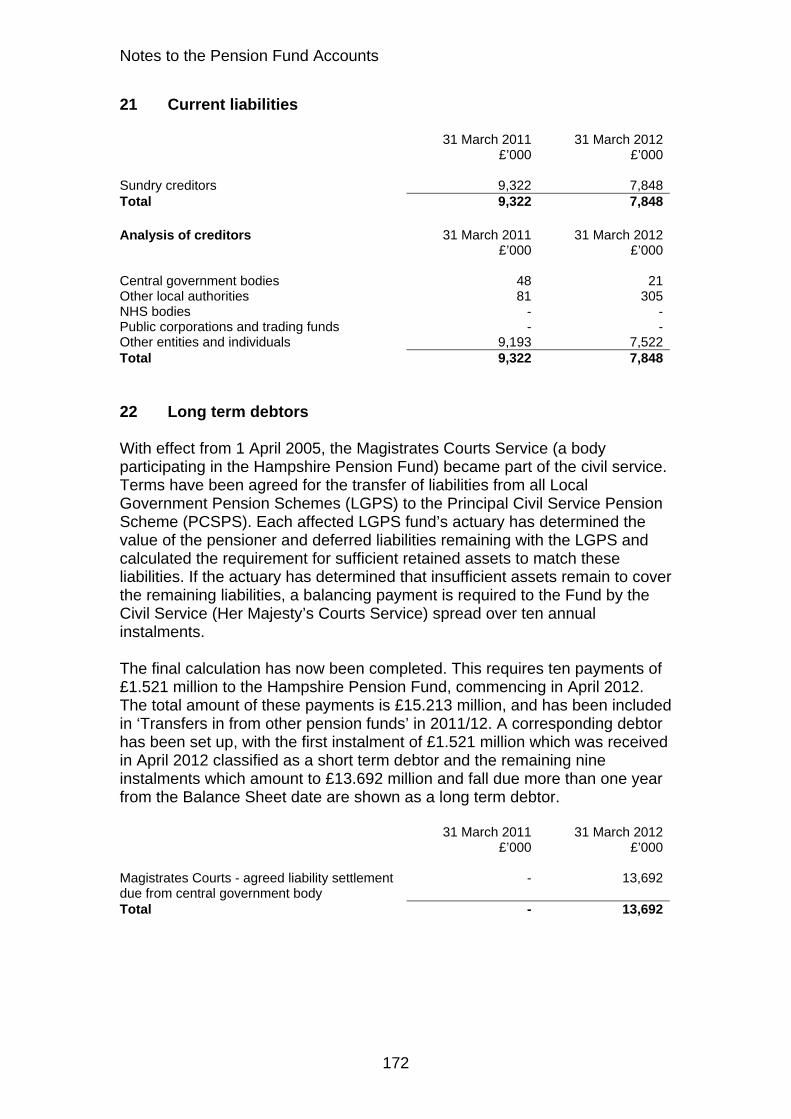
Notes to the Pension Fund Accounts
21 Current liabilities 31 March 2011 31 March 2012 £’000 £’000 Sundry creditors 9,322 7,848Total 9,322 7,848 Analysis of creditors 31 March 2011 31 March 2012 £’000 £’000 Central government bodies 48 21Other local authorities 81 305NHS bodies - -Public corporations and trading funds - -Other entities and individuals 9,193 7,522Total 9,322 7,848 22 Long term debtors With effect from 1 April 2005, the Magistrates Courts Service (a body participating in the Hampshire Pension Fund) became part of the civil service. Terms have been agreed for the transfer of liabilities from all Local Government Pension Schemes (LGPS) to the Principal Civil Service Pension Scheme (PCSPS). Each affected LGPS fund’s actuary has determined the value of the pensioner and deferred liabilities remaining with the LGPS and calculated the requirement for sufficient retained assets to match these liabilities. If the actuary has determined that insufficient assets remain to cover the remaining liabilities, a balancing payment is required to the Fund by the Civil Service (Her Majesty’s Courts Service) spread over ten annual instalments. The final calculation has now been completed. This requires ten payments of £1.521 million to the Hampshire Pension Fund, commencing in April 2012. The total amount of these payments is £15.213 million, and has been included in ‘Transfers in from other pension funds’ in 2011/12. A corresponding debtor has been set up, with the first instalment of £1.521 million which was received in April 2012 classified as a short term debtor and the remaining nine instalments which amount to £13.692 million and fall due more than one year from the Balance Sheet date are shown as a long term debtor. 31 March 2011 31 March 2012 £’000 £’000 Magistrates Courts - agreed liability settlement due from central government body
- 13,692
Total - 13,692
172
Notes to the Pension Fund Accounts
23 Additional voluntary contributions Market value Market value 31 March 2011 31 March 2012 £’000 £’000 Prudential - 299Zurich 8,409 7,893Equitable Life 1,543 1,462Total 9,952 9,654 During the year, AVC contributions of £0.297 million were paid directly to Prudential (2010/11: nil), £1.494 million to Zurich (2010/11: £1.662 million), and £0.024 million to Equitable Life (2010/11: £0.027 million). 24 Related party transactions The Hampshire Pension Fund is administered by Hampshire County Council. Consequently, there is a strong relationship between the County Council and the Pension Fund. The County Council incurred costs of £2.504 million (2010/11: £2.415 million) in relation to the administration of the Fund and was subsequently reimbursed by the Fund for these expenses. The County Council is also the single largest employer of members of the Pension Fund and contributed £88.539 million to the Fund in 2011/12 (2010/11: £92.111 million). Whilst the Pension Fund previously invested part of its cash holdings jointly with the County Council, the introduction of a separate bank account for the Fund since October 2010 has enabled its cash holdings to be separately invested. As a result, there was no temporary lending to the County Council during 2011/12 earning nil interest (2010/11: £0.201 million based on the actual rate of interest earned on an average investment balance of £50.5 million between the period of 1 April 2010 and 20 October 2010 only). 25 Contingent liabilities and contractual commitments Outstanding capital commitments (investments) at 31 March 2012 totalled £88.317 million (31 March 2011: £90.734 million). These commitments relate to outstanding call payments due on unquoted limited partnership funds held in the private equity and infrastructure parts of the portfolio. The amounts ‘called’ by these funds are irregular in both size and timing over a period of between four and six years from the date of each original commitment. The Fund had no contingent liabilities on 31 March 2012.
173

Notes to the Pension Fund Accounts
174
26 Contingent assets The Fund had no contingent assets on 31 March 2012. 27 Impairment losses During 2011/12, the Fund has recognised an impairment loss for bad and doubtful debt of £0.008 million (2010/11: £0.007 million) for possible non-recovery of pensioner death overpayments, and there were no potential non-payment of cessation values where the employer is not backed up by a guarantee on 31 March 2012.

Glossary
Glossary Academies Publicly funded independent schools, free from local authority and national government control. Freedoms held by academies include the ability to set their own pay and conditions for staff, freedoms around the delivery of the curriculum, and the ability to change the lengths of terms and school days. The income, expenditure and assets of academies within Hampshire do not form part of the Council’s accounts. Accruals basis Accounting for income and expenditure during the financial year in which they are earned or incurred, not when money is received or paid. Actuary A person or firm who analyses the assets and future liabilities of a pension fund and calculates the level of employers’ contributions needed to keep it solvent. Admitted bodies These are employers who have been allowed into the Hampshire Pension Fund at the County Council’s discretion. Alternative investments These are less traditional investments where risks can be greater but potential returns higher over the long term, for example investments in private equity partnerships, hedge funds, commodities, foreign currency and futures. Amortisation The process of writing down the cost of an asset or liability through depreciation or repayment of principle over a suitable period of time. Assets held for sale Assets that the Council intends to sell within the next year and are actively marketed as such. Audit Commission The independent public body responsible for ensuring that public money is spent economically, efficiently, and effectively in the areas of local government, housing, health, criminal justice, and fire and rescue services. Additional voluntary contributions (AVCs) Additional voluntary contributions are paid by a contributor who decides to supplement his or her pension by paying extra contributions to the Scheme’s AVC providers (Zurich and Equitable Life). Best Value Accounting Code of Practice (BVACOP) The code of practice containing a standard definition of services and total cost so that spending comparisons can be consistent between local authorities. Budget requirement Planned spending to be met from council tax, general Government grant and national business rates. Capital adjustment account An account that reflects the difference between the cost of fixed assets consumed and the capital financing set aside to pay for them. Capital expenditure Expenditure on the acquisition or creation of a fixed asset or expenditure that adds to and does not merely maintain the value of an existing fixed asset.
175

Glossary
Capital receipt Proceeds from the sale of capital assets (e.g. land, buildings and equipment). Chartered Institute of Public Finance and Accountancy (CIPFA) The professional accountancy body for public services which recommends accounting practice for the preparation of local authority accounts. Community asset An asset that the Council intends to hold forever, that has no determinable useful life, and that may have restrictions on its disposal. An example of a community asset is parkland. Comprehensive Income and Expenditure Statement (CIES) Statement that shows the accounting cost in the year of providing services in accordance with generally accepted accounting practices. Contingent asset A potential asset that is uncertain because it depends on the outcome of a future event. Contingent liability A potential liability that is uncertain because it depends on the outcome of a future event. Continuing services Services that the Council will continue to provide in the following financial year. Corporate and democratic core Activities that local authorities carry out specifically because they are elected, multi-purpose authorities. The cost of these activities is not split between services. Council tax A domestic property tax based on capital values with a personal element (a 25% discount for single-adult households). Each property is allocated to one of eight tax bands according to its capital value. Creditor An individual or body to which the Council owes money at the Balance Sheet date. Current asset An asset that is realisable or disposable within less than one year without disruption to services. Current liability A liability that is due to be settled within one year. Current service costs The increase in the present value of pension liabilities expected to arise from employee service in the current period. Custodian A bank that looks after Pension Fund investments, implements investment transactions as instructed by the Fund’s managers and provides reporting, performance and administrative services to the Fund. Debtor An individual or body that owes money to the Council at the Balance Sheet date. Dedicated Schools Grant (DSG) A Government grant that can only be used to fund expenditure within the schools’ budget.
176

Glossary
Deferred liability An amount owed by the Council that will be repaid over a significant period of time. For example, the Council holds a deferred liability to pay for assets constructed as part of the waste and street lighting PFI contracts, which will reduce over the life of the assets. Defined benefit pension scheme A pension scheme in which a pensioner’s benefits are specified, usually relating to their length of service and final salary. Deposit Receipt held that is repayable in prescribed circumstances. Depreciated historical cost The valuation of fixed assets at their original cost less depreciation charged to date. Depreciated replacement cost Relating to fixed assets, the current replacement costs adjusted for depreciation. This method of valuation is used when it is not practical to estimate the open market value for the existing use of a specialised property. Depreciation The measure of the wearing out, consumption, or other reduction in the useful economic life of a fixed asset, whether arising from use, the passage of time or obsolescence through technological or other changes. Developers’ contribution If a development derives special benefit from highway works, developers can be required to contribute towards the costs. They arise mainly as a result of agreements under section 278 of the Highways Act 1980. Discretionary increase in pension payments This increase arises when an employer agrees to the early retirement of an employee other than for reasons of ill health and agrees to pay pension benefits based on more years than he or she actually worked. Dividends Income to the Pension Fund on its holdings of UK and overseas shares. Doubtful debt A debt that the Council is unlikely to recover because something has happened since the debt was raised. An assessment of the reduction in recoverable debt is made both individually (for individually significant debts) and collectively. This reduction is charged to the Income and Expenditure Account. Earmarked reserve See Reserve. Emoluments Sums paid to employees, including any expenses or non-monetary benefits, which are taxable, but excluding pension contributions made by the employee. Equities Shares in UK and overseas companies. Exceptional item An item identified separately in the accounts because of its exceptional nature to make sure the presentation of the accounts is fair.
177
Glossary
Fair value The amount for which an asset could be exchanged, or a liability settled, between knowledgeable, willing parties in an arm’s-length transaction. Finance lease Under this type of lease, the risks and rewards of ownership of the leased goods transfer to the lessee. Financial instruments Any contract that gives rise to a financial asset of one entity and a financial liability or equity instrument of another. Fixed asset An asset that yields benefits to the local authority and the services it provides for a period of more than one year. Foundation schools A category of school that receives its funding from the County Council, but are run by their own governing body, which employs the staff and sets the admissions criteria. Land and buildings are usually owned by the governing body or a charitable foundation General Fund The accumulated credit balance on the General Fund. It is the excess of income over expenditure in the Income and Expenditure Account after adjusting for movements to and from reserves and other non-cash items. This balance is needed as a cushion against unforeseen expenditure. Gross book value (GBV) The original or revalued cost of an asset before the deduction of depreciation. Gross expenditure The total cost of providing the Council’s services before deducting income from Government grants, or fees and charges for services. Hedge fund A specialist fund that seeks to generate consistent returns in all market conditions by exploiting opportunities resulting from inefficient markets. Heritage assets Assets with historical, artistic, scientific, technological, geophysical or environmental qualities that are maintained principally for their contribution to knowledge and culture. The principal heritage assets owned by the Authority are its museum collections, archives collection and a small number of historic buildings and archaeological sites. Historical cost The amount originally paid for a fixed asset. Impairment loss A loss arising from an event that significantly reduces an asset’s value. An example is physical damage or a fall in market value. Infrastructure assets Fixed assets that cannot be taken away or transferred, and whose benefits can only be obtained by continued use of the asset created. Examples of infrastructure assets are highways and footpaths.
178

Glossary
Intangible assets Assets that do not have physical substance but are identifiable and controlled by the Council and bring benefits to the Council for more than one year. Typical examples include software licences, internally developed software and websites developed to deliver services rather than information about services. Internal trading account A service within the Council that operates on a trading basis with other parts of the Council. International Financial Reporting Standards (IFRS) International accounting standards that govern the treatment and reporting of income and expenditure in an organisation’s accounts, which came fully into effect from 1 April 2010. Inventories Goods that are acquired in advance of their use in the provision of services or their resale. At the year-end inventories are a current asset in the balance sheet and they will be charged to the CIES in the year they are consumed or sold. Investment property Property (land or buildings) that are held (by the owner or by the lessee under a finance lease) to earn rentals or for capital appreciation or both. Landfill Allowances Trading Scheme (LATS) The LATS allocates tradable landfill allowances to each of the waste disposal authorities (WDA). These allowances can be used for disposal of biodegradable waste or sold to other WDAs. Lessee The party that leases an asset that is owned by another party. Lessor The owner of an asset which is leased to another party. Local Government Pension Scheme (LGPS) The LGPS is a nationwide scheme for employees working in local government or working for other employers participating in the Scheme and for councillors. Long-term asset An asset that may be held indefinitely for the provision of services or is realisable over a longer period than one year. Long-term borrowing A loan repayable in more than one year from the Balance Sheet date. Long-term debtor An individual or body that owes money to the Council that is not due for payment within one year from the Balance Sheet date. Minimum revenue provision (MRP) The minimum amount (as specified in statute) which must be charged to the CIES each year and set aside as a provision for repaying external loans and meeting other credit liabilities. (National) Non-domestic rates (NNDR) Charges collected by district councils from non-domestic properties, at a national rate in the £ set by the Government. The proceeds are pooled nationally and redistributed to areas in proportion to their population. Net assets The amount by which assets exceed liabilities (same as net worth).
179
Glossary
Net assets statement A statement showing the net assets of the Pension Fund. Net book value (NBV) The value of an asset as recorded in the accounts. This usually equates to the net current replacement or original cost less any depreciation charged against the asset over its life to date. Net current liabilities The amount by which current liabilities exceed current assets. Net worth The amount by which assets exceed liabilities (same as net assets). Non-distributed costs Overheads for which no direct user now benefits and which are therefore not split between services. Non-ringfenced government grants Amounts received from central Government towards funding the Council’s activities that are not required to be spent on a particular service. Operating lease Under this type of lease, the risks and rewards of ownership of the leased goods remain with the lessor. Operational asset A fixed asset held and occupied, used or consumed by the Council in the direct delivery of services. Past service cost For a defined benefit pension scheme, the increase in the present value of the scheme’s liabilities related to employee service prior periods arising in the current period as a result of the introduction of, or improvement to, retirement benefits. Payment in advance A payment for a service due to be received in a future financial year. Pooled budget Partners contribute a set amount of money to form a separate budget. The purpose and scope of the budget is agreed at the outset and then used to pay for relevant services and activities. Precept The demand made by the County Council on the collection funds maintained by the district councils for council taxpayers’ contribution to its services. Private equity Mainly specialist pooled partnerships that invest in private companies not normally traded on public stock markets – these are often illiquid (i.e. not easily turned into cash) and higher-risk investments that should provide high returns over the long term. Private finance initiative (PFI) Contracts typically involving a private sector entity (the operator) constructing or enhancing property used in the provision of a public service, and operating and maintaining that property for a specified period of time. The operator is paid for its services over the period of the arrangement.
180
Glossary
Projected unit method One of the common methods used by actuaries to calculate a contribution rate to the LGPS, which is usually expressed as a percentage of the members’ pensionable pay. Provisions An estimated figure within the accounts for liabilities that are known to exist but cannot be measured accurately. Public Works Loan Board (PWLB) A central government agency that provides loans to local authorities at a slightly higher rate than the Government is able to borrow. In most cases, the interest rates offered are lower than local authorities can achieve in the open market. The amounts and purposes for which PWLB loans can be obtained are tightly controlled by the Government. Receipt in advance A receipt that is attributable to a future financial year. Related party An organisation, body or individual that has the potential to control or significantly influence the Council, or to be controlled or influenced by the Council. Reserve The Council’s reserves fall into two categories. The ‘unearmarked’ reserve is the balance on the General Fund. An ‘earmarked’ reserve is an amount set aside in the Council’s accounts for specific purposes. Revaluation reserve Records unrealised net gains from asset revaluations made after 1 April 2007. Revenue contributions to capital The use of revenue funds to finance capital expenditure. Revenue expenditure The operating costs incurred by the Council during the financial year in providing its day-today services. It is distinct from capital expenditure on projects that benefit the Council over a period of more than one financial year. Revenue expenditure funded from capital under statute (REFCUS) Expenditure that is classified as capital expenditure under statutory provisions, but does not result in the creation or enhancement of fixed assets owned by the County Council. Such expenditure incurred during the year is treated as revenue expenditure and charged to the relevant service in the CIES. Scheduled bodies These are organisations that have a right to be in the LGPS. Service concession Contracts typically involving a private sector entity (the operator) constructing or enhancing property used in the provision of a public service, and operating and maintaining that property for a specified period of time. The operator is paid for its services over the period of the arrangement. SETS Stock Exchange Trading Service – a service provided by the Stock Exchange, enabling shares to be bought and sold electronically. Short-term investments An investment that is readily realisable within one year.
181

Glossary
182
Specific grants Central Government grants to finance a particular service. Straight-line basis Dividing a sum equally between several years. Surplus assets Fixed assets held by the Council but not directly occupied, used or consumed in the delivery of services. These are assets that do not meet the criteria to be classified as either investment property or assets held for sale. Transfer value The value of an employee’s pension rights, which can be transferred from one pension scheme to another. Transferred debt Debt serviced by bodies that are independent of the Council following the transfer of services formerly provided by the Council. Trust fund A fund set up under a trust deed in which the Council is a trustee. Useful life The period over which the Council will benefit from the use of a fixed asset. Voluntary aided schools (VA schools) Mainly religious or 'faith' schools, although anyone can apply for a place. As with foundation schools, the governing body employs the staff and sets the admissions criteria Voluntary controlled schools (VC schools) Similar to voluntary aided schools, but are run by the local authority. As with community schools, the local authority employs the school's staff and sets the admissions criteria Write-off Elimination of an asset or liability over a defined period, usually by means of charging or crediting the CIES.