half yearly report & accounts - the … and the documents referred to within it. copies of the...
TRANSCRIPT

F I D E L I T Y I N S T I T U T I O N A L L I Q U I D I T Y F U N D p l c
H A L F Y E A R L Y R E P O R T & A C C O U N T S
2 8 F e b r u a r y 2 0 1 1
( A n U m b r e l l a F u n d )
M O O D Y ’ S A a a & M R 1 + R AT E D
S & P A A A m R AT E D
Fidelity Institutional Liquidity Fund plc
Contents
General Information 2
Investment Manager’s Overview 3
Schedule of Investments 5
Statement of Net Assets attributable to holders of redeemable participating shares 12
Statement of Operations 16
Notes to the Financial Statements 18
Statement of Changes in Investments 24
Directory 28
1

General InformationFidelity Institutional Liquidity Fund plc (the ‘Company’), is an open ended investment company with variable capital organised underthe laws of Ireland and is authorised by the Central Bank of Ireland as a UCITS fund pursuant to the European Communities(Undertakings for Collective Investment in Transferable Securities) Regulations 2003 (as amended) (the ‘UCITS Regulations’). It isestablished as an umbrella fund. The Company is recognised in the UK under Sections 264-265 of the Financial Services and MarketsAct 2000, as amended. The Company will not be covered by the provisions of the Financial Services Compensation Scheme operated inthe UK. Unless otherwise defined or inconsistent with the context herein, capitalised terms used in this document are as used and havethe same meanings as are ascribed to them in the Memorandum and Articles of Association and Prospectus of the Company.
This half yearly report does not constitute an offer of shares. Shares are offered on the basis of the information contained in the currentProspectus and the documents referred to within it. Copies of the current Prospectus, the annual and half yearly reports are available freeof charge, from the registered office of the Company.
This material is issued by FIL Fund Management (Ireland) Limited, a firm authorised in Ireland as a management company by theCentral Bank of Ireland pursuant to the European Communities (Undertakings for Collective Investment in Transferable Securities)Regulations, 2003 (as amended).
Standard & Poor’s Ratings Services (‘S&P’) announced on 16 February 2011 that it assigned The Sterling Fund, The Euro Fund and TheCanadian Dollar Fund its principal stability fund rating of ‘AAAm’. The United States Dollar Fund has maintained its AAAm rating sinceit was assigned on 25 September 2000. The ratings reflect S&P’s view that these funds have a strong capacity to maintain principalstability and to limit exposure to principal losses due to credit risks.*
2
* ‘S&P’ and ‘Standard & Poor’s’ are trademarks of The McGraw-Hill Companies, Inc.Copyright 2011 © Standard & Poor’s Financial Services LLC.

Investment Manager’s OverviewThe review period was dominated by the re-emergence of sovereign risk in the European peripheral economies and expectations ofanother round of quantitative easing in the US. Concerns about the sustainability of fiscal deficits of peripheral European countries tookcentre stage thereby leading to bouts of volatility. Rating downgrades of a few peripheral nations further impacted sentiment. AfterGreece, Ireland was the second country in the region to be bailed out due to its fragile banking sector and rising fiscal deficits.Meanwhile, the US Federal Reserve (‘Fed’) announced a second round of quantitative easing (QE2) in November, with the intention ofpurchasing $600 billion worth of long term US Treasury securities.
Over the period, the London Interbank Offered Rates (Libor) moved in a very narrow range in the US & the UK. Euro inter-bankfunding rates increased as sovereign debt risks in the peripheral economies intensified over the period. Despite the Irish bailout, moneymarket rates remained high as investors feared a similar fate for other deficit countries.
The European Central Bank (‘ECB’) left its key interest rate unchanged at 1% over the review period but the President, Jean-ClaudeTrichet mentioned the possibility of an interest rate hike given that inflationary risks were on the upside. The ECB will continue its LongTerm Refinancing Operation (LTRO) due to be allotted in April, May and June 2011 as fixed rate tender procedures with full allotment.
The Eurozone economy sustained its positive momentum in the last two quarters of 2010, maintaining the rate of growth at 0.3%quarter on quarter. The region was impacted by adverse weather around the end of the year hampering construction activity. At a countrylevel, Germany and France maintained their pace of economic growth while the activity in peripheral countries was rather weak. BothGreece and Ireland reported a contraction. Nevertheless, Spain and Italy recorded positive growth. Recent data releases and survey basedevidence continue to confirm the positive underlying momentum of economic activity in the euro area at the beginning of 2011.
Inflationary pressures continued to build up in the Eurozone with the annual headline inflation rate increasing to 2.4% in Februaryalthough the inflation rate without energy and food was much lower, below half of the headline figure. Despite austerity measures andsigns of rising inflationary pressures, the European Commission marginally raised their economic growth forecast for 2011, stating thatthe improved outlook for the external environment will provide a boost to European exports.
In the US, the Fed, in order to promote a stronger pace of economic recovery and to help ensure that inflation is at levels consistent with theFed’s mandate, announced an additional purchase of $600 billion of long term US Treasury securities. The federal funds rate was leftunchanged at 0-0.25% and the Fed continues to anticipate that economic conditions, including low rates of resource utilisation, subduedinflation trends, and stable inflation expectations, are likely to warrant exceptionally low levels for the federal funds rate for an extended period.
Economic recovery continued over the fourth quarter at an annual rate of 2.8%. However, it was slower than previously forecast.Furthermore, the pace of growth appears as insufficient to bring about a significant improvement in labour market conditions. InFebruary, although the unemployment rate fell to 8.9%, it is still very high on a historical basis.
Consumer spending rose less than forecast in January, constrained by increasing food and fuel prices, high unemployment, modestincome growth and lower housing wealth. Although commodity prices have risen, the Fed said that longer term inflation expectationshave remained stable, and measures of underlying inflation remained subdued.
In the UK, the Bank of England (‘BoE’) left the interest rate unchanged at 0.5% even as headline inflation remains at twice the 2% target.The high rate of inflation led to a four way split among members of the Monetary Policy Committee. Three members backed an increasein interest rates in February while another member voted to extend the bank’s stock of asset purchases by an additional £50 billion whilekeeping the bank rate unchanged. The BoE also maintained its stock of asset purchases at £200 billion.
Partly reflecting adverse weather conditions, economic growth contracted by 0.6% in the fourth quarter of 2010. The weakness wasbroadbased and both consumer spending and business investment declined. Despite a strong growth in exports, imports rose at a fasterpace. Recent surveys suggest the contraction could have been a temporary setback, with manufacturing strengthening. Meanwhile,headline inflation remained stubbornly above the BoE’s target for 14 consecutive months and has exceeded the government’s 3% limitsince March. The hike in value added tax from 17.5% to 20%, rising commodity costs and a weak Pound have all added to pricepressures. In its February Inflation report, the BoE suggested that inflation could rise to between 4% and 5% by the first half of this yearbefore falling back.
The housing market continued to remain fragile with house prices declining. According to the Halifax House Price Index, UK houseprices fell at their fastest annual pace for 16 months in February, raising further concerns about the strength of the economic recovery.Moreover, according to figures released by the British Bankers Association, the number of mortgages approved for home buyers inJanuary was 29% less than a year ago.
In Canada, the Bank of Canada (‘BoC’) raised its benchmark interest rate in September from 0.75% to 1%. The BoC stopped raisinginterest rates after September and scaled back plans to exit stimulus as policy makers dealt with the impact of a strong currency and aslowdown in growth of household and government spending that crimped the economic recovery. In its January Monetary Policy Report,the BoC stated that any further changes to monetary policy would need to be carefully considered.
The recovery in Canada is proceeding broadly as anticipated with GDP accelerating to an annual pace of 3.3% in the fourth quarter. Netexports are projected to contribute more to growth going forward, supported by stronger US activity and global demand forcommodities. Overall, the BoC projects the economy will expand by 2.4% in 2011 and 2.8% in 2012.
The inflation rate slowed in January, rising 2.3% from a year earlier. According to the BoC, underlying pressures affecting prices remainsubdued, reflecting the considerable slack in the Canadian economy. The BoC further added that core inflation is projected to edgegradually up to 2% by the end of 2012, as excess supply in the economy is slowly absorbed.
3

Fidelity Institutional Liquidity Fund plc Yield as at Yield as at(Class A shares)1 28 February 2011 31 August 2010
The United States Dollar Fund 0.19% 0.27%
The Sterling Fund 0.57% 0.48%
The Euro Fund 0.69% 0.37%
The Canadian Dollar Fund 0.91% 0.64%
1 The yield for Class B shares was 0.25% (maximum) lower than for Class A shares due to the shareholder service fee applied. During theperiod this fee and the management fee were reduced if required to ensure a yield of 0.01% on Class B Shares. The yield for Class D shareswas 0.05% (maximum) lower than for Class A shares due to the shareholder service fee applied. The shareholder services fee was capped at0.25% (Class B shares) and capped at 0.05% (Class D shares) effective June 2009.
FIL Investments International
15 March 2011
4
5*Commercial Papers are shown with calculated yields. All investments are in the functional currency of the Fund.
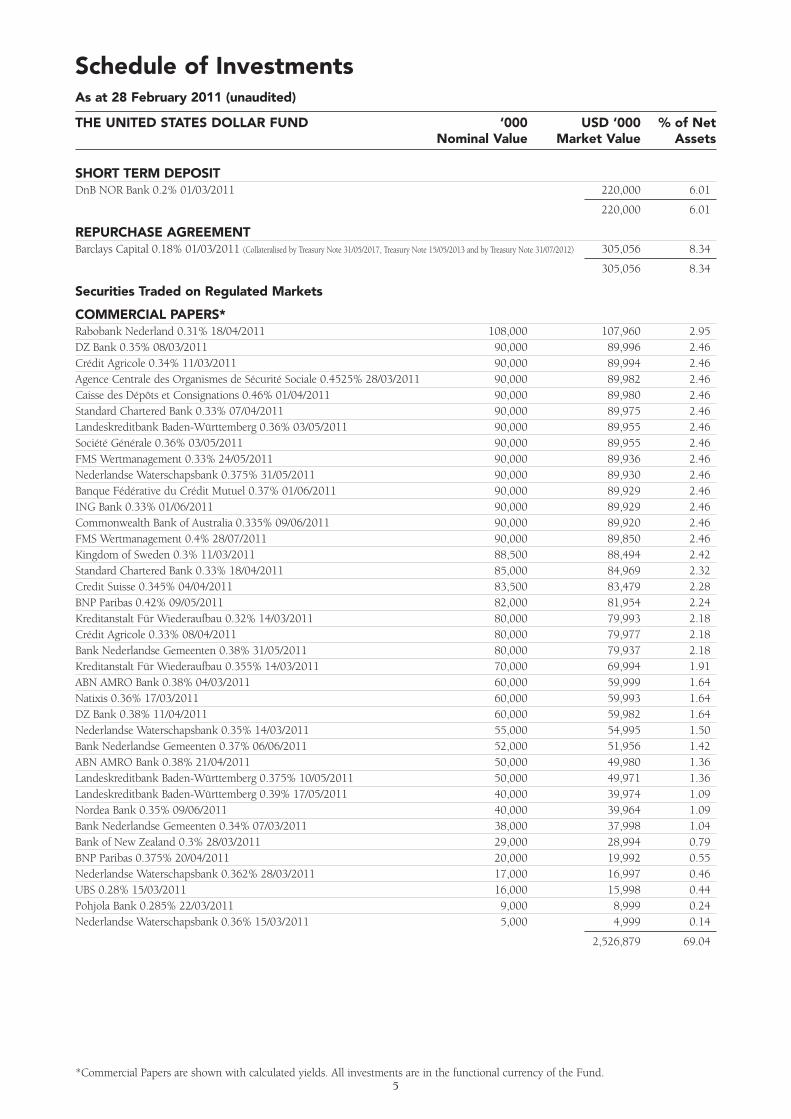
Schedule of InvestmentsAs at 28 February 2011 (unaudited)
THE UNITED STATES DOLLAR FUND ‘000 USD ‘000 % of NetNominal Value Market Value Assets
SHORT TERM DEPOSITDnB NOR Bank 0.2% 01/03/2011 220,000 6.01
220,000 6.01
REPURCHASE AGREEMENTBarclays Capital 0.18% 01/03/2011 (Collateralised by Treasury Note 31/05/2017, Treasury Note 15/05/2013 and by Treasury Note 31/07/2012) 305,056 8.34
305,056 8.34
Securities Traded on Regulated Markets
COMMERCIAL PAPERS* Rabobank Nederland 0.31% 18/04/2011 108,000 107,960 2.95DZ Bank 0.35% 08/03/2011 90,000 89,996 2.46Crédit Agricole 0.34% 11/03/2011 90,000 89,994 2.46Agence Centrale des Organismes de Sécurité Sociale 0.4525% 28/03/2011 90,000 89,982 2.46Caisse des Dépôts et Consignations 0.46% 01/04/2011 90,000 89,980 2.46Standard Chartered Bank 0.33% 07/04/2011 90,000 89,975 2.46Landeskreditbank Baden-Württemberg 0.36% 03/05/2011 90,000 89,955 2.46Société Générale 0.36% 03/05/2011 90,000 89,955 2.46FMS Wertmanagement 0.33% 24/05/2011 90,000 89,936 2.46Nederlandse Waterschapsbank 0.375% 31/05/2011 90,000 89,930 2.46Banque Fédérative du Crédit Mutuel 0.37% 01/06/2011 90,000 89,929 2.46ING Bank 0.33% 01/06/2011 90,000 89,929 2.46Commonwealth Bank of Australia 0.335% 09/06/2011 90,000 89,920 2.46FMS Wertmanagement 0.4% 28/07/2011 90,000 89,850 2.46Kingdom of Sweden 0.3% 11/03/2011 88,500 88,494 2.42Standard Chartered Bank 0.33% 18/04/2011 85,000 84,969 2.32Credit Suisse 0.345% 04/04/2011 83,500 83,479 2.28BNP Paribas 0.42% 09/05/2011 82,000 81,954 2.24Kreditanstalt Für Wiederaufbau 0.32% 14/03/2011 80,000 79,993 2.18Crédit Agricole 0.33% 08/04/2011 80,000 79,977 2.18Bank Nederlandse Gemeenten 0.38% 31/05/2011 80,000 79,937 2.18Kreditanstalt Für Wiederaufbau 0.355% 14/03/2011 70,000 69,994 1.91ABN AMRO Bank 0.38% 04/03/2011 60,000 59,999 1.64Natixis 0.36% 17/03/2011 60,000 59,993 1.64DZ Bank 0.38% 11/04/2011 60,000 59,982 1.64Nederlandse Waterschapsbank 0.35% 14/03/2011 55,000 54,995 1.50Bank Nederlandse Gemeenten 0.37% 06/06/2011 52,000 51,956 1.42ABN AMRO Bank 0.38% 21/04/2011 50,000 49,980 1.36Landeskreditbank Baden-Württemberg 0.375% 10/05/2011 50,000 49,971 1.36Landeskreditbank Baden-Württemberg 0.39% 17/05/2011 40,000 39,974 1.09Nordea Bank 0.35% 09/06/2011 40,000 39,964 1.09Bank Nederlandse Gemeenten 0.34% 07/03/2011 38,000 37,998 1.04Bank of New Zealand 0.3% 28/03/2011 29,000 28,994 0.79BNP Paribas 0.375% 20/04/2011 20,000 19,992 0.55Nederlandse Waterschapsbank 0.362% 28/03/2011 17,000 16,997 0.46UBS 0.28% 15/03/2011 16,000 15,998 0.44Pohjola Bank 0.285% 22/03/2011 9,000 8,999 0.24Nederlandse Waterschapsbank 0.36% 15/03/2011 5,000 4,999 0.14
2,526,879 69.04

CERTIFICATES OF DEPOSIT Bank of Tokyo-Mitsubishi 01/03/2011 85,000 85,000 2.32Bank of Tokyo-Mitsubishi 11/03/2011 85,000 84,994 2.32Bank of Tokyo-Mitsubishi 06/04/2011 85,000 84,978 2.32ABN AMRO Bank 07/03/2011 62,500 62,497 1.71Société Générale 01/04/2011 50,000 49,989 1.37BNP Paribas 06/04/2011 50,000 49,987 1.37Mizuho Corporate Bank 16/03/2011 41,000 40,996 1.12Natixis 10/03/2011 40,000 39,997 1.09Mizuho Corporate Bank 24/03/2011 40,000 39,993 1.09Sumitomo Mitsui Banking Corp. 01/03/2011 37,000 37,000 1.01DZ Bank 01/04/2011 30,000 29,993 0.82BNP Paribas 06/04/2011 30,000 29,992 0.82Rabobank Nederland 0.34% 10/05/2011 7,000 7,001 0.19
642,417 17.55
CORPORATE BOND - Fixed RateJapan Finance Organization for Municipalities 5.875% 14/03/2011 49,560 49,644 1.36
49,644 1.36
Financial Assets at fair value through profit or loss (including short term deposits) 3,743,996 102.30
Net Current Liabilities (84,221) (2.30)
Total Net Assets based on dealing NAV (Amortised Cost) 3,659,775 100.00
6All investments are in the functional currency of the Fund.
Schedule of InvestmentsAs at 28 February 2011 (unaudited)
THE UNITED STATES DOLLAR FUND ‘000 USD ‘000 % of NetNominal Value Market Value Assets(continued)

7
Schedule of InvestmentsAs at 28 February 2011 (unaudited)
THE STERLING FUND ‘000 GBP ‘000 % of NetNominal Value Market Value Assets
SHORT TERM DEPOSITS Rabobank Nederland 0.48% 01/03/2011 78,346 5.62 Deutsche Bank 0.5% 01/03/2011 50,000 3.59 DnB NOR Bank 0.5% 01/03/2011 50,000 3.59 Crédit Agricole 0.5% 01/03/2011 30,000 2.15 DnB NOR Bank 0.5% 01/03/2011 30,000 2.15 Santander 0.8% 31/03/2011 20,000 1.43 Santander 0.8% 28/04/2011 20,000 1.43
278,346 19.96
Securities Traded on Regulated Markets
COMMERCIAL PAPERS* ING Bank 0.75% 11/04/2011 38,000 37,973 2.72 Banque Fédérative du Crédit Mutuel 0.935% 01/03/2011 35,000 35,000 2.51 North Rhine-Westphalia Bank 0.65% 04/05/2011 34,000 33,959 2.44 Natixis 0.645% 01/03/2011 30,000 30,000 2.15 ABN AMRO Bank 0.66% 04/03/2011 30,000 29,999 2.15 Intesa Sanpaolo Bank 0.6% 04/03/2011 30,000 29,999 2.15 Crédit Agricole 0.65% 11/03/2011 30,000 29,995 2.15 National Australia Bank 0.65% 14/03/2011 30,000 29,994 2.15 Royal Park Investments 0.65% 30/03/2011 30,000 29,985 2.15 Royal Park Investments 0.70% 14/04/2011 30,000 29,977 2.15 FMS Wertmanagement 0.63% 26/04/2011 30,000 29,969 2.15 Caisse des Dépôts et Consignations 0.75% 24/05/2011 30,000 29,947 2.15 Banque Fédérative du Crédit Mutuel 1.03% 01/06/2011 30,000 29,939 2.15 Bank Nederlandse Gemeenten 0.76% 06/06/2011 30,000 29,935 2.15 Landeskreditbank Baden-Württemberg 0.81% 07/06/2011 30,000 29,934 2.15 Caisse des Dépôts et Consignations 0.82% 11/07/2011 30,000 29,900 2.14 FMS Wertmanagement 0.95% 26/07/2011 30,000 29,883 2.14 ING Bank 0.74% 06/04/2011 28,000 27,983 2.01 Stadshypotek 0.77% 13/05/2011 27,000 26,960 1.94 Nordea Bank 0.76% 22/03/2011 20,000 19,993 1.43 Toyota Motor Finance 0.64% 11/04/2011 20,000 19,986 1.43 Bank of Western Australia 0.65% 14/03/2011 17,000 16,996 1.22 Nordea Bank 0.79% 11/05/2011 14,000 13,980 1.00 Toyota Motor Finance 0.64% 11/04/2011 10,000 9,993 0.72 North Rhine-Westphalia Bank 0.713% 14/04/2011 10,000 9,992 0.72
672,271 48.22
CERTIFICATES OF DEPOSIT Mizuho Corporate Bank 0.62% 23/03/2011 30,000 30,001 2.15 KBC Bank 02/03/2011 30,000 29,999 2.15 KBC Bank 09/03/2011 30,000 29,997 2.15 Bank of Tokyo-Mitsubishi 16/03/2011 30,000 29,993 2.15 BNP Paribas 16/03/2011 30,000 29,993 2.15 Société Générale 01/04/2011 30,000 29,984 2.15 Natixis 04/04/2011 30,000 29,984 2.15 HSBC France 18/04/2011 30,000 29,974 2.15 DZ Bank 26/04/2011 30,000 29,969 2.15 Société Générale 03/05/2011 30,000 29,964 2.15 Svenska Handelsbanken 0.735% 06/05/2011 25,100 25,101 1.81 ABN AMRO Bank 0.75% 01/03/2011 20,000 20,000 1.43
*Commercial Papers are shown with calculated yields. All investments are in the functional currency of the Fund.
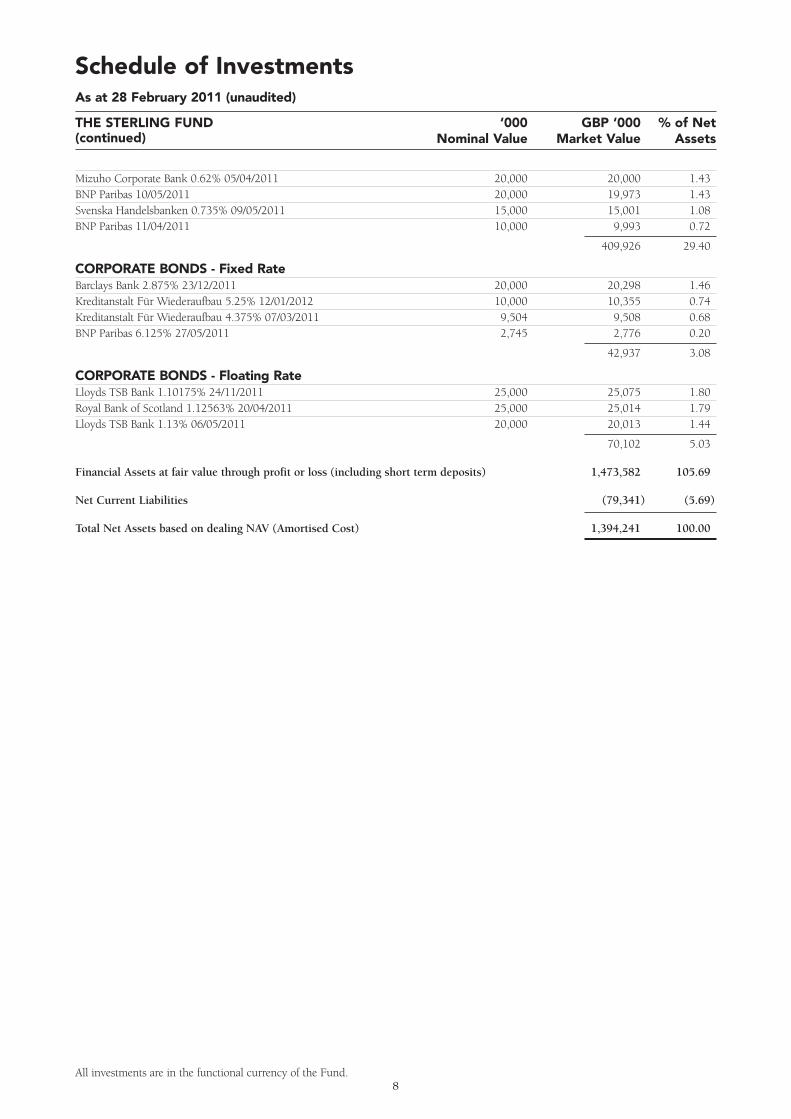
Mizuho Corporate Bank 0.62% 05/04/2011 20,000 20,000 1.43 BNP Paribas 10/05/2011 20,000 19,973 1.43Svenska Handelsbanken 0.735% 09/05/2011 15,000 15,001 1.08BNP Paribas 11/04/2011 10,000 9,993 0.72
409,926 29.40
CORPORATE BONDS - Fixed RateBarclays Bank 2.875% 23/12/2011 20,000 20,298 1.46 Kreditanstalt Für Wiederaufbau 5.25% 12/01/2012 10,000 10,355 0.74 Kreditanstalt Für Wiederaufbau 4.375% 07/03/2011 9,504 9,508 0.68 BNP Paribas 6.125% 27/05/2011 2,745 2,776 0.20
42,937 3.08
CORPORATE BONDS - Floating RateLloyds TSB Bank 1.10175% 24/11/2011 25,000 25,075 1.80 Royal Bank of Scotland 1.12563% 20/04/2011 25,000 25,014 1.79 Lloyds TSB Bank 1.13% 06/05/2011 20,000 20,013 1.44
70,102 5.03
Financial Assets at fair value through profit or loss (including short term deposits) 1,473,582 105.69
Net Current Liabilities (79,341) (5.69)
Total Net Assets based on dealing NAV (Amortised Cost) 1,394,241 100.00
8All investments are in the functional currency of the Fund.
Schedule of InvestmentsAs at 28 February 2011 (unaudited)
THE STERLING FUND ‘000 GBP ‘000 % of NetNominal Value Market Value Assets(continued)
9
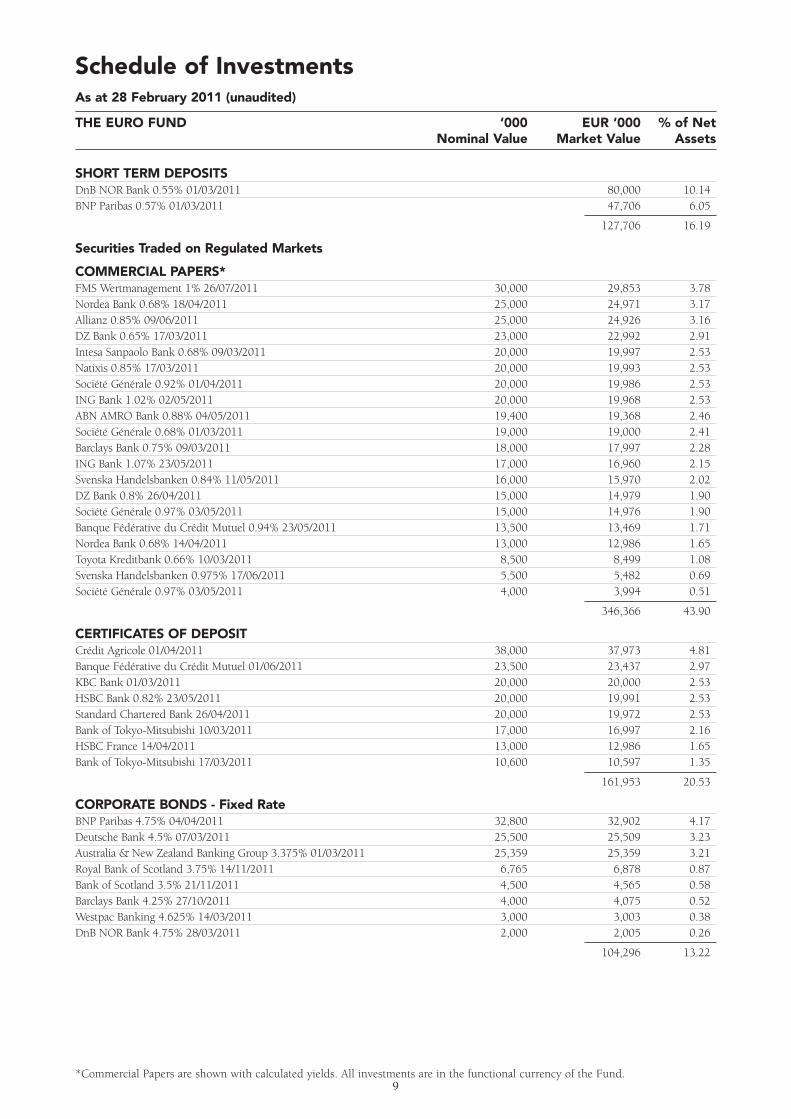
Schedule of InvestmentsAs at 28 February 2011 (unaudited)
THE EURO FUND ‘000 EUR ‘000 % of NetNominal Value Market Value Assets
SHORT TERM DEPOSITSDnB NOR Bank 0.55% 01/03/2011 80,000 10.14BNP Paribas 0.57% 01/03/2011 47,706 6.05
127,706 16.19
Securities Traded on Regulated Markets
COMMERCIAL PAPERS* FMS Wertmanagement 1% 26/07/2011 30,000 29,853 3.78Nordea Bank 0.68% 18/04/2011 25,000 24,971 3.17Allianz 0.85% 09/06/2011 25,000 24,926 3.16DZ Bank 0.65% 17/03/2011 23,000 22,992 2.91Intesa Sanpaolo Bank 0.68% 09/03/2011 20,000 19,997 2.53Natixis 0.85% 17/03/2011 20,000 19,993 2.53Société Générale 0.92% 01/04/2011 20,000 19,986 2.53ING Bank 1.02% 02/05/2011 20,000 19,968 2.53ABN AMRO Bank 0.88% 04/05/2011 19,400 19,368 2.46Société Générale 0.68% 01/03/2011 19,000 19,000 2.41Barclays Bank 0.75% 09/03/2011 18,000 17,997 2.28ING Bank 1.07% 23/05/2011 17,000 16,960 2.15Svenska Handelsbanken 0.84% 11/05/2011 16,000 15,970 2.02DZ Bank 0.8% 26/04/2011 15,000 14,979 1.90Société Générale 0.97% 03/05/2011 15,000 14,976 1.90Banque Fédérative du Crédit Mutuel 0.94% 23/05/2011 13,500 13,469 1.71Nordea Bank 0.68% 14/04/2011 13,000 12,986 1.65Toyota Kreditbank 0.66% 10/03/2011 8,500 8,499 1.08Svenska Handelsbanken 0.975% 17/06/2011 5,500 5,482 0.69Société Générale 0.97% 03/05/2011 4,000 3,994 0.51
346,366 43.90
CERTIFICATES OF DEPOSIT Crédit Agricole 01/04/2011 38,000 37,973 4.81 Banque Fédérative du Crédit Mutuel 01/06/2011 23,500 23,437 2.97 KBC Bank 01/03/2011 20,000 20,000 2.53 HSBC Bank 0.82% 23/05/2011 20,000 19,991 2.53 Standard Chartered Bank 26/04/2011 20,000 19,972 2.53 Bank of Tokyo-Mitsubishi 10/03/2011 17,000 16,997 2.16 HSBC France 14/04/2011 13,000 12,986 1.65 Bank of Tokyo-Mitsubishi 17/03/2011 10,600 10,597 1.35
161,953 20.53
CORPORATE BONDS - Fixed RateBNP Paribas 4.75% 04/04/2011 32,800 32,902 4.17Deutsche Bank 4.5% 07/03/2011 25,500 25,509 3.23Australia & New Zealand Banking Group 3.375% 01/03/2011 25,359 25,359 3.21Royal Bank of Scotland 3.75% 14/11/2011 6,765 6,878 0.87Bank of Scotland 3.5% 21/11/2011 4,500 4,565 0.58Barclays Bank 4.25% 27/10/2011 4,000 4,075 0.52Westpac Banking 4.625% 14/03/2011 3,000 3,003 0.38DnB NOR Bank 4.75% 28/03/2011 2,000 2,005 0.26
104,296 13.22
*Commercial Papers are shown with calculated yields. All investments are in the functional currency of the Fund.

CORPORATE BONDS - Floating RateRabobank Nederland 1.528% 23/05/2011 35,000 35,034 4.44National Australia Bank 1.099% 18/03/2011 26,150 26,145 3.31Lloyds TSB Bank 1.179% 09/06/2011 2,500 2,500 0.32
63,679 8.07
Financial Assets at fair value through profit or loss (including short term deposits) 804,000 101.91
Net Current Liabilities (15,072) (1.91)
Total Net Assets based on dealing NAV (Amortised Cost) 788,928 100.00
10All investments are in the functional currency of the Fund.
Schedule of InvestmentsAs at 28 February 2011 (unaudited)
THE EURO FUND ‘000 EUR ‘000 % of NetNominal Value Market Value Assets(continued)
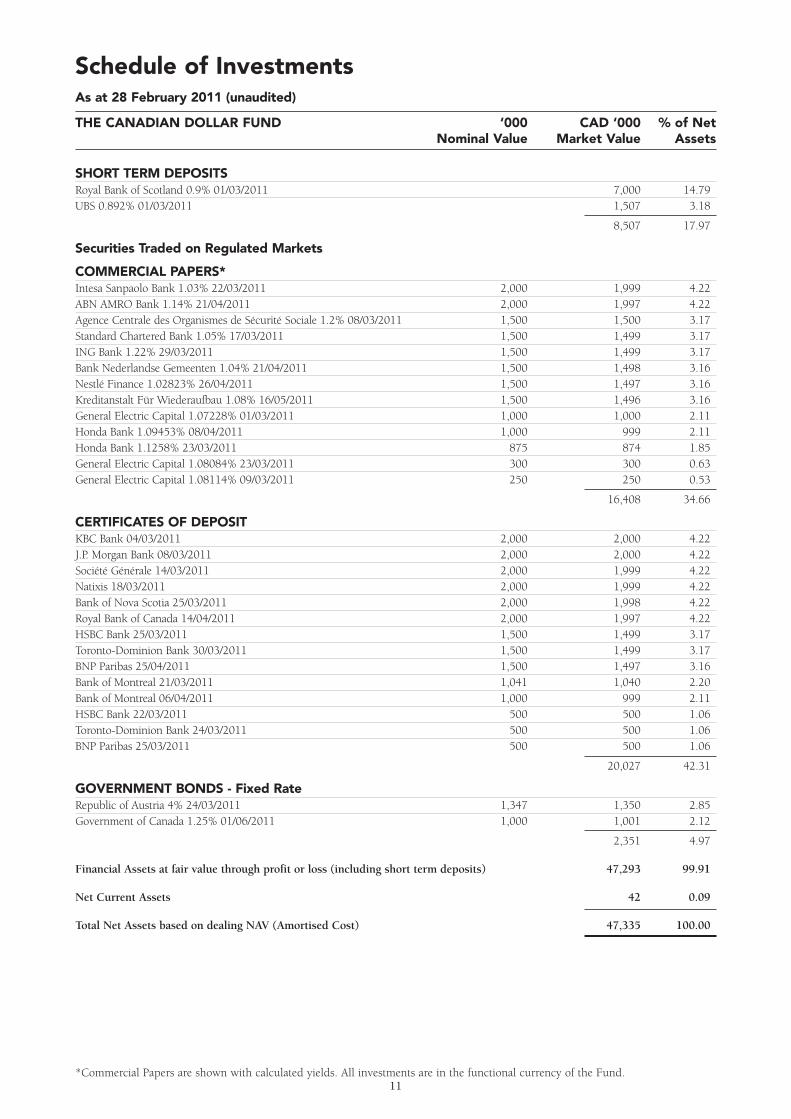
Schedule of InvestmentsAs at 28 February 2011 (unaudited)
THE CANADIAN DOLLAR FUND ‘000 CAD ‘000 % of NetNominal Value Market Value Assets
SHORT TERM DEPOSITSRoyal Bank of Scotland 0.9% 01/03/2011 7,000 14.79UBS 0.892% 01/03/2011 1,507 3.18
8,507 17.97
Securities Traded on Regulated Markets
COMMERCIAL PAPERS* Intesa Sanpaolo Bank 1.03% 22/03/2011 2,000 1,999 4.22ABN AMRO Bank 1.14% 21/04/2011 2,000 1,997 4.22Agence Centrale des Organismes de Sécurité Sociale 1.2% 08/03/2011 1,500 1,500 3.17Standard Chartered Bank 1.05% 17/03/2011 1,500 1,499 3.17ING Bank 1.22% 29/03/2011 1,500 1,499 3.17Bank Nederlandse Gemeenten 1.04% 21/04/2011 1,500 1,498 3.16Nestlé Finance 1.02823% 26/04/2011 1,500 1,497 3.16Kreditanstalt Für Wiederaufbau 1.08% 16/05/2011 1,500 1,496 3.16General Electric Capital 1.07228% 01/03/2011 1,000 1,000 2.11Honda Bank 1.09453% 08/04/2011 1,000 999 2.11Honda Bank 1.1258% 23/03/2011 875 874 1.85General Electric Capital 1.08084% 23/03/2011 300 300 0.63General Electric Capital 1.08114% 09/03/2011 250 250 0.53
16,408 34.66
CERTIFICATES OF DEPOSIT KBC Bank 04/03/2011 2,000 2,000 4.22 J.P. Morgan Bank 08/03/2011 2,000 2,000 4.22 Société Générale 14/03/2011 2,000 1,999 4.22 Natixis 18/03/2011 2,000 1,999 4.22 Bank of Nova Scotia 25/03/2011 2,000 1,998 4.22 Royal Bank of Canada 14/04/2011 2,000 1,997 4.22 HSBC Bank 25/03/2011 1,500 1,499 3.17 Toronto-Dominion Bank 30/03/2011 1,500 1,499 3.17 BNP Paribas 25/04/2011 1,500 1,497 3.16 Bank of Montreal 21/03/2011 1,041 1,040 2.20 Bank of Montreal 06/04/2011 1,000 999 2.11 HSBC Bank 22/03/2011 500 500 1.06Toronto-Dominion Bank 24/03/2011 500 500 1.06BNP Paribas 25/03/2011 500 500 1.06
20,027 42.31
GOVERNMENT BONDS - Fixed RateRepublic of Austria 4% 24/03/2011 1,347 1,350 2.85Government of Canada 1.25% 01/06/2011 1,000 1,001 2.12
2,351 4.97
Financial Assets at fair value through profit or loss (including short term deposits) 47,293 99.91
Net Current Assets 42 0.09
Total Net Assets based on dealing NAV (Amortised Cost) 47,335 100.00
11*Commercial Papers are shown with calculated yields. All investments are in the functional currency of the Fund.
12
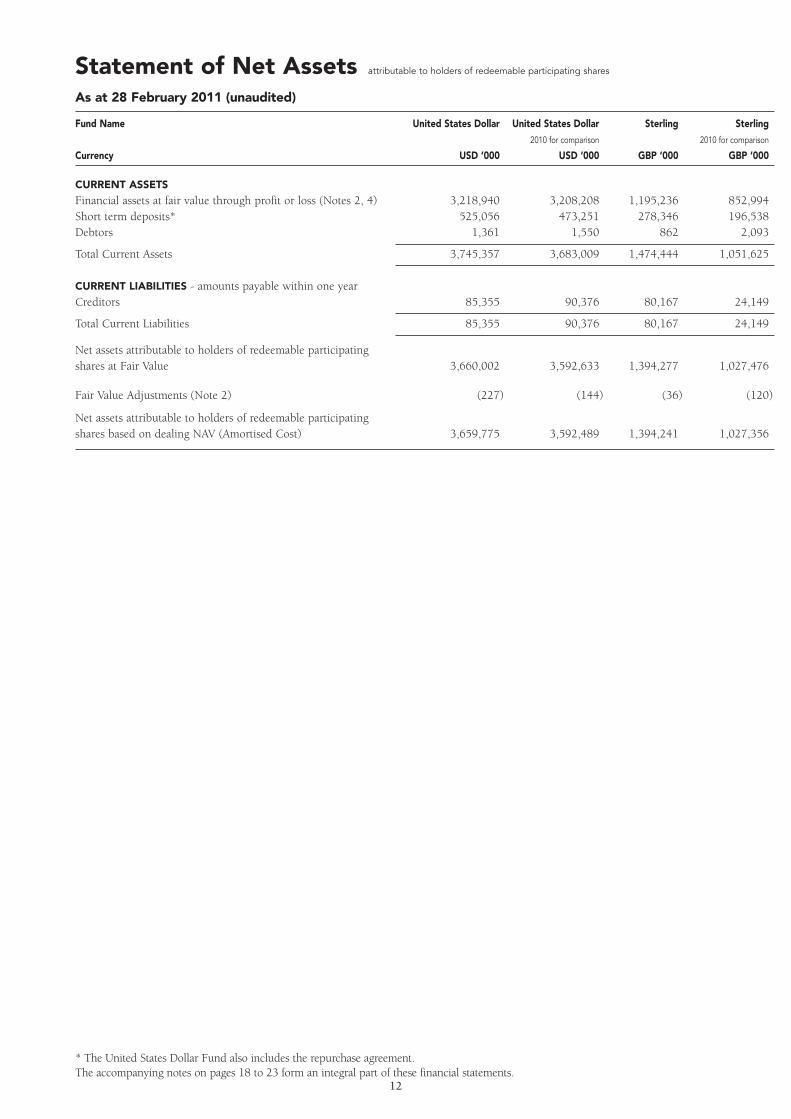
Statement of Net Assets attributable to holders of redeemable participating shares
As at 28 February 2011 (unaudited)
Fund Name United States Dollar United States Dollar Sterling Sterling
2010 for comparison 2010 for comparison
Currency USD ‘000 USD ‘000 GBP ‘000 GBP ‘000
CURRENT ASSETS
Financial assets at fair value through profit or loss (Notes 2, 4) 3,218,940 3,208,208 1,195,236 852,994Short term deposits* 525,056 473,251 278,346 196,538Debtors 1,361 1,550 862 2,093
Total Current Assets 3,745,357 3,683,009 1,474,444 1,051,625
CURRENT LIABILITIES - amounts payable within one yearCreditors 85,355 90,376 80,167 24,149
Total Current Liabilities 85,355 90,376 80,167 24,149
Net assets attributable to holders of redeemable participating shares at Fair Value 3,660,002 3,592,633 1,394,277 1,027,476
Fair Value Adjustments (Note 2) (227) (144) (36) (120)
Net assets attributable to holders of redeemable participating shares based on dealing NAV (Amortised Cost) 3,659,775 3,592,489 1,394,241 1,027,356
* The United States Dollar Fund also includes the repurchase agreement. The accompanying notes on pages 18 to 23 form an integral part of these financial statements.
13
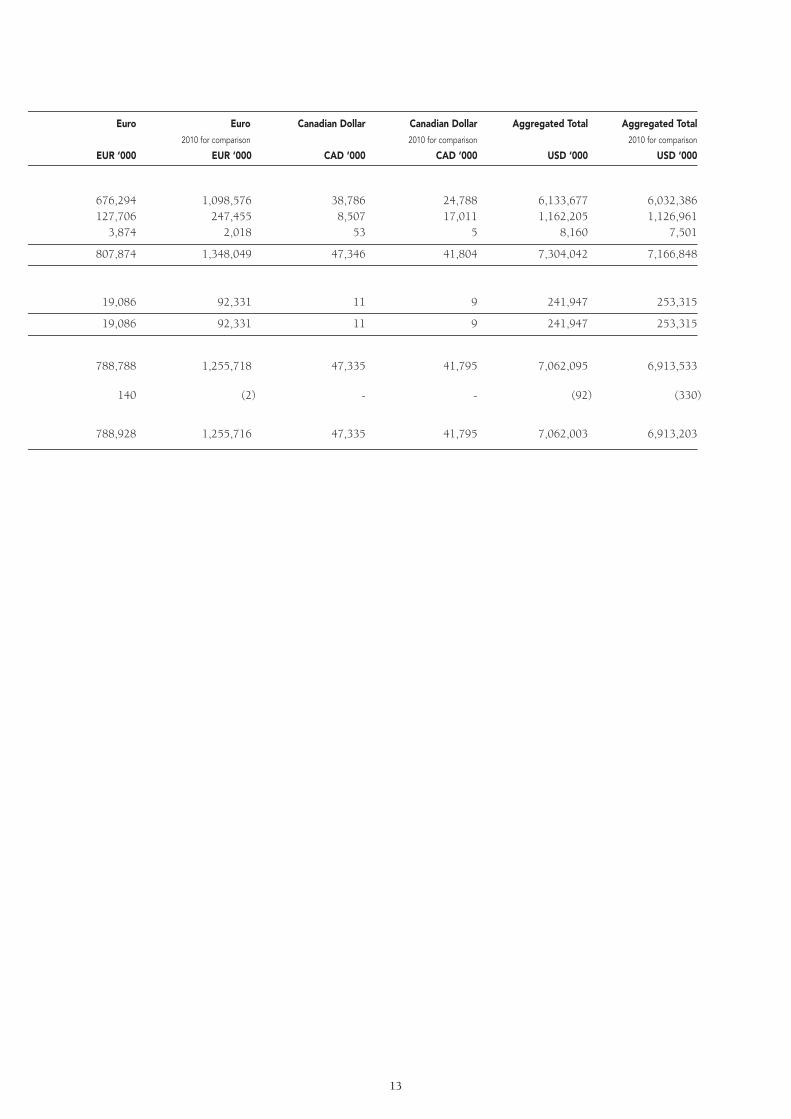
Euro Euro Canadian Dollar Canadian Dollar Aggregated Total Aggregated Total
2010 for comparison 2010 for comparison 2010 for comparison
EUR ‘000 EUR ‘000 CAD ‘000 CAD ‘000 USD ‘000 USD ‘000
676,294 1,098,576 38,786 24,788 6,133,677 6,032,386127,706 247,455 8,507 17,011 1,162,205 1,126,961
3,874 2,018 53 5 8,160 7,501
807,874 1,348,049 47,346 41,804 7,304,042 7,166,848
19,086 92,331 11 9 241,947 253,315
19,086 92,331 11 9 241,947 253,315
788,788 1,255,718 47,335 41,795 7,062,095 6,913,533
140 (2) - - (92) (330)
788,928 1,255,716 47,335 41,795 7,062,003 6,913,203
14
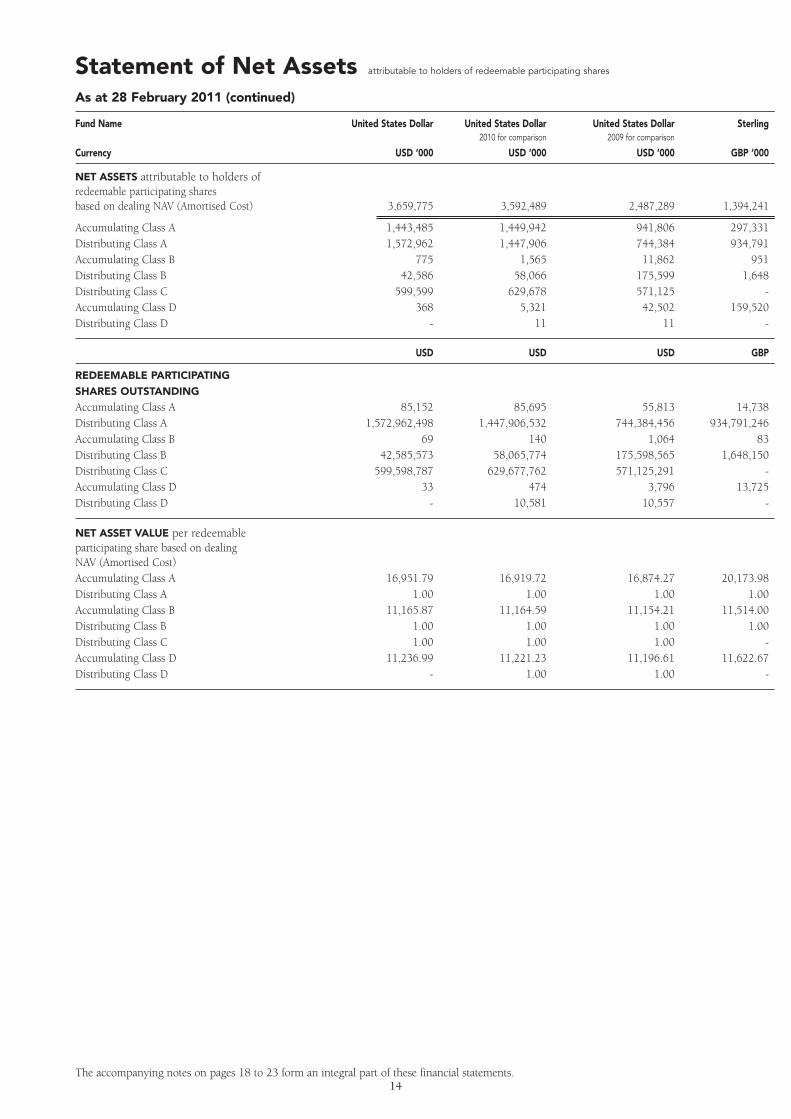
Statement of Net Assets attributable to holders of redeemable participating shares
As at 28 February 2011 (continued)
Fund Name United States Dollar United States Dollar United States Dollar Sterling2010 for comparison 2009 for comparison
Currency USD ‘000 USD ‘000 USD ‘000 GBP ‘000
NET ASSETS attributable to holders of redeemable participating sharesbased on dealing NAV (Amortised Cost) 3,659,775 3,592,489 2,487,289 1,394,241
Accumulating Class A 1,443,485 1,449,942 941,806 297,331Distributing Class A 1,572,962 1,447,906 744,384 934,791Accumulating Class B 775 1,565 11,862 951Distributing Class B 42,586 58,066 175,599 1,648Distributing Class C 599,599 629,678 571,125 -Accumulating Class D 368 5,321 42,502 159,520Distributing Class D - 11 11 -
USD USD USD GBP
REDEEMABLE PARTICIPATING
SHARES OUTSTANDING
Accumulating Class A 85,152 85,695 55,813 14,738Distributing Class A 1,572,962,498 1,447,906,532 744,384,456 934,791,246Accumulating Class B 69 140 1,064 83Distributing Class B 42,585,573 58,065,774 175,598,565 1,648,150Distributing Class C 599,598,787 629,677,762 571,125,291 -Accumulating Class D 33 474 3,796 13,725Distributing Class D - 10,581 10,557 -
NET ASSET VALUE per redeemableparticipating share based on dealingNAV (Amortised Cost)Accumulating Class A 16,951.79 16,919.72 16,874.27 20,173.98Distributing Class A 1.00 1.00 1.00 1.00Accumulating Class B 11,165.87 11,164.59 11,154.21 11,514.00Distributing Class B 1.00 1.00 1.00 1.00Distributing Class C 1.00 1.00 1.00 -Accumulating Class D 11,236.99 11,221.23 11,196.61 11,622.67Distributing Class D - 1.00 1.00 -
The accompanying notes on pages 18 to 23 form an integral part of these financial statements.

15
Sterling Sterling Euro Euro Euro Canadian Dollar Canadian Dollar Canadian Dollar2010 for comparison 2009 for comparison 2010 for comparison 2009 for comparison 2010 for comparison 2009 for comparison
GBP ‘000 GBP ‘000 EUR ‘000 EUR ‘000 EUR ‘000 CAD ‘000 CAD ‘000 CAD ‘000
1,027,356 872,701 788,928 1,255,716 1,561,488 47,335 41,795 55,234
256,682 230,203 499,765 875,258 801,187 4,523 1,439 1,065727,779 621,275 261,436 323,374 582,981 30,642 22,800 18,369
2,191 7,165 13,877 37,837 126,340 - - -2,933 9,968 13,326 16,362 25,108 12,170 17,555 32,118
- - - - - - - -37,770 4,089 524 2,884 1,799 - - -
1 1 - 1 24,073 - 1 3,682
GBP GBP EUR EUR EUR CAD CAD CAD
12,785 11,532 35,820 63,016 58,015 308 98 73727,778,422 621,274,935 261,435,631 323,374,206 582,981,355 30,642,374 22,800,197 18,368,831
191 626 1,249 3,413 11,433 - - -2,933,045 9,967,789 13,326,073 16,362,251 25,108,438 12,170,133 17,554,412 32,117,584
- - - - - - - -3,264 355 47 258 162 - - -1,014 1,009 - 1,002 24,073,008 - 1,000 3,681,692
20,076.51 19,962.87 13,951.94 13,889.34 13,809.89 14,696.70 14,610.85 14,576.311.00 1.00 1.00 1.00 1.00 1.00 1.00 1.00
11,484.20 11,447.01 11,108.65 11,086.50 11,050.66 - - -1.00 1.00 1.00 1.00 1.00 1.00 1.00 1.00
- - - - - - - -11,572.51 11,512.39 11,217.58 11,172.86 11,114.43 - - -
1.00 1.00 - 1.00 1.00 - 1.00 1.00

16
Statement of OperationsFor the six month period ended 28 February 2011 (unaudited)
Fund Name United States Dollar United States Dollar Sterling Sterling
2010 for comparison 2010 for comparison
Currency USD ‘000 USD ‘000 GBP ‘000 GBP ‘000
OPERATING INCOME
Interest Income (Note 2) 6,099 4,261 4,548 2,733Net change in unrealised gains/(losses) on financial assets at fair value through profit or loss (126) (105) 20 178Net realised gains/(losses) on financialassets at fair value through profit or loss 90 22 82 8
Total Operating Income 6,063 4,178 4,650 2,919
OPERATING EXPENSES
Management/Trailer Fees (Note 3) (2,387) (1,933) (1,066) (769)
Net Operating Income 3,676 2,245 3,584 2,150
FINANCE COSTS
Distributions to redeemable participating shareholders (2,235) (1,554) (2,299) (1,407)
FAIR VALUE ADJUSTMENT
Fair Value Adjustments (Note 2) 126 105 (20) (178)
INCREASE IN NET ASSETS ATTRIBUTABLE
TO REDEEMABLE PARTICIPATING
SHARES FROM OPERATIONS 1,567 796 1,265 565
Gains and losses arose solely from continuing operations. There were no gains or losses other than those dealt with in the Statement of Operations.
The accompanying notes on pages 18 to 23 form an integral part of these financial statements.

17
Euro Euro Canadian Dollar Canadian Dollar Aggregated Total Aggregated Total
2010 for comparison 2010 for comparison 2010 for comparison
EUR ‘000 EUR ‘000 CAD ‘000 CAD ‘000 USD ‘000 USD ‘000
3,213 2,201 232 58 17,904 11,857
(32) (115) 2 8 (136) 23
90 47 - - 342 102
3,271 2,133 234 66 18,110 11,982
(729) (840) (52) (42) (5,119) (4,411)
2,542 1,293 182 24 12,991 7,571
(1,097) (535) (172) (15) (7,541) (4,592)
32 115 (2) (8) 136 (23)
1,477 873 8 1 5,586 2,956
18
Notes to the Financial StatementsAs at 28 February 2011
1. GeneralThe Company is an open ended investment company with variable capital organised under the laws of Ireland as a public limitedcompany pursuant to the Companies Acts, 1963 to 2009 and is listed on the Irish Stock Exchange. It was incorporated on 29 June 1995under registration number 235175. The authorisation of the Company is not an endorsement or guarantee of the Company or itsperformance by the Central Bank of Ireland. Its object, as set out in clause 2 of the Company’s Memorandum of Association, is thecollective investment in either or both transferable securities and other liquid financial assets referred to in Regulation 45 of the EuropeanCommunities (Undertakings for Collective Investment in Transferable Securities) Regulations 2003 (as amended), of capital raised fromthe public and which operates on the basis of risk spreading. At present the Company’s shares represent interest in The United StatesDollar Fund, The Sterling Fund, The Euro Fund and The Canadian Dollar Fund (each a ‘Fund’), each relating to a separate portfolio ofsecurities, cash and other net assets.
2. Significant Accounting PoliciesThe significant accounting policies adopted by the Company are as follows:
BASIS OF PREPARATIONThe financial statements have been prepared in accordance with accounting standards generally accepted in Ireland and Irish legislationcomprising the Companies Acts, 1963 to 2009 and the UCITS Regulations. Accounting standards generally accepted in Ireland inpreparing financial statements giving a true and fair view are those published by the Institute of Chartered Accountants in Ireland andissued by the Accounting Standards Board.
The Fair Value Adjustments in the Statement of Net Assets and Statement of Operations are due to the revaluation of financial assets basedon bid market pricing for financial statement purposes. For the Net Asset Value calculations financial assets are valued at amortised cost.
The format and certain wordings of the financial statements have been adapted from those contained in the Companies (Amendment) Act1986, (as amended) and FRS3 ‘Reporting Financial Performance’ so that, in the opinion of the Directors, they more appropriately reflect thenature of the Company as an investment fund. Certain comparatives have been restated to conform with the current period presentation.
The Company has availed of the exemption available to open-ended investment funds under FRS1 not to prepare a cash flow statement.
HISTORICAL COST CONVENTIONThe financial statements have been prepared under the historical cost convention as modified by the revaluation of financial assets andfinancial liabilities held at fair value through profit or loss.
INCOMEIncome from investment securities is accounted for in the Statement of Operations using the effective interest method.
SECURITY VALUATIONThe Company has classified financial instruments as financial assets or financial liabilities at fair value through profit or loss. The fairvalue of financial instruments traded in active markets is based on quoted market prices at 28 February 2011. The quoted market priceused for financial assets held by the Company is the current bid price. The Company may invest in securities that are not traded in anactive market (for example in over-the-counter money market instruments). The fair value of these investments is determined by using avaluation technique. This is a matrix based technique which calculates a fair value price based on the correlation of spot to 12 monthLIBOR rates and length of time to maturity of each asset in this category.
All other assets are valued in such manner as the Directors of the Company may deem appropriate. The Company does not own anyrestricted securities, all holdings being quoted on an official market, except where otherwise distinguished in the Fund’s schedule ofinvestments.
REALISED GAINS AND LOSSESThe realised gains and losses on transferable securities arising during the period are transferred to the Statement of Operations and aretreated as income.
FUND SHARE TRANSACTIONSThe issue and redemption price of each Fund is based on the last calculated Net Asset Value per share.
REDEEMABLE PARTICIPATING SHARESRedeemable participating shares are redeemable in accordance with the provisions of the Company’s Prospectus at the shareholder’soption and are classified as financial liabilities. The participating shares can be put back to the Company at any time for cash equal to aproportionate share of the Company’s Net Asset Value. The participating share is carried at the redemption amount that is payable at thebalance sheet date if the shareholder exercised its right to put the share back to the Company.
FOREIGN EXCHANGEItems included in the Company’s financial statements are measured using the currency of the primary economic environment in which itoperates (the ‘functional currency’). As functional currency is determined at the individual Fund level the functional currency in respectof each Fund is the United States Dollar for The United States Dollar Fund, the Pound Sterling for The Sterling Fund, the Euro for TheEuro Fund and the Canadian Dollar for The Canadian Dollar Fund.
19
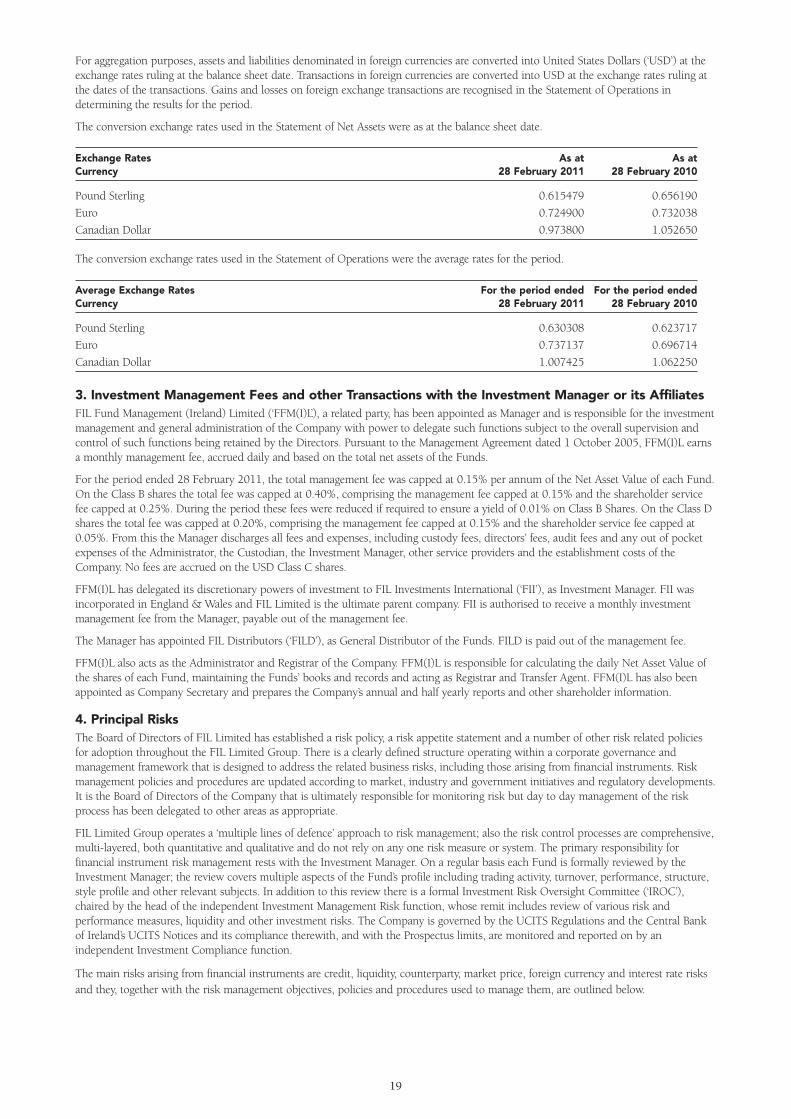
For aggregation purposes, assets and liabilities denominated in foreign currencies are converted into United States Dollars (‘USD’) at theexchange rates ruling at the balance sheet date. Transactions in foreign currencies are converted into USD at the exchange rates ruling atthe dates of the transactions. Gains and losses on foreign exchange transactions are recognised in the Statement of Operations indetermining the results for the period.
The conversion exchange rates used in the Statement of Net Assets were as at the balance sheet date.
Exchange Rates As at As atCurrency 28 February 2011 28 February 2010
Pound Sterling 0.615479 0.656190
Euro 0.724900 0.732038
Canadian Dollar 0.973800 1.052650
The conversion exchange rates used in the Statement of Operations were the average rates for the period.
Average Exchange Rates For the period ended For the period endedCurrency 28 February 2011 28 February 2010
Pound Sterling 0.630308 0.623717
Euro 0.737137 0.696714
Canadian Dollar 1.007425 1.062250
3. Investment Management Fees and other Transactions with the Investment Manager or its AffiliatesFIL Fund Management (Ireland) Limited (‘FFM(I)L’), a related party, has been appointed as Manager and is responsible for the investmentmanagement and general administration of the Company with power to delegate such functions subject to the overall supervision andcontrol of such functions being retained by the Directors. Pursuant to the Management Agreement dated 1 October 2005, FFM(I)L earnsa monthly management fee, accrued daily and based on the total net assets of the Funds.
For the period ended 28 February 2011, the total management fee was capped at 0.15% per annum of the Net Asset Value of each Fund.On the Class B shares the total fee was capped at 0.40%, comprising the management fee capped at 0.15% and the shareholder servicefee capped at 0.25%. During the period these fees were reduced if required to ensure a yield of 0.01% on Class B Shares. On the Class Dshares the total fee was capped at 0.20%, comprising the management fee capped at 0.15% and the shareholder service fee capped at0.05%. From this the Manager discharges all fees and expenses, including custody fees, directors’ fees, audit fees and any out of pocketexpenses of the Administrator, the Custodian, the Investment Manager, other service providers and the establishment costs of theCompany. No fees are accrued on the USD Class C shares.
FFM(I)L has delegated its discretionary powers of investment to FIL Investments International (‘FII’), as Investment Manager. FII wasincorporated in England & Wales and FIL Limited is the ultimate parent company. FII is authorised to receive a monthly investmentmanagement fee from the Manager, payable out of the management fee.
The Manager has appointed FIL Distributors (‘FILD’), as General Distributor of the Funds. FILD is paid out of the management fee.
FFM(I)L also acts as the Administrator and Registrar of the Company. FFM(I)L is responsible for calculating the daily Net Asset Value ofthe shares of each Fund, maintaining the Funds’ books and records and acting as Registrar and Transfer Agent. FFM(I)L has also beenappointed as Company Secretary and prepares the Company’s annual and half yearly reports and other shareholder information.
4. Principal RisksThe Board of Directors of FIL Limited has established a risk policy, a risk appetite statement and a number of other risk related policiesfor adoption throughout the FIL Limited Group. There is a clearly defined structure operating within a corporate governance andmanagement framework that is designed to address the related business risks, including those arising from financial instruments. Riskmanagement policies and procedures are updated according to market, industry and government initiatives and regulatory developments.It is the Board of Directors of the Company that is ultimately responsible for monitoring risk but day to day management of the riskprocess has been delegated to other areas as appropriate.
FIL Limited Group operates a ‘multiple lines of defence’ approach to risk management; also the risk control processes are comprehensive,multi-layered, both quantitative and qualitative and do not rely on any one risk measure or system. The primary responsibility forfinancial instrument risk management rests with the Investment Manager. On a regular basis each Fund is formally reviewed by theInvestment Manager; the review covers multiple aspects of the Fund’s profile including trading activity, turnover, performance, structure,style profile and other relevant subjects. In addition to this review there is a formal Investment Risk Oversight Committee (‘IROC’),chaired by the head of the independent Investment Management Risk function, whose remit includes review of various risk andperformance measures, liquidity and other investment risks. The Company is governed by the UCITS Regulations and the Central Bankof Ireland’s UCITS Notices and its compliance therewith, and with the Prospectus limits, are monitored and reported on by anindependent Investment Compliance function.
The main risks arising from financial instruments are credit, liquidity, counterparty, market price, foreign currency and interest rate risksand they, together with the risk management objectives, policies and procedures used to manage them, are outlined below.
20
CREDIT RISKCredit risk arises as both counterparty and issuer credit risk.
All security investments are transacted through brokers who have been approved by the FIL Limited Group as an acceptablecounterparty. The list of approved brokers is reviewed regularly.
There is a risk of loss if a counterparty fails to perform its financial or other obligations to a Fund, for example, the possibility that acounterparty may default by failing to make payments due, or failing to repay principal and interest in a timely manner. If settlementnever occurs the loss incurred by the Fund will be the difference between the price of the original contract and the price of thereplacement contract or, in the case where the contract is not replaced, the absolute value of the contract at the time it is voided.Furthermore, in some markets ‘Delivery versus Payment’ may not be possible in which case the absolute value of the contract is at risk ifthe Fund meets its settlement obligations but the counterparty fails before meeting its obligations under the relevant contract.
A Fund’s investments may be adversely affected if any of the institutions with which its money is deposited suffers insolvency or otherfinancial difficulties. Credit risk also arises from the uncertainty surrounding the ultimate repayment of principal and interest or otherdebt instrument investments by the issuers of such securities. Although the Funds may invest in high quality credit instruments, therecan be no assurance that the institutions or securities in which a Fund invests will not be subject to credit difficulties leading to the lossof some or all of the sums invested in such institutions, securities or other instruments.
The credit quality of permitted investments is strictly monitored and investment grade debt securities will be rated A or higher for longterm securities or rated A-1 or higher for short term securities. Each Fund invests only in investment grade debt securities.
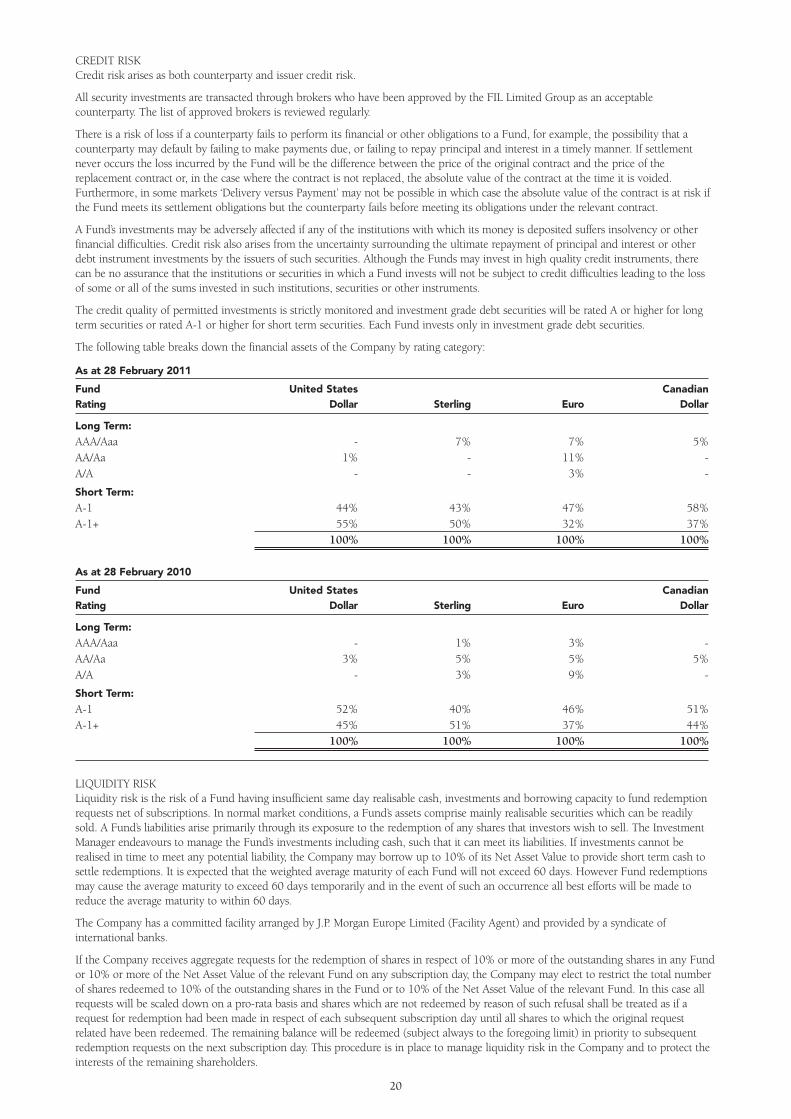
The following table breaks down the financial assets of the Company by rating category:
As at 28 February 2011
Fund United States CanadianRating Dollar Sterling Euro Dollar
Long Term:
AAA/Aaa - 7% 7% 5%AA/Aa 1% - 11% -A/A - - 3% -
Short Term:
A-1 44% 43% 47% 58%A-1+ 55% 50% 32% 37%
100% 100% 100% 100%
As at 28 February 2010
Fund United States CanadianRating Dollar Sterling Euro Dollar
Long Term:
AAA/Aaa - 1% 3% -AA/Aa 3% 5% 5% 5%A/A - 3% 9% -
Short Term:
A-1 52% 40% 46% 51%A-1+ 45% 51% 37% 44%
100% 100% 100% 100%
LIQUIDITY RISKLiquidity risk is the risk of a Fund having insufficient same day realisable cash, investments and borrowing capacity to fund redemptionrequests net of subscriptions. In normal market conditions, a Fund’s assets comprise mainly realisable securities which can be readilysold. A Fund’s liabilities arise primarily through its exposure to the redemption of any shares that investors wish to sell. The InvestmentManager endeavours to manage the Fund’s investments including cash, such that it can meet its liabilities. If investments cannot berealised in time to meet any potential liability, the Company may borrow up to 10% of its Net Asset Value to provide short term cash tosettle redemptions. It is expected that the weighted average maturity of each Fund will not exceed 60 days. However Fund redemptionsmay cause the average maturity to exceed 60 days temporarily and in the event of such an occurrence all best efforts will be made toreduce the average maturity to within 60 days.
The Company has a committed facility arranged by J.P. Morgan Europe Limited (Facility Agent) and provided by a syndicate ofinternational banks.
If the Company receives aggregate requests for the redemption of shares in respect of 10% or more of the outstanding shares in any Fundor 10% or more of the Net Asset Value of the relevant Fund on any subscription day, the Company may elect to restrict the total numberof shares redeemed to 10% of the outstanding shares in the Fund or to 10% of the Net Asset Value of the relevant Fund. In this case allrequests will be scaled down on a pro-rata basis and shares which are not redeemed by reason of such refusal shall be treated as if arequest for redemption had been made in respect of each subsequent subscription day until all shares to which the original requestrelated have been redeemed. The remaining balance will be redeemed (subject always to the foregoing limit) in priority to subsequentredemption requests on the next subscription day. This procedure is in place to manage liquidity risk in the Company and to protect theinterests of the remaining shareholders.
21
At the 28 February 2011 (and at 28 February 2010), redeemable participating shares are redeemable on demand, subject to thelimitations described in the previous paragraph or during any period of temporary suspension of valuation of shares, sales andredemptions, and all other liabilities are repayable within one month.
MARKET RISKMarket Risk comprises Market Price Risk, Foreign Currency Risk, and Interest Rate Risk.
MARKET PRICE RISKMarket price risk arises from the uncertainty about future price movements on financial instruments held. It represents the potential lossthe Company might suffer through holding market positions in the face of price movements. The value of investments is not fixed andmay go down as well as up. This may be as a result of a specific factor affecting the value of an individual investment, or may be causedby general market factors.
The Investment Manager considers the asset allocation of the portfolios in order to optimise the risk associated with particular countriesor industry sectors whilst continuing to follow each Fund’s investment objective. The Investment Manager does not currently usederivative instruments to hedge the investment portfolios against market risk, as in its opinion the cost of such a process would result inan unacceptable reduction in the potential for capital growth.
FAIR VALUE ESTIMATIONIFRS7 requires the Company to classify fair value measurements using a fair value hierarchy that reflects the significance of the inputsused in making the measurements. The fair value hierarchy has the following levels:
• Quoted prices (unadjusted) in active markets for identical assets or liabilities (Level 1);
• Inputs other than quoted prices included within Level 1 that are observable for the asset or liability, either directly (i.e. as prices) orindirectly (i.e. derived from prices) (Level 2); and
• Inputs for the asset or liability that are not based on observable market data (i.e. unobservable inputs) (Level 3).
The determination of what constitutes ‘observable’ requires significant judgement by the Company. The Company considers observabledata to be that market data that is readily available, regularly distributed or updated, reliable and verifiable, not proprietary, and providedby independent sources that are actively involved in the relevant market.
Instruments whose values are based on quoted market prices in active markets are classified within Level 1. The Company does notadjust the quoted price for these instruments.
The Company uses valuation techniques to derive the fair value for over-the-counter money market instruments classified within Level 2.Instruments whose values are based on evaluated market prices (adjusted by the vendor) are also classified within this Level.
The Company does not have any Level 3 measurements.
FOREIGN CURRENCY RISKThere is no foreign currency risk as each Fund only holds assets in the same currency as the currency of the shares in issue.
INTEREST RATE RISK Debt securities have varying levels of sensitivity to changes in interest rates. In general, the price of a fixed rate debt security can fall wheninterest rates rise and can rise when interest rates fall.
Securities with longer maturity dates can be more sensitive to interest rate changes. As the permitted investments of the Fund’s entailtrading in interest bearing securities, there is an exposure to interest rate risk. The Investment Manager manages this exposure bygenerally investing in instruments whose maturity or interest rate refixing date is less than 397 days. The Fund’s investment portfolioyield profiles are monitored regularly in pursuance of the investment objectives and policies as set out in the Prospectus of the Company.
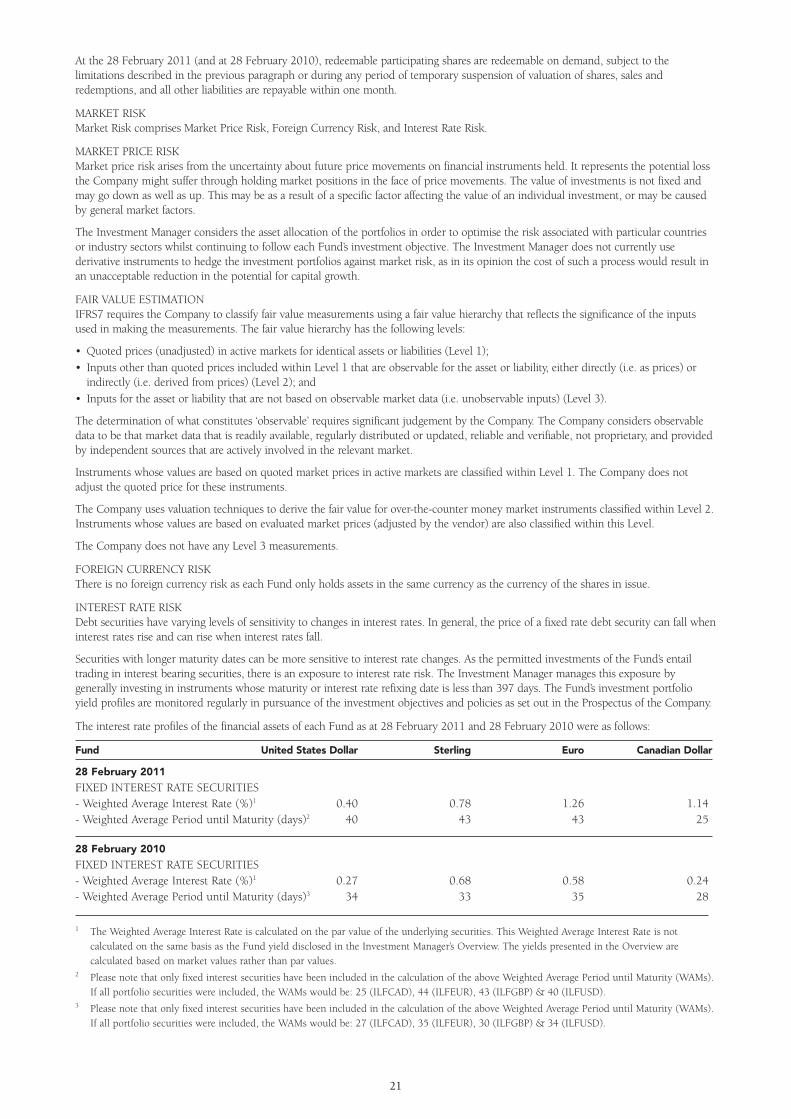
The interest rate profiles of the financial assets of each Fund as at 28 February 2011 and 28 February 2010 were as follows:
Fund United States Dollar Sterling Euro Canadian Dollar
28 February 2011
FIXED INTEREST RATE SECURITIES- Weighted Average Interest Rate (%)1 0.40 0.78 1.26 1.14- Weighted Average Period until Maturity (days)2 40 43 43 25
28 February 2010
FIXED INTEREST RATE SECURITIES- Weighted Average Interest Rate (%)1 0.27 0.68 0.58 0.24- Weighted Average Period until Maturity (days)3 34 33 35 28
1 The Weighted Average Interest Rate is calculated on the par value of the underlying securities. This Weighted Average Interest Rate is not
calculated on the same basis as the Fund yield disclosed in the Investment Manager’s Overview. The yields presented in the Overview are
calculated based on market values rather than par values.2 Please note that only fixed interest securities have been included in the calculation of the above Weighted Average Period until Maturity (WAMs).
If all portfolio securities were included, the WAMs would be: 25 (ILFCAD), 44 (ILFEUR), 43 (ILFGBP) & 40 (ILFUSD).3 Please note that only fixed interest securities have been included in the calculation of the above Weighted Average Period until Maturity (WAMs).
If all portfolio securities were included, the WAMs would be: 27 (ILFCAD), 35 (ILFEUR), 30 (ILFGBP) & 34 (ILFUSD).

22
The table below summarises the exposure of the Company to interest rate risk as at 28 February 2011 and 28 February 2010. It includesthe Company’s financial assets and financial liabilities at fair values, categorised by the earlier of contractual re-pricing or maturity dates.
Less than 1 month - Over Non InterestThe United States Dollar Fund 1 month 3 months 3 months Bearing TotalAs at 28 February 2011 USD ‘000 USD ‘000 USD ‘000 USD ‘000 USD ‘000
Current Assets 1,762,603 1,359,980 621,413 1,361 3,745,357 Current Liabilities - - - (3,745,357) (3,745,357)
Interest sensitivity gap 1,762,603 1,359,980 621,413 (3,743,996) -
As at 28 February 2010Current Assets 2,052,662 1,349,588 279,209 1,550 3,683,009 Current Liabilities - - - (3,683,009) (3,683,009)
Interest sensitivity gap - - - (3,681,459) -
Less than 1 month - Over Non InterestThe Sterling Fund 1 month 3 months 3 months Bearing TotalAs at 28 February 2011 GBP ‘000 GBP ‘000 GBP ‘000 GBP ‘000 GBP ‘000
Current Assets 709,797 583,540 180,245 862 1,474,444 Current Liabilities - - - (1,474,444) (1,474,444)
Interest sensitivity gap 709,797 583,540 180,245 (1,473,582) -
As at 28 February 2010Current Assets 603,298 446,234 - 2,093 1,051,625 Current Liabilities - - - (1,051,625) (1,051,625)
Interest sensitivity gap 603,298 446,234 - (1,049,532) -
Less than 1 month - Over Non InterestThe Euro Fund 1 month 3 months 3 months Bearing TotalAs at 28 February 2011 EUR ‘000 EUR ‘000 EUR ‘000 EUR ‘000 EUR ‘000
Current Assets 368,300 336,484 99,216 3,874 807,874 Current Liabilities - - - (807,874) (807,874)
Interest sensitivity gap 368,300 336,484 99,216 (804,000) -
As at 28 February 2010Current Assets 789,542 434,428 122,061 2,018 1,348,049 Current Liabilities - - - (1,348,049) (1,348,049)
Interest sensitivity gap 789,542 434,428 122,061 (1,346,031) -
Less than 1 month - Over Non InterestThe Canadian Dollar Fund 1 month 3 months 3 months Bearing TotalAs at 28 February 2011 CAD ‘000 CAD ‘000 CAD ‘000 CAD ‘000 CAD ‘000
Current Assets 34,312 11,980 1,001 53 47,346 Current Liabilities - - - (47,346) (47,346)
Interest sensitivity gap 34,312 11,980 1,001 (47,293) -
As at 28 February 2010Current Assets 26,509 14,293 997 5 41,804 Current Liabilities - - - (41,804) (41,804)
Interest sensitivity gap 26,509 14,293 997 (41,799) -
23
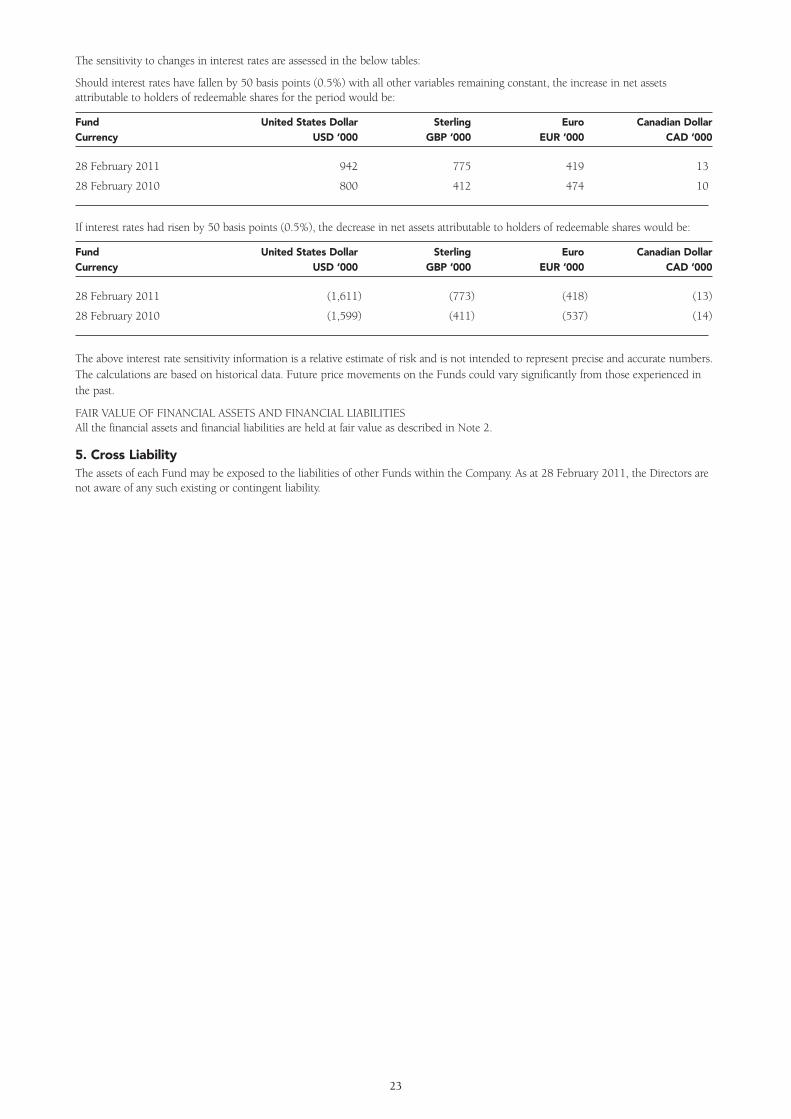
The sensitivity to changes in interest rates are assessed in the below tables:
Should interest rates have fallen by 50 basis points (0.5%) with all other variables remaining constant, the increase in net assetsattributable to holders of redeemable shares for the period would be:
Fund United States Dollar Sterling Euro Canadian DollarCurrency USD ‘000 GBP ‘000 EUR ‘000 CAD ‘000
28 February 2011 942 775 419 13
28 February 2010 800 412 474 10
If interest rates had risen by 50 basis points (0.5%), the decrease in net assets attributable to holders of redeemable shares would be:
Fund United States Dollar Sterling Euro Canadian DollarCurrency USD ‘000 GBP ‘000 EUR ‘000 CAD ‘000
28 February 2011 (1,611) (773) (418) (13)
28 February 2010 (1,599) (411) (537) (14)
The above interest rate sensitivity information is a relative estimate of risk and is not intended to represent precise and accurate numbers.The calculations are based on historical data. Future price movements on the Funds could vary significantly from those experienced inthe past.
FAIR VALUE OF FINANCIAL ASSETS AND FINANCIAL LIABILITIESAll the financial assets and financial liabilities are held at fair value as described in Note 2.
5. Cross LiabilityThe assets of each Fund may be exposed to the liabilities of other Funds within the Company. As at 28 February 2011, the Directors arenot aware of any such existing or contingent liability.

Statement of Changes in InvestmentsFor the six month period ended 28 February 2011 (unaudited)
THE UNITED STATES DOLLAR FUND Major purchases for Major sales forthe period ended the period ended
Security 28 February 2011 28 February 2011USD ‘000 USD ‘000
Natixis 0.36% 01/11/2010 180,000 Rabobank Nederland 0.31% 18/04/2011 108,000 Bank of Tokyo-Mitsubishi 29/11/2010 100,000 Kreditanstalt Für Wiederaufbau 0.3% 20/12/2010 100,000 ABN AMRO Bank 0.3% 21/12/2010 100,000 Sumitomo Mitsui Banking Corp. 23/12/2010 100,000 Nederlandse Waterschapsbank 0.3% 14/01/2011 100,000 Banco Bilbao Vizcaya Argentaria 0.32% 05/10/2010 90,000 BP Capital Markets 0.34% 07/10/2010 90,000 KBC Bank 15/10/2010 90,000 Rabobank Nederland 0.37% 19/10/2010 90,000 Bank of Tokyo-Mitsubishi 20/10/2010 90,000 Landwirtschaftliche Rentenbank 0.3% 21/10/2010 90,000 Banesto Financial Products 0.45% 22/10/2010 90,000 Banesto Financial Products 0.54% 28/10/2010 90,000 Banco Bilbao Vizcaya Argentaria 0.3% 19/11/2010 90,000 Credit Suisse 0.29% 23/11/2010 90,000 Intesa Sanpaolo Bank 0.51% 30/11/2010 90,000 Société Générale 0.295% 01/12/2010 90,000 Bank Nederlandse Gemeenten 0.345% 06/12/2010 90,000 Kreditanstalt Für Wiederaufbau 0.3% 20/12/2010 100,000 Natixis 0.33% 01/10/2010 90,000 Banesto Financial Products 0.45% 22/10/2010 90,000 Banque Fédérative du Crédit Mutuel 0.48% 09/11/2010 90,000 Bank Nederlandse Gemeenten 0.345% 06/12/2010 90,000 Caisse des Dépôts et Consignations 0.34% 09/12/2010 90,000 Kingdom of Netherlands 0.29% 09/12/2010 90,000 Banque Fédérative du Crédit Mutuel 0.455% 05/01/2011 90,000 ING Bank 0.3% 10/01/2011 90,000 Republic of Austria 0.32% 04/02/2011 90,000 Landeskreditbank Baden-Württemberg 0.345% 14/02/2011 90,000 Banque Fédérative du Crédit Mutuel 0.5% 02/03/2011 90,000 Société Générale 0.36% 04/03/2011 90,000 Banesto Financial Products 0.46% 29/10/2010 80,000 DZ Bank 22/11/2010 80,000 DZ Bank 0.38% 06/01/2011 80,000 Bank Nederlandse Gemeenten 0.32% 28/02/2011 80,000 Rabobank Nederland 0.35% 24/02/2011 79,000 Bank of Tokyo-Mitsubishi 20/10/2010 65,000 Banque Fédérative du Crédit Mutuel 0.38% 26/11/2010 65,000
24

Statement of Changes in InvestmentsFor the six month period ended 28 February 2011 (unaudited)
THE STERLING FUND Major purchases for Major sales forthe period ended the period ended
Security 28 February 2011 28 February 2011GBP ‘000 GBP ‘000
GE Capital UK Funding 0.52% 10/01/2011 80,000GE Capital UK Funding 0.52% 11/01/2011 80,000GE Capital UK Funding 0.52% 14/01/2011 80,000GE Capital UK Funding 0.52% 31/01/2011 78,000GE Capital UK Funding 0.52% 03/02/2011 72,200GE Capital UK Funding 0.52% 04/02/2011 72,200GE Capital UK Funding 0.52% 28/01/2011 70,000GE Capital UK Funding 0.52% 12/01/2011 60,000GE Capital UK Funding 0.52% 13/01/2011 60,000GE Capital UK Funding 0.52% 27/01/2011 60,000GE Capital UK Funding 0.52% 24/12/2010 50,500Intesa Sanpaolo Bank 0.5% 08/10/2010 50,000GE Capital UK Funding 0.53% 21/10/2010 50,000GE Capital UK Funding 0.53% 22/10/2010 50,000GE Capital UK Funding 0.52% 23/12/2010 50,000GE Capital UK Funding 0.52% 06/01/2011 50,000GE Capital UK Funding 0.52% 07/01/2011 50,000GE Capital UK Funding 0.52% 18/01/2011 50,000GE Capital UK Funding 0.52% 01/02/2011 50,000GE Capital UK Funding 0.52% 02/02/2011 50,000Landeskreditbank Baden-Württemberg 0.71% 16/05/2011 45,000Banque Fédérative du Crédit Mutuel 0.85% 05/01/2011 35,000Caisse des Dépôts et Consignations 0.64% 10/01/2011 35,000Nordea Bank 14/01/2011 35,000HSBC Bank 0.78% 15/03/2011 35,000Nordea Bank 0.745% 22/03/2010 35,000Caisse des Dépôts et Consignations 0.765% 04/04/2011 35,000ING Bank 01/03/2011 31,000Caisse des Dépôts et Consignations 0.62% 03/12/2010 30,000National Australia Bank 0.6% 17/12/2010 30,000Société Générale 0.69% 04/01/2011 30,000Kingdom of Belgium 0.7% 06/01/2011 30,000ING Bank 12/01/2011 30,000Agence Centrale des Organismes de Sécurité Sociale 0.64% 21/01/2011 30,000North Rhine-Westphalia Bank 0.635% 31/01/2011 30,000Société Générale 01/02/2011 30,000Natixis 0.65% 11/02/2011 30,000Royal Park Investments 0.72% 17/02/2011 30,000Landeskreditbank Baden-Württemberg 0.651% 22/02/2010 30,000Société Générale 0.62% 16/03/2011 30,000
25

Statement of Changes in InvestmentsFor the six month period ended 28 February 2011 (unaudited)
THE EURO FUND Major purchases for Major sales forthe period ended the period ended
Security 28 February 2011 28 February 2011EUR ‘000 EUR ‘000
Banco Bilbao Vizcaya Argentaria 0.62% 15/10/2010 88,500 Toyota Motor Finance 0.4% 25/11/2010 56,800 BP Capital Markets 0.32% 30/09/2010 50,000 Toyota Motor Finance 0.37% 26/11/2010 50,000 Toyota Motor Finance 0.55% 10/12/2010 50,000 Toyota Motor Finance 0.55% 13/12/2010 50,000 Toyota Motor Finance 0.5% 14/12/2010 50,000 Toyota Motor Finance 0.46% 15/12/2010 50,000 Toyota Motor Finance 0.32% 09/09/2010 46,800 Toyota Motor Finance 0.32% 10/09/2010 46,400 BP Capital Markets 0.34% 29/09/2010 40,000 Toyota Motor Finance 0.62% 02/11/2010 40,000 Toyota Motor Finance 0.7% 08/12/2010 40,000 Toyota Motor Finance 0.75% 03/02/2011 40,000 Toyota Motor Finance 0.68% 16/02/2011 40,000 Crédit Agricole 01/04/2011 40,000 Toyota Motor Finance 0.32% 13/09/2010 37,000 Toyota Motor Finance 0.64% 17/02/2011 35,000 Toyota Motor Finance 0.46% 21/02/2011 35,000 KBC Bank 15/09/2010 30,000 Banco Bilbao Vizcaya Argentaria 0.62% 15/10/2010 60,000Banque Fédérative du Crédit Mutuel 0.955% 01/03/2011 30,000Rabobank Nederland 0.81% 24/03/2011 30,000Banque Fédérative du Crédit Mutuel 0.86% 14/01/2011 26,000BNP Paribas 13/09/2010 25,000HSBC France 28/09/2010 25,000Intesa Sanpaolo Bank 0.53% 05/10/2010 25,000Banco Bilbao Vizcaya Argentaria 0.5% 06/10/2010 25,000Intesa Sanpaolo Bank 0.53% 11/10/2010 25,000Rabobank Nederland 0.48% 12/10/2010 25,000Landesbank Hessen-Thüringen 0.46% 13/10/2010 25,000Nordea Bank 0.58% 19/10/2010 25,000Banesto Financial Products 0.65% 22/10/2010 25,000Société Générale 0.52% 02/11/2010 25,000Natixis 0.685% 08/11/2010 25,000Banque Fédérative du Crédit Mutuel 0.77% 11/11/2010 25,000ING Bank 0.87% 12/11/2010 25,000DnB NOR Boligkreditt 4.375% 15/11/2010 25,000Crédit Agricole 16/11/2010 25,000Stadshypotek 0.64% 24/11/2010 25,000
26
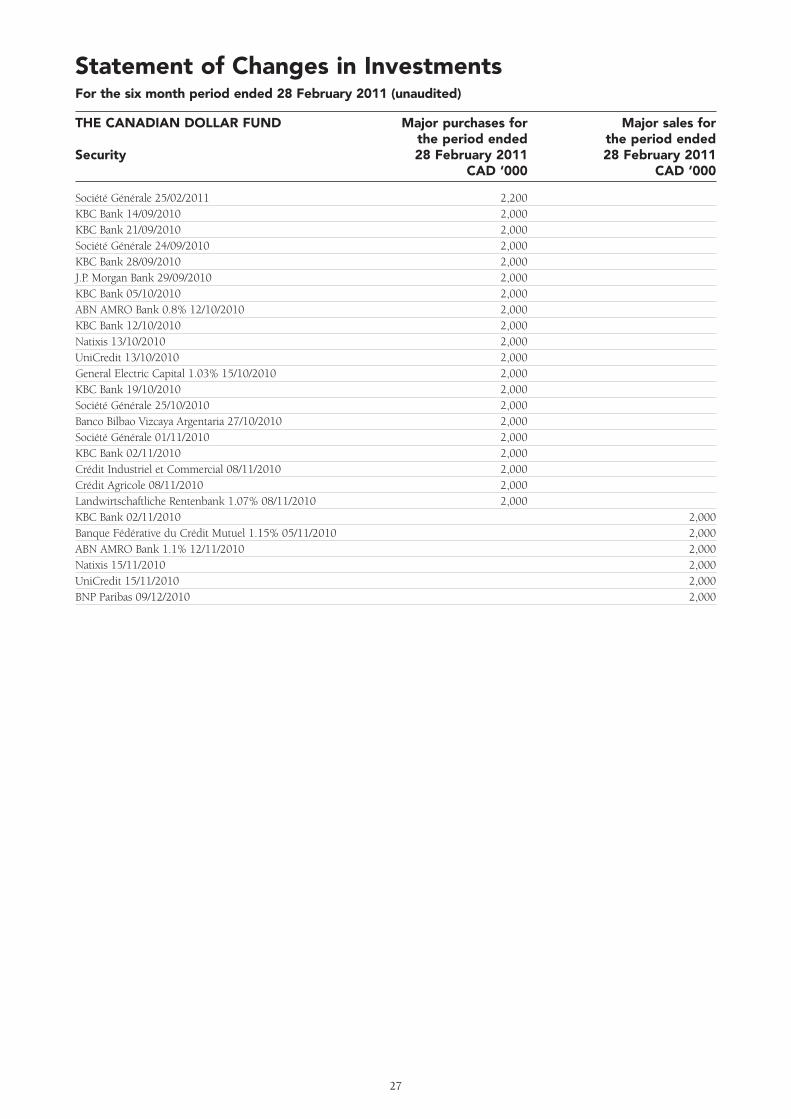
Statement of Changes in InvestmentsFor the six month period ended 28 February 2011 (unaudited)
THE CANADIAN DOLLAR FUND Major purchases for Major sales forthe period ended the period ended
Security 28 February 2011 28 February 2011CAD ‘000 CAD ‘000
Société Générale 25/02/2011 2,200KBC Bank 14/09/2010 2,000KBC Bank 21/09/2010 2,000Société Générale 24/09/2010 2,000KBC Bank 28/09/2010 2,000J.P. Morgan Bank 29/09/2010 2,000KBC Bank 05/10/2010 2,000ABN AMRO Bank 0.8% 12/10/2010 2,000KBC Bank 12/10/2010 2,000Natixis 13/10/2010 2,000UniCredit 13/10/2010 2,000General Electric Capital 1.03% 15/10/2010 2,000KBC Bank 19/10/2010 2,000Société Générale 25/10/2010 2,000Banco Bilbao Vizcaya Argentaria 27/10/2010 2,000Société Générale 01/11/2010 2,000KBC Bank 02/11/2010 2,000Crédit Industriel et Commercial 08/11/2010 2,000Crédit Agricole 08/11/2010 2,000Landwirtschaftliche Rentenbank 1.07% 08/11/2010 2,000KBC Bank 02/11/2010 2,000Banque Fédérative du Crédit Mutuel 1.15% 05/11/2010 2,000ABN AMRO Bank 1.1% 12/11/2010 2,000Natixis 15/11/2010 2,000UniCredit 15/11/2010 2,000BNP Paribas 09/12/2010 2,000
27

28
CIRL0171
Directory
FIDELITY INSTITUTIONAL LIQUIDITY FUND plc ADMINISTRATOR, REGISTRAR & SECRETARY
Registered Office FIL Fund Management (Ireland) Limited
First Floor First Floor
Marconi House Marconi House
Digges Lane Digges Lane
Dublin 2 Dublin 2
Ireland Ireland
INVESTMENT MANAGER GENERAL DISTRIBUTOR
FIL Investments International FIL Distributors
Oakhill House Pembroke Hall
130 Tonbridge Road 42 Crow Lane
Hildenborough Pembroke HM19
Kent TN11 9DZ Bermuda
United Kingdom
MANAGER SPONSORING BROKER
FIL Fund Management (Ireland) Limited J & E Davy
First Floor Davy House
Marconi House 49 Dawson Street
Digges Lane Dublin 2
Dublin 2 Ireland
Ireland
INDEPENDENT AUDITORS LEGAL ADVISOR
PricewaterhouseCoopers Dillon Eustace Solicitors
One Spencer Dock 33 Sir John Rogerson’s Quay
North Wall Quay Dublin 2
Dublin 1 Ireland
Ireland
CUSTODIAN & TRUSTEE
J.P. Morgan Bank (Ireland) plc
JPMorgan House
International Financial Services Centre
Dublin 1
Ireland

F I D E L I T Y I N S T I T U T I O N A L L I Q U I D I T Y F U N D p l c
Fidelity, Fidelity International and the Pyramid Logo are trademarks of FIL Limited