half-year review 2011 - zonebourse.com€¦ · half-year review of operations ... martin bouygues ....
TRANSCRIPT

30 August 2011
32 Hoche - Paris
HALF-YEAR REVIEW
2011
BUILDING THE FUTURE IS OUR GREATEST ADVENTURE
French société anonyme with share capital of €365,862,523 - Registered office: 32, avenue Hoche, 75008 Paris, France Registration No. 572 015 246 Paris - I.E. FR 29 572 015 246

BOUYGUES/2011 Half-year review
CONTENTS
Board of Directors ......................................................................................................... 2 Half-year review of operations ..................................................................................... 3 Condensed consolidated first-half financial statements ............................................ 31 Certificate of responsibility .......................................................................................... 58 Auditors' report on the first-half financial statements ................................................ 59
1

BOUYGUES/2011 Half-year review Board of Directors
BOARD OF DIRECTORS
MEMBERSHIP Chairman and Chief Executive Officer Martin Bouygues Director and Deputy CEO Olivier Bouygues Deputy CEO and standing representative of SCDM, director Directors Pierre Barberis Former Deputy CEO, Oberthur Patricia Barbizet CEO and director, Artémis François Bertière Chairman and CEO, Bouygues Immobilier Mrs Francis Bouygues Georges Chodron de Courcel COO, BNP Paribas Lucien Douroux Former Chairman of the Supervisory Board, Crédit Agricole Indosuez Yves Gabriel Chairman and CEO, Bouygues Construction Patrick Kron Chairman and CEO, Alstom Non-voting director Alain Pouyat BOARD COMMITTEES Accounts Committee Helman le Pas de Sécheval (Chairman) Patricia Barbizet Georges Chodron de Courcel Selection Committee Jean Peyrelevade (Chairman) François-Henri Pinault
Hervé Le Bouc Chairman and CEO, Colas Helman le Pas de Sécheval Managing Director, Groupama Centre Atlantique Colette Lewiner Deputy Chairwoman, Capgemini Sandra Nombret Director representing employee shareholders Nonce Paolini Chairman and CEO, TF1 Jean Peyrelevade Chairman of the Board of Directors, Leonardo & Co. François-Henri Pinault Chairman and CEO, PPR Michèle Vilain Director representing employee shareholders Remuneration Committee Pierre Barberis (Chairman) Patricia Barbizet Ethics and Sponsorship Committee Lucien Douroux (Chairman) François-Henri Pinault
2
BOUYGUES/2011 Half-year review Half-year review of operations 3
HALF-YEAR REVIEW OF OPERATIONS
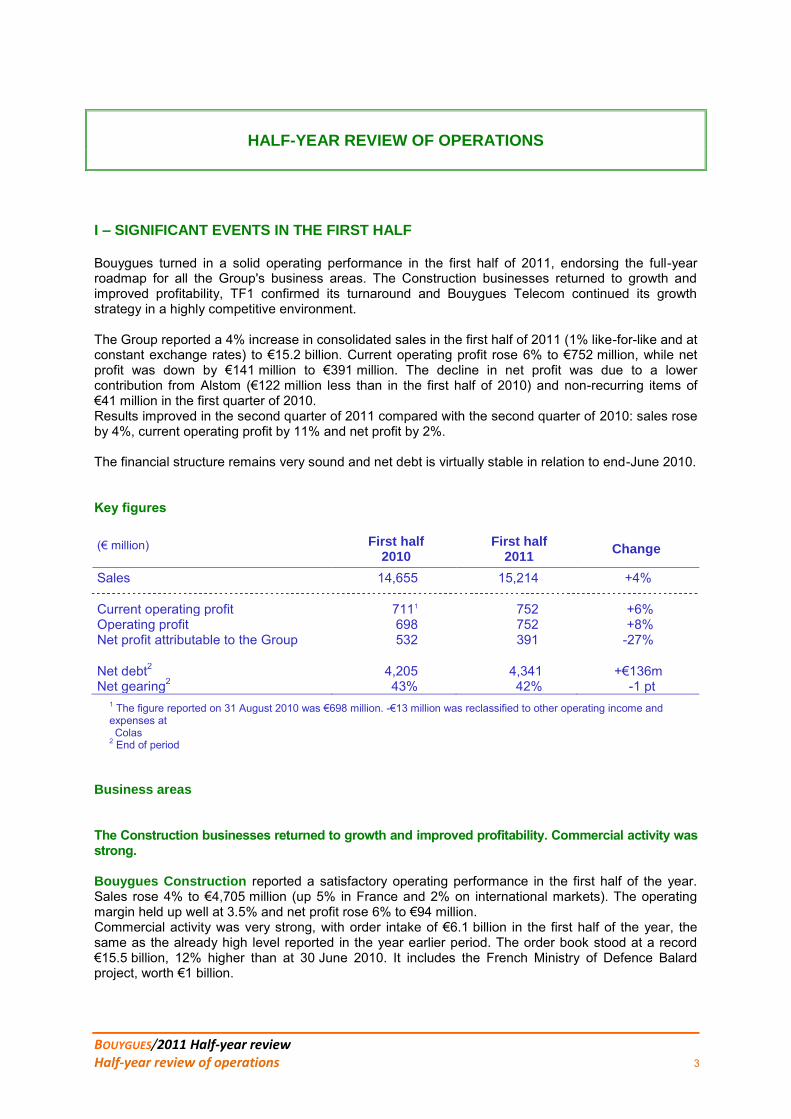
I – SIGNIFICANT EVENTS IN THE FIRST HALF Bouygues turned in a solid operating performance in the first half of 2011, endorsing the full-year roadmap for all the Group's business areas. The Construction businesses returned to growth and improved profitability, TF1 confirmed its turnaround and Bouygues Telecom continued its growth strategy in a highly competitive environment. The Group reported a 4% increase in consolidated sales in the first half of 2011 (1% like-for-like and at constant exchange rates) to €15.2 billion. Current operating profit rose 6% to €752 million, while net profit was down by €141 million to €391 million. The decline in net profit was due to a lower contribution from Alstom (€122 million less than in the first half of 2010) and non-recurring items of €41 million in the first quarter of 2010. Results improved in the second quarter of 2011 compared with the second quarter of 2010: sales rose by 4%, current operating profit by 11% and net profit by 2%. The financial structure remains very sound and net debt is virtually stable in relation to end-June 2010. Key figures
(€ million)
First half 2010
First half 2011
Change
Sales 14,655 15,214 +4%
Current operating profit 7111 752 +6% Operating profit 698 752 +8% Net profit attributable to the Group 532 391 -27%
Net debt2 4,205 4,341 +€136m Net gearing2 43% 42% -1 pt
1 The figure reported on 31 August 2010 was €698 million. -€13 million was reclassified to other operating income and expenses at Colas
2 End of period Business areas The Construction businesses returned to growth and improved profitability. Commercial activity was strong. Bouygues Construction reported a satisfactory operating performance in the first half of the year. Sales rose 4% to €4,705 million (up 5% in France and 2% on international markets). The operating margin held up well at 3.5% and net profit rose 6% to €94 million. Commercial activity was very strong, with order intake of €6.1 billion in the first half of the year, the same as the already high level reported in the year earlier period. The order book stood at a record €15.5 billion, 12% higher than at 30 June 2010. It includes the French Ministry of Defence Balard project, worth €1 billion.

BOUYGUES/2011 Half-year review Half-year review of operations
First-half results at Bouygues Immobilier were in line with the company's full-year roadmap. Sales declined 16% to €1,098 million. Commercial property sales were down 47% squeezed by a tough comparative with the first half of 2010. Residential property sales dropped 6% overall in the first six months but started to rise again in the second quarter. The current operating margin and net profit remained stable at 8.3% and €56 million respectively. After a record year in 2010, residential property reservations remained high at €990 million. Commercial property reservations rose sharply to €324 million in a still hesitant market. Overall, reservations were up 6% on the first half of 2010 at €1,314 million. The order book was 18% higher than at end-June 2010 at €2.5 billion.
At Colas, the gradual improvement in profitability was confirmed in the first half of 2011. Sales were up 8% to €5,400 million (up 15% in France and down 3% on international markets). After benefiting from favourable weather conditions in France in the first quarter, sales remained robust in the second quarter. As expected, current operating profit improved – it was €34 million higher than in the first half of 2010 – as the positive effects of the action plan introduced in 2010 began to show. Net profit amounted to €2 million, €31 million up on the first half of 2010. Good business activity in the first half of 2011 kept the order book at a high level of €7.2 billion (the same as at end-June 2010), despite sales growth. TF1 put in a very good first half and confirmed its turnaround. Sales at TF1 were virtually stable at €1,278 million. The current operating margin improved substantially to 14.6%, 6.5 points more than in the first half of 2010, and net profit rose 61% to €119 million as TF1 confirmed its capacity to closely manage costs and adapt its business model. Standard & Poor’s raised TF1's credit rating to BBB+ with a stable outlook, reflecting the company's healthy financial structure. Bouygues Telecom continued its growth strategy in a highly competitive environment and performed in line with its expectations. Bouygues Telecom reported a 5% increase in first-half sales to €2,866 million and a 3% rise in sales from network to €2,575 million. As anticipated, EBITDA remained stable stripping out the effect of the cut in mobile termination rate differentials, despite fierce competitive pressure. EBITDA amounted to €665 million, down 9%, and net profit to €213 million, down 19%. In a very brisk mobile phone market, Bouygues Telecom signed up 206,000 new mobile contract customers in the first half of 2011, representing 21% of net market growth1. Bouygues Telecom had a total customer base of 11,187,000 at 30 June 2011, 80% of them on mobile call plans, a 1.3-point rise over a 12-month period. On 18 July 2011, the operator innovated once again by launching the new B&YOU service, a mobile plan that targets the “internet generation”. 215,000 new fixed broadband customers joined Bouygues Telecom in the first half of 20112, giving a total of 1,023,000 fixed broadband customers at 30 June 2011. 1 Arcep (French communications regulator) data 2 Including broadband and very-high-speed subscribers. Alstom Alstom contributed €94 million to the Group's first-half net profit, compared with €216 million in the first half of 2010. As announced, after a first quarter severely hit by non-recurring expenses taken by Alstom in the second half of FY2010/2011, Alstom contributed €71 million to Group net profit in the second quarter of 2011 (versus €101 million in the second quarter of 2010). Carrying on from the second half of FY2010/2011, Alstom recorded strong growth in its order intake in the first quarter of FY2011/2012 and confirmed its operating margin target of between 7% and 8% for FY2011/2012.
4

BOUYGUES/2011 Half-year review Half-year review of operations
Financial position Cash flow increased slightly to €1,502 million, in line with the rise in operating profit. As anticipated, net capital expenditure rose to €651 million, €150 million more than in the first half of 2010, generating free cash flow1 of €494 million. Group net debt was virtually stable in relation to end-June 2010 at €4.3 billion. 1 Before the change in working capital requirement Cancellation of shares The Board of Directors decided to cancel 9,973,287 shares, 5,153,093 of which were acquired in the first half of 2011. Following the cancellation, the number of shares stood at 356,307,709 and voting rights at 479,801,903. Sales target Sales by business area
(€ million)
2010 actual
2011 target
% change
Reported in March
Reported in May
Reported in August
Bouygues Construction 9,235 9,400 9,600 9,600 +4% Bouygues Immobilier 2,418 2,440 2,440 2,440 +1% Colas 11,661 11,800 11,800 11,900 +2% TF1 2,622 2,630 2,630 2,630 = Bouygues Telecom 5,636 5,730 5,730 5,730 +2% Holding company and other 132 120 120 120 nm
Intra-Group elimination (479) (420) (420) (420) nm
TOTAL 31,225 31,700 31,900 32,000 +2% o/w France 21,576
1 22,000 22,100 22,400 +4%
o/w international 9,6491 9,700 9,800 9,600 -1%
1 Following the change in status of Mayotte that has become a French department, sales were reclassified to France
5

BOUYGUES/2011 Half-year review Half-year review of operations
Condensed consolidated income statement
(€ million) First half %
change 2010 2011
Sales 14,655 15,214 +4% Current operating profit 7111 752 +6% Operating profit 698 752 +8% Cost of net debt (162) (134) -17% Other financial income and expenses 36 (2) nm Income tax expense (204) (223) +9% Share of profits and losses from associates 237 91 -62% Net profit 605 484 -20% Minority interests (73) (93) +27% Net profit attributable to the Group 532 391 -27%
1 The figure reported on 31 August 2010 was €698 million. -€13 million was reclassified to other operating income and expenses at Colas
First-quarter consolidated income statement
(€ million)
First quarter
% change
2010 2011 Sales 6,443 6,686 +4%
Current operating profit 1701 153 -10% Operating profit 162 153 -6%
Net profit attributable to the Group 181 34 -81%
1 The figure reported on 1 June 2010 was €162 million. -€8 million was reclassified to other operating income and expenses at Colas
Second-quarter consolidated income statement
(€ million)
Second quarter
% change
2010 2011 Sales 8,212 8,528 +4%
Current operating profit 5411 599 +11% Operating profit 536 599 +12%
Net profit attributable to the Group 351 357 +2%
1 The figure reported on 31 August 2010 was €536 million. -€5 million was reclassified to other operating income and expenses at Colas
6

BOUYGUES/2011 Half-year review Half-year review of operations
Sales by business area
(€ million)
First half
% change
Change like-for-like and at
constant exchange
rates
2010
2011
Bouygues Construction 4,530 4,705 +4% +1% Bouygues Immobilier 1,313 1,098 -16% -16% Colas 5,002 5,400 +8% +4% TF1 1,285 1,278 -1% -4% Bouygues Telecom 2,732 2,866 +5% +5% Holding company and other 70 64 nm nm
Intra-Group elimination (277) (197) nm nm
Total 14,655 15,214 +4% +1%
o/w France 10,4011 11,064 +6% +4% o/w international 4,2541 4,150 -2% -6%
1 Following the change in status of Mayotte that has become a French department, sales were reclassified to France Contribution of business areas to EBITDA
(€ million)
First half
% change
2010 2011
Bouygues Construction 307 252 -18% Bouygues Immobilier 91 86 -5% Colas 1481 190 +28% TF1 123 234 +90% Bouygues Telecom 734 665 -9% Holding company and other (19) (19) nm TOTAL 1,3841 1,408 +2%
1 The figure reported on 31 August 2010: €1,378 million for the Group and €142 million for Colas.-€6 million was reclassified to other operating income and expenses at Colas
Contribution of business areas to Current operating profit
(€ million)
First half
% change
2010 2011
Bouygues Construction 144 165 +15% Bouygues Immobilier 109 91 -17% Colas (34)1 0 nm TF1 104 187 +80% Bouygues Telecom 409 331 -19% Holding company and other (21) (22) nm TOTAL 7111 752 +6%
1 The figure reported on 31 August 2010: €698 million for the Group and -€47 million for Colas. -€13 million was reclassified to other operating income and expenses at Colas
7

BOUYGUES/2011 Half-year review Half-year review of operations
Contribution of business areas to Net profit attributable to the Group
(€ million)
First half
% change
2010 2011
Bouygues Construction 89 94 +6% Bouygues Immobilier 56 56 = Colas (28) 2 nm TF1 32 51 +59% Bouygues Telecom 237 191 -19% Alstom 216 94 -56% Holding company and other (70) (97) nm TOTAL 532 391 -27%
Net cash by business area
(€ million)
At end-June
Change €m
2010 2011
Bouygues Construction 2,922 2,236 -€686m Bouygues Immobilier 58 390 +€332m Colas (952) (1,046) -€94m TF1 (120) 11 +€131m Bouygues Telecom (505) (619) -€114m Holding company and other (5,608) (5,313) +€295m TOTAL (4,205) (4,341) -€136m
Contribution of business areas to Cash flow
(€ million)
First half
% change
2010 2011
Bouygues Construction 245 260 +6% Bouygues Immobilier 97 94 -3% Colas 164 220 +34% TF1 132 220 +67% Bouygues Telecom 715 659 -8% Holding company and other 104 49 nm TOTAL 1,457 1,502 +3%
8

BOUYGUES/2011 Half-year review Half-year review of operations
Contribution of business areas to Net capital expenditure
(€ million)
First half
% change
2010 2011
Bouygues Construction 114 121 +6% Bouygues Immobilier 1 4 x4 Colas 135 159 +18% TF1 21 18 -14% Bouygues Telecom 227 348 +53% Holding company and other 3 1 nm TOTAL 501 651 +30%
9

BOUYGUES/2011 Half-year review Half-year review of operations
Bouygues share ownership structure at 30 June 2011 Capital
Voting rights
10

BOUYGUES/2011 Half-year review Half-year review of operations
Bouygues Construction
Bouygues Construction is a world leader in building, civil works, energy and services. Combining the strength of a large group with the responsiveness of a network of companies, its know-how includes project financing, design, construction, operation and maintenance. Key figures
(€ million) H1
Change 2010 2011
Sales o/w France o/w International
4,530 2,538 1,992
4,705 2,665 2,040
+4% +5% +2%
Operating profit 144 165 +15% Net profit attributable to the Group 89 94 +6%
Half-year highlights Bouygues Construction took orders worth a very satisfactory €6,134 million in the first half of 2011, stable in relation to the same period of the previous year (€6,105 million, i.e. an increase of €29 million). The order intake in France, up €864 million to €3,744 million, includes the Balard project, which involves the financing, design and construction of a new Defence Ministry complex in Paris, plus a 30-year operation and maintenance contract. International orders, down €835 million at €2,390 million, include the €464-million order book of Leadbitter, a British building firm acquired at the end of 2010. For information, the international order intake in the first half of 2010 included five projects worth over €300 million each. The order intake in the first half of 2011 includes long-term contracts (more than five years) worth €676 million for ETDE, compared with €568 million in the first half of 2010. The order book at 30 June 2011 amounted to €15.5 billion, another record and 12% higher than at end-June 2010. 52% of orders are on international markets, compared with 54% at 30 June 2010. The order book gives increasing visibility, since the share of orders at more than two years rose by 19% over the preceding 12 months to €5.6 billion. Overall sales in the first half of 2011 increased 4% to €4,705 million, rising by 5% in France to €2,665 million and by 2% on international markets to €2,040 million. Like-for-like and at constant exchange rates, the increase was 1%, taking account of the inclusion of Leadbitter and a positive exchange-rate effect mainly due to the appreciation of the Swiss franc. Operating profit rose €21 million to €165 million, representing 3.5% of sales compared with 3.2% in the first half of 2010. Although interest rates on surplus cash remained very low, net financial income rose by €4 million to €20 million. The net margin at end-June 2011 was 2.0%, the same as at end-June 2010, giving a net profit of €94 million. After the financing of capital expenditure and payment of the dividend in April 2011, the cash position net of financial debt stood at €2,236 million, down €620 million on end-December 2010.
11

BOUYGUES/2011 Half-year review Half-year review of operations
BUILDING AND CIVIL WORKS The Building and Civil Works activity generated €3,959 million, including €2,145 million in France and €1,814 million on international markets. France Sales in France in the first half of 2011 amounted to €2,145 million, 5% more than in the first half of 2010. Bouygues Bâtiment Ile-de-France, the leader on its market, is involved in numerous renovation and construction projects, including public buildings such as the Paris Philharmonic Hall in La Villette and the National Archives in Pierrefitte to the north of Paris, residential complexes and office buildings. Two major projects were delivered in the first half of the year: Tour First in La Défense, the biggest renovation project in France with HQE® High Environmental Quality certification, and a new shopping centre in Aubervilliers, to the north of Paris. The five regional subsidiaries of Bouygues Entreprises France Europe operate in both the building and civil works sectors in France. They are particularly involved in the construction of public infrastructure for healthcare (Amiens-Picardie hospital and the new regional hospital at Orléans), justice (a new prison in Réau, near Lille, is scheduled for delivery in the second half of the year), education and leisure (reconfiguration of the existing Stade Vélodrome in Marseille which will remain in operation throughout the works). Bouygues Travaux Publics and DTP Terrassement are involved in civil engineering work for the Flamanville EPR nuclear power plant, the largest ongoing construction project in Europe. Europe (except France) Sales in Europe (except France) amounted to €797 million in the first half of 2011, 1% down on the previous year. In the United Kingdom, Bouygues UK is involved in PFI (Private Finance Initiative) and Design & Build projects in the London area. Warings, which operates in the south of England, benefits from a diversified portfolio of activities. Bouygues Construction strengthened its regional coverage at the end of 2010 with the acquisition of an interest in Leadbitter, an Oxford-based building firm with operations throughout the south of England. Bouygues Travaux Publics is completing a new tunnel under the River Tyne at Newcastle in the framework of a concession agreement. In Switzerland, Bouygues Construction is taking advantage of its expertise in putting together complex property development projects. Losinger Construction is basing its expansion in the German-speaking part of the country on its subsidiary Marazzi. In Croatia, Bouygues Travaux Publics in partnership with DTP Terrassement is completing the widening of the Istria motorway. In Ukraine, Bouygues Travaux Publics, with other partners, is building the new Chernobyl confinement shelter, which will ultimately enable the damaged reactor to be dismantled. In Eastern Europe, subsidiaries in Poland and the Czech Republic are continuing to expand their building activities.
12

BOUYGUES/2011 Half-year review Half-year review of operations
In Finland, Bouygues Travaux Publics has completed civil engineering work on the Olkiluoto EPR nuclear power plant for Areva. Bouygues Construction also has smaller-scale operations in Hungary, Russia, Spain and Portugal. International (except Europe) Sales on international markets (except Europe) in the first half of 2011 amounted to €1,017 million, up 9% on the previous year. In Asia-Pacific, Bouygues Construction has strong local operations in Hong Kong, Singapore, Turkmenistan and Thailand. Dragages Hong Kong is involved in building projects including the civil aviation headquarters and Kai Tak Cruise Terminal, civil works (two sections of tunnel for the future high-speed rail link between Hong Kong and Canton) and electrical and HVAC engineering through a specialist subsidiary, BYME. In Singapore, work has started on the Sports Hub, the world's largest sports PPP project. In South Korea, Bouygues Travaux Publics is completing work on the port at Pusan under a concession agreement. In Africa, Bouygues Construction has operations in several countries. In South Africa, Bouygues Travaux Publics is finishing work on the Gautrain, an 80-km railway link between Johannesburg International Airport, Johannesburg and Pretoria. In Equatorial Guinea, Bouygues Bâtiment Guinée Equatoriale is involved in building, road construction and civil engineering, especially the major Bata motorway project. In Morocco, Bouygues Construction is continuing work on a second container port for Tangiers, Tanger Med 2. In Egypt, Bouygues Travaux Publics is helping to build Cairo's third subway line. In the Middle East, Bouygues Bâtiment International, in partnership with two local firms, is building the QP District in Doha (Qatar), a vast 700,000-sq metre real-estate complex. In Abu Dhabi, VSL is building the first cable-stayed bridge in the United Arab Emirates, linking Hodariyat Island to Abu Dhabi. In the Americas/Caribbean zone, Bouygues Bâtiment International is involved in two PPP projects in Canada: work is nearing completion on Surrey Hospital and has recently started on a headquarters building for the Royal Canadian Mounted Police. In the United States, Bouygues Travaux Publics is continuing work on a tunnel for the port of Miami under a 35-year PPP contract. In Cuba, Bouygues Bâtiment International builds turnkey luxury hotel projects and is currently working on a major tourist complex around a marina at Varadero. ENERGY AND SERVICES ETDE contributed €746 million to Bouygues Construction's consolidated first-half sales, virtually the same as in the first half of 2010. Sales in France amounted to €520 million, compared with €490 million at end-June 2010. A major street-lighting contract in Paris with an energy performance commitment was booked. ETDE also started three new contracts concluded in 2010, including a 20-year contract in Thiais, near Paris, that includes a commitment to reduce electricity consumption by a third. Exprimm, ETDE's facility management subsidiary, is also involved in PPP contracts in partnership with the group's construction subsidiaries. In the first half of the year, with Bouygues Bâtiment Île-de-France, it concluded a maintenance contract for the French Ministry of Defence Balard project. ETDE is the electrical and HVAC engineering contractor
13

BOUYGUES/2011 Half-year review Half-year review of operations
for hospitals in Metz and Amiens. Axione, another ETDE subsidiary specialising in network infrastructure, is involved in 14 public service delegations, representing 7,600 km of optical fibre serving six million people, making it a leading player in the development of broadband and digital networks in France. International sales at end-June 2011 amounted to €226 million, compared with €257 million at end-June 2010. ETDE operates through local subsidiaries that are well-established on their markets in Europe (mainly the UK and Switzerland) and Africa (mainly the Republic of the Congo and Gabon). In Canada, Ecovert FM has a 30-year FM contract for Surrey Hospital and a 25-year contract for the RCMP headquarters. ETDE is also involved in other major international projects, such as the ongoing construction and renovation of 500 km of power lines and substations in the Republic of the Congo for an international oil company. Outlook for 2011 Bouygues Construction's sales target for 2011 is €9.6 billion, up 4% on 2010. With several major projects getting under way, especially in Asia, Bouygues Construction has a relatively clear view of the future and can count on:
secured sales at 30 June 2011 to be executed in the year worth €9.1 billion, covering
95% of forecast sales; sustained activity on international markets (outside Europe), especially in countries
less affected by the economic crisis, such as Hong Kong, Singapore and Qatar;
a long-term order book (more than five years) worth €2.3 billion at 30 June 2011;
a sound financial structure, with a net cash position of €2.2 billion;
an expanding range of sustainable construction products and services, in many cases involving energy and environmental performance commitments.
Tight control over the execution of major projects and a high-quality order intake in a context of fierce competitive pressure will continue to be central priorities for Bouygues Construction. Sales target 2011
(€ million) 2010 2011 target Change
Sales 9,235 9,600 +4%
14

BOUYGUES/2011 Half-year review Half-year review of operations
Bouygues Immobilier Bouygues Immobilier is France's leading property developer, with 34 branches around the country and four subsidiaries elsewhere in Europe. A standard-setter in the ecocity movement, the company develops urban, residential, serviced residence and commercial projects. Key figures
(€ million) H1 Change
2010 2011
Sales 1,313 1,098 -16% o/w Residential 981 923 -6%
o/w Commercial 332 175 -47%
Current operating profit 109 91 -17% Current operating margin 8.3% 8.3% = Net profit attributable to the Group 56 56 = Net cash at end of period1 58 390 +332
1Net cash minus current and non-current financial debt and corresponding financial instruments. Context The housing market slowed in the first half of 2011 after an excellent year in 2010, sustained by historically low interest rates and government stimulus measures, including a doubling of zero-interest loans, the Pass-foncier® scheme for first-time owner-occupiers and tax incentives for investors in buy-to-let properties. The slowdown was attributable to economic uncertainty, a rise (albeit slight) in interest rates and waning interest from investors. The commercial property market was still hesitant despite some signs of picking up again. In this context, Bouygues Immobilier recorded a 6% increase in its order intake to €1,314 million. Sales amounted to €1,098 million, 16% down on the same period in 2010, mainly due to the completion of major commercial property projects. Residential property sales started to rise again in the second quarter. The operating margin remained stable at 8.3% due to good profitability in the residential segment. Sales and results were in line with the roadmap for the year.
15

BOUYGUES/2011 Half-year review Half-year review of operations
Half-year highlights Business performance Reservations
H1 Change 2010 2011
Total in €m Residential
1,243 1,314 +6%
Units 7,320 5,769 -21% Value (€m) 1,175 990 -16%
Commercial Surface area (sq. m) 28,000 83,000 x 3 Value (€m) 68 324 x 5
Residential property Residential property reservations fell back 21% in unit terms, consistent with the overall market trend. However, they remained at a high level after an exceptional year in 2010. In response to falling demand from private investors, Bouygues Immobilier is targeting owner-occupiers, especially first-time buyers, rolling out products at affordable prices. A number of competitively priced projects have been marketed in urban development zones, where the lower 5.5% rate of VAT applies. Benefiting from the leverage generated by enhanced zero-interest loans, these products have proved highly successful. Commercial property In a still-sticky market, commercial property reservations jumped sharply in the first half of 2011 to €324 million. This figure includes the sale to Scor of Green Office® Meudon, the first large-scale positive-energy office building in France, and the conclusion of two property development contracts, one for the co-development with Sogeprom of the D² tower in La Défense and one for the Paris Bar Law School in Issy-les-Moulineaux that will accommodate 1,500 students on completion. Bouygues Immobilier is also pursuing its strategy of becoming a flagship player in sustainable urban development and has recently been named developer of the Wacken eco-community in Strasbourg, France's first positive-energy neighbourhood. Order book
(€ million) End-December 2010
End-June 2011
Order book 2,280 2,537 o/w Residential 2,216 2,337 o/w Commercial 64 200
The order book rose substantially to €2,537 million, including €2,337 million in the residential segment representing 14 months of sales.
16

BOUYGUES/2011 Half-year review Half-year review of operations
Outlook and strategy Bouygues Immobilier expects the residential property market to pick up in the second half of 2011, sustained by stronger demand from private investors who, as in the latter part of 2010, will want to take advantage of the 22% tax break on low-energy buildings before the changes to the scheme announced by the government for 2012, and by the ongoing success of the enhanced zero-interest loan scheme for first-time buyers. With low-energy certification for all its products and its entry-level to mid-range positioning, well-suited to first-time buyers, Bouygues Immobilier intends to continue to increase its share of the residential property market in France over the year as a whole. In the commercial property segment, Bouygues Immobilier is continuing its strategy of controlling risk by developing projects for clearly identified operators. Bouygues Immobilier's objective of preserving a solid financial structure remains unchanged. 2011 sales target
(€ million) 2010 2011 target Change
Sales 2,418 2,440 +1%
17

BOUYGUES/2011 Half-year review Half-year review of operations
Colas
With more than 800 profit centres and 1,400 production units in 40 countries around the world, Colas is a leading player in the roadbuilding and maintenance sectors. Operating in all transport infrastructure markets, the firm offers complementary services including the manufacture and installation of road safety and signalling equipment, civil engineering, pipes and mains, the manufacture and laying of waterproofing membranes, building, and the construction and maintenance of railway infrastructure. Colas also operates infrastructure concessions, especially for motorways. Key figures
(€ million) H1
Change 2010 2010 2011
Sales o/w France o/w International
5,002 3,069 1,933
5,400 3,522 1,878
+8.0% +14.8%
-2.8%
11,661 6,731 4,930
Operating profit/(loss) (47) 0 47 313 Net profit/(loss) attributable to the Group (29) 2 31 224
Contribution to Bouygues' consolidated net profit (28) 2 30 216
Consolidated sales at 30 June 2011 amounted to €5.4 billion compared with €5.0 billion at end-June 2010, an increase of 8.0% (4.1% like-for-like and at constant exchange rates), boosted by a significant increase in business in mainland France and, to a lesser extent, in northern Europe. Half-year highlights
Acquisition of a 50% stake in Gamma Materials Ltd, a Mauritian producer of aggregates, ready-mixed concrete and blocks.
Award of a concession for a 105-km section of the A63 motorway in southwest France.
Good order intake in the first half of the year, with the renewal of railway renovation
contracts in France for the period 2013-2015, a tramway in Tours and airport extensions at Mauritius and Fort McMurray in Canada and Anchorage in Alaska.
€47 million increase in operating profit in comparison with H1 2010, due to:
- better weather conditions than in the first half of 2010, except in North America,
- the first effects of the rightsizing and cost control plans introduced in 2010,
- the stemming of losses in central Europe,
- the absence of non-current operating charges (€13 million in the first half of 2010). France
18

BOUYGUES/2011 Half-year review Half-year review of operations
Sales in France at end-June 2011 were up 14.8% on the same period in the previous year to €3.5 billion. Sales in mainland France in the first half of the year amounted to €3.3 billion, 15.4% higher than at end-June 2010 (9.6% like-for-like). Sales by roads subsidiaries were up 12% on the figure at end-June 2010 due to mild
winter weather which favoured activity in the first quarter, unlike in the previous year. Taking higher construction costs into account, the increase in constant euro terms may be estimated at 7%. Considerable disparities remain in local authority investment, both between regions and between urban and rural areas, and the roads market showed little change from the previous year, with no real sense of direction despite a slight upturn in private investment and numerous public transport projects in urban areas. In this context, and with prices remaining low, there was no let-up in the pressure on margins.
Sales at all non-road subsidiaries were 6.5% higher than at end-June 2010, driven by a
rise in the waterproofing business that offset a decline in the pipes and mains and building segments, with the railway and road safety/signalling businesses remaining stable.
Sales to third parties of refined oil products (basic oils, paraffin and fuel oils) generated
an additional €162 million in relation to end-June 2010 (SRD was acquired on 30 June 2010). Sales to roadbuilding subsidiaries of bitumen produced by SRD are eliminated on consolidation.
In French overseas departments (including Mayotte), sales rose 5% on the back of steady activity in French Guiana and Mayotte and a slight upturn on Réunion, though the market in the Caribbean remained depressed. International International sales amounted to €1.9 billion at 30 June 2011, down 2.8% on 30 June 2010 (-3.6% like-for-like and at constant exchange rates). Sales in North America amounted to €664 million, down slightly by 1.6% on end-June 2010 (-1.2% like-for-like and at constant exchange rates). Adverse weather conditions, especially in Canada but also in the United States, delayed the pickup in activity and affected worksite productivity until May. Sales in northern Europe rose 3% to €548 million. Higher sales in Belgium, Denmark and Switzerland offset a decline in activity in Ireland and the United Kingdom. As expected, sales in central Europe fell by around 20%, with Slovakia, Hungary and Romania the worst affected. Subsidiaries in the rest of the world reported sales of €435 million, the same level as at end-June 2010. Growth in Asia and Australia offset a slight fall in Africa and the Indian Ocean (Madagascar).
19

BOUYGUES/2011 Half-year review Half-year review of operations
Production of materials A significant proportion of Colas' activity, both in France and elsewhere, consists in the production of construction materials, especially aggregates. 46.4 million tonnes of aggregates (-3%), 17.5 million tonnes of asphalt mixes (+1%) and 716,000 tonnes of binders and emulsions (-5%) were produced in the six months to 30 June 2011. Outlook The order book at end-June 2011 amounted to €7.2 billion, practically the same as at end-June 2010. Orders in mainland France amounted to €3.6 billion, 1% higher than at end-June 2010. Orders in French overseas departments and on international markets remained stable, also at €3.6 billion. The high level of orders, despite robust activity in the first six months, bodes well for the second half of the year. For 2011 as a whole: activity in mainland France is expected to increase by over 5%, with sales in overseas
departments remaining close to last year's figure; in North America, the high level of orders at end-June points to a bright outlook for the
year as a whole, as long as the weather is better than in the first six months, enabling orders to be executed;
in central Europe, the planned scaling-back of activity to the expected market level over the coming years is going ahead in accordance with the strategy defined in 2010;
in northern Europe, due to a tough comparison base in 2010, activity could decline by around 10% because of budget cuts in the UK and Ireland; in the rest of the world, activity could be very slightly lower due to less buoyant markets in Africa.
On the basis of currently available data, the sales target for 2011 has been adjusted up from €11.8 billion at the start of the year to €11.9 billion. The first effects of the rightsizing measures taken since mid-2010 have confirmed an improvement in profitability in 2011. 2011 sales target
(€ million) 2010 2011 target Change
Sales 11,661 11,900 +2.0%
20

BOUYGUES/2011 Half-year review Half-year review of operations
TF1
The TF1 group's mission is to inform and entertain. While continuing to strengthen its position in its core television business with free and pay channels, it has diversified into the internet, audiovisual rights, production and licences. Key figures
(€ million) H1 Change
2010 2011
Sales TF1 channel advertising Other activities
1,284.6 764.6 520.0
1,277.6 757.8 519.8
-0.5% -0.9%
= Operating profit 104.4 186.5 +78.6%
Net profit attributable to the Group 74.2 118.6 +59.8%
The TF1 group's consolidated sales over the first six months of the year remained virtually stable at €1,287 million (down 0.5%). This figure comprises: revenue from advertising on the TF1 channel of €758 million, very slightly lower
(-0.9%) than in the first half of 2010. TF1 did not show any major sporting events in the first half of 2011, unlike in the previous year (2010 FIFA World Cup). Nevertheless, advertising revenue in the second quarter of 2011 was up 0.7% year-on-year and up 14% on the first quarter of 2011;
revenue from other activities of €520 million, stable year-on-year. Higher sales resulting
from the acquisition of TMC and NT1 were offset to a considerable extent by the absence of sporting rights sales.
Operating profit in the first half of 2011 amounted to €186.5 million, €82.1 million more than in the first half of 2010, a rise of 78.6%. The current operating margin rose to 14.6%, compared with 8.1% in the first half of 2010 and 8.8% over the whole of the year. The second-quarter operating margin rose to 18.8%, compared with 8.8% in the second quarter of 2010. Net profit attributable to the Group in the first half of 2011 amounted to €119 million, compared with €74 million in the first half of 2010. Half-year highlights The TF1 group kept its unrivalled position in free-to-air television in France, with TF1,
TMC and NT1 gaining an aggregate audience share of 29.1% among individuals aged four years and over and 32.9% among women under 50 who are purchasing decision-makers.
21

BOUYGUES/2011 Half-year review Half-year review of operations
The TF1 group had a cash surplus of €11 million at end-June 2011. The strength of its financial position was underlined when Standard & Poor's upgraded its rating from BBB with positive outlook to BBB+ with stable outlook.
1. French broadcasting
a. TF1 core channel
In the first half of the year, the TF1 core channel won an audience share of 23.8% among individuals aged four years and over and 26.8% among women under 50 who are purchasing decision-makers. It also achieved the top 50 audience ratings. The cost of programmes shown on TF1 amounted to €424 million in the first half of 2011, compared with €483 million in the same period of the previous year. The €59-million drop (12.2%) was due to the absence of the 2010 FIFA World Cup, which represented a saving of €49 million on rights net of replacement programme costs, and savings of €10 million on other programmes. Sales by the TF1 core channel fell 1.2% in the first six months of 2011 to €761 million, including €758 million of net advertising revenue, down 0.9%. Television remained the top medium for advertising spend in the first half of 2011 and TF1 confirmed its status as France's leading mass media outlet. The advertising sales department continued its value-recovery strategy even without any major sporting event, like the FIFA World Cup in 2010. With a €75-million increase in operating profit to €132 million, the operating margin in the first half of the year jumped 9.9 points from 7.4% in the first half of 2010 to 17.3%. b. Other activities Téléshopping generated sales of €54 million in the first half of 2011 compared with €58 million in same period of the previous year, a drop of 7%. This was mainly due to a decline in its core business and in the infomercials business, where the number of orders rose but the average value fell. This decline was partly offset by the success of Place des Tendances, an online fashion shopping site that now has a catalogue of 200 brands. Operating profit fell €3 million to €1 million. Theme channel sales jumped 48.4% to €160 million, due partly to full consolidation of TMC and NT1 from 1 July 2010 but also to an excellent increase in audience share by TMC, TV Breizh and LCI. Operating profit rose €16 million to €28 million, giving an operating margin of 17.4%. TF1 Entreprises reported a 5.1% rise in half-year sales to €17 million on the back of successes in the music business, including productions like the Prêtres I and II CDs, coproductions like the Black Eyed Peas, the musical Mozart Rock Opera, and the division's trade-mark and licence agency business. Operating profit amounted to €2.6 million compared with €0.3 million in the first half of 2010, giving an operating margin of 15.7%. At e-TF1, the sale of videos over the internet and the rollout by new operators of MyTF1, an enhanced television portal, drove revenue growth to €39 million, a rise of 3.5%. Profitability improved to €3.1 million, a €3-million increase over one year.
22

BOUYGUES/2011 Half-year review Half-year review of operations
2. Audiovisual rights The Catalogue division reported half-year sales of €12 million compared with €24 million in the first half of 2010. This decline was due to less successful cinema releases than in the first half of 2010 and the restatement of sales with TMC and NT1 as intragroup sales. Against a background of tumbling DVD prices, sales by TF1 Vidéo rose 7.9% to €38 million as a result of higher volume sales and the expansion of video on demand (VOD). The division incurred an operating loss of €11 million, which includes a provision for the Miracle at St Anna dispute. 3. International broadcasting
Sales at the international broadcasting division (Eurosport International) fell back 4.1% despite a steady rise in subscription revenue, due to the uncertain economic climate, the lack of major sporting events in the first half of 2011 and the corresponding impact on advertising revenue. Operating profit rose €1 million to €28 million. Eurosport International achieved an operating margin of 15.9%, a 1.2-point improvement attributable to reductions in and close management of programme costs by the TF1 group, which is not showing any major events this year. Outlook In a low-visibility economic environment, the TF1 group confirms that it expects sales to remain stable in 2011. The group is keener than ever to consolidate its position as France's leading provider of news and entertainment on television. Having rationalised its business portfolio, the TF1 group is continuing to expand its diversification activities, which are becoming more successful again. Source: Médiamétrie
23
BOUYGUES/2011 Half-year review Half-year review of operations
Bouygues Telecom Bouygues Telecom is France's third mobile and fixed telecommunications, TV and internet operator. Key figures
(€ million) H1 Change
2010 2011
Sales Sales from network
2,732 2,506
2,866 2,575
5% 3%
EBITDA EBITDA / sales from network
734 29.3%
665 25.8%
-9% -3.5 pts
Operating profit Operating margin
409 15.0%
331 11.5%
-19% -3.5 pts
Net profit attributable to the Group 264 213 -19%
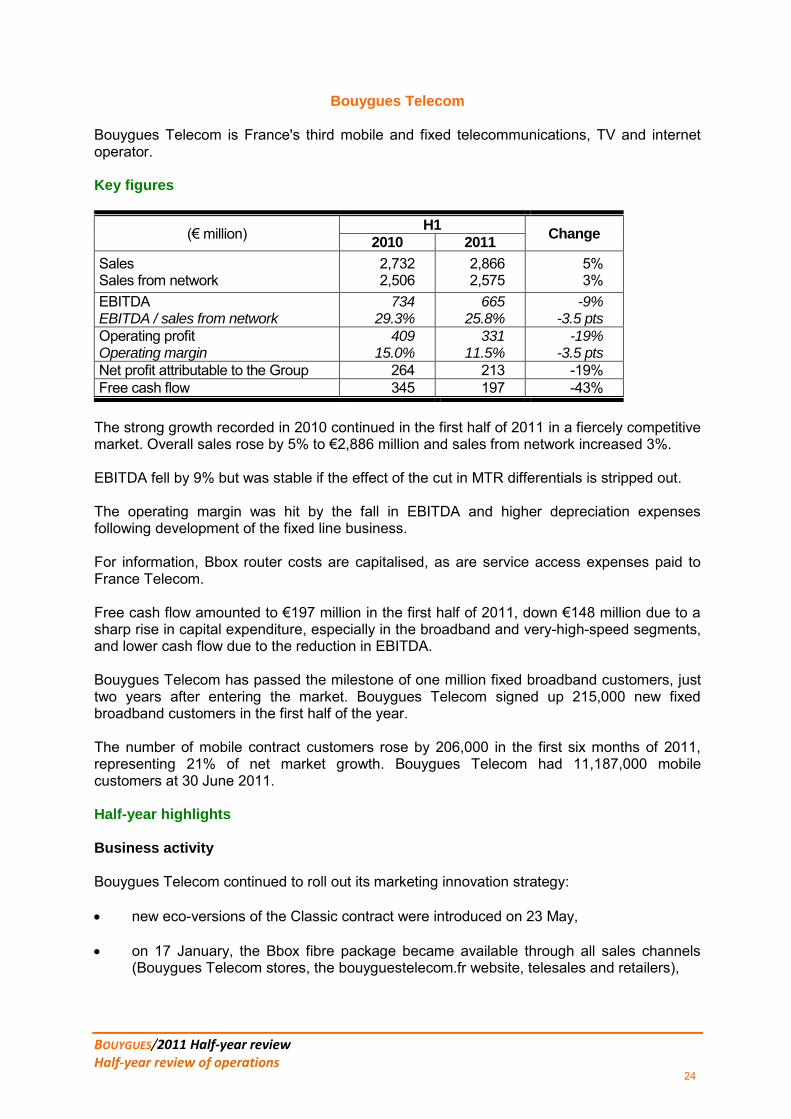
Free cash flow 345 197 -43% The strong growth recorded in 2010 continued in the first half of 2011 in a fiercely competitive market. Overall sales rose by 5% to €2,886 million and sales from network increased 3%. EBITDA fell by 9% but was stable if the effect of the cut in MTR differentials is stripped out. The operating margin was hit by the fall in EBITDA and higher depreciation expenses following development of the fixed line business. For information, Bbox router costs are capitalised, as are service access expenses paid to France Telecom. Free cash flow amounted to €197 million in the first half of 2011, down €148 million due to a sharp rise in capital expenditure, especially in the broadband and very-high-speed segments, and lower cash flow due to the reduction in EBITDA. Bouygues Telecom has passed the milestone of one million fixed broadband customers, just two years after entering the market. Bouygues Telecom signed up 215,000 new fixed broadband customers in the first half of the year. The number of mobile contract customers rose by 206,000 in the first six months of 2011, representing 21% of net market growth. Bouygues Telecom had 11,187,000 mobile customers at 30 June 2011. Half-year highlights Business activity Bouygues Telecom continued to roll out its marketing innovation strategy: new eco-versions of the Classic contract were introduced on 23 May, on 17 January, the Bbox fibre package became available through all sales channels
(Bouygues Telecom stores, the bouyguestelecom.fr website, telesales and retailers),
24

BOUYGUES/2011 Half-year review Half-year review of operations
the new Neo Pro 24/24 Platinum contract for professionals was launched, including unlimited calls in France, unlimited text messages, 3G+ and 3 hours of international calls.
Bouygues Telecom is continuing its policy of putting customers first. Following the rise in VAT on mobile and fixed services including TV services, Bouygues
Telecom decided not to pass on the higher rate of VAT to its prices. As well as enhancing its brand image, the initiative enabled Bouygues Telecom to lead the market in terms of net growth on the mobile phone segment in the first quarter of 2011.
Bouygues Telecom, Orange, SFR and Atos Origin have cooperated on an innovative
payment solution called “Buyster”, which offers a secure link between a customer's bank card and mobile phone number.
High-quality customer relations continue to be a priority for Bouygues Telecom, which pulled off a historic double by coming top of the customer relations league table for both the mobile phone sector, for the fifth year running, and the fixed line internet sector, after just two years on the market. The quality of the company's HR policy was recognised by the award of the Top Employer label for the second year running. Networks Bouygues Telecom's 3G HSPA network covered 87% of the French population at end-June 2011, thus meeting the requirement under the terms of its licence to cover 75% of the population by the end of 2010. Bouygues Telecom covers all the major towns and cities in France and strives to continually improve its network.
On 4 April, the company extended the ADSL unbundling zone and now has access to over 3,700 subscriber connection nodes. Bouygues Telecom's fixed line network is now comparable to that of its rivals and gives the company a level playing-field on the fixed phone market.
A decision was taken with SFR to jointly build an optical fibre network to the home with 3 million FTTH connections.
A partnership agreement was concluded with Numericable under which Bouygues Telecom can use its optical fibre network to the last amplifier (FTTLA), giving access to a potential market of 7 million households in France.
Regulatory context The voice termination rate was cut by 41% on 1 July 2011 to €0.02 per minute, thus ending the differential with Orange and SFR. The SMS termination rate was also cut by 31% to €0.015. Environment
25

BOUYGUES/2011 Half-year review Half-year review of operations
The Technical Centre in Meudon, near Paris, was awarded HQE Operation certification, recognising the high environmental quality not only of the building but also of the monitoring and maintenance processes for the benefit of users. Outlook Voice and SMS termination rates were cut again on 1 July 2011. Bouygues Telecom considers that the impact of the cut in voice and SMS termination rates is likely to be at least €330 million on 2011 sales and a minimum of €120 million on EBITDA. However, strong organic growth means that sales are expected to rise by 2% over the year as a whole. EBITDA is likely to remain stable in 2011, stripping out the effect of the cut in termination rate differentials. 2011 sales target
(€ million) 2010 2011 target Change
Sales 5,636 5,730 2%
26
BOUYGUES/2011 Half-year review Half-year review of operations
Alstom
Alstom, in which Bouygues has a 30.7% stake, is a world leader in power generation and transmission and rail transport infrastructure and sets the standard in innovative technologies for the protection of the environment. It makes the world's fastest trains and highest-capacity automatic metros. Alstom also provides turnkey power plants, equipment and related services for the production of electricity from all sources, including hydropower, nuclear, gas, coal and wind. It offers a vast range of electricity transmission solutions, especially smart grids. The group has about 93,500 employees in a hundred or so countries and generated sales of €20.9 billion in FY2010/11, ended on 31 March 2011. Operating results in FY2010/11 in line with forecasts, a sharp rise in orders in the second half of the year Alstom published its financial statements for the year ended 31 March 2011 on 4 May 2011. During FY2010/11, Alstom recorded sales of €20.9 billion and an operating profit of €1,570 million, giving an operating margin of 7.5%. Net profit amounted to €462 million, severely hit by non-recurring expenses. The order intake amounted to €19.1 billion, higher than the low level recorded in the previous year. After bottoming out in the first half, orders bounced back in the second half. Free cash flow also improved substantially in the second half of FY2010/11, rising to €447 million, compared with -€963 million in the first half. Results in FY2010/11 reflected an operating performance in line with forecasts. After three consecutive half-years of low orders, the order intake jumped sharply in the second half of FY2010/11, with a stronger fourth than third quarter, as announced. This upturn in the commercial situation generated a substantial improvement in cash flow in the second half of the year. The upturn in orders was driven by numerous successes in emerging countries, where demand is likely to carry on growing, whereas business in developed countries remains sluggish. This geographical shift in demand opens up a new phase for Alstom. In order to grasp future opportunities while remaining competitive, the group plans to adapt the geographical scope of its operations and step up its innovative products and services. Consequently, Alstom continued to expand in the BRICs and concluded several partnership agreements in these key zones. At the same time, rightsizing plans were introduced for certain sites in Europe and North America. Research and development spending was maintained at a high level to enable Alstom to remain at the cutting edge of technology. On 15 June 2011, on a proposal from the Chairman and CEO, Alstom's board of directors approved major changes to the group's organisation, which took effect on 4 July 2011. They included the appointment of a Deputy CEO, the reshaping of operational activities into four sectors (Thermal Power, Renewable Power, Transport, Grid) and a complete overhaul of the Executive Committee. The new organisation is intended to allow the group to better anticipate the structural changes in its businesses, accelerate its development and achieve its performance objectives. Splitting the Power sector into two sectors, Thermal and Renewable, is designed to simplify the working of each entity and to take better account of the specific features of their markets. The shareholders' meeting on 28 June 2011 approved the payment of a dividend of €0.62 per share, compared with €1.24 in the previous financial year.
27

BOUYGUES/2011 Half-year review Half-year review of operations
Recent events
Alstom published its sales for the first quarter of FY2011/12 (1 April to 30 June 2011) on 20 July 2011. Alstom took orders worth €5 billion over the period, 44% more (34% excluding Grid) than in the same period of the previous year. Sales, at €4.5 billion, were down 12% (-23% excluding Grid). The newly created sectors, Thermal Power and Renewable Power, received orders of €2.8 billion and €0.3 billion respectively in the first quarter. Transport booked contracts for small and medium-sized projects worth €1 billion. Grid orders amounted to €0.9 billion. The geographical shift of orders towards emerging countries seen over the previous six months was confirmed, since they accounted for 63% of new orders booked. Thermal Power and Transport saw sales drop sharply in the first quarter of FY2011/12 in relation to the first quarter of FY2010/11, hitting a low that was the consequence of the previous low order intake. The total order book amounted to €47 billion at 30 June 2011, representing 28 months of sales. Outlook
Alstom's financial structure is solid and an improvement is expected in the second half as a result of the combined effect of the recent upturn in orders and the benefits of the restructuring plan. On that basis, Alstom confirmed that it expects an operating margin of between 7% and 8% for FY2011/12, as already announced.
28

BOUYGUES/2011 Half-year review Half-year review of operations
II – MAIN RISKS AND UNCERTAINTIES IN H2 2011 This report contains forward-looking statements. Those statements, which express targets based on current assessments and estimates, are subject to the risks and uncertainties described below. The main risks and uncertainties that the Group could face in the second half of 2011 are similar to those described in the 2010 Registration Document (pages 139-159). III – RELATED-PARTY TRANSACTIONS
No related-party transactions liable to materially affect Bouygues' financial situation or results were concluded in the first half of 2011. Likewise, no change to related-party transactions liable to materially affect Bouygues' financial situation or results occurred during that period. Under the terms of agreements approved by the Board of Directors and the Shareholders' Meeting, Bouygues provided services to its sub-groups, mainly in the areas of management, human resources, information systems and finance. More detailed information about related-party transactions is given in Note 13 of the notes to the condensed consolidated first-half financial statements. IV – RECENT EVENTS A number of significant events occurred in July and August 2011. Most of the Gautrain transport system linking Pretoria, Johannesburg and Johannesburg International Airport was brought into service on 2 August 2011. Bouygues Construction has started work on redeveloping the site of the old Laënnec Hospital in the 7th arrondissement of Paris, a project worth a total of around €150 million. On 28 July, TF1 finalised the acquisition of Metro International's 65.7% stake in Metro France, a free newspaper, making TF1 the sole owner. TF1 Droits Audiovisuels, the producer and the authors/directors of the film Miracle at St Anna ended the dispute as a result of which the Paris civil court of first instance, on 21 June 2011, ordered TF1 to pay €32 million in compensation. The calls for tender for the allocation of frequencies in the 800 MHz and 2.6 GHz bands were published on 15 June 2011. The frequencies will be allocated in late 2011 and early 2012. During the summer Bouygues Telecom launched B&You in the form of three no-commitment plans designed to meet the needs of new, more autonomous users at ease with new technologies. The new initiative is based on a new model: The creation of value from data traffic, Low marketing costs, mainly due to the absence of handset subsidies Increased customer participation via the use of Web 2.0 tools (social networks,
community help forums etc.) and the involvement of customers in the development of the service
Alstom has won a number of major contracts, including a €330-million contract to operate and maintain a gas-fired power station in Israel, an order worth €200 million for 66 trainsets for the
29

BOUYGUES/2011 Half-year review Half-year review of operations
Paris metro, electricity transmission contracts worth €100 million in Australia, an €80-million contract as part of the programme to rebuild the energy network in Iraq and a €90-million contract for a turnkey rail system in Indonesia.
30

BOUYGUES/2011 Half-year review Condensed consolidated first-half financial statements
CONDENSED CONSOLIDATED FIRST-HALF FINANCIAL STATEMENTS
31

CONSOLIDATED BALANCE SHEET AT 30 JUNE 2011 € million
ASSETS30/06/2011
Net
31/12/2010
Net
30/06/2010
Net
Property, plant and equipment 6,144 6,159 5,945
Intangible assets 966 990 988
Goodwill (1) 5,552 5,531 5,197
Investments in associates (2) 5,062 5,020 5,234
Other non-current financial assets 801 659 773
Deferred tax assets and non-current tax receivable 235 261 273
Non-current assets 18,760 18,620 18,410
Inventories, programmes and broadcasting rights 2,811 2,680 2,686
Advances and down-payments on orders 441 396 430
Trade receivables 7,532 6,167 7,173
Tax asset (receivable) 137 134 82
Other current receivables and prepaid expenses 2,257 1,982 2,231
Cash and equivalents 3,303 5,576 4,144
Financial instruments (3) 10 13 19
Other current financial assets 24 18 44
Current assets 16,515 16,966 16,809
Assets held for sale and discontinued operations
Total assets 35,275 35,586 35,219
LIABILITIES AND SHAREHOLDERS' EQUITY 30/06/2011 31/12/2010 30/06/2010
Shareholders' equity
- Share capital 366 366 356
- Share premium and reserves 8,591 8,027 7,785
- Translation reserve (24) 8 62
- Treasury shares (324) (155) (45)
- Consolidated net profit for the period 391 1,071 532
Shareholders' equity attributable to the Group 9,000 9,317 8,690
Minority interests 1,253 1,290 1,163
Shareholders' equity 10,253 10,607 9,853
Non-current debt 6,835 6,750 6,295
Non-current provisions 1,872 1,870 1,816
Deferred tax liabilities and non-current tax liabilities 130 112 92
Non-current liabilities 8,837 8,732 8,203
Advances and down-payments received 1,452 1,413 1,415
Current debt 268 994 1,538
Current taxes payable 111 137 118
Trade payables 6,629 6,347 6,479
Current provisions 853 930 873
Other current liabilities 6,306 6,089 6,156
Overdrafts and short-term bank borrowings 530 294 504
Financial instruments (3) 21 24 31
Other current financial liabilities 15 19 49
Current liabilities 16,185 16,247 17,163
Liabilities on held-for-sale assets and discontinued operations
Total liabilities and shareholders' equity 35,275 35,586 35,219
Net surplus cash/(net debt) (4,341) (2,473) (4,205)
(1) Goodwill of consolidated entities(2) Associates (including goodwill on associates)(3) Fair value hedges of financial liabilities
BOUYGUES GROUP - CONSOLIDATED FINANCIAL STATEMENTS
32

CONSOLIDATED INCOME STATEMENT
1st half
2011 2010
2nd quarter
2011 2010
Full year
2010
SALES (1) 15,214 14,655 8,528 8,212 31,225
Other revenues from operations 58 76 19 47 144
Purchases used in production (6,624) (6,313) (3,755) (3,610) (13,886)
Personnel costs (3,398) (3,274) (1,753) (1,706) (6,504)
External charges (3,554) (3,371) (1,869) (1,801) (7,091)
Taxes other than income tax (320) (303) (162) (147) (633)
Net depreciation and amortisation expense (664) (653) (355) (348) (1,392)
Net charges to provisions and impairment losses (157) (178) (69) (122) (549)
Changes in production and property development inventories (47) (166) (101) (111) (116)
Other income from operations (2) 576 576 304 296 1,250
Other expenses on operations (332) (338) (188) (169) (688)
CURRENT OPERATING PROFIT 752 711 599 541 1,760
Other operating income 0 0 0 108
Other operating expenses (13) 0 (5) (77)
OPERATING PROFIT 752 698 599 536 1,791
Financial income 42 34 25 21 64
Financial expenses (176) (196) (85) (101) (394)
COST OF NET DEBT (134) (162) (60) (80) (330)
Other financial income 35 92 25 30 101
Other financial expenses (37) (56) (22) (27) (95)
Income tax expense (223) (204) (194) (180) (482)
Share of profits and losses of associates 91 237 67 116 278
NET PROFIT FROM CONTINUING OPERATIONS 484 605 415 395 1,263
Net profit from discontinued and held-for-sale operations 0 0 0
NET PROFIT 484 605 415 395 1,263
Net profit attributable to the Group 391 532 357 351 1,071
Net profit attributable to minority interests 93 73 58 44 192
BASIC EARNINGS PER SHARE FROM CONTINUING OPERATIONS (€) 1.10 1.50 1.00 0.99 3.03
DILUTED EARNINGS PER SHARE FROM CONTINUING OPERATIONS (€) 1.09 1.49 1.00 0.98 3.02
(1) Of which sales generated abroad (including export sales) 4,150 4,254 2,501 2,529 9,649(2) Of which reversals of unutilised provisions and impairment losses/other items 165 158 72 61 371
BOUYGUES GROUP - CONSOLIDATED FINANCIAL STATEMENTS
€ million
33

BOUYGUES GROUP - CONSOLIDATED FINANCIAL STATEMENTS
STATEMENT OF RECOGNISED INCOME AND EXPENSE € million
Net profit for the period 484 605 1,263
Change in cumulative translation adjustment of controlled entities (18) 92 38Net change in fair value of financial instruments used for hedging purposes and of 12 (12)other financial assets (including available-for-sale financial assets) 23Actuarial gains/(losses) on employee benefits (amendment to IAS 19) (1) (15) (11)Share of income and expense recognised directly in equity by associates (1) 34 47 (16)Net tax effect of items recognised directly in equity 0 7 (5)
Income and expense recognised directly in equity 27 119 29
Total recognised income and expense 511 724 1,292
Attributable to the Group 423 640 1,092
Attributable to minority interests 88 84 200
(1) Relates primarily to Alstom (accounted for by the equity method)
Full year
2010
1st half
2011 2010
34

BOUYGUES GROUP - CONSOLIDATED FINANCIAL STATEMENTS
CHANGES IN CONSOLIDATED SHAREHOLDERS' EQUITY - PERIOD ENDED 30 JUNE 2011 € million
POSITION AT 1 JANUARY 2010 2,423 1,823 4,485 (56) (139) 8,536 1,190 9,726
MOVEMENTS IN FIRST HALF OF 2010
Capital and reserves transactions, net 27 451 (451) 27 27
Acquisitions/disposals of treasury shares (45) 83 38 38
Acquisitions/disposals without loss of control 1 1 1
Dividend paid (566) (566) (108) (674)
Other transactions with shareholders 1 (1) 14 14 1 15
Net profit for the period 532 532 73 605
Other recognised income and expense (b) 118 (10) 108 11 119
Total recognised income and expense 0 0 532 118 0 (10) 640 84 724
Changes in scope of consolidation 0 (4) (4)
POSITION AT 30 JUNE 2010 2,451 2,273 4,014 62 (45) (65) 8,690 1,163 9,853
MOVEMENTS IN SECOND HALF OF 2010
Capital and reserves transactions, net 261 7 268 268
Acquisitions/disposals of treasury shares (110) (110) (110)
Acquisitions/disposals without loss of control (3) (3) (3)
Dividend paid 0 0
Other transactions with shareholders (1) 20 19 19
Net profit for the period 539 539 119 658
Other recognised income and expense (b) (54) (33) (87) (3) (90)
Total recognised income and expense 0 0 539 (54) 0 (33) 452 116 568
Changes in accounting policy/scope of consolidation and other items 1 1 11 12
POSITION AT 31 DECEMBER 2010 2,711 2,273 4,574 8 (155) (94) 9,317 1,290 10,607
MOVEMENTS IN FIRST HALF OF 2011
Capital and reserves transactions, net 10 294 (294) 10 1 11
Acquisitions/disposals of treasury shares (169) (3) (172) (172)
Acquisitions/disposals without loss of control (19) (19) (19)
Dividend paid (570) (570) (123) (693)
Net profit for the period 391 391 93 484
Other recognised income and expense (b) (32) 64 32 (5) 27
Total recognised income and expense 0 0 391 (32) 0 64 423 88 511
Other transactions (changes in accounting policy/scope of consolidation and other items) (1) 12 11 (3) 8
POSITION AT 30 JUNE 2011 2,721 2,567 4,100 (24) (324) (40) 9,000 1,253 10,253
(a) Translation reserveAttributable to: Group Minority interests Total
Controlled entities (15) (3) (18)
Associates (17) (17)
(32) (3) (35)
(b) See the statement of recognised income and expense
Minority
interestsTOTAL
Translation
reserve
Treasury
shares
Share
capital &
share
premium
Reserves related
to capital/
retained earnings
Consolidate
d reserves
and profit
for the
period
Items
recognised
directly in
equity
TOTAL
ATTRIBUTABLE
TO THE GROUP
(a)
35

BOUYGUES GROUP - CONSOLIDATED FINANCIAL STATEMENTS
CONSOLIDATED CASH FLOW STATEMENT € million
1st half
2011 2010
Full year
2010
I - CASH FLOW FROM CONTINUING OPERATIONS
A - NET CASH GENERATED BY/(USED IN) OPERATING ACTIVITIES
Net profit from continuing operations 484 605 1,263
Share of profits effectively reverting to associates (1) (110) (124)
Elimination of dividends (non-consolidated companies) (9) (4) (8)
Charges to/(reversals of) depreciation, amortisation, impairment & non-current provisions 683 657 1,481
Gains and losses on asset disposals (15) (56) (91)
Miscellaneous non-cash charges 3 (1) (89)
sub-total 1,145 1,091 2,432
Cost of net debt 134 162 330
Income tax expense for the period 223 204 482
Cash flow 1,502 1,457 3,244
Income taxes paid during the period (189) (244) (501)
Changes in working capital related to operating activities (1)
(1,305) (1,163) (52)
NET CASH GENERATED BY/(USED IN) OPERATING ACTIVITIES 8 50 2,691
Tous
B - NET CASH GENERATED BY/(USED IN) INVESTING ACTIVITIES
Purchase price of property, plant and equipment and intangible assets (695) (532) (1,507)
Proceeds from disposals of property, plant and equipment and intangible assets 44 31 84
Net liabilities related to property, plant and equipment and intangible assets (101) (154) 28
Purchase price of non-consolidated companies and other investments (41) (214) (24)
Proceeds from disposals of non-consolidated companies and other investments 0 218 219
Net liabilities related to non-consolidated companies and other investments 0 5 6
Effects of changes in scope of consolidationPurchase price of investments in consolidated activities (43) (254) (470)
Proceeds from disposals of investments in consolidated activities 20 4 20
Net liabilities related to consolidated activities 0 0 1
Other cash effects of changes in scope of consolidation 1 (25) (51)TousOther cash flows related to investing activities (changes in loans, dividends received from
non-consolidated companies)(104) 12 (47)
NET CASH GENERATED BY/(USED IN) INVESTING ACTIVITIES (919) (909) (1,741)
C - NET CASH GENERATED BY/(USED IN) FINANCING ACTIVITIES
Capital increases paid, movements in treasury shares and other transactions with shareholders (104) (15) 78
Dividends paid during the period: Dividends paid to shareholders of the parent company (570) (566) (566)
Dividends paid to minority shareholders of consolidated companies (123) (108) (108)
Change in debt (639) 690 565
Cost of net debt (134) (162) (330)
Other cash flows related to financing activities 1 84 133
NET CASH GENERATED BY/(USED IN) FINANCING ACTIVITIES (1,569) (77) (228)
D - EFFECT OF FOREIGN EXCHANGE FLUCTUATIONS (29) 121 105
CHANGE IN NET CASH POSITION (A+B+C+D) (2,509) (815) 827
Net cash position at 1 January 5,282 4,455 4,455
Net cash flows during the period (2,509) (815) 827
Other non-monetary flows
Net cash position at end of period 2,773 3,640 5,282
II - CASH FLOWS FROM DISCONTINUED AND HELD-FOR-SALE OPERATIONS
Net cash position at 1 January 0 0 0
Net cash flows during the period 0 0 0
Net cash position at end of period 0 0 0
(1) Definition of change in working capital related to operating activities:
Current assets - current liabilities (excluding income taxes paid, which are reported separately)
36
NOTES TO THE CONSOLIDATED FINANCIAL STATEMENTS FOR THE SIX MONTHS ENDED 30 JUNE 2011
30 August 2011
37

NOTES
CONTENTS
(Figures in millions of euros unless otherwise indicated)
NOTES
1. Significant events of the period
2. Accounting policies
3. Non-current assets
4. Current assets
5. Consolidated equity
6. Non-current and current provisions
7. Non-current and current debt
8. Main components of change in net debt
9. Analysis of sales and other revenues from operations
10. Operating profit
11. Income tax expense
12. Segment information
13. Related-party information
14. Principal exchange rates
38

Declaration of compliance:
The condensed consolidated financial statements for the six months ended 30 June 2011 have been prepared in accordance with IAS 34, “Interim Financial Reporting”, a standard issued by the IASB and endorsed by the European Union, using the historical cost convention (except for certain financial assets and liabilities measured at fair value). They include comparatives as at and for the periods ended 30 June 2010 and 31 December 2010. The Bouygues group has not early adopted as of 30 June 2011 any standard or interpretation not endorsed by the European Union.
The financial statements are prepared in millions of euros (unless otherwise indicated) and comprise:
the balance sheet;
the income statement and statement of recognised income and expense;
the statement of changes in equity;
the cash flow statement;
the notes to the financial statements.
39

1.0. SIGNIFICANT EVENTS OF THE PERIOD
1.1. SCOPE OF CONSOLIDATION AS AT 30 JUNE 2011 1,119 entities were consolidated as at 30 June 2011, against 1,158 at the end of 2010. The net reduction of 39 mainly relates to Colas (various proportionately-consolidated asphalt companies) and to Bouygues Immobilier (deconsolidation of real estate partnerships and property companies on project completion, etc).
Principal acquisitions and other transactions during the period:
• LEADBITTER GROUP (BOUYGUES CONSTRUCTION):
After receiving clearance from the European Commission competition authorities in March 2011, the Bouygues Construction group acquired 51% of the Leadbitter group via the holding company Leadbitter Bouygues H. Ltd. The remaining 49% is held by the Leadbitter management team and is to be acquired within no more than 4 years. The Leadbitter group, which has a construction and house-building business in the United Kingdom, has been fully consolidated in the Bouygues Construction group financial statements with effect from 31 March 2011. The €38 million investment in Leadbitter was recognised in the first half of 2011. The commitment to buy out the minority shareholders in the holding company, amounting to €19 million, has been recognised in non-current debt.
• GAMMA MATERIALS LTD (COLAS): At the end of June 2011, Colas acquired a 50% interest in Gamma Materials Ltd (Mauritius) for €33 million. As at 30 June 2011, this interest is reported in “Investments in non-consolidated companies” pending accounting and financial data. Gamma Materials will be accounted for by the proportionate consolidation method in the second half of 2011. ALSTOM: Alstom is accounted for by the equity method, and is carried at net acquisition cost plus Bouygues’ share of Alstom’s net profit since the acquisition date. On 4 May 2011, Alstom published its results for the financial year ended 31 March 2011. Given the time-lag between the financial year-end of Alstom (31 March) and Bouygues (31 December), the financial contribution of Alstom to the Bouygues group’s net profit for the first quarter of 2011 was €23 million, while the estimate for the second quarter (after eliminating non-recurring charges booked in 2011) is €71 million. This gives a total contribution of €94 million for the first half of 2011. Amortisation of fair value remeasurements of identifiable intangible assets and other items had a negative impact of €8 million on the Bouygues group consolidated income statement in the period (portion attributable to the Bouygues group).
The investment in Alstom is reported under “Investments in associates” in the balance sheet, at a carrying amount of €4,425 million, including goodwill of €2,593 million.
1.2. CONSOLIDATED SALES FOR THE FIRST HALF OF 2011
Consolidated sales were €15,214 million, 3.8% higher than in the first half of 2010.
1.3. SIGNIFICANT EVENTS AND CHANGES IN SCOPE OF CONSOLIDATION SUBSEQUENT TO 30 JUNE 2011
None.
40

2.0. ACCOUNTING POLICIES
2.1. BUSINESS AREAS
The Bouygues group is a diversified industrial group with operations in more than 80 countries. The Group’s activities are organised into a number of business areas: a) Construction:
- Bouygues Construction (building & civil works, energy and services) - Bouygues Immobilier (property) - Colas (roads)
b) Telecoms/Media: - TF1 (television) - Bouygues Telecom (mobile, fixed, TV and internet services)
c) The Bouygues group also holds a 30.74% interest in Alstom (Power, Transport and Transmission).
2.2. BASIS OF PREPARATION
The consolidated financial statements of the Bouygues group include the financial statements of Bouygues and its subsidiaries, and investments in associates. They are presented in millions of euros, the currency in which the majority of the Group’s transactions are denominated, and take account of the recommendations on presentation (Recommendation 2009-R-03) issued on 2 July 2009 by the Conseil National de la Comptabilité (CNC), now the Autorité des Normes Comptables (ANC), the French national accounting standard-setter.
They were approved by the Board of Directors on 30 August 2011. The Bouygues group has applied the same standards, interpretations and accounting policies for the six months ended 30 June 2011 as those disclosed in its consolidated financial statements for the year ended 31 December 2010, except for new IFRS requirements applicable from 1 January 2011 (see below). Consequently, Note 2 to the consolidated financial statements for the six months ended 30 June 2011 does not include detailed disclosures of these accounting policies, and these financial statements should be read in conjunction with the consolidated financial statements for the year ended 31 December 2010. • Principal new standards, amendments and interpretations effective within the European Union and mandatorily
applicable to periods beginning on or after 1 January 2011:
- IFRIC 14, “The Limit on a Defined Benefit Asset, Minimum Funding Requirements and their Interaction” (no impact on the financial statements).
- IFRIC 19, “Extinguishing Financial Liabilities with Equity Instruments” (no impact on the financial
statements).
• Other key standards, amendments and interpretations issued by the IASB but not yet endorsed by the European
Union, for which early adoption effective 1 January 2011 is permitted.
- Bouygues has not early adopted any standards, amendments or interpretations as of 30 June 2011.
41

• Elective accounting treatments and estimates used in the valuation of certain assets, liabilities, income and expenses:
Preparing financial statements to comply with IFRS standards and interpretations requires the use of estimates and assumptions which may have affected the amounts reported for assets, liabilities and contingent liabilities at the balance sheet date, and the amounts of income and expenses reported for the period. These estimates and assumptions have been applied consistently on the basis of past experience and of various other factors regarded as reasonable forming the basis of assessments of the valuations of assets and liabilities for accounting purposes. Actual results may differ materially from these estimates if different assumptions or conditions apply. The main items involved are the impairment testing of goodwill, share-based payment (stock options), employee benefits (lump-sum retirement benefits, etc), the fair value of unlisted financial instruments, deferred tax assets, and provisions. Where no standard or interpretation applies to specific transactions, events or conditions, Group management has exercised its judgement to define and apply accounting policies that will provide relevant and reliable financial information, such that the financial statements:
represent faithfully the financial position, financial performance and cash flows of the Group; reflect the economic substance of the underlying transactions; are neutral, prudent, and complete in all material respects.
Disclosures about judgements made by management are provided in the notes to the consolidated financial statements.
Goodwill is tested annually for impairment at the end of the financial year, or during the year if there is evidence of impairment, to ensure that the Group’s share of the recoverable amount of the goodwill is greater than its carrying amount in the consolidated financial statements. If it is not, a provision for impairment may be recorded in accordance with IAS 36: see Note 2.7.1, “Impairment testing of non-current assets”.
• Changes in accounting policy:
Bouygues has made no changes in accounting policy in the six months ended 30 June 2011 except for the new IFRS requirements mentioned above, which have no impact on the consolidated financial statements.
2.3. CONSOLIDATION METHODS • Full consolidation:
- Companies over which Bouygues exercises control are consolidated using the full consolidation method.
- Assessment of exclusive control over TF1:
As of 30 June 2011, Bouygues held 43.19% of the voting rights of TF1. The exercise of exclusive control over TF1 by Bouygues is demonstrated by the following:
Bouygues has consistently and regularly held a large majority of the voting rights exercised at TF1 shareholders’ meetings, and no other shareholder directly or indirectly controls a higher share of voting rights than Bouygues.
Bouygues has clearly had exclusive power to determine decisions at TF1 shareholders’ meetings for at least two consecutive financial years.
42
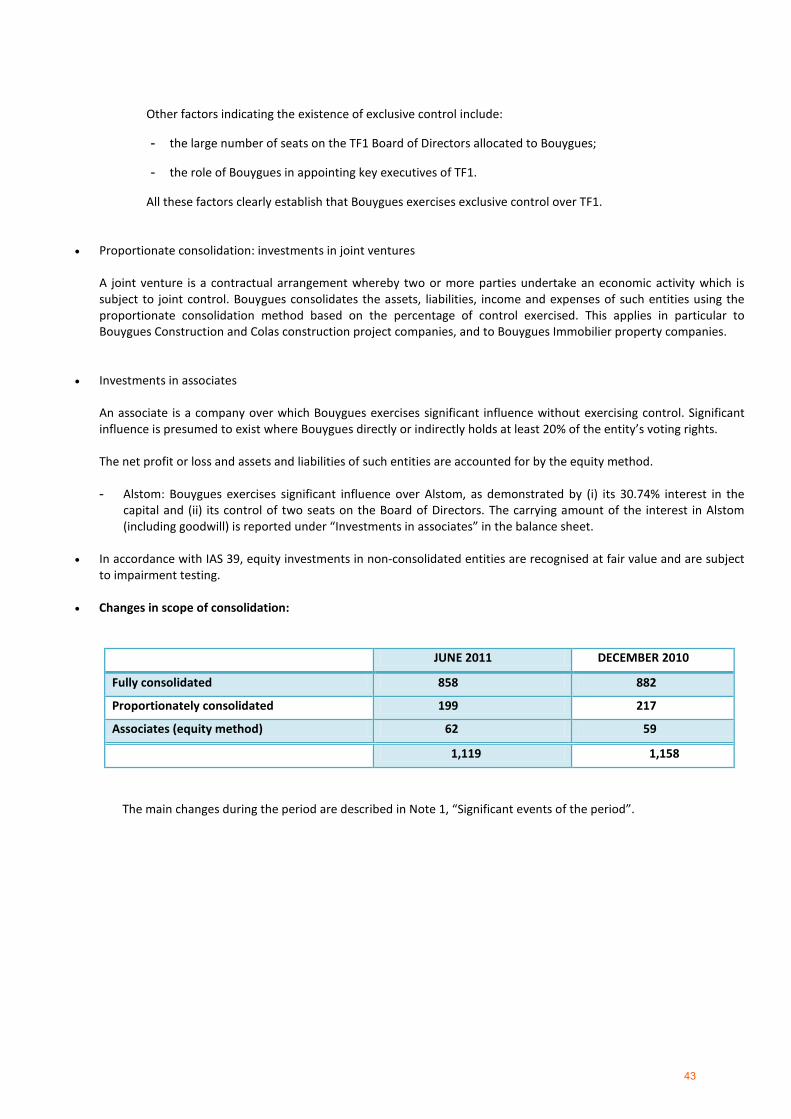
Other factors indicating the existence of exclusive control include:
- the large number of seats on the TF1 Board of Directors allocated to Bouygues;
- the role of Bouygues in appointing key executives of TF1.
All these factors clearly establish that Bouygues exercises exclusive control over TF1.
• Proportionate consolidation: investments in joint ventures
A joint venture is a contractual arrangement whereby two or more parties undertake an economic activity which is subject to joint control. Bouygues consolidates the assets, liabilities, income and expenses of such entities using the proportionate consolidation method based on the percentage of control exercised. This applies in particular to Bouygues Construction and Colas construction project companies, and to Bouygues Immobilier property companies.
• Investments in associates
An associate is a company over which Bouygues exercises significant influence without exercising control. Significant influence is presumed to exist where Bouygues directly or indirectly holds at least 20% of the entity’s voting rights. The net profit or loss and assets and liabilities of such entities are accounted for by the equity method.
- Alstom: Bouygues exercises significant influence over Alstom, as demonstrated by (i) its 30.74% interest in the
capital and (ii) its control of two seats on the Board of Directors. The carrying amount of the interest in Alstom (including goodwill) is reported under “Investments in associates” in the balance sheet.
• In accordance with IAS 39, equity investments in non-consolidated entities are recognised at fair value and are subject
to impairment testing. • Changes in scope of consolidation:
JUNE 2011 DECEMBER 2010
Fully consolidated 858 882
Proportionately consolidated 199 217
Associates (equity method) 62 59
1,119 1,158
The main changes during the period are described in Note 1, “Significant events of the period”.
43

2.4. BUSINESS COMBINATIONS
With effect from 1 January 2010, business combinations have been accounted for in accordance with the revised IFRS 3 and IAS 27, which use the concept of “obtaining control” in determining the accounting treatment to be applied to acquisitions or disposals of equity interests; the impacts of such acquisitions and disposals are recognised either in consolidated profit or loss or in equity, depending on the nature of the combination. In a business combination, the fair value of the consideration transferred is allocated to the identifiable assets and liabilities of the acquiree, which are measured at fair value at the acquisition date and presented in the balance sheet using the full fair value method in accordance with IFRS 3. This method involves remeasuring the assets and liabilities acquired at fair value in full (including minority interests), rather than remeasuring just the percentage interest acquired. The revised IFRS 3 allows entities to elect one of two methods of accounting for minority interests in each business combination: at fair value (full goodwill method), i.e. the minority interests are allocated their share of goodwill; at the minority interests’ proportionate share of the acquired entity’s identifiable assets and liabilities (partial
goodwill method), i.e. no share of goodwill is allocated to the minority interests. Fair value is the amount for which an asset or cash generating unit (CGU) could be sold between knowledgeable, willing parties in an arm’s length transaction.
Goodwill represents the excess of acquisition cost over the acquirer’s interest in the fair value of the acquiree’s identifiable assets, liabilities and contingent liabilities that can be reliably measured at the acquisition date; minority interests are either measured at fair value or not, depending on the option elected (see above). Goodwill is allocated to the CGU benefiting from the business combination or to the group of CGUs at the level of which return on investment is measured (business segment for the Bouygues group). The purchase price allocation period is limited to the time required to identify and measure the acquired entity’s assets and liabilities, the minority interests, the consideration transferred and the fair value of any previously-held equity interest, subject to a maximum period of 12 months. Negative goodwill (i.e. gain from a bargain purchase) is taken to the income statement in the period in which the acquisition is made. Subsequently, goodwill is carried at cost net of any impairment losses identified annually using the methods described under “Impairment testing of non-current assets” in Note 2.7.1 below, in accordance with IAS 36. Impairment losses are charged to the income statement as an operating item. In accordance with the revised IFRS 3, any previously-held equity interest is remeasured at fair value at the date on which control is obtained, with the resulting gain or loss recognised in profit or loss for the period. In the event of loss of control, the retained equity interest is also remeasured at fair value; the gain or loss on remeasurement is recognised in profit or loss for the period, along with the gain or loss arising on the disposal. In the event of a change in percentage interest with no effect on control, the difference between the consideration paid or received and the carrying amount of the minority interest is recognised directly in equity attributable to the Group. Consequently, no additional goodwill is recognised.
All acquisition-related costs are recognised as an expense in profit or loss for the period.
Goodwill recognised prior to 1 January 2004 continues to be measured using the partial fair value method. This method involves restricting the fair value remeasurement of identifiable items to the percentage interest acquired. Minority interests in these items are measured on the basis of the carrying amount of the items as shown in the balance sheet of the acquired entity. The revised standards allow the acquirer to elect to account for each new business combination on either a full goodwill basis or a partial goodwill basis.
44

2.5. FOREIGN CURRENCY TRANSLATION
2.5.1. Foreign-currency transactions
Foreign-currency transactions are translated into euros at the average exchange rate on the date of the transaction. Monetary assets and liabilities denominated in foreign currencies at the balance sheet date are translated at the closing exchange rate. Translation differences are recognised as income or expenses in the income statement. Non-monetary assets and liabilities denominated in foreign currencies and accounted for at historical cost are translated using the exchange rate on the date of the transaction.
2.5.2. Financial statements of foreign entities
All assets and liabilities of consolidated entities with a functional currency other than the euro are translated at the closing exchange rate. Income and expenses are translated at the average exchange rate for the period. Translation differences arising from this treatment, and arising from the retranslation of a subsidiary’s opening shareholders’ equity at the closing exchange rate, are taken to the translation reserve (which is a component of consolidated shareholders’ equity). Translation differences arising on the net investment in foreign subsidiaries and associates are recognised in shareholders' equity.
2.6. ASSESSMENT OF INCOME TAXES
• Income tax expense recognised by each consolidated company for the six months ended 30 June 2011 is assessed in accordance with IAS 34: income taxes for interim periods are recognised on the basis of the best estimate of the average annual effective income tax rate for the financial year (except in the case of holding companies, which recognise income taxes on the basis of the actual tax position at the end of the period).
• Deferred taxation is recognised on differences between the carrying amounts and tax bases of assets and liabilities, and arises as a result of:
Temporary differences between the carrying amount and tax base of assets or liabilities, which may be:
items generating a tax liability in the future (deferred tax liabilities), arising mainly from income that is liable to tax in future periods; or
items deductible from taxable profits in the future (deferred tax assets), mainly provisions that are
temporarily non-deductible for tax purposes. Tax losses available for carry-forward (deferred tax assets) which are likely to be recovered in future periods.
Deferred taxes are measured using known applicable domestic tax rates for the relevant country as at the balance sheet date.
Deferred taxes are not discounted, and are reported in non-current assets and liabilities.
45
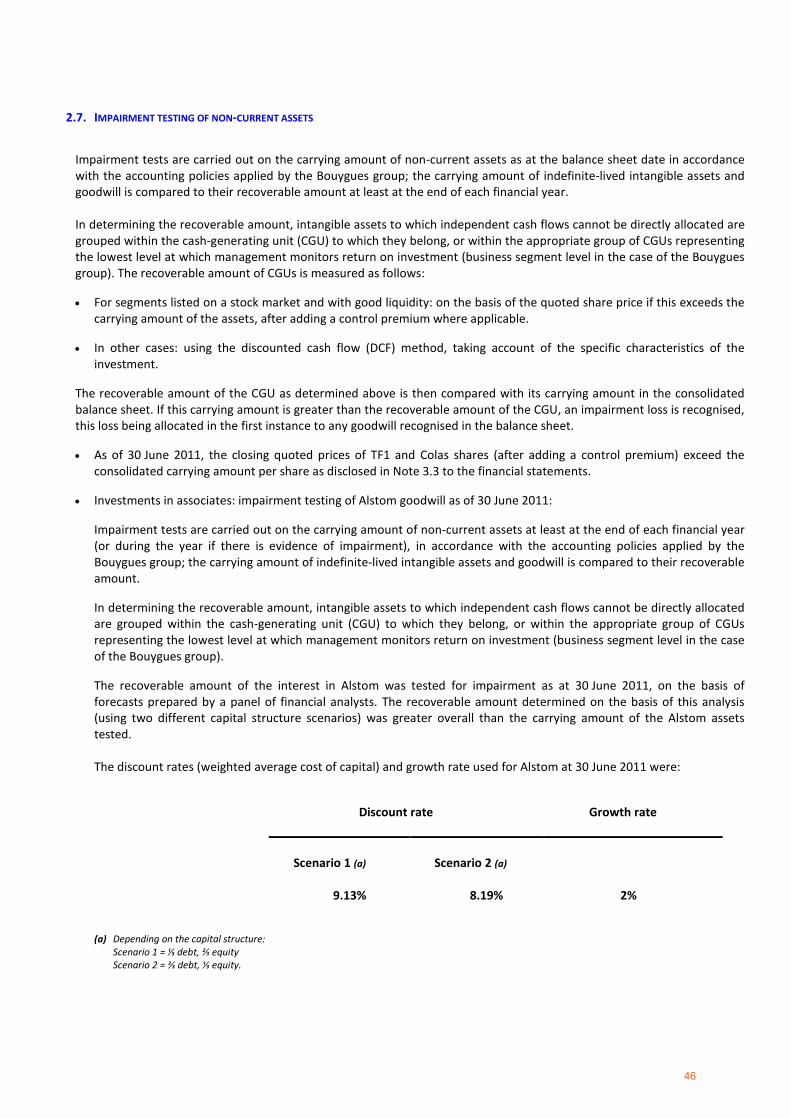
2.7. IMPAIRMENT TESTING OF NON-CURRENT ASSETS
Impairment tests are carried out on the carrying amount of non-current assets as at the balance sheet date in accordance with the accounting policies applied by the Bouygues group; the carrying amount of indefinite-lived intangible assets and goodwill is compared to their recoverable amount at least at the end of each financial year. In determining the recoverable amount, intangible assets to which independent cash flows cannot be directly allocated are grouped within the cash-generating unit (CGU) to which they belong, or within the appropriate group of CGUs representing the lowest level at which management monitors return on investment (business segment level in the case of the Bouygues group). The recoverable amount of CGUs is measured as follows: • For segments listed on a stock market and with good liquidity: on the basis of the quoted share price if this exceeds the
carrying amount of the assets, after adding a control premium where applicable. • In other cases: using the discounted cash flow (DCF) method, taking account of the specific characteristics of the
investment. The recoverable amount of the CGU as determined above is then compared with its carrying amount in the consolidated balance sheet. If this carrying amount is greater than the recoverable amount of the CGU, an impairment loss is recognised, this loss being allocated in the first instance to any goodwill recognised in the balance sheet. • As of 30 June 2011, the closing quoted prices of TF1 and Colas shares (after adding a control premium) exceed the
consolidated carrying amount per share as disclosed in Note 3.3 to the financial statements.
• Investments in associates: impairment testing of Alstom goodwill as of 30 June 2011: Impairment tests are carried out on the carrying amount of non-current assets at least at the end of each financial year (or during the year if there is evidence of impairment), in accordance with the accounting policies applied by the Bouygues group; the carrying amount of indefinite-lived intangible assets and goodwill is compared to their recoverable amount. In determining the recoverable amount, intangible assets to which independent cash flows cannot be directly allocated are grouped within the cash-generating unit (CGU) to which they belong, or within the appropriate group of CGUs representing the lowest level at which management monitors return on investment (business segment level in the case of the Bouygues group). The recoverable amount of the interest in Alstom was tested for impairment as at 30 June 2011, on the basis of forecasts prepared by a panel of financial analysts. The recoverable amount determined on the basis of this analysis (using two different capital structure scenarios) was greater overall than the carrying amount of the Alstom assets tested. The discount rates (weighted average cost of capital) and growth rate used for Alstom at 30 June 2011 were:
Discount rate
Growth rate
Scenario 1 (a)
Scenario 2 (a)
9.13%
8.19%
2%
(a) Depending on the capital structure: Scenario 1 = ⅓ debt, ⅔ equity Scenario 2 = ⅔ debt, ⅓ equity.
46

• Other non-current assets: For other non-current assets, in particular non-depreciable assets, an impairment loss is recognised as soon as there is evidence that the asset is impaired.
2.8. CASH FLOW STATEMENT The cash flow statement is presented in accordance with IAS 7 and with recommendation 2009-R-03 issued by the CNC (now the ANC) on 2 July 2009, using the indirect method. The net profit of consolidated entities is adjusted to eliminate the impact of transactions with no cash effect, and of income and expenses related to investing or financing activities. • Cash flow
The Bouygues group defines cash flow as:
Consolidated net profit before: net depreciation and amortisation expense, net changes in provisions and impairment losses, gains and losses on asset disposals, cost of net debt (included in financing activities in the cash flow statement), and net income tax expense for the period.
The cash flow statement explains changes in the Group’s net cash position, which is defined as the net total of the following balance sheet items:
- cash and equivalents; - overdrafts and short-term bank borrowings.
2.9. OTHER FINANCIAL INDICATORS 2.9.1. EBITDA
Current operating profit excluding net depreciation and amortisation expense and changes in provisions, and impairment losses (after reversals of utilised and non-utilised provisions and of impairment losses). 2.9.2. Free cash flow Cash flow (determined after cost of net debt and net income tax expense, but before changes in working capital) minus net capital expenditure for the period.
2.9.3. Net debt
This represents the aggregate of: - cash and equivalents; - overdrafts and short-term bank borrowings; - non-current and current debt; - financial instruments (used to hedge financial liabilities measured at fair value).
2.10. STATEMENT OF RECOGNISED INCOME AND EXPENSE
The Bouygues group presents a statement of recognised income and expense, disclosing a comparative net profit figure on the line “Total recognised income and expense” which includes income and expenses recognised directly in equity.
47

2.11. COMPARABILITY OF THE FINANCIAL STATEMENTS Changes in the scope of consolidation during the year to date had no material impact on the financial statements for the six months ended 30 June 2011, and do not impair comparability with the financial statements for the six months ended 30 June 2010. Sales generated by the Leadbitter group (Bouygues Construction) in the second quarter of 2011: €121 million. A non-recurring expense of €13 million recognised by Colas in the first half of 2010 has been reclassified from current operating profit to non-current operating profit, in line with the position adopted by the Bouygues group on this issue as of 31 December 2010. Sales recorded in the first half of 2011 and the comparative periods presented by Colas – Mayotte have been reclassified from “International” to “France”, as this overseas territory became an administrative department of France on 1 January 2011. The amounts involved are as follows: - 1st half of 2011 = €36 million - 1st half of 2010 = €32 million - Full year 2010 = €70 million
48

NOTE 3 NON-CURRENT ASSETS
Acquisitions of non-current assets, net of disposals: €715m, vs. €747m in the first half of 2010.
3.1 PROPERTY, PLANT AND EQUIPMENT 6,144
Carrying amountLand and
buldings (a)
Industrial plant
and equipment
Other property,
plant and
equipment
PP&E under
construction and
advance
payments
TOTAL
30 June 2011 1,249 3,564 853 478 6,144
of which finance leases 14 46 9 69
31 December 2010 1,274 3,590 864 431 6,159
of which finance leases 15 49 8 72 (a) Includes land and quarries: €696m, vs. €708m at 31 December 2010 For an analysis of the carrying amount of property, plant and equipment by business segment see Note 12, “Segment Information”.
3.2 GOODWILL 5,552
3.2.1. Movement in the carrying amount of goodwill during the period
(excluding goodwill on associates → see Note 3.4)
Gross value Impairment Carrying amount
31 December 2010 5,611 (80) 5,531
Acquisitions, disposals, remeasurements and other movements 7 19 26
Translation effects (4) 0 (4)
Impairment losses recognised in the period 0 (1) (1)
30 June 2011 5,614 (62) 5,552
3.2.2. Split of goodwill by cash generating unit (CGU) Segment 30 June 2011 31 December 2010
Total % Bouygues Total % Bouygues
Bouygues Construction (subsidiaries) 388 99.97% 347 99.97%
Colas (a) 1,064 96.55% 1,063 96.62%
TF1 (a) 1,449 43.19% 1,468 43.09%
Bouygues Telecom 2,651 89.55% 2,651 89.55%
Other 2
Total 5,552 5,531 (a) Includes goodwill generated at segment level on acquisitions of subsidiaries
49

3.3 CONSOLIDATED CARRYING AMOUNT OF LISTED SHARES (IN EUROS)
Consolidated
carrying amount
per share at
Closing market
price per share
at
30 June 2011 30 June 2011
TF1 13.44 14.42
Colas 88.52 171.12
Alstom (b) 49.81 42.52
(a)
(a)
(a) Includes an estimated control premium (b) See Note 2.7
3.4 INVESTMENTS IN ASSOCIATES 5,062
Carrying amount
31 December 2010 5,020
Translation effects (18)
New equity investments and capital increases, net of divestments (1)
Share of net profit/(loss) for the period 91
Payment of dividends (90)
Other movements 60
30 June 2011 5,062 (a) (a) Includes €4,425m for Alstom (goodwill: €2,593m) and €485m for Cofiroute [Colas]
NOTE 4 CURRENT ASSETS
INVENTORIES 2,811
30 June 2011 31 December 2010
Gross value Impairment Carrying amount Carrying amount
Property development inventories 1,282 (114) 1,168 1,226
Raw materials and finished goods 1,059 (45) 1,014 836
Programmes and broadcasting rights (TF1) 782 (153) 629 618
Total 3,123 (312) 2,811 2,680
50

NOTE 5 CONSOLIDATED EQUITY
5.1 SHARE CAPITAL OF BOUYGUES SA (in euros) €366,250,096
As at 30 June 2011, the share capital of Bouygues SA consisted of 366,250,096 shares with a par value of €1.
Movements during the period were as follows:
Movements during the period
Reductions Increases 30 June 2011
Shares 365,862,523 387,573 366,250,096
Number of shares 365,862,523 0 387,573 366,250,096
Par value €1 €1
Share capital (€) 365,862,523 0 387,573 366,250,096
1 January 2011(a)
(a) After exercise of stock options
5.2 TREASURY SHARES (in euros)
During the first half of 2011, Bouygues SA acquired 5,153,093 of its own shares for a total of €168,956,628.
As of 30 June 2011, Bouygues SA held 9,973,287 of its own shares (2.73% of the capital), with a carrying
amount of €323,623,387.
NOTE 6 – NON-CURRENT AND CURRENT PROVISIONS
6.1 NON-CURRENT PROVISIONS 1,872
Long-term
employee
benefits
(a)
Litigation and
claims
(b)
Guarantees
given
Other non-
current
provisions
(d)
TOTAL
1 January 2011 498 364 372 636 1,870
Translation adjustments (2) 0 0 (1) (3)
Changes in scope of consolidation 0 0 0 (4) (4)
Charges to provisions 24 51 45 34 154
Reversals of provisions (used and unused) (e) (10) (46) (39) (41) (136)
Actuarial gains and losses 2 0 0 0 2
Transfers between items & other movements (6) 1 3 (9) (11)
30 June 2011 506 370 381 615 1,872
(c)
(a) Long-term employee benefits 506
• Lump-sum retirement benefits and long-service awards 451
• Other long-term employee benefits (pension funds of Colas 55
subsidiaries in English-speaking countries) (b) Litigation and claims 370
• Provisions for customer disputes 185
• Provisions for subcontractor claims 42
• Other litigation and claims 143 (c) Guarantees given 381
• Provisions for customer warranties 277
• Provisions for additional building and civil works guarantees 104
51

(d) Other non-current provisions 615
• Provisions for risks related to official inspections and to 202
subsidiaries and other equity investees
• Provisions for site remediation costs 219
• Other non-current provisions 194
(e) Of which reversals of unused provisions: (€64m)
6.2 CURRENT PROVISIONS 853
Provisions related to the operating cycle
Provisions
for customer
warranties
Provisions for
project risks
and project
completion
Provisions for
expected
losses to
completion
(a)
Other
current
provisions
(b)
TOTAL
1 January 2011 57 294 282 297 930
Translation adjustments (1) (3) (5) (4) (13)
Changes in scope of consolidation 0 (2) 0 2 0
Charges to provisions 8 72 31 47 158
Reversals of provisions (used or unused) (c) (7) (71) (70) (71) (219)
Transfers between items & other movements (1) (3) 0 1 (3)
30 June 2011 56 287 238 272 853
(a) Provisions for expected losses to completion: these relate to construction projects (Bouygues
Construction, Bouygues Immobilier and Colas). Individual project provisions are not disclosed for confidentiality reasons.
(b) The main items included in “Other current provisions” are reinsurance costs, the current portion
of site remediation costs, rent guarantees (Bouygues Immobilier), film co-financing (TF1), customer claims and vendor’s liability guarantees (TF1), and the business customer loyalty programme provision (Bouygues Telecom).
(c) Of which reversals of unused provisions: (€52m)
52

NOTE 7 – NON-CURRENT AND CURRENT DEBT
7.1 BREAKDOWN OF DEBT BY MATURITY
Current debt: less than one year
Total Total Total Total
30 June 2011 31 Dec. 2010 30 June 2011 31 Dec. 2010
Bond issues 185 901 6,086 6,085
Bank borrowings 42 32 632 556
Finance leases 26 23 40 47
Other debt 15 38 77 62
Total debt 268 994 6,835 6,750
Non-current debt
(1) (1) Bouygues SA: the 2003 bond issue of €750m was redeemed in full in February 2011 (current debt).
7.2 COVENANTS AND TRIGGER EVENTS
The bond issues maturing in 2013, 2015, 2016, 2018, 2019 and 2026 contain a change of control clause relating
to Bouygues SA.
The bank loans contracted by Bouygues and its subsidiaries are not subject to any financial covenants or trigger
events.
NOTE 8 – MAIN COMPONENTS OF CHANGE IN NET DEBT
31 December 2010Movement in the
period
30 June
2011
Cash and equivalents 5,576 (2,273) 3,303
Ovedrafts and short-term bank borrowings (294) (236) (530)
Net cash and equivalents 5,282 (2,509) 2,773
Non-current debt (6,750) (85) (6,835)
Current debt (994) 726 (268)
Financial instruments, net (11) 0 (11)
Total debt (7,755) 641 (7,114)
Net debt (2,473) (1,868) (4,341)
(a)
(a) Net cash flows as analysed in the cash flow statement for the period
53

NOTE 9 – ANALYSIS OF SALES AND OTHER REVENUES FROM OPERATIONS
9.1 ANALYSIS BY ACCOUNTING CLASSIFICATION
First half
2011 2010
Sales of goods 1,392 1,136
Sales of services 5,966 6,098
Construction contracts 7,856 7,421
Sales 15,214 14,655
Other revenues from operations 58 76
Total 15,272 14,731
(a)
(a) Year-on-year growth of 3.8%
9.2 CONTRIBUTION OF BUSINESS SEGMENTS TO CONSOLIDATED SALES
Sales for the first half of 2011 Sales for the first half of 2010
France International Total % France International Total %
Construction 2,600 2,040 4,640 31% 2,387 1,990 4,377 30%
Property 1,048 50 1,098 7% 1,164 141 1,305 9%
Roads 3,466 1,878 5,344 35% 3,038 1,933 4,971 34%
Media 1,088 180 1,268 8% 1,082 188 1,270 9%
Telecoms 2,859 0 2,859 19% 2,725 0 2,725 18%
Bouygues SA & other activities 3 2 5 0% 5 2 7 0%
Consolidated sales 11,064 4,150 15,214 100% 10,401 4,254 14,655 100%
% year-on-year change 6.4% (2.4)% 3.8%
BUSINESS SEGMENT
(a)
(a) Includes export sales
9.3 ANALYSIS OF CONSOLIDATED SALES BY BUSINESS SEGMENT
Construction Property Roads Media Telecoms
Bouygues SA
& other
activities
TOTAL H1
2011
TOTAL H1
2010
Total sales 4,705 1,098 5,400 1,278 2,866 64 15,411 14,932
Inter-segment sales (65) 0 (56) (10) (7) (59) (197) (277)
Third-party sales 4,640 1,098 5,344 1,268 2,859 5 15,214 14,655
54
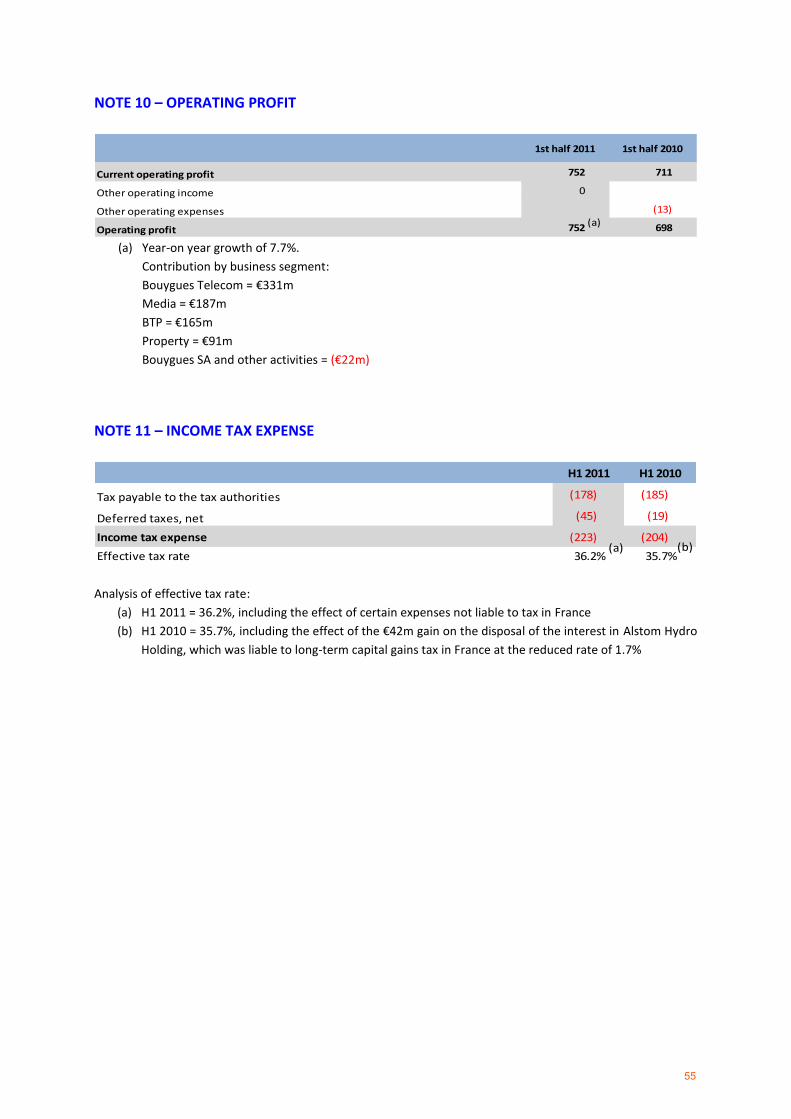
NOTE 10 – OPERATING PROFIT
1st half 2011 1st half 2010
Current operating profit 752 711
Other operating income 0
Other operating expenses (13)
Operating profit 752 698 (a)
(a) Year-on year growth of 7.7%.
Contribution by business segment:
Bouygues Telecom = €331m
Media = €187m
BTP = €165m
Property = €91m
Bouygues SA and other activities = (€22m)
NOTE 11 – INCOME TAX EXPENSE
H1 2011 H1 2010
Tax payable to the tax authorities (178) (185)
Deferred taxes, net (45) (19)
Income tax expense (223) (204)
Effective tax rate 36.2% 35.7%(a) (b)
Analysis of effective tax rate:
(a) H1 2011 = 36.2%, including the effect of certain expenses not liable to tax in France
(b) H1 2010 = 35.7%, including the effect of the €42m gain on the disposal of the interest in Alstom Hydro
Holding, which was liable to long-term capital gains tax in France at the reduced rate of 1.7%
55

NOTE 12 – SEGMENT INFORMATION The table below shows the contribution made by each business segment to key items in the income statement,
the balance sheet and the cash flow statement.
ANALYSIS BY BUSINESS SEGMENT: SIX MONTHS ENDED 30 JUNE 2011
Construction Property Roads Media Telecoms
Bouygues SA
& other
activities
TOTAL TOTAL
INCOME STATEMENT H1 2011 H1 2010
Operating profit 165 91 0 187 331 (22) 752 698
Net profit attrbutable to the Group 94 56 2 51 191 (3) 391 532
BALANCE SHEET 30/06/11 31/12/10
Property, plant & equipment and intangible assets663 17 2,455 310 3,506 159 7,110 7,149
0
Net debt 2,236 390 (1,046) 11 (619) (5,313) (4,341) (2,473)
OTHER FINANCIAL INDICATORS H1 2011 H1 2010
Acquisitions of property, plant & equipment 121 4 159 18 348 1 651 501
and intangible assets, net of disposals
EBITDA 252 86 190 234 665 (19) 1,408 1,384
Cash flow 260 94 220 220 659 49 1,502 1,457
Free cash flow 66 65 36 149 197 (19) 494 590
56

NOTE 13 RELATED-PARTY INFORMATION
Expenses Income Receivables Liabilities
Transactions 2011 2010 2011 2010 2011 2010 2011 2010
Parties with an ownership interest 3 1 3 1 1
Joint ventures 14 15 66 72 238 205 79 105
Associates 4 2 64 42 122 49 12 20
Other related parties 4 22 22 6 71 69 73 57
Total 25 39 153 123 431 323 165 183
Maturityless than 1 year 349 275 97 1831 to 5 years 22 31 68more than 5 years 60 17of which impairment of doubtful receivables (mainly non-consolidated companies) 78 77
(1(2(3) (a)
(a) Includes €56m of dividends receivable from Alstom as of 30 June 2011.
Identity of related parties:
- Parties with an ownership interest: SCDM (company controlled by Martin and Olivier Bouygues).
- Joint ventures: primarily quarry companies, project joint ventures and property development companies.
- Associates: includes in particular transactions with concession companies.
- Other related parties: mainly comprises transactions with non-consolidated companies in which the
Group has an equity interest.
NOTE 14 – PRINCIPAL EXCHANGE RATES
Convention: 1 local currency unit = x euros
Closing euro exchange rate (1) Average rate for the period (2)
Country Currency unit 30/06/2011 31/12/2010 1st half 2011 Full year 2010
EUROPE
Denmark Danish krone 0.134072 0.134165 0.134108 0.134269
United Kingdom Pound sterling 1.107972 1.161778 1.139883 1.168215
Hungary Hungarian forint 0.003758 0.003598 0.003732 0.003617
Poland Polish zloty 0.250608 0.251572 0.252278 0.249695
Czech Republic Czech koruna 0.041076 0.039903 0.041030 0.039583
Romania Romanian leu 0.235655 0.234632 0.239652 0.237141
Switzerland Swiss franc 0.828432 0.799744 0.790004 0.729949
NORTH AMERICA
United States US dollar 0.691898 0.748391 0.702321 0.757189
Canada Canadian dollar 0.716794 0.750638 0.722569 0.732055
REST OF THE WORLD
Morocco Moroccan dirham 0.088277 0.089497 0.088542 0.089724
Thailand Thai baht 0.022533 0.024894 0.023082 0.023913
Hong Kong Hong Kong dollar 0.088909 0.096287 0.090243 0.097455
African Financial Community CFA franc 0.001524 0.001524 0.001524 0.001524
South Africa South African rand 0.101452 0.112835 0.102278 0.103544
(1) Translation of the balance sheet
(2) Translation of the income statement
57

BOUYGUES/2011 Half-year review Certificate of responsibility
CERTIFICATE OF RESPONSIBILITY
I certify that to the best of my knowledge the condensed consolidated first-half financial statements for the past half-year have been prepared in accordance with the relevant accounting standards and give a true and fair view of the assets and liabilities, financial position and results of the company and of affiliated undertakings and that the attached half-year review provides an accurate representation of significant events in the first six months of the year and of their impact on the first-half financial statements, of the main related-party transactions and of the main risks and uncertainties for the remaining six months. Done at Paris, 30 August 2011 Chairman and CEO Martin Bouygues
58

BOUYGUES/2011 Half-year review Auditors’ report 59
AUDITORS' REPORT ON THE FIRST-HALF FINANCIAL STATEMENTS
for the period 1 January to 30 June 2011
This is a free translation into English of the statutory auditors' review report on the half-yearly consolidated financial statements issued in French and it is provided solely for the convenience of English-speaking users. This report also includes information relating to the specific verification of information given in the Group’s interim management report. This report should be read in conjunction with and construed in accordance with French law and professional standards applicable in France. To the Shareholders, In compliance with the assignment entrusted to us by Shareholders meeting and in accordance with the requirements of article L.451-1-2 III of the French monetary and financial code (Code monétaire et financier), we hereby report to you on:
the review of the accompanying condensed half-yearly consolidated financial statements of Bouygues, for the period from January 1 to June 30, 2011, and;
the verification of the information contained in the interim management report.
These condensed half-yearly consolidated financial statements are the responsibility of the board of directors. Our role is to express a conclusion on these financial statements based on our review.
1. Conclusion on the financial statements
We conducted our review in accordance with professional standards applicable in France. A review of interim financial information consists of making inquiries, primarily of persons responsible for financial and accounting matters, and applying analytical and other review procedures. A review is substantially less in scope than an audit conducted in accordance with professional standards applicable in France and consequently does not enable us to obtain assurance that we would become aware of all significant matters that might be identified in an audit. Accordingly, we do not express an audit opinion. Based on our review, nothing has come to our attention that causes us to believe that these condensed half-yearly consolidated financial statements are not prepared in all material respects, in accordance with IAS 34 – standard of the IFRSs as adopted by the European Union applicable to interim financial information.
2. Specific verification
We have also verified the information presented in the interim management report in respect of the condensed half-yearly consolidated financial statements subject to our review. We have no matters to report as to its fair presentation and its consistency with the condensed half-yearly consolidated financial statements. Courbevoie and Paris-La Défense, August 30, 2011
The statutory auditors French original signed by
Mazars Gilles Rainaut
ERNST & YOUNG Audit Jean Bouquot