half year results presentation - trgplc.com results... · capital expenditure and development 8...
TRANSCRIPT

Half year results presentation 26 Weeks to 2 July 2017
1
Good progress on strategic initiatives
• Fundamentally improved value positioning and food offer in Frankie & Benny’s
• Restaurant technology roll-out complete, facilitating serving customers better
• Healthy pipeline of opportunities to advance growth in Pubs and Concessions
• Good progress on cost reduction
• Team strengthened
2017 Half year results 2

Early signs of improved volume momentum within our Leisure business
3 2017 Half year results
2017 H1
Leisure business
YoY, 6 month moving average
2016 H2 2017 H2
LFL Sales
LFL Covers

2 0 1 7 H a l f y e a r r e s u l t s
4
Financial review

Financial highlights
5 2017 Half year results
• FY 2017 COGS margin expected to be between 1.5% to 1.8% adverse to FY16 reflecting impact of new menus and promotional activity
Column1
2017 HY
26 weeks
£m
2016 HY
27 weeks
£m
%
Change
Revenue 333.1 358.7 (7.1%)
Like-for-like % (2.2%)
EBITDA* 44.3 59.6 (25.7%)
EBITDA margin %* 13.3% 16.6%
EBIT / Operating profit* 26.5 37.5 (29.5%)
Operating margin %* 7.9% 10.5%
PBT* 25.5 36.6 (30.4%)
Earnings per share* 10.0p 14.3p (30.0%)
* Adjusted (pre-exceptional charge)
Tot al sales decrease on a 26 week basis is (1.9%)

Exceptional charges
6 2017 Half year results
• 3 sites identified for closure
Column1
Property
provisions
£m
Impairment of
property, plant &
equipment
£m
Restructuring
costs
£m
Total
£m
Closed sites (0.7) 0.4 - (0.3)
Distressed/closure sites 5.1 3.9 - 9.0
Change in discount rate assumption 9.8 - - 9.8
Restructuring - - 4.2 4.2
2017 HY Exceptional charge 14.2 4.3 4.2 22.7

7 2017 Half year results
Cost headwinds
• Underlying purchase cost inflation for 2018 currently anticipated to be c.£4m
• Expect to mitigate c.50% of 2018 cost increases via:
– Continuing to leverage purchasing scale
– Improved labour scheduling and deployment
– Overhead savings
2017 cost headwinds 2018 statutory/contractual cost headwinds
Column1 £m
NLW / NMW / Apprentice levy 4
Rent and rates 5
Purchase cost inflation 6
Utilities 2
Total 17
Column1 £m
NLW / NMW / Apprentice levy/Auto-
enrolment5
Rent and rates 4
Sugar tax 1
Utilities 3
Total 13
Capital expenditure and development
8 2017 Half year results
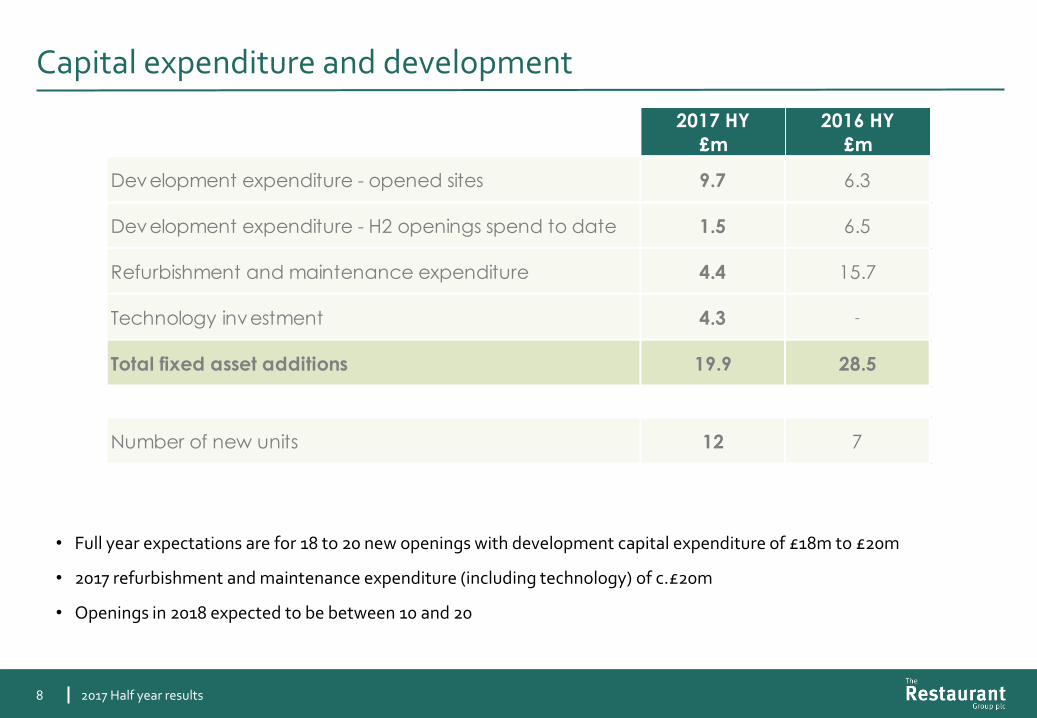
• Full year expectations are for 18 to 20 new openings with development capital expenditure of £18m to £20m
• 2017 refurbishment and maintenance expenditure (including technology) of c.£20m
• Openings in 2018 expected to be between 10 and 20
Column1
2017 HY
£m
2016 HY
£m
Development expenditure - opened sites 9.7 6.3
Development expenditure - H2 openings spend to date 1.5 6.5
Refurbishment and maintenance expenditure 4.4 15.7
Technology investment 4.3 -
Total fixed asset additions 19.9 28.5
Number of new units 12 7

Cash flow
9 2017 Half year results
Column1
2017 HY
£m
2016 HY
£m
Adjusted operating profit* 26.5 37.5
Working capital and non-cash adjustments 1.5 1.3
Depreciation 17.8 22.1
Cash inflow from operations 45.8 60.9
Net interest paid (0.3) (0.4)
Tax paid (1.7) (9.0)
Maintenance capital expenditure (8.7) (15.7)
Free cash flow 35.1 35.8
Development capital expenditure (11.2) (12.8)
Movement in capital creditor (2.2) (10.5)
Utilisation of property provisions (7.0) -
Restructuring costs (5.5) -
Other items (0.2) 1.6
Cash inflow 9.0 14.1
Net bank debt at start of period (28.3) (28.4)
Comparable net bank debt at end of period (19.3) (14.3)
Div idend paid - (21.3)
Net bank debt at end of period (19.3) (35.6)
* Adjusted (pre-exceptional charge)
Balance sheet and key ratios
10 2017 Half year results
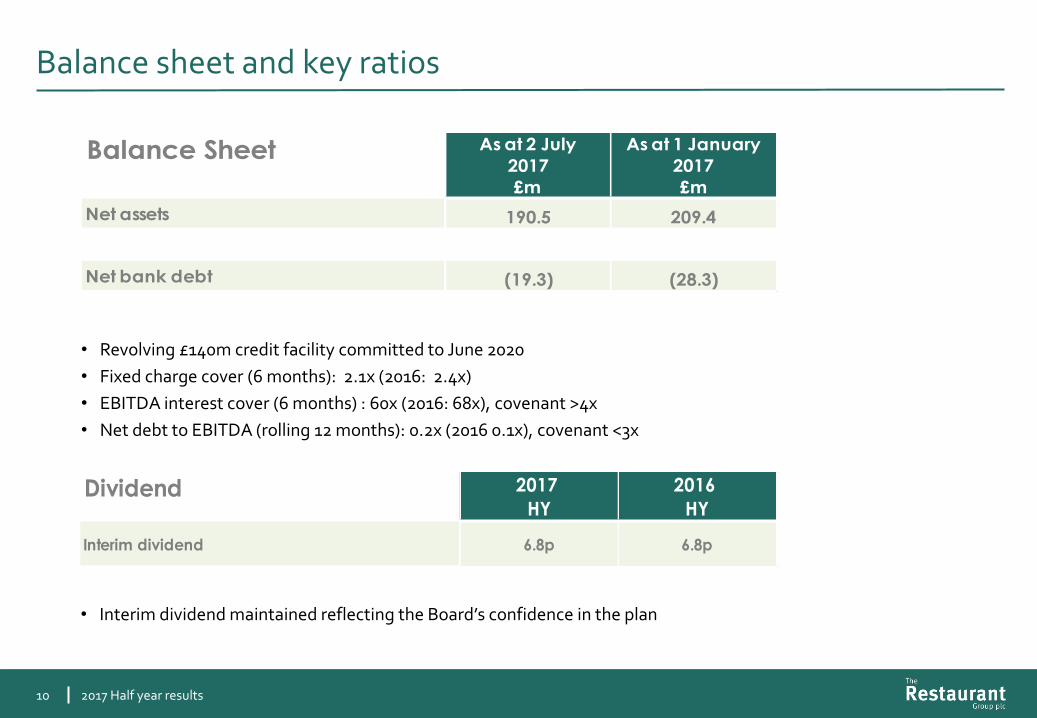
• Revolving £140m credit facility committed to June 2020
• Fixed charge cover (6 months): 2.1x (2016: 2.4x)
• EBITDA interest cover (6 months) : 60x (2016: 68x), covenant >4x
• Net debt to EBITDA (rolling 12 months): 0.2x (2016 0.1x), covenant <3x
• Interim dividend maintained reflecting the Board’s confidence in the plan
Dividend 2017
HY
2016
HY
Interim dividend 6.8p 6.8p
Balance Sheet As at 2 July
2017
£m
As at 1 January
2017
£m
Net assets 190.5 209.4
Net bank debt (19.3) (28.3)

2 0 1 7 H a l f y e a r r e s u l t s
11
Business review

Grow our Pubs and Concessions businesses
Re-establish competitiveness of our Leisure brands
Our plan
Build a leaner, faster and more focused organisation
Serve customers better and more efficiently
1
2
3
2017 Half year results
4
12

Re-establishing competitiveness of our Leisure brands
13
1
• New core menu rolled out – highly competitive value positioning, improved food offer
• More competitive £9.95 two course fixed price menu
• Distinctive new kids’ menu rolled out
• Improved marketing and affiliate presence
Progress to date
• Two-tier value menu launched
• Trial menu launched in 20 sites
• Affiliate partnerships launched
• Increased delivery penetration
• Change of leadership
• Improved recent trading momentum via discounting
• Opened pilot site for a new concept
2017 Half year results
Next steps
• Further menu improvements
• Innovative new product development on trial
• Marketing re-launch towards end of year
• Piloting restaurant ‘capital refresh’
• Roll-out of adapted menu to further 20 sites in September
• National roll-out thereafter
• Further delivery roll-out
• Apply learnings from pilot
• Potential reformatting of further sites

Re-establishing competitiveness of Frankie & Benny’s
2017 Half year results 14
1
Restored value credentials Improved food offer Marketing to attract back lapsed customers
• Mains entry prices reduced by 22% • LFL mains prices reduced by 7% /
volume up by 7% • Fixed price £9.95 menu continues to
perform well
Competitor Set: Bella Italia, Pizza Express, Zizzi , Prezzo, TGIF Sources: MCA, company websites
Pricing relative to casual dining competitors
Old menu New menu
New sharing options
New dishes introduced
-9%
3% 5% 8%
10%
1%
10%
-32%
-7% -11%
-15% -15% -13%
-6%
Spring Summer 2016
July 2017

Frankie & Benny’s case study: Kids’ menu
15
1
Old kids’ menu
New kids’ menu
YoY LFL kids’ menu covers • New menu rolled out in June following customer testing – Better value – Much improved food offer – Easier / more impactful navigation
New menu launched
June July August
2017 Half year results
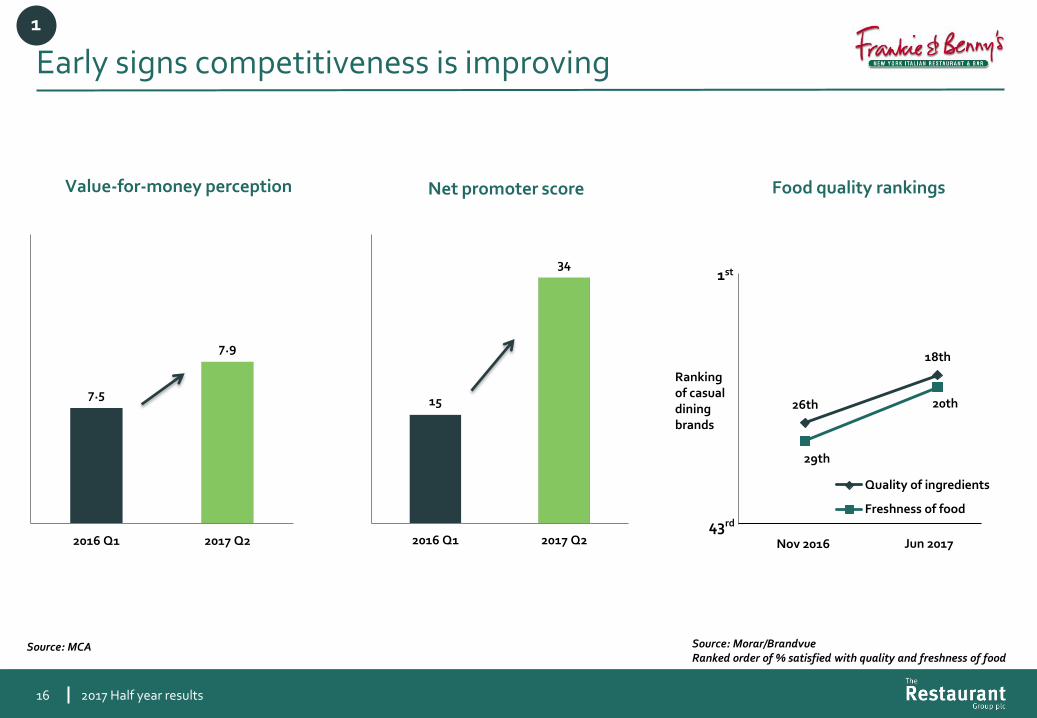
Early signs competitiveness is improving
2017 Half year results 16
1
Value-for-money perception Food quality rankings
Source: Morar/Brandvue Ranked order of % satisfied with quality and freshness of food
26th
18th
29th
20th
Quality of ingredients
Freshness of food
Ranking of casual dining brands
Source: MCA
15
34
2016 Q1 2017 Q2
7.5
7.9
2016 Q1 2017 Q2
Net promoter score
Nov 2016 Jun 2017
01st
43rd

Re-establishing competitiveness of Chiquito
17
1
FY 2014 FY 2015 FY 2016 YTD 2017
Fixed-price value menu (% of sales)
Original menu
Trial menu
• New fixed-price value menu performing well
• New menu:
– Trial of new ‘accessible’ menu in 20 sites
– Trial extending in September to half the estate
– Full roll-out thereafter
• Increased penetration of delivery
2017 Half year results

Other Leisure brands
2017 Half year results 18
1
• Declining LFL sales but improved recent momentum as a result of discounting
• New brand proposition:
– Emphasis on high quality steaks and burgers – Fries your way / sauce station – Open-fire flame grilled cooking – Highly competitive pricing
• Launched earlier this month in 1 pilot site, a converted
Coast to Coast in Northampton
• Solid trading
• Not strategic priorities

Serving customers better and more efficiently 2
2017 Half year results
• Completed deployment of new restaurant technology, enabling:
– Improved labour forecasting and scheduling
– Increased bookings
– Quicker ordering and payment processing / faster table turns (3% faster)
– Increased attachment of side dishes (+12%)
• Stripping out unnecessary back of house processing
• New service training in development for deployment in H2
• Upcoming trials of:
– Mobile order and pay
– Click and collect
• Planning customer facing digital upgrade for launch in 2018
Correct for under-staffing at peak times
Serve more tables, more quickly
19

Growing our Pubs and Concessions businesses
• Strong trading performance
• Customer ratings 4.4/5
• Good success hosting community events
• 2 pubs opened
• Increased resources focused on growing the estate
• Number of prospects for new sites increasing
3
20
• Solid trading performance
• Opened new pub “The Smithfield” in Luton airport
• Secured a 7-year renewal term for one of the largest concessions at Heathrow
• Expect to secure several new concessions in H2
2017 Half year results

Build a leaner, faster and more focused organisation
2017 Half year results
4
Initiative Stage of completion
◑
21
• Central roles restructured (c.100) – Head office roles reduced – Streamlined field ops structure – Investment in marketing, digital and analytical resources
• Centralising purchasing to leverage scale of group – Rationalisation of suppliers – Centralising logistics
• Reduction in overheads – Improved energy management – Improved supplier pricing
2017 c.£10m savings invested back into price, product and marketing
◕
●
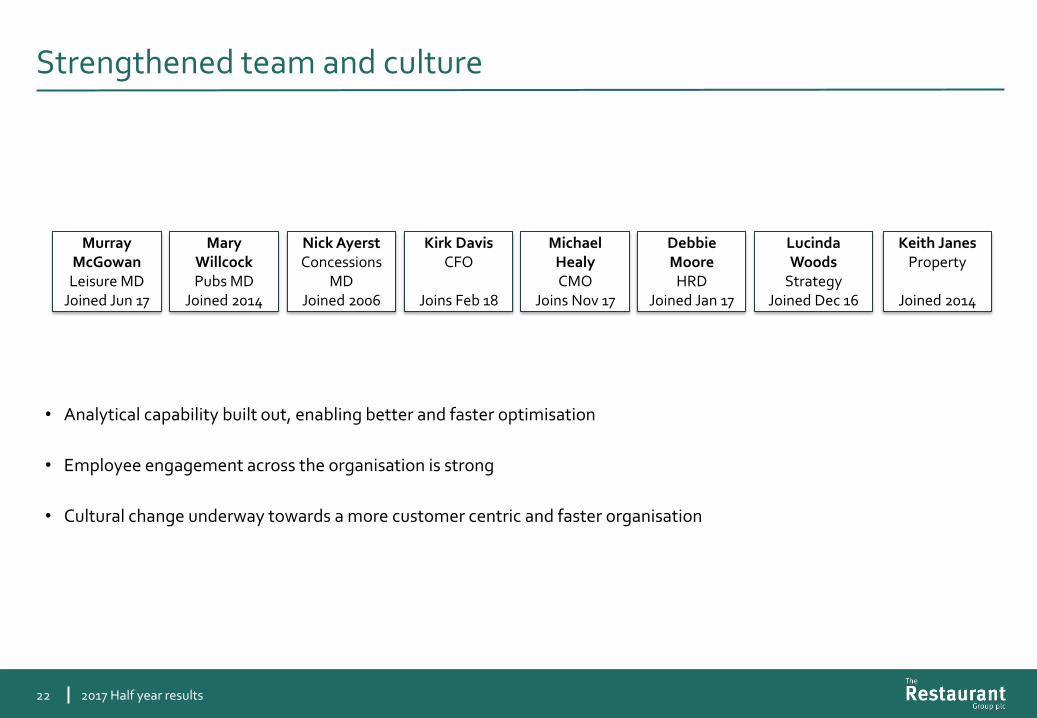
Strengthened team and culture
2017 Half year results 22
• Analytical capability built out, enabling better and faster optimisation
• Employee engagement across the organisation is strong
• Cultural change underway towards a more customer centric and faster organisation
Murray McGowan
Leisure MD Joined Jun 17
Mary Willcock Pubs MD
Joined 2014
Nick Ayerst Concessions
MD Joined 2006
Kirk Davis CFO
Joins Feb 18
Michael Healy CMO
Joins Nov 17
Debbie Moore
HRD Joined Jan 17
Lucinda Woods
Strategy Joined Dec 16
Keith Janes Property
Joined 2014
Summary
2017 Half year results 23
• 2017 a transitional year
• Progressing on track against a clear plan
• Customers are benefitting from better value and improved offering
• Early signs of improved volume momentum within our Leisure business
• Current trading in line with our expectations
• Maintenance of dividend reflects continued confidence in the plan