half year results presentation 2013
TRANSCRIPT

Half Year Results Presentation 2013

• Key Points
• Financial Outcomes
• KFC
• Pizza Hut
• Starbucks Coffee
• Carl’s Jr
• Outlook
Contents

Key Points
• Net Profit after Tax for the half year (excluding non-trading items) was $8.8 million (9.0 cents per share), up 2.4%. Reported profit (including non-trading items) was $6.9 million.
• Total revenues of $167.2 million were up 0.2% on the prior year. Same store sales were up 0.5%, driven by a significant improvement in Pizza Hut (up 19.5%).
• Total brand EBITDA was $27.0 million, an increase of $1.0 million (4.0%) on the previous half year with higher earnings for KFC and Pizza Hut partly offset by reduced earnings for Starbucks Coffee.
• G&A costs up $1.0 million (16.6%) with increased focus on HR and IS projects and Carl’s Jr establishment costs.
• A fully imputed interim dividend is payable on 23 November 2012 of 6.5 cents per share, consistent with last year.

Financial Outcomes

Consolidated NPAT* was $8.8 million, up 2.4% on prior year and consistent with earlier years
$m 1H2009 1H2010 1H2011 1H2012 1H2013
Revenue 162.5 169.9 176.6 166.8 167.2
Gross Margin 27.5 31.7 37.6 29.0 29.3
Distribution (2.4) (2.1) (2.0) (1.7) (1.5)Marketing (10.2) (8.6) (8.1) (8.6) (7.9)G&A (5.6) (7.0) (7.3) (6.2) (7.2)
EBIT 9.3 14.0 20.2 12.5 12.6
Non‐trading (3.2) (0.5) (0.6) (1.7) (2.9)
Interest (2.5) (0.9) (0.6) (0.7) (0.4)
NPBT 3.6 12.6 19.0 10.1 9.3
Tax (1.0) (3.7) (5.5) (2.6) (2.4)
NPAT 2.6 8.9 13.5 7.5 6.9
NPAT (excl non‐trading) 4.9 9.2 13.9 8.6 8.8
* Excluding non‐trading
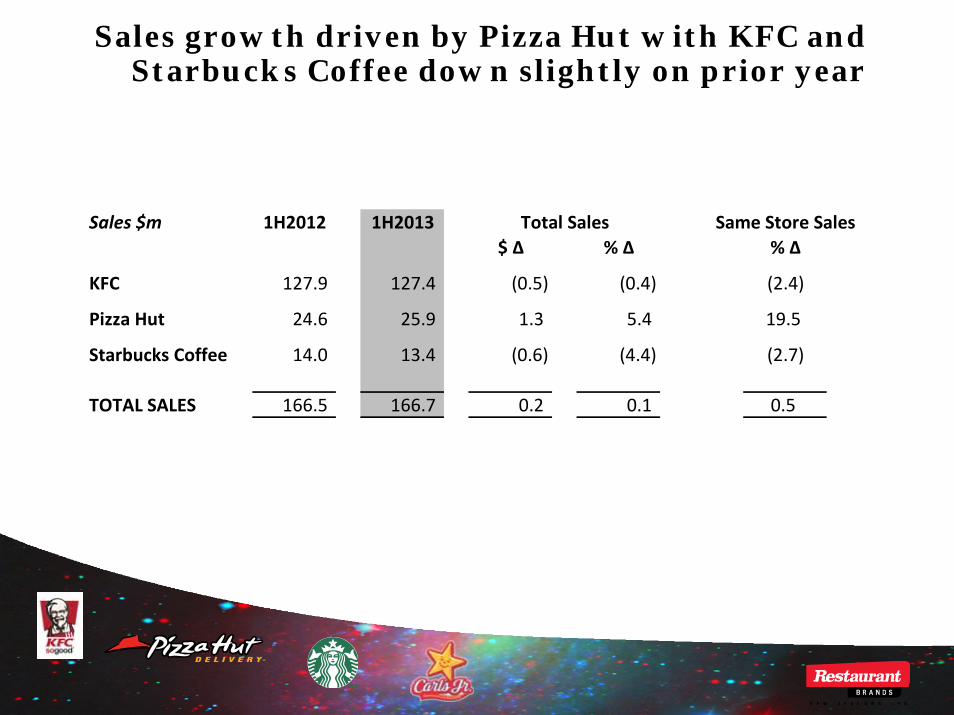
Sales growth driven by Pizza Hut with KFC and Starbucks Coffee down slightly on prior year
Sales $m 1H2012 1H2013 Total Sales Same Store Sales$ Δ % Δ % Δ
KFC 127.9 127.4 (0.5) (0.4) (2.4)
Pizza Hut 24.6 25.9 1.3 5.4 19.5
Starbucks Coffee 14.0 13.4 (0.6) (4.4) (2.7)
TOTAL SALES 166.5 166.7 0.2 0.1 0.5

Despite some input cost increases, KFC and Pizza Hut saw overall margins improve by $1.0 million (4.0%)
EBITDA $m 1H2011 1H2012 1H2013 $ Δ % Δ2012/13 2012/13
KFC 28.8 23.2 23.9 0.7 2.9
Pizza Hut 3.1 1.0 1.7 0.7 59.5
Starbucks Coffee 2.0 1.7 1.4 (0.3) (15.5)
TOTAL 33.9 25.9 27.0 1.0 4.0
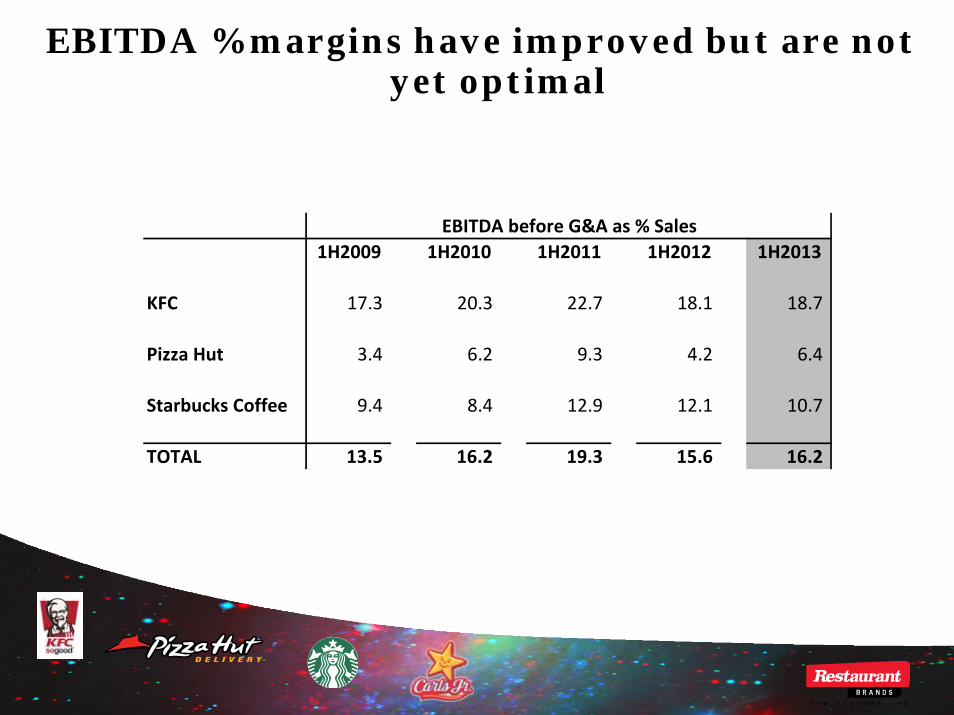
EBITDA % margins have improved but are not yet optimal
1H2009 1H2010 1H2011 1H2012 1H2013
KFC 17.3 20.3 22.7 18.1 18.7
Pizza Hut 3.4 6.2 9.3 4.2 6.4
Starbucks Coffee 9.4 8.4 12.9 12.1 10.7
TOTAL 13.5 16.2 19.3 15.6 16.2
EBITDA before G&A as % Sales

G&A costs are up significantly on prior year with new initiatives
$m 1H2012 1H2013
G&A 1H 2012 6.2 6.2
Carl's Jr ‐ *0.4
Information Services ‐ 0.1
HR ‐ 0.2
Other ‐ 0.3
Reported G&A 6.2 7.2
% Sales 3.7% 4.3%
*includes development prespend

2012/13 G&A initiatives – preparing the business for future growth
• New Payroll and HR systems
• IS Projects
• Marketing Projects
• Website upgrades
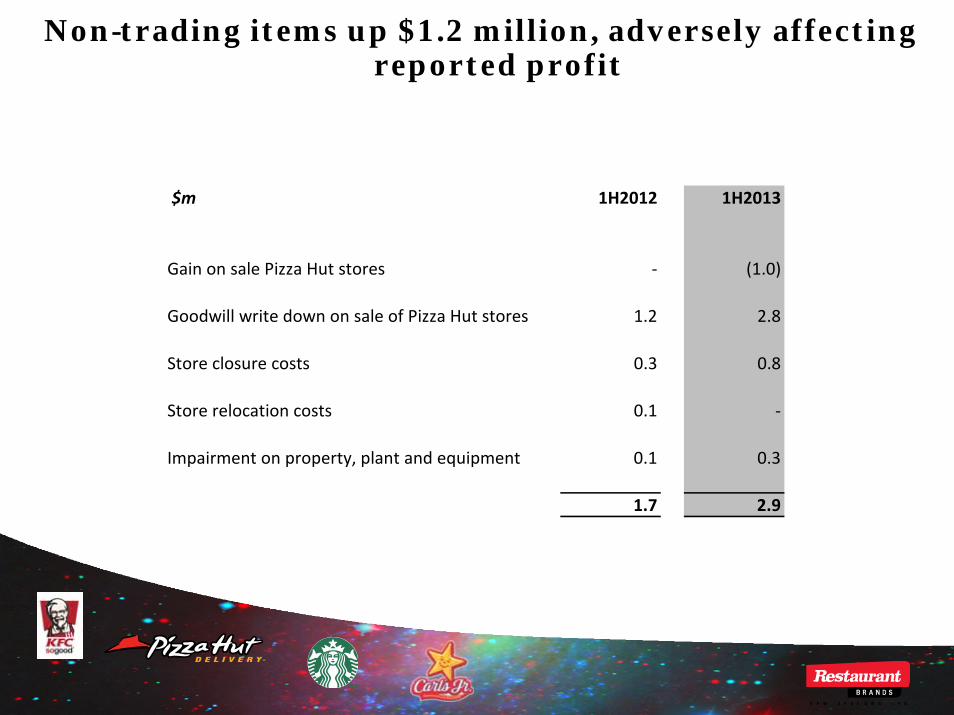
Non-trading items up $1.2 million, adversely affecting reported profit
$m 1H2012 1H2013
Gain on sale Pizza Hut stores ‐ (1.0)
Goodwill write down on sale of Pizza Hut stores 1.2 2.8
Store closure costs 0.3 0.8
Store relocation costs 0.1 ‐
Impairment on property, plant and equipment 0.1 0.3
1.7 2.9

Higher operating cash flows (assisted by some working capital movements) and lower investing cash flows
(assisted by Pizza Hut store sales) have enabled further debt reduction
Cashflow $m 1H2010 1H2011 1H2012 1H2013
Operating Cashflow 23.4 26.0 15.2 19.8
Investing Cashflow (4.5) (13.4) (10.9) (3.1)
Free Cashflow 18.9 12.6 4.3 16.7
1H2010 1H2011 1H2012 1H2013
Bank Debt $m 19.7 12.6 17.8 6.4

Current facility maintains ample headroom on current debt levels. All ratios remain solid
Bank Facility 1H2010 1H2011 1H2012 1H2013
Westpac $45m $35m $35m $35m
Ratios 1H2010 1H2011 1H2012 1H2013
Interest Cover 16.8x 35.3x 17.3x 29.2x
Net Debt: EBIT 1.4:1 0.6:1 1.4:1 0.5:1
Gearing (D:D+E) * 32% 19% 24% 10%
*Debt excluding cash and finance leases

Dividend has been held at prior year level
1H2009 1H2010 1H2011 1H2012 1H2013
NPAT excl non‐trading cps 5.0 9.5 14.2 8.7 9.0
Interim dividend cps 3.0 4.5 7.0 6.5 6.5*
* Imputed at 29% (average)

KFC Operations
Sales $127.4m (0.4)%
EBITDA $23.9m 2.9%

KFC saw an improvement in same store sales
+0.3%
(3.5%)
(1.6%)(1.9%)
(6.4%)
+0.7%
-7.0%
-6.0%
-5.0%
-4.0%
-3.0%
-2.0%
-1.0%
0.0%
1.0%
2.0%
Q1 2011/12 Q2 2011/12 Q3 2011/12 Q4 2011/12 Q1 2012/13 Q2 2012/13
Sam
e S
tore
Sal
es %
Quarterly Same Store Sales - KFC

Whilst EBITDA improved on prior year, EBITDA margin was slightly below target with effect of input price increases
and value strategies
KFC HY1 2009 HY1 2010 HY1 2011 HY1 2012 HY1 2013
EBITDA $m 19.0 24.0 28.8 23.2 23.9
EBITDA Margin (% of sales) 17.3% 20.3% 22.7% 18.1% 18.7%
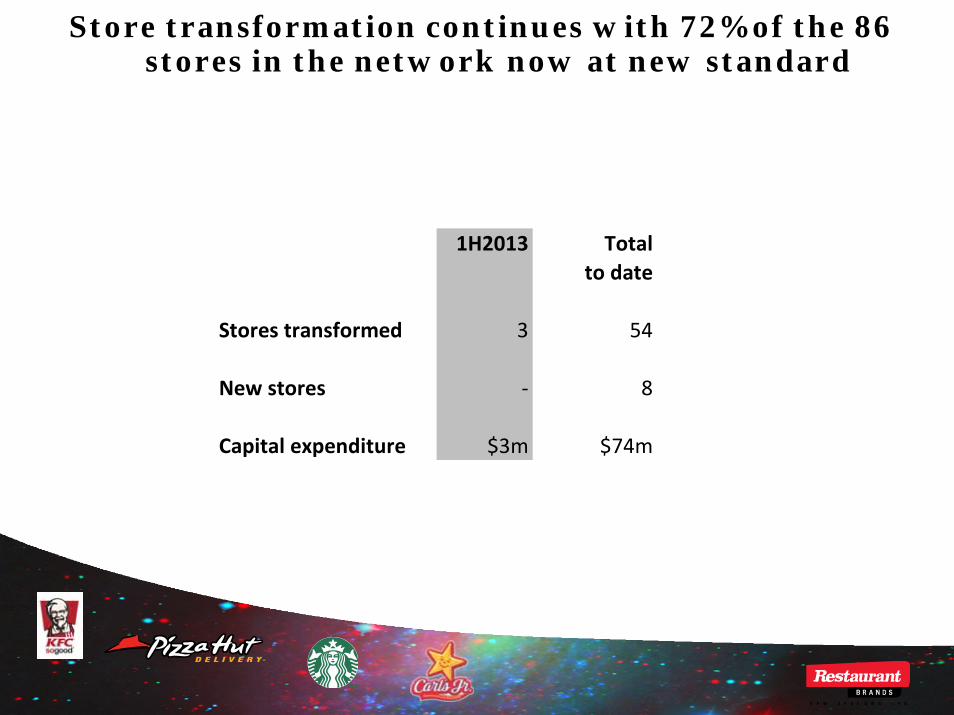
Store transformation continues with 72% of the 86 stores in the network now at new standard
1H2013 Totalto date
Stores transformed 3 54
New stores ‐ 8
Capital expenditure $3m $74m

Transformed stores continue to deliver growth
WPRA WPRA % Δ pre transformation post transformation
Store 1 $29.6k $35.3k 19%
Store 2 $46.6k $53.7k 15%
Store 3 $45.6k $57.6k 26%

Transformation enters a new phase with the opening of Lower Hutt and Silverdale stores
• Upgraded store design
• Digital menu boards (in store and drive through)
• BOH production line improvements
• Partial table service

KFC Lower Hutt

KFC Silverdale

Strategy Mark Outcome
Continue focus on positive SSS growth Q2 SSS positive and Q3 started positive despite rolling over RWC
EBITDA margin >20% through supply chain opportunities, loss prevention and continued operations improvements
Improved but not to required level
Introduction of next phase of transformation (Lower Hutt)
Successful opening of Lower Hutt
Complete 7 transformations 3 this half – on target for full year
Scorecard 1H 2013KFC strategies for the new year

Pizza Hut Operations
Sales $25.9m 5.4%
EBITDA $1.7m 59.5%

A significant turnaround in the Pizza Hut business on the back of the $4.90 campaign
(15.7%)(13.5%)
+10.4%
+26.5%
(5.3%)(1.6%)
-20.0%
-15.0%
-10.0%
-5.0%
0.0%
5.0%
10.0%
15.0%
20.0%
25.0%
30.0%
Q1 2011/12 Q2 2011/12 Q3 2011/12 Q4 2011/12 Q1 2012/13 Q2 2012/13Sam
e S
tore
Sal
es %
Quarterly Same Store Sales - Pizza Hut

EBITDA margin also up strongly (59%) with sales leverage, store rationalisation and cost reductions
Pizza Hut HY1 2009 HY1 2010 HY1 2011 HY1 2012 HY1 2013
EBITDA $m 1.2 2.2 3.1 1.0 1.7
EBITDA Margin (% of sales) 3.4% 6.2% 9.3% 4.2% 6.4%

Strategy Mark Outcome
Drive sales to maintain leverage through website, value offers, NPD
Weekly sales up with strong value offer and new website
Supply Chain and other initiatives to reduce input costs (cheese, freight, call centre)
Lower input costs and call centre rationalisation benefits
Trial PHD opportunity in Hamilton X Trial on hold
Continued operations focus (waste, loss prevention)
Some progress, especially with higher volumes reducing waste
Continued store sales to independent franchisees (10+ targeted)
Seven stores sold this 1H. Five more targeted in 2H
Pizza Hut delivering strongly on strategies for current year

The sale of Pizza Hut stores to independent franchisees remains on target
Average selling price $300k
Book gain on disposal $1.0 million
Goodwill write down $2.8 million
RBD gains:
• Royalty share
• Continued Adco contribution
• Supply Chain contribution
2H2012 2014‐15(F)
85 84 83 82
1120
42
63
40
Total Stores
74
Company stores
13Franchisee stores
71
1H 2012 1H 2013

Starbucks Coffee Operations
Sales $13.4m (4.4)%
EBITDA $1.4m (15.5)%

Starbucks Coffee Lynmall Kiosk

Starbucks Coffee sales performance has been disappointing but actions under way to address this
1H2010 1H2011 1H2012 1H2013
Store numbers 42 39 32* 32*
Total sales ($m) 16.1 15.5 14.0 13.4
Total sales growth (%) (7.1)% (3.8)% (9.7)% (4.4)%
Same store sales growth (%) (3.8)% 0.5% 5.4% (2.7)%
* 3 closed because of earthquake

Starbucks Coffee margins have softened with input cost increase and recent value offers
1H2010 1H2011 1H2012 1H2013
EBITDA $m 1.4 2.0 1.7 1.4
EBITDA margin (% sales) 8.4% 12.9% 12.1% 10.7%

Carl’s Jr

The Carl’s Jr opportunity is being actively pursued
• 3 stores to be opened in 2H 2013
• New site pipeline being filled
• Initial batch of managers fully trained in US
• RBD store designs approved by CKE


Key Objectives

Objective Mark Comment
KFC positive same store sales growth with EBITDA margins >20%
SSS now positive, but margins still <20%
Continue KFC transformation process and pilot next generation store
Three ‘normal’ transformations in 1H and two ‘Fusion’ stores due to open 2H
Rebuild Pizza Hut margins through reducing input costs and sales leverage
EBITDA margins up strongly on higher sales
Continue reducing investment in Pizza Hut through store sales to franchisees
20 stores now sold, 7 in 1H
Maintain current levels of sales and margin for Starbucks Coffee
X Loss of sales and some discounting leverage
Starbucks Coffee refurbishment One store – New Lynn – refurbished
Roll out first 3 Carl’s Jr stores Three stores being built – open by year end
Key management objectives Report Card

Outlook

Outlook for 2012/13 is tempered by the current economic environment
• KFC – some sales growth, margins held
• Pizza Hut – higher total sales, profitable residual stores and continued margin leverage
• Starbucks Coffee – lower sales and margins flattening out
• Carl’s Jr – new stores immediately margin positive
Net Profit After Tax (excluding non-trading) is expected to be in the vicinity of $18 million for the year