half-year results 2018 - de.marketscreener.com file•all references in this presentation to...
TRANSCRIPT

I 1 I
HALF-YEAR RESULTS2018
Cécile CabanisCFO
July 27, 2018

I 2 I
• This presentation contains certain forward-looking statements concerning Danone. In some cases, you can identify these forward-looking statements by forward-looking words, such as “estimate,” “expect,” “anticipate,” “project,” “plan,” “intend,” “objective”“believe,” “forecast,” “foresee,” “likely,” “may,” “should,” “goal,” “target,” “might,” “will,” “could,” “predict,” “continue,”“convinced,” and “confident,” the negative or plural of these words and other comparable terminology. Forward lookingstatements in this document include, but are not limited to, statements regarding Danone’s operation of its business, and the futureoperation, direction and success of Danone’s business.
• Although Danone believes its expectations are based on reasonable assumptions, these forward-looking statements are subject tonumerous risks and uncertainties, which could cause actual results to differ materially from those anticipated in these forward-looking statements. For a detailed description of these risks and uncertainties, please refer to the “Risk Factor” section of Danone’sRegistration Document (the current version of which is available on www.danone.com).
• Subject to regulatory requirements, Danone does not undertake to publicly update or revise any of these forward-lookingstatements. This document does not constitute an offer to sell, or a solicitation of an offer to buy Danone securities.
• All references in this presentation to ”Like-for-like (LFL) New Danone” changes, recurring operating income, recurring operatingmargin, recurring net income, recurring income tax rate, Recurring EPS, Yakult Transaction Impact, free cash flow and net financialdebt correspond to financial indicators not defined in IFRS. Their definitions, as well as their reconciliation with financial statements,are defined in the H1 results press release issued on July 27th, 2018. Q1, Q2 and H1 2017 reported figures have been restated forIFRS 15.
• Due to rounding, the sum of values presented in this presentation may differ from totals as reported. Such differences are notmaterial.
Disclaimer
I 3 I
Highlights

I 4 I
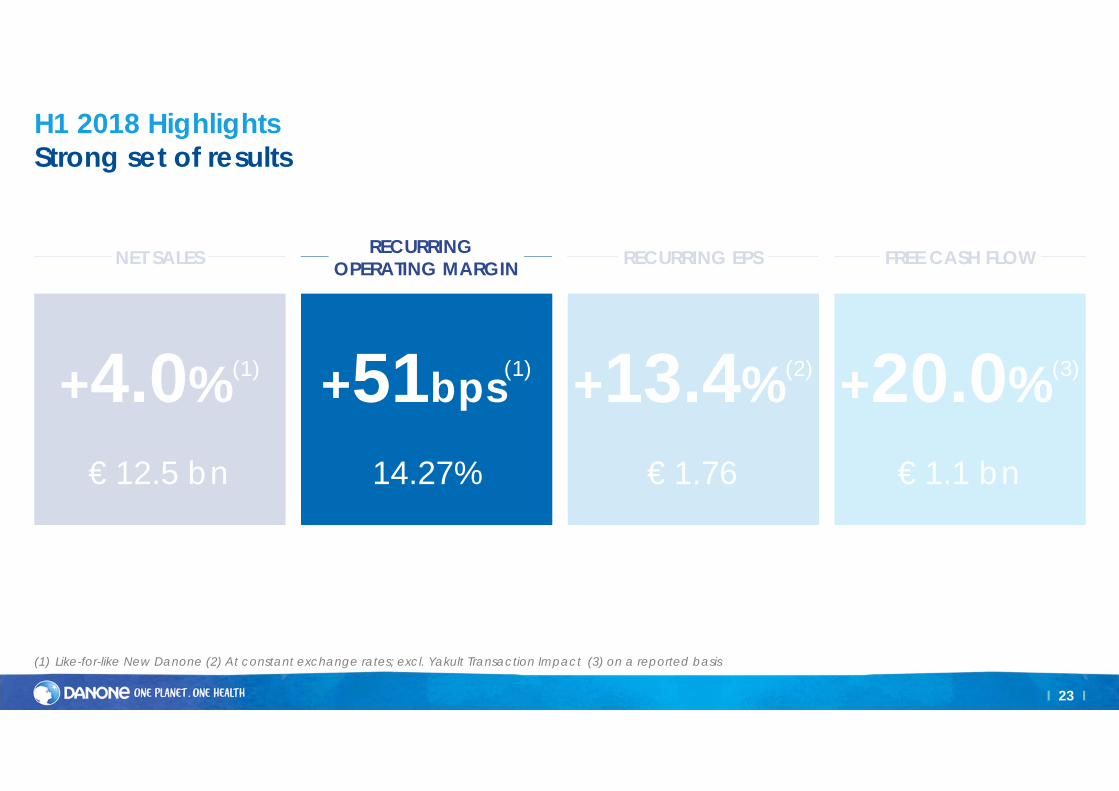
H1 2018 highlightsStrong set of results
+4.0%(1)
€ 12.5 bn
+51bps(1)
14.27%
+13.4%€ 1.76
Net Sales Recurring Operating Margin Free Cash Flow
(1) Like-for-like New Danone
Recurring EPSat constant FX
excl. Yakult Transaction Impact
+20.0%€ 1.1 bn

I 5 I
WhiteWave, one year after closingHigh-quality asset, accretive to Danone’s model
High-growth categories
Successful integration
Synergies delivery on track
Innovation momentum
Distribution expansion
#1 #2 #1 #1
~75% of former WhiteWave sales
growing > 5% in H1 2018

I 6 I
Major step-up in innovation - more, faster, betterRobust innovation engine

I 7 I
SpecializedNutrition Waters
EDPInternational
EDP Noram
Europe & Noram
Rest of the World
+10.6%
€1.8 bn
+4.0%
+6.6%
Volume
Net sales
Value
+1.4%
€1.2 bn
+2.9%
-1.5%
-2.4%
€2.0 bn
-8.0%
+5.6%
+4.8%
€1.3 bn
+2.8%
+2.0%
-1.7%
€3.5 bn
-1.6%
+9.4%
€3.0 bn
-0.1%
LFL growth(1)
+0.9%
+8.5%
(1) Like-for-like New Danone
Rebalanced growth profileQ2 2018 performance by reporting entity
excl. Morocco: +0.4%

I 8 I
Protein efficiency program underway On track for €1bn gross savings in 2020
€75m gross savings delivered in H1 2018
€200m gross savings target for the full-year
Professional services
Sales & MarketingLogisticsManufacturing

I 9 I
Challenging H1 macro headwindsNavigating market volatility
PET cost inflation~ +20%
H1 Impact
52$
74$
H1 2017 H1 2018
Crude oilincrease
H2 2017
Source: US Energy Information Administration
H1 2017 H1 2018
US freightcosts
H2 2017
Source: RMOC Freight Rate Index
Transportationstrikes
US freight costs inflation~ +20%
Recurring operating income impact
~ -€20m
100
120

I 10 I
Update on MoroccoCommitted to rebuilding trust with consumers
Unforeseen boycott
Complex situation,
extending beyond
business
Commitment to
change fresh milk
model
Greater transparency
and consumer
engagement
Significant impact
Q2 sales down 40%
H1 recurring operating
income down €25m
€661m non-cash
impairment
I 11 I
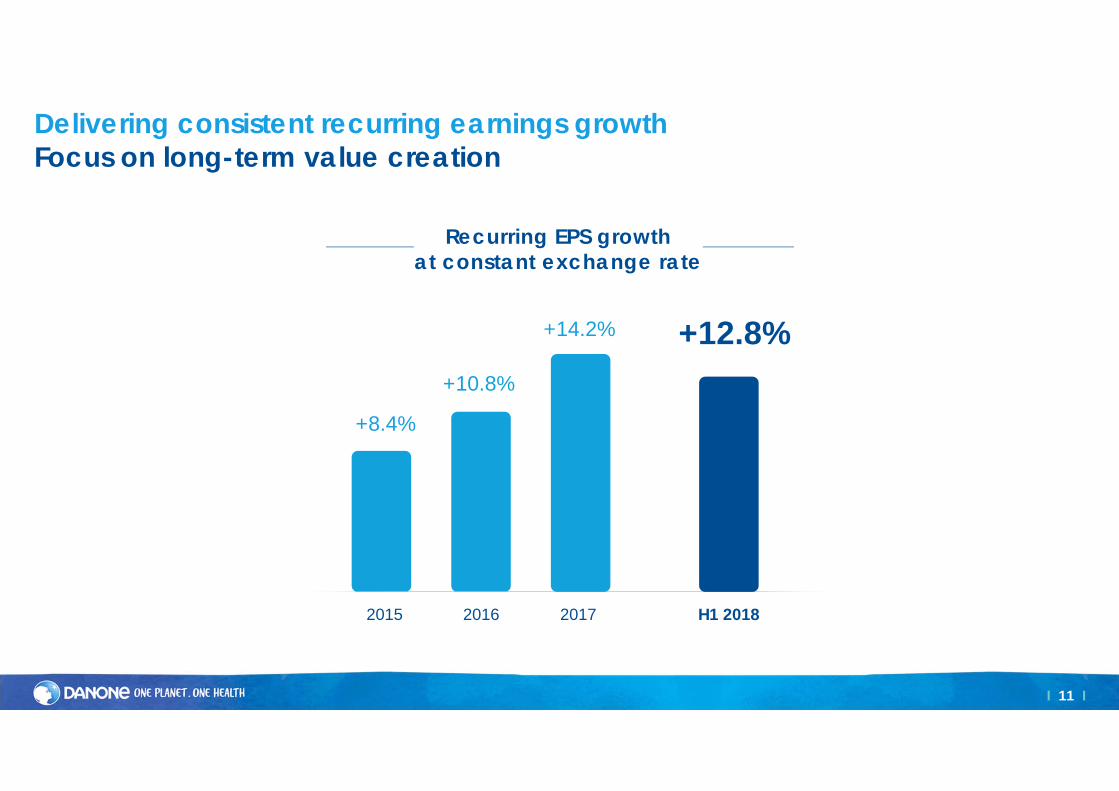
Delivering consistent recurring earnings growthFocus on long-term value creation
+8.4%
+10.8%
2015 2016
+14.2%
2017
+12.8%
H1 2018
Recurring EPS growthat constant exchange rate

I 12 I
Financial Review

I 13 I
+4.0%(1) +51bps(1) +13.4%(2) +20.0%(3)
€ 12.5 bn 14.27% € 1.76 € 1.1 bn
NET SALES RECURRING OPERATING MARGIN RECURRING EPS FREE CASH FLOW
H1 2018 HighlightsStrong set of results
(1) Like-for-like New Danone (2) At constant exchange rates; excl. Yakult Transaction Impact (3) on a reported basis
I 14 I
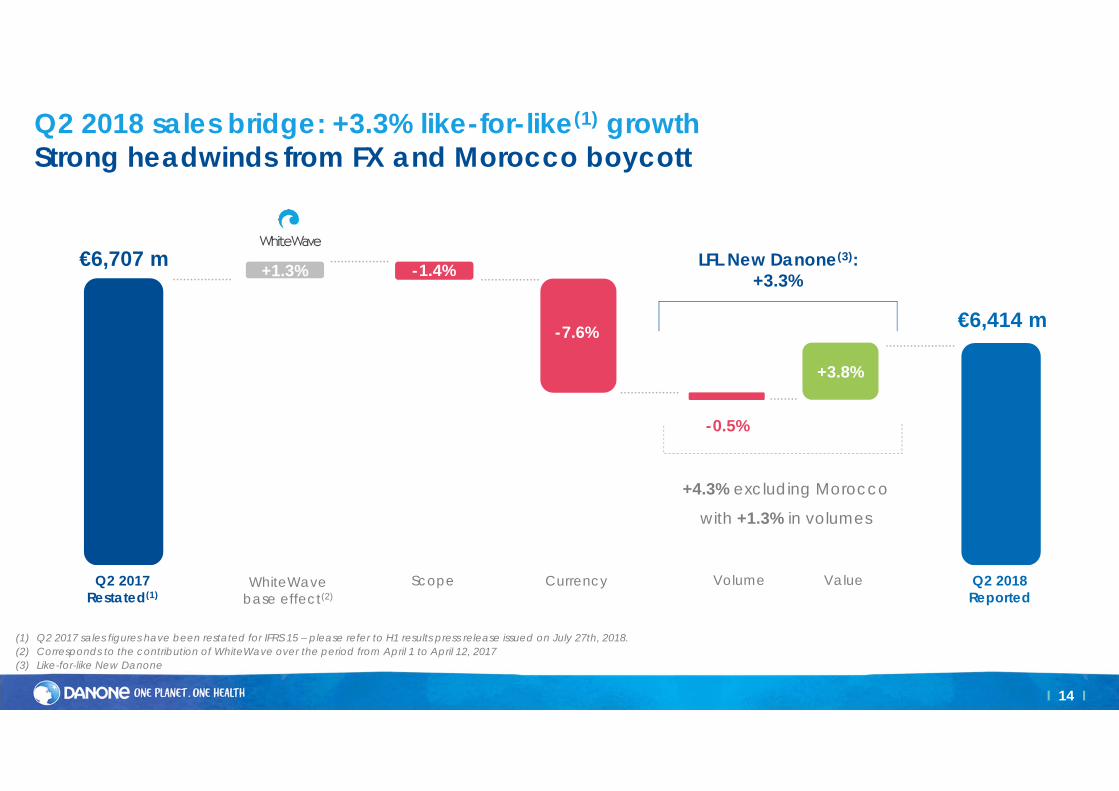
€6,707 m
€6,414 m
+1.3%
+3.8%
Q2 2017Restated(1)
CurrencyScope Volume Value Q2 2018Reported
WhiteWave base effect(2)
LFL New Danone(3): +3.3% -1.4%
-7.6%
Q2 2018 sales bridge: +3.3% like-for-like(1) growth Strong headwinds from FX and Morocco boycott
(1) Q2 2017 sales figures have been restated for IFRS 15 – please refer to H1 results press release issued on July 27th, 2018. (2) Corresponds to the contribution of WhiteWave over the period from April 1 to April 12, 2017(3) Like-for-like New Danone
-0.5%
+4.3% excluding Morocco
with +1.3% in volumes

I 15 I
H1 2018 key figures
Sales
Change(1)
Volume / Price Mix
Recurring operating margin
Change(1)
€3.6bn
+12.5%
+4.8% / +7.7%
25.53%
+121bps
(1) Like-for-like New Danone

I 16 I
Specialized Nutrition: +10.6% in Q2Early Life and Medical Nutrition both contributing to highly profitable growth
Advanced Medical Nutrition: mid to high-single digit growth Solid growth in Europe, very strong in Rest of the World
Early Life Nutrition: double-digit growth China1: sales growth ~30%
Expansion in ultra-premiumPursuing channel shift
Other markets Europe: slight decreaseLatam: double-digit growth in sales and volumes
Recurring operating margin: Very strong expansion Positive mix and valorization
All data in like-for-like New Danone
+8.4%+14.5%
Q4 2017Q3 2017
+17.8%
+5.6%
Q1 2018Q2 2017Q1 2017
+5.2%
Quarterly LFL sales growth
+10.6%
Q2 2018
(1) Total sales in China, including direct and indirect distribution channels

I 17 I
H1 2018 key figures
(1) Like-for-like New Danone
€2.4bn
+0.6%
+2.3% / -1.7%
Sales
Change(1)
Volume / Price Mix
9.96%-43bps
Recurring operating marginChange(1)

I 18 I
Yogurt: slightly positive growth Probiotics: Activia growing thanks to Dailies Kids: activation (Danimals Incredibles)and innovations Plant-based: portfolio and distribution expansion
Plant-based: high-single-digit growth Innovations in almond large size and premium offerings, and novelties Relevant communication campaign
Coffee creamers: strong growth Better-for-you offering and ready-to-drinks growing fast
Premium Dairy: still declining but outperforming the category
Recurring operating margin: Strong impact from freight costs Negative mix in Premium Dairy Synergies delivery
EDP Noram: +1.4% in Q2 Plant-based and yogurt leading return to growth
All data in like-for-like New Danone
Q4 2017 Q1 2018
-0.4% -0.2%
-2.9%-2.2%
Q3 2017Q2 2017Q1 2017
-2.8%
+0.5%Excl. Fresh Foods -0,9% +0.1%
Quarterly LFL sales growth
Q2 2018
+2.7%
+1.4%

I 19 I
H1 2018 key figures
(1) Like-for-like New Danone
€4.1bn
-0.8%
-5.6% / +4.8%
Sales
Change(1)
Volume / Price Mix
8.44%+26bps
Recurring operating marginChange(1)

I 20 I
EDP International: +0.4% in Q2 excluding Morocco Back to profitable growth excluding impact of Morocco boycott
Europe: slightly negative; back to solid growth in some countries UK and Nordics growing in both dairy and plant-based France & Spain still challenging Alpro growing around 10%
CIS: strong growth Consistent portfolio valorization
Latam: still penalized by Brazil
Morocco: ~ -40% sales decline in Q2 due to boycott
Q4 2017 Q1 2018Q2 2017 Q3 2017Q1 2017
Quarterly LFL sales growth
All data in like-for-like New Danone
Q2 2018
Recurring operating margin: ~+50bps improvement excl. Morocco Acceleration of efficiencies
-0.3%
+0.8 %
-0.8%
-2.3%-1.7%
-2.4%
+0.4%
Excl. Morocco

I 21 I
H1 2018 key figures
(1) Like-for-like New Danone
€2.3bn
+4.5%
+2.6% / +1.9%
Sales
Change(1)
Volume / Price Mix
11.45%-96bps
Recurring operating marginChange(1)

I 22 I
Continued good momentum in all regions and categories
Europe: solid growth Valorized innovations acceleration Good weather conditions in Northern Europe
Noram: enduring high-single digit growth
Asia: strong momentum across region
Strong performance in Indonesia and Turkey Mizone: solid growth; innovation and marketing activation
Latam: still soft; weather conditions in Mexico
Waters: +4.8% in Q2Another quarter of strong growth; PET inflation weighing on margin
Q4 2017 Q1 2018Q3 2017Q2 2017Q1 2017
Quarterly LFL sales growth
All data in like-for-like New Danone
+10.3%
+4.2%+0.3%
+7.6%
+1.8%+4.8%
Q2 2018
Recurring operating margin: Adversely impacted by inflation in plastic and disruptions caused by railway
strike in France
I 23 I
+4.0%(1) +51bps(1) +13.4%(2) +20.0%(3)
€ 12.5 bn 14.27% € 1.76 € 1.1 bn
NET SALES RECURRING OPERATING MARGIN RECURRING EPS FREE CASH FLOW
(1) Like-for-like New Danone (2) At constant exchange rates; excl. Yakult Transaction Impact (3) on a reported basis
H1 2018 HighlightsStrong set of results

I 24 I
H1 2018Recurring
CurrencyScope (excl. WW)
+8 bps+9 bps
14.27%
WhiteWavebase effect(2)
H1 2017Restated(1)
14.07%
-49 bps
Overheadsand Others
Sales andMarketing
Margin fromoperations
-24 bps+48 bps
+27 bps
LFL New Danone(3): +51 bps
Strong improvement in recurring operating marginMix and efficiencies offsetting strong headwinds
(1) H1 2017 figures have been restated for IFRS 15 – please refer to H1 results press release issued on July 27th, 2018; (2) Corresponds to the contribution of WhiteWave over the period from January 1 to April 12, 2017; (3) Like-for-like New Danone
• COGS inflation ~ -330bps
• Mix ~ +160bps
• Efficiencies ~ +150bps(incl. Protein)
• Protein
• WhiteWave synergies
• Resource allocation

I 25 I
+4.0%(1) +51bps(1) +13.4%(2) +20.0%(3)
€ 12.5 bn 14.27% € 1.76 € 1.1 bn
NET SALES RECURRING OPERATING MARGIN RECURRING EPS FREE CASH FLOW
(1) Like-for-like New Danone (2) At constant exchange rates; excl. Yakult Transaction Impact (3) on a reported basis
H1 2018 HighlightsStrong set of results

I 26 I
+3.9%
H1 2017Restated(1)
Recurring EPS
Financing(incl. Hybrid)
Margin Tax & others
Scope (excl. WW)
H1 2018Recurring EPS
WhiteWave base effect(2)
Net Sales
+13.4%At constant FX, excl. Yakult Transaction Impact
+3.5%
+4.0%
-8.2%
Currency
+1.6%
+4.6%Total
EPS bridgeDouble-digit growth at constant exchange rate excl. Yakult Transaction Impact
-0.6%
+1.0%
-0.6%
YakultTransation
Impact
€ 1.76
€ 1.68
(1) H1 2017 figures have been restated for IFRS 15 – please refer to H1 results press release issued on July 27th, 2018; (2) Corresponds to the contribution of WhiteWave over the period from January 1 to April 12, 2017

I 27 I
From Recurring operating income to Net income
€ million H1 2017 recurring
H1 2018 recurring
H1 2018 Non-recurring items
Total H1 2018
Recurring operating income 1,717 1,784 - 1,784
Other operating income and expenses - - (695) (695)
Operating income 1,717 1,784 (695) 1,089
Total Financial expenses (201) (175) 3 (172)
Income tax (459) (475) 63 (412)
Net income from associates 47 46 701 747
Net income 1,104 1,180 71 1,251
Non-controlling interests (57) (48) 1 (47)
Net income – Group share 1,047 1,132 72 1,204
EPS 1.68 1.76 - 1.87

I 28 I
+4.0%(1) +51bps(1) +13.4%(2) +20.0%(3)
€ 12.5 bn 14.27% € 1.76 € 1.1 bn
NET SALESRECURRING
OPERATING MARGIN RECURRING EPS FREE CASH FLOW
(1) Like-for-like New Danone (2) At constant exchange rates; excl. Yakult Transaction Impact (3) on a reported basis
H1 2018 HighlightsStrong set of results

I 29 I
1104920
FCFH1 2017
FCFH1 2018
Working Capital / Net Sales (%) Capex / Net Sales (%)
(5.0)% (4.5)% 3.0% 2.9%
H1 2017 H1 2018
Free Cash Flow (€m)
H1 2017 H1 2018
Accelerated cash delivery: +20.0%Solid cash conversion
-4.5%-5.0%+2.9%+3.0%

I 30 I
15.4
(1.1)
(1.2)+0.5
+0.2
13.7
Net debt31/12/2017
Net debt30/06/2018
M&A Puts
DividendsFCF Others
€ -1.7 bnin € billion
Change in net debtAccelerated pace of deleverage
18.2
Net debt30/06/2017
€ -4.5 bn

I 31 I
20202017 2018
FY2018 guidance confirmed
2018 objective
DOUBLE-DIGIT RECURRING EPS GROWTH
at constant exchange rateexcluding Yakult Transaction Impact
Based on: Accelerated LFL sales growth vs. FY2017 Recurring operating margin improvement LFL

I 32 I
Appendix
I 33 I
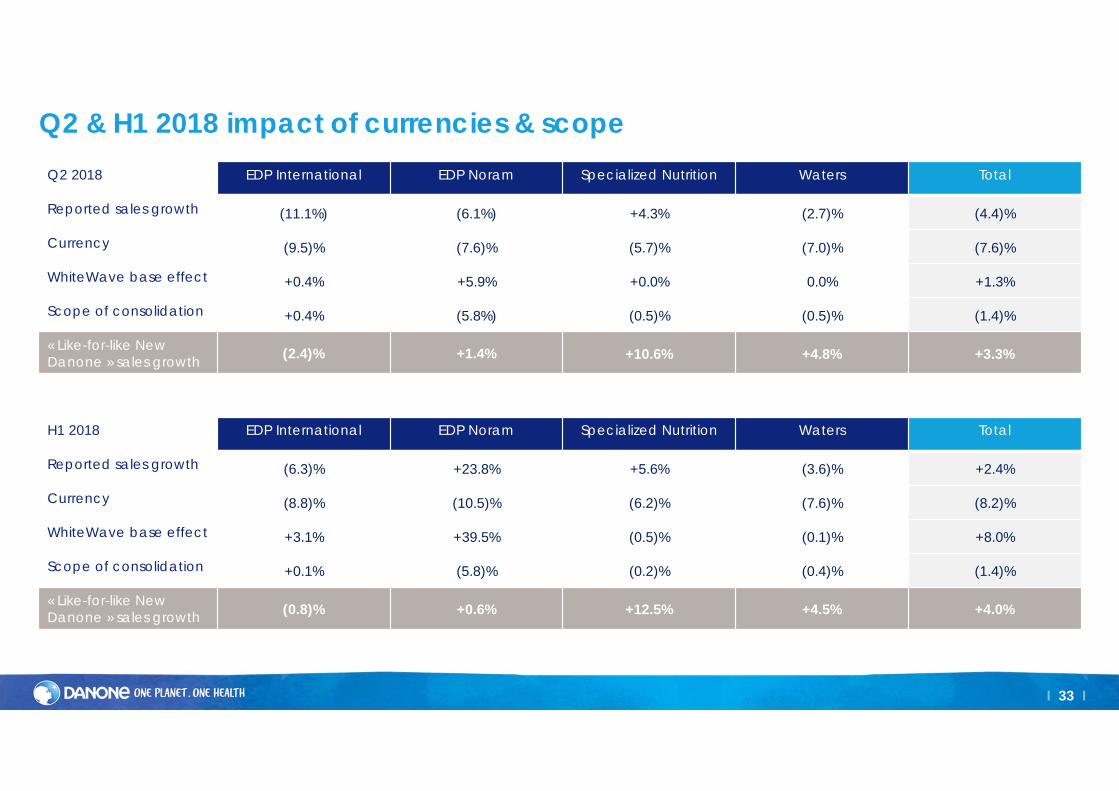
Q2 & H1 2018 impact of currencies & scopeQ2 2018 EDP International EDP Noram Specialized Nutrition Waters Total
Reported sales growth (11.1%) (6.1%) +4.3% (2.7)% (4.4)%
Currency (9.5)% (7.6)% (5.7)% (7.0)% (7.6)%
WhiteWave base effect +0.4% +5.9% +0.0% 0.0% +1.3%
Scope of consolidation +0.4% (5.8%) (0.5)% (0.5)% (1.4)%
« Like-for-like New Danone » sales growth (2.4)% +1.4% +10.6% +4.8% +3.3%
H1 2018 EDP International EDP Noram Specialized Nutrition Waters Total
Reported sales growth (6.3)% +23.8% +5.6% (3.6)% +2.4%
Currency (8.8)% (10.5)% (6.2)% (7.6)% (8.2)%
WhiteWave base effect +3.1% +39.5% (0.5)% (0.1)% +8.0%
Scope of consolidation +0.1% (5.8)% (0.2)% (0.4)% (1.4)%
« Like-for-like New Danone » sales growth (0.8)% +0.6% +12.5% +4.5% +4.0%

I 34 I
Changes in exchange rates
% total H1 2018 H1 18 vs H1 17 (avg) Q2 18 vs Q2 17 (avg)
US Dollar 19.8% -10.5% -9.0%
Chinese Renminbi 7.9% -3.3% -1.8%
Russian Ruble 6.6% -12.7% -12.3%
British Pound 5.3% -2.2% -2.2%
Indonesian Rupiah 4.9% -13.5% -12.2%
Mexican Peso 4.3% -8.8% -11.4%
Argentine Peso 3.2% -34.5% -33.2%
Brazilian Real 2.9% -16.8% -14.3%
Polish Zloty 2.5% 1.2% -0.1%
Hong Kong Dollar 2.3% -11.2 -9.5%
Turkish Lira 1.8% -20.5% -20.5%
Australian Dollar 1.8% -8.5% -6.4%
Moroccan Dirham 1.8% -4.2% -3.5%

I 35 I
Recurring operating margin by geographical area
H1 2017 H1 2018 Like-for-like change(1)
EDP International 8.15% 8.44% +26 bps
EDP Noram 11.69% 9.96% -43 bps
Specialized Nutrition 24.32% 25.53% +121 bps
Waters 12.15% 11.45% -96 bps
Europe & Noram 15.31% 12.98% -126 bps
Rest of the world 12.77% 15.80% +260 bps
Total 14.07% 14.27% +51 bps
(1) Like-for-like New Danone

I 36 I
Cash bridge
RecurringOperating
income
Depreciation/Amort
Taxes Financialresults
Others Cash fromoperatingactivities(1)
W cap var Capex Sales of assets and transaction
Fees
Free cash-flow
1,784
420 475
175
1,533
106
363 41
1,104
20
(1) Excluding working capital variations
in € million

I 37 I
Balance sheet
5,924
9,161
24,361
7,055
3,476
15,252
13,663
39,446 39,446
30/06/18
Other assets
Working capital
Intangible assets
Net debt(2)
Working capital
Shareholders’ equity
Other liabilities
5,499
9,679
24,945
40,123
6,668
3,554
14,529
15,372
40,123
31/12/17Restated(3)
in € millionAssets(1) Liabilities
(1) Excluding assets included in net debt(2) Net of cash, cash equivalents, marketable securities, other short-term investments and financial instrument asset
(3) H1 2017 figures have been restated for IFRS 15 – please refer to H1 results press release issued on July 27th, 2018
30/06/1831/12/17Restated(3)