half-year report 2013
TRANSCRIPT

www.ivsgroup.it
Half-yearReport2013

+5ACQUISITIONS
VENDS (million)
325.6334.1SALES / BUSINESS DAY
(€ ‘000’ s)
H1 2012
H1 2012
H1 2012
H1 2013
H1 2013
H1 2013
1,11
7
1,19
4AVERAGE PRICE (€ cents/vend)
COIN DIVISIONREVENUES
42.1
43.4
+15.6%59BRANCHESItaly / France / Spain

2,040EMPLOYEES
COST OF SALESPER VENDS (€ cents/vend)
11.0
11.4
GROSS PROFIT(€ cents/vend)
31.1
32.1
65%Automatic Vending Machines
35%
VENDING MACHINES
Highlights
O� ce Co� ee
System
~147KH1 2012
H1 2012
H1 2013
H1 2013

In
dex
In
dex
2
Con
dens
ed in
terim
con
solid
ated
repo
rt a
s of
Mar
ch 3
1,
Con
dens
ed in
terim
con
solid
ated
repo
rt a
s of
Mar
ch 3
1,
Con
dens
ed in
terim
con
solid
ated
repo
rt a
s of
Mar
ch 3
1, 2
013
2013
2013
•••Ind
exIn
dex
Inde
x

3
Hal
f-yea
r Rep
ort 2
013
• C
onte
nts
COMPANY OFFICERS 5Board of Directors 5Independent auditors 5
GROUP STRUCTURE 7
INTERIM MANAGEMENT REPORT 9Purpose and Accounting principles 10Company overview 10Signi� cant events in the � rst six months of 2013 12Business overview 14Changes in the consolidation 14Information on acquisitions carried out in previous years 14Group performance 15Related party transactions 20Principal Risks and uncertainties 20
MANAGEMENT CERTIFICATION 23
CONDENSED INTERIM CONSOLIDATED FINANCIAL STATEMENTS 25Indipendent Auditor’s Report on Interim Consolidated Financial Statements 27Financial Statements Schedules 31 Consolidated Statements of � nancial position 32 Consolidated Income Statements 33 Consolidated Statements of Comprehensive Income 34 Consolidated Statements of changes in Shareholders’ equity during the � rst six months of 2013 35 Consolidated Statements of changes in Shareholders’ equity during the � rst six months of 2012 36 Consolidated Statements of Cash Flows 37
Explanatory Notes to the Financial Statements 39 1 – Corporate information 40 2 – Basis of preparation and changes to the Group’s accounting policies 40 3 – Seasonal factors 42 4 – Business combinations 42 5 – Operating segments 43 6 – Intangible assets 45 7 – Goodwill 45 8 – Property, plant and equipment 46 9 – Borrowings 46 10 – Net Financial Indebtedness 47 11 – Financial Instruments 47 12 – Shareholders’ equity 48 13 – Commitments and guarantees 49 14 – Other non-recurring income and expenses 50 15 – Financial income and expenses 50 16 – Income tax for the period 51 17 – Earnings per share 51 18 – Related party transactions 52 19 – Subsequent events 53 20 – Consolidation 53
Contents

Inte
rim m
anag
emen
t rep
ort
Hal
f-yea
r Rep
ort 2
013
• In
terim
man
agem
ent r
epor
t
4
IVS GROUP S.A.Registered o� ces: 2A Rue Jean-Baptiste Esch L-1473 Luxembourg R.C.S. Luxembourg B155 294 VAT No. LU 24379120Share capital Euro 386,892.00 fully paid up
Operational headquarters: I-24068 Seriate (BG) via dell’Artigianato, 25VAT No. IT 03840650166 – Tax code 97602500155
www.ivsgroup.lu

5
Hal
f-yea
r Rep
ort 2
013
• Co
mpa
ny O
� ce
rs
Company Offi cers
BOARD OF DIRECTORS
Cesare Cerea Chairman
Massimo Paravisi Chief Executive O� cer (CEO)
Massimo Trapletti Chief Executive O� cer (CEO)
Antonio Tartaro Chief Financial O� cer (CFO)
Paolo Covre Vice Chairman
Vito Alfonso Gamberale Vice Chairman
Adriana Cerea Director
Monica Cerea Director
Carlo Giovanni Mammola Non-executive director
Mariella Trapletti Non-executive director
Luigi De Puppi Independent non-executive director
Mariano Frey Independent non-executive director
Francesco Tatò Independent non-executive director
INDEPENDENT AUDITORS
Ernst & Young S.A. Luxembourg
IVS GROUP S.A.Registered o� ces: 2A Rue Jean-Baptiste Esch L-1473 Luxembourg R.C.S. Luxembourg B155 294 VAT No. LU 24379120Share capital Euro 386,892.00 fully paid up
Operational headquarters: I-24068 Seriate (BG) via dell’Artigianato, 25VAT No. IT 03840650166 – Tax code 97602500155
www.ivsgroup.lu


7
Hal
f-yea
r Rep
ort 2
013
• G
roup
Str
uctu
re
Group Structure
ESP S.A.(J.V. con Lavazza e DB)
Vending SystemItalia S.p.A.
IVS Italia S.p.A.
IVS F. S.p.A.
Metroshopping S.r.L.IVS France S.a.S. Emmedi S.A.
SCI+39Maquina Automaticas
Blasco S.L.
D.A.V. S.A.
CaYbe 2 S.L.
Eur Co� ee S.r.L. Mr. Vending S.r.L. Time Vending S.r.L.(J.V. con Cremonini)
S. Italia S.p.A. Fast ServiceItalia S.p.A.
The IVS Group presents the following structure as of June 30, 2013:
20.10 Vending S.r.L. D.D.S. S.p.A. Eurovending S.r.L. EVS S.r.L. Liguria Ca� è Automatico S.r.l.
IVS GROUP S.A.
ItalianCompanies
FrenchComapanies
SpanishCompanies Associates Joint
VenturesSociété Civile
Immobilière (France)
Universo Vending S.r.L.
CoFraDis Sud S.a.S.
Ristora System S.r.L.
Ciesse Ca� é S.r.L.
CoinPartecipazioni
S.p.A.
Coin Service Empoli S.p.A.
Coin Service Nord S.p.A.
CSH S.r.L.
Coin Service business division
(Italy)
Inte
rim m
anag
emen
t rep
ort
Hal
f-yea
r Rep
ort 2
013
• In
terim
man
agem
ent r
epor
t
8

Inte
rim m
anag
emen
t rep
ort
Inte
rim m
anag
emen
t rep
ort
9
Hal
f-yea
r Rep
ort 2
013
• In
terim
man
agem
ent r
epor
tInterim
management report

Hal
f-yea
r Rep
ort 2
013
• In
terim
man
agem
ent r
epor
t
10
Interim management report
PURPOSE AND ACCOUNTING PRINCIPLES
This half-year report for the six-month period ended June 30, 2013 has been prepared in compliance with Article 4 of the Luxembourg Transparency Law of January 11, 2008, and should be read in conjunction with the annual report for the year ended December 31, 2012 (including the � nancial statements included therein) and the unaudited consolidated condensed interim � nancial statements included in this half-year report.
These condensed interim consolidated � nancial statements has been prepared in conformity with IFRS, the International Financial Reporting Standards, as issued by the International Accounting Standards Board and as adopted by the European Union.
Our consolidated � nancial statements are expressed in Euro. The unaudited condensed interim consolidated � nancial statements included in this half-year report have been prepared in accordance with IAS 34, “Interim Financial Reporting”. These unaudited condensed interim consolidated � nancial statements should be read in conjunction with the audited consolidated � nancial statements for the year ended December 31, 2012, which have been prepared in accordance with IFRS. See Note 2, “Basis of preparation and changes to the Group’s accounting policies” to our unaudited condensed interim consolidated � nancial statements included in this half-year report.
COMPANY OVERVIEW1
IVS Group S.A. resulted from the merger by incorporation of IVS Group Holding S.p.A. into Italy1 Investment S.A.Italy1 Investment S.A. (“Italy1”) was the � rst SPAC (Special Purpose Acquisition Company) to be listed on the Italian Stock Exchange. The merger between Italy1 Investment S.A. and its target IVS Group Holding S.p.A. was approved on April 12, 2012 by the shareholders and on May 16, 2012 the merger � nally came into force and Company assumed the corporate name of IVS Group S.A., proceeding, in the meantime, as per company statute and regulations, to buy-back the shares held by those Italy1’s shareholders who exercised the redemption option in view of the realization of the Business Combination.
1. Cautionary Statement Concerning Forward-looking statements This half-year report and any other oral or written statements made by us to the public may contain “forward-looking statements”. Forward looking statements
are based on management’s current views and assumptions and involve known and unknown risks that could cause actual results, performance or events to di� er materially from those expressed or implied by those statements.
We use words such as “aim”, “will likely result”, “will continue”, “contemplate”, “seek to”, “future”, “objective”, “goal”, “should”, “will pursue”, “anticipate”, “estimate”, “expect”, “project”, “intend”, “plan”, “believe” and words and terms of similar substance to identify forward-looking statements, but they are not the only way we identify such statements. All forward-looking statements are management’s present expectations of future events and are subject to a number of factors and uncertainties that could cause actual results to di� er materially from those described in the forward-looking statements. These factors include the risks related to our business discussed under “Principal Risks and Uncertainties”, among them, the following:
- our ability to implement our business strategy or to grow through acquisitions, joint ventures and other investments; - the competitive environment in our business and our industry; - our ability to price our products and services in accordance with our strategy; - general macroeconomic and political conditions and developments in the countries in which we operate; - � uctuations in costs related to fuel and transportation inputs, food, co� ee and other commodity prices; - impact of seasonal variation and abnormal weather; - loss of major customers and/or inability to establish new customer relationships; By their nature, certain disclosures relating to these and other risks are only estimates and could be materially di� erent from what actually occurs in the future. As
a result, actual future gains or losses that may a� ect our � nancial condition and results of operations could di� er materially from those that have been estimated. You should not place undue reliance on the forward-looking statements, which speak only as of the date of this half-year report.
Except as required by law, we are not under any obligation, and expressly disclaim any obligation, to update or alter any forward-looking statements, whether as a result of new information, future events or else.

Hal
f-yea
r Rep
ort 2
013
• In
terim
man
agem
ent r
epor
t
11

Hal
f-yea
r Rep
ort 2
013
• In
terim
man
agem
ent r
epor
t
12
SIGNIFICANT EVENTS IN THE FIRST SIX MONTHS OF 2013SENIOR SECURED NOTES DUE 2020On March 12, 2013 the Parent company, IVS Group S.A., incorporated the Italian company IVS F. S.p.A., under its direction and control, with share capital of EUR 2,050,000. On March 20, 2013 IVS F. S.p.A. announced the plan to issue EUR 200,000,000 of senior secured notes due on April 1, 2020, to be o� ered to quali� ed investors, principally to re� nance some of its credit facilities, to extend the maturity pro� le of its debt, and for other more general corporate purposes. On March 26, 2013 IVS F. S.p.A. set the price of the senior secured bond, and issued the Notes listed on the ExtraMOT Market of Borsa Italiana S.p.A. and on the EUR MTF Market of the Luxembourg Stock Exchange, publishing the O� ering Memorandum and setting the interest rate on the bonds at 7.125% per annum. The rating of these notes is BB- (S&P).
With regards to the issue procedure, pursuant to the laws of the State of New York, a purchase agreement was signed by the initial purchasers – who are also quali� ed institutional buyers – the issuer and the underwriters. The notes may be resold by the initial purchasers exclusively as follows:• in the United States of America only to quali� ed investors, in compliance with Rule 144A of the U.S.
Securities Act; • outside the United States of America to quali� ed investors as de� ned by Regulation S of the U.S. Securities
Act, and• in Europe to European investors speci� ed in the O� ering Memorandum.
Subsequently, a global bond certi� cate was published pursuant to Rule 144A and a global bond certi� cate was published pursuant to Regulation S (collectively “Global Notes”).The Notes are guaranteed by the following shares owned by IVS Group S.A.:• Pledge on IVS F. S.p.A. shares,• Pledge on Fast Service Italia S.p.A. shares,• Pledge on S.Italia S.p.A. shares, and• Pledge on IVS Italia S.p.A. shares;as well as by:• Pledge on IVS F. S.p.A. receivables arising from intragroup loans, and by • Note Guarantees issued by each underwriter for the amounts indicated in the O� ering Memorandum.
On April 4, 2013 IVS F. S.p.A signed an Indenture between certain Group companies (as guarantors - IVS Group S.A., IVS Italia S.p.A., Fast Service S.p.A. and S.Italia S.p.A.), The Law Debenture Trust Corporation p.l.c.(as trustee) and BNP Paribas Securities Services (as security agent).The Notes were issued under the laws of New York (Rule 144A and Regulation S of Securities Act as of 1933), Securities Act as of 1933), Securities Actand the placement was led by BNP Paribas and Banca IMI as Joint Lead Bookrunners and MPS Capital Services, as Co-Manager.During April and May 2013 the subsidiaries of the Group made certain early repayments of loans and other � nancial liabilities in accordance with the speci� c instructions set out in the Senior Secured Notes issued by IVS F. S.p.A..

Hal
f-yea
r Rep
ort 2
013
• In
terim
man
agem
ent r
epor
t
13
Share
Recent trading of IVS Securities
Contracts in €
Jan2013
Feb2013
Mar2013
Apr2013
May2013
Jun2013
Jul2013
Aug2013
3,000K
2,500K
2,000K
1,500K
1,000K
500K
0K
Warrants Contracts in €
Jan2013
Feb2013
Mar2013
Apr2013
May2013
Jun2013
Jul2013
Aug2013
100K
50K
0K
Senior Secure Notes Contracts in €
Apr2013
Jun2013
Jul2013
2,000K
1,500K
1,000K
500K
0K
Feb2013
Mar2013
May2013
Jun2013
Aug2013
6.300
6.700
7.100
Feb2013
Mar2013
May2013
Jun2013
Aug2013
0.2259
0.2980
0.3700
Source: Borsa italiana
Feb2013
Mar2013
May2013
Jun2013
Aug2013
96.00
98.25
100.50

Hal
f-yea
r Rep
ort 2
013
• In
terim
man
agem
ent r
epor
t
14
TRANSLISTING FROM MIV TO MTA SEGMENT OF BORSA ITALIANA On April 30, 2013 IVS Group S.A. � led with Borsa Italiana a request to list its shares (Class A shares) and warrants on the MTA-Mercato Telematico Azionario managed by Borsa Italiana S.p.A.. On May 30, 2013 Borsa Italiana approved the transfer. The starting date of trading on the MTA and the simultaneous end of trading on the MIV was June 3, 2013.
DIVIDEND DISTRIBUTIONThe shareholders’ meeting of IVS Group S.A., held in Luxembourg on May 14, 2013, in addition to approving the � nancial statements and the consolidated � nancial statements as of December 31, 2012 and related documents, resolved the distribution of a dividend amounting to EUR 0.125 per share, for a total amount of EUR 4,824,745.38, by using distributable reserves. The ex-dividend date was set to be June 3, 2013, the record date June 5, 2013, and the payment date June 6, 2013.
BUY-BACKThe General Meeting held in Luxembourg on May 14, 2013 also resolved to authorise the Board of Directors to purchase the company’s own shares, to be used as consideration for possible acquisitions, for a total amount of up to EUR 5 million over a period of 10 months from the date of the General Meeting, and indicated, pursuant to the applicable Luxembourg laws, a purchase price between a minimum of EUR 1 per share and a maximum of EUR 10 per share.
BUSINESS OVERVIEW
The IVS Group is one of the leading vending machine operators in Europe (a highly fragmented market), as detailed in the Company’s annual report and as re� ected in the � gures published by the EVA (European Vending Association). According to the latest report of CONFIDA, the Italian association of vending sector companies (based on 2012 � gures), IVS is the most important operator in Italy, with a market share of 11.3%. Italy represents IVS’s principal market; nevertheless, IVS is also present in the French and Spanish markets, where sales for the half year ended June 30, 2013 represented, respectively, approximately 7.9% and 4.8% of the Group’s total turnover, net of the Coin business. With over 40 years of experience in the industry, the IVS Group is the only operator to cover the entire territory of Italy.The Company owns more than 147,000 automatic and semiautomatic vending machines of various sizes, located in o� ces, institutions, and areas open to the public.
CHANGES IN THE CONSOLIDATION
The main change in the composition of the IVS Group with respect to December 31, 2012 is the acquisition on February 6, 2013 of Liguria Ca� è Automatico S.r.l., an Italian company operating in the vending sector.
INFORMATION ON ACQUISITIONS CARRIED OUT IN PREVIOUS YEARS
In March and April 2012, the Group acquired Fast Service Italia S.r.l. and Selecta Italia S.p.A. (now Fast Service Italia S.p.A. and S.Italia S.p.A., respectively) and the related purchase price allocations were completed on December 31, 2012. Accordingly, following the provisions of IFRS 3, the Company has retrospectively adjusted the reported � gures as of June 30, 2012. Further details are provided in Note 7 of the explanatory notes to the consolidated � nancial statements of IVS Group S.A. as of December 31, 2012.

Hal
f-yea
r Rep
ort 2
013
• In
terim
man
agem
ent r
epor
t
15
GROUP PERFORMANCE2
The interim consolidated � nancial statements of the IVS Group as of June 30, 2013 show a net pro� t ofEUR 4,947 thousand.This result, without giving e� ect to non-recurring expenses related to the translisting (EUR 576 thousand) and the issuance of Senior Secure Notes (EUR 2,776 thousand), would have amounted to Euro 8,299 thousand.
Six Months Ended June 30, 2013
(thousands of Euro) Italy France Spain Coin GroupInter-sector
eliminations Total
Value of production 135,915 12,549 7,651 6,498 (4,229) 158,384
Operating costs (107,820) (10,077) (5,924) (5,027) 4,229 (124,619)
Ebitda Adjusted 28,095 2,472 1,727 1,471 - 33,765 Other non-recurring income/(expenses) (1,940) (47) (87) (47) - (2,121)
EBITDA 26,155 2,425 1,640 1,424 - 31,644 % Ebitda Adj / Value of production 21% 20% 23% 23% - 21%
Depreciation and amortisation (17,235) (1,177) (1,060) (297) - (19,770)
Ebit 8,920 1,248 580 1,127 - 11,873
% Ebit/ Value of production 7% 10% 8% 17% - 7%
Six Months Ended June 30, 2012
(thousands of Euro) Italy France Spain Coin GroupInter-sector
eliminations Total
Value of production 125,831 12,485 7,781 5,621 (4,289) 147,429
Operating costs (99,908) (10,808) (6,300) (4,147) 4,289 (116,874)
Ebitda Adjusted 25,923 1,677 1,481 1,474 - 30,555Other non-recurring income/(expenses) (*) (1,555) 232 - 16 - (1,307)
EBITDA (*) 24,368 1,909 1,481 1,490 - 29,248 % Ebitda Adj / Value of production 21% 13% 19% 26% - 21%
Depreciation and amortisation (16,281) (1,301) (750) (192) 24 (18,500)
Ebit (*) 8,087 608 731 1,298 24 10,748
% Ebit (*)/ Value of production 6% 5% 9% 23% - 7%
2. In this document, we present certain non-IFRS measures, including EBITDA, Adjusted EBITDA, Operating pro� t, Net � nancial position/ indebtedness and Financial indebtedness.
We de� ne “EBITDA” as operating pro� t before interest and income taxes (“EBIT”) plus amortisation and depreciation. “Adjusted EBITDA” refers to EBITDA as adjusted to remove accounting e� ects and costs associated with the Merger and some other non-recurring income and expenses considered by our management to be non-recurring and exceptional in nature.
It uses similar indicators for its net � nancial indebtedness, the components of which are described in the relative section of the notes. This document also includes a number of � nancial ratios which are helpful to better understand the Group’s performance, especially with respect to di� erences
compared to previous years. We believe that EBITDA is a useful indicator of our ability to incur and service our indebtedness and can assist certain shareholders, certain investors, security
analysts and other interested parties in evaluating us. We believe that Adjusted EBITDA is a relevant measure for assessing our performance because it is adjusted for certain charges which, we believe, are not indicative of our underlying operating performance and thus aid in an understanding of EBITDA.
EBITDA and Adjusted EBITDA and similar measures are used by di� erent companies for di� ering purposes and are often calculated in ways that re� ect the circumstances of those companies. Reader should exercise caution in comparing EBITDA and Adjusted EBITDA as reported by us to EBITDA and Adjusted EBITDA of other companies. The information presented by each of EBITDA and Adjusted EBITDA is unaudited and has not been prepared in accordance with IFRS or any other accounting standards. None of EBITDA or Adjusted EBITDA is a measurement of performance under IFRS and you should not consider EBITDA or Adjusted EBITDA as an alternative to net income or operating pro� t determined in accordance with IFRS, as the case may be, or to cash � ows from operations, investing activities or � nancing activities. EBITDA and Adjusted EBITDA have limitations as analytical tools, and you should not consider them in isolation. Some of these limitations are:
- they do not re� ect our cash expenditures or future requirements for capital expenditures or contractual commitments; - they do not re� ect changes in, or cash requirements for, our working capital needs; - they do not re� ect the signi� cant interest expense, or the cash requirements necessary, to service interest or principal payments on our debt; - although depreciation and amortisation are non-cash charges, the assets being depreciated and amortised will often need to be replaced in the future and
EBITDA and Adjusted EBITDA do not re� ect any cash requirements that would be required for such replacements; and - the fact that other companies in our industry may calculate EBITDA and Adjusted EBITDA di� erently than we do. which limits their usefulness as comparative measures.

Hal
f-yea
r Rep
ort 2
013
• In
terim
man
agem
ent r
epor
t
16
Vending sector
Vending business overview
First six months of 2013 First six months of 2012 Italy France Spain Consolidated Italy France Spain Consolidated
Business days 122.0 118.5 118.0 121.5 123.0 122.0 119.0 122.7Units sold (thousands) 287,691 27,139 19,294 334,124 277,483 28,033 20,133 325,649Units sold per business day (thousands) 2,358 229 164 2,751 2,256 230 169 2,653Sales (€ thousand) 125,475 12,072 7,589 145,136 118,141 11,165 7,733 137,039Sales per business day(€ thousand) 1,028 102 64 1,194 960 92 65 1,117Average price (€ cents) 43.61 44.48 39.34 43.44 42.58 39.83 38.41 42.08Cost of sales per unit sold(€ cents) (11.20) (13.12) (11.73) (11.38) (10.81) (12.59) (11.75) (11.02)Gross pro� t per unit sold(€ cents) 32.41 31.36 27.61 32.06 31.77 27.24 26.66 31.07Operating pro� t from continuing operations per unit sold (€ cents) 9.24 9.11 8.95 9.21 8.97 5.98 7.35 8.47
Italy France Spain Consolidated
Δ% Business days -0.8% -2.9% -0.8% -1.0%Δ% Units sold 3.7% -3.2% -4.2% 2.6%Δ% Units sold per business day 4.5% -0.3% -3.4% 3.6%Δ% Sales 6.2% 8.1% -1.9% 5.9%Δ% Sales per business day 7.1% 11.3% -1.0% 6.9%Δ% Average price 2.4% 11.7% 2.4% 3.2%Δ% Cost of sales per unit sold 3.6% 4.3% -0.2% 3.3%Δ% Gross pro� t per unit sold 2.0% 15.1% 3.5% 3.2%Δ% Operating pro� t from continuing operations per unit sold 3.1% 52.3% 21.6% 8.8%
During the � rst six months of the year 2013, the Group recorded an increase in the turnover from distribution and sale of food, drinks and other goods through automatic vending machines, with respect to the corresponding period of the previous year (EUR 145,136 thousand, compared to EUR 137,039 thousand).The signi� cant increase in sales is corroborated by the increase in volumes registered during the � rst part of 2013 with respect to the corresponding period of the previous year. This change is largely due to the improvement of the acquisitions completed during all the 2012 that also contributed to P&L since January 1, 2013.
June 30, 2013 Sales and vends breakdown by product type
57Hot34
Mix
9OCS
%
Vends (Thousands)
Hot Mix OCS Total
2013 2012 2013 2012 2013 2012 2013 2012
Italy 161,743 154,087 103,637 102,161 22,311 21,235 287,691 277,483France 16,408 16,275 3,504 3,514 7,227 8,245 27,139 28,033Spain 13,179 13,381 5,565 6,031 550 721 19,294 20,133Total 191,330 183,743 112,706 111,706 30,088 30,201 334,124 325,649
Sales (Thousands) (€)
Hot Mix OCS Total
2013 2012 2013 2012 2013 2012 2013 2012
Italy 57,785 52,828 58,433 56,749 9,257 8,565 125,475 118,141France 6,454 5,222 2,816 2,768 2,802 3,174 12,072 11,165Spain 4,416 4,506 2,947 2,922 227 305 7,589 7,733Total 68,654 62,556 64,196 62,439 12,286 12,044 145,136 137,039
9OCS
44Mix
47Hot%

Hal
f-yea
r Rep
ort 2
013
• In
terim
man
agem
ent r
epor
t
17
Vending activity during the � rst six months of the year 2013 has been negatively a� ected by unfavourable meteorological conditions. In particular, the second quarter – where normally a temperature increase favours the consumption of items with higher margin in absolute terms sold through our vending machines – was colder than the previous year. In Rome, the number of 2013 2Q days where the average temperature was higher than 20˚ C were 17 (vs. 25 in 2012); in Nice 10 (vs. 24 in 2012) and in Madrid 19 (vs. 40 in 2012) (Source: wunderground.com).
The raising of the average sales price – from 42.08 to 43.44 EUR cents – was therefore particularly incisive, although the sales price of our main product (co� ee) remains far below the average price in traditional bars, which in certain cases reaches three-times our price. Our observation of the Italian vending operators’ market suggest a decrease in overall vends in the region of 4%. The decrease is closely correlated to corporate market segment trend, which is driven by working hours. (Source: ISTAT). However, our commercial e� ort in 1H 2013 resulted in a positive gain of vends coming from new clients, which exceeded the churn rate for the � fth quarter in raw.
First Quarter Second Quarter
2013 2012 2013 2012
Thousands % €cent Thousands % €cent Thousands % €cent Thousands % €cent
Vends 167,071 161,329 167,052 164,320Value of production 74,364 100.0% 44.51 65,016 100.0% 40.30 78,929 100.0% 47.25 73,267 100.0% 44.59Operating costs (58,582) 78.8% 35.06 (50,843) 78.2% 31.52 (62,418) 79.1% 37.36 (58,359) 79.7% 35.52Ebitda Adjusted 15,782 21.2% 9.45 14,172 21.8% 8.78 16,511 20.9% 9.88 14,908 20.3% 9.07Other non-recurring income/(expenses)* (1,023) 1.4% 0.61 (849) 1.3% 0.53 (1,051) 1.3% 0.63 (474) 0.6% 0.29Ebitda* 14,759 19.8% 8.83 13,323 20.5% 8.26 15,460 19.6% 9.25 14,434 19.7% 8.78Depreciation and amortisation (9,790) 13.2% 5.86 (8,934) 13.7% 5.54 (9,683) 12.3% 5.80 (9,399) 12.8% 5.72Ebit* 4,969 6.7% 2.97 4,389 6.8% 2.72 5,777 7.3% 3.46 5,035 6.9% 3.06Δ% Vends 3.6% 1.7%Δ% Value of production 14.4% 10.4% 7.7% 6.0%Δ% Operating costs 15.2% 11.3% 7.0% 5.2%Δ% Ebitda Adjusted 11.4% 7.5% 10.8% 8.9%Δ% Other non-recurring income/(expences)* 20.5% 16.3% 121.7% 118.1%Δ% Ebitda* 10.8% 7.0% 7.1% 5.4%Δ% Depreciation and amortisation 9.6% 5.8% 3.0% 1.3%Δ% Ebit* 13.2% 9.3% 14.7% 12.9%
(*) Adjusted by IT1-IVSG 2012 merger cost (Euro 26,827 thousand).
COIN SECTORThe Coin Service division (which carries out coin management activities) recorded revenues of Euro 6,498thousand during the � rst six months of 2013, registering an increase of 15.6% with respect to the corresponding period of the previous year, meanwhile the decrease in the unitary margins generated from bank’s coin managing business a� ected level of pro� tability. Consequently the EBITDA Adjusted remained stable despite the above mentioned increase in the turnover. However the new plants of Alessandria and Messina are not yet at full capacity and they have enough space to increase the activity.In the � rst months of 2013, a new activity, regarding managing of special electronic money acceptance system for Vending industry was started. The initial cost of the start-up has slightly diluted the overall margin of the division, although the performance of the core metallic coin business remains in line with the past.

Hal
f-yea
r Rep
ort 2
013
• In
terim
man
agem
ent r
epor
t
18
Coin Sector June 30, 2013 June 30, 2012
Value of production 6,498 5,621 Operating costs (5,027) (4,147)Ebitda Adjusted 1,471 1,474 Other non-recurring income/(expenses) (47) 16EBITDA 1,424 1,490 % Ebitda Adj / Value of production 23% 26%Depreciation and amortisation (297) (192)Ebit 1,127 1,298 % Ebit / Value of production 17% 23%
FINANCIALS COST, NETNet � nance costs amounted to EUR 7,008 thousand against EUR 5,762 thousand in the corresponding period of the previous year. This increase is due to the non-recurring expenses for an amount equal to EUR 2,776 thousand, as described in the table below.This table shows the detail of � nancials P&L:
Financial P&L June 30, 2013
Interest income 939 Result of companies valued at net equity 13 Interest on loans (1,237) Interest on � nancial leases (321) Interest on bond (3,563) Interest cost of employee bene� ts (102) Income on derivatives, net 90 Income on fair value warrant 570 Change of put option (326) Other charges (295) Total ordinary result (4,232) MTM hedging derivatives (2,291) Amortised cost fees (485) Total extraordinary result (2,776)Grand Total (7,008)
In the � rst part of 2013, the Italian tax authorities did not increase their delay in refund VAT3 and partially recovered the lag accumulated in 2012. Accordingly, our VAT credit decreased of EUR 5,078 thousand during the � rst six months of the year 2013.In addition to that, EUR 8,445 thousand have been refunded in July 2013. The Italian tax authority is committed to normalise the timing of VAT refunds.
INVESTMENTSDuring the period the principal investments carried out by Group companies regarded the purchase of assets to be used in the exercise of its commercial activities: vending machines, token dispensers and payment systems, motor vehicles and trucks; these investments were made to upgrade and renew the existing machinery and equipment in order to meet customers’ changing requirements, to improve customer service and, accordingly, strengthen and develop the Group’s position in its relevant market.
In August 2013 the Italian Parliament approved the conversion in law of the Government’s decree June 4, 2013, no.63 that increased from 4% to 10% the VAT rate applicable to items sold through vending business. In order to allow vending operators to modify their machines on the � eld and to inform the clients of this law
3. VAT credit deriving from the di� erence in the VAT rate between the one applied to sales and the one applied to purchases of the principal Italian operating company (IVS Italia S.p.A.).

Hal
f-yea
r Rep
ort 2
013
• In
terim
man
agem
ent r
epor
t
19
change, the increase will take e� ect from the beginning of the year 2014. Considering that the largest part of our Italian technical structure will be involved during the second part of 2013 in this activity, we concentrated the largest part of our capital expenditure (“capex”) during the second quarter of the year 2013.
In the � rst part of year 2013 we paid Euro 7,968 for acquiring new participations and pay part of the deferred consideration agreed with the acquisition of Fast Service Italia S.p.A., completed in the year 2012.Despite the amounts paid in the � rst half of the year 2013 in connection with the Senior Notes issuance and an aggressive payment policy adopted with some selected suppliers to obtain some reductions in COGS, the cash � ows generated in the � rst half of year 2013 from the operating activity (EUR 20,007 thousand) were comparable to the amount generated in the whole year 2012 (EUR 20,151 thousand).
March 31, 2013
Type
New Refurbishment Total Capex
Operative Capex:Vending machines and payment systems 4,882 1,886 6,768 Vehicles 804 - 804 Other assets 1,522 - 1,522
7,208 1,886 9,094 Extraordinary CapexNew Barcelona facility 3,657 - 3,657 Operating Assets from Acquisitions 903 - 903
4,560 - 4,560
June 30, 2013 (Cumulated 1Q + 2Q)
Type
New Refurbishment Total Capex
Operative Capex:Vending machines and payment systems 9,127 3,364 12,491 Vehicles 1,500 - 1,500 Other assets 3,971 - 3,971
14,598 3,364 17,962 Extraordinary CapexNew Barcelona facility 4,232 - 4,232 Operating Assets from Acquisitions 3,157 - 3,157
7,389 - 7,389
PRINCIPAL EQUITY, FINANCIAL AND EARNINGS RATIOSThe IVS Group closed the � rst six months of the year 2013 with a net pro� t of Euro 4,947 thousand and with a consolidated shareholders’ equity attributable to the owner of the parent company of Euro 298,454 thousand, (+1.6% compared to December 31, 2012). In addition, at June 30, 2013, the Group shows a net � nancial indebtedness of Euro 177,770 thousand (+5,5% compared to December 31, 2012).
(thousands of Euro) Italy % France % Spain % Coin %Intra-sector adjustment
June 30, 2013 %
Capital structure composition analysisFixed Assets 508,338 79% 34,140 88% 19,672 87% 14,811 31% (38,281) 538,680 76%Current Assets 73,314 11% 3,087 8% 1,672 7% 17,939 37% (6,158) 89,855 13%Liquidity 63,602 10% 1,424 4% 1,220 6% 15,328 32% - 81,574 11%Invested Capital 645,254 100% 38,651 100% 22,564 100% 48,078 100% (44,439) 710,109 100%Consolidated Liabilities 237,352 37% 14,089 36% 3,486 16% 11,248 23% (8,996) 257,178 36%Current Liabilities 112,847 17% 7,060 18% 3,240 14% 32,979 69% (6,404) 149,722 21%Equity 295,056 46% 17,502 46% 15,839 70% 3,851 8% (29,039) 303,209 43%Finance Capital 645,254 100% 38,651 100% 22,564 100% 48,078 100% (44,439) 710,109 100%

Hal
f-yea
r Rep
ort 2
013
• In
terim
man
agem
ent r
epor
t
20
(thousands of Euro) Italy % France % Spain % Coin %Intra-sector adjustment
December 31, 2012 %
Capital structure composition analysisFixed Assets 508,098 85% 33,118 90% 17,547 86% 19,222 40% (37,996) 539,989 82%Current Assets 78,599 13% 2,911 8% 1,946 10% 9,896 21% (6,407) 86,945 13%Liquidity 11,812 2% 719 2% 886 4% 18,400 39% (3,001) 28,817 5%Invested Capital 598,509 100% 36,749 100% 20,380 100% 47,518 100% (47,404) 655,751 100%Consolidated Liabilities 142,604 24% 14,240 38% 797 4% 14,928 32% (20,907) 151,662 23%Current Liabilities 163,613 28% 7,157 20% 4,137 20% 29,630 62% 1,479 206,016 31%Equity 292,292 48% 15,352 42% 15,446 76% 2,961 6% (27,976) 298,074 46%Finance Capital 598,509 100% 36,749 100% 20,380 100% 47,518 100% (47,404) 655,751 100%
RELATED PARTY TRANSACTIONS
The transactions with related parties shown in the interim consolidated � nancial statements regarded the associated companies and other related parties as de� ned by IAS 24. A summary of transactions and balances with related parties as of June 30, 2013 is provided in the Explanatory notes (Note 18).The operations with related parties were carried out for the purposes of consolidating existing synergies within the Group in terms of production, commercial and logistics integration, of the e� cient use of expertise and skills and streamlining of centralised structures and of � nancial resources. All transactions with related parties, both those related to the exchange of goods and services and those of a � nancial nature, take place at normal market conditions.
TRANSACTIONS WITH SUBSIDIARIES AND ASSOCIATESThese transactions are of a commercial (exchange of goods and/or services) and � nancial nature. For more detailed information reference should be made to the explanatory notes regarding transactions with subsidiaries and associates.
TRANSACTIONS WITH OTHER RELATED PARTIES:Transactions with other related parties are mainly of a commercial nature and mostly consist of the exchange of goods and/or services such as management fees, fees and consideration for services, rental/leasing charges, etc..For further information reference should be made to the explanatory notes about transactions with other related parties.
OWN SHARES AND SHARES/QUOTAS IN PARENT COMPANIESThe Company holds 2,854,528 own shares following the re-acquisition thereof as a result of the exercise of the redemption option by certain shareholders during the business combination completed on May 16, 2012.
PRINCIPAL RISKS AND UNCERTAINTIES
Risk management (which involves management of internal and external, social, industrial, political and � nancial risks) is an integrated part of the Group’s growth strategy and is essential to the on-going development of its corporate governance system. Its aim is to protect both stakeholders (employees, customers, suppliers and shareholders) and the Group’s assets by improving codes of conduct.
GENERAL AND BUSINESS RISKS:The Group constantly monitors its � nancial risks in order to assess in advance the potential e� ects thereof and undertake the necessary actions to mitigate or o� set them.Our business, � nancial condition and results of operations may be adversely a� ected by the current unfavourable economic conditions in our primary markets of Italy, France and Spain and by market perceptions concerning Italy in particular.

Hal
f-yea
r Rep
ort 2
013
• In
terim
man
agem
ent r
epor
t
21
The global � nancial and credit markets continue to be volatile in many markets and non-� nancial sectors of the world economy have also su� ered in recent years, resulting in a general contraction in consumer spending that varies by market. The international crisis, unprecedented in its scope and rapid spread, has steadily damaged the global economy in the last few years and constituted a risk for the Group. This di� cult situation was worsened by the � nancial scenario characterised by rising uncertainty and a rigidity which has made it very di� cult to operate.The Group has faced this situation by adjusting its equity and � nancial structure and introducing policies to contain costs, rethink its commercial policies and increase prices. The e� ects of the crisis would seem to be more or less stabilised, although demand continues to � uctuate.
The food and beverage industry is highly regulated and our business could be materially adversely a� ected by changes in governmental regulation and legislation or by associated compliance costs. Moreover, failure to comply with governmental regulations could result in the imposition of � nes or restrictions on operations and remedial liabilities.The restrictions placed in the past on the French market in relation to vending machines in schools may become more widespread, even in Italy, for instance, some discussions on this matter took place in the last months. Such restrictions could require us to stock less pro� table products in our vending machines and/or products that are less appealing to consumers and generate less revenue. If this were to occur in Italy or Spain, then it may have a material adverse e� ect on our business, � nancial condition and results of operations.
We operate in highly competitive industries, and if we do not compete e� ectively, we may lose market share or be unable to maintain or increase prices for our services. We face constraints on our ability to increase prices in response to competitive pressures or otherwise. Additionally, increasing operating costs, including redevance4 cost arrangements with certain customers, may o� set improvements on margins that rising prices might otherwise produce.
Our Coin Service Business involves the movement of large sums of money, and, as a result, our business is particularly dependent on our ability to process and settle transactions securely, accurately and e� ciently.
Our operations could be adversely a� ected if we are unable to retain key employees.We may face labour disruptions that could interfere with our operations and have a material adverse e� ect on our business, � nancial condition and results of operations.
The concentration of credit risk of a commercial nature is limited given its vast and diversi� ed customer base. For this reason, the current provisions for bad and doubtful debts are considered to be adequate.
FINANCIAL RISKS:The Group is exposed to normal � nancial risks as part of its business related mainly to interest rate.The Group did not made any investments in non-current � nancial assets nor in current � nancial assets (shares, bonds or other securities) such as to require particular prudence on how to measure the impact the economic recession and collapse of the � nancial markets in having thereon.
CREDIT RISK:We are exposed to credit risk related to our customers who may cause us to make larger allowances for doubtful trade receivables or incur write-o� s related to impaired receivables.
As of June 30, 2013, we had approximately Euro 18.6 million in trade receivables from customers resulting from sales hot beverage single-use drink pods (mostly co� ee), cups and stirrers which we provide to our O� ce Co� ee Services customers and typically invoice our customers at the time of each delivery.
4. We name Redavance any cost, fees or expenses paid to exercise vending activity at third parties premises or spaces.

Hal
f-yea
r Rep
ort 2
013
• In
terim
man
agem
ent r
epor
t
22
If the macroeconomic conditions in Italy, France and Spain continue to deteriorate, we cannot assure that we will not have to increase our provisions for impaired debts relating to debts owed to us, which could have a material adverse e� ect on our business, � nancial condition and results of operations.
LIQUIDITY RISK:This is the risk that the Group will not be able to generate su� cient cash � ows from its operations to cover investments and third party debt. Each group company is free to negotiate credit facilities (in accordance with corporate management) and to agree diversi� ed sources of funding (e.g., loans, � nance leases, bank credit facilities, etc.) as long as the incurrence covenants of the Indenture of the Senior Notes are respected.
INTEREST RATE RISK:This is the risk related to future cash � ows from � nancing operations at � oating interest rates. A change in interest rates a� ects the fair value of � oating rate � nancial assets and liabilities and may impact a company’s future results. However as of June 30, 2013 only 26% of IVS Group’s � nancial indebtedness is at � oating rate.
The Group is also exposed to the following non-� nancial risks:
LEGAL RISKS:The Group is not involved in any signi� cant legal disputes relative to products sold, unfair competition or market practices, nor does it have any related � nancial obligations.
FISCAL RISKS:No new relevant � scal disputes have arisen as a result of tax assessments carried out by the � scal authorities.
While not constituting a risk in itself, we would point out that IVS Group S.A. has registered o� ces in Luxembourg, while its operational headquarters and centre of main operations are located in Italy. Consequently, for 2012, but also for 2011, in accordance with the prevailing OECD doctrine, the directors believe that the Company is resident for � scal purposes in Italy. The Company has therefore presented a request for interpretation to the Italian tax authorities (Agenzia delle Entrate – Direzione Centrale Normativa) regarding the application of the regulations contained in Article 83, D.P.R. No. 917 of 22 December 1986 and by Article 1, Legislative Decree No. 201 of 6 December 2011. After receiving the answer from the Italian tax authorities, the company has decided to calculate its tax charge in accordance with Italian tax legislation applicable to Italian resident companies.
SUBSEQUENT EVENTS AND OUTLOOK FOR THE REMAINDER OF THE YEAR No signi� cant events have occurred after June 30, 2013 except the above mentioned enact of the law concerning the VAT rate increase applicable to items sold through vending machines. All available steps are being taken to increase average sales prices to compensate this VAT rate increase., We are managing an adequate pricing policy to minimise the e� ect of such law on our margins, but we estimate that the extraordinary commercial e� ort to implement such strategy will bare an extraordinary cost of between EUR 500 thousand and EUR 900 thousand.Nevertheless, volumes will be a� ected by the new regime. In addition, it is reasonable to expect that, due to the current economic condition, like-for-like sale volumes will continue to stagnate, which is being taken into consideration by the IVS Group management team.
Lastly, we continue the research of targets to acquire in order to increase the customer base and service in those areas and branches which � xed structures would permit an increase in volumes without a proportional increase in the relative costs.
Luxembourg, 28 August 2013 On behalf of the Board of Directors,
Cesare Cerea Chairman

23
Management Certifi cation
On the basis of the information currently available to us, we con� rm that:
1. the unaudited condensed interim consolidated � nancial statements, prepared in conformity with the International Financial Reporting Standards adopted by the European Union, included in this Half-year Report, give a true and fair view of the equity and � nancial situation, the economic result and the cash � ows of IVS Group S.A., and of its consolidated subsidiaries; and
2. the Interim management’s report included in this Half-year Report, contains a reliable analysis of the signi� cant events which took place during the � rst six months of the year 2013, of the impact thereof on the unaudited condensed interim consolidated � nancial statements, of the signi� cant transactions with related parties, as well as a description of the principal risks and uncertainties to which the IVS Group is exposed.
Massimo Paravisi Chief Executive O� cer August 28, 2013
Antonio Tartaro Chief Financial O� cer August 28, 2013
Hal
f-yea
r Rep
ort 2
013
• M
anag
emen
t Cer
ti� c
atio
n

Inte
rim m
anag
emen
t rep
ort
Hal
f-yea
r Rep
ort 2
013
• In
terim
man
agem
ent r
epor
t
24

Inte
rim m
anag
emen
t rep
ort
Inte
rim m
anag
emen
t rep
ort
25
Hal
f-yea
r Rep
ort 2
013
• In
terim
man
agem
ent r
epor
tCondensed Interim
Consolidated Financial Statements

Hal
f-yea
r Rep
ort 2
013
• In
terim
man
agem
ent r
epor
t
26

Hal
f-yea
r Rep
ort 2
013
• In
terim
man
agem
ent r
epor
t
27
IndependentAuditor’s Report


Indi
pend
ent A
udito
r’s R
epor
t
29
Hal
f-yea
r Rep
ort 2
013
• In
dipe
nden
t Aud
itor’s
Rep
ort

Hal
f-yea
r Rep
ort 2
013
• F
inan
cial
Sta
tem
ents
Sch
edul
es
30

H
alf-y
ear R
epor
t 201
3 •
Fin
anci
al S
tate
men
ts S
ched
ules
31
Financial StatementsSchedules

Hal
f-yea
r Rep
ort 2
013
• F
inan
cial
Sta
tem
ents
Sch
edul
es
32
Financial Statements SchedulesCONSOLIDATED STATEMENTS OF FINANCIAL POSITION
(in thousands of Euro) Note June 30, 2013 December 31, 2012
ASSETSNon-current assetsIntangible assets 6 46,487 48,337Goodwill 7 317,067 314,794Property, plant and equipment 8 154,739 150,588Equity Investments 5,564 5,552Non-current � nancial assets 2,813 9,487Deferred tax assets 11,807 10,956Other non-current assets 203 274TOTAL NON-CURRENT ASSETS A 538,680 539,988Current assetsInventories 18,943 19,194Trade receivables 18,616 19,047Tax assets 2,316 2,498Other current assets 38,661 41,397Current � nancial assets 11,319 4,810Cash and cash equivalents 81,574 28,817TOTAL CURRENT ASSETS B 171,429 115,763TOTAL ASSETS A+B 710,109 655,751SHAREHOLDERS’ EQUITY AND LIABILITIESShareholders’ equityShare capital 11 387 387Share premium reserve 349,825 354,650Other reserves 9,401 7,740Treasury shares (28,303) (31,720)Retained earnings / (losses) (37,151) (21,746)Net pro� t (loss) for the period 4,295 (15,422)SHAREHOLDERS’ EQUITY ATTRIBUTABLE TO THE OWNERS OF THE PARENT 298,454 293,889Share capital and reserves attributable to non-controlling interests 4,103 2,913Net pro� t/(loss) for the year attributable to non-controlling interests 652 1,272SHAREHOLDERS’ EQUITY ATTRIBUTABLE TO NON-CONTROLLING INTERESTS 4,755 4,185TOTAL SHAREHOLDERS’ EQUITY C 303,209 298,074Non-current liabilitiesDue to Bond holders 9 195,161 - Non-current � nancial liabilities 9 34,777 113,682Employee bene� ts 6,477 6,729Provisions for risks and charges 830 814Deferred tax liabilities 19,933 20,906Other non-current liabilities 0 9,531TOTAL NON-CURRENT LIABILITIES D 257,178 151,662Current liabilitiesDue to Bond holders 9 3,852 8,083Current � nancial liabilities 9 33,260 79,906Derivative � nancial instruments 9, 11 6,629 10,245Trade payables 65,663 68,608Tax liabilities 2,046 2,580Other current liabilities 38,272 36,593TOTAL CURRENT LIABILITIES E 149,722 206,016TOTAL LIABILITIES F=D+E 406,900 357,677TOTAL SHAREHOLDERS’ EQUITY AND LIABILITIES C+F 710,109 655,751
H
alf-y
ear R
epor
t 201
3 •
Fin
anci
al S
tate
men
ts S
ched
ules
33
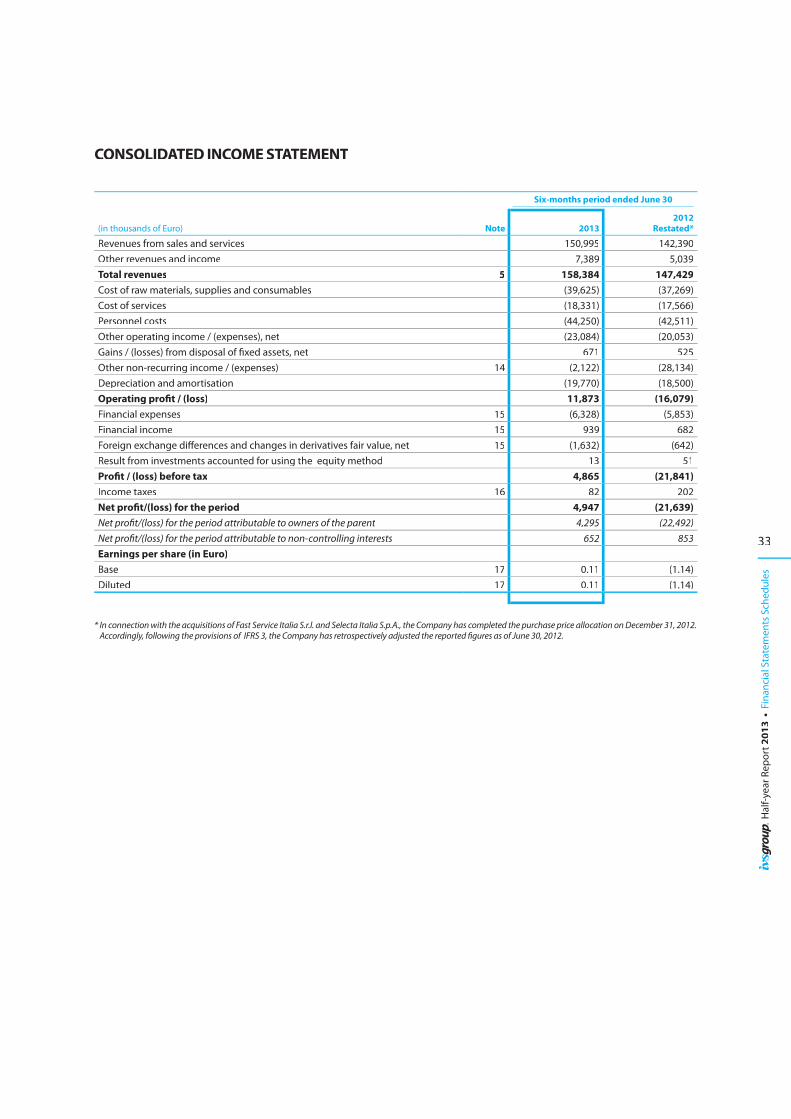
CONSOLIDATED INCOME STATEMENT
(in thousands of Euro) Note
Six-months period ended June 30
20132012
Restated*
Revenues from sales and services 150,995 142,390Other revenues and income 7,389 5,039Total revenues 5 158,384 147,429Cost of raw materials, supplies and consumables (39,625) (37,269)Cost of services (18,331) (17,566)Personnel costs (44,250) (42,511)Other operating income / (expenses), net (23,084) (20,053)Gains / (losses) from disposal of � xed assets, net 671 525Other non-recurring income / (expenses) 14 (2,122) (28,134)Depreciation and amortisation (19,770) (18,500)Operating pro� t / (loss) 11,873 (16,079)Financial expenses 15 (6,328) (5,853)Financial income 15 939 682Foreign exchange di� erences and changes in derivatives fair value, net 15 (1,632) (642)Result from investments accounted for using the equity method 13 51Pro� t / (loss) before tax 4,865 (21,841)Income taxes 16 82 202Net pro� t/(loss) for the period 4,947 (21,639)Net pro� t/(loss) for the period attributable to owners of the parent 4,295 (22,492)Net pro� t/(loss) for the period attributable to non-controlling interests 652 853Earnings per share (in Euro)Base 17 0.11 (1.14)Diluted 17 0.11 (1.14)
* In connection with the acquisitions of Fast Service Italia S.r.l. and Selecta Italia S.p.A., the Company has completed the purchase price allocation on December 31, 2012.Accordingly, following the provisions of IFRS 3, the Company has retrospectively adjusted the reported � gures as of June 30, 2012.

Hal
f-yea
r Rep
ort 2
013
• F
inan
cial
Sta
tem
ents
Sch
edul
es
34
CONSOLIDATED STATEMENT OF COMPREHENSIVE INCOME
(in thousands of Euro)
Six-months period ended June 30,
20132012
Restated*
Net pro� t/(loss) for the period 4,947 (21,639)Other comprehensive income to be reclassi� ed to pro� t or loss in subsequent periodsNet (loss)/gain on cash � ow hedges 2,291 268Income tax e� ect (630) (74)Net other comprehensive income to be reclassi� ed to pro� t or loss in subsequent periods 1,661 194Items not to be reclassi� ed to pro� t or loss in subsequent periodsActuarial gains/(losses) on de� ned bene� t plans 137 (198)Income tax e� ect (32) 54Net other comprehensive income not being reclassi� ed to pro� t or loss in subsequent periods 105 (144)Total income/(loss) in the statements of comprehensive income, net of taxes 6,713 (21,589)Attributable to:Owners of the Parent 6,049 (22,442)Non-controlling interests 664 853
* In connection with the acquisitions of Fast Service Italia S.r.l. and Selecta Italia S.p.A., the Company has completed the purchase price allocation on December 31, 2012Accordingly, following the provisions of IFRS 3, the Company has retrospectively adjusted the reported � gures as of June 30, 2012.

H
alf-y
ear R
epor
t 201
3 •
Fin
anci
al S
tate
men
ts S
ched
ules
35
CON
SOLI
DAT
ED S
TATE
MEN
T O
F CH
AN
GES
IN S
HA
REH
OLD
ERS’
EQ
UIT
Y D
URI
NG
TH
E FI
RST
SIX
MO
NTH
S O
F 20
13
(in th
ousa
nds
of E
uro)
Shar
ehol
ders
’equ
ity
of th
e IV
S G
roup
S.A
.
Att
ribu
tabl
e to
non
-co
ntro
lling
in
tere
sts
Tota
l Sh
areh
olde
rs’
equi
tySh
are
capi
tal
Shar
e pr
emiu
m
rese
rve
Trea
sury
sh
ares
Oth
erca
pita
l re
serv
es
Reta
ined
ea
rnin
gs/
(loss
es
brou
ght
forw
ard)
Rese
rve
for
cash
� ow
he
dges
Net
inco
me/
(loss
) for
the
peri
odTo
tal
Bal
ance
as
of Ja
nuar
y 1,
201
3 38
735
4,65
0(3
1,72
0)9,
401
(21,
746)
(1,6
61)
(15,
422)
293,
889
4,18
529
8,07
4 A
lloca
tion
of n
et in
com
e (lo
ss)
(15,
422)
15,4
22 -
0 N
et re
sult
for t
he p
erio
d 4,
295
4,29
565
24,
947
Oth
er c
ompr
ehen
sive
inco
me
941,
661
1,75
512
1,76
6 T
otal
com
preh
ensi
ve in
com
e/(lo
ss)
- -
- -
941,
661
4,29
56,
050
664
6,71
3 T
reas
ury
shar
es s
old:
-
to IV
S Pa
rtec
ipaz
ioni
S.p
.A.
3,41
7(1
96)
3,22
13,
221
Tot
al e
� ec
t of T
reas
ury
shar
es s
old
- -
3,41
7 -
(196
) -
- 3,
221
- 3,
221
Oth
er m
ovem
ents
: R
ecla
ssi�
catio
n 11
8 1
18
(118
)0
Wai
ver c
redi
t min
ority
sha
reho
lder
s of
CSH
Srl
- 24
24
Rou
ndin
gs
11
2 T
otal
oth
er m
ovem
ents
-
- -
- 11
9 -
- 11
9(9
4)25
Pay
men
t of d
ivid
ends
(4
,825
)(4
,825
)(4
,825
) B
alan
ce a
s of
June
30,
201
3 38
734
9,82
5(2
8,30
3)9,
401
(37,
151)
- 4,
295
298,
454
4,75
530
3,20
9

Hal
f-yea
r Rep
ort 2
013
• F
inan
cial
Sta
tem
ents
Sch
edul
es
36
CON
SOLI
DAT
ED S
TATE
MEN
TS O
F CH
AN
GES
IN S
HA
REH
OLD
ERS’
EQ
UIT
Y D
URI
NG
TH
E FI
RST
SIX
MO
NTH
S O
F 20
12 (R
ESTA
TED
)*
(in th
ousa
nds
of E
uro)
Shar
ehol
ders
’equ
ity
of th
e IV
S G
roup
S.A
.
Att
ribu
tabl
e to
non
-co
ntro
lling
in
tere
sts
Tota
l Sh
areh
olde
rs’
equi
tySh
are
capi
tal
Shar
e pr
emiu
m
rese
rve
Trea
sury
sh
ares
Oth
erca
pita
l re
serv
es
Reta
ined
ea
rnin
gs/
(loss
es
brou
ght
forw
ard)
Rese
rve
for
cash
� ow
he
dges
Net
inco
me/
(loss
) for
the
peri
odTo
tal
Bala
nce
as o
f Jan
uary
1, 2
012
64,0
022,
498
5,23
1(1
9,88
4)(2
,216
)2,
684
52,3
157,
403
59,7
18A
lloca
tion
of n
et in
com
e (lo
ss)
2,68
4(2
,684
)-
-N
et lo
ss fo
r the
per
iod
(22,
492)
(22,
492)
853
(21,
639)
Oth
er c
ompr
ehen
sive
inco
me
(143
)19
451
51To
tal c
ompr
ehen
sive
inco
me/
(loss
) -
--
-(1
43)
194
(22,
492)
(22,
441)
853
(21,
588)
E� e
cts
of a
cqui
sitio
n of
non
-con
trol
ling
inte
rest
s-
-- I
VS F
ranc
e S.
a.S.
(366
)(3
66)
(2,0
30)
(2,3
96)
- EM
MED
I S.A
.(1
,715
)(1
,715
)(9
92)
(2,7
07)
- DAV
S.A
.(1
,856
)(1
,856
)(1
,222
)(3
,078
)- M
ETRO
SHO
PPIN
G(2
7)(2
7)(2
)(2
9)To
tal e
� ec
t of A
cqui
siti
on o
f non
-con
trol
ling
inte
rest
s -
--
-(3
,964
)-
-(3
,964
)(4
,246
)(8
,210
)E�
ect
s of
sha
re c
apita
l inc
reas
es c
arrie
d ou
t:- S
hare
cap
ital i
ncre
ase
of 2
1-03
-12
128,
227
(5,2
31)
122,
996
122,
996
- Sha
re c
apita
l inc
reas
e of
04-
04-1
21,
938
285
2,22
32,
223
- Sha
re c
apita
l inc
reas
e of
03-
05-1
24,
310
945
5,25
55,
255
Tota
l e�
ect o
f Sha
re c
apit
al in
crea
ses
134,
475
1,23
0-
(5,2
31)
--
-13
0,47
4-
130,
474
E� e
cts
from
Bus
ines
s Co
mbi
natio
ns:
- Bus
ines
s co
mbi
natio
n Fa
st S
ervi
ce It
alia
S.r.
l.90
890
8To
tal e
� ec
t of B
usin
ess
Com
bina
tion
s-
--
--
--
-90
890
8E�
ect
s of
reve
rse
asse
t acq
uisi
tion
Shar
e ca
pita
l inc
reas
e (F
air V
alue
Ital
y1 In
vest
men
t S.A
. 16/
5/12
)13
0,51
013
0,51
013
0,51
0Ac
quis
ition
of o
wn
shar
es(3
1,72
0)31
,720
--
Exis
ting
shar
es It
aly1
Inve
stm
ent S
.A.
175
134,
860
(135
,035
)-
-Sh
are
capi
tal in
crea
se in
favo
ur o
f the
shar
ehol
ders
of I
VS G
roup
Hol
ding
S.p
.A.
212
219,
788
(220
,000
)-
-Re
clas
si� c
atio
n of
the
shar
e ca
pita
l of I
VS G
roup
Hol
ding
S.p
.A.
(198
,477
)(3
,728
)20
2,20
5-
-To
tal e
� ec
t fro
m re
vers
e as
set a
cqui
siti
on(1
98,0
90)
350,
920
(31,
720)
9,40
0-
--
130,
510
-13
0,51
0Pa
ymen
t of d
ivid
ends
-(1
88)
(188
)Ba
lanc
e as
of J
une
30, 2
012
387
354,
648
(31,
720)
9,40
0(2
1,30
7)(2
,022
)(2
2,49
2)28
6,89
44,
730
291,
624
* In
conn
ectio
n w
ith th
e ac
quis
ition
s of F
ast S
ervi
ce It
alia
S.r.
l. an
d Se
lect
a Ita
lia S
.p.A
., th
e Co
mpa
ny h
as co
mpl
eted
the
purc
hase
pric
e al
loca
tion
on D
ecem
ber 3
1, 2
012.
Acc
ordi
ngly
, fol
low
ing
the
prov
isio
ns o
f IF
RS 3
, the
Com
pany
has
retr
ospe
ctiv
ely
adju
sted
th
e re
port
ed �
gure
s as o
f Jun
e 30
, 201
2.

H
alf-y
ear R
epor
t 201
3 •
Fin
anci
al S
tate
men
ts S
ched
ules
37
CONSOLIDATED STATEMENT OF CASH FLOWS
Six Months EndedJune 30, 2013
Six Months EndedJune 30, 2012
Restated*
A) Cash � ows from operating activities Pro� t (Loss) before tax 4,865 (21,841)Adjustments for:Undistributed pro� t/(loss) of associates valued at net equity (13) (51)Amortisation, depreciation and impairment losses 20,111 18,385Non-recurring costs of reverse asset acquisition - 25,476(Gains)/losses on disposal of non-current assets (670) (525)Changes in employee bene� ts and other provisions (374) 270Reversal of � nancial expense 4,005 5,813 Cash � ows from operating activities before tax, � nancial income/expense and changes in
working capital: 27,924 27,527Changes in working capital 4,934 (13,164) Cash � ows from operating activities before tax and � nancial income/expense: 32,858 14,363Net � nancial expense paid (10,184) (5,859)Tax paid (2,667) (1,612)
Total A) 20,007 6,892B) Cash � ows from investing activities:Investments in non-current assets:Intangible assets (273) (618)Property, plant and equipment (21,943) (14,312)Payments for property, plant and equipment acquired in previous years (1,495) 664Business acquired (2,670) (1,932)Acquisition of subsidiaries, net of cash (7,968) (23,242)
Total investments (34,349) (39,440)Proceeds from disposal of net non-current assets 1,667 1,272
Total divestitures 1,667 1,272Total B) (32,682) (38,168)
C) Cash � ows from � nancing activities:Proceeds from non-current loan 205,386 9,903Repayment of non-current loan liabilities (120,054) (191,107)Changes in current � nancial liabilities (15,553) 516Changes in � nancial assets 165 13,000Changes in a Parent’s ownership interests - (7,679)Share capital increase - 130,705Share capital increase realised by means of reverse asset acquisition - 119,066Dividend distribution (4,512) -
Total C) 65,432 74,404Total D) - -
D) Exchange rate di� erences and other variations:E) Change in cash and cash equivalents (A+B+C+D): 52,757 43,128F) Cash and cash equivalents as of January 1: 28,817 36,127Cash and cash equivalents as of June 30 (E+F) 81,574 79,255
* In connection with the acquisitions of Fast Service Italia S.r.l. and Selecta Italia S.p.A., the Company has completed the purchase price allocation on December 31, 2012.Accordingly, following the provisions of IFRS 3, the Company has retrospectively adjusted the reported � gures as of June 30, 2012.

Hal
f-yea
r Rep
ort 2
013
• In
terim
man
agem
ent r
epor
t
38

Hal
f-yea
r Rep
ort 2
013
• In
terim
man
agem
ent r
epor
t
39
Explanatory Notes to the Financial Statements

Hal
f-yea
r Rep
ort 2
013
• E
xpla
nato
ry N
otes
to th
e Fi
nanc
ial S
tate
men
ts
40
Explanatory Notes to the Financial Statements
1 – CORPORATE INFORMATION
IVS Group S.A. is a public limited company incorporated under the Luxembourg law on August 26, 2010 and registered on the Luxembourg Companies Register with the number B155.294. The company has its registered o� ces at 2A, Rue Jean-Baptiste Esch, L-1473 Luxembourg, where it is currently based. The shares of IVS Group S.A. are listed on the Italian stock market (“MTA” segment). The name of the Company was changed on May 16, 2012, from Italy1 Investment S.A..The publication of the Condensed Interim Consolidated Financial Statements for the period ended on June 30, 2013 was authorised by the Board of Directors’ resolution of August 28, 2013.
IVS Group S.A. controls, directly and indirectly, a number of companies that operate in the vending market, i.e., in the sale of products through automated and semi-automated vending machines installed at unattended points of sale (businesses, schools, hospitals, railway stations, and other public places). These machines operate 24 hours a day and allow consumers to purchase products with coins, banknotes, prepaid cards and other means of payment. The Group also controls the Coin Group, whose core business is the counting of coins for third parties, cash-in-transit services, collection and distribution of coins (coin management).
2 – BASIS OF PREPARATION AND CHANGES TO THE GROUP’S ACCOUNTING POLICIES
BASIS OF PREPARATIONThe condensed interim consolidated � nancial statements for the six months ended June 30, 2013 have been prepared in accordance with IAS 34 Interim Financial Reporting. The condensed interim consolidated � nancial statements do not include all the information and disclosures required in the annual � nancial statements, and should be read in conjunction with the Group’s annual consolidated � nancial statements as at December 31, 2012.
NEW STANDARDS, INTERPRETATIONS AND AMENDMENTS ADOPTED BY THE GROUPThe accounting policies adopted in the preparation of the condensed interim consolidated � nancial statements are consistent with those followed in the preparation of the Group’s annual consolidated � nancial statements for the year ended December 31, 2012, except for the adoption of new standards and interpretations e� ective as of January 1, 2013.
The Group applied, for the � rst time, some standards and amendments that require restatement of previous � nancial statements. These include amendments to IAS 1 Presentation of Financial Statements. As required by IAS 34, the nature and the e� ect of these changes are disclosed below.
IAS 1 Presentation of Items of Other Comprehensive Income – Amendments to IAS 1 The amendments to IAS 1 introduce a grouping of items presented in other comprehensive income (OCI). Items that could be reclassi� ed (or recycled) to pro� t or loss at a future point in time (e.g., net gain on hedge of net investment, exchange di� erences on translation of foreign operations, net movement on cash � ow hedges and net loss or gain on available-for-sale � nancial assets) now have to be presented separately from items that will never be reclassi� ed (e.g., actuarial gains and losses on de� ned bene� t plans and revaluation of land and buildings). The amendment a� ected presentation only and had no impact on the Group’s � nancial position or performance.

Hal
f-yea
r Rep
ort 2
013
• E
xpla
nato
ry N
otes
to th
e Fi
nanc
ial S
tate
men
ts
41
IFRS 7 Financial Instruments: Disclosures O� setting Financial Assets and Financial Liabilities – Amendments to IFRS 7 The amendment requires an entity to disclose information about rights to o� set � nancial instruments and related arrangements (e.g., collateral agreements). The disclosures would provide investors with information relevant to the evaluation of the e� ect of netting arrangements on an entity’s � nancial position. The new disclosures are required for all recognised � nancial instruments that are o� set in accordance with IAS 32.The disclosures also apply to recognised � nancial instruments that are subject to an enforceable master netting arrangement or similar agreement, irrespective of whether the � nancial instruments are o� set in accordance with IAS 32. As the Group is not o� setting � nancial instruments in accordance with IAS 32 and does not have relevant o� setting arrangements, the amendment does not have an impact on the Group.
IFRS 13 Fair Value Measurement IFRS 13 establishes a single IFRS framework for all fair value measurements. IFRS 13 does not determine when an entity is required to use fair value, but rather provides guidance on how to measure fair value under IFRS when fair value is required or permitted. The application of IFRS 13 has not materially impacted the fair value measurements carried out by the Group. IFRS 13 also requires speci� c disclosures on fair values, some of which replace existing disclosure requirements set by other standards, including IFRS 7 Financial Instruments: Disclosures. Some of these disclosures are speci� cally required for � nancial instruments by IAS 34.16A(j), thereby a� ecting the interim condensed consolidated � nancial statements period. The Group provides these disclosures in Note 11.
In addition to the above-mentioned amendments and new standards, IFRS 1 First-time Adoption of International Financial Reporting Standards was amended with e� ect on reporting periods starting on or after January 1, 2013. The Group is not a � rst-time adopter of IFRS, therefore, this amendment is not relevant to the Group.
Standards and interpretations issued but not yet e� ective up to the date of preparation of the Group’s consolidated financial statements are listed below. The Group intends to adopt these standards when they become e� ective.
IFRS 10 Consolidated Financial Statements and IAS 27 Separate Financial Statements IFRS 10 establishes a single control model that applies to all entities including special purpose entities. IFRS 10 replaces the parts of previously existing IAS 27 Consolidated and Separate Financial Statements that dealt with consolidated � nancial statements and SIC-12 Consolidation – Special Purpose Entities. IFRS 10 changes the de� nition of control such that an investor controls an investee when it is exposed, or has rights, to variable returns from its involvement with the investee and has the ability to a� ect those returns through its power over the investee. To meet the de� nition of control in IFRS 10, all three criteria must be met, including: (a) an investor has power over an investee; (b) the investor has exposure, or rights, to variable returns from its involvement with the investee; and (c) the investor has the ability to use its power over the investee to a� ect the amount of the investor’s returns. IFRS 10 had no impact on the consolidation of investments held by the Group. This Standard becomes e� ective for annual periods beginning on or after January 1, 2014.
IFRS 11 “Joint arrangements”It replaces IAS 31 “Interests in joint ventures” and SIC-13 “Jointly-controlled entities - non-monetary contributions by venturers”. IFRS 11 removes the option to account for jointly controlled entities (JCEs) using proportionate consolidation. Instead, JCEs that meet the definition of a joint venture must be accounted for using the equity method. This Standard becomes e� ective for annual periods beginning on or after January 1, 2014.
IFRS 12 “Disclosure of interests in other entities”It includes all of the disclosure requirements about consolidated financial statements that were previously covered by IAS 27, as well as all those that were previously included in IAS 31 and IAS 28. These disclosures

Hal
f-yea
r Rep
ort 2
013
• E
xpla
nato
ry N
otes
to th
e Fi
nanc
ial S
tate
men
ts
42
relate to an entity’s interests in subsidiaries, joint ventures, associates and structured entities. A number of new disclosures are also required. The Standard will have no impact on the Group’s financial position or its results for the period. This Standard becomes e� ective for annual periods beginning on or after January 1, 2014.
3 – SEASONAL FACTORS
In the vending sector the seasons have a signi� cant impact on the sales mix: in warmer months the consumption of cold drinks increases, while in colder months the consumption of co� ee is most important. However, the e� ect on economic result in terms of margin between the � rst and the second half of the calendar year is insigni� cant, as the abovementioned seasonal e� ects o� set each other. On the other hand, the volume of the Coin division business increases signi� cantly in the summer months, and therefore the � gures shown for the � rst six months of the year are not representative of the trend for the entire year.
4 – BUSINESS COMBINATIONS
During the � rst six months of 2013, the subsidiary IVS Italia S.p.A. � nalised the following:- on February 6, 2013 the acquisition of 100% of the share capital of Liguria Ca� è Automatico S.r.l., an Italian
company operating in the vending sector;- the acquisition of four business segments of Italian companies (Danmatic, D’Andrea, DAG and Til Ca� ).
All these acquisitions were recorded using the acquisition method of accounting. Consequently, the condensed interim consolidated � nancial statements as of June 30, 2013 include the results of Liguria Ca� è Automatico S.r.l. from the date of acquisition of control.
The fair values of the identi� able assets acquired and liabilities assumed of these companies as at the date of acquisition were the following:
(in thousands of Euro)Liguria Ca� è
Automatico S.r.l.Acquisition of business units
Net � xed assets 278 669Deferred tax assets - - Other non-current assets - - Current assets 27 - Non-current liabilities (50) - Current liabilities (62) - Non-controlling interest - - Goodwill 456 1,755Consideration 649 2,424Analysis of cash � ows of the acquisition:Net cash acquired (included in cash � ows from investing activities) 10 - Contractual price (649) (2,424)Outstanding amount as of June 30, 2013 349 621Net cash � ow for the acquisition (300) (1,803)
From the date of acquisition Liguria Ca� è Automatico S.r.l. has contributed EUR 206 thousand to Group revenues.
The goodwill recognised is attributable to synergies and other economic bene� ts deriving from the aggregation of the commercial operations of Liguria Ca� è Automatico S.r.l. with those of the Group and has been allocated to the “Italy” CGU. This goodwill is not deductible for income tax purposes.

Hal
f-yea
r Rep
ort 2
013
• E
xpla
nato
ry N
otes
to th
e Fi
nanc
ial S
tate
men
ts
43
It should be noted that as of June 30, 2013 the outstanding amount for the acquisition of such investments and business units (and for the acquisitions carried out in previous years) amounted to EUR 14,523 thousand in total, broken down as follows:- Fast Service Italia S.p.A. (EUR 15,413 thousand, of which EUR 7,725 thousand related to the estimate of the
outstanding amount to acquire the remaining stake of 30%);- Liguria Ca� è Automatico S.r.l. (EUR 349 thousand);- EUR 247 thousand used to acquire equity investments in previous years (Italdrink S.r.l. EUR 233 thousand
and ODA S.r.l. EUR 14 thousand); - EUR 904 thousand to acquire Italian business units.
Transaction costs arising from these transactions were charged to the income statement under the heading “Other non-recurring income/expenses” and were included in the cash � ows from operating activities in the statement of cash � ows.
INFORMATION ON ACQUISITIONS CARRIED OUT IN PREVIOUS YEARS In March and April 2012, the Group acquired Fast Service Italia S.r.l. and Selecta Italia S.p.A. (now respectively Fast Service Italia S.p.A. and S.Italia S.p.A.) and the related purchase price allocations were completed on December 31, 2012. Accordingly, following the provisions of IFRS 3, the Company has retrospectively adjusted the reported � gures as of June 30, 2012. Further details are provided in Note 7 of the explanatory notes to the consolidated � nancial statements of IVS Group S.A. as of December 31, 2012.
5 – OPERATING SEGMENTS
For operating purposes, the Group is organised in business units according to the type of supplied products and services and has the following four operating segments:- the Italy segment, which comprises the sale and supply of goods, food and beverages via automatic and
semiautomatic vending machines in Italy;- the France segment, which comprises the sale and supply of goods, food and beverages via automatic and
semiautomatic vending machines in France;- the Spain segment, which comprises the sale and supply of goods, food and beverages via automatic and
semiautomatic vending machines in Spain;- the Coin segment, which comprises the collection and distribution of coins (coin management), counting of
coins for third parties and cash-in-transit services.
The directors examine the results achieved by each business unit separately when making decisions on the allocation of resources and assessment of performance. Assessment of the performance of a segment is based on its net operating income which, as explained in the table below, is measured di� erently from the net operating income in the consolidated � nancial statements. The Group’s � nancial activities (such as costs and revenues on loans) and income taxes are managed at Group level and are not allocated to operating segments.
Transfer prices between operating segments are negotiated internally, using a procedure similar to transactions with independent parties.

Hal
f-yea
r Rep
ort 2
013
• E
xpla
nato
ry N
otes
to th
e Fi
nanc
ial S
tate
men
ts
44
The table below shows segment � gures for revenue, net income and other items at June 30, 2013 and 2012.
June 30, 2013 Italy France Spain CoinAdjustments and
eliminations Consolidated
Revenues from third parties 132,290 12,549 7,651 5,894 - 158,384Inter-segment revenues 3,625 - - 604 (4,229) - Total revenues 135,915 12,549 7,651 6,498 (4,229) 158,384Depreciation charge (17,235) (1,177) (1,060) (297) - (19,770)Share of pro� t or loss of associates 6 7 - - - 13Segment result 8,919 1,248 579 1,127 - 11,873Operating assets 590,859 35,831 21,882 33,343 (5,625) 676,290Operating liabilities 103,972 6,777 2,728 3,253 (5,488) 111,242
June 30, 2012 Italy France Spain CoinAdjustments and
eliminations Consolidated
Revenue from third parties 121,812 12,485 7,781 5,351 - 147,429Inter-segment revenue 4,019 - - 270 (4,289) - Total revenue 125,831 12,485 7,781 5,621 (4,289) 147,429Depreciation charge (16,281) (1,301) (750) (192) 24 (18,500)Share of pro� t or loss of associates 51 0 0 0 - 51Segment result 8,087 608 731 1,298 24 10,748Operating assets 549,697 37,153 17,248 58,179 (6,245) 656,033Operating liabilities 89,508 7,911 2,435 3,264 6,145 109,263
The increase in the assets of the “Italy” segment is due principally to the business combination betweenMr. Vending S.r.l. which took place in the last quarter of 2012.
ADJUSTMENTS AND ELIMINATIONSFinancial income and expenses, gains and losses due to changes in the fair value of � nancial assets, are not allocated to individual segments given that the underlying instruments are managed and administered at Group level.The same applies to income taxes and some other � nancial assets and liabilities, also managed at Group level. These are included in adjustments and eliminations in the segment disclosures.
Reconciliation of pro� t June 30, 2013 June 30, 2012
Segment pro� t 11,873 10,725Adjustments to value of � nancial assets - - Financial income 939 682Financial expenses (6,328) (5,853)Net exchange di� erences and variations in fair value of derivatives (1,632) (642)Result of companies valued at net equity 13 51Other non-recurring expenses for Italy1/IVS’ merger - (26,828)Inter-segment eliminations - 24Group pro� t before tax 4,865 (21,841)
Reconciliation of Assets June 30, 2013 June 30, 2012
Segment operating assets 681,915 662,278Equity investments 5,564 5,573Loans and receivables 2,813 11,772Deferred tax assets 11,807 8,352Tax assets 2,316 231Current � nancial assets 11,319 2,100Inter-segment eliminations (5,625) (6,245)Group Operating Assets 710,109 684,061

Hal
f-yea
r Rep
ort 2
013
• E
xpla
nato
ry N
otes
to th
e Fi
nanc
ial S
tate
men
ts
45
Reconciliation of Liabilities June 30, 2013 June 30, 2012
Segment operating liabilities 116,730 103,118Medium/long term loans payable 34,777 130,957Deferred tax liabilities 19,933 21,593Due to bondholders 199,013 10,980Short-term loans payable 33,260 104,988Derivatives 6,629 13,285Tax liabilities 2,046 2,280Inter-segment eliminations (5,488) 6,145Group Operating Liabilities 406,900 393,346
6 – INTANGIBLE ASSETS
The table below shows changes in historical cost and in accumulated amortisation of intangible assets during the period:
(in thousands of Euro) June 30, 2013 June 30, 2012
Net book value at 1 January 48,337 9,726Additions 645 538Disposals (11) (45)Amortisation charge (2,480) (1,654)Reclassi� cation (360) - Business combinations 356 40,294Net book value at 30 June 46,487 48,859
The � gure related to the previous period re� ected the above mentioned restatement connected to the completion of the purchase price allocation of Fast Service Italia S.p.A. and S.Italia S.p.A..
7 – GOODWILL
The table below shows changes in the value of goodwill during the period:
(in thousands of Euro) June 30, 2013 June 30, 2012
Net book value at 1 January 314,794 295,928Disposals - - Write-downs - - Reclassi� cation (33) - Business combinations 2,306 14,475Net book value at 30 June 317,067 310,403
The � gure “Additions” and “Business Combinations” of EUR 2,306 thousand relates to operations described in Note 4 above.
IMPAIRMENTGoodwill is tested for impairment annually (as of December 31) and when circumstances indicate the carrying value may be impaired. The Group’s impairment test for goodwill is based on value-in-use calculations. The key assumptions used to determine the recoverable amount for each of the cash generating units were disclosed in the annual consolidated � nancial statements for the year ended December 31, 2012.
The Group takes into consideration the relationship between its market capitalisation and its book value, among other factors, when reviewing the impairment indicators. Even though as of June 30, 2013, the market

Hal
f-yea
r Rep
ort 2
013
• E
xpla
nato
ry N
otes
to th
e Fi
nanc
ial S
tate
men
ts
46
capitalisation of the Group was below the book value of its equity, the management did not identify any other indicators of signi� cant impairment since the most recent year-end, and consequently no detailed impairment calculation has been performed.
8 – PROPERTY, PLANT AND EQUIPMENT
The table below shows the changes in historical cost values and in accumulated depreciation during the period:
(in thousands of Euro) June 30, 2013 June 30, 2012
Net book value at 1 January 150,588 138,852Additions 21,549 14,409Disposals (997) (702)Depreciation charge (17,290) (16,802)Reclassi� cation 394 - Business combinations 495 8,982Net book value at 30 June 154,739 144,739
9 – BORROWINGS
Borrowings comprised the following as of June 30, 2013 and as of December 31, 2012:
(in thousands of Euro)
June 30, 2013 December 31, 2012
Non-current Current Total Non-current Current Total
Due to banks for loans 16,137 2,316 18,453 89,192 24,494 113,686Due to banks for current accounts and advances - 11,758 11,758 - 26,957 26,957Due to leasing companies 13,734 1,316 15,050 16,055 4,147 20,202Due to other providers of � nance 4,906 17,870 22,776 8,435 24,307 32,742Fair value of derivative instruments - 6,629 6,629 - 10,245 10,245Bonds 195,161 3,851 199,012 - 8,084 8,084Total Financial Debt 229,938 43,740 273,678 113,682 98,234 211,916
In March 2013 IVS F. S.p.A. issued Senior Secured Notes due 2020 for EUR 200 million: this � nancial liability is shown net of transaction costs (EUR 4,790 thousand) partly deducted from the amount received on April 4, 2013 (EUR 2,5 million related to Joint Lead Bookrunners and Co-Manager’s fees) and partly paid to advisors (EUR 2,290 thousand); the Notes bear interest at a rate of 7.125% per annum and the interest is payable semi-annually in arrears on April 1 and October 1 of each year, beginning on October 1, 2013. The Notes will mature on April 1, 2020. Some � nancial leases and � nancial liabilities loans – presented within the “Non-Current Liabilities” as of December 31, 2012 – have been redeemed in advance in the second quarter of the current year, in accordance with the contractual targets achieved.
The other variations during the period relate to: - the new real estate � nancial lease held by the Spanish company DAV S.A. which commenced in January
2013 (EUR 3,328 thousand);- the early repayment of bank loans taken out by IVS Italia S.p.A. which had an original principal amount of
EUR 200 million and an outstanding amount of EUR 90 million at the redemption date, April 19, 2013;

Hal
f-yea
r Rep
ort 2
013
• E
xpla
nato
ry N
otes
to th
e Fi
nanc
ial S
tate
men
ts
47
- the decrease in the fair value of derivatives instruments by EUR 3,616 thousand compared to December 31, 2012: in particular, the fair value of warrants (EUR 6,629 thousand) decreased by EUR 570 thousand compared to December 31, 2012 (EUR 7,198 thousand); as of June 30, 2013 the decrease by EUR 3,047 thousand of the fair value of the IRS, reduced to zero, is due to the early redemption of such derivatives in connection with the early repayment of the bank loan of IVS Italia S.p.A.;
- the increase by about EUR 1,596 thousand in liabilities to Coin Service customers (totalling EUR 16,846 thousand as of June 30, 2013 and EUR 15,250 thousand as of December 31, 2012), corresponding to coins collected and stored at the company’s coin counting rooms that at the reporting date had not yet been returned to customers.
10 – NET FINANCIAL INDEBTEDNESS
The table below shows the value and composition of the Net Financial Position as of June 30, 2013 and as of December 31, 2012:
(in thousands of Euro) June 30, 2013 December 31, 2012
Current Securities 11,259 4,787Cash and cash equivalents 81,574 28,817Derivatives 60 23 Cash and current � nancial assets 92,893 33,627Short-term loans payable (33,260) (79,906)Liabilities towards bond holders (3,852) (8,083)Derivatives (6,629) (10,245) Current � nancial debt (43,741) (98,234)Medium/long term loans payable (34,777) (113,682)Liabilities towards bond holders (195,161) - Liabilities towards shareholders for loans - - Non-current � nancial debt (229,938) (113,682) Net � nancial indebtedness (*) (180,786) (178,289)Held-to-maturity investments 2,158 6,600Non-current loans and receivables 655 2,887Other non-current assets - from others 203 274 Net � nancial position (177,770) (168,528)
(*) Pursuant to CESR’s recommendation dated 10 February 2005 (“Recommendations for the consistent implementation of the European Commission’s Regulation on Prospectuses”).
11 – FINANCIAL INSTRUMENTS
RISK MANAGEMENT ACTIVITIES The Group is exposed to � nancial risks in the course of its normal business activities: credit risk, liquidity risk, market risks (related mainly to interest rates). These condensed interim consolidated � nancial statements do not include all the information and explanatory notes on the management of � nancial risks required in the preparation of the annual � nancial statements. Further detail is provided in Note 41 of the explanatory notes to the consolidated � nancial statements of IVS Group S.A. as of December 31, 2012.

Hal
f-yea
r Rep
ort 2
013
• E
xpla
nato
ry N
otes
to th
e Fi
nanc
ial S
tate
men
ts
48
FAIR VALUES Carrying amounts and fair values of � nancial instruments as of June 30, 2013 are shown below:
(in thousands of Euro) Carrying amount Fair value
Financial assets:Loans and other � nancial assets 858 858 Debt instruments (Corporate Bond HTM) 2,158 2,265 Total non-current 3,016 3,123 Loans and other � nancial assets 2,259 2,259 Debt instruments (Corporate Bond HTM) 9,000 9,165 Derivatives over Interest rates 60 60 Total current 11,319 11,484 Total 14,335 14,607 Financial liabilities: Senior Secured Notes 195,161 191,996 Interest bearing loans and borrowings 34,777 34,777 Total non-current 229,938 226,773 Interest bearing loans and borrowings 8,508 8,508 Senior Secured Notes 3,852 3,852 Derivatives over own equity instruments (warrant) 6,629 6,629 Total current 18,989 18,989 Total 248,927 245,762
FAIR VALUE HIERARCHY All � nancial instruments for which fair value is recognised or disclosed are categorised within a fair value hierarchy, described as follows, and based on the lowest level input that is signi� cant to the fair value measurement as a whole: • Level 1 – Quoted prices in active markets for identical assets or liabilities, used without adjustment
[whenever available];• Level 2 – Valuation techniques (for which the lowest level input that is signi� cant to the fair value
measurement is directly or indirectly observable);• Level 3 – Valuation techniques (for which the lowest level input that is signi� cant to the fair value
measurement is unobservable).
For � nancial instruments that are recognised at fair value on a recurring basis, the Group determines whether transfers have occurred between levels in the hierarchy by reassessing categorisation (based on the lowest level input that is signi� cant to the fair value measurement as a whole) at the end of each reporting period.
At June 30, 2013, the following � nancial instruments were valued at fair value:
(in thousands of Euro) Level 1 Level 2 Level 3 Total
Derivatives on own equity instruments (warrant) (6,629) - - (6,629)Derivatives on interest rates - 60 - 60
During the six-month period ended June 30, 2013, there were no transfers between Level 1 and Level 2 fair value measurements, and no transfers into or out of Level 3 fair value measurements.
12 – SHAREHOLDERS’ EQUITY
SHARE CAPITALThe share capital underwritten and paid up as of June 30, 2013 (including treasury shares held in portfolio) is comprised of 38,952,491 class “A” shares (of which 2,854,528 treasury shares), 1,250,000 class “B2” shares and 1,250,000 class “B3” shares. These shares, without par value, amount to a total of EUR 386,888 and, with the exception of treasury shares, have normal dividend rights.

Hal
f-yea
r Rep
ort 2
013
• E
xpla
nato
ry N
otes
to th
e Fi
nanc
ial S
tate
men
ts
49
Conversion into market sharesThe following conditions are in force for the conversion into market shares of shares issued to founding shareholders:• Class B2 shares shall be automatically converted into Class A shares at a ratio of one Class A share per Class
B2 share upon con� rmation by the Board of Directors that, before � fth anniversary of the Merger (May 16th
2017), the per market shares volume-weighted average price quoted on the Italian Stock Exchange (VWAP) for any period of 20 trading days out of 30 consecutive trading days (whereby such 20 trading days do not have to be consecutive) equals or exceeds EUR 11.00;
• Class B3 shares shall be automatically converted into class A shares at a ratio of one class A share per class B3 share upon con� rmation by the Board of Directors that the VWAP before � fth anniversary of the Merger (May 16th 2017), for any period of 20 trading days out of 30 consecutive trading days (whereby such 20 trading days do not have to be consecutive) equals or exceeds EUR 12.00.
Dividend rightsClass “A”, “B2” and “B3” shares all enjoy equal dividend rights.
Voting rights The extraordinary operation foreseen by the Company Statute having been completed, Class “A”, “B2” and “B3” shares all enjoy equal voting rights.
Circulation restrictionsClass “B2” and “B3” shares are held in escrow, awaiting the ful� lment of the conditions for their release and conversion into Class “A” shares.
Stock exchange listingClass “B2” and class “B3” shares are not listed on any stock exchange.
TREASURY SHARESDuring the � rst three months of 2013, the main shareholder, IVS Partecipazioni S.p.A., acquired from the Parent company 344,483 of its own shares for a total of EUR 3,221 thousand.Consequently the Parent company holds 2,854,528 class “A” shares. As the unit value of the sales of treasury shares is lower than the original purchase value, the Parent company recorded in equity this di� erence (EUR 196 thousand).
DIVIDENDS PAID AND PROPOSEDThe table below gives details of dividends paid and proposed:
(in thousands of Euro) June 30, 2013 June 30, 2012
Dividends on ordinary shares declared and paid during the six-month period: 4,825 -Final dividend for 2012: 12.5 cents (2011: 0) 4,825 -
13 – COMMITMENTS AND GUARANTEES
Existing guarantees at the reporting date were mostly given for loans granted by third parties to Group companies or for their involvement in tenders.The following should be noted:- the entire share capital of IVS F. S.p.A., IVS Italia S.p.A, S.Italia S.p.A., and Fast Service Italia S.p.A. was pledged
as security against notes of EUR 200 million; at the same time pledges over the entire share capital of
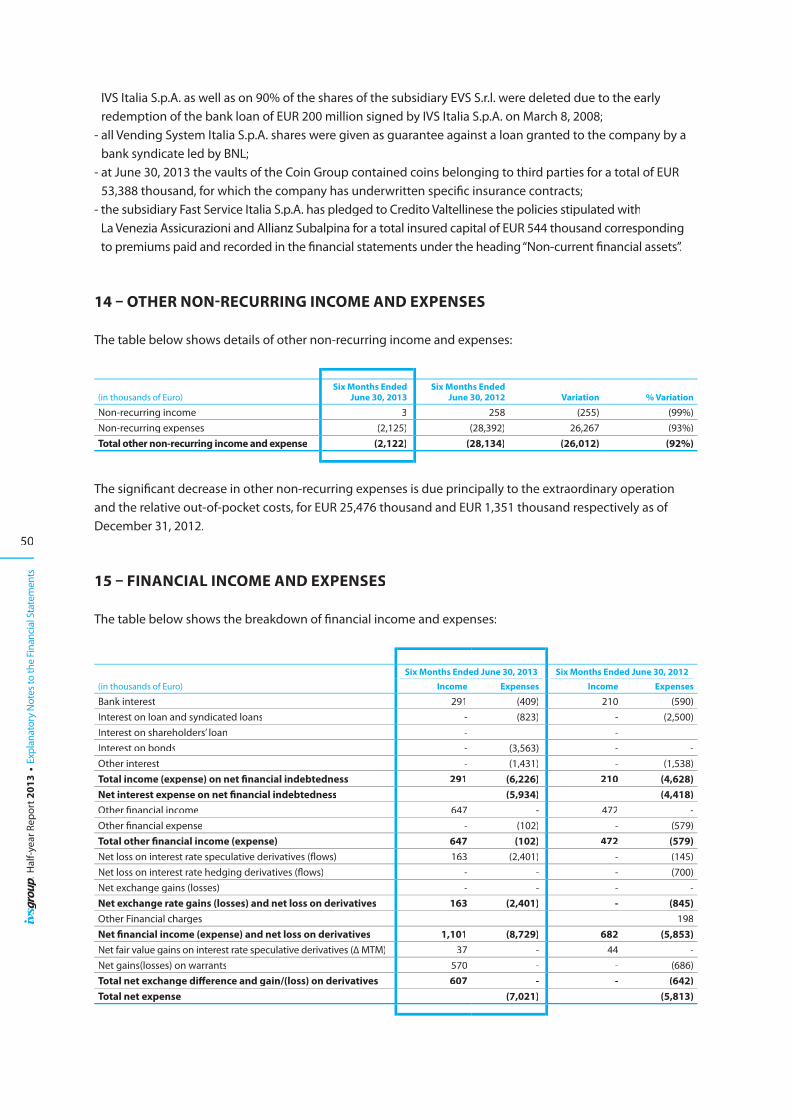
Hal
f-yea
r Rep
ort 2
013
• E
xpla
nato
ry N
otes
to th
e Fi
nanc
ial S
tate
men
ts
50
IVS Italia S.p.A. as well as on 90% of the shares of the subsidiary EVS S.r.l. were deleted due to the early redemption of the bank loan of EUR 200 million signed by IVS Italia S.p.A. on March 8, 2008;
- all Vending System Italia S.p.A. shares were given as guarantee against a loan granted to the company by a bank syndicate led by BNL;
- at June 30, 2013 the vaults of the Coin Group contained coins belonging to third parties for a total of EUR 53,388 thousand, for which the company has underwritten speci� c insurance contracts;
- the subsidiary Fast Service Italia S.p.A. has pledged to Credito Valtellinese the policies stipulated withLa Venezia Assicurazioni and Allianz Subalpina for a total insured capital of EUR 544 thousand corresponding to premiums paid and recorded in the � nancial statements under the heading “Non-current � nancial assets”.
14 – OTHER NON-RECURRING INCOME AND EXPENSES
The table below shows details of other non-recurring income and expenses:
(in thousands of Euro)Six Months Ended
June 30, 2013Six Months Ended
June 30, 2012 Variation % Variation
Non-recurring income 3 258 (255) (99%)Non-recurring expenses (2,125) (28,392) 26,267 (93%)Total other non-recurring income and expense (2,122) (28,134) (26,012) (92%)
The signi� cant decrease in other non-recurring expenses is due principally to the extraordinary operation and the relative out-of-pocket costs, for EUR 25,476 thousand and EUR 1,351 thousand respectively as of December 31, 2012.
15 – FINANCIAL INCOME AND EXPENSES
The table below shows the breakdown of � nancial income and expenses:
(in thousands of Euro)
Six Months Ended June 30, 2013 Six Months Ended June 30, 2012
Income Expenses Income Expenses
Bank interest 291 (409) 210 (590)Interest on loan and syndicated loans - (823) - (2,500)Interest on shareholders’ loan - - - -Interest on bonds - (3,563) - -Other interest - (1,431) - (1,538)Total income (expense) on net � nancial indebtedness 291 (6,226) 210 (4,628)Net interest expense on net � nancial indebtedness (5,934) (4,418)Other � nancial income 647 - 472 - Other � nancial expense - (102) - (579)Total other � nancial income (expense) 647 (102) 472 (579)Net loss on interest rate speculative derivatives (� ows) 163 (2,401) - (145)Net loss on interest rate hedging derivatives (� ows) - - - (700) Net exchange gains (losses) - - - - Net exchange rate gains (losses) and net loss on derivatives 163 (2,401) - (845)Other Financial charges - - - 198Net � nancial income (expense) and net loss on derivatives 1,101 (8,729) 682 (5,853)Net fair value gains on interest rate speculative derivatives (∆ MTM) 37 - 44 - Net gains(losses) on warrants 570 - - (686)Total net exchange di� erence and gain/(loss) on derivatives 607 - - (642)Total net expense (7,021) (5,813)

Hal
f-yea
r Rep
ort 2
013
• E
xpla
nato
ry N
otes
to th
e Fi
nanc
ial S
tate
men
ts
51
The variations in net � nancial income and expenses are due substantially to:- accrued interest on the new bond of EUR 200 million with annual � xed rate of 7.125% (EUR 3,563 thousand);- the increase of � nancial expenses due to the write-o� of the cash � ow hedge reserve in compliance with
the redemption of hedging IRS; - the change in the fair value of warrants (EUR 1,256 thousand);- the decrease in � nancial expenses due to early redemption of the loan from Intesasanpaolo S.p.A. (on April
19, 2013).
16 – INCOME TAX FOR THE PERIOD
This is comprised as follows:
(in thousands of Euro)Six Months Ended
June 30, 2013Six Months Ended
June 30, 2012 Variation % Variation
Current taxation (2,309) (2,897) 588 (20%)Deferred tax liability 920 35 885 n.s.Deferred tax assets 1,471 3,064 (1,593) (52%)Total 82 202 (120) (59%)
It should be noted that IVS Group S.A. has its registered o� ces in Luxembourg, while its administrative and main operations are located in Italy. Consequently, for 2013, as well as for the previous years, in accordance with the prevailing OECD doctrine, the directors believe that the Company is resident for � scal purposes in Italy, and taxes were calculated accordingly.The deferred tax assets refer principally to the tax losses matured by Italy1 Investment S.A. and IVS Group S.A. during respectively prior years and the � rst half of 2013 up until the merger date.The directors believe that these losses shall be recoverable in future years given that:a) the losses were e� ectively realised;b) the favourable reply to the request to obtain the exemption from the application of article 172 of DPR
917/86, paragraph 7, received during on August 2013;c) the abovementioned losses may be carried forward for an inde� nite period of time;d) su� cient income will be generated in future years.
17 – EARNINGS PER SHARE
BASE EARNINGS PER SHAREBase earnings per share at June 30, 2013 were calculated on a net income attributable to the Group of EUR 4,295 thousand (EUR -22,249 thousand at June 30, 2012) and on an average number of outstanding shares during the period of 38,554,189 (19,781,308 at June 30, 2012), calculated as follows:
June 30, 2013 June 30, 2012Number of shares in existence as of January 1 (net of treasury shares) 38,253,479 7,320,703Number of shares issued with the share capital increase of March 21, 2012 - 14,666,891Number of shares issued with the share capital increase of 4 April 2012 - 492,988Number of shares issued with the share capital increase of March 30, 2012 - 221,673Number of Italy1 Investment S.A. shares in circulation at 16 May 2012 (net of treasury shares) - 15,550,989Number of treasury shares sold during � rst three months of 2013 344,483 -Weighted average shares in circulation 38,554,189 19,781,308

Hal
f-yea
r Rep
ort 2
013
• E
xpla
nato
ry N
otes
to th
e Fi
nanc
ial S
tate
men
ts
52
BASE EARNINGS PER SHARE AT JUNE 30, 2012Earnings per share for 2012 were calculated using the rules applicable to reverse acquisitions. For the purposes of calculating the weighted average number of outstanding ordinary shares (the denominator of the earnings per share calculation) during the period in which the reverse acquisition takes place: a) the number of outstanding ordinary shares from the beginning of the year to the date of acquisition is
calculated on the basis of the weighted average number of outstanding ordinary shares of the legally acquired company (acquiring company for accounting purposes – IVS Group) during the period, multiplied by the exchange ratio established in the merger agreement; and
b) the number of outstanding ordinary shares from the acquisition date to the period end must correspond to the actual number of outstanding ordinary shares of the legally acquiring company (acquired company for accounting purposes – Italy1 Investment S.A.), during the period.
As regards the comparative period prior to the acquisition date (May 16, 2012) shown in the consolidated � nancial statements, basic earnings per share were calculated by dividing: a) the net gain (loss) for the period of the legally acquired company attributable to ordinary shareholders in
each of these periods, by b) the historical weighted average number of outstanding ordinary shares of the legally acquired company
multiplied by the exchange ratio established in the acquisition agreement.
DILUTED EARNINGS PER SHAREAt June 30, 2013 the e� ect of the potential exercise of the warrants into shares has no dilutive e� ect and therefore diluted earnings per share correspond to base earnings per share.
18 – RELATED PARTY TRANSACTIONS
The following tables provide information about transactions with related parties and their impact on the Group’s � nancial position and results of operations:
Related PartiesOperating
revenuesSale of
� xed assetsOperating
costs InterestPurchase of � xed assets
Argan capital advisors Srl 18Astro Srl (14)BML Immobiliare Srl (55)Cami Spa (928)Chef Express Spa 436 (218) 2Ciesse Ca� è Srl 1 8Cofradis Sud SASCP & Partners 1D.A. Design Group Srl (11)Dama Srl (6)Domal Company Srl (33)ESP S.A. (Espresso Service Proximité) 46 (191)Espresso Italia Srl 3 (8) (171)Freddi Rossana (2)Gimoka Srl 927 122 (1,495) (5)Immobiliare Vending Srl 4 (1,487) 10IVS Partecipazioni Spa 4 (78)Lavazza Spa (6,983) (2,199)Locomotiva Srl 0MC-AG Sas di Cesaracciu Maurizio 1 22 (100)Quattro 1Roberto Pompei (2)Sogeda Srl 256 86 1Studio FT (195)Universo Vending Srl (1,556) (2) (14)Vendomat Spa (5)Aura Holding 67mAn.ch S.A. (64)Time Vending Srl 33 (455) (3)Director’s emoluments (160)Total related parties 1,713 238 (14,018) 60 (2,384)Total per Financial Statement 158,384 124,619 5,390 Incidence 1% 11% (1%)

Hal
f-yea
r Rep
ort 2
013
• E
xpla
nato
ry N
otes
to th
e Fi
nanc
ial S
tate
men
ts
53
Related PartiesTrade
ReceivablesTrade
PayablesFinancialPayables
Argan capital advisors Srl 14Astro Srl 64Cami Spa 2 423Chef Express Spa 213 310Ciesse Ca� è Srl 42CP & Partners 1Crimo Srl 1D.A. Design Group Srl 68Dama Srl 3,088 96Domal CO.SRL 6,165 192Espresso Italia Srl 189EVA Spa 1,161F2i 48Freddi Rossana 116Gimoka Srl 291 1,726Immobiliare Vending Srl 285IVS Partecipazioni Spa 132 (35) 1,658L.B. Immobiliare Spa 9Lavazza Spa 157 8,558Locomotiva Srl 6,165 192MC-AG Sas di Cesaracciu Maurizio 410 3Roberto Pompei 116Sogeda Srl 458 161Universo Vending Srl 403Vendomat Spa 2,405mAn.ch S.A. 130Director’s Emoluments 160Total related parties 1,707 27,934 5,936Total per Financial Statement 18,616 65,663 267,050Incidence 9% 43% 2%
19 – SUBSEQUENT EVENTS
There were no signi� cant subsequent events during the period from July 1, 2013 until the date these condensed interim consolidated � nancial statements were authorised for issue.
20 – CONSOLIDATION
The condensed interim consolidated � nancial statements comprise the � nancial statements of the parent company IVS Group S..A. and those of the companies over which it exercises control, directly and indirectly (through its subsidiary and associated companies), governs their � nancial and operating policies so as to obtain bene� ts from their activities.
The � nancial statements of the parent company (IVS Group S.A.) and of its subsidiaries are prepared as of June 30, 2013.

Hal
f-yea
r Rep
ort 2
013
• E
xpla
nato
ry N
otes
to th
e Fi
nanc
ial S
tate
men
ts
54
The table below lists the companies in which the Parent directly or indirectly holds an investment, indicating the consolidation method adopted.
Name ParentInvestment
% direct%
Reference Treatment
IVS Italia S.p.A. IVS Group S.A. 100.0% 100.0% ConsolidatedVending System S.p.A. IVS Group S.A. 100.0% 100.0% ConsolidatedS.Italia S.p.A. IVS Group S.A. 100.0% 100.0% ConsolidatedFast Service Italia S.p.A. IVS Group S.A. 70.0% 100.0% ConsolidatedEurovending S.r.l. IVS ITALIA S.p.A. 70.0% 70.0% ConsolidatedDDS S.p.A. IVS ITALIA S.p.A. 71.0% 71.0% ConsolidatedEmmedi S.A. IVS ITALIA S.p.A. 70.0% 70.0% ConsolidatedEmmedi S.A. IVS Group S.A. 30.0% 30.0% ConsolidatedDav S.A. IVS ITALIA S.p.A. 78.0% 78.0% ConsolidatedDav S.A. IVS Group S.A. 22.0% 22.0% ConsolidatedEur Co� ee S.r.l. IVS ITALIA S.p.A. 80.0% 80.0% ConsolidatedE.V.S. S.r.l. IVS ITALIA S.p.A. 90.0% 90.0% ConsolidatedMr. Vending S.r.l. IVS ITALIA S.p.A. 100.0% 100.0% Consolidated20.10 Vending S.r.l. IVS ITALIA S.p.A. 100.0% 100.0% ConsolidatedLiguria Ca� è Automatico S.r.l, IVS ITALIA S.p.A. 100.0% 100.0% ConsolidatedIVS F. S.p.A. IVS Group S.A. 100.0% 100.0% ConsolidatedIVS France SAS IVS ITALIA S.p.A. 87.0% 87.0% ConsolidatedIVS France SAS IVS Group S.A. 13.0% 13.0% ConsolidatedCiesse Ca� è S.r.l. IVS ITALIA S.p.A. 26.3% 26.3% Equity-accountedRistora System S.r.l. IVS ITALIA S.p.A. 30.0% 30.0% Equity-accountedUniverso Vending S.r.l. IVS ITALIA S.p.A. 25.0% 25.0% Equity-accountedCaybe 2 Sl Dav Sa 72.5% 56.6% Not consolidatedMaquinas Automaticas Blasco SA Emmedi Sa 100.0% 70.0% Not consolidatedCofradis Sud Sarl IVS France SAS 50.0% 50.0% Not consolidatedSci +39 IVS France Sas 99.0% 99.0% ConsolidatedSci +39 IVS ITALIA S.p.A. 1.0% 1.0% ConsolidatedTime Vending S.r.l. IVS ITALIA S.p.A. 50.0% 50.0% Proportionally consolidatedEspresso Service Proximitè IVS France SAS 22.0% 22.8% Equity-accountedEspresso Service Proximitè IVS Group S.A. 14.8% 14.8% Equity-accountedMetroshopping S.r.l. IVS ITALIA S.p.A. 100.0% 85.0% ConsolidatedCSH S.r.l. IVS Group S.A. 75.0% 75.0% ConsolidatedCoin Partecipazioni S.p.A. CSH S.r.l. 60.0% 45.0% ConsolidatedCoin Service Empoli S.p.A. Coin Partecipazioni S.p.A. 62.0% 27.9% ConsolidatedCoin Service Nord S.p.A. Coin Partecipazioni S.p.A. 33.0% 14.9% ConsolidatedCoin Service Nord S.p.A. Coin Service Empoli S.p.A. 48.0% 13.4% Consolidated
The companies excluded from the scope of consolidation are non-operative and the total carrying value of the equity investments therein was EUR 53 thousand.
Luxembourg, 28 August 2013 On behalf of the Board of Directors, Cesare Cerea Chairman


www.mercuriogp.eu
Concept, Graphic design and Paging:

+5ACQUISITIONS
VENDS (million)
325.6334.1SALES / BUSINESS DAY
(€ ‘000’ s)
H1 2012
H1 2012
H1 2012
H1 2013
H1 2013
H1 2013
1,11
7
1,19
4
AVERAGE PRICE (€ cents/vend)
COIN DIVISIONREVENUES
42.1
43.4
+15.6%59BRANCHESItaly / France / Spain

www.ivsgroup.it
Half-yearReport2013