half-year financial report at 30 june 2020
TRANSCRIPT

HALF-YEAR FINANCIAL REPORTAT 30 JUNE 2020

2
RAPPORT D’ACTIVITÉ 2017HALF-YEAR FINANCIAL REPORT JUNE 2020
Table of contents
HALF-YEARFINANCIAL REPORT AT 30 JUNE 2020

3
RAPPORT D’ACTIVITÉ 2017HALF-YEAR FINANCIAL REPORT JUNE 2020
Statement by the person responsible for the financial report ...............................4
Management report on the consolidated financial statements of ONEY Bank .5
A. The economic climate ....................................................................................6
B. Key events and activity during the period .................................................8
C. Outlook for 2020 ............................................................................................8
D. Main risks facing ONEY Bank .......................................................................8
E. Equity management ....................................................................................XX
Consolidated financial statements ........................................................................... 11
A. Consolidated balance sheet (assets) ........................................................ 12
B. Consolidated balance sheet (liabilities) ................................................... 13
C. Consolidated income statement ............................................................... 14
D. Consolidated statement of comprehensive income ............................. 15
E. Cash flow statement .................................................................................... 16
F. Table of changes in shareholders’ equity ................................................ 17
Note to the consolidated financial statements ..................................................... 19
Statutory Auditors’ report on the consolidated financial statements ............... 57
TABLE OF CONTENTS

4
RAPPORT D’ACTIVITÉ 2017HALF-YEAR FINANCIAL REPORT JUNE 2020
STATEMENT BY THE PERSON RESPONSIBLE FOR THE
HALF-YEAR FINANCIAL REPORTFOR THE PERIOD ENDING 30 JUNE 2020PURSUANT TO ARTICLE 3(2)(C) OF THE
FRENCH TRANSPARENCY ACT (LOI TRANSPARENCE)
NOM DU RESPONSABLE
Jean-Pierre Viboud, Chief Executive Officer of Oney Bank.
ATTESTATION DU RESPONSABLE
«I hereby declare that, to the best of my knowledge, the consolidated half-year financial statements at 30 June 2020 have been prepared in accordance with applicable accounting standards, give a true and fair view of the assets and liabilities, financial position and profits or losses of the Company and of all companies included in its scope of consolidation, and that this management report accurately presents the Company’s business development and results, its situation/position and that of all the companies included in the consolidation scope, as well as a description of the main risks and uncertainties they face.»
Croix, 20 July 2020
Jean-Pierre VIBOUDCEOOney Bank
ONEY BANKPublic limited company (Société Anonyme)
with a Board of DirectorsWith a share capital of 51,286,585 euros
40 Avenue de Flandre 59170 CROIXLille Métropole trade and companies register B 546 380 197

Managementreport
ON THE HALF-YEAR CONSOLIDATED FINANCIAL STATEMENTSAT 30 JUNE 2020
6
RAPPORT D’ACTIVITÉ 2017HALF-YEAR FINANCIAL REPORT JUNE 2020
A. KEY EVENTS AND ACTIVITY DURING THE PERIOD
COVID-19 CRISIS :
In the context of the COVID-19 crisis, Oney has committed to helping customers who are experiencing cash flow difficulties by implementing measures to support the economy in each of its countries, as decided by local governments and professional organisations.
Oney has been working to support those customers who may be struggling financially as a result of the developing COVID-19 pandemic. In concrete terms, this translates into deferred loan repayments for individuals, with €66 million of outstanding receivables deferred by Oney on a blanket or individual basis at 30 June 2020.
REFINANCING :
• S&P rating: Following the BPCE Group’s equity investment in Oney Bank, Standard & Poor’s confirmed the Oney Group’s long-term rating as BBB in October 2019 and raised its outlook to positive. The short-term rating was also confirmed at A-2. Oney Bank is considered by S&P to be “strategically important” to the BPCE Group.
• Liquidity management: Following the BPCE Group’s equity investment in Oney Bank, any new financing is now provided by the BPCE Group. Oney’s traditional financing sources have become legacy assets. Oney Bank has a liquidity budget with the BPCE Group that allows it to cover all of its needs (calculated during the fiscal year). This budget may be increased, if necessary, to cover any additional Oney needs.
• Refinancing structure: As at 30 June 2020, BPCE represented 90% of the total refinancing of Oney Bank. Oney’s traditional financing sources complete the refinancing structure are now legacy assets (amounts owing represented by securities, savings by individuals). On 24 June 2020, Oney paid back its TLTRO II of €355 million refinanced by €549.4 million in TLTRO IIIs taken out by BPCE and transferred to Oney in the form of intra-group loans under the TLTRO III interest rates.
MAIN EVENTS AND ACTIVITY
Oney continues to stay the course and has seen its strategy bolstered by the new consumption patterns that have resulted from the COVID crisis.
The last few months have been marked by a global health crisis and period of lockdown that have led to an increase in the use of online shopping and digital payment solutions. This exceptional situation has confirmed the relevance of Oney’s current strategy of responding to changes in consumption patterns: the digitisation of services and e-commerce support for its retail partners and customers.
There’s no doubt that Oney’s products have been particularly popular in recent months, and especially during the lockdown period, both for the “3x 4x Oney” solution and its long-term online loans of up to 60 months. Solutions like these allow consumers to enjoy greater flexibility when managing their spending, and more freedom for pursuing their projects and ideas. This has proven very useful during lockdown, in particular for the purchase of high-tech products, interiors and even DIY. This trend is still being observed, even after the easing of lockdown measures.
In the first half of 2020, Oney has therefore stayed the course and continued to pursue its objective of becoming the European leader in split payment solutions, as well as extending its “3x 4x Oney” omni-channel solution to even more partners:
• In Italy, Oney has continued to develop the “3x 4x” solution, with four new partnerships in the past six months, from four different industries: WRS for car accessories, Musical Store for music and culture, San Marco for outdoor furniture and Conte for home insurance.
• In Spain, Oney has entered into partnerships with Sprinter, Kimoa, Xiaomi, Kave Home,
7
RAPPORT D’ACTIVITÉ 2017HALF-YEAR FINANCIAL REPORT JUNE 2020
Rodi Motor (150 physical sales outlets), Merida Bike and Honda (echo-es.es, hondaencasa.
com, hondamarine.com). Another partnership with BackMarket - an expert in refurbished
electronic equipment - has allowed Oney to take a firmer stance on the issue of sustainable
consumption by making it easier to buy products second-hand. Oney Spain therefore stands
out with a significant increase in production, despite the closure of physical stores during
the lockdown period.
• In Portugal, Oney has forged new partnerships with major brands in various business sectors,
such as La Redoute, Hey Phones, Egitana, Lanidor and 4paper. Like in France and Spain, in
Portugal Oney signed a partnership with the Payment Services Provider (PSP) Adyen.
• Finally, in France, the use of the «3x 4x» solution has intensified, both online during the
lockdown and when stores reopened too, especially for the purchase of high-tech products,
household equipment, healthcare and sports. Over the period, Oney’s market share increased
by 12%. Since January, Oney has welcomed more than 50 new retailers and e-retailers such
as So Brico, Mon Lit Cabane, La Chaise Longue, Barbecue&co., Bexley, Agnès B and more,
expanding its partnership network in the payment sector with more than 20 new partners:
service and payment providers (Adyen, Dalenys, PayPlug, Limonetik, etc.) or e-commerce
modules (PrestaShop, Magento, Shopify, etc.). This expertise has made it possible to support
its partners in the implementation of their new purchasing process (drive, click and collect,
etc.) during the lockdown period.
What’s more, the online long-term loan offering is attracting more and more partners, a
good example being the Optic 2000 Group (Optic 2000, Lissac, Audio 2000), which has been
gradually rolling out both the split payment and online long-term financing solutions since June.
GROUP RESULTS AND KEY FIGURES:
The key figures for ONEY BANK at 30 June 2020 are as follows:
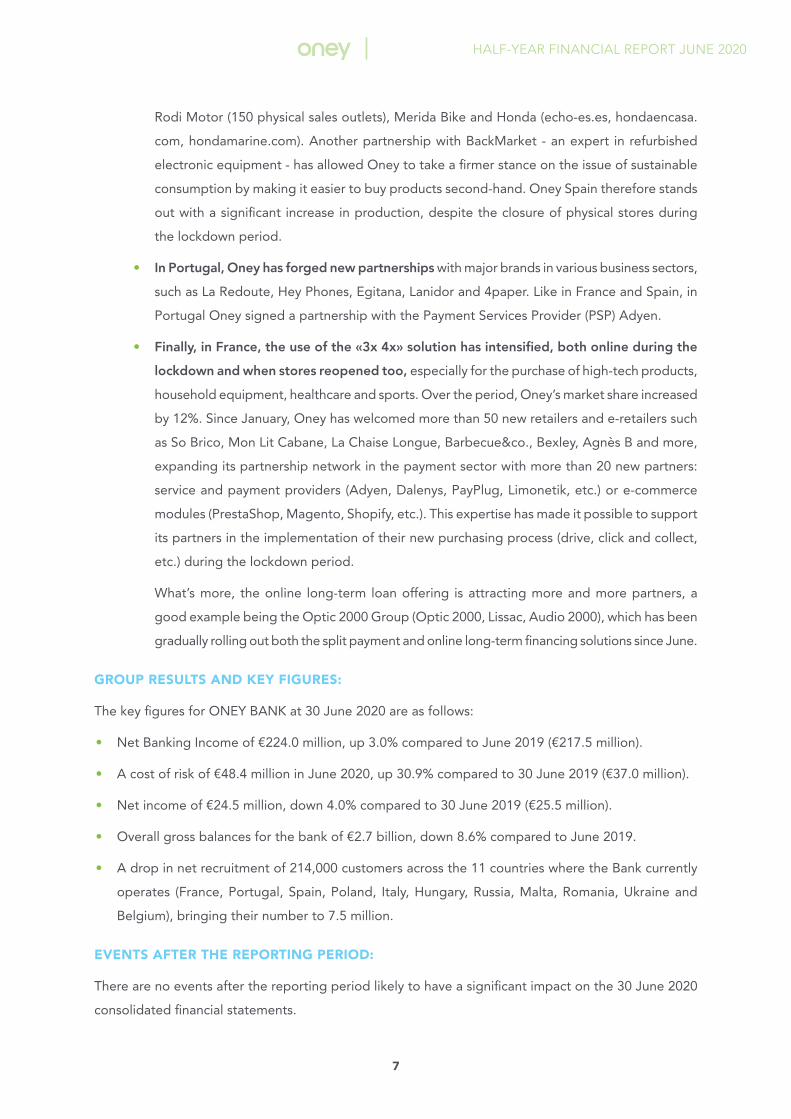
• Net Banking Income of €224.0 million, up 3.0% compared to June 2019 (€217.5 million).
• A cost of risk of €48.4 million in June 2020, up 30.9% compared to 30 June 2019 (€37.0 million).
• Net income of €24.5 million, down 4.0% compared to 30 June 2019 (€25.5 million).
• Overall gross balances for the bank of €2.7 billion, down 8.6% compared to June 2019.
• A drop in net recruitment of 214,000 customers across the 11 countries where the Bank currently
operates (France, Portugal, Spain, Poland, Italy, Hungary, Russia, Malta, Romania, Ukraine and
Belgium), bringing their number to 7.5 million.
EVENTS AFTER THE REPORTING PERIOD:
There are no events after the reporting period likely to have a significant impact on the 30 June 2020
consolidated financial statements.

8
RAPPORT D’ACTIVITÉ 2017HALF-YEAR FINANCIAL REPORT JUNE 2020
B. OUTLOOK FOR THE 2ND HALF OF 2020 The second half of 2020 will continue to be marked by the deployment of new customer journeys and the continued development of instalment payment solutions in both France and Europe; the latter should become the main growth driver for the business. In addition, in Central European countries, Oney is planning to increase its autonomy and focus on developments that create value, like that achieved in Poland with Smartney.
To support these initiatives, and to provide the bank with the building blocks required for the successful creation of a local digital bank, an ambitious project plan will be implemented.
And finally, the synergies resulting from the BPCE partnership will be amplified.
C. MAIN RISKS FACING ONEY BANK
LIQUIDITY RISK EXPOSURE:
In order to limit its liquidity risk, Oney Bank relies on the financing of its majority shareholder, the BPCE Group, which provides Oney with all the liquidity its needs to fund its activity.
Oney Bank has also built up a reserve of high-quality liquid assets (HQLA) allowing it to cope with 30-day net cash outflows in a stressed scenario. Since 1st January 2018, in accordance with the regulations in force, Oney Bank has complied with the minimum coverage of 100% of net cash outflows for a 30-day period.
INTEREST RATE RISK EXPOSURE:
Oney Bank SA’s financial policy aims to protect its (current and future) equity and income against unfavourable changes in interest rates. Exposure to interest rate risk is measured both in terms of net interest margin and economic value.
CREDIT RISK EXPOSURE:
Oney has efficient provision and risk management processes that allow credit risk to be controlled over a long period. Nevertheless, credit risk has been under rising pressure since 2019. The COVID-19 crisis has affected our production and created pressure in terms of risk, particularly in Portugal, Spain and to a lesser extent in Russia and Poland.
D. EQUITY MANAGEMENTIn accordance with the prudential regulations that transpose the European directives on the «capital adequacy of investment firms and credit institutions» into French law, Oney Bank is required to comply with the solvency ratio and ratios on liquidity, the division of risk and balance sheet stability.
Oney Bank’s equity is managed in such a way as to meet the prudential capital standards required by European regulations in order to hedge against risks weighted in terms of credit risk, operational risk and market risk. To ensure compliance with its solvency ratio, Oney Bank carries out a comprehensive projection of its equity once a year at the time of establishing the plan, and monitors it more regularly at each quarterly closing date.
Since 2014, the level of equity has been based on Basel III regulations.
The decree of 26 June 2013 transposes the European Capital Requirements Directive (CRD - 575/2013 and 2013/36/EU) into French regulations. The document defines the «capital requirements applicable to credit institutions and investment firms» and the methods for calculating the solvency ratio from 1st
9
RAPPORT D’ACTIVITÉ 2017HALF-YEAR FINANCIAL REPORT JUNE 2020
January 2014 onwards.
In accordance with these provisions, since 2014 Oney Bank has incorporated the impacts of switching to the new European CRD Directive into its equity and rusk management approaches.
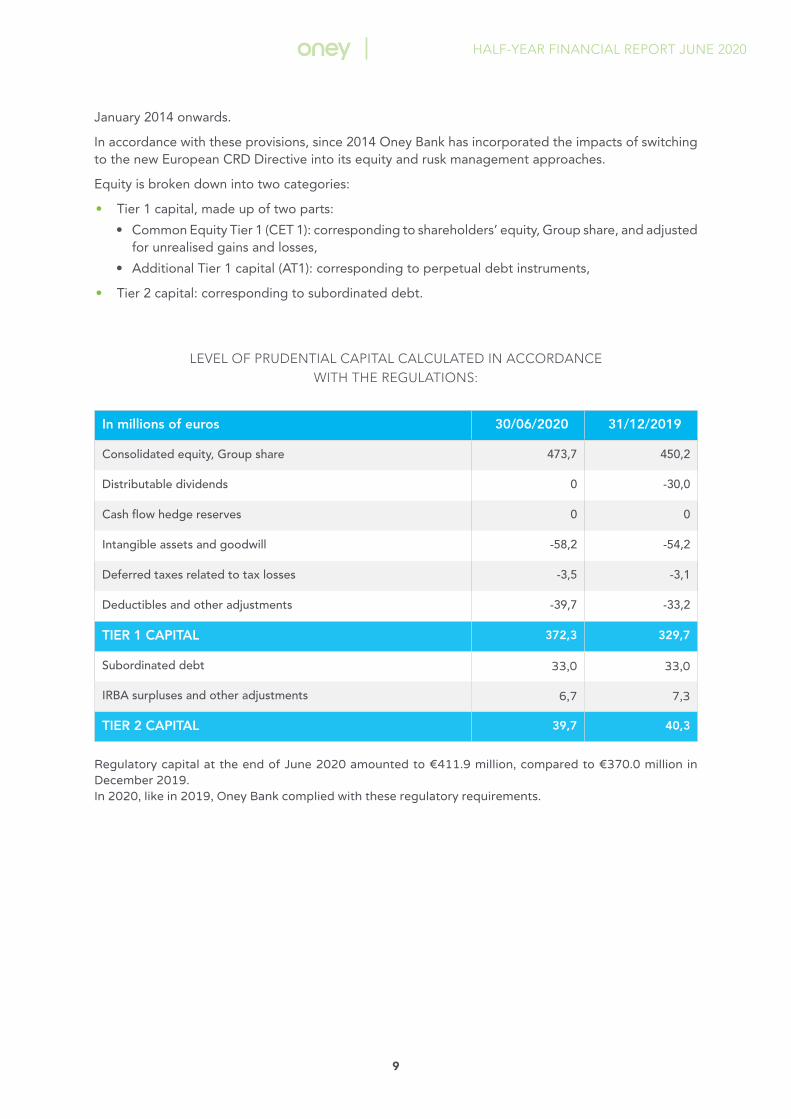
Equity is broken down into two categories:
• Tier 1 capital, made up of two parts:
• Common Equity Tier 1 (CET 1): corresponding to shareholders’ equity, Group share, and adjusted for unrealised gains and losses,
• Additional Tier 1 capital (AT1): corresponding to perpetual debt instruments,
• Tier 2 capital: corresponding to subordinated debt.
In millions of euros 30/06/2020 31/12/2019
Consolidated equity, Group share 473,7 450,2
Distributable dividends 0 -30,0
Cash flow hedge reserves 0 0
Intangible assets and goodwill -58,2 -54,2
Deferred taxes related to tax losses -3,5 -3,1
Deductibles and other adjustments -39,7 -33,2
TIER 1 CAPITAL 372,3 329,7
Subordinated debt 33,0 33,0
IRBA surpluses and other adjustments 6,7 7,3
TIER 2 CAPITAL 39,7 40,3
LEVEL OF PRUDENTIAL CAPITAL CALCULATED IN ACCORDANCEWITH THE REGULATIONS:
Regulatory capital at the end of June 2020 amounted to €411.9 million, compared to €370.0 million in December 2019.In 2020, like in 2019, Oney Bank complied with these regulatory requirements.

10
RAPPORT D’ACTIVITÉ 2017HALF-YEAR FINANCIAL REPORT JUNE 2020
CONSOLIDATED RATIOS
The solvency ratio stands at 13.8% in 2020 does not take into account the projection of dividends.
BASEL 3JUNE 2020
BASEL 3DECEMBER
2019
BASEL 3DECEMBER
2018
BASEL 3DECEMBER
2017
Ratio / Tier 1 12,4% 10,5% 15,9% 17,0%
Ratio / Tier 2 1,3% 1,3% 0,2% 0,0%
Basel solvency ratio 13,8% 11,8% 16,1% 17,0%
LCR 135,6% 143,0% 143,0% 100,5%
The Board of Directors

StatementsCONSOLIDATED FINANCIAL STATEMENTSAT 30 JUNE 2020
12
RAPPORT D’ACTIVITÉ 2017HALF-YEAR FINANCIAL REPORT JUNE 2020
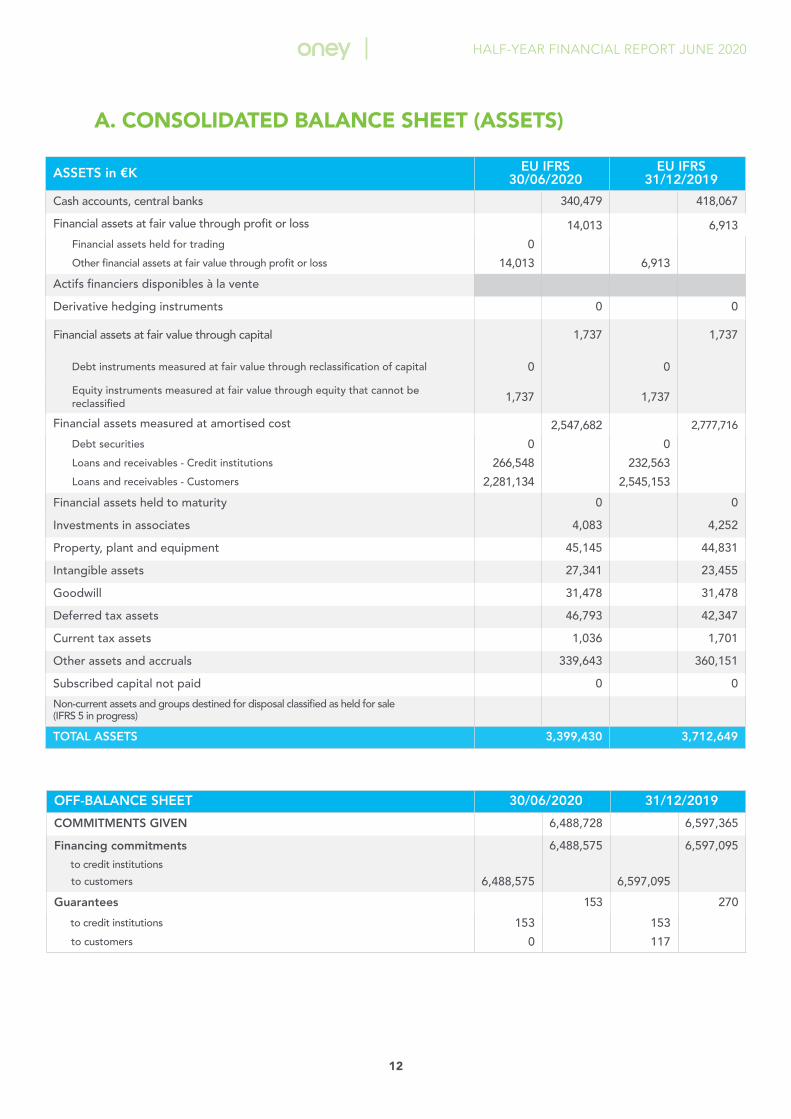
A. CONSOLIDATED BALANCE SHEET (ASSETS)
ASSETS in €K EU IFRS30/06/2020
EU IFRS31/12/2019
Cash accounts, central banks 340,479 418,067
Financial assets at fair value through profit or loss 14,013 6,913
Financial assets held for trading 0
Other financial assets at fair value through profit or loss 14,013 6,913
Actifs financiers disponibles à la vente
Derivative hedging instruments 0 0
Financial assets at fair value through capital 1,737 1,737
Debt instruments measured at fair value through reclassification of capital 0 0
Equity instruments measured at fair value through equity that cannot be reclassified 1,737 1,737
Financial assets measured at amortised cost 2,547,682 2,777,716
Debt securities 0 0
Loans and receivables - Credit institutions 266,548 232,563
Loans and receivables - Customers 2,281,134 2,545,153
Financial assets held to maturity 0 0
Investments in associates 4,083 4,252
Property, plant and equipment 45,145 44,831
Intangible assets 27,341 23,455
Goodwill 31,478 31,478
Deferred tax assets 46,793 42,347
Current tax assets 1,036 1,701
Other assets and accruals 339,643 360,151
Subscribed capital not paid 0 0
Non-current assets and groups destined for disposal classified as held for sale(IFRS 5 in progress)
TOTAL ASSETS 3,399,430 3,712,649
OFF-BALANCE SHEET 30/06/2020 31/12/2019
COMMITMENTS GIVEN 6,488,728 6,597,365
Financing commitments 6,488,575 6,597,095
to credit institutions
to customers 6,488,575 6,597,095
Guarantees 153 270
to credit institutions 153 153
to customers 0 117

13
RAPPORT D’ACTIVITÉ 2017HALF-YEAR FINANCIAL REPORT JUNE 2020
B. CONSOLIDATED BALANCE SHEET (LIABILITIES)
LIABILITIES in €K IFRS-EU30/06/2020
IFRS-EU31/12/2019
Central banks 0 0
Financial liabilities at fair value through profit or loss 0 0
Hedging derivatives 0 0
Financial liabilities measured at amortised cost 2,649,119 2,964,928
Amounts owing to credit institutions 2,378,820 2,329,667
Customer debts and deposits 17,612 67,094
Debt securities 211,084 528,006
Subordinated debt 33,014 33,016
Leasing debts - IFRS 16 8,589 7,145
Provisions 10,587 10,396
Technical reserves of insurance contracts 64,825 59,895
Technical reserves 64,825 59,895
Amounts owing to reinsurers 0 0
Current tax liabilities 16,287 10,965
Deferred tax liabilities 59 94
Accruals and other liabilities 184,153 214,701
Total Liabilities 2,925,030 3,260,979
SHAREHOLDERS EQUITY
Shareholders equity, Group share 473,723 450,170
Subscribed capital and issue premiums 112,145 112,145
Subscribed capital 51,287 51,287
Issue premium 60,859 60,859
Other equity
Revaluation reserves 0 0
Reserves 336,509 293,979
Profit (loss) for the period 25,069 44,047
Minority interests 678 1,500
Total equity 474,401 451,670
TOTAL LIABILITIES, SHAREHOLDERS EQUITY 3,399,430 3,712,649
OFF-BALANCE SHEET 30/06/2020 31/12/2019
COMMITMENTS RECEIVED 6,467 71,514
Financing commitments 2,859 65,907
received from credit institutions 2,000 65,000
received from customers 859 907
Guarantees 3,327 5,327
received from credit institutions 3,327 5,327
received from customers 0 0
Commitments on securities 281 281
securities receivable 281 281

14
RAPPORT D’ACTIVITÉ 2017HALF-YEAR FINANCIAL REPORT JUNE 2020
FINANCIAL AND OPERATING INCOME AND EXPENSES (in €K)
EU IFRS30/06/2020
EU IFRS31/12/2019
EU IFRS30/06/2019
Interest and similar income 126,597 248,870 121,279 Of which interest and similar income on transactions with credit institutions 3,274 1,140 157
Of which interest and similar income on customer transactions 123,164 247,334 120,969
Of which interest on variable-income securities 159 396 152
Interest and similar expenses 3,325 11,093 6,455 Of which interest and similar expenses on transactions with credit institutions 2,977 4,600 2,260
Of which interest and similar expenses on customer transactions 198 5,179 3,139
Of which interest and similar expenses on bonds and other fixed-income securities 150 1,314 1,056
Net interest margin 123,272 237,777 114,824
Fee and commission income 50,857 117,885 59,028
Fee and commission expenses 17,519 25,251 13,242
Margin on commissions 33,338 92,633 45,785Net gains or losses on financial assets at fair value through profit or loss 7,099 4,327 2,541
Return on equity measured in equity that cannot be reclassified (Dividends) 27 34 11
Net gains or losses resulting from the derecognition of financial assets at amortised cost 0 0 0
Net gains or losses on financial instruments at fair value through profit or loss 0 -4,348 -2,219
Gains on financial instruments 0 2,129 167
Losses on financial instruments 0 6,477 2,386
Net foreign exchange differences -116 -56 4
Revenue from other activities 73,483 141,764 68,454
Expenses for other activities 13,095 24,465 11,907
NET BANKING INCOME 224,008 447,666 217,494
General operating expenses 135,849 299,141 144,936
Of which personnel expenses 64,909 141,005 68,234
Of which other administrative costs 70,939 158,136 76,702
Depreciation, amortisation and impairment of intangible and tangible assets 9,029 14,494 4,940
Of which depreciation of fixed assets 9,109 16,657 8,175
Of which provisions net of reversals -80 -2,163 -3,236
Of which provisions net of reversals for impairment 0 0 0
GROSS OPERATING PROFIT 79,130 134,031 67,619
Cost of risk 48,394 79,240 36,984
OPERATING INCOME 30,736 54,791 30,635
Share of net profit (loss) of associates -117 777 446
Gains or losses on fixed assets 19 13 9
Change in value of goodwill 0 0 0
C. CONSOLIDATED INCOME STATEMENT

15
RAPPORT D’ACTIVITÉ 2017HALF-YEAR FINANCIAL REPORT JUNE 2020
PRODUITS ET CHARGES FINANCIERS ET OPERATIONNELS (en K€)
EU IFRS30/06/2020
EU IFRS31/12/2019
EU IFRS30/06/2019
TOTAL PROFIT FROM OPERATIONSBEFORE TAX 30,638 55,581 31,089
Tax expense (income) on profits from operations 6,159 11,646 5,602
TOTAL PROFIT FROM OPERATIONSAFTER TAX
Net income from discontinued or held-for-sale operations (IFRS 5 in progress)
TOTAL PROFIT 24,478 43,935 25,487
Net profit, Group share 25,069 44,047 25,494
Minority interests -591 -112 -7
Number of shares 1 465 331 1 465 331 1 449 749
The Group's share of net profit per share 17,11 30,06 17,59
D. CONSOLIDATED STATEMENT OF COMPREHENSIVE INCOME
(in €K)
30/06/2020 30/06/2019
Before tax Tax income (expense) After tax Before tax Tax income
(expense) After tax
Profit (loss) for the period 30,638 (6,159) 24,478 31,089 (5,602) 25,487
Items to be reclassified
Foreign exchange rate differences from foreign operations
(1,597) (1,597) (159) (159)
Change in the fair value of financial instruments (cash flow hedge)
269 (86) 183
Other 435 435
Items that are unable to be reclassified to profit or loss
Actuarial gains (losses) on defined benefit plans (319) 80 (239) 583 583
Other comprehensive income for the period (1,481) 80 (1,402) 693 (86) 607
Comprehensive income for the period 29,157 (6,080) 23,077 31,782 (5,688) 26,094
Attributable to:
Owners of the Parent Company 24,576 25,965
Minority interests (1,500) 129
Comprehensive income for the period 23,077 26,094

16
RAPPORT D’ACTIVITÉ 2017HALF-YEAR FINANCIAL REPORT JUNE 2020
E. CASH FLOW STATEMENT
In thousands of euros 30/06/2020 30/06/2019
Net profit (loss) before tax A 30,638 31,089
Removal of non-monetary items: B 24,742 -18,930
Depreciation and amortisation of intangible and tangible assets 9,109 8,175
Provisions net of reversals on customer receivables 15,656 -23,390
Provisions net of reversals on provisions for risks and charges -95 -3,710
Capital gains or losses -19 -9
Net income from discontinued operations
Other movements 90 2
Income from operations excluding non-monetary items A+B 55,379 12,159
Increase in assets/decrease in liabilities (-)
Decrease in assets/increase in liabilities (+)
Cash flow from operations
Loans and advances to customers C 236,498 96,215
Receivables/payables - credit institutions C 45,356 272,563
Receivables/payables - customers (including corporate) C -38,363 -521,862
Debt securities C -316,922 182,883
Financial assets and liabilities C -7,099 1,008
Non-financial assets and liabilities C -3,718 37,309
Taxes paid C -4,183 -11,541
Other movements C 1,579 1,021
Net cash flow from operating activities D=A+B+C -31,474 69,754
Cash flow from investment activities
Cash flow related to intangible and tangible investments -14,387 -6,727
Cash flow related to long-term investments and equity interests 0 0
Other movements 96
Changes to consolidation scope 0 0
Net cash flow from investment activities E -14,291 -6,727
Cash flow from financing activities
Dividends paid to shareholders -15,755
Dividends paid to minority shareholders -808
Capital increases 0
Other 465 121
Net cash flow from financing activities F 465 -16,442
Net cash flow from operating activities D -31,474 69,754
Net cash flow from investment activities E -14,291 -6,727
Net cash flow from financing activities F 465 -16,442
Effects of exchange rate fluctuations 250 226
Net increase/decrease in cash flow -45,049 46,812
Cash and cash equivalents, start of period 642,842 581,900
Cash and cash equivalents, end of period 597,793 628,712
Net increase/decrease in cash flow -45,049 46,812
17
RAPPORT D’ACTIVITÉ 2017HALF-YEAR FINANCIAL REPORT JUNE 2020
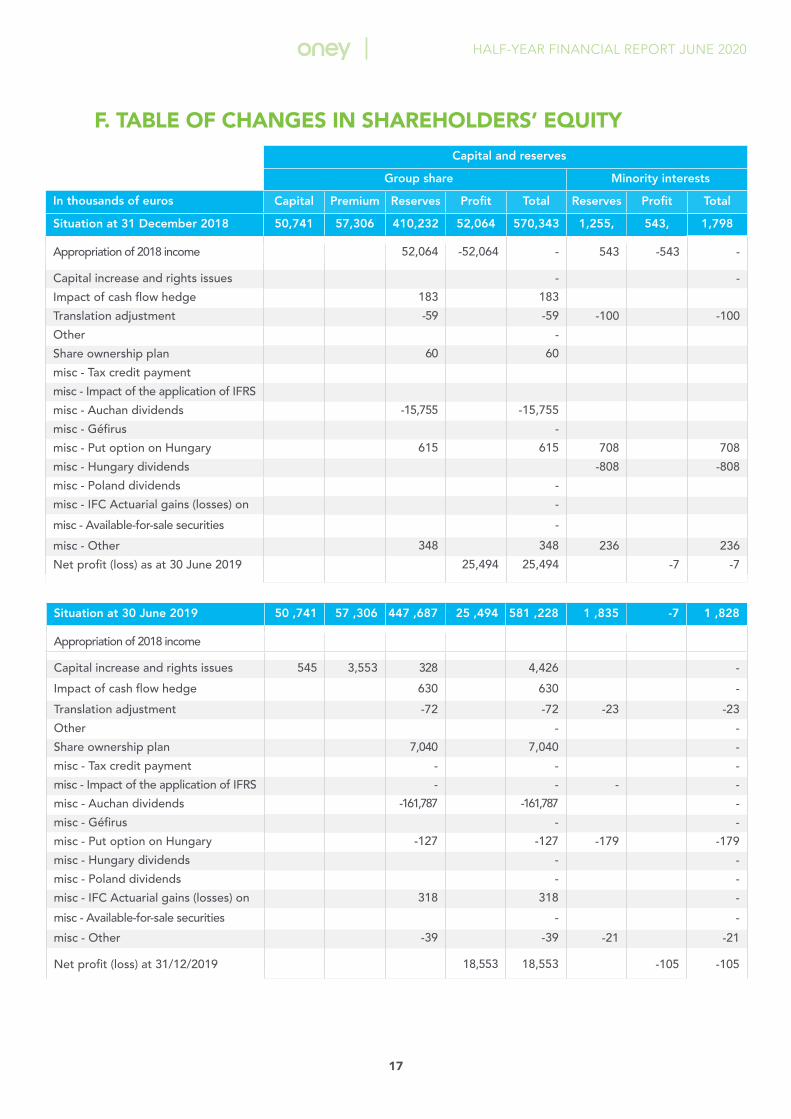
F. TABLE OF CHANGES IN SHAREHOLDERS’ EQUITY
Capital and reserves
Group share Minority interests
In thousands of euros Capital Premium Reserves Profit Total Reserves Profit Total
Situation at 31 December 2018 50,741 57,306 410,232 52,064 570,343 1,255, 543, 1,798
Appropriation of 2018 income 52,064 -52,064 - 543 -543 -
Capital increase and rights issues - -
Impact of cash flow hedge 183 183
Translation adjustment -59 -59 -100 -100
Other -
Share ownership plan 60 60
misc - Tax credit payment
misc - Impact of the application of IFRS
misc - Auchan dividends -15,755 -15,755
misc - Géfirus -
misc - Put option on Hungary 615 615 708 708
misc - Hungary dividends -808 -808
misc - Poland dividends -
misc - IFC Actuarial gains (losses) on -
misc - Available-for-sale securities -
misc - Other 348 348 236 236
Net profit (loss) as at 30 June 2019 25,494 25,494 -7 -7
Situation at 30 June 2019 50 ,741 57 ,306 447 ,687 25 ,494 581 ,228 1 ,835 -7 1 ,828
Appropriation of 2018 income
Capital increase and rights issues 545 3,553 328 4,426 -
Impact of cash flow hedge 630 630 -
Translation adjustment -72 -72 -23 -23
Other - -
Share ownership plan 7,040 7,040 -
misc - Tax credit payment - - -
misc - Impact of the application of IFRS - - - -
misc - Auchan dividends -161,787 -161,787 -
misc - Géfirus - -
misc - Put option on Hungary -127 -127 -179 -179
misc - Hungary dividends - -
misc - Poland dividends - -
misc - IFC Actuarial gains (losses) on 318 318 -
misc - Available-for-sale securities - -
misc - Other -39 -39 -21 -21
Net profit (loss) at 31/12/2019 18,553 18,553 -105 -105

18
RAPPORT D’ACTIVITÉ 2017HALF-YEAR FINANCIAL REPORT JUNE 2020
Situation at 31 December 2019 51,287 60,859 293,979 44,047 450,170 1,611 -112 1,500
Appropriation of 2019 income
Capital increase and rights issues 44,047 -44 047 -112 112
Impact of cash flow hedge
Translation adjustment -2,100 -2,100 502 502
Other
Share ownership plans
Misc.
misc - Impact of the application of -1,582 -1,582
misc - Auchan dividends
misc - Géfirus
misc - Put option on Hungary 1,340 1,340 -106 -106
misc - Hungary dividends
misc - Poland dividends
misc - IFC Actuarial gains (losses) -239 -239
misc -JV liabilities through equity that cannot be reclassified
misc - Other 1,064 1,064 -629 -629
Net profit (loss) as at 30 June 2020 25,069 25,069 -591 -591
Situation at 30 June 2020 51,287 60,859 336,509 25,069 473,723 1,268 -591 678

NotesTO THE CONDENSED CONSOLIDATED FINANCIAL STATEMENTS FOR THE FIRST HALFOF 2020(FIGURES IN THOUSANDS OF EUROS - €KOR MILLIONS OF EUROS - €M)
20
RAPPORT D’ACTIVITÉ 2017HALF-YEAR FINANCIAL REPORT JUNE 2020
Note 1: Summary of the Group ................................................................................. 21
Note 2: Main events and major changes to the consolidation scope ................ 21
Note 3: Rules and methods ........................................................................................ 22
Note 4: Seasonality of business................................................................................. 29
Note 5: Unusual items ................................................................................................. 29
Note 6: Cash accounts, central banks ...................................................................... 29
Note 7: Derivatives ....................................................................................................... 29
Note 8: Loans and receivables - credit institutions ............................................... 30
Note 9: Loans and receivables - customers ............................................................ 31
Note 10: Goodwill ......................................................................................................... 35
Note 11: Deferred taxes .............................................................................................. 35
Note 12: Accruals and other assets .......................................................................... 36
Note 13: Financial liabilities measured at amortised cost ................................... 36
Note 14: Provisions for risks and charges ............................................................... 37
Note 15: Technical reserves with insurers and liabilities towards reinsurers ... 37
Note 16: Other liabilities and accruals ..................................................................... 38
Note 17: Shareholders equity, Group share ............................................................ 38
Note 18: Minority interests ........................................................................................ 42
Note 19: Off-balance sheet liabilities ....................................................................... 42
Note 20: Interest income and expenses .................................................................. 43
Note 21: Commission income and expenses .......................................................... 43
Note 22: Other banking operating income and expenses ................................... 44
Note 23: Personnel costs ............................................................................................ 44
Note 24: Other administrative costs......................................................................... 44
Note 25: Cost of risk .................................................................................................... 45
Note 26: Corporation tax ............................................................................................ 45
Note 27: Misc ................................................................................................................ 46
Note 28: Sector-specific information ....................................................................... 46
Note 29: Fair value ....................................................................................................... 47
Note 30: Exposure and risk management ............................................................... 49
Note 31: Related party transactions ........................................................................ 55
Note 32: Documents available to the public ........................................................... 56

21
RAPPORT D’ACTIVITÉ 2017HALF-YEAR FINANCIAL REPORT JUNE 2020
NOTE 1 : SUMMARY OF THE GROUPOney Bank S.A., registered under number 546 380 197 00105, is a French Société Anonyme (public limited company) with a Board of Directors and whose registered address is 34, Avenue de Flandre, Croix (59170), France.
It specialises in all types of banking transaction and banking-related operations including the receipt and transmission of orders on behalf of third parties, insurance brokerage and the representation of all insurance firms.
It is 50.1% owned by BPCE and 49.9% by Auchan Holding, a French Société Anonyme (public limited company) with a Board of Directors and head office registered at 34, Avenue de Flandre, Croix (59170), France.
NOTE 2 : MAIN EVENTS AND MAJOR CHANGES TO THE CONSOLIDATION SCOPE
MAIN EVENTS:
• COVID-19 crisis:
In the context of the COVID-19 crisis, Oney has committed to helping customers experiencing cash flow difficulties, by implementing measures to support the economy in each of its countries, as decided by local governments and professional organisations.
Oney has taken action to support its customers who may face difficulties as a result of the de-veloping COVID-19 pandemic. In concrete terms, this translates into deferred loan repayments for individuals.
• S&P rating:
Following the BPCE Group’s equity investment in Oney Bank, Standard & Poor’s confirmed the Oney Group’s long-term rating as BBB in October 2019 and raised its outlook to positive. The short-term rating was also confirmed at A-2. Oney Bank is considered by S&P to be “strategically important” to the BPCE Group.
CHANGES TO THE CONSOLIDATION SCOPE:
• Additions to the consolidation scope/Integration of new companies:
No additions to the consolidation scope in the first half of 2020.
• Changes in percentage interest:
Following the change of control in Oney Bank’s capital in 2019, Magyar Cetelem exercised its put option on the 40% held in the subsidiary ONEY Hungary. The securities transfer operation was validated on 25 June 2020. Oney Bank now owns 100% of the Hungarian subsidiaries.
• Removals from the consolidation scope:
No companies left the consolidation scope in the first half of 2020.
EVENTS AFTER THE REPORTING PERIOD:
There are no events after the reporting period likely to have a significant impact on the 30 June 2020

22
RAPPORT D’ACTIVITÉ 2017HALF-YEAR FINANCIAL REPORT JUNE 2020
consolidated half-year financial statements.
APPROVAL OF THE FINANCIAL STATEMENTS:
The condensed consolidated half-year financial statements were approved by the Board of Directors on 20 July 2020.
NOTE 3 : RULES AND METHODS
3.1 STATEMENT OF COMPLIANCE
The Oney Group’s condensed interim consolidated financial statements for the period ending 30 June 2020 have been prepared in accordance with IAS/IFRS international accounting standards published by the IASB and IFRIC interpretations as adopted by the European Union (the «carve out» version, in which certain exemptions are made in the application of IAS 39 for macro-hedge accounting).
The standards and interpretations used for the preparation of the condensed consolidated half-year financial statements are the same as those used by the Oney Group for the preparation of its consolidated financial statements for the period ending 31 December 2019, with the exception of new standards with mandatory application from 1st January 2020, drawn up in accordance with EC Regulation 1606/2002, as well as IAS/IFRS requirements and IFRIC interpretations as adopted by the European Union (the «carve out» version, in which certain exemptions are made in the application of IAS 39 for macro-hedge accounting).
This regulation was supplemented by the regulation of 29 September 2003 (EC 1725/2003) on the application of international accounting standards and the regulation of 19 November 2004 (EC 2086/2004) on the adoption of standard 39 in an amended form.
The new standards, amendments and interpretations (in addition to the 2010-2012 and 2012-2014 annual improvements to the standards) required for reporting periods beginning on or after 1st January 2020 are:
• The IFRS 16 standard
The IFRS 16 “Leases” standard replacing IAS 17 “Leases” and its interpretations has been ap-plicable since 1st January 2019.
At the meeting of 26 November 2019, the IFRS Interpretations Committee (IFRS IC) provided details on the application of the IFRS 16 standard regarding the procedures for establishing the enforceable period of a lease. Work is underway to analyse their effects, which could lead the Group to review its application of accounting principles as applied at 31 December 2019, in particular for determining the duration of leasing contracts represented by commercial leases under French law. The IASB published a COVID-19 IFRS16 amendment on 28 May 2020.
The standards, amendments to existing standards and interpretations adopted by the European Union but whose application was not mandatory at 1st January 2020 have not been taken into account.
Nor do these financial statements take into account any new standards, revisions to existing standards or interpretations issued by the IASB but not yet adopted by the European Union on the financial statement reporting date.

23
RAPPORT D’ACTIVITÉ 2017HALF-YEAR FINANCIAL REPORT JUNE 2020
Standards, Amendments and
Interpretations not adopted by the EU
Summary of the standard Impact on the Group
IFRS 17 Insurance Contracts
The IFRS 17 “Insurance Contracts” standard was published by the IASB on 18 May 2017 to replace IFRS 4 “Insurance Contracts». Initially applicable on 1st January 2021, with a comparison on 1st January 2020, this standard is not set to come into force until 1st January 2023.In fact, at its meeting on 17 March 2020, the IASB decided to postpone its application for two years, with clarifications still to be made on key aspects of the standard. It was also decided to align the end of the temporary exemption from IFRS 9 for insurers to coincides with the application of IFRS 17 on 1st January 2023. Improvements for the application of IFRS 17 are given in an amendment.IFRS 17 establishes the principles of recognition, assessment, presentation and information to be provided for insurance contracts and investment contracts with discretionary participation features, within the scope of the standard.Currently valued at historical cost, contract obligations will be recognised at their current value, in accordance with IFRS 17. To this end, insurance contracts will be valued according to the cash flows they will generate in the future, including a risk margin to take into account the uncertainty relating to these flows. Furthermore, IFRS 17 introduces the notion of contractual service margin. This represents the profit not earned by the insurer and will be released over time, based on the service rendered by the insurer to the insured. The standard requires a greater level of granularity than before, since it requires estimates by group of contracts.These accounting changes could affect the level of insurance earnings (in particular that of life insurance) and also introduce more volatility in the earnings.
The Oney Group has joined the group of insurance entities within the BPCE Group. Project structures have been set up to tackle the changes brought about by the standard, and preparatory work continues to take place: instruction and documentation of normative decisions, modelling, adaptation of systems and organisations, production of accounts and changeover strategy, financial communication and change management.

24
RAPPORT D’ACTIVITÉ 2017HALF-YEAR FINANCIAL REPORT JUNE 2020
3.2 COMPARABILITY AND CHANGES IN ACCOUNTING POLICY
• Comparability:
The accounting policies used by the Oney Group for preparing its condensed consolidated half-year financial statements are the same as those used in the consolidated financial statements for the year ended 31 December 2019 with the exception of specific provisions applicable to the preparation of interim financial statements and new mandatory standards.
The Oney Group’s condensed consolidated half-year financial statements should be read in conjunction with the consolidated financial statements for the period ending 31 December 2019, which set out all the accounting policies applied, except for the new mandatory standards effective from 1st January 2020, which are presented in paragraph 3.1.
• Changes in accounting policy:
No change in accounting policy has occurred since 1st January 2020 that applies to the Oney Group.
3.3 DETAILS SPECIFIC TO THE PREPARATION OF THE CONDENSED CONSOLIDATED HALF-YEAR FINANCIAL STATEMENTS
Employee benefits: Unless a specific event occurs during the period, no actuarial valuations are perfor-med as part of the preparation of the condensed consolidated half-year financial statements.
3.4 USE OF ESTIMATES
The preparation of financial statements in accordance with IFRS requires the use of estimates and assumptions that could affect the carrying amount of certain assets, liabilities, income and expenses, as well as the information provided in the notes to the financial statements. Actual values may differ from estimated amounts.
For the Oney Group’s consolidated financial statements, accounting estimates that require assumptions to be made are used primarily to measure the following:
• Impairment of receivables:
The value of the item «Loans and receivables - Customers» is adjusted by impairment on the date of initial recognition of the receivables.
This impairment loss, calculated on groups of similar receivables discounted to present value, is estimated on the basis of a certain number of inputs and assumptions (number of past dues, historical recovery rates, status of receivables in the recovery process, loss rates, performance of third-party litigation firms, etc.), and forward-looking information.
Recorded impairments reflect Management’s best estimates of the future cash flows of these receivables at the reporting date.
The Oney Group applies the new impairment model required by IFRS 9.
IFRS 9 replaces IAS 39’s incurred loss model with a single forward-looking impairment model based on expected losses. The new model applies to loans, off-balance sheet commitments and debt securities recognised at fair value through OCI.
As required by the standard, the Oney Group categorises assets into 3 «stages»: performing assets, underperforming assets and non-performing assets.
• A performing asset (stage 1) is an asset whose credit quality has not deteriorated signifi-cantly since initial recognition. The impairment amount is based on the expected credit losses at 12 months.
• The transition from a performing asset to an underperforming one (stage 2) is justified
25
RAPPORT D’ACTIVITÉ 2017HALF-YEAR FINANCIAL REPORT JUNE 2020
by a significant deterioration in credit quality since initial recognition. Significant dete-rioration is defined by the Oney Group as an ongoing situation of non-payment lasting less than 90 days or that has arisen in previous months. A return to the performing asset class occurs when the probability of default falls below a certain level compared to the original probability of default, resulting in a stricter observation period. Oney justifies the use of this criterion for defining credit deterioration by the very significant proportion of past due payments in the management scores and the absence of a Basel rating for all entities in the Group.
• Classification as a non-performing asset (stage 3) is justified by the default of the asset. Oney’s concept of default requires at least one of the following three grounds to be met: the existence of one or more payments past due for at least three months, the existence of contentious proceedings, a situation whose characteristics - regardless of the existence of an unpaid debt - could lead to the conclusion that there is a proven risk (e.g. restructured loans with application of a discount in France on which an additional provision is recognised).
The expected loss is evaluated using the following model: the PD/EAD (Probability of Default/Exposure at Default) multiplied by the LGD (Loss Given Default).
The expected loss of assets will be based on a 12-month PD for performing assets and a lifetime PD for underperforming assets. Lifetime PD/EADs are calculated using ageing parameters applied to the PD/EAD at 12 months. The use of the ceiling available to the customer is also taken into account in ECL calculations.
The provisioning system, based on a PD and an LGD, converges towards the advanced Basel Ad-vanced-IRB model but retains strong specific features, such as reflecting amortisation in the EAD, using a contract rate as a discount rate, calculating a lifetime PD for underperforming assets, the absence of any adjustment for prudence, and the inclusion of forward-looking data to assess the default.
A forward-looking methodology has been established for all countries in which the Group operates, incorporating the various risk factors to be assessed and the implementation of scenarios to account for external (macroeconomic) and/or internal (corporate strategy) foresight.
In France, the methodology includes a component that incorporates a change in the probability of future default in the provision rate. This component is established on the basis of the volatility and observed evolution of the probabilities of default over the last five years. This method was chosen in France in the absence of any convincing correlation with macroeconomic information, whereas Spain and Portugal rely on the correlation between macroeconomic data (unemployment rate, Euribor rate, the country’s central consumer credit database, etc.) and expected credit losses.
The governance of IFRS 9 describes the general framework for the various controls and the monitoring of expected credit losses. The most important functions of governance related to data quality and availability, modelling management and methodologies, and internal control. The governance in place ensures that the company has a clear view of risk, by establishing reports that contain key performance indicators for estimating ECL. The reports are used to explain or adjust the calibration of the provisio-ning model according to alert levels and the corrective measures described.
The definitive estimate of the impact was made during the transition to the new standard on 1st Ja-nuary 2018.
Impact of the health crisis on the accounts:
The Group has relied on the various press releases published by the ESMA, the EBA, the ECB and the IASB for its application of accounting principles in the context of the COVID-19 crisis, in particular the provisioning model.
• In France, Oney offered its customers payment holidays. Outstanding amounts resulting from contractual payment holidays are maintained in the original stage. Outstanding amounts resulting

26
RAPPORT D’ACTIVITÉ 2017HALF-YEAR FINANCIAL REPORT JUNE 2020
from non-contractual payment breaks are downgraded to stage 2 or stage 3.
• In Portugal, moratoriums are usually private, as per market agreements. The terms of application are the same for all customers, and contracts are maintained at the same stage.
• In Spain, there have been few legal moratoria. Regulated loan moratoriums stay at the original stage for those that have not incurred any outstanding payments, otherwise they are downgraded to stage 2 or stage 3.
• In Hungary, moratoria are public and apply to all customers with outstanding amounts maintained at the original stage.
The Group anticipates the need to update current estimates and the forward-looking information, and also allows model results to be adjusted if they are deemed unsuitable.
In the context of loan moratoriums, the Group has defined rules for returning to the initial stage after an observation period of at least one month.
Each entity will implement the governance rules set out by the Group in terms of measures, documen-tation and monitoring relating to COVID-19 risks.
• Provisions:
Estimates may also be used to measure provisions.
The assessment of the amount of the potential financial impact incorporates Management’s judgement.
• Insurance technical reserves:
Calculations are based on expected losses using models and assumptions based on historical and current market data.
• Financial instruments measured at fair value:
The fair value of financial instruments is determined using interest rate curves based on market interest rates observed on the reporting date.
• Pension plans and other future employee benefits:
Expenses related to pensions/retirement and other future employee benefits are calculated based on assumptions drawn up by Management on discount rates, staff turnover rates and changes to salaries and social security contributions. If the actual figures differ from the assumptions used, the retirement benefits expense may increase or decrease in future financial years.
Unless a specific event occurs during the period, no actuarial valuations are performed as part of the preparation of the condensed consolidated half-year financial statements.
• Deferred tax assets:
Deferred tax assets are recognised for all deductible temporary differences, provided that the future availability of a taxable profit to which these deductible temporary differences may be attributed is considered probable. The likelihood of the tax asset being used depends on it being allocated within a reasonable time frame.
• Goodwill:
Impairment tests carried out on goodwill are based on three-year budget assumptions and pa-rameters (discount rate, growth rate to infinity) that require estimates to be made.

27
RAPPORT D’ACTIVITÉ 2017HALF-YEAR FINANCIAL REPORT JUNE 2020
FORMAT OF THE FINANCIAL STATEMENTS
The Oney Group uses summary formats (Balance Sheet, Income Statement, Statement of Comprehensive Income, Statement of Changes in Equity and Cash Flow Statement) pursuant to ANC recommendation no. 2017-02 of 2 June 2017.
The Cash Flow Statement was established using an analysis of cash flow based on consolidated pre-tax income and using the indirect method.
In addition, the corporate purpose of Oney Bank SA forms the basis for determining the scope of operations, investment transactions and financing.
Cash flow relating to the customer lending business and the liabilities refinancing this loan business have therefore been included in the scope of operations.
Finally, the definition of cash and cash equivalents used in this document corresponds to that recom-mended by ANC recommendation no. 2017-02, namely: cash accounts, central banks (assets and liabilities), accounts (assets and liabilities) and demand loans/borrowings to/from credit institutions as they appear in the Oney Group consolidated balance sheet for the periods under review.
3.5 3.5 SCOPE AND METHOD OF CONSOLIDATION
The notes to the consolidated financial statements contain important material information allowing for a fair assessment of the Group’s assets and liabilities, its financial position, risks and performance.
These consolidated financial statements comprise the financial statements of Oney Bank SA and the French and foreign entities that make up the Oney Group. Since the financial statements of foreign subsidiaries are prepared in accordance with local accounting rules, they have been adjusted and re-classified to bring them in line with the IFRS accounting policies applied by the Oney Group.
1) SCOPE
The scope of consolidation includes 24 companies (and a branch in Portugal) at 30 June 2020:
• 23 controlled companies,
• 1 company under significant influence.

28
RAPPORT D’ACTIVITÉ 2017HALF-YEAR FINANCIAL REPORT JUNE 2020
The scope of consolidation on 30 June 2020 was as follows:
SUBSIDIARIES %SHAREHOLDING
TYPE OFCONTROL
%CONTROL
Oney Espagne (Spain) 100% Controlled 100%
ONEY Italia 100% Controlled 100%
ONEY MAGYAROSZAG (Hungary) 100% Controlled 100%
ONEY PSP (Hungary) 100% Controlled 100%
GEFIRUS (France) 60% Controlled 100%
BA Finans (Russia) 60% Controlled 100%
ONEY BANK (Russia) 60% Controlled 100%
ONEY Poland (Poland) 100% Controlled 100%
ONEY Services (Poland) 100% Controlled 100%
SMARTNEY (Poland) 100% Controlled 100%
ONEY FINANCES (Romania) 100% Controlled 100%
ONEY ACCORD Business Consulting (China) 49% Significant in- 49%
ONEY Services (formerly Oney Courtage - 100% Controlled 100%
ONEY Holding Limited (Malta) 100% Controlled 100%
ONEY Insurance (Malta) 100% Controlled 100%
ONEY Life (Malta) 100% Controlled 100%
ONEY UKRAINE (Ukraine) 100% Controlled 100%
ONEY Investment (France) 100% Controlled 100%
ONEY Trust (merger of FIA-NET and Oney Tech) 100% Controlled 100%
ID Expert (France) 100% Controlled 100%
FNP (France) (formerly Flash'n Pay) 100% Controlled 100%
Flandre Investment (France) 100% Controlled 100%
ICI (France) 100% Controlled 100%
Natural Security (France) 48.33% Controlled 100%
AD HOC STRUCTURE %SHAREHOLDING
TYPE OFCONTROL
%CONTROL
FCT Oneycord 1 (France) 100 % Controlled 100 %
By way of a reminder, a securitisation transaction was carried out on 22 September 2009.
FCT Oneycord 1, which would ordinarily have begun to be amortised on 15 October 2012, was extended by three years, with amortisation beginning on 15 October 2015. In 2015 and in previous years, Oney Bank SA carried out a restructuring (new prospectus and new rating) of FCT Oneycord 1. Its term has been extended to September 2019.
In 2019, Oney Bank extended the life of the FCT for another four years.
This fund is wholly owned by Oney Bank SA. The assigned receivables originate from revolving cre-dit facilities. The sub-fund is topped up throughout its term by new eligible receivables as well as by drawdowns on receivables that have already been securitised. FCT Oneycord 1 is controlled.
For more details on this securitisation transaction and an indication of the carrying amount of the assets

29
RAPPORT D’ACTIVITÉ 2017HALF-YEAR FINANCIAL REPORT JUNE 2020
concerned and related liabilities, see Note 7.7 Assets transferred but not derecognised or derecognised with continuing involvement.
NOTE 4 :
SEASONALITY OF BUSINESSThe Group’s activities are not seasonal or cyclical, so the results for the first half of the year are not influenced by these factors.
NOTE 5 : UNUSUAL ITEMSThere are no unusual items affecting the 30 June 2020 financial statements.
NOTE 6 : CASH ACCOUNTS, CENTRAL BANKS(in thousands of euros) 30/06/2020 31/12/2019 Change
Central bank 328,936 405,289 -76,353
Cash dispenses - Financial spaces 10,144 11,797 -1,653
Other 1,399 981 418
TOTAL 340,479 418,067 -77,588
NOTE 7 : DERIVATIVESAt 30 June 2020, Oney no longer had derivative instruments in its portfolio.
The portfolio can be classified into a number of groups:
1. Hedging derivatives
2. Derivatives not qualifying for hedge accounting
• Cross-currency swaps are used to hedge against risks associated with refinancing subsidiary com-panies outside the eurozone.
The fair value of these instruments is set out in the table below:

30
RAPPORT D’ACTIVITÉ 2017HALF-YEAR FINANCIAL REPORT JUNE 2020
HEDGING AND TRADING DERIVATIVES (in thousands of euros)
30/06/2020 31/12/2019
ASSETS LIABILITIES ASSETS LIABILITIES
DERIVATIVES NOT QUALIFYING FOR HEDGE ACCOUNTING 0 0 0 0
Interest-rate derivatives:
Fixed instruments
Conditional instruments
FAIR VALUE HEDGING 0 0 0 0
Interest-rate derivatives:
Fixed instruments
Conditional instruments
CASH FLOW HEDGING 0 0 0 0
Interest-rate derivatives:
0Fixed instruments
Conditional instruments
TOTAL 0 0 0 0
Information on IFRS 9 Phase 3 «Hedge Accounting»:
The financing of Oney’s subsidiaries outside the Euro zone, which was previously done using cross cur-rency swaps, is now carried out by borrowing in foreign currencies from the BPCE Group. At 30/06/2020, Oney therefore has no more cross currency swap portfolios.
Since the takeover of Oney’s financing by BPCE, Oney has been managing its interest rate risk by hedging these sources of financing, in maturities and rates, tailored to the profile of its assets. At 30/06/2020, Oney therefore no longer had any interest rate swaps in the portfolio.
NOTE 8 : LOANS AND RECEIVABLES - CREDIT INSTITUTIONS
LOANS AND RECEIVABLES (in thousands of euros) 30/06/2020 31/12/2019 CHANGE
Demand loans - credit institutions: 192 ,389 170 ,641 21 ,748
Term loans - credit institutions: 74 ,159 61 ,922 12 ,237
Principal 72 ,762 61 ,018 11 ,745
Related receivables 1 ,396 904 492
(in thousands of euros) < = 3 months 3 months < D <= 1 year
1 year < D <= 5 years > 5 years 30/06/2020
Term loans - credit institutions: 60,662 824 12,673 74,159
Principal 59,265 824 12,673 72,762
Related receivables 1,396 1,396

31
RAPPORT D’ACTIVITÉ 2017HALF-YEAR FINANCIAL REPORT JUNE 2020
NOTE 9 : LOANS AND RECEIVABLES - CUSTOMERS
9.1 GENERAL PRINCIPLES OF IFRS 9 STAGE 1 «CLASSIFICATION AND MEASUREMENT»
9.1.1 GENERAL PRINCIPLES
IFRS 9 introduces a single, logical approach to classification for all financial assets, either at amortised cost or at fair value, including for financial assets that include an embedded derivative. In this case, the financial asset is classified in its entirety instead the complex system of accounting for it separately. The approach is based on principles rather than rules like in IAS 39, which were deemed complex and difficult to apply.
Three criteria must be used to determine how financial assets should be classified and measured:
• The nature of the asset: debt instrument, equity instrument or derivative instrument;
• The SPPI test (Solely Payment of Principal and Interests): the characteristics of the contractual cash flows of the financial asset.
• The business model test: the business model that the entity uses for its management of financial assets.
Financial assets must all be fully allocated to one of these IFRS 9 categories. This allocation takes place on the day of the asset’s initial recognition and cannot be modified, except in specific circumstances, such as a change of business model, in particular.
Outstanding debts for the Oney Group include revolving and redeemable loans, cash balances and related receivables. Loans are allocated to the category «Loans and receivables».
Countries have analysed the completeness of outstanding loan agreements by completing a SPPI questionnaire for each product.
Based on the characteristics of the latter (interest rate, duration and type of instrument), it was pos-sible to show that the results of the products met SPPI criteria, with a business model aimed at holding financial assets for the purposes of collecting contractual cash flows. For these outstanding loans, the new IFRS 9 standard does not bring about any changes compared to IAS 39, and they continue to be recognised at amortised cost at the effective interest rate.
• Business model :
The Oney Group does not collect contractual cash flows for the purposes of resale. However, coun-tries may decide to dispose of certain categories of portfolios, in response to market opportunities or occasional internal demands.
The business model associated with over-indebted portfolios for which disposals regularly take place is not designed to collect contractual cash flows in order to sell them on. Its sole purpose is to hold these financial assets in order to collect contractual cash flows, and never for the purposes of sale - they cannot be measured at fair value through OCI.
In accordance with the standard, disposals of assets are not incompatible with the «collection of contrac-tual cash flows» management model, as specified in IFRS 9 (paragraph B4.1.3A): «The business model may be to hold assets to collect contractual cash flows even if the entity sells financial assets when there is an increase in the assets’ credit risk... Irrespective of their frequency and value, sales due to an increase in the assets’ credit risk are not inconsistent with a business model whose objective is to hold

32
RAPPORT D’ACTIVITÉ 2017HALF-YEAR FINANCIAL REPORT JUNE 2020
financial assets to collect contractual cash flows... Credit risk management activities that are aimed at minimising potential credit losses due to credit deterioration are integral to such a business model…».
The business model was analysed at the outset and the sale of loans for over-indebtedness does not call into question the business model for collecting contractual cash flows.
9.1.2 FINANCIAL ASSETS AT FAIR VALUE
LOANS AND RECEIVABLES(in thousands of euros) 30/06/2020 31/12/2019 CHANGE IN
FAIR VALUE
Financial assets at fair value through profitor loss 14 013 6 913 7 100
Financial assets at fair value through OCI that cannot be reclassified* 1 737 1 737 0
*Oney recognises its strategic equity shares as fair value equity instruments that cannot be reclassified (irrevocable option).
The irrevocable option to recognise equity instruments at fair value through non-recyclable equity is chosen at transactional level (line by line) and is effective from the date of initial recognition. These securities are recorded on the trade date.
The initial fair value includes transaction costs.
In subsequent valuations, changes to fair value are recorded in non-recyclable equity. In the event of a sale, these variations are not reclassified to profit or loss, the profit or loss is recognised in equity.
Only dividends are recognised in profit or loss.
At 30 June 2020, the financial assets measured at fair value through profit or loss relate to Visa securities. The introduction of a hedge leads to the full reversal of a discount that no longer has any reason to exist on the Visa preference shares acquired in 2016 during the sale of Visa Europe stock. The reversal of this discount results in a one-off impact of €7 million in the accounts on the line «gains on financial assets at fair value through profit or loss».

33
RAPPORT D’ACTIVITÉ 2017HALF-YEAR FINANCIAL REPORT JUNE 2020
9.2 MATURITY DATES
LOANS AND RECEIVABLES (in thousands of euros) < = 3 months
3 months < D <= 1 year
1 year < D <= 5 years > 5 years 30/06/2020
Customer current accounts 8 8
Overall gross outstanding debts: 585,867 656,144 1,228,901 191,461 2,662,374
Performing outstanding debts (stage 1) subject to a 12-month ECL 515,901 501,812 910,869 102,326 2,030,907
Non-performing outstanding debt (stage 2) subject to an ECL at maturity 31,407 49,659 116867 23115 221,049
Impaired outstanding debt (stage 3) subject to an ECL at maturity 38,559 104,673 201,165 66,021 410,418
LOANS AND RECEIVABLES (in thousands of euros) < = 3 months
3 months < D <= 1 year
1 year < D <= 5 years > 5 years 31/12/2019
Customer current accounts 7 7
Overall gross outstanding debts: 622,232 750,414 1,334,072 206,081 2,912,800
Performing outstanding debts (stage 1) subject to a 12-month ECL 550,385 598,208 1,028,339 122,264 2,299,196
Non-performing outstanding debt (stage 2) subject to an ECL at maturity 33,982 52,675 111,845 22,273 220,776
Impaired outstanding debt (stage 3) subject to an ECL at maturity 37,865 99,532 193,888 61,543 392,828
9.3 IMPAIRED OUTSTANDING DEBT
(in thousands of euros) 30/06/2020 31/12/2019 Variation
Gross outstanding debt 2,662,374 2,912,800 -250,426
Stage 1 performing outstanding debt subject to a 12-month ECL + 2,030,907 2,299,196
Stage 2 non-performing outstanding debt subject to an ECL at maturity + 221,049 220,776
Stage 3 impaired outstanding debt subject to an ECL at maturity + 410,418 392,828
Impairments - 381,248 367,653 13,595
Outstanding debt at end of period: = 2,281,126 2,545,147 -264,021
Percentage of Stage 3 outstanding debt/total debt: 15,4% 13,5%
Hedging rate of total outstanding debt: 14,3% 12,6%
34
RAPPORT D’ACTIVITÉ 2017HALF-YEAR FINANCIAL REPORT JUNE 2020
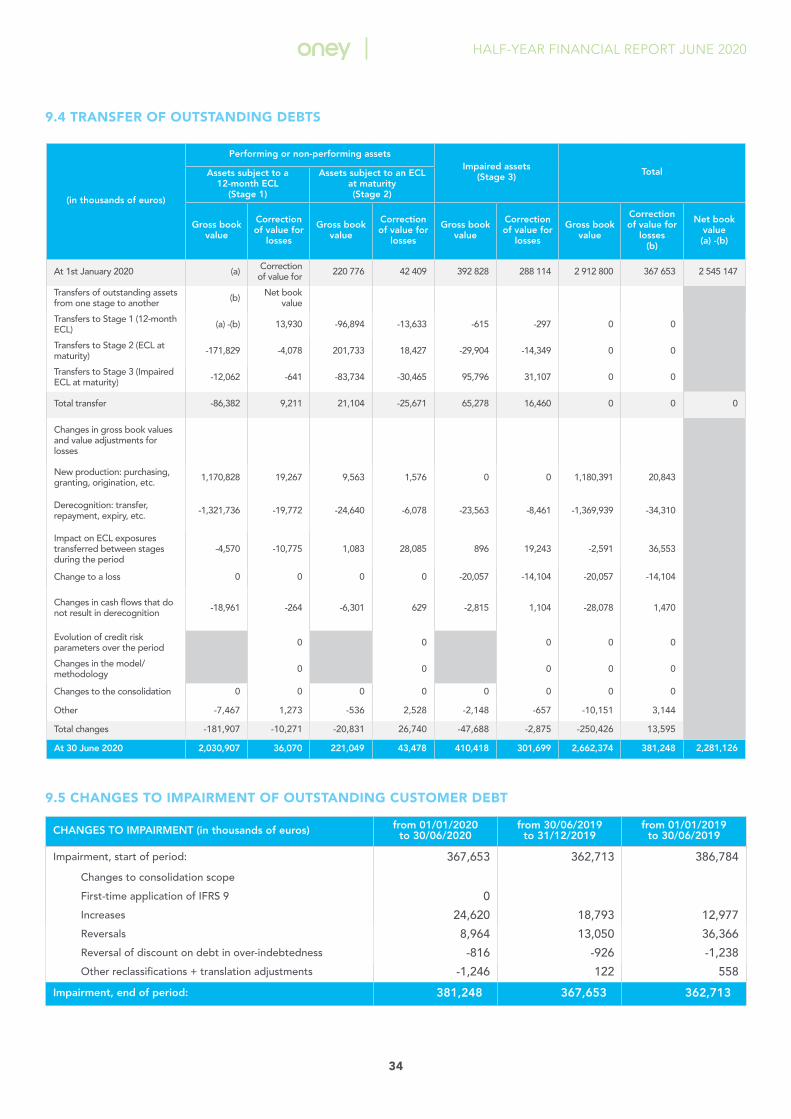
9.4 TRANSFER OF OUTSTANDING DEBTS
(in thousands of euros)
Performing or non-performing assetsImpaired assets
(Stage 3) TotalAssets subject to a 12-month ECL
(Stage 1)
Assets subject to an ECLat maturity(Stage 2)
Gross book value
Correction of value for
losses
Gross book value
Correction of value for
losses
Gross book value
Correction of value for
losses
Gross book value
Correction of value for
losses(b)
Net book value(a) -(b)
At 1st January 2020 (a) Correction of value for 220 776 42 409 392 828 288 114 2 912 800 367 653 2 545 147
Transfers of outstanding assets from one stage to another (b) Net book
value
Transfers to Stage 1 (12-month ECL) (a) -(b) 13,930 -96,894 -13,633 -615 -297 0 0
Transfers to Stage 2 (ECL at maturity) -171,829 -4,078 201,733 18,427 -29,904 -14,349 0 0
Transfers to Stage 3 (Impaired ECL at maturity) -12,062 -641 -83,734 -30,465 95,796 31,107 0 0
Total transfer -86,382 9,211 21,104 -25,671 65,278 16,460 0 0 0
Changes in gross book values and value adjustments for losses
New production: purchasing, granting, origination, etc. 1,170,828 19,267 9,563 1,576 0 0 1,180,391 20,843
Derecognition: transfer, repayment, expiry, etc. -1,321,736 -19,772 -24,640 -6,078 -23,563 -8,461 -1,369,939 -34,310
Impact on ECL exposures transferred between stages during the period
-4,570 -10,775 1,083 28,085 896 19,243 -2,591 36,553
Change to a loss 0 0 0 0 -20,057 -14,104 -20,057 -14,104
Changes in cash flows that do not result in derecognition -18,961 -264 -6,301 629 -2,815 1,104 -28,078 1,470
Evolution of credit risk parameters over the period 0 0 0 0 0
Changes in the model/methodology 0 0 0 0 0
Changes to the consolidation 0 0 0 0 0 0 0 0
Other -7,467 1,273 -536 2,528 -2,148 -657 -10,151 3,144
Total changes -181,907 -10,271 -20,831 26,740 -47,688 -2,875 -250,426 13,595
At 30 June 2020 2,030,907 36,070 221,049 43,478 410,418 301,699 2,662,374 381,248 2,281,126
9.5 CHANGES TO IMPAIRMENT OF OUTSTANDING CUSTOMER DEBT
CHANGES TO IMPAIRMENT (in thousands of euros) from 01/01/2020 to 30/06/2020
from 30/06/2019 to 31/12/2019
from 01/01/2019 to 30/06/2019
Impairment, start of period: 367,653 362,713 386,784
Changes to consolidation scope
First-time application of IFRS 9 0
Increases 24,620 18,793 12,977
Reversals 8,964 13,050 36,366
Reversal of discount on debt in over-indebtedness -816 -926 -1,238
Other reclassifications + translation adjustments -1,246 122 558
Impairment, end of period: 381,248 367,653 362,713

35
RAPPORT D’ACTIVITÉ 2017HALF-YEAR FINANCIAL REPORT JUNE 2020
ASSETS TRANSFERRED BUT NOT DERECOGNISED OR DERECOGNISED WITH CONTINUING INVOLVEMENT
• Assets transferred but not derecognised include customer outstandings within FCT Oneycord sub-fund 1. At 30 June 2020, the amount of the relevant assets, net of associated liabilities, was €737 million, compared to €717 million at 31 December 2019, and continue to be recognised on the Group’s balance sheet under “Loans and Receivables - Customers”.
• The amount of derecognised assets with ongoing involvement corresponds to disposals of outstanding debt in over-indebtedness proceedings for which debt collection continues to be carried out by the Oney Group. At 30 June 2020, the amount of derecognised outstanding debt with continued involvement amounted to €0 million compared to €1.7 million at 31 December 2019.
NOTE 10 : GOODWILLGoodwill consists of:
• Goodwill in relation to Oney Portugal (dated 1st July 2000, initially amortised on a 20-year basis until 31 December 2003 and dated 1st January 2005 following the purchase of further Oney Portugal shares held by Cofinoga). Its net worth is €18,394,000;
• Goodwill in relation to Oney Spain (formerly Accordfin) amounting to €8,049K dated 3 July 2010 in connection with the exercise by Santander Consumer Finance of its put option over the 49% shareholding it held in Accordfin.
• Goodwill in relation to ICI of €5,035K.
Impairment tests are performed at least once a year (in practice at the end of the year) for assets with an indefinite life span such as goodwill. On 30 June 2020, because of the crash in the financial markets in March 2020 and the global health crisis, we assessed the consequences of these events on future cash flows by carrying out impairment tests. At the end of the tests, there was no goodwill impairment to be recognised at the closing of the accounts on 30 June 2020.
NOTE 11 : DEFERRED TAXESThis table explains the changes to net deferred taxes (assets - liabilities)
(in thousands of euros) 01/01/2020Changes
recognised in profit or loss
Changes recognised in
equity
Cumulative translation
adjustment/Reclassification
30/06/2020
Non-deductible provisions 34,238 -1,037 677 -152 33,725
Tax-related provisions -7 1 -5
Financial instruments 0 0
Other 8,026 5,038 80 -127 13,014
TOTAL 42,253 4,002 757 -279 46,734
The «Other» section includes a €3.5 million deferred tax asset activated on a loss on 30/06/2020.
These deferred tax amounts include a €10.2 million deferred tax on carry-forwards which has not been activated due to the uncertainty of its future allocation.

36
RAPPORT D’ACTIVITÉ 2017HALF-YEAR FINANCIAL REPORT JUNE 2020
NOTE 12 : ACCRUALS AND OTHER ASSETS
(in thousands of euros) 30/06/2020 31/12/2019 Change
Uncleared transactions 237,888 256,372 -18,484
Prepaid expenses 7,531 7,018 513
Accrued income 7,824 6,551 1,273
Other accrual accounts 2957 2,293 664
Other assets 83,444 87,918 -4,474
TOTAL 339,643 360,151 -20,508
Uncleared transactions correspond to debits on customer accounts.
NOTE 13 : FINANCIAL LIABILITIES MEASURED AT AMORTISED COST
(in thousands of euros) 30/06/2020 31/12/2019 Change
Amounts owing to credit institutions: 2,378,820 2,329,667 49,153
Demand 5,626 5,909 -284
Term 2,373,194 2,323,758 49,436
Customer debts and deposits: 17,612 67,094 -49,482
Demand 4,561 4,552 8
Term 13,051 62,542 -49,490
Debt securities: 211,084 528,006 -316,922
Debenture loans 100,070 100,005 65
Other debt represented by a security (MT notes, nego- 111,014 428,001 -316,987
Subordinated debt: 33,014 33,016 -2
Leasing debts - IFRS 16: 8,589 7,145 1,445
TOTAL 2,649,119 2,964,928 -315,809
BREAKDOWN OF DEBENTURE LOANS
Borrowing company
Nominal interest rate
Effective interest rate Date of issue Maturity 30/06/2020 31/12/2019 Listing market
Oney Bank SA
E3M + 60bp E3M + 60bpOctober
2016October
202050,000 50,000 Luxembourg
Oney Bank SA
E3M + 60bp E3M + 60bpFebruary
2018October
202050,000 50,000 Luxembourg
TOTAL 100 000 100 000

37
RAPPORT D’ACTIVITÉ 2017HALF-YEAR FINANCIAL REPORT JUNE 2020
OFFSETTING FINANCIAL ASSETS AND LIABILITIES
In accordance with IAS 32, Oney Bank offsets a financial asset and a financial liability and has a net balance if, and only if, Oney Bank has a legally enforceable right to offset the recognised amounts and intends to settle the net amount or realise assets and liabilities simultaneously.
FINANCIAL INSTRUMENTS GIVEN/RECEIVED AS COLLATERAL
The Oney Group has 5,364 A Bonds (corresponding to a fraction of the securitised loan portfolio) pledged as collateral with the European Central Bank for a total nominal amount of €536.4 million as part of the ECB’s open market operations.
TLTRO II :
On 24 June 2020, Oney paid back its TLTRO II of €355 million refinanced by €549.4 million in TLTRO IIIs taken out by BPCE and transferred to Oney in the form of intra-group loans under the TLTRO III interest rates.
NOTE 14 : PROVISIONS FOR RISKS AND CHARGES
(in thousands of euros) 01/01/2020 Increases Reversals
Capital / Currency / Entry into
scope
30/06/2020
Employee 3,306 29 44 301 3,592
Provisions for tax 0 0 0 0 0
Provisions for 7,090 835 914 -16 6,994
Sub-total 10,396 864 958 285 10,587
NOTE 15 :TECHNICAL RESERVES WITH INSURERS AND LIABILITIES TOWARDS REINSURERS
(in thousands of euros) 01/01/2020 Increases Reversals Reclassification / Capital 30/06/2020
Technical reserves - Life 4,159 111 4,270
Technical reserves - Non-life 55,737 4,819 60,555
Total Technical Reserves 59,895 4,929 0 0 64,825
38
RAPPORT D’ACTIVITÉ 2017HALF-YEAR FINANCIAL REPORT JUNE 2020
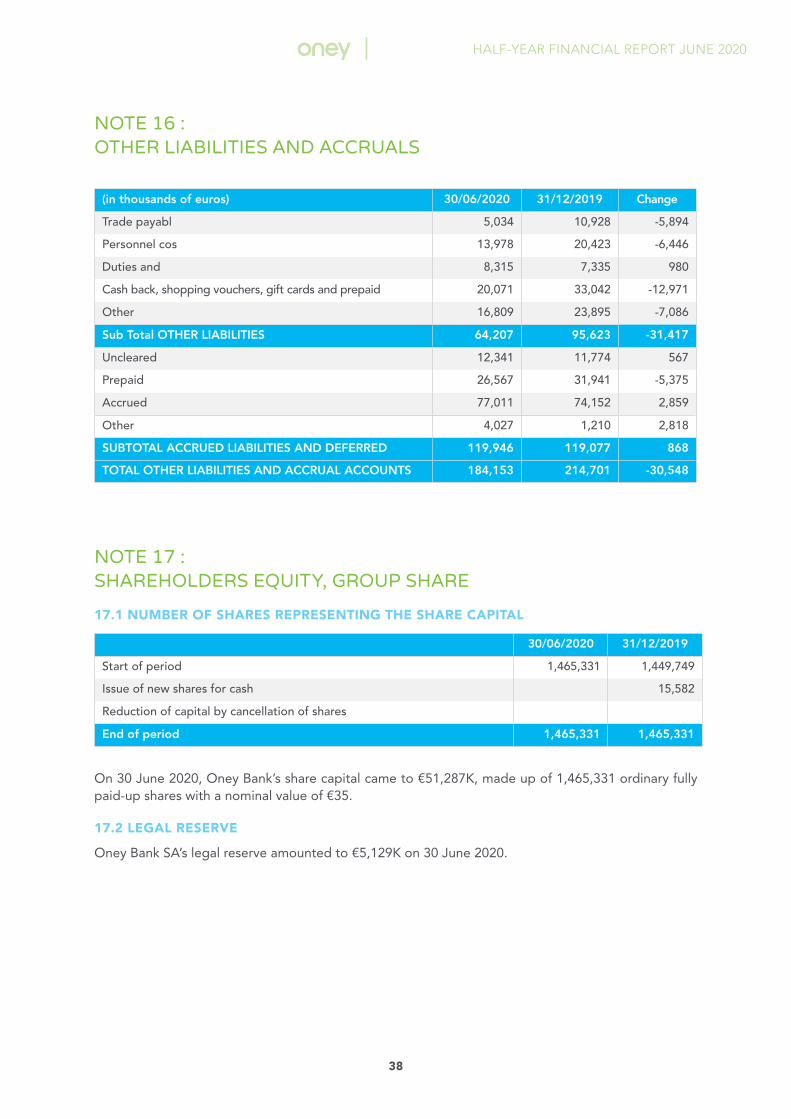
NOTE 16 : OTHER LIABILITIES AND ACCRUALS
(in thousands of euros) 30/06/2020 31/12/2019 Change
Trade payabl 5,034 10,928 -5,894
Personnel cos 13,978 20,423 -6,446
Duties and 8,315 7,335 980
Cash back, shopping vouchers, gift cards and prepaid 20,071 33,042 -12,971
Other 16,809 23,895 -7,086
Sub Total OTHER LIABILITIES 64,207 95,623 -31,417
Uncleared 12,341 11,774 567
Prepaid 26,567 31,941 -5,375
Accrued 77,011 74,152 2,859
Other 4,027 1,210 2,818
SUBTOTAL ACCRUED LIABILITIES AND DEFERRED 119,946 119,077 868
TOTAL OTHER LIABILITIES AND ACCRUAL ACCOUNTS 184,153 214,701 -30,548
NOTE 17 : SHAREHOLDERS EQUITY, GROUP SHARE
17.1 NUMBER OF SHARES REPRESENTING THE SHARE CAPITAL
30/06/2020 31/12/2019
Start of period 1,465,331 1,449,749
Issue of new shares for cash 15,582
Reduction of capital by cancellation of shares
End of period 1,465,331 1,465,331
On 30 June 2020, Oney Bank’s share capital came to €51,287K, made up of 1,465,331 ordinary fully paid-up shares with a nominal value of €35.
17.2 LEGAL RESERVE
Oney Bank SA’s legal reserve amounted to €5,129K on 30 June 2020.

39
RAPPORT D’ACTIVITÉ 2017HALF-YEAR FINANCIAL REPORT JUNE 2020
17.3 RESERVES BROKEN DOWN BY TYPE
TRANSLATION RESERVE
(in thousands of euros) 30/06/2020 31/12/2019
China -37 10
Hungary -2,622 -1,174
Poland -153 113
Romania -21 -7
Russia -3,412 -2,926
Ukraine -120 -70
United States 15 15
TOTAL -6,349 -4,039
THE CURRENCY/EURO EXCHANGE RATES USED FOR THE CURRENCIES OF THE MAIN COUNTRIES ARE AS FOLLOWS
Country CurrencyClosing rate Average rate
June 2020 Dec. 2019 June 2020 Dec. 2019
China Yuan 0,126232 0.127869 0,129099 0.129318
Hungary Forint 0,002804 0.003025 0,002896 0.003074
Poland Zloty 0,224417 0.234918 0,226563 0.232732
Romania Lei 0,206624 0.209074 0,207573 0.210723
Russia Rouble 0,012558 0.014295 0,013049 0.013804
Ukraine Hryvnia 0,033389 0.037482 0,034932 0.034610
CASH FLOW HEDGE RESERVE (EXCLUDING DEFERRED TAX)
(in thousands of euros) 30/06/2020 31/12/2019
Start of period 0 -1,203
Change 1,203
End of period 0 0

40
RAPPORT D’ACTIVITÉ 2017HALF-YEAR FINANCIAL REPORT JUNE 2020
17.4 CHANGE IN SHAREHOLDERS’ EQUITY (GROUP SHARE)
(in thousands of euros) Capital Premium Treasury shares
Consolidated reserves
Unrealised gains and
losses
Profit/loss for the
financial year
Conversion difference
Total equity
Situation at 31/12/2018 50,741, 57,306 -784 415,861 -101 52,064 -4,744 570,343
Movements
Appropriation 52,064 -52,064 0
Profit (loss) for the period 25,494 25,494
Capital increases
Impact of cash flow hedge 183 183
Translation adjustment -59 -59
Other
Share ownership plans 60 60
Auchan dividends -15,755 -15,755
Hungary put option 615 615
Hungary dividends
Poland dividends
Actuarial gains (losses) on retire. bfits.
Available-for-sale securities
Goodwill China
Real Estate Goodwill 347 347
Other
Situation at 30/06/2019 50,741 57,306 -724 453,133 81 25,494 -4,803 581,228
Movements
Appropriation
Profit (loss) for the period 18,553 18,553
Capital increases 3,553,,, 328 4,426
Impact of cash flow hedge 630 630
Translation adjustment -72 -72
Other
Share ownership plan 724 6,316 7,040
Auchan dividends -161,787 -161,787
Hungary put option -127 -127
Poland dividends
Actuarial gains (losses) on retire. bfits. 318 318
Available-for-sale securities
Real Estate Goodwill -28 -28
Other -9 -9

41
RAPPORT D’ACTIVITÉ 2017HALF-YEAR FINANCIAL REPORT JUNE 2020
Situation at 31/12/2019 51 287 60 859 0 297 824 1 030 44 047 -4 875 450 170
Movements
Appropriation 44,047 -44,047
Profit (loss) for the period 25,069 25,069
Capital increases
Impact of cash flow hedge
Translation adjustment -2,100 -2,100
Other
Share ownership plans
Auchan dividends
IFRS 9 -1,582 -1,582
Hungary put option 1,340 1,340
Hungary dividends
Poland dividends
Actuarial gains (losses) on retire. bfits. -239 -239
Real Estate Goodwill 1,064 1,064
Other 0 0
Situation au 30/06/2020 51,287 60,859 0 342,693 791 25,069 -6,975 473,723
DIVIDENDS PAID (in euros) Amount Dividend per share
Cash dividends paid for the 2017 financial year 11,396,836 7.88€
Cash dividends paid for the 2018 financial year 15,755,187 10,88€
Cash dividends paid for the 2018 financial year 161,787,196 110,41€
17.5 DIVIDENDS PAID OVER THE LAST THREE REPORTING PERIODS

42
RAPPORT D’ACTIVITÉ 2017HALF-YEAR FINANCIAL REPORT JUNE 2020
NOTE 18 : MINORITY INTERESTS
(in thousands of euros)
Situation at 31 December 2018 1,798
Profit (loss) for the period -7
Put option on Hungary minority interests 708
Dividends -808
Other (including CTA 136
FTA IFRS 9
Situation at 30 June 2019 1,828
Profit (loss) for the period -105
Put option on Hungary minority interests -179
Dividends
Other (including CTA -229
Situation at 31 December 2019 1,500
Profit (loss) for the period -591
Put option on Hungary minority interests -106
Dividends
Other (including CTA) -126
Situation at 30 June 2020 678
NOTE 19 : OFF-BALANCE SHEET LIABILITIES
COMMITMENTS RECEIVED
COMMITMENTS RECEIVED (in thousands of euros) 30/06/2020 31/12/2019
Financing commitments 2,859 65,907
Received from credit institutions and customers
Guarantees 3,327 5,327
Received from credit institutions and customers
Securities commitments 281 281
Securities to be received
TOTAL 6,467 71,514
Securities commitments are valued in accordance with the agreements described in the protocols signed with partners and are updated at each reporting date. These are call options that Oney Bank may or may not choose to exercise.

43
RAPPORT D’ACTIVITÉ 2017HALF-YEAR FINANCIAL REPORT JUNE 2020
COMMITMENTS GIVEN
COMMITMENTS GIVEN (in thousands of euros) 30/06/2020 31/12/2019
Financing commitments 6,488,575 6,597,095
To credit institutions and customers
Guarantees 153 270
To credit institutions and customers
TOTAL 6,488,728 6,597,365
NOTE 20 : INTEREST INCOME AND EXPENSES
(in thousands of euros) 30/06/2020 30/06/2019
Expense Income Expense Income
Transactions with credit institutions 2,977 3,274 2,260 157
Transactions with 198 123,164 3,139 129,969
Transactions involving financial 150 159 1,056 152
TOTAL 3,325 126,597 6,455 121,279
NOTE 21 : COMMISSION INCOME AND EXPENSES
(in thousands of euros) 30/06/2020 30/06/2019
Expense Income Expense Income
Transactions with credit institutions 2,059 2,909 2,941 3,405
Insurance transactions 3,847 7,192 1,600 10,022
Transactions with customers 4 10,602 -85 11,035
Financial services - including card fees 5,542 20,717 5,204 22,017
Other* 6,067 9,437 3,583 12,549
TOTAL 17,519 50,857 13,242 59,028
*Expenses paid to brands recognised as general operating expenses in 2019 have been reclassified as commission expenses for all Oney countries since 1st January 2020.

44
RAPPORT D’ACTIVITÉ 2017HALF-YEAR FINANCIAL REPORT JUNE 2020
NOTE 22 : OTHER BANKING OPERATING INCOME AND EXPENSES
(in thousands of euros) 30/06/2020 30/06/2019
Expense Income Expense Income
Insurance Expenses and Income 12,908 52,880 10,591 48,838
Operating Expenses and Income 187 20,603 1,315 19,616
TOTAL 13,095 73,483 11,907 68,454
NOTE 23 : PERSONNAL COSTS
(in thousands of euros) 30/06/2020 30/06/2019
Wages and salaries 43,785 43,810
Social security contributions 18,523 20,436
Tax expenses 0 0
Employee profit-sharing and incentive schemes 2,601 3,988
TOTAL 64,909 68,234
NOTE 24 : OTHER ADMINISTRATIVE COSTS
(in thousands of euros) 30/06/2020 30/06/2019
Taxes 4,576 2,975
Rentals 804 381
Remuneration of interim staff* 797 10,519
Other 64,763 62,826
TOTAL 70,939 76,702
* Expenses paid to brands recognised as general operating expenses in 2019 have been reclassified as commission expenses for all Oney countries since 1st January 2020.

45
RAPPORT D’ACTIVITÉ 2017HALF-YEAR FINANCIAL REPORT JUNE 2020
NOTE 25 : COST OF RISK
COST OF RISK30/06/2020 30/06/2019
Expense Income Expense Income
Impairment on customer transactions 24,620 8,964 12,977 36,366
Stage 1 performing outstanding debt (subject to a 1,040 1,930 486 706
Stage 2 non-performing outstanding debt (subject to 3,452 2,262 6,158 27,926
Stage 3 impaired outstanding debt (subject to an ECL 20,128 4,771 6,333 7,735
Impairment on other receivables and financial fixed assets 0 0 0 0
Losses on unrecoverable debt 37,535 76,353
Collections on written-off receivables 4,797 15,979
TOTAL 62,155 13,761 89,329 52,346
BALANCE 48,394 36,984
NOTE 26 : CORPORATION TAX
TAX EXPENSES
Tax expense 30/06/2020 30/06/2019
Taxes payable 10,161 400
Deferred tax liabilities -4,002 5,202
TOTAL 6,159 5,602
Amount30/06/2020
30/06/2020Rate
31/12/2019Rate
30/06/2019Rate
Earnings before corporation tax and associates 30 638
Standard rate 32,02% 34,43% 32,02%
Theoretical corporation tax 9 848
Permanent differences -268 -0,87% -1,18% 0,44%
Unrecognised deferred taxes 139 0,45% 1,92% 3,19%
Rate differential -104 -0,34% -1,46% -0,81%
Tax credits -3 293 -10,75% -14,56% -15,41%
Impact of rate changes at start of period
Other differences -164 9,95% 2,16% -1,41%
EFFECTIVE TOTAL 6 159
EFFECTIVE RATE 20,10% 20,95% 18,02%
TAX ANALYSIS
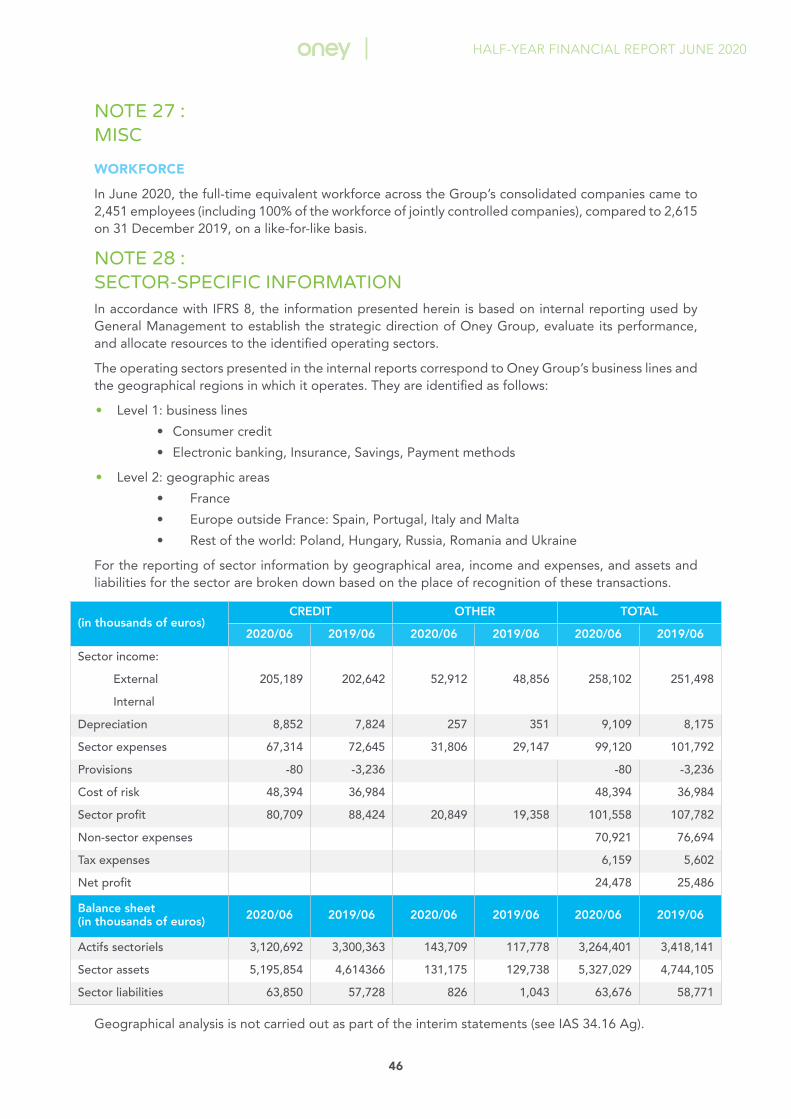
46
RAPPORT D’ACTIVITÉ 2017HALF-YEAR FINANCIAL REPORT JUNE 2020
NOTE 27 : MISC
WORKFORCE
In June 2020, the full-time equivalent workforce across the Group’s consolidated companies came to 2,451 employees (including 100% of the workforce of jointly controlled companies), compared to 2,615 on 31 December 2019, on a like-for-like basis.
NOTE 28 : SECTOR-SPECIFIC INFORMATION In accordance with IFRS 8, the information presented herein is based on internal reporting used by General Management to establish the strategic direction of Oney Group, evaluate its performance, and allocate resources to the identified operating sectors.
The operating sectors presented in the internal reports correspond to Oney Group’s business lines and the geographical regions in which it operates. They are identified as follows:
• Level 1: business lines
• Consumer credit
• Electronic banking, Insurance, Savings, Payment methods
• Level 2: geographic areas
• France
• Europe outside France: Spain, Portugal, Italy and Malta
• Rest of the world: Poland, Hungary, Russia, Romania and Ukraine
For the reporting of sector information by geographical area, income and expenses, and assets and liabilities for the sector are broken down based on the place of recognition of these transactions.
(in thousands of euros)CREDIT OTHER TOTAL
2020/06 2019/06 2020/06 2019/06 2020/06 2019/06
Sector income:
External 205,189 202,642 52,912 48,856 258,102 251,498
Internal
Depreciation 8,852 7,824 257 351 9,109 8,175
Sector expenses 67,314 72,645 31,806 29,147 99,120 101,792
Provisions -80 -3,236 -80 -3,236
Cost of risk 48,394 36,984 48,394 36,984
Sector profit 80,709 88,424 20,849 19,358 101,558 107,782
Non-sector expenses 70,921 76,694
Tax expenses 6,159 5,602
Net profit 24,478 25,486
Balance sheet(in thousands of euros) 2020/06 2019/06 2020/06 2019/06 2020/06 2019/06
Actifs sectoriels 3,120,692 3,300,363 143,709 117,778 3,264,401 3,418,141
Sector assets 5,195,854 4,614366 131,175 129,738 5,327,029 4,744,105
Sector liabilities 63,850 57,728 826 1,043 63,676 58,771
Geographical analysis is not carried out as part of the interim statements (see IAS 34.16 Ag).

47
RAPPORT D’ACTIVITÉ 2017HALF-YEAR FINANCIAL REPORT JUNE 2020
NOTE 29 :FAIR VALUEAssets and liabilities are recognised and measured in accordance with IFRS 9. In certain circumstances, market values are very close to the carrying amounts. This is the case for:
• variable-rate assets or liabilities for which changes in interest do not have a material impact on fair value, because the rates of these instruments frequently adjust to market rates;
• short-term assets or liabilities for which we consider the redemption value to be close to the market value.
The accounting methods used are as follows:
Cash at bank and in hand, accruals and receivables accounts, and other assets and liabilities
For these short-term assets and liabilities, the redemption value is close to the market value.
Variable-rate loans and receivables - customers
When it comes to financial assets for which changes in interests have no material impact on the fair value, the redemption value is close to the market value.
Fixed-rate loans and receivables - customers
The fair value of outstanding fixed-rate loans corresponds to the discounted value of anticipated future cash flows from outstanding debts through the amortisation curve (excluding interest).
Financial instruments
The Oney Group values its financial instruments using a standard method by discounting antici-pated future cash flows of the financial instrument identified through the zero-coupon curve at the end of the accounting period.
Debt securities
For debts represented by a floating-rate security, for which changes in interest have no material impact on the fair value, the redemption value is close to the market value.
For debts represented by a fixed-rate security, the fair value of this debt at 30 June 2020 corres-ponds to the discounting of cash flows from the liability with a EURO rate curve.
Receivables and payables - credit institutions
These are variable-rate receivables or payables. Changes in interest have no material impact on fair value. As such, the repayment value is close to the market value.

48
RAPPORT D’ACTIVITÉ 2017HALF-YEAR FINANCIAL REPORT JUNE 2020
MARKET VALUE OF ASSETS AND LIABILITIES BASED ON MARKET DATA OR VALUATION TECHNIQUES:
In thousands of eurosMarket value
Level 1 Level 2 Level 3
Derivatives - assets 0
Derivatives - liabilities 0
Cash at bank and in hand 340,479
Loans and receivables - customers 2,281,134
Current tax assets 1,036
Other assets and accruals 339,643
Amounts owing to credit institutions 2,378,820
Amounts owing to customers 17,612
Amounts owing represented by securities 211,084
Subordinated debt 33,014
Leasing debts - IFRS 16 8,589
Current tax liabilities 16,287
Other liabilities and accruals 184,153
(in thousands of euros)Market value
Level 1 Level 2 Level 3
Financial assets at fair value through profit or loss* 1,664 12,349
Financial assets at fair value through capital 1,737
* VISA preference shares are classified at market value level 3.
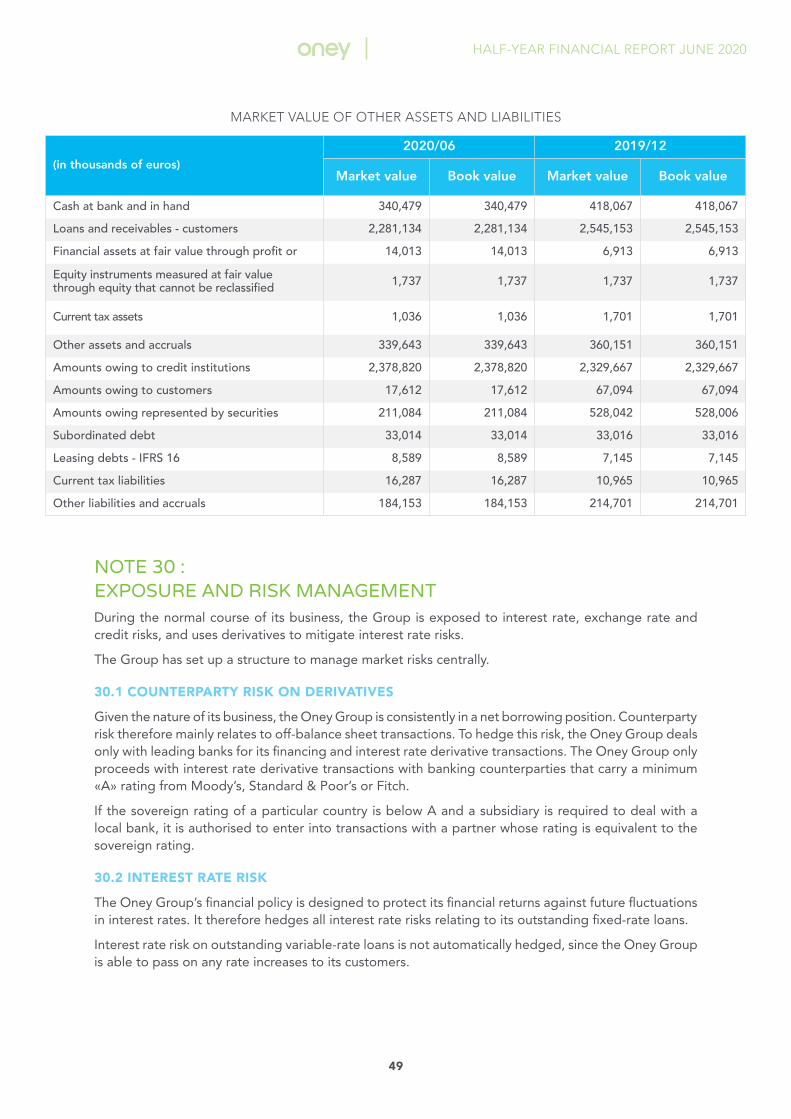
49
RAPPORT D’ACTIVITÉ 2017HALF-YEAR FINANCIAL REPORT JUNE 2020
MARKET VALUE OF OTHER ASSETS AND LIABILITIES
(in thousands of euros)
2020/06 2019/12
Market value Book value Market value Book value
Cash at bank and in hand 340,479 340,479 418,067 418,067
Loans and receivables - customers 2,281,134 2,281,134 2,545,153 2,545,153
Financial assets at fair value through profit or 14,013 14,013 6,913 6,913
Equity instruments measured at fair value through equity that cannot be reclassified 1,737 1,737 1,737 1,737
Current tax assets 1,036 1,036 1,701 1,701
Other assets and accruals 339,643 339,643 360,151 360,151
Amounts owing to credit institutions 2,378,820 2,378,820 2,329,667 2,329,667
Amounts owing to customers 17,612 17,612 67,094 67,094
Amounts owing represented by securities 211,084 211,084 528,042 528,006
Subordinated debt 33,014 33,014 33,016 33,016
Leasing debts - IFRS 16 8,589 8,589 7,145 7,145
Current tax liabilities 16,287 16,287 10,965 10,965
Other liabilities and accruals 184,153 184,153 214,701 214,701
NOTE 30 : EXPOSURE AND RISK MANAGEMENTDuring the normal course of its business, the Group is exposed to interest rate, exchange rate and credit risks, and uses derivatives to mitigate interest rate risks.
The Group has set up a structure to manage market risks centrally.
30.1 COUNTERPARTY RISK ON DERIVATIVES
Given the nature of its business, the Oney Group is consistently in a net borrowing position. Counterparty risk therefore mainly relates to off-balance sheet transactions. To hedge this risk, the Oney Group deals only with leading banks for its financing and interest rate derivative transactions. The Oney Group only proceeds with interest rate derivative transactions with banking counterparties that carry a minimum «A» rating from Moody’s, Standard & Poor’s or Fitch.
If the sovereign rating of a particular country is below A and a subsidiary is required to deal with a local bank, it is authorised to enter into transactions with a partner whose rating is equivalent to the sovereign rating.
30.2 INTEREST RATE RISK
The Oney Group’s financial policy is designed to protect its financial returns against future fluctuations in interest rates. It therefore hedges all interest rate risks relating to its outstanding fixed-rate loans.
Interest rate risk on outstanding variable-rate loans is not automatically hedged, since the Oney Group is able to pass on any rate increases to its customers.

50
RAPPORT D’ACTIVITÉ 2017HALF-YEAR FINANCIAL REPORT JUNE 2020
EXPOSURE TO INTEREST RATE RISK
This table gives a broad outline of the interest rate risk on financial assets associated with cus-tomers. All financial liabilities are given.
In millions of euros 06/2020 12/2019
Fixed rate financial assets 1,876 2,007
Fixed rate financial liabilities 113 492
Floating rate financial assets 1,027 1,197
Floating rate financial liabilities 2,536 2,473
The maturity dates for financial assets are shown in notes 7 and 8, and those of financial liabilities in note 26.4.
30.3 INTEREST RATE HEDGES
HEDGING INSTRUMENTS
At 30 June 2020, the interest rate risk is hedged by the interbank refinancing structure (fixed rate loan/adjustable rate distribution), and therefore does not require a hedging derivative.

51
RAPPORT D’ACTIVITÉ 2017HALF-YEAR FINANCIAL REPORT JUNE 2020
30.4 LIQUIDITY RISK
In order to limit its liquidity risk, Oney Bank relies on the financing of its majority shareholder, the BPCE Group, which provides Oney with all the liquidity its needs to fund its activity.
Oney Bank has also built up a reserve of high-quality liquid assets (HQLA) allowing it to cope with 30-day net cash outflows in a stressed scenario. Since 1st January 2018, in accordance with the regu-lations in force, Oney Bank has complied with the minimum coverage of 100% of net cash outflows for a 30-day period.
EXPOSURE TO LIQUIDITY RISK
The contractual residual maturities of the financial liabilities break down as follows (including interest payments):
AT 30/06/2020
(in thousands of euros) Book valueContractual cash flow
Total < 3 M < 6 M < 1 year 1 to 5 years + 5 years
Amounts owing to credit institutions (deposits) 5,626 5,626 5,626
Amounts owing to credit institutions 2,373,194 2,365,176 404,427 464,012 461,422
Amounts owing to customers - demand 4,561 4,561 4,561
Amounts owing to customers - term 13,051 13,145 717 101 11,994 333
Debenture loans 100,070 100,135 90 100,045
Debt securities 111,014 111,017 80,022 15,998 14,996
Subordinated debt 33,014 37,446 79 68 141 1,556 35,602
Leasing debts - IFRS 16 8,589 8,589 723 723 1,446 5,293 404
Trade payables 5,034 5,034 5,034
Other liabilities 179,119 179,119 166,512 2,129 6,829 3,649
(in thousands of euros) Book valueContractual cash flow
Total < 3 M < 6 M < 1 year 1 to 5 years + 5 years
Amounts owing to credit institutions (deposits) 5,909 5,909 5,909
Amounts owing to credit institutions 2,323,758 2,321,577 327,886 605,651 608,297 779,744
Amounts owing to customers - demand 4,552 4,552 4,552
Amounts owing to customers - term 62,542 62,749 45,987 3,504 818 12,441
Debenture loans 100,005 100,158 49 55 100,055
Debt securities 428,001 427,822 256,916 59,950 95,960 14,996
Subordinated debt 33,016 37,787 76 71 136 1,559 35,944
Leasing debts - IFRS 16 7,145 7,145 636 636 1,273 4,132 467
Trade payables 10,928 10,928 10,928
Other liabilities 203,773 204,252 174,129 11,982 5,047 13,094
Tax liabilities 11,058 11,058 10,632 380 0 47
AT 31/12/2019

52
RAPPORT D’ACTIVITÉ 2017HALF-YEAR FINANCIAL REPORT JUNE 2020
Expected cash flows correspond to the contractual cash flows.
Originally medium and long-term credit lines granted and confirmed by banks, but still unused at 30 June 2020 and 31 December 2019:
Amount in €Kat 30/06/2020 <1 year 1< <5 years + 5 years
2,000 2,000
Amount in €Kat 31/12/2019 <1 year 1< <5 years + 5 years
65,000 30,000 35,000
30.5 FOREIGN EXCHANGE RISK
Oney Bank SA is exposed to a foreign exchange risk linked to capital investments in its subsidiaries outside the euro zone. With regard to the amounts committed, this risk is not subject to any specific hedging.
30.6 MANAGEMENT OF CUSTOMER CREDIT RISK
1. OVERVIEW
Credit risk mainly relates to consumer loans (personal loans, revolving loans, etc.) granted to individuals.
The risk is spread over a large number of customers with limited individual commitment.
For off-balance sheet commitments, the Group’s policy is to grant financial guarantees only to subsidiaries and certain partner companies.
2. STRUCTURE OF THE RISK DIVISION
The Oney Group’s credit risk is managed and monitored by the Risk Departments of its subsi-diaries or partners, as well as the Group Risk and Compliance Department and Internal Audit Department, through Risk Committees.
For France, Spain, Portugal and Smartney (Poland), these risks are managed by local Risk De-partments.
For other countries, (Hungary and Russia), the partner is responsible for managing credit risk, since it is the partner’s processes and information systems that are determine loan approval, risk monitoring and debt collection.
In all cases, risk is monitored by the Group Risk and Compliance Department.
The Risk Committees are responsible for managing credit risks and overseeing projects that have an impact on these risks. They validate the strategy, the methodologies put in place and above all the performance achieved when it comes to risk management.
3. PROCEDURE FOR GRANTING LOANS AND DEBTS, AND SETTING INDIVIDUAL LIMITS
Credit decision systems are based on a statistical approach, supported by an examination of each loan application. They are adapted to the different types of product and customer.

53
RAPPORT D’ACTIVITÉ 2017HALF-YEAR FINANCIAL REPORT JUNE 2020
They include:
• Credit scoring
• Clearly-stated rules for declining applications
• A system of delegation and authority
• Rules governing the supporting documentation to be provided
• Anti-fraud controls
Adhering to credit decisions based on these aforementioned scores and rules, which are very seldom waived, ensures tight control over credit risk. Exceptions and the persons qualified to make exceptions are defined by procedures and are checked retrospectively; these exceptions are designed to ensure personalised management of loan approvals for larger amounts or intended for targeted customer bases.
4. GRANTING OF GUARANTEES
The Group’s policy is to grant financial guarantees only to subsidiaries and to certain partner companies.
5. WITHIN THE GROUP
The Oney Group’s financial policy is designed to protect its financial returns against future fluc-tuations in interest rates. It therefore hedges all interest rate risks relating to its outstanding fixed-rate loans.
Interest rate risk on outstanding variable-rate loans is not automatically hedged, since the Oney Group is able to pass on any rate increases to its customers.
6. DEBT RESTRUCTURING
The amount of outstanding debt that has been restructured or rearranged, whether decided internally or after referral to an over-indebtedness commission, amounted to €97.9 million at 30 June 2020 compared with €102.1 million at 31 December 2019. These outstanding debts were impaired by €67.5 million at 30 June 2020 compared to €70.4 million at 31 December 2019.
30.7 INSURANCE RISK MANAGEMENT
There are two main types of insurance risk:
• risks related to rate-setting and adverse claim trends;
• risks related to the financial markets.
The first of these refers to the differences in assumptions made at the time when the risk is insured and the reality of subsequent claims in terms of frequency, timing and severity.
For borrower insurance, the types of coverage offered are: death, accidental death, permanent total disability, temporary inability to work and redundancy. The products are offered on the basis of regular premium payments, with claim payouts capped at the amount of outstanding credit owed by the policyholder at the date of the claim.
For payment method insurance, the types of coverage offered are: fraudulent use, cash theft by mugging, loss or theft of keys and official papers and non-delivery or non-compliant delivery of online purchases.
For warranty extension products, the warranties offered mainly relate to breakdowns.
For protection reinsurance in Italy, the reinsured types of cover offered are: temporary inability to work

54
RAPPORT D’ACTIVITÉ 2017HALF-YEAR FINANCIAL REPORT JUNE 2020
and loss of employment following an accident.
The products on offer provide for the limited or lump-sum payment of single or monthly compensation for predefined periods.
The Company also reserves the right to adjust premium amounts (except for reinsurance, where the insurer retains the ability to do so). This provides protection against any excess costs and to makes it possible to adapt to the current economic climate. The insurance companies operate under “group” contracts. The diversity of the policyholder portfolio and the individual amounts allocated to each insurance product eliminate concentration risk.
For the second type of risk, all financial institutions and instruments chosen for investments are subject to the approval of the Board before any investment of funds, and all counterparties must have a minimum rating of «A-» from Standard & Poor’s, unless explicitly decided otherwise by the Board of Directors. These ratings are regularly reviewed.
30.8 EXPOSURE TO SOVEREIGN RISK
As at 30 June 2020, the Oney Group has no exposure to sovereign risk.
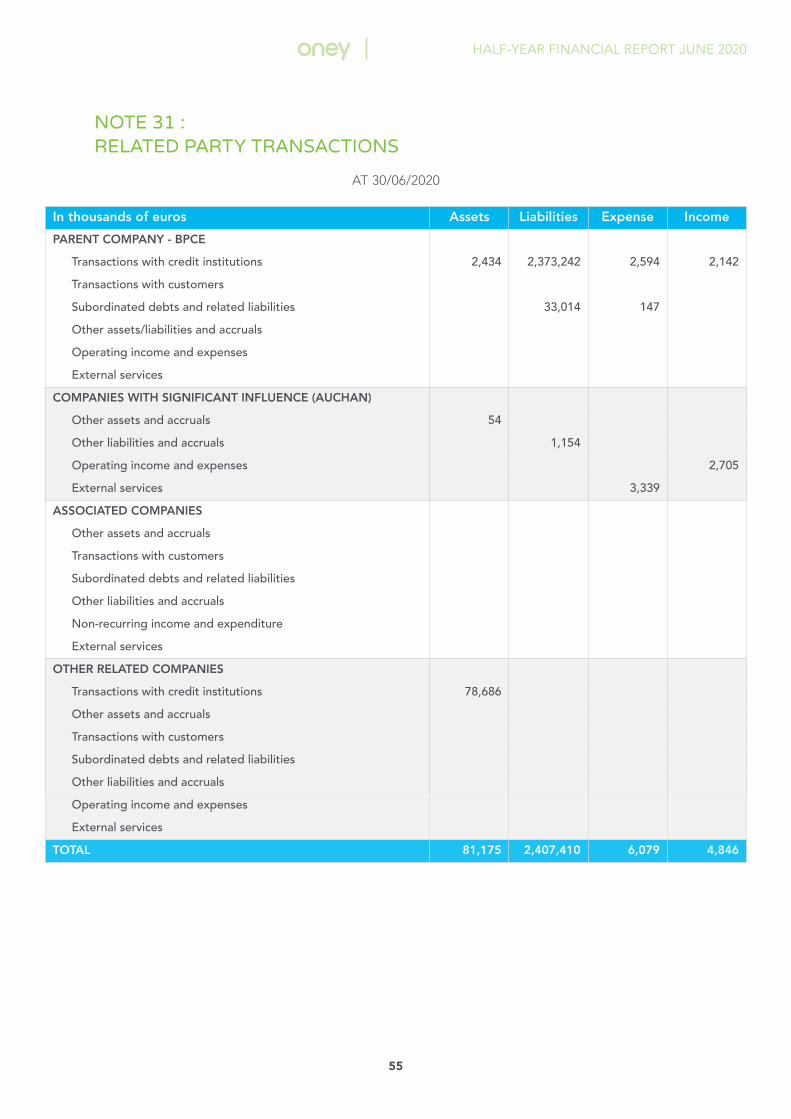
55
RAPPORT D’ACTIVITÉ 2017HALF-YEAR FINANCIAL REPORT JUNE 2020
NOTE 31 : RELATED PARTY TRANSACTIONS
AT 30/06/2020
In thousands of euros Assets Liabilities Expense Income
PARENT COMPANY - BPCE
Transactions with credit institutions 2,434 2,373,242 2,594 2,142
Transactions with customers
Subordinated debts and related liabilities 33,014 147
Other assets/liabilities and accruals
Operating income and expenses
External services
COMPANIES WITH SIGNIFICANT INFLUENCE (AUCHAN)
Other assets and accruals 54
Other liabilities and accruals 1,154
Operating income and expenses 2,705
External services 3,339
ASSOCIATED COMPANIES
Other assets and accruals
Transactions with customers
Subordinated debts and related liabilities
Other liabilities and accruals
Non-recurring income and expenditure
External services
OTHER RELATED COMPANIES
Transactions with credit institutions 78,686
Other assets and accruals
Transactions with customers
Subordinated debts and related liabilities
Other liabilities and accruals
Operating income and expenses
External services
TOTAL 81,175 2,407,410 6,079 4,846

56
RAPPORT D’ACTIVITÉ 2017HALF-YEAR FINANCIAL REPORT JUNE 2020
AT 31/12/2019
In thousands of euros Assets Liabilities Expense Income
PARENT COMPANY - BPCE
Transactions with credit institutions 135 1,962,144 205
Transactions with customers
Subordinated debts and related liabilities 33,016 16
Other assets/liabilities and accruals
Operating income and expenses
External services
COMPANIES WITH SIGNIFICANT INFLUENCE (AUCHAN)
Other assets and accruals 636
Other liabilities and accruals 2,366
Operating income and expenses 4,232 5,780
External services 4,971
ASSOCIATED COMPANIES
Other assets and accruals
Transactions with customers
Subordinated debts and related liabilities
Other liabilities and accruals
Non-recurring income and expenditure 26
External services 20
OTHER RELATED COMPANIES
Transactions with credit institutions 66,080
Other assets and accruals
Transactions with customers
Subordinated debts and related liabilities
Other liabilities and accruals 3,961
Operating income and expenses 8,546 14,005
External services 1,096 379
TOTAL 66,850 1,997,526 9,461 6,031
NOTE 32 : DOCUMENTS AVAILABLE TO THE PUBLICIn accordance with ANC regulation no. 2014-07, this document is available to the public at https://www.oney.com. Anyone wishing to obtain further information about the Oney Group may request documents, without obligation:
• by post: ONEY BANK OZEA 34, Avenue de Flandre 59170 Croix
• by telephone: +33 3 28 38 58 00

57
RAPPORT D’ACTIVITÉ 2017HALF-YEAR FINANCIAL REPORT JUNE 2020
ONEY BANK S.A.STATUTORY AUDITORS’ REPORT ON THE2020 HALF-YEAR FINANCIAL STATEMENTS(PERIOD FROM 1ST JANUARY 2020TO 30 JUNE 2020)

58
RAPPORT D’ACTIVITÉ 2017HALF-YEAR FINANCIAL REPORT JUNE 2020
PricewaterhouseCoopers Audit63, rue de Villiers92208 Neuilly-sur-Seine CedexFrance
KPMG S.A.Registered officeTour EQHO2, Avenue GambettaCS 6005592066 Paris la Défense CedexFrance
Statutory Auditors’ report on the half-year financial statements(Period from 1st January 2020 to 30 June 2020)
To Shareholders,ONEY BANK S.A.40, Avenue de FlandreBP13959964 Croix Cedex
Mesdames, Messieurs,
Dear Shareholders,
As mandated by your AGM and pursuant to Article L. 451-1-2 III of the French Monetary and Financial Code, we have undertaken:
• a limited review of the condensed consolidated half-year financial statements of ONEY BANK S.A., relating to the period from 1st January 2020 to 30 June 2020, attached to this report
• a verification of the information given in the half-year activity report.
These condensed consolidated half-year financial statements were prepared under the responsibility of the Board of Directors on 20 July 2020 based on the information available at that date, bearing in mind the developing context of the Covid-19 pandemic and the uncertainty surrounding its impacts and prospects for the future.It is our job to report our conclusions on these financial statements, based on our review.
1. CONCLUSIONS ON THE FINANCIAL STATEMENTS
We have conducted our limited review in accordance with professional standards applicable in France. A limited review consists mainly of interviewing senior managers in charge of accounting and financial matters and implementing analytical procedures. The work is less extensive than that required for an audit performed in accordance with the professional standards applicable in France. As a result, in the context of a limited review, the assurance that the financial statements, taken as a whole, do not contain any material misstatements is a moderate assurance, lower than that obtained as part of a full audit.
Based on our limited review, we have not identified any material misstatement that would call into question the compliance of the interim condensed consolidated financial statements with the IAS 34 - IFRS standard applicable in the European Union to interim financial information.

59
RAPPORT D’ACTIVITÉ 2017HALF-YEAR FINANCIAL REPORT JUNE 2020
2. SPECIFIC VERIFICATION
We have also verified the information provided in the half-year management report drawn up on 20 July 2020, commenting on the condensed consolidated half-year financial statements subject to our review. We have no comments to make as to their accuracy or their consistency with the condensed consolidated half-year financial statements.
Established in Neuilly-sur-Seine and Paris La Défense
The Statutory Auditors
PricewaterhouseCoopers AuditNicolas Wilfart
Partner
KPMG S.A.Christophe Coquelin
Partner

CREDITS•
REDACTION :DIRECTION DE LA TRANSFORMATION,
COMMUNICATION ET RSE
PICTURES :JOAQUIM DASSONVILLE, VINCENT MONTAGNE,
ONEY, ISTOCK
CONCEPTION & REALISATION :ULTRAMEDIA