half full or half empty? ways forward on massive galaxy evolution since z~1 daniel eisenstein...
TRANSCRIPT
Half Full or Half Half Full or Half Empty? Empty? Ways Forward on Ways Forward on
Massive Galaxy Evolution Massive Galaxy Evolution since z~1since z~1Daniel EisensteinDaniel Eisenstein
University of ArizonaUniversity of Arizona
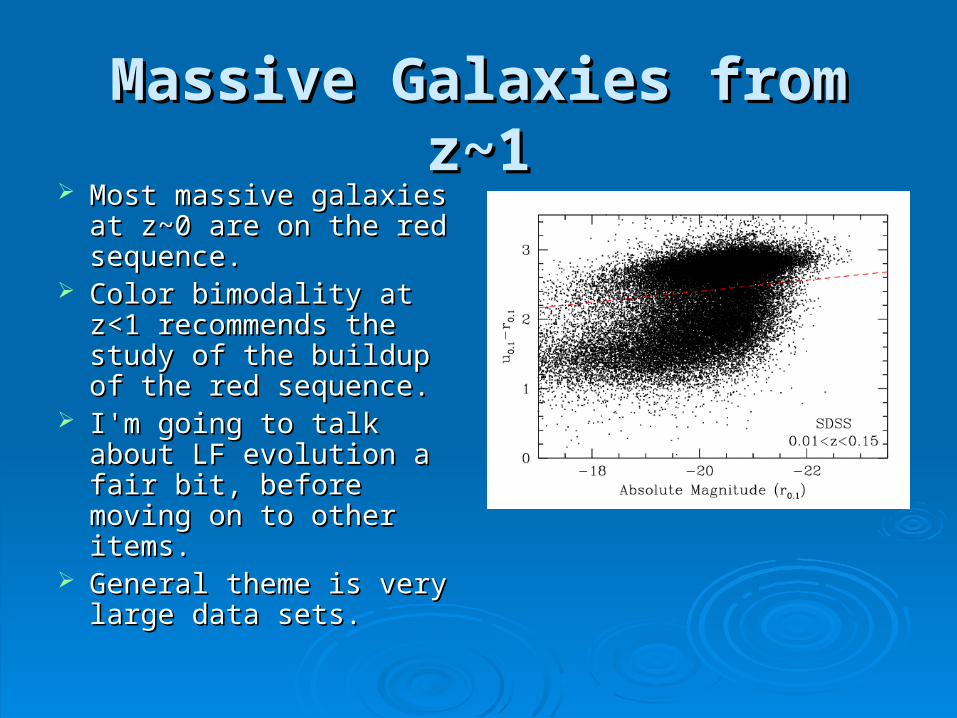
Massive Galaxies from z~1Massive Galaxies from z~1 Most massive galaxies at Most massive galaxies at
z~0 are on the red z~0 are on the red sequence.sequence.
Color bimodality at z<1 Color bimodality at z<1 recommends the study of recommends the study of the buildup of the red the buildup of the red sequence.sequence.
I'm going to talk about LF I'm going to talk about LF evolution a fair bit, before evolution a fair bit, before moving on to other items.moving on to other items.
General theme is very General theme is very large data sets.large data sets.
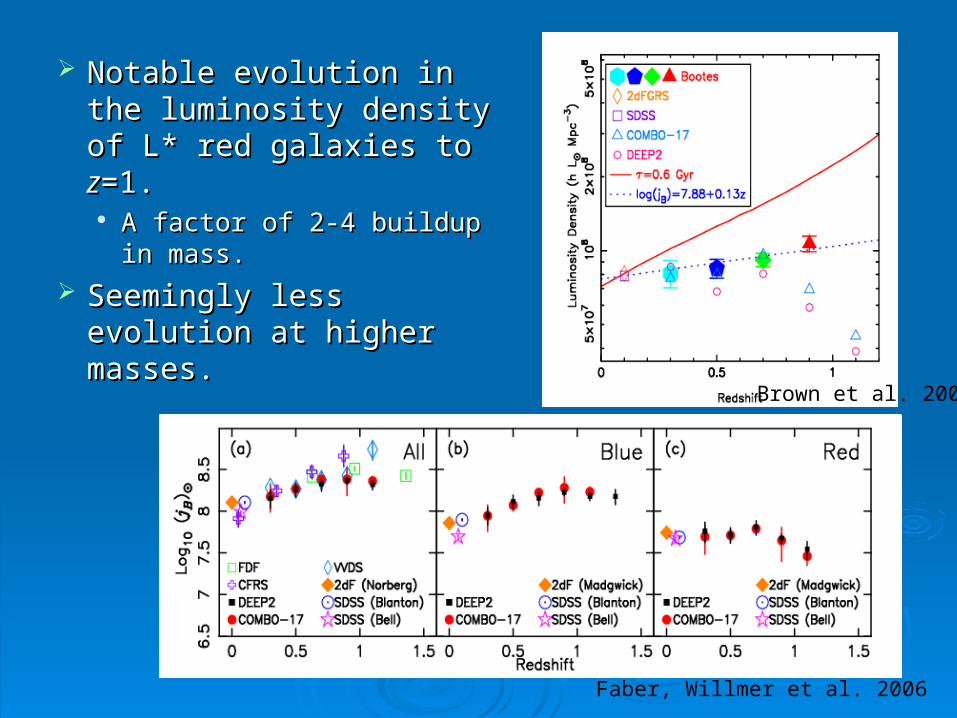
Notable evolution in the Notable evolution in the luminosity density of L* luminosity density of L* red galaxies to red galaxies to zz=1.=1. A factor of 2-4 buildup in A factor of 2-4 buildup in
mass.mass.
Seemingly less evolution Seemingly less evolution at higher masses.at higher masses.
Brown et al. 2006
Faber, Willmer et al. 2006
The AGN and Galaxy The AGN and Galaxy Evolution Survey (AGES)Evolution Survey (AGES)
AGES is a redshift AGES is a redshift survey with MMT survey with MMT Hectospec of the 9 degHectospec of the 9 deg22 NOAO Deep Wide-Field NOAO Deep Wide-Field Survey Bootes field.Survey Bootes field. IIcc<20 for galaxies.<20 for galaxies. IIcc<21.5 for AGN (22.5 in <21.5 for AGN (22.5 in
parts).parts). 20,000 redshifts.20,000 redshifts. Observations complete.Observations complete. ~3 mag fainter than ~3 mag fainter than
SDSS. SDSS.
Superb imagingSuperb imaging NDWFS NDWFS BBww, , RRcc, , IIcc to 25–26 to 25–26
mag.mag. NDWFS NDWFS KK to 19 Vega to 19 Vega FLAMEX FLAMEX JJ & & KK deeper over deeper over
half the fieldhalf the field Spitzer IRAC and MIPS Spitzer IRAC and MIPS
(similar to SWIRE depth).(similar to SWIRE depth). Chandra (5 ksec)Chandra (5 ksec) GALEX underway to 25 ABGALEX underway to 25 AB Radio dataRadio data
Who is AGES?Who is AGES?
PIs: Chris Kochanek, Daniel Eisenstein, Steve MurrayPIs: Chris Kochanek, Daniel Eisenstein, Steve Murray Special mention: Nelson Caldwell, Richard CoolSpecial mention: Nelson Caldwell, Richard Cool NDWFS: Brand, Brown, Dey, R. Green, JannuziNDWFS: Brand, Brown, Dey, R. Green, Jannuzi Chandra: P. Green, Jones-Forman, ShieldsChandra: P. Green, Jones-Forman, Shields IRAC: Brodwin, Eisenhardt, Fazio, J. Huang, Pahre, Stern IRAC: Brodwin, Eisenhardt, Fazio, J. Huang, Pahre, Stern MIPS/IRS: Dole, Egami, Le Floc'h, Kuraszkiewicz, MIPS/IRS: Dole, Egami, Le Floc'h, Kuraszkiewicz,
Papovich, Perez-Gonzalez, M. Rieke, Soifer, Weedman, Papovich, Perez-Gonzalez, M. Rieke, Soifer, Weedman, WillmerWillmer
SO/SAO: Fan, Falco, Huchra, Impey, Moustakas, ZaritskySO/SAO: Fan, Falco, Huchra, Impey, Moustakas, Zaritsky GALEX: Martin, HeckmanGALEX: Martin, Heckman OSU: Kollmeier, Watson OSU: Kollmeier, Watson
Redshift DistributionsRedshift Distributions
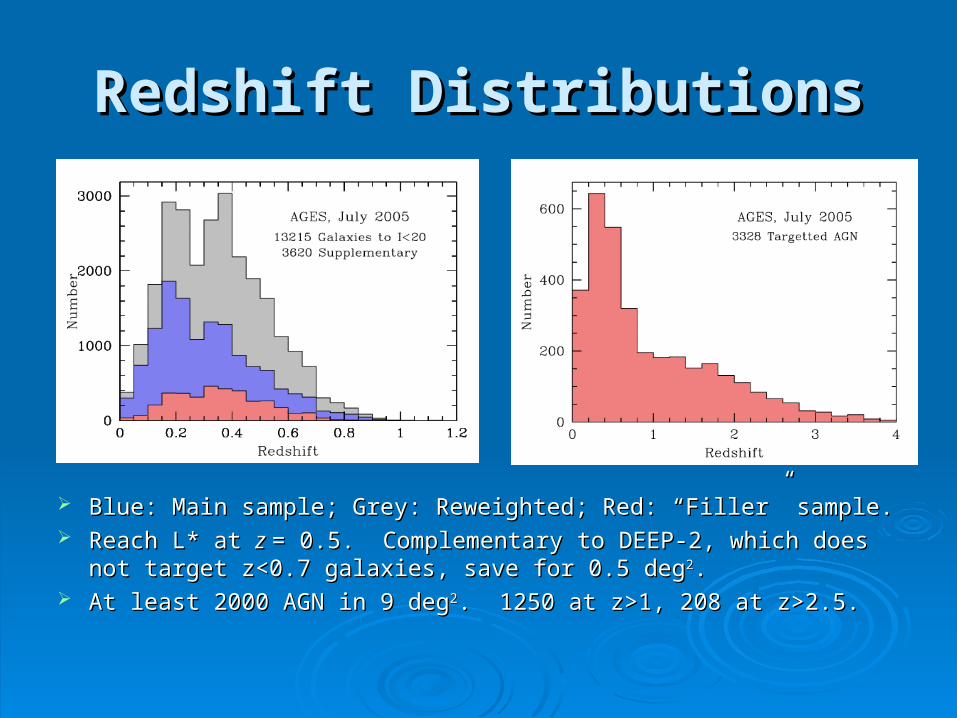
Blue: Main sample; Grey: Reweighted; Red: “Filler” sample.Blue: Main sample; Grey: Reweighted; Red: “Filler” sample. Reach L* at Reach L* at z z = 0.5. Complementary to DEEP-2, which does not = 0.5. Complementary to DEEP-2, which does not
target z<0.7 galaxies, save for 0.5 degtarget z<0.7 galaxies, save for 0.5 deg22.. At least 2000 AGN in 9 degAt least 2000 AGN in 9 deg22. 1250 at z>1, 208 at z>2.5.. 1250 at z>1, 208 at z>2.5.
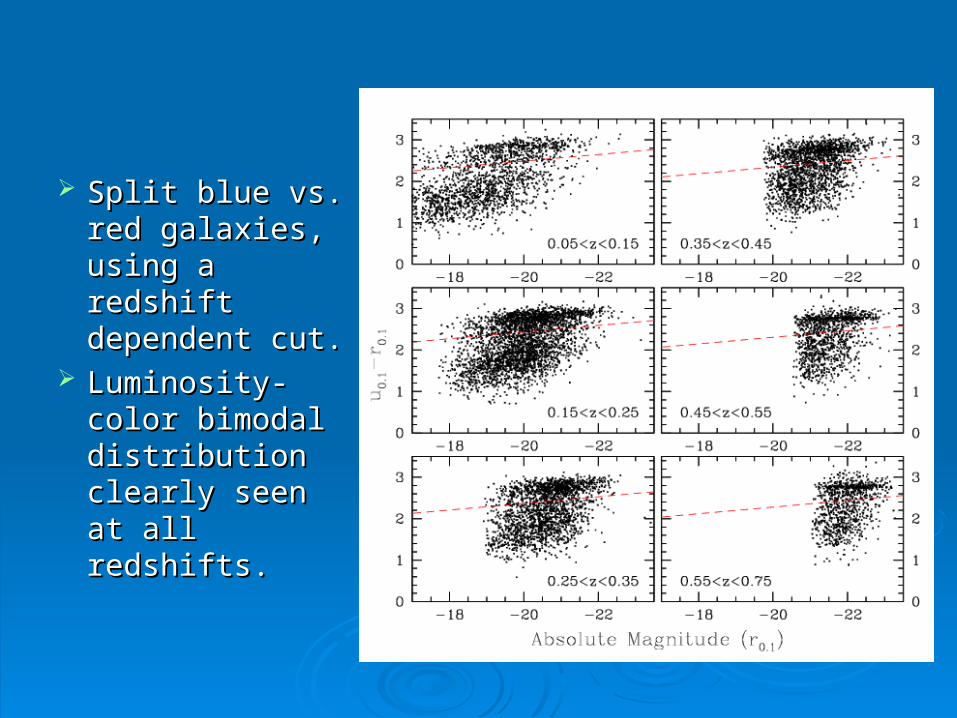
Split blue vs. Split blue vs. red galaxies, red galaxies, using a redshift using a redshift dependent cut.dependent cut.
Luminosity-Luminosity-color bimodal color bimodal distribution distribution clearly seen at clearly seen at all redshifts.all redshifts.
Red vs. Blue GalaxiesRed vs. Blue Galaxies
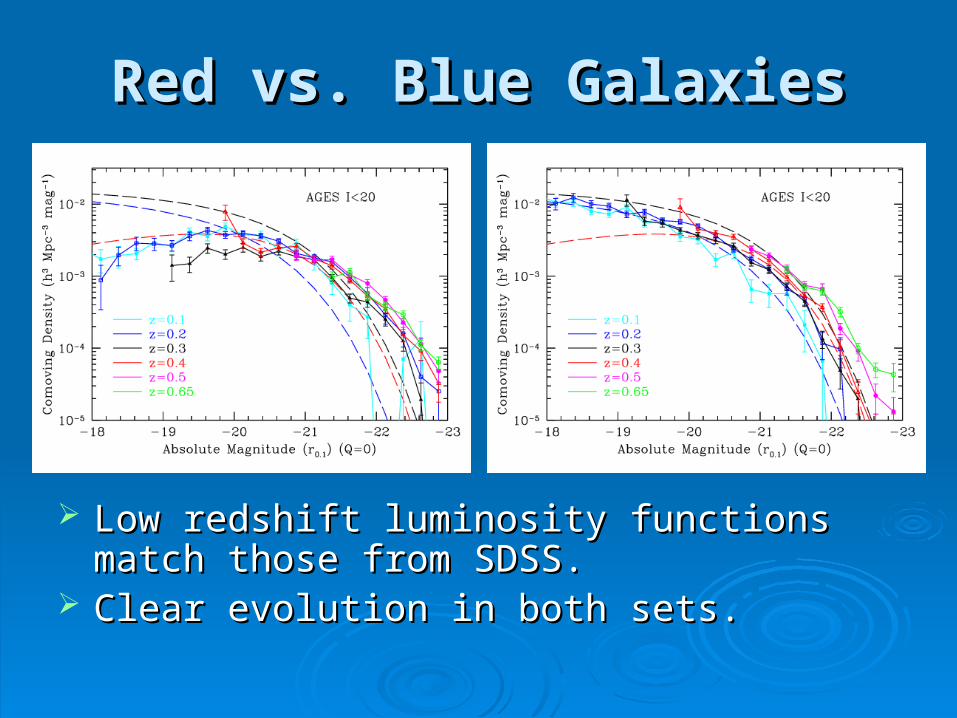
Low redshift luminosity functions match those Low redshift luminosity functions match those from SDSS.from SDSS.
Clear evolution in both sets.Clear evolution in both sets.
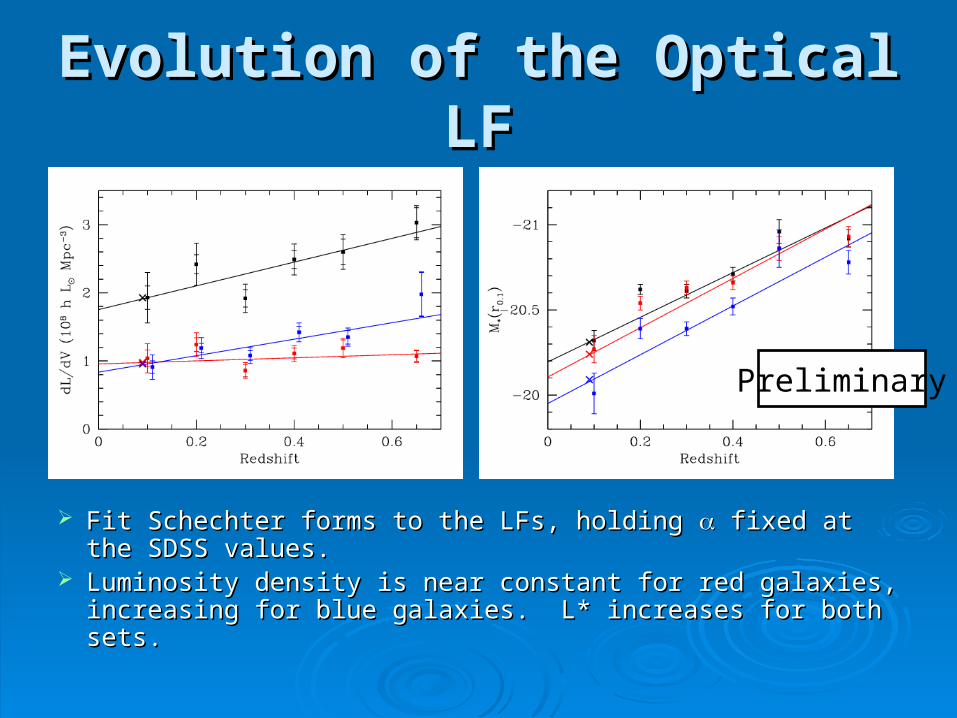
Evolution of the Optical LFEvolution of the Optical LF
Fit Schechter forms to the LFs, holding Fit Schechter forms to the LFs, holding fixed at the fixed at the SDSS values.SDSS values.
Luminosity density is near constant for red galaxies, Luminosity density is near constant for red galaxies, increasing for blue galaxies. L* increases for both sets.increasing for blue galaxies. L* increases for both sets.
Preliminary
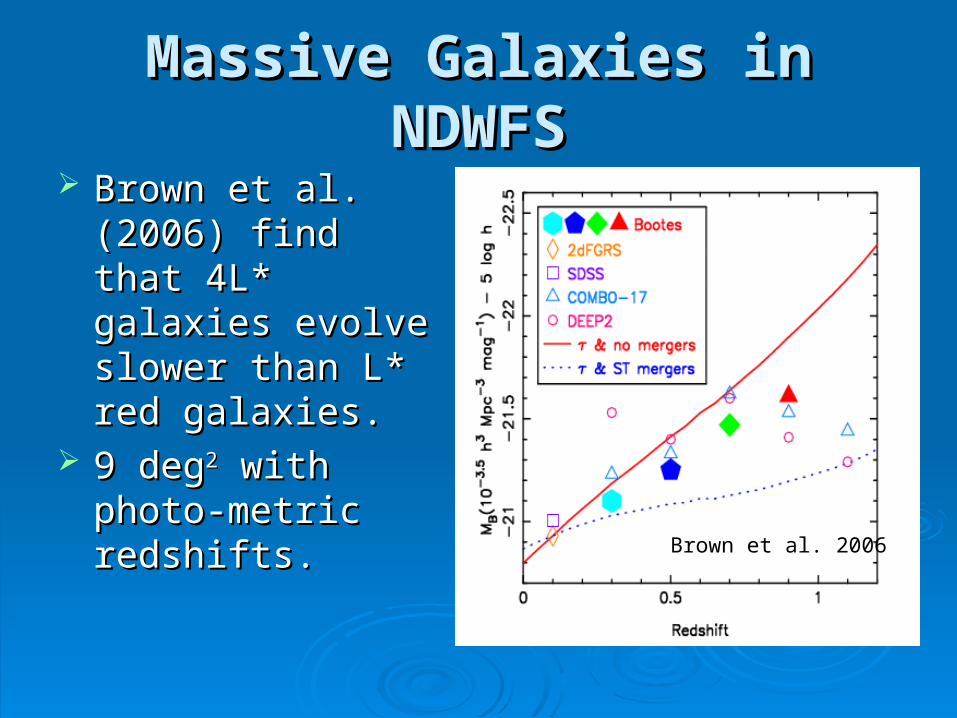
Massive Galaxies in NDWFSMassive Galaxies in NDWFS
Brown et al. (2006) Brown et al. (2006) find that 4L* galaxies find that 4L* galaxies evolve slower than evolve slower than L* red galaxies.L* red galaxies.
9 deg9 deg22 with photo- with photo-metric redshifts.metric redshifts.
Brown et al. 2006
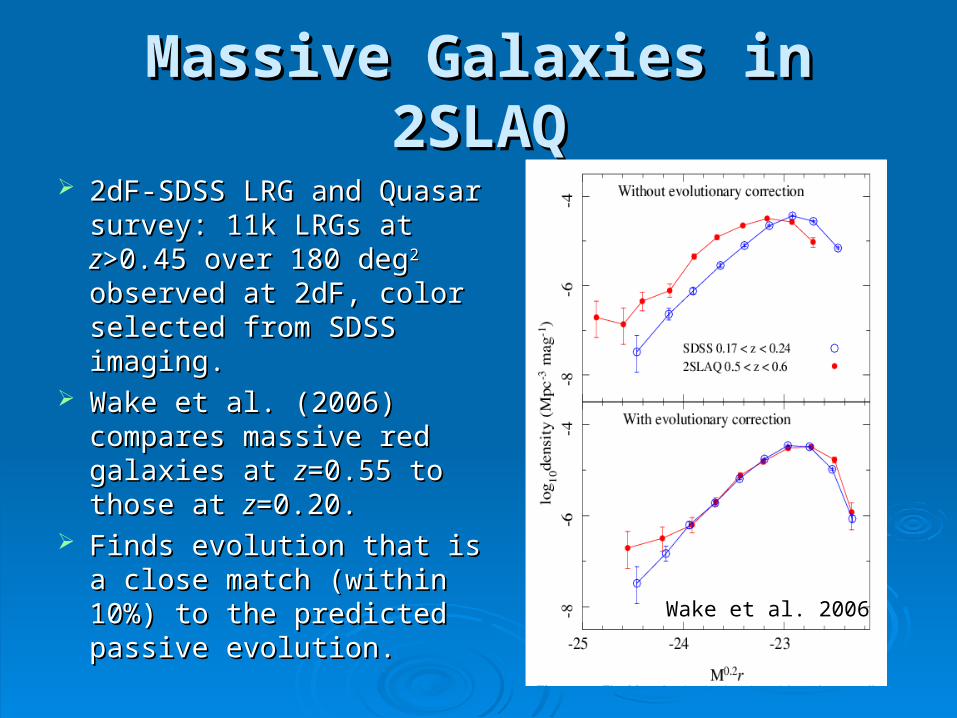
Massive Galaxies in 2SLAQMassive Galaxies in 2SLAQ
2dF-SDSS LRG and Quasar 2dF-SDSS LRG and Quasar survey: 11k LRGs at survey: 11k LRGs at zz>0.45 >0.45 over 180 degover 180 deg22 observed at observed at 2dF, color selected from 2dF, color selected from SDSS imaging.SDSS imaging.
Wake et al. (2006) compares Wake et al. (2006) compares massive red galaxies at massive red galaxies at zz=0.55 to those at =0.55 to those at zz=0.20.=0.20.
Finds evolution that is a Finds evolution that is a close match (within 10%) to close match (within 10%) to the predicted passive the predicted passive evolution. evolution.
Wake et al. 2006

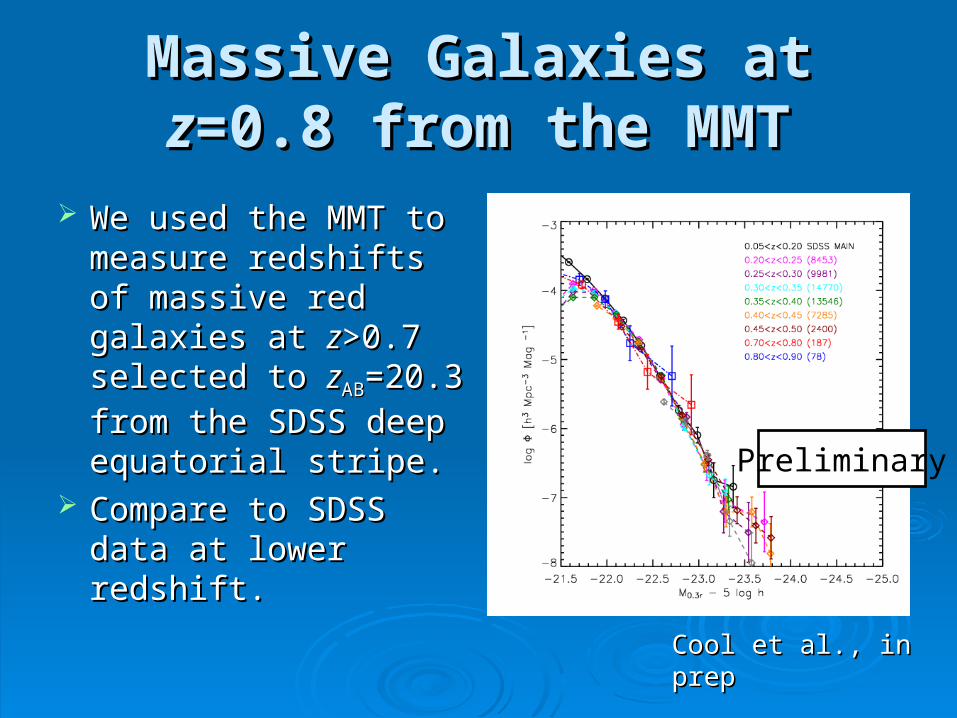
Massive Galaxies at Massive Galaxies at zz=0.8 =0.8 from the MMTfrom the MMT
We used the MMT to We used the MMT to measure redshifts of measure redshifts of massive red galaxies massive red galaxies at at zz>0.7 selected to >0.7 selected to zzABAB=20.3 from the =20.3 from the
SDSS deep equatorial SDSS deep equatorial stripe.stripe.
Compare to SDSS Compare to SDSS data at lower redshift.data at lower redshift.
Preliminary
Cool et al., in prepCool et al., in prep
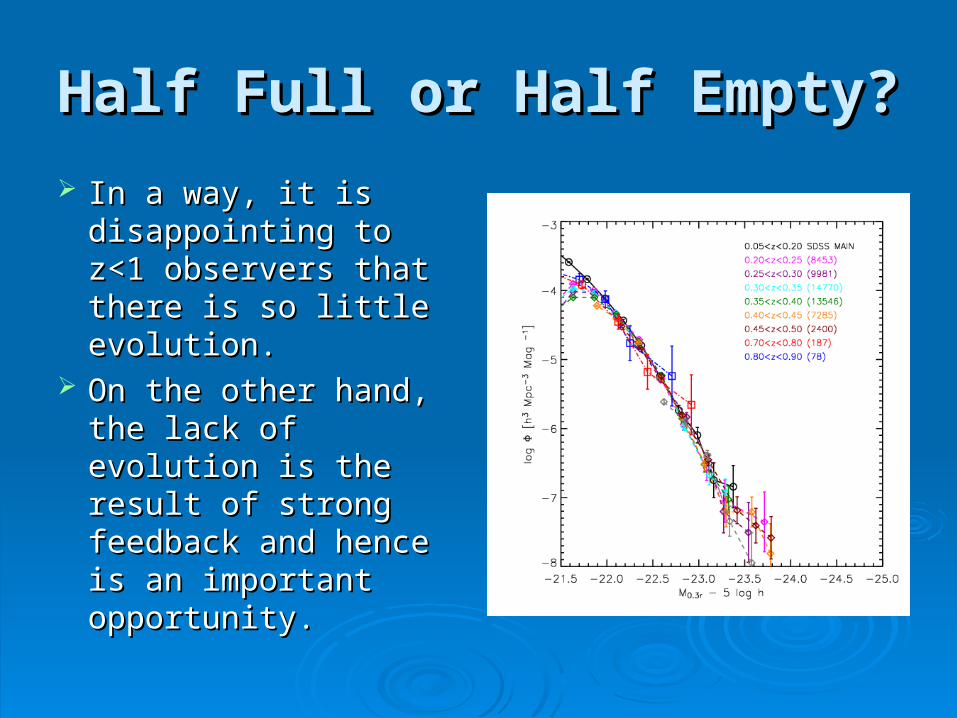
Half Full or Half Empty?Half Full or Half Empty?
In a way, it is In a way, it is disappointing to z<1 disappointing to z<1 observers that there observers that there is so little evolution.is so little evolution.
On the other hand, On the other hand, the lack of evolution is the lack of evolution is the result of strong the result of strong feedback and hence feedback and hence is an important is an important opportunity.opportunity.
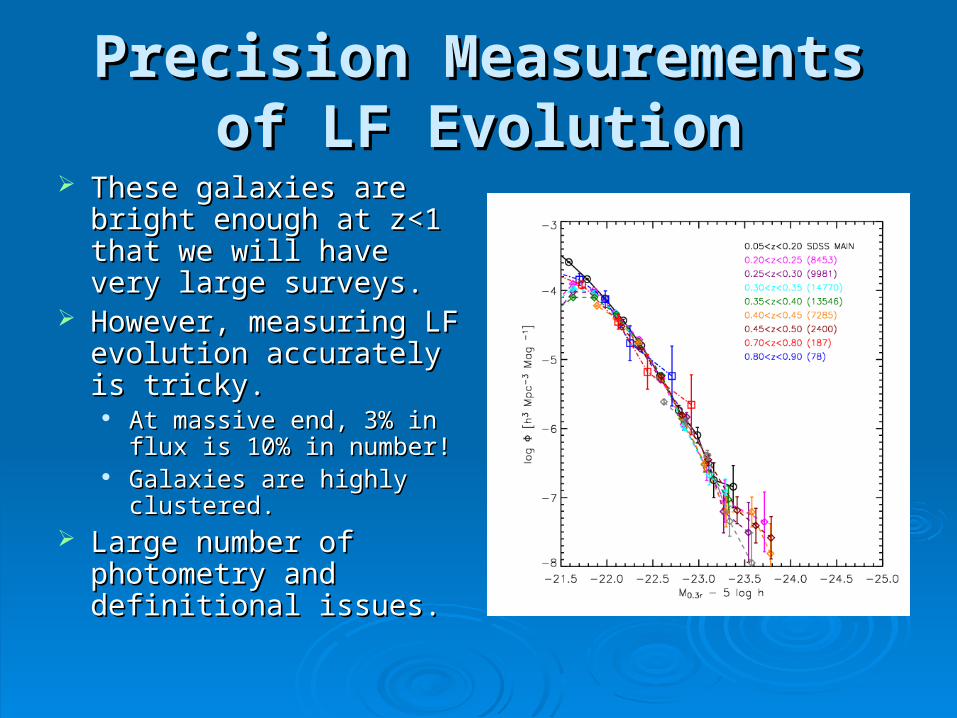
Precision Measurements of Precision Measurements of LF EvolutionLF Evolution
These galaxies are bright These galaxies are bright enough at z<1 that we will enough at z<1 that we will have very large surveys.have very large surveys.
However, measuring LF However, measuring LF evolution accurately is evolution accurately is tricky.tricky.
At massive end, 3% in flux At massive end, 3% in flux is 10% in number!is 10% in number!
Galaxies are highly Galaxies are highly clustered.clustered.
Large number of Large number of photometry and photometry and definitional issues.definitional issues.
Photometry MattersPhotometry Matters
These galaxies have extended profiles. Easy to have These galaxies have extended profiles. Easy to have mismatches in the photometry across redshift.mismatches in the photometry across redshift.
At low z, sky subtraction can be a problem. At low z, sky subtraction can be a problem. Note that the SDSS issues are with the pipeline photometry, not Note that the SDSS issues are with the pipeline photometry, not
the data itself, which is very flat.the data itself, which is very flat. At high z, surface brightness dimming and seeing are the At high z, surface brightness dimming and seeing are the
challenge.challenge. We should be embracing this and measuring the We should be embracing this and measuring the
luminosity function in sets of physical apertures.luminosity function in sets of physical apertures. If stars are being added, we'd like to know where.If stars are being added, we'd like to know where. Total magnitudes are not well defined anyways.Total magnitudes are not well defined anyways.
Need deep images to control these problems!Need deep images to control these problems!
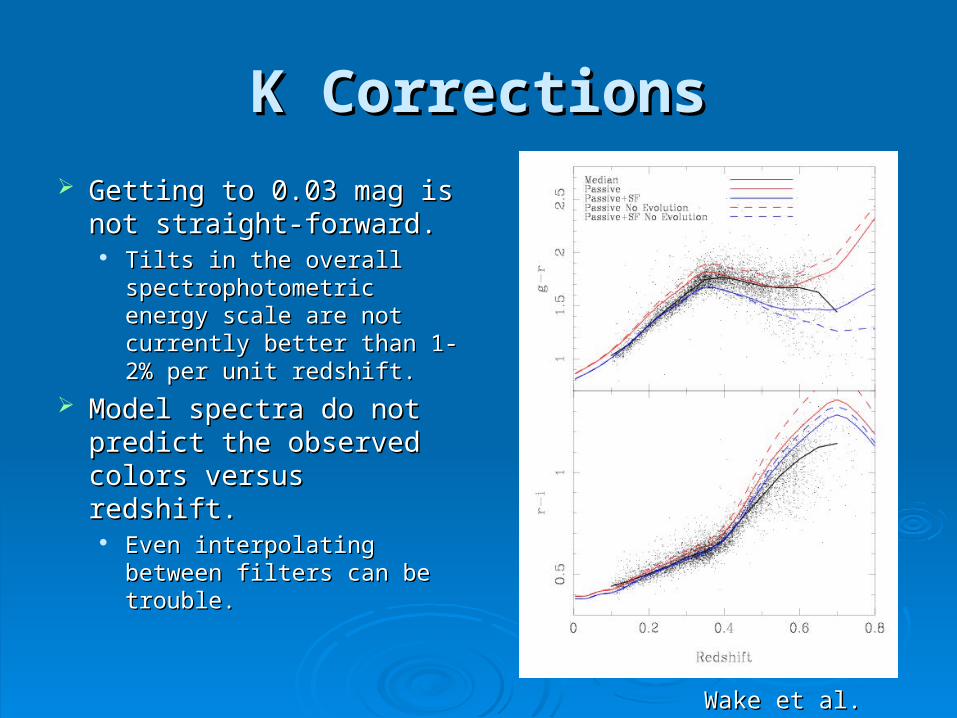
K CorrectionsK Corrections
Getting to 0.03 mag is not Getting to 0.03 mag is not straight-forward.straight-forward.
Tilts in the overall Tilts in the overall spectrophotometric energy spectrophotometric energy scale are not currently scale are not currently better than 1-2% per unit better than 1-2% per unit redshift.redshift.
Model spectra do not Model spectra do not predict the observed predict the observed colors versus redshift.colors versus redshift.
Even interpolating between Even interpolating between filters can be trouble.filters can be trouble.
Wake et al. (2006)Wake et al. (2006)
M/L Evolution Sample VarianceM/L Evolution Sample Variance
Even if we measure the Even if we measure the evolution in the luminosity evolution in the luminosity function to a few percent, function to a few percent, this doesn't give us the this doesn't give us the evolution of mass.evolution of mass.
"Passive evolution" "Passive evolution" doesn't predict change in doesn't predict change in luminosity to this luminosity to this precision.precision.
Variations in populations Variations in populations can probably confuse M/L can probably confuse M/L at this level.at this level.
These galaxies are highly These galaxies are highly clustered. Need about clustered. Need about 101088 h h–3–3 Mpc Mpc33 to get to 3% to get to 3% in number density.in number density.
About 100 degAbout 100 deg22 for for 0.6<z<1.0.0.6<z<1.0.
101044-10-1055 galaxies. galaxies.
This is highly feasible for This is highly feasible for both deep imaging and both deep imaging and spectroscopy.spectroscopy.
Red versus BlueRed versus Blue
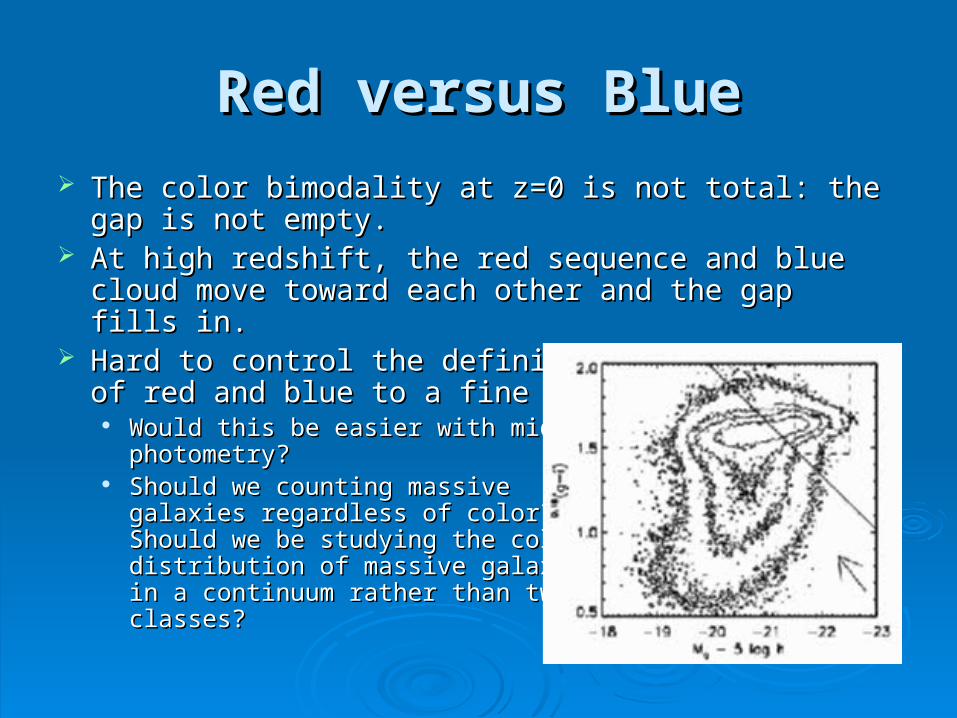
The color bimodality at z=0 is not total: the gap is not The color bimodality at z=0 is not total: the gap is not empty.empty.
At high redshift, the red sequence and blue cloud move At high redshift, the red sequence and blue cloud move toward each other and the gap fills in.toward each other and the gap fills in.
Hard to control the definition Hard to control the definition of red and blue to a fine level.of red and blue to a fine level.
Would this be easier with mid-UV Would this be easier with mid-UV photometry?photometry?
Should we counting massive Should we counting massive galaxies regardless of color? galaxies regardless of color? Should we be studying the color Should we be studying the color distribution of massive galaxies distribution of massive galaxies in a continuum rather than twoin a continuum rather than twoclasses?classes?
LF EvolutionLF Evolution
Reaching 10% precision or better errors on the Reaching 10% precision or better errors on the evolution of the massive galaxy LF is possible but will evolution of the massive galaxy LF is possible but will require considerably more attention.require considerably more attention.
Similar in precision to next-generation SNe dark energy Similar in precision to next-generation SNe dark energy experiments.experiments.
Important to hear from theory what level of precision is Important to hear from theory what level of precision is required to distinguish interesting models. Or what required to distinguish interesting models. Or what precision of prediction is possible.precision of prediction is possible.
Ultimately, the LF is a fairly blunt tool for determining Ultimately, the LF is a fairly blunt tool for determining the cause of this mild evolution? What other kinds of the cause of this mild evolution? What other kinds of data can we use?data can we use?
Small-scale CorrelationsSmall-scale Correlations
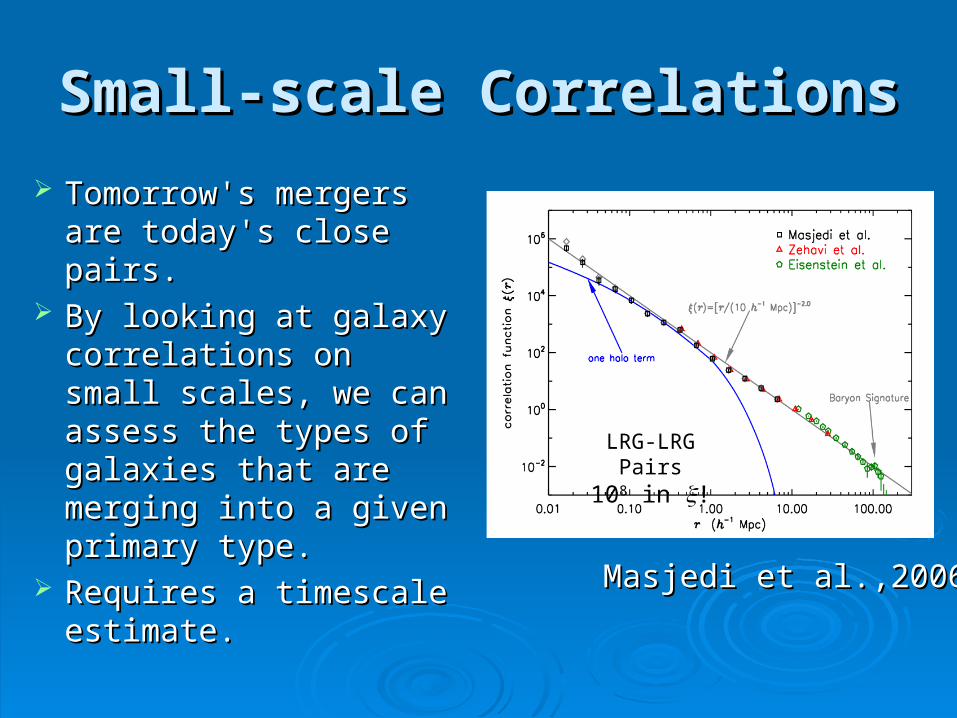
Tomorrow's mergers Tomorrow's mergers are today's close pairs.are today's close pairs.
By looking at galaxy By looking at galaxy correlations on small correlations on small scales, we can assess scales, we can assess the types of galaxies the types of galaxies that are merging into a that are merging into a given primary type. given primary type.
Requires a timescale Requires a timescale estimate.estimate.
LRG-LRG Pairs108 in !
Masjedi et al.,2006 Masjedi et al.,2006
Mergers to Massive GalaxiesMergers to Massive Galaxies
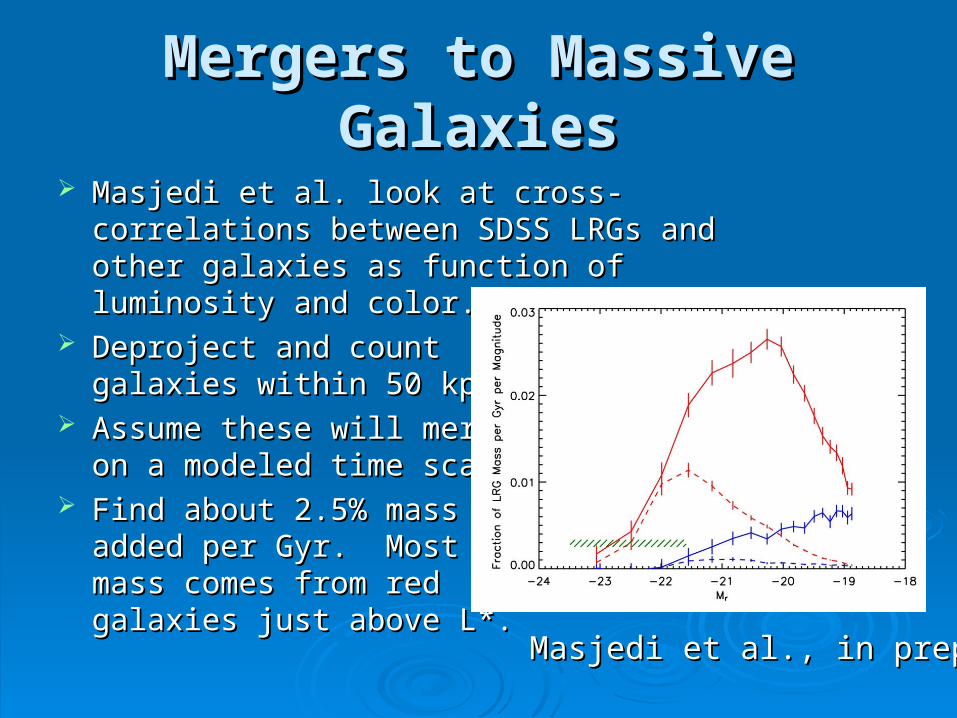
Masjedi et al. look at cross-correlations between Masjedi et al. look at cross-correlations between SDSS LRGs and other galaxies as function of SDSS LRGs and other galaxies as function of luminosity and color.luminosity and color.
Deproject and count Deproject and count galaxies within 50 kpc.galaxies within 50 kpc.
Assume these will merge Assume these will merge on a modeled time scale.on a modeled time scale.
Find about 2.5% mass Find about 2.5% mass added per Gyr. Most added per Gyr. Most mass comes from red mass comes from red galaxies just above L*.galaxies just above L*.
Masjedi et al., in prep. Masjedi et al., in prep.
Cross-correlationsCross-correlations
At small enough angles on the sky, nearly all At small enough angles on the sky, nearly all pairs are physically associated.pairs are physically associated. Of course, one must do background subtraction, but Of course, one must do background subtraction, but
the noise from the interlopers is sub-dominant.the noise from the interlopers is sub-dominant. This implies that one only needs one robust redshift in This implies that one only needs one robust redshift in
the pair.the pair. Angular correlations can be converted into true Angular correlations can be converted into true
spatial correlations.spatial correlations. There are flexible ways to do this, handling each There are flexible ways to do this, handling each
primary galaxy separately and coadding in any primary galaxy separately and coadding in any binning one wants.binning one wants.
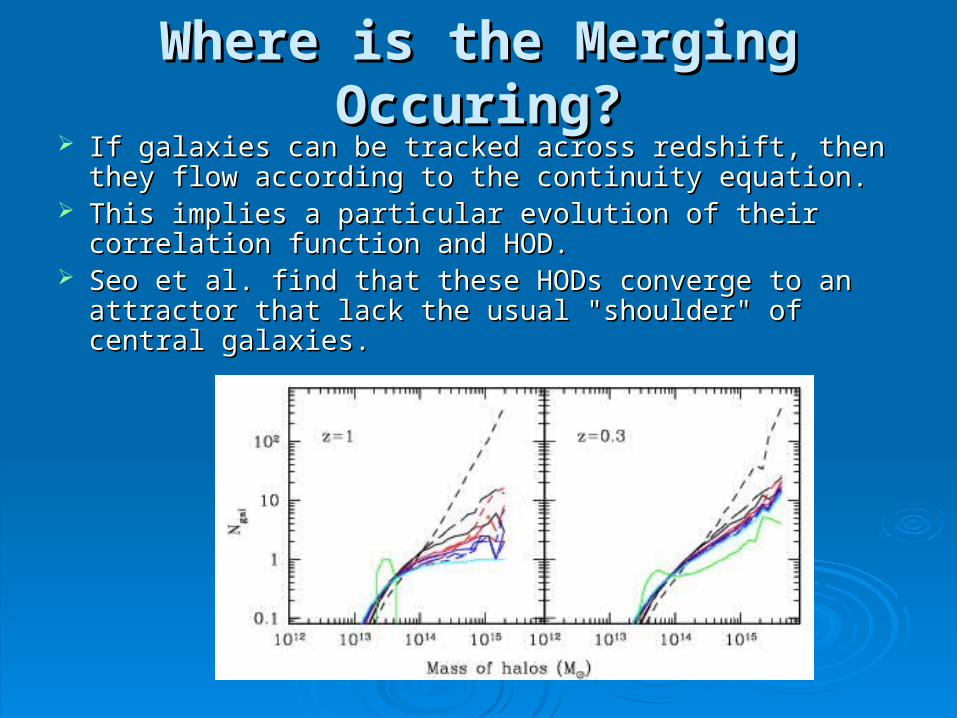
Where is the Merging Occuring?Where is the Merging Occuring? If galaxies can be tracked across redshift, then they flow If galaxies can be tracked across redshift, then they flow
according to the continuity equation.according to the continuity equation. This implies a particular evolution of their correlation This implies a particular evolution of their correlation
function and HOD.function and HOD. Seo et al. find that these HODs converge to an attractor Seo et al. find that these HODs converge to an attractor
that lack the usual "shoulder" of central galaxies. that lack the usual "shoulder" of central galaxies.
Environment-based Evolution Environment-based Evolution & Correlations& Correlations
If galaxies aren't passively evolving and we If galaxies aren't passively evolving and we preferentially alter galaxies in a particular preferentially alter galaxies in a particular environment, then this will show up in the environment, then this will show up in the correlation functions.correlation functions.
Galaxy correlations are measured extremely Galaxy correlations are measured extremely accurately in SDSS-sized samples (<2% in accurately in SDSS-sized samples (<2% in 88).).
The combination of weak lensing mass The combination of weak lensing mass measurements and auto-correlations are measurements and auto-correlations are particularly powerful.particularly powerful.
These are very stringent tests of a galaxy model These are very stringent tests of a galaxy model (but cosmology matters too).(but cosmology matters too).
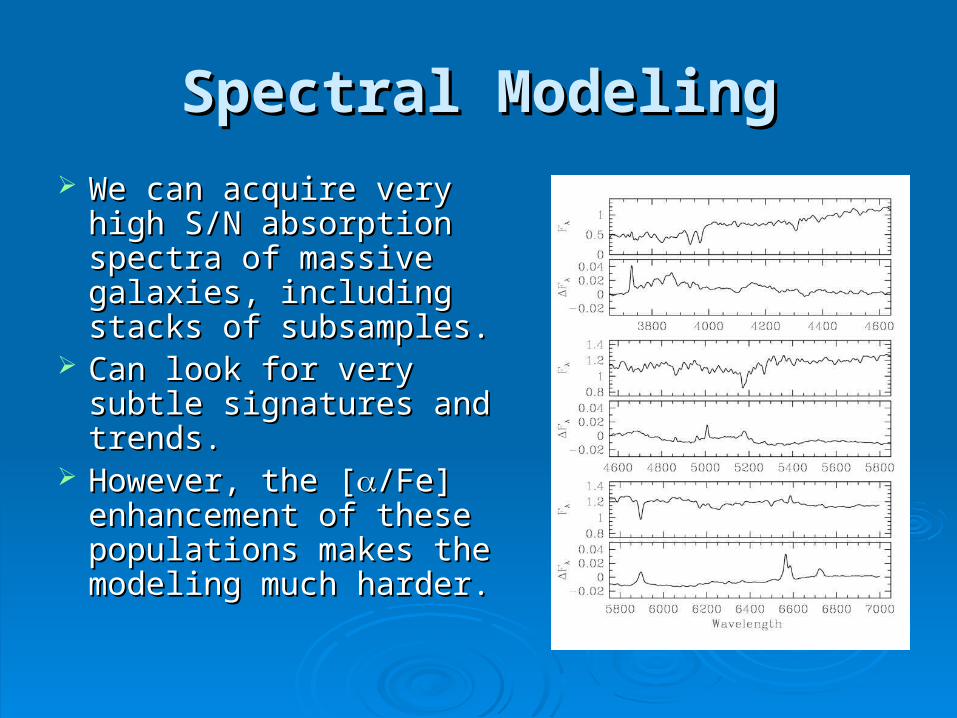
Spectral ModelingSpectral Modeling
We can acquire very We can acquire very high S/N absorption high S/N absorption spectra of massive spectra of massive galaxies, including galaxies, including stacks of subsamples.stacks of subsamples.
Can look for very subtle Can look for very subtle signatures and trends.signatures and trends.
However, the [However, the [/Fe] /Fe] enhancement of these enhancement of these populations makes the populations makes the modeling much harder. modeling much harder.
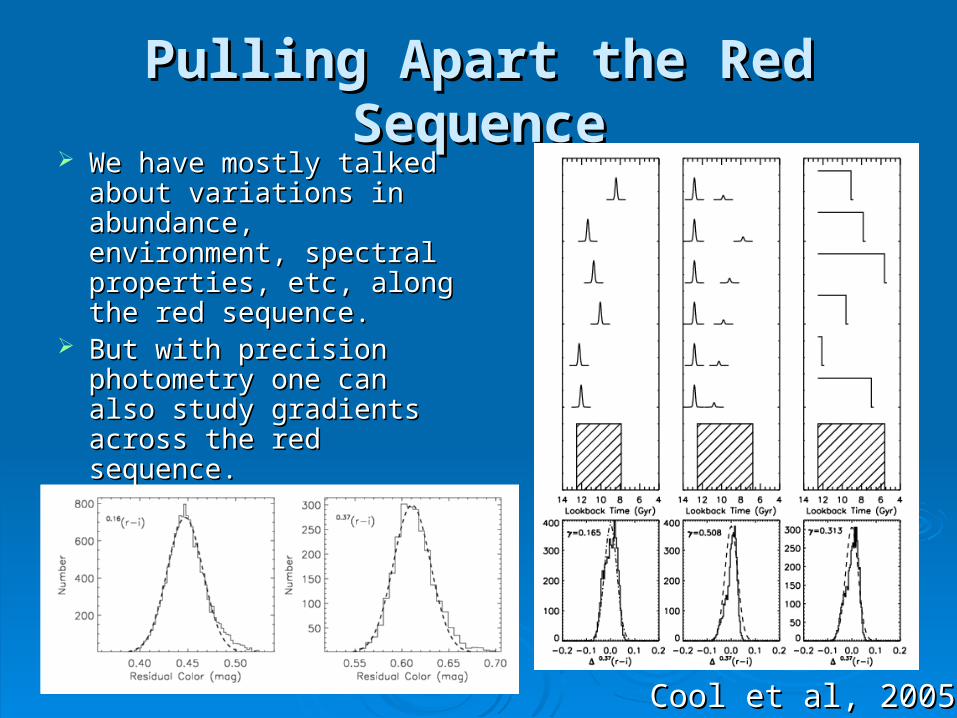
Pulling Apart the Red SequencePulling Apart the Red Sequence We have mostly talked We have mostly talked
about variations in about variations in abundance, environment, abundance, environment, spectral properties, etc, spectral properties, etc, along the red sequence.along the red sequence.
But with precision But with precision photometry one can also photometry one can also study gradients across study gradients across the red sequence.the red sequence.
Cool et al, 2005 Cool et al, 2005
Feedback?Feedback?
Can we find observational evidence for feedback Can we find observational evidence for feedback in massive galaxies?in massive galaxies? Correlations with radio, X-ray, environment?Correlations with radio, X-ray, environment? Spectral signatures?Spectral signatures?
Is this a Is this a zz<1 problem (for non-cluster <1 problem (for non-cluster environments)? Or is the halo gas already environments)? Or is the halo gas already “fluffed up” enough at “fluffed up” enough at zz>1?>1?
Is the answer the same at 10Is the answer the same at 101313 M Msunsun vs 10 vs 101515 M Msunsun??
ConclusionsConclusions Near-term surveys will yield fabulous data for the Near-term surveys will yield fabulous data for the
study of massive galaxies at study of massive galaxies at zz<1.<1. Near-IR wide-field imaging, giving way to Spitzer at Near-IR wide-field imaging, giving way to Spitzer at
zz~1.~1. New deep & wide optical imaging.New deep & wide optical imaging. Wide-field spectroscopy.Wide-field spectroscopy.
Likely to determine LF evolution, merging, Likely to determine LF evolution, merging, residual star formation, and halo masses to residual star formation, and halo masses to excellent precision. Set the stage for the more excellent precision. Set the stage for the more distinct evolution at distinct evolution at zz>1.>1.
Trickier task is proving why Trickier task is proving why zz<1 star formation is <1 star formation is truncated!truncated!

Sample VarianceSample Variance
These galaxies are highly These galaxies are highly clustered. Need about clustered. Need about 101088 h h–3–3 Mpc Mpc33 to get to 3% to get to 3% in number density.in number density. About 100 degAbout 100 deg22 for for
0.6<z<1.0.0.6<z<1.0. 101044-10-1055 galaxies. galaxies.
This is highly feasible for This is highly feasible for both deep imaging and both deep imaging and spectroscopy.spectroscopy.
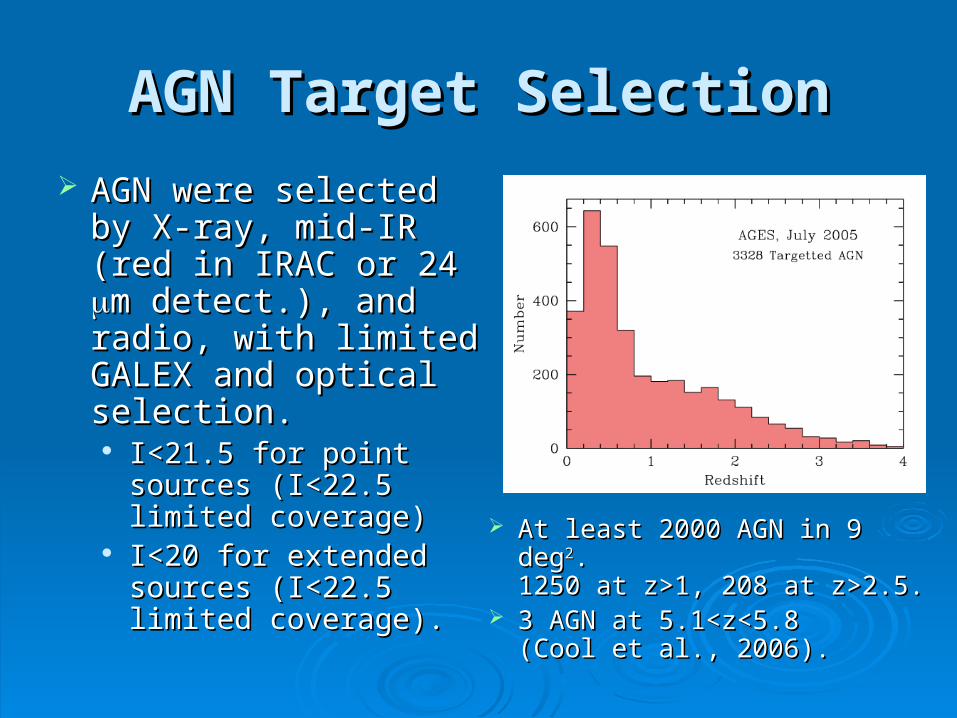
AGN Target SelectionAGN Target Selection
AGN were selected by AGN were selected by X-ray, mid-IR (red in X-ray, mid-IR (red in IRAC or 24 IRAC or 24 m m detect.), and radio, with detect.), and radio, with limited GALEX and limited GALEX and optical selection.optical selection. I<21.5 for point sources I<21.5 for point sources
(I<22.5 limited (I<22.5 limited coverage)coverage)
I<20 for extended I<20 for extended sources (I<22.5 limited sources (I<22.5 limited coverage).coverage).
At least 2000 AGN in 9 degAt least 2000 AGN in 9 deg22. . 1250 at z>1, 208 at z>2.5.1250 at z>1, 208 at z>2.5.
3 AGN at 5.1<z<5.8 3 AGN at 5.1<z<5.8 (Cool et al., 2006).(Cool et al., 2006).