haleakala highway haleakala national … highway haleakala national park maui, hawai’i...
TRANSCRIPT
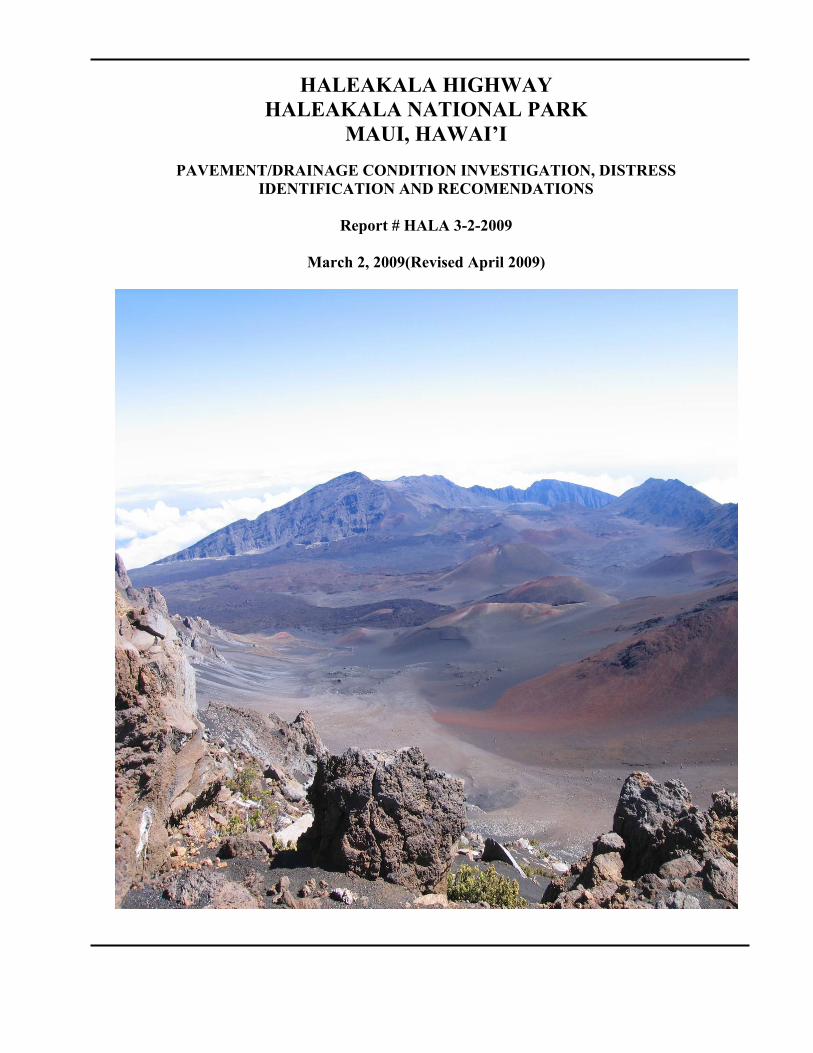
HALEAKALA HIGHWAY
HALEAKALA NATIONAL PARK MAUI, HAWAI’I
PAVEMENT/DRAINAGE CONDITION INVESTIGATION, DISTRESS
IDENTIFICATION AND RECOMENDATIONS
Report # HALA 3-2-2009
March 2, 2009(Revised April 2009)
Central Federal Lands Highway Division Haleakala Highway Haleakala Highway Report Haleakala National Park __________________________________________________________________________________________
3
TABLE OF CONTENTS
INTRODUCTION…………………………………....………….…………4 Haleakala National Park Advanced Technology Solar Telescope Project Chronology of Roadway. Rehabilitation and Structure construction Weather
INVESTIGATION…………………………………..…..….……………..8 Visual Pavement Condition Assessment Physical Pavement Investigation Pavement Layer Thicknesses Falling-weight Deflectometer(FWD) Analysis Drainage Structure Investigation Analysis and Summary
Traffic……………………………………………………………….……24
Visitation Traffic and ESALS Anticipated ATST Construction Traffic and ESALS
DISCUSSIONS AND RECOMMENDATONS……………….….……27
Pavement Section Metal and Concrete Box culvert Bridge Other Structures
SUMMARY………………………………………………..……….……32 APPENDICES………………………………………………..…….……33 A – Site Map B – Photos C – Vehicle Schema D – Soil Classification charts E - Summary of test results
Central Federal Lands Highway Division Haleakala Highway Haleakala Highway Report Haleakala National Park __________________________________________________________________________________________
4
1.0 INTRODUCTION
This report documents the follow-up comprehensive investigation to a previous pavement condition investigation report for the Haleakala Highway within the park boundary of Haleakala National Park. That report was entitled, Pavement Condition Investigation, Distress Identification and Recommendations, dated May 01, 2006 prepared by H. R. Marquez, Quality Assurance Specialist, FHWA/PWT. Some information contained in this report as needed, has been duplicated and updated from the 2006 report based on the information gathered during this investigation. The purpose of this investigation was to:
• Perform a visual evaluation of the existing pavement condition • Perform drainage structures evaluation as it pertains to exisiting damage and
condition of existing structures including “cover” over existing drainage structures. • Perform physical sampling and testing of existing pavement and underlying materials • Determine thickness and strength of existing pavement structural section • Assess the potential damage that could result from planned construction of the
Advanced Technology Solar Telescope (ATST) with respect to associated construction traffic on the Haleakala Highway within the park Boundary as described in subpart 1.2 Advanced Technology Solar Telescope(ATST) project
• Evaluate and assess the cause for present pavement failures and distresses---water pumping and water bleeding at numerous locations
• Review available information from previous roadway work
1.1 Haleakala National Park
Haleakala, originally part of Hawaii Volcanoes National Park, was re-designated as a separate entity in 01 July 1961. Haleakala National Park was designated an International Biosphere Reserve in 1980. As of 9/30/2008, Haleakala NP consists of 33,230.53 acres: 33,222.45 acres of Federal Land and 8.08 acres of Non-Federal Land.
Access to Haleakala National Park is via State Highway 377 and 378 also denoted on route maps as the Haleakala highway. The Haleakala Highway originates approximately 1.5 mile southeast of Kahului, Hawaii off of state highway 36, Hana highway. The Haleakala highway designation at this point is highway 37. The route traverses south to southeast to the junction of SH 37 and SH 377. At this point the route traverses north to south and is designated as state highway 377 to the junction of SH 377 and SH 378. Then the route traverses southeast to Haleakala National Park. The route within the park is sometimes referred to as the Haleakala Crater Road. The roadway within the park is a two-lane highway approximately 22-foot wide with steep grades (5%-7%) and nine (9) switchbacks. The road was originally constructed between 1933-1935 and has under gone numerous reconstruction phases since then consisting of roadway widening, installation of metal and concrete box culvert extensions, pulverization
Central Federal Lands Highway Division Haleakala Highway Haleakala Highway Report Haleakala National Park __________________________________________________________________________________________
5
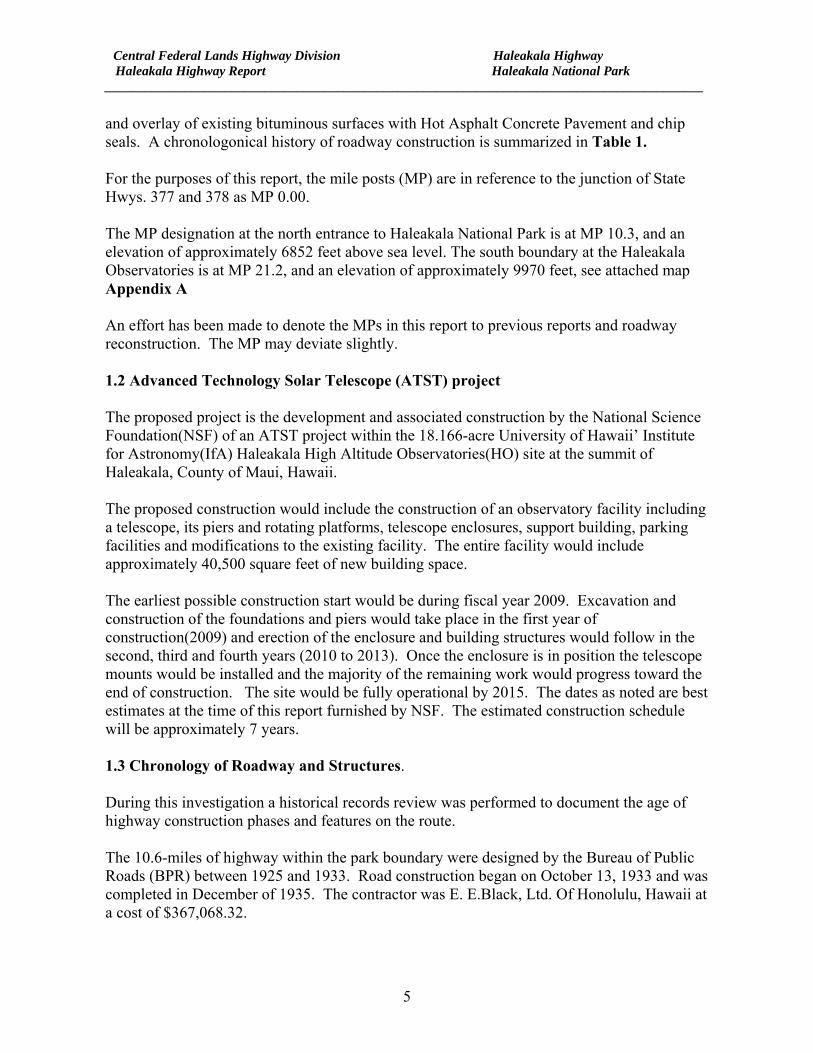
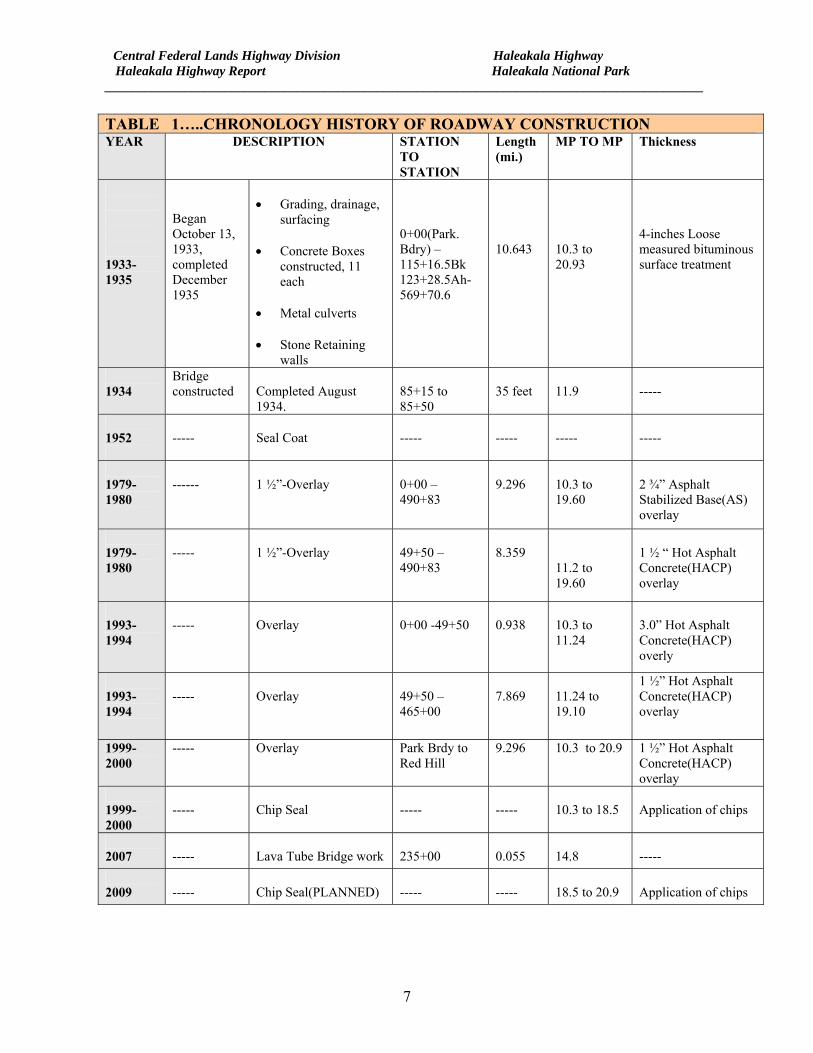
and overlay of existing bituminous surfaces with Hot Asphalt Concrete Pavement and chip seals. A chronologonical history of roadway construction is summarized in Table 1. For the purposes of this report, the mile posts (MP) are in reference to the junction of State Hwys. 377 and 378 as MP 0.00. The MP designation at the north entrance to Haleakala National Park is at MP 10.3, and an elevation of approximately 6852 feet above sea level. The south boundary at the Haleakala Observatories is at MP 21.2, and an elevation of approximately 9970 feet, see attached map Appendix A An effort has been made to denote the MPs in this report to previous reports and roadway reconstruction. The MP may deviate slightly. 1.2 Advanced Technology Solar Telescope (ATST) project The proposed project is the development and associated construction by the National Science Foundation(NSF) of an ATST project within the 18.166-acre University of Hawaii’ Institute for Astronomy(IfA) Haleakala High Altitude Observatories(HO) site at the summit of Haleakala, County of Maui, Hawaii. The proposed construction would include the construction of an observatory facility including a telescope, its piers and rotating platforms, telescope enclosures, support building, parking facilities and modifications to the existing facility. The entire facility would include approximately 40,500 square feet of new building space. The earliest possible construction start would be during fiscal year 2009. Excavation and construction of the foundations and piers would take place in the first year of construction(2009) and erection of the enclosure and building structures would follow in the second, third and fourth years (2010 to 2013). Once the enclosure is in position the telescope mounts would be installed and the majority of the remaining work would progress toward the end of construction. The site would be fully operational by 2015. The dates as noted are best estimates at the time of this report furnished by NSF. The estimated construction schedule will be approximately 7 years. 1.3 Chronology of Roadway and Structures. During this investigation a historical records review was performed to document the age of highway construction phases and features on the route. The 10.6-miles of highway within the park boundary were designed by the Bureau of Public Roads (BPR) between 1925 and 1933. Road construction began on October 13, 1933 and was completed in December of 1935. The contractor was E. E.Black, Ltd. Of Honolulu, Hawaii at a cost of $367,068.32.
Central Federal Lands Highway Division Haleakala Highway Haleakala Highway Report Haleakala National Park __________________________________________________________________________________________
6
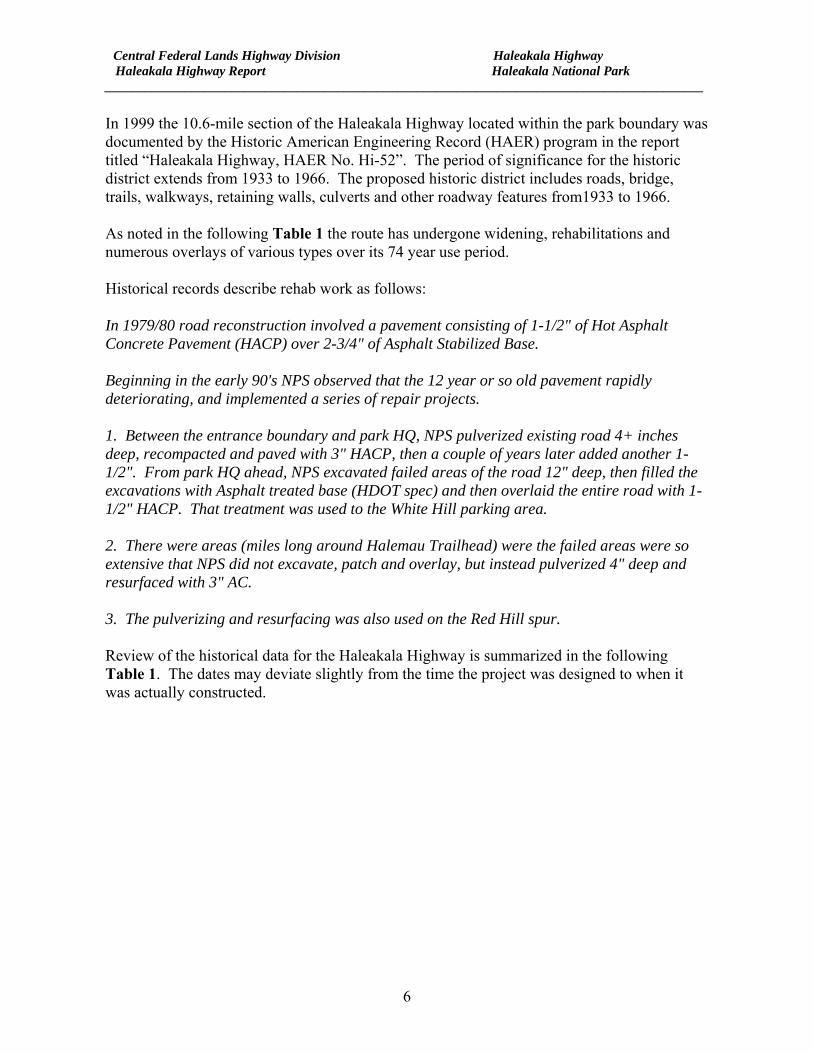
In 1999 the 10.6-mile section of the Haleakala Highway located within the park boundary was documented by the Historic American Engineering Record (HAER) program in the report titled “Haleakala Highway, HAER No. Hi-52”. The period of significance for the historic district extends from 1933 to 1966. The proposed historic district includes roads, bridge, trails, walkways, retaining walls, culverts and other roadway features from1933 to 1966. As noted in the following Table 1 the route has undergone widening, rehabilitations and numerous overlays of various types over its 74 year use period. Historical records describe rehab work as follows: In 1979/80 road reconstruction involved a pavement consisting of 1-1/2" of Hot Asphalt Concrete Pavement (HACP) over 2-3/4" of Asphalt Stabilized Base. Beginning in the early 90's NPS observed that the 12 year or so old pavement rapidly deteriorating, and implemented a series of repair projects. 1. Between the entrance boundary and park HQ, NPS pulverized existing road 4+ inches deep, recompacted and paved with 3" HACP, then a couple of years later added another 1-1/2". From park HQ ahead, NPS excavated failed areas of the road 12" deep, then filled the excavations with Asphalt treated base (HDOT spec) and then overlaid the entire road with 1-1/2" HACP. That treatment was used to the White Hill parking area. 2. There were areas (miles long around Halemau Trailhead) were the failed areas were so extensive that NPS did not excavate, patch and overlay, but instead pulverized 4" deep and resurfaced with 3" AC. 3. The pulverizing and resurfacing was also used on the Red Hill spur. Review of the historical data for the Haleakala Highway is summarized in the following Table 1. The dates may deviate slightly from the time the project was designed to when it was actually constructed.
Central Federal Lands Highway Division Haleakala Highway Haleakala Highway Report Haleakala National Park __________________________________________________________________________________________
7
TABLE 1…..CHRONOLOGY HISTORY OF ROADWAY CONSTRUCTION YEAR DESCRIPTION STATION
TO STATION
Length (mi.)
MP TO MP Thickness
1933-1935
Began October 13, 1933, completed December 1935
• Grading, drainage,
surfacing • Concrete Boxes
constructed, 11 each
• Metal culverts • Stone Retaining
walls
0+00(Park. Bdry) – 115+16.5Bk 123+28.5Ah-569+70.6
10.643
10.3 to 20.93
4-inches Loose measured bituminous surface treatment
1934
Bridge constructed
Completed August 1934.
85+15 to 85+50
35 feet
11.9
-----
1952
-----
Seal Coat
-----
-----
-----
-----
1979-1980
------
1 ½”-Overlay
0+00 – 490+83
9.296
10.3 to 19.60
2 ¾” Asphalt Stabilized Base(AS) overlay
1979-1980
-----
1 ½”-Overlay
49+50 – 490+83
8.359
11.2 to 19.60
1 ½ “ Hot Asphalt Concrete(HACP) overlay
1993-1994
-----
Overlay
0+00 -49+50
0.938
10.3 to 11.24
3.0” Hot Asphalt Concrete(HACP) overly
1993-1994
-----
Overlay
49+50 – 465+00
7.869
11.24 to 19.10
1 ½” Hot Asphalt Concrete(HACP) overlay
1999-2000
----- Overlay Park Brdy to Red Hill
9.296 10.3 to 20.9 1 ½” Hot Asphalt Concrete(HACP) overlay
1999-2000
-----
Chip Seal
-----
-----
10.3 to 18.5
Application of chips
2007
-----
Lava Tube Bridge work
235+00
0.055
14.8
-----
2009
-----
Chip Seal(PLANNED)
-----
-----
18.5 to 20.9
Application of chips
Central Federal Lands Highway Division Haleakala Highway Haleakala Highway Report Haleakala National Park __________________________________________________________________________________________
8
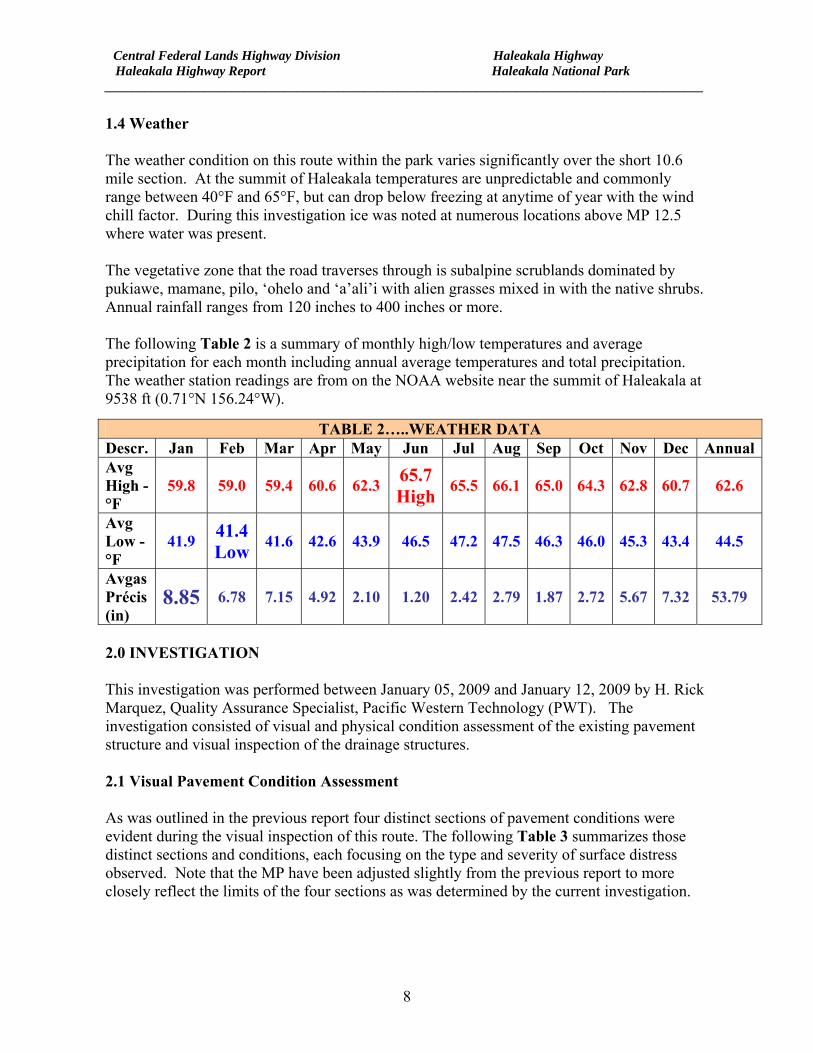
1.4 Weather The weather condition on this route within the park varies significantly over the short 10.6 mile section. At the summit of Haleakala temperatures are unpredictable and commonly range between 40°F and 65°F, but can drop below freezing at anytime of year with the wind chill factor. During this investigation ice was noted at numerous locations above MP 12.5 where water was present. The vegetative zone that the road traverses through is subalpine scrublands dominated by pukiawe, mamane, pilo, ‘ohelo and ‘a’ali’i with alien grasses mixed in with the native shrubs. Annual rainfall ranges from 120 inches to 400 inches or more. The following Table 2 is a summary of monthly high/low temperatures and average precipitation for each month including annual average temperatures and total precipitation. The weather station readings are from on the NOAA website near the summit of Haleakala at 9538 ft (0.71°N 156.24°W).
2.0 INVESTIGATION This investigation was performed between January 05, 2009 and January 12, 2009 by H. Rick Marquez, Quality Assurance Specialist, Pacific Western Technology (PWT). The investigation consisted of visual and physical condition assessment of the existing pavement structure and visual inspection of the drainage structures. 2.1 Visual Pavement Condition Assessment As was outlined in the previous report four distinct sections of pavement conditions were evident during the visual inspection of this route. The following Table 3 summarizes those distinct sections and conditions, each focusing on the type and severity of surface distress observed. Note that the MP have been adjusted slightly from the previous report to more closely reflect the limits of the four sections as was determined by the current investigation.
TABLE 2…..WEATHER DATA Descr. Jan Feb Mar Apr May Jun Jul Aug Sep Oct Nov Dec AnnualAvg High - °F
59.8 59.0 59.4 60.6 62.3 65.7 High 65.5 66.1 65.0 64.3 62.8 60.7
62.6
Avg Low - °F
41.9 41.4 Low
41.6 42.6 43.9 46.5 47.2 47.5 46.3 46.0 45.3 43.4 44.5
Avgas Précis (in)
8.85 6.78 7.15 4.92 2.10 1.20 2.42 2.79 1.87 2.72 5.67 7.32
53.79
Central Federal Lands Highway Division Haleakala Highway Haleakala Highway Report Haleakala National Park __________________________________________________________________________________________
9
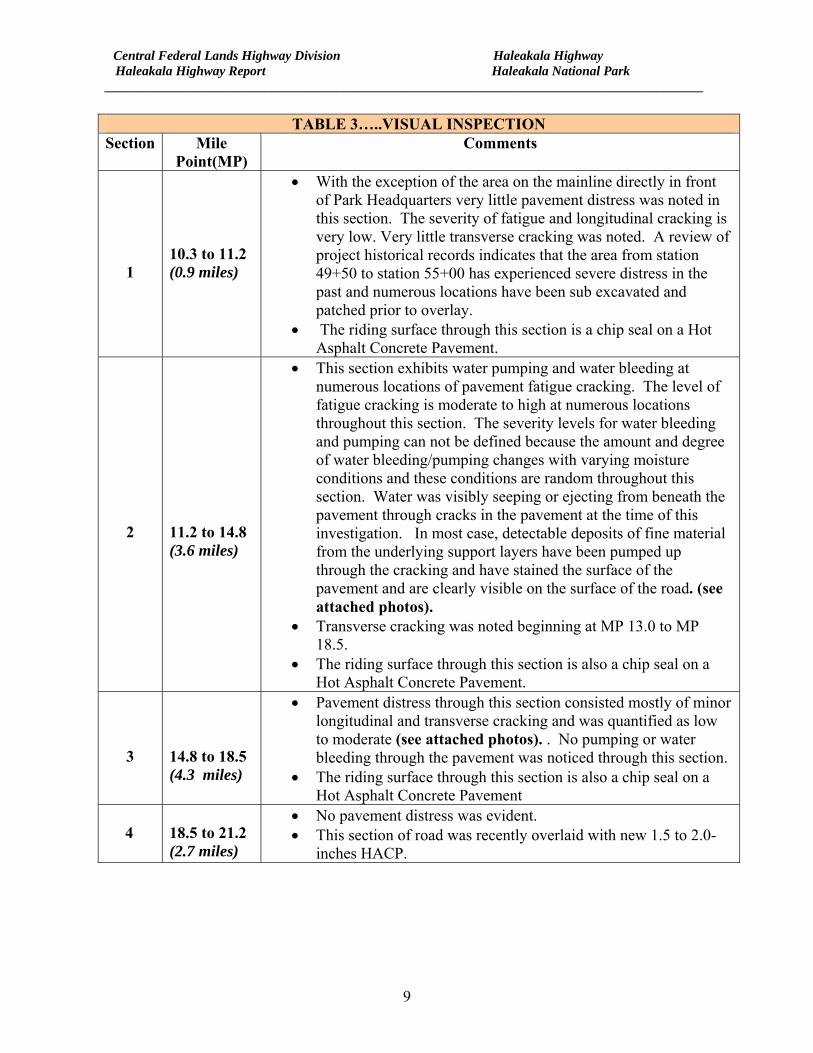
TABLE 3…..VISUAL INSPECTION
Section Mile Point(MP)
Comments
1
10.3 to 11.2 (0.9 miles)
• With the exception of the area on the mainline directly in front of Park Headquarters very little pavement distress was noted in this section. The severity of fatigue and longitudinal cracking is very low. Very little transverse cracking was noted. A review of project historical records indicates that the area from station 49+50 to station 55+00 has experienced severe distress in the past and numerous locations have been sub excavated and patched prior to overlay.
• The riding surface through this section is a chip seal on a Hot Asphalt Concrete Pavement.
2
11.2 to 14.8 (3.6 miles)
• This section exhibits water pumping and water bleeding at numerous locations of pavement fatigue cracking. The level of fatigue cracking is moderate to high at numerous locations throughout this section. The severity levels for water bleeding and pumping can not be defined because the amount and degree of water bleeding/pumping changes with varying moisture conditions and these conditions are random throughout this section. Water was visibly seeping or ejecting from beneath the pavement through cracks in the pavement at the time of this investigation. In most case, detectable deposits of fine material from the underlying support layers have been pumped up through the cracking and have stained the surface of the pavement and are clearly visible on the surface of the road. (see attached photos).
• Transverse cracking was noted beginning at MP 13.0 to MP 18.5.
• The riding surface through this section is also a chip seal on a Hot Asphalt Concrete Pavement.
3
14.8 to 18.5 (4.3 miles)
• Pavement distress through this section consisted mostly of minor longitudinal and transverse cracking and was quantified as low to moderate (see attached photos). . No pumping or water bleeding through the pavement was noticed through this section.
• The riding surface through this section is also a chip seal on a Hot Asphalt Concrete Pavement
4
18.5 to 21.2 (2.7 miles)
• No pavement distress was evident. • This section of road was recently overlaid with new 1.5 to 2.0-
inches HACP.
Central Federal Lands Highway Division Haleakala Highway Haleakala Highway Report Haleakala National Park __________________________________________________________________________________________
10
It is evident that the existing roadway does not have adequate drainage particularly in the area from MP 11.2 to 14.8 and this is contributing to the numerous failures that are occurring in this section. The roadway ditch flowline elevation in many instances is at or very near to the same elevation as the roadway pavement allowing water to enter the underlying materials very easily. The soils throughout the route are highly permeable allowing water to freely flow into the subgrade. In addition to poor drainage this section of roadway appears to receive more precipitation than the rest of the route. It is recommended that future rehabilitation work on this route address improved drainage measures particularly in this section. 2.2 Physical Pavement Investigation Roadway physical investigations were performed as proposed between MP 10.3 to 21.2 in both the uphill and downhill lanes of the route. The physical investigation consisted of:
1. Auguring through the existing pavement surface to determine thickness of pavement and base layer.
2. Obtain samples of underlying materials for testing to determine soil strengths using California Bearing Ratio test method--Soaked
3. Perform Falling weight deflectmeter analysis The Falling Weight Deflectometer (FWD) survey was performed on January 5 & 6, 2009 by HDOT using their Dynatest machine. Auguring through the existing surface for thickness measurements and sampling was performed by Island Geotechnical, Maui. Testing of soil samples was performed by Geolabs, Maui 2.2.1 Pavement and base layer thickness
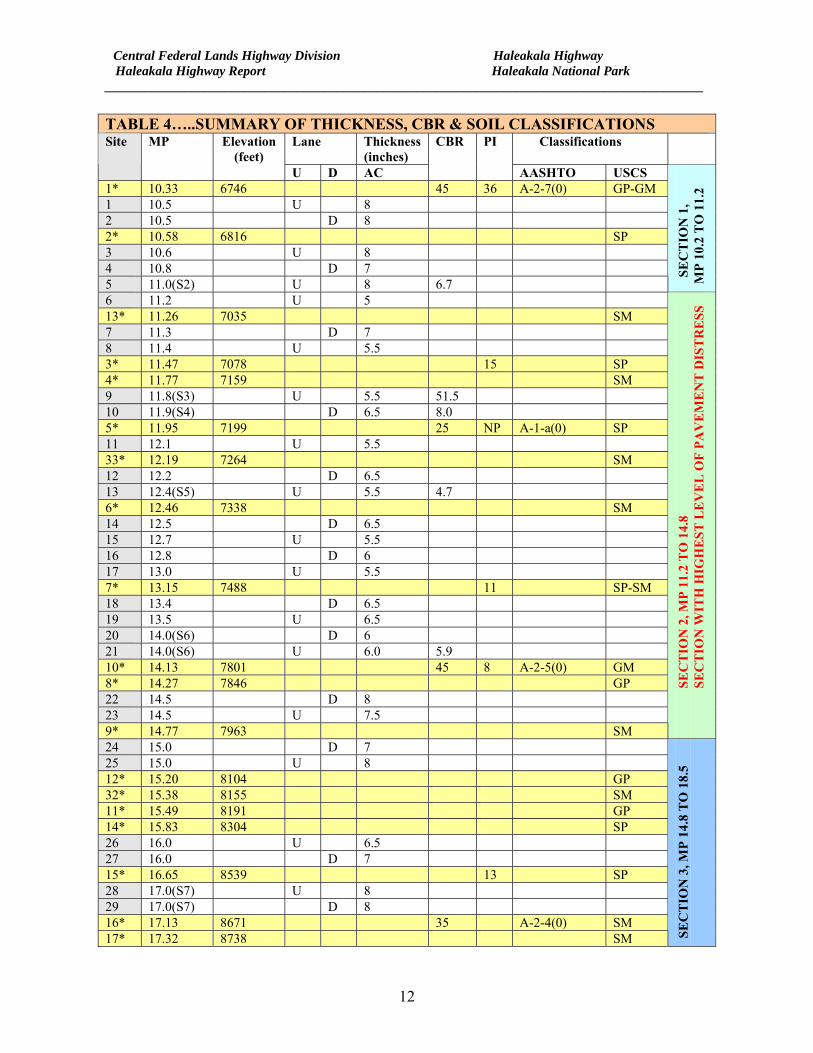
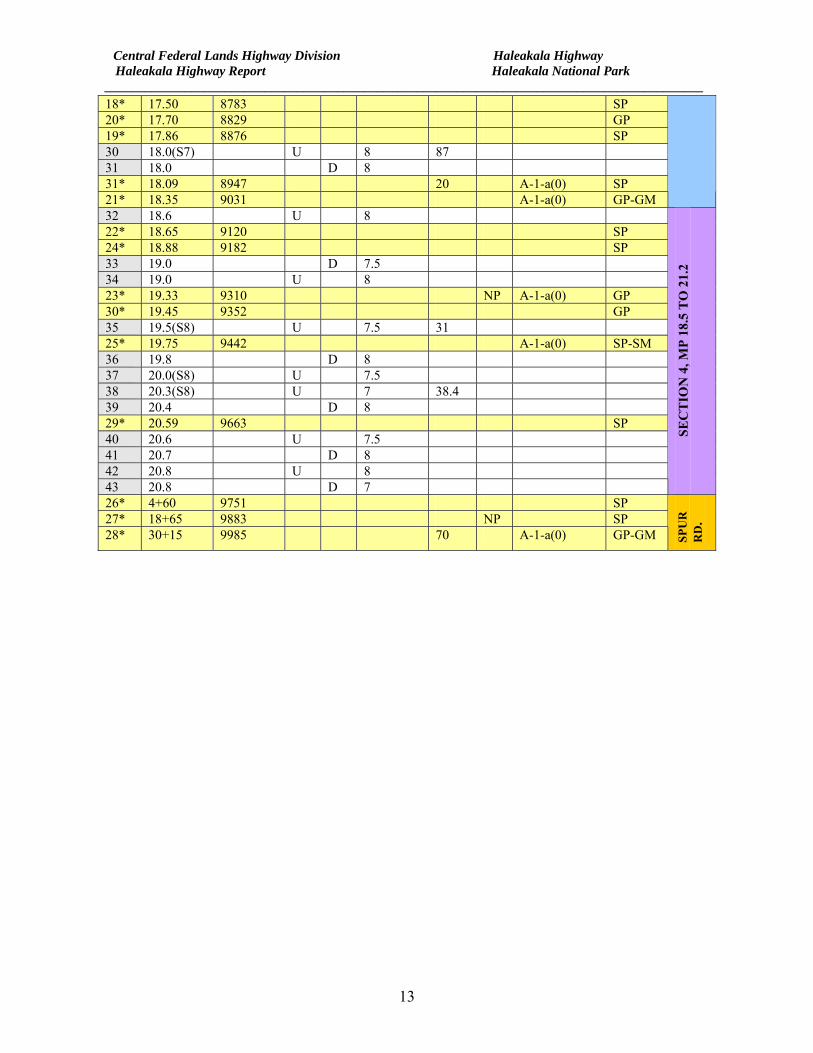
Pavement thicknesses are summarized in Table 4. The thickness indicated in this table indicates total thickness of bituminous treated materials measured at each hole location.
Table notations:
• Site = numerical numbering of MP locations • Location, (MP = mile point), • Elevation, • Lane, (U = uphill, D = downhill), • Asphalt Cement Thickness(AC), • California Bearing Ratio(CBR), • Plasticity Index(PI), • S = indicates a soil sample was taken at this location.
Central Federal Lands Highway Division Haleakala Highway Haleakala Highway Report Haleakala National Park __________________________________________________________________________________________
11
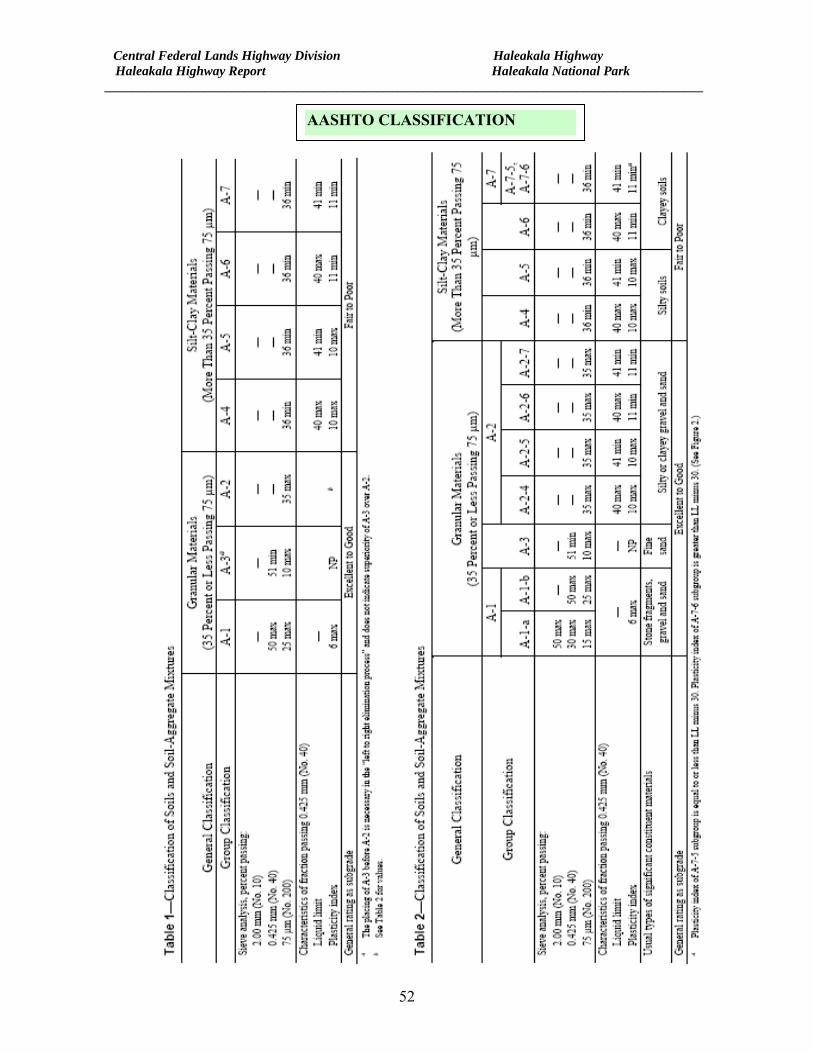
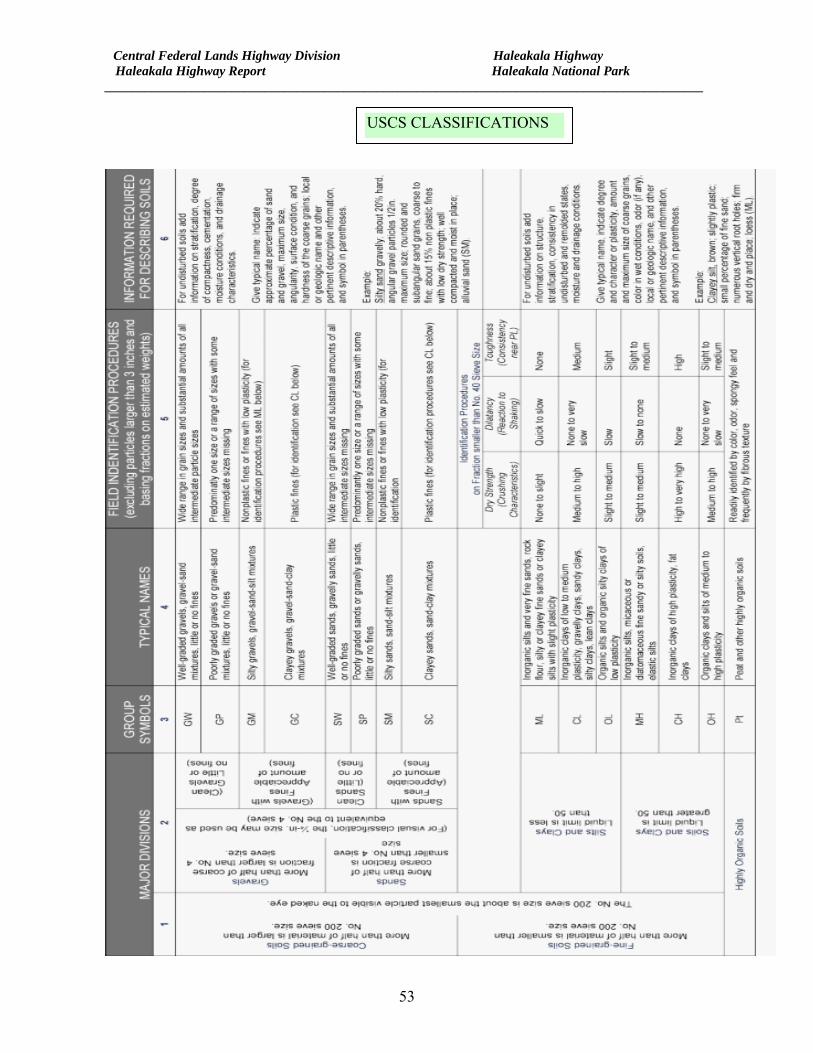
Soil classifications were performed on the soil sample and classified based on the American Association of State Highway Testing Officials (AASHTO) and the Unified Soil Classification System (USCS) soil classification methodology. A copy of the AASHTO and USCS classifications tables are included in Appendix D. Sites noted in the table with an astric (*) denotes sample locations and test results from previous investigations.
The values indicated in the AC-Thickness column of table 4 are an accumulation of bituminous materials that have been placed on this route since the original highway construction was completed in1935. Historical records indicate that the original bituminous materials were placed on native subgrade material and referred to in historical records as “surfacing with treated crusher-run base course”.
During initial construction in 1933 a crusher was placed onsite at station 160+00 to produce finishing and surfacing material. All surfacing material was produced from rock quarried on site by widening rock cuts uniformly along the roadway. This was verified during the auguring performed on this investigation, no evidence of base course was encountered; however there did appear to be varying amounts of screened material under the bituminous layer. It is assumed this material was produced for finishing subgrade prior to placing bituminous layer. During the auguring operation the majority of the sample holes encountered either bedrock or in fill areas encountered large rock at a depth of 15 to 24 inches.
Central Federal Lands Highway Division Haleakala Highway Haleakala Highway Report Haleakala National Park __________________________________________________________________________________________
12
TABLE 4…..SUMMARY OF THICKNESS, CBR & SOIL CLASSIFICATIONS
Lane Thickness (inches)
Classifications Site MP Elevation(feet)
U D AC
CBR PI
AASHTO USCS 1* 10.33 6746 45 36 A-2-7(0) GP-GM 1 10.5 U 8 2 10.5 D 8 2* 10.58 6816 SP 3 10.6 U 8 4 10.8 D 7 5 11.0(S2) U 8 6.7 S
EC
TIO
N 1
,
MP
10.2
TO
11.
2
6 11.2 U 5 13* 11.26 7035 SM 7 11.3 D 7 8 11.4 U 5.5 3* 11.47 7078 15 SP 4* 11.77 7159 SM 9 11.8(S3) U 5.5 51.5 10 11.9(S4) D 6.5 8.0 5* 11.95 7199 25 NP A-1-a(0) SP 11 12.1 U 5.5 33* 12.19 7264 SM 12 12.2 D 6.5 13 12.4(S5) U 5.5 4.7 6* 12.46 7338 SM 14 12.5 D 6.5 15 12.7 U 5.5 16 12.8 D 6 17 13.0 U 5.5 7* 13.15 7488 11 SP-SM 18 13.4 D 6.5 19 13.5 U 6.5 20 14.0(S6) D 6 21 14.0(S6) U 6.0 5.9 10* 14.13 7801 45 8 A-2-5(0) GM 8* 14.27 7846 GP 22 14.5 D 8 23 14.5 U 7.5 9* 14.77 7963 SM
SEC
TIO
N 2
, MP
11.2
TO
14.
8
SEC
TIO
N W
ITH
HIG
HE
ST L
EV
EL
OF
PAV
EM
EN
T D
IST
RE
SS
24 15.0 D 7 25 15.0 U 8 12* 15.20 8104 GP 32* 15.38 8155 SM 11* 15.49 8191 GP 14* 15.83 8304 SP 26 16.0 U 6.5 27 16.0 D 7 15* 16.65 8539 13 SP 28 17.0(S7) U 8 29 17.0(S7) D 8 16* 17.13 8671 35 A-2-4(0) SM 17* 17.32 8738 SM SE
CT
ION
3, M
P 14
.8 T
O 1
8.5
Central Federal Lands Highway Division Haleakala Highway Haleakala Highway Report Haleakala National Park __________________________________________________________________________________________
13
18* 17.50 8783 SP 20* 17.70 8829 GP 19* 17.86 8876 SP 30 18.0(S7) U 8 87 31 18.0 D 8 31* 18.09 8947 20 A-1-a(0) SP 21* 18.35 9031 A-1-a(0) GP-GM 32 18.6 U 8 22* 18.65 9120 SP 24* 18.88 9182 SP 33 19.0 D 7.5 34 19.0 U 8 23* 19.33 9310 NP A-1-a(0) GP 30* 19.45 9352 GP 35 19.5(S8) U 7.5 31 25* 19.75 9442 A-1-a(0) SP-SM 36 19.8 D 8 37 20.0(S8) U 7.5 38 20.3(S8) U 7 38.4 39 20.4 D 8 29* 20.59 9663 SP 40 20.6 U 7.5 41 20.7 D 8 42 20.8 U 8 43 20.8 D 7
SEC
TIO
N 4
, MP
18.5
TO
21.
2
26* 4+60 9751 SP 27* 18+65 9883 NP SP 28* 30+15 9985 70 A-1-a(0) GP-GM SP
UR
R
D.
Central Federal Lands Highway Division Haleakala Highway Haleakala Highway Report Haleakala National Park __________________________________________________________________________________________
14
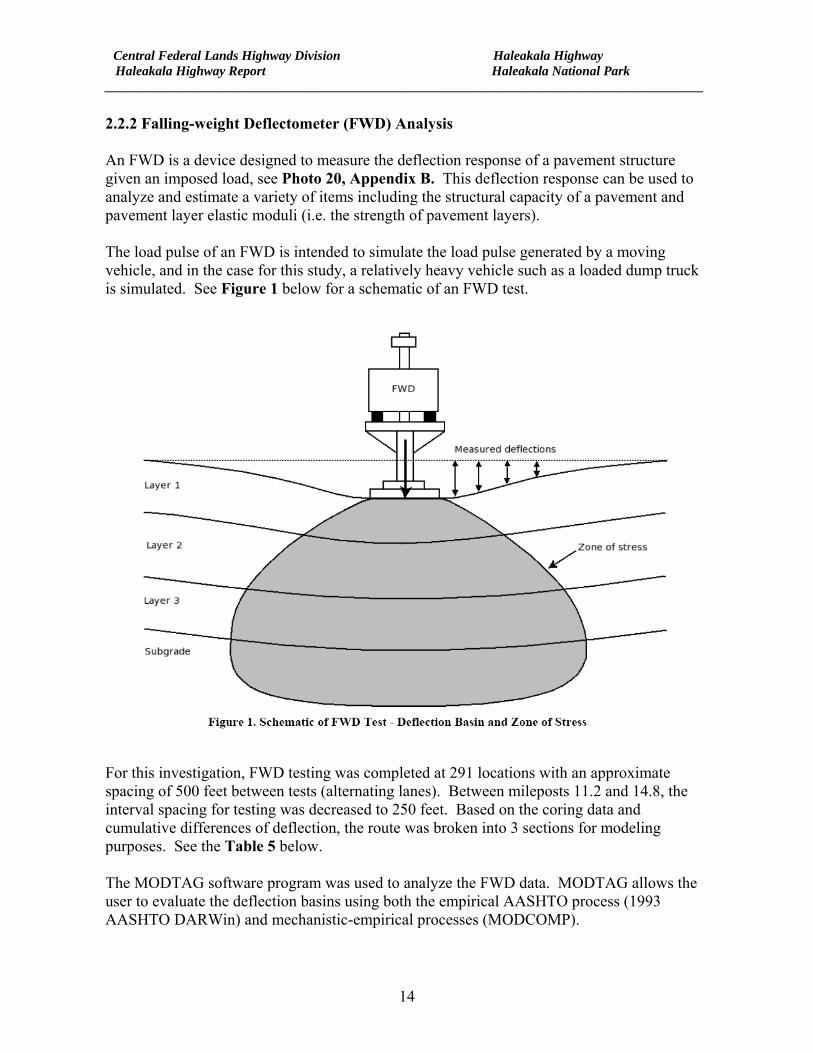
2.2.2 Falling-weight Deflectometer (FWD) Analysis An FWD is a device designed to measure the deflection response of a pavement structure given an imposed load, see Photo 20, Appendix B. This deflection response can be used to analyze and estimate a variety of items including the structural capacity of a pavement and pavement layer elastic moduli (i.e. the strength of pavement layers). The load pulse of an FWD is intended to simulate the load pulse generated by a moving vehicle, and in the case for this study, a relatively heavy vehicle such as a loaded dump truck is simulated. See Figure 1 below for a schematic of an FWD test.
For this investigation, FWD testing was completed at 291 locations with an approximate spacing of 500 feet between tests (alternating lanes). Between mileposts 11.2 and 14.8, the interval spacing for testing was decreased to 250 feet. Based on the coring data and cumulative differences of deflection, the route was broken into 3 sections for modeling purposes. See the Table 5 below. The MODTAG software program was used to analyze the FWD data. MODTAG allows the user to evaluate the deflection basins using both the empirical AASHTO process (1993 AASHTO DARWin) and mechanistic-empirical processes (MODCOMP).
Central Federal Lands Highway Division Haleakala Highway Haleakala Highway Report Haleakala National Park __________________________________________________________________________________________
15
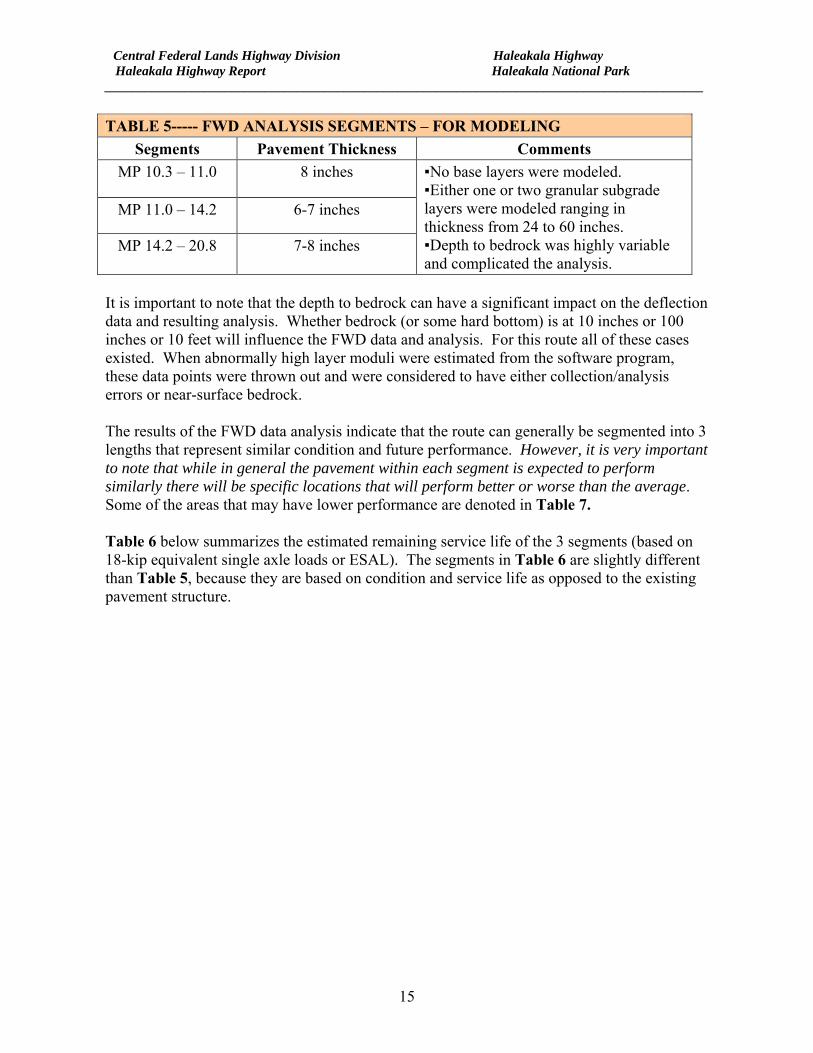
TABLE 5----- FWD ANALYSIS SEGMENTS – FOR MODELING
Segments Pavement Thickness Comments MP 10.3 – 11.0 8 inches
MP 11.0 – 14.2 6-7 inches
MP 14.2 – 20.8 7-8 inches
▪No base layers were modeled. ▪Either one or two granular subgrade layers were modeled ranging in thickness from 24 to 60 inches. ▪Depth to bedrock was highly variable and complicated the analysis.
It is important to note that the depth to bedrock can have a significant impact on the deflection data and resulting analysis. Whether bedrock (or some hard bottom) is at 10 inches or 100 inches or 10 feet will influence the FWD data and analysis. For this route all of these cases existed. When abnormally high layer moduli were estimated from the software program, these data points were thrown out and were considered to have either collection/analysis errors or near-surface bedrock. The results of the FWD data analysis indicate that the route can generally be segmented into 3 lengths that represent similar condition and future performance. However, it is very important to note that while in general the pavement within each segment is expected to perform similarly there will be specific locations that will perform better or worse than the average. Some of the areas that may have lower performance are denoted in Table 7. Table 6 below summarizes the estimated remaining service life of the 3 segments (based on 18-kip equivalent single axle loads or ESAL). The segments in Table 6 are slightly different than Table 5, because they are based on condition and service life as opposed to the existing pavement structure.
Central Federal Lands Highway Division Haleakala Highway Haleakala Highway Report Haleakala National Park __________________________________________________________________________________________
16
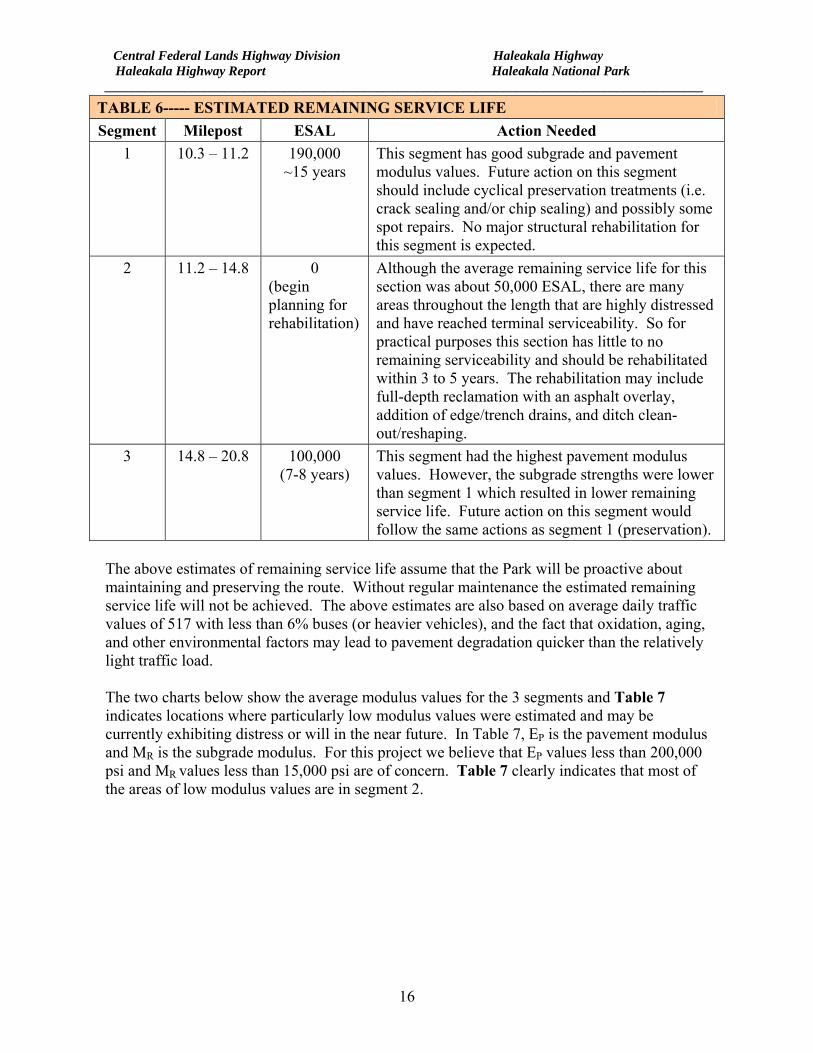
TABLE 6----- ESTIMATED REMAINING SERVICE LIFE Segment Milepost ESAL Action Needed
1 10.3 – 11.2 190,000 ~15 years
This segment has good subgrade and pavement modulus values. Future action on this segment should include cyclical preservation treatments (i.e. crack sealing and/or chip sealing) and possibly some spot repairs. No major structural rehabilitation for this segment is expected.
2 11.2 – 14.8 0 (begin planning for rehabilitation)
Although the average remaining service life for this section was about 50,000 ESAL, there are many areas throughout the length that are highly distressed and have reached terminal serviceability. So for practical purposes this section has little to no remaining serviceability and should be rehabilitated within 3 to 5 years. The rehabilitation may include full-depth reclamation with an asphalt overlay, addition of edge/trench drains, and ditch clean-out/reshaping.
3 14.8 – 20.8 100,000 (7-8 years)
This segment had the highest pavement modulus values. However, the subgrade strengths were lower than segment 1 which resulted in lower remaining service life. Future action on this segment would follow the same actions as segment 1 (preservation).
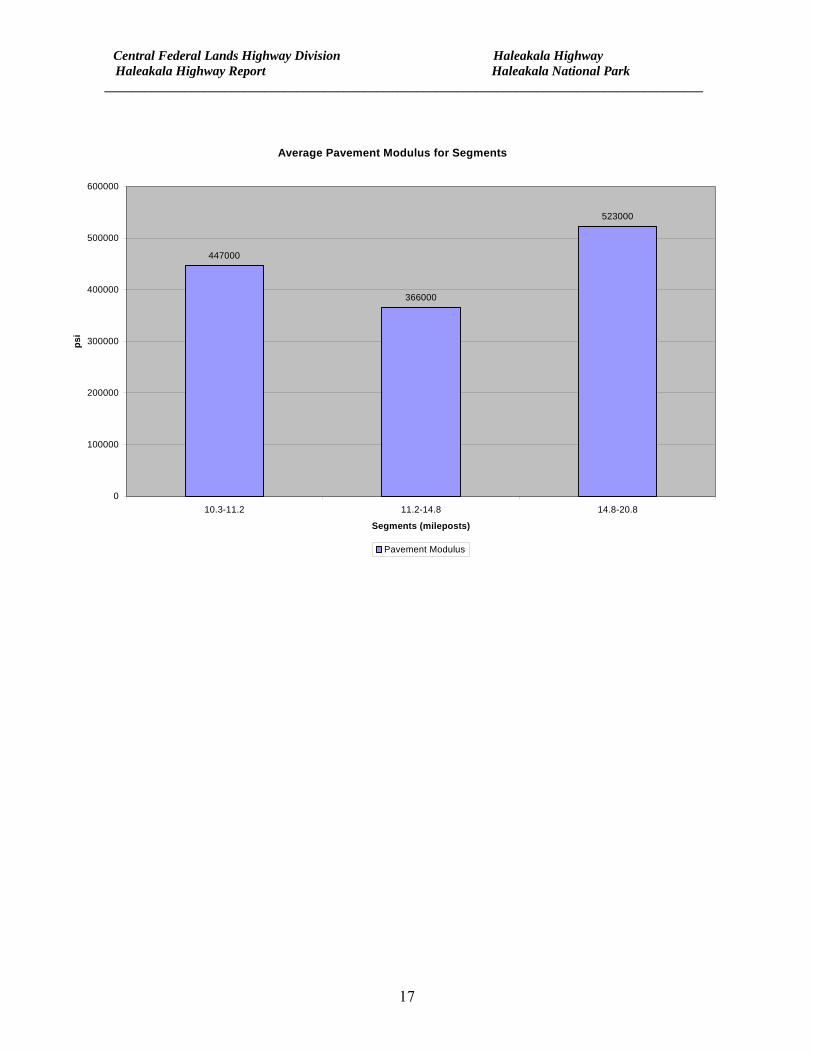
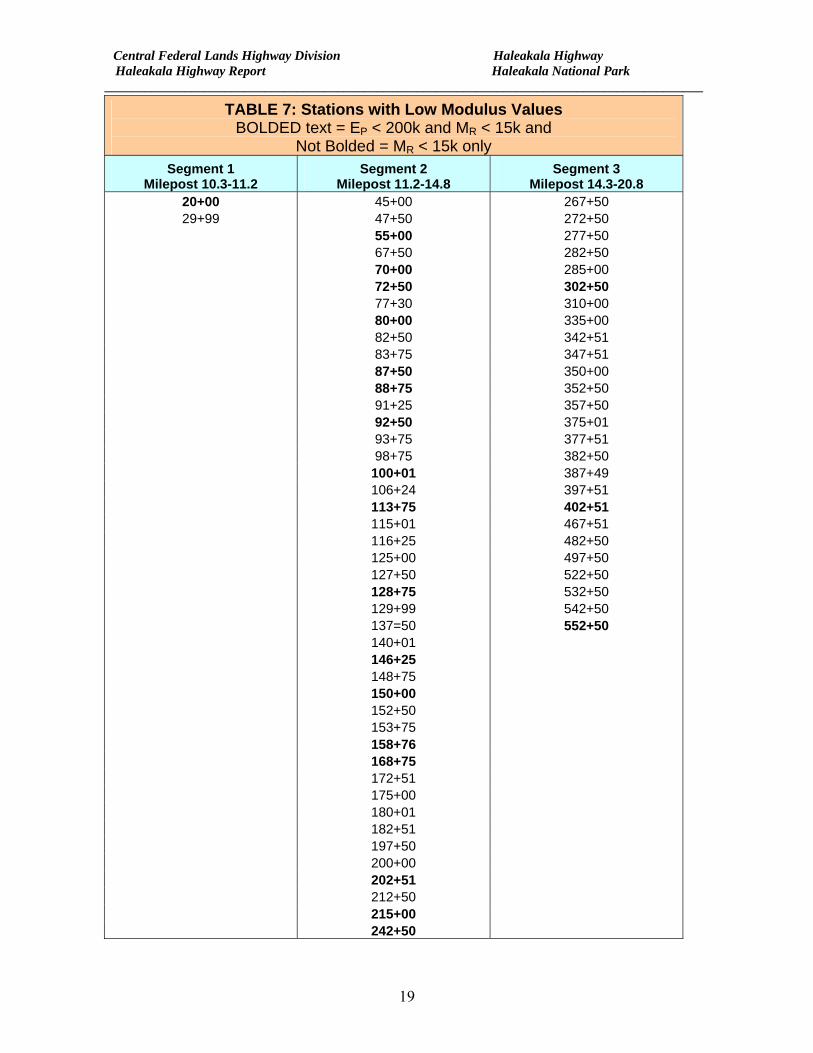
The above estimates of remaining service life assume that the Park will be proactive about maintaining and preserving the route. Without regular maintenance the estimated remaining service life will not be achieved. The above estimates are also based on average daily traffic values of 517 with less than 6% buses (or heavier vehicles), and the fact that oxidation, aging, and other environmental factors may lead to pavement degradation quicker than the relatively light traffic load. The two charts below show the average modulus values for the 3 segments and Table 7 indicates locations where particularly low modulus values were estimated and may be currently exhibiting distress or will in the near future. In Table 7, EP is the pavement modulus and MR is the subgrade modulus. For this project we believe that EP values less than 200,000 psi and MR values less than 15,000 psi are of concern. Table 7 clearly indicates that most of the areas of low modulus values are in segment 2.
Central Federal Lands Highway Division Haleakala Highway Haleakala Highway Report Haleakala National Park __________________________________________________________________________________________
17
Average Pavement Modulus for Segments
447000
366000
523000
0
100000
200000
300000
400000
500000
600000
10.3-11.2 11.2-14.8 14.8-20.8
Segments (mileposts)
psi
Pavement Modulus

Central Federal Lands Highway Division Haleakala Highway Haleakala Highway Report Haleakala National Park __________________________________________________________________________________________
18
Average Subgrade Modulus of Segments
28000
1780018900
0
5000
10000
15000
20000
25000
30000
10.3-11.2 11.2-14.8 14.8-20.8
Segments (mileposts)
psi
Subgrade Modulus
Central Federal Lands Highway Division Haleakala Highway Haleakala Highway Report Haleakala National Park __________________________________________________________________________________________
19
TABLE 7: Stations with Low Modulus Values BOLDED text = EP < 200k and MR < 15k and
Not Bolded = MR < 15k only Segment 1
Milepost 10.3-11.2 Segment 2
Milepost 11.2-14.8 Segment 3
Milepost 14.3-20.8 20+00 45+00 267+50 29+99 47+50 272+50
55+00 277+50 67+50 282+50 70+00 285+00 72+50 302+50 77+30 310+00 80+00 335+00 82+50 342+51 83+75 347+51 87+50 350+00 88+75 352+50 91+25 357+50 92+50 375+01 93+75 377+51 98+75 382+50 100+01 387+49 106+24 397+51 113+75 402+51 115+01 467+51 116+25 482+50 125+00 497+50 127+50 522+50 128+75 532+50 129+99 542+50 137=50 552+50 140+01 146+25 148+75 150+00 152+50 153+75 158+76 168+75 172+51 175+00 180+01 182+51 197+50 200+00 202+51 212+50 215+00 242+50
Central Federal Lands Highway Division Haleakala Highway Haleakala Highway Report Haleakala National Park __________________________________________________________________________________________
20
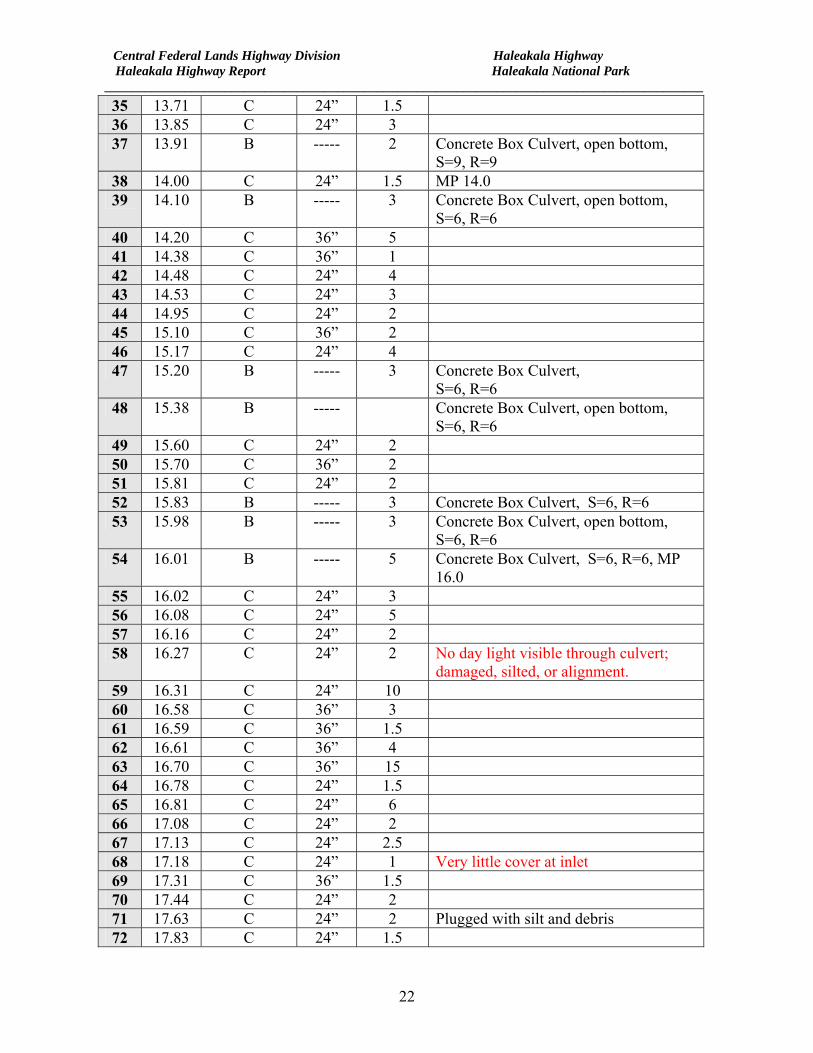
2.2.3 Drainage structure investigation analysis and summary The drainage structures inventory performed for the route included:
• Identify location, diameter, and amount of cover over all metal culverts(C) • Identify location, size and amount of cover over all concrete box culverts(B) • Identify existing damage(if any) to drainage structures
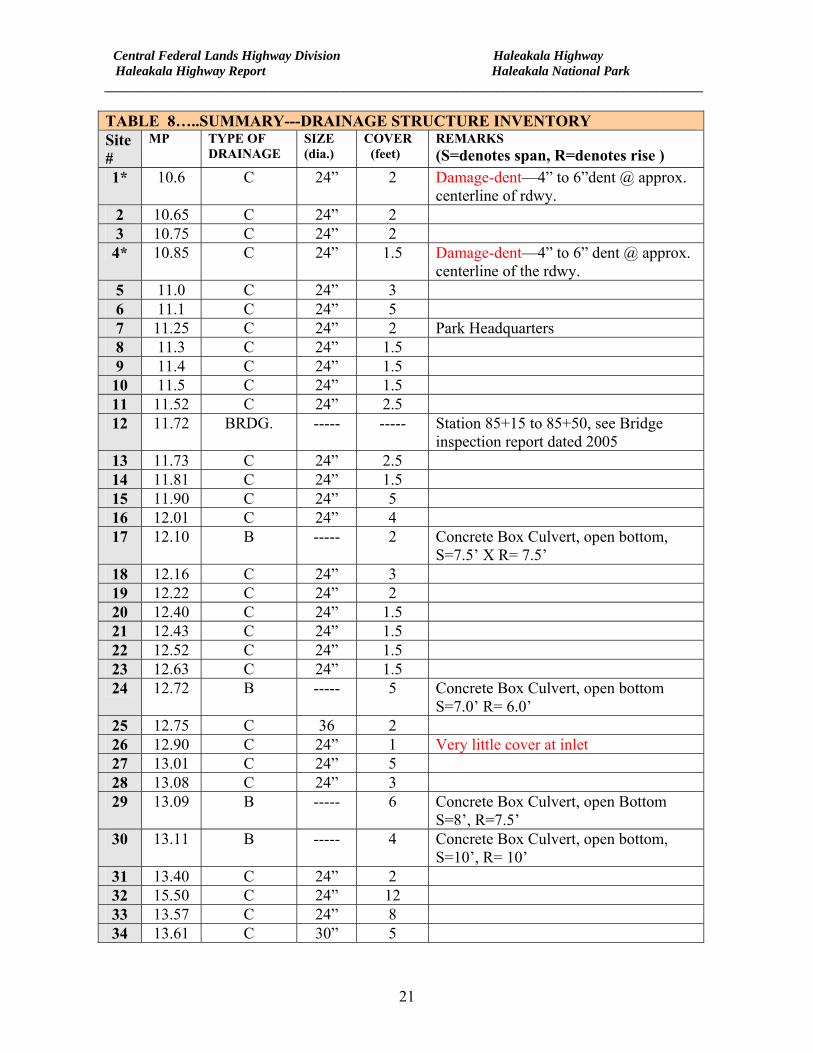
Most of drainage structures were installed/constructed during the original construction of the route in 1933-1935 including the bridge at MP 11.9 and the 11 concrete box culverts at various locations. The metal culverts and some of the concrete box culverts have been extended 2 to 6 feet overtime to accommodate widening of the roadway from the original 16-foot width roadway to the current 20-22 foot width roadway. Most of this work occurred between 1976 to early 1980. Many of the culverts as well as the concrete boxes and the bridge have masonry headwall end treatments, abutments and parapet walls. With the exception of those structures that were extended during subsequent projects for widening the roadway much of the masonry stone work dates back to the original 1933-1935 era. The condition of the masonry stone work was not specifically evaluated at each location. The masonry stone at most locations is intact and functional. Some loose cap and corner stone were evident but were not recorded. Mortar at some locations over time has eroded from between the stones. The following Table 8 is a summary of the findings of that investigation. As noted in the table the following culverts were documented as having existing damage or a condition as noted: sites, 1, 4, 26, 59, 68, 79 & 80 and noted with an *. The damage noted does not appear to be affecting the performance of the structure. Cause of damage is unknown. The “cover” column in the table indicates the difference between the surface of pavement and top of the culvert at its minimum cover. That minimum cover is usually at the inlet and usually in the uphill lane. The minimum cover as specified for metal culverts with a metal thickness of 0.052 inches for an H-20 loading is 12-inches. This value is recommended by the Handbook of Steel Drainage and Highway Construction Products handbook.
Central Federal Lands Highway Division Haleakala Highway Haleakala Highway Report Haleakala National Park __________________________________________________________________________________________
21
TABLE 8…..SUMMARY---DRAINAGE STRUCTURE INVENTORY Site #
MP TYPE OF DRAINAGE
SIZE (dia.)
COVER (feet)
REMARKS (S=denotes span, R=denotes rise )
1* 10.6 C 24” 2 Damage-dent—4” to 6”dent @ approx. centerline of rdwy.
2 10.65 C 24” 2 3 10.75 C 24” 2 4* 10.85 C 24” 1.5 Damage-dent—4” to 6” dent @ approx.
centerline of the rdwy. 5 11.0 C 24” 3 6 11.1 C 24” 5 7 11.25 C 24” 2 Park Headquarters 8 11.3 C 24” 1.5 9 11.4 C 24” 1.5 10 11.5 C 24” 1.5 11 11.52 C 24” 2.5 12 11.72 BRDG. ----- ----- Station 85+15 to 85+50, see Bridge
inspection report dated 2005 13 11.73 C 24” 2.5 14 11.81 C 24” 1.5 15 11.90 C 24” 5 16 12.01 C 24” 4 17 12.10 B ----- 2 Concrete Box Culvert, open bottom,
S=7.5’ X R= 7.5’ 18 12.16 C 24” 3 19 12.22 C 24” 2 20 12.40 C 24” 1.5 21 12.43 C 24” 1.5 22 12.52 C 24” 1.5 23 12.63 C 24” 1.5 24 12.72 B ----- 5 Concrete Box Culvert, open bottom
S=7.0’ R= 6.0’ 25 12.75 C 36 2 26 12.90 C 24” 1 Very little cover at inlet 27 13.01 C 24” 5 28 13.08 C 24” 3 29 13.09 B ----- 6 Concrete Box Culvert, open Bottom
S=8’, R=7.5’ 30 13.11 B ----- 4 Concrete Box Culvert, open bottom,
S=10’, R= 10’ 31 13.40 C 24” 2 32 15.50 C 24” 12 33 13.57 C 24” 8 34 13.61 C 30” 5
Central Federal Lands Highway Division Haleakala Highway Haleakala Highway Report Haleakala National Park __________________________________________________________________________________________
22
35 13.71 C 24” 1.5 36 13.85 C 24” 3 37 13.91 B ----- 2 Concrete Box Culvert, open bottom,
S=9, R=9 38 14.00 C 24” 1.5 MP 14.0 39 14.10 B ----- 3 Concrete Box Culvert, open bottom,
S=6, R=6 40 14.20 C 36” 5 41 14.38 C 36” 1 42 14.48 C 24” 4 43 14.53 C 24” 3 44 14.95 C 24” 2 45 15.10 C 36” 2 46 15.17 C 24” 4 47 15.20 B ----- 3 Concrete Box Culvert,
S=6, R=6 48 15.38 B ----- Concrete Box Culvert, open bottom,
S=6, R=6 49 15.60 C 24” 2 50 15.70 C 36” 2 51 15.81 C 24” 2 52 15.83 B ----- 3 Concrete Box Culvert, S=6, R=6 53 15.98 B ----- 3 Concrete Box Culvert, open bottom,
S=6, R=6 54 16.01 B ----- 5 Concrete Box Culvert, S=6, R=6, MP
16.0 55 16.02 C 24” 3 56 16.08 C 24” 5 57 16.16 C 24” 2 58 16.27 C 24” 2 No day light visible through culvert;
damaged, silted, or alignment. 59 16.31 C 24” 10 60 16.58 C 36” 3 61 16.59 C 36” 1.5 62 16.61 C 36” 4 63 16.70 C 36” 15 64 16.78 C 24” 1.5 65 16.81 C 24” 6 66 17.08 C 24” 2 67 17.13 C 24” 2.5 68 17.18 C 24” 1 Very little cover at inlet 69 17.31 C 36” 1.5 70 17.44 C 24” 2 71 17.63 C 24” 2 Plugged with silt and debris 72 17.83 C 24” 1.5
Central Federal Lands Highway Division Haleakala Highway Haleakala Highway Report Haleakala National Park __________________________________________________________________________________________
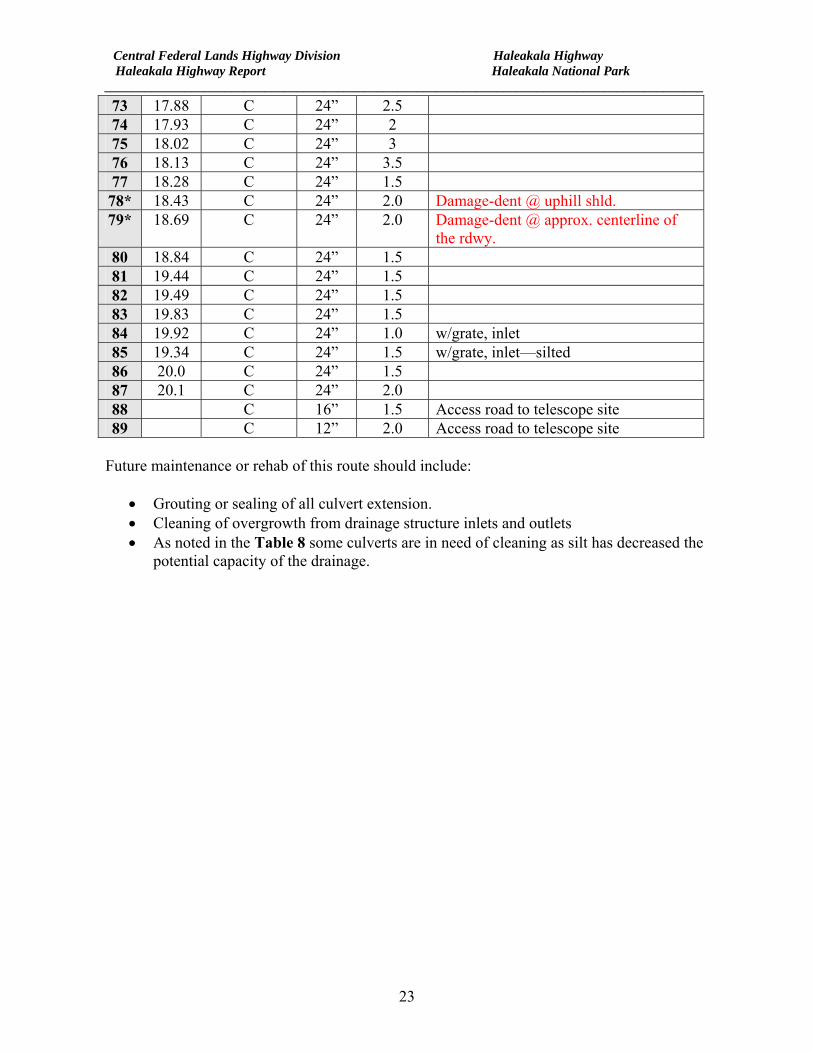
23
73 17.88 C 24” 2.5 74 17.93 C 24” 2 75 18.02 C 24” 3 76 18.13 C 24” 3.5 77 18.28 C 24” 1.5 78* 18.43 C 24” 2.0 Damage-dent @ uphill shld. 79* 18.69 C 24” 2.0 Damage-dent @ approx. centerline of
the rdwy. 80 18.84 C 24” 1.5 81 19.44 C 24” 1.5 82 19.49 C 24” 1.5 83 19.83 C 24” 1.5 84 19.92 C 24” 1.0 w/grate, inlet 85 19.34 C 24” 1.5 w/grate, inlet—silted 86 20.0 C 24” 1.5 87 20.1 C 24” 2.0 88 C 16” 1.5 Access road to telescope site 89 C 12” 2.0 Access road to telescope site
Future maintenance or rehab of this route should include:
• Grouting or sealing of all culvert extension. • Cleaning of overgrowth from drainage structure inlets and outlets • As noted in the Table 8 some culverts are in need of cleaning as silt has decreased the
potential capacity of the drainage.
Central Federal Lands Highway Division Haleakala Highway Haleakala Highway Report Haleakala National Park __________________________________________________________________________________________
24
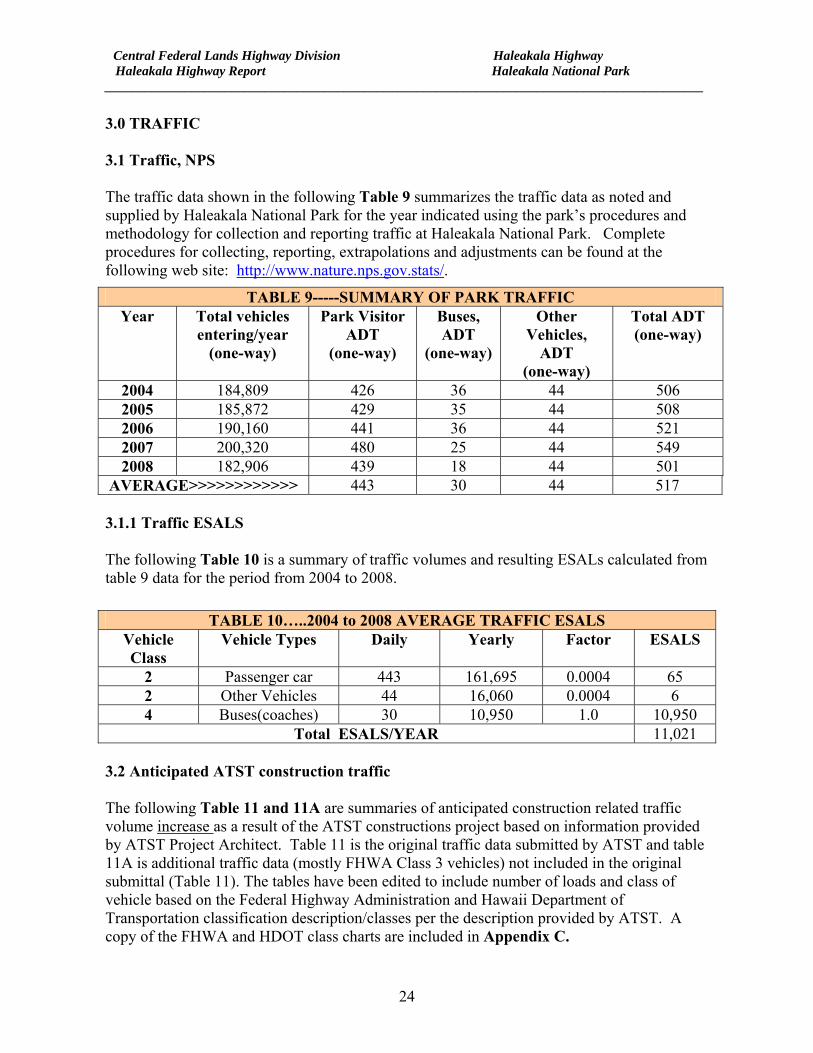
3.0 TRAFFIC 3.1 Traffic, NPS The traffic data shown in the following Table 9 summarizes the traffic data as noted and supplied by Haleakala National Park for the year indicated using the park’s procedures and methodology for collection and reporting traffic at Haleakala National Park. Complete procedures for collecting, reporting, extrapolations and adjustments can be found at the following web site: http://www.nature.nps.gov.stats/.
3.1.1 Traffic ESALS The following Table 10 is a summary of traffic volumes and resulting ESALs calculated from table 9 data for the period from 2004 to 2008.
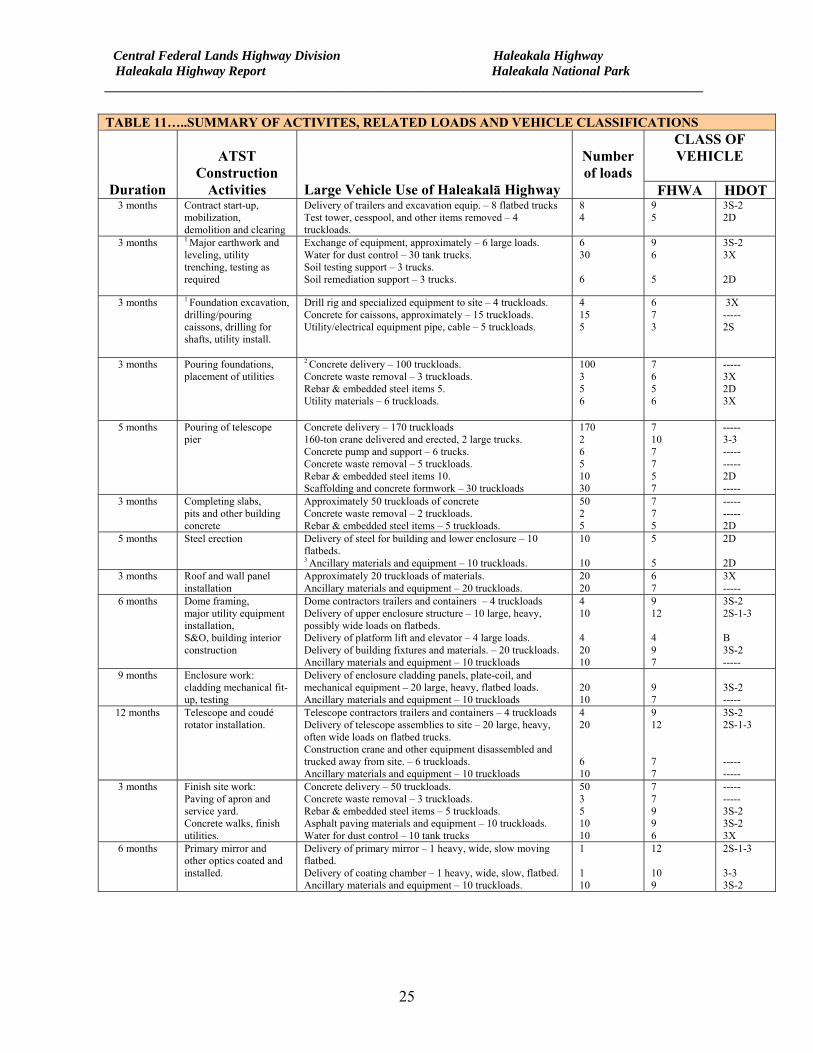
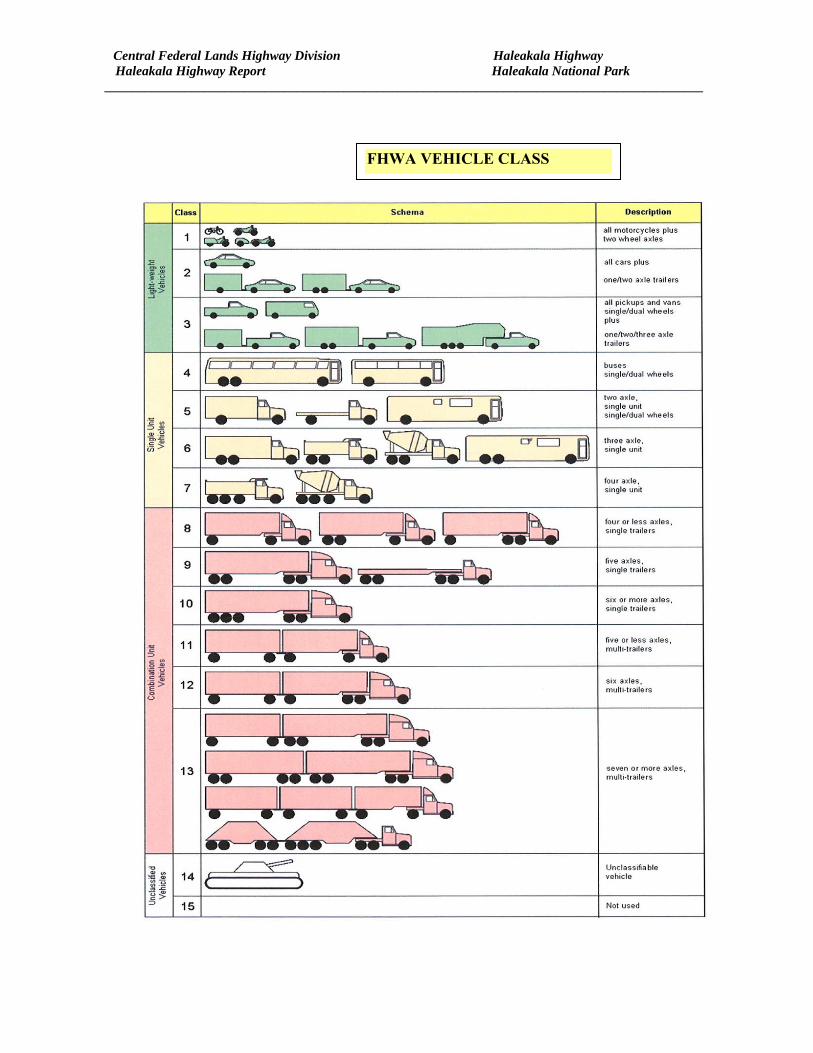
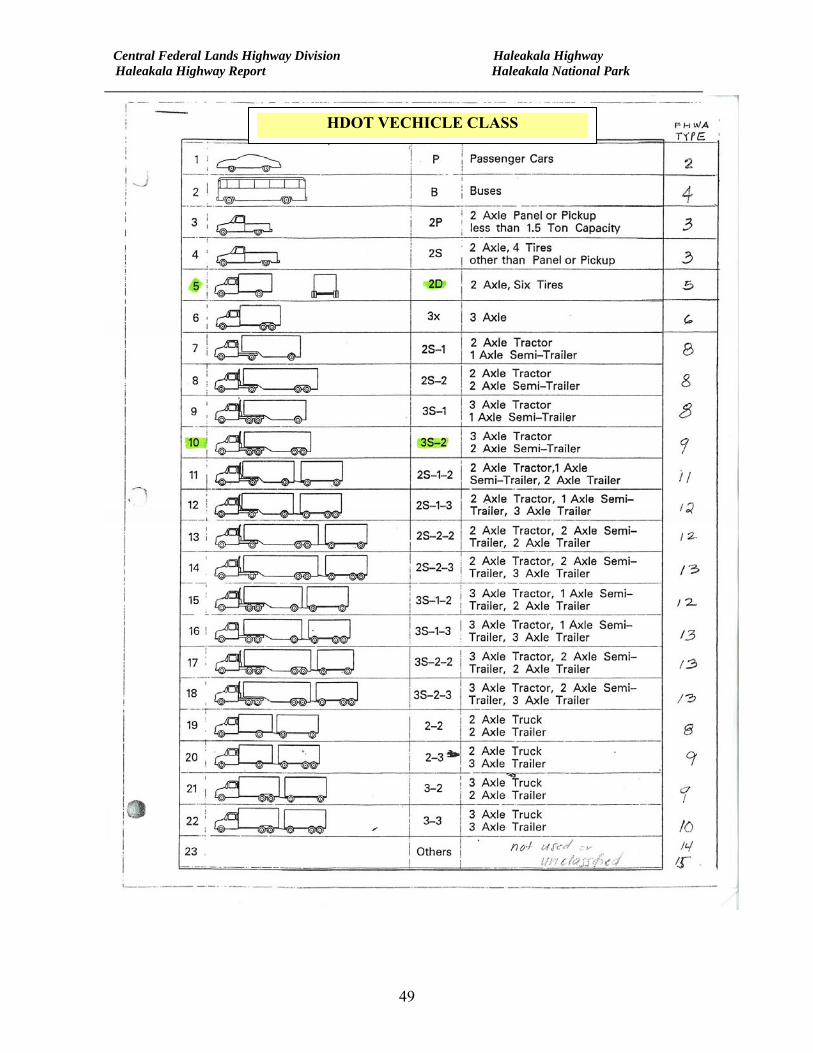
3.2 Anticipated ATST construction traffic The following Table 11 and 11A are summaries of anticipated construction related traffic volume increase as a result of the ATST constructions project based on information provided by ATST Project Architect. Table 11 is the original traffic data submitted by ATST and table 11A is additional traffic data (mostly FHWA Class 3 vehicles) not included in the original submittal (Table 11). The tables have been edited to include number of loads and class of vehicle based on the Federal Highway Administration and Hawaii Department of Transportation classification description/classes per the description provided by ATST. A copy of the FHWA and HDOT class charts are included in Appendix C.
TABLE 9-----SUMMARY OF PARK TRAFFIC Year Total vehicles
entering/year (one-way)
Park Visitor ADT
(one-way)
Buses, ADT
(one-way)
Other Vehicles,
ADT (one-way)
Total ADT (one-way)
2004 184,809 426 36 44 506 2005 185,872 429 35 44 508 2006 190,160 441 36 44 521 2007 200,320 480 25 44 549 2008 182,906 439 18 44 501
AVERAGE>>>>>>>>>>>> 443 30 44 517
TABLE 10…..2004 to 2008 AVERAGE TRAFFIC ESALS Vehicle Class
Vehicle Types Daily Yearly Factor ESALS
2 Passenger car 443 161,695 0.0004 65 2 Other Vehicles 44 16,060 0.0004 6 4 Buses(coaches) 30 10,950 1.0 10,950
Total ESALS/YEAR 11,021
Central Federal Lands Highway Division Haleakala Highway Haleakala Highway Report Haleakala National Park __________________________________________________________________________________________
25
TABLE 11…..SUMMARY OF ACTIVITES, RELATED LOADS AND VEHICLE CLASSIFICATIONS
CLASS OF VEHICLE
Duration
ATST Construction
Activities Large Vehicle Use of Haleakalā Highway
Number of loads
FHWA HDOT 3 months Contract start-up,
mobilization, demolition and clearing
Delivery of trailers and excavation equip. – 8 flatbed trucks Test tower, cesspool, and other items removed – 4 truckloads.
8 4
9 5
3S-2 2D
3 months 1 Major earthwork and leveling, utility trenching, testing as required
Exchange of equipment, approximately – 6 large loads. Water for dust control – 30 tank trucks. Soil testing support – 3 trucks. Soil remediation support – 3 trucks.
6 30 6
9 6 5
3S-2 3X 2D
3 months 1 Foundation excavation, drilling/pouring caissons, drilling for shafts, utility install.
Drill rig and specialized equipment to site – 4 truckloads. Concrete for caissons, approximately – 15 truckloads. Utility/electrical equipment pipe, cable – 5 truckloads.
4 15 5
6 7 3
3X ----- 2S
3 months
Pouring foundations, placement of utilities
2 Concrete delivery – 100 truckloads. Concrete waste removal – 3 truckloads. Rebar & embedded steel items 5. Utility materials – 6 truckloads.
100 3 5 6
7 6 5 6
----- 3X 2D 3X
5 months Pouring of telescope pier
Concrete delivery – 170 truckloads 160-ton crane delivered and erected, 2 large trucks. Concrete pump and support – 6 trucks. Concrete waste removal – 5 truckloads. Rebar & embedded steel items 10. Scaffolding and concrete formwork – 30 truckloads
170 2 6 5 10 30
7 10 7 7 5 7
----- 3-3 ----- ----- 2D -----
3 months Completing slabs, pits and other building concrete
Approximately 50 truckloads of concrete Concrete waste removal – 2 truckloads. Rebar & embedded steel items – 5 truckloads.
50 2 5
7 7 5
----- ----- 2D
5 months Steel erection Delivery of steel for building and lower enclosure – 10 flatbeds. 3 Ancillary materials and equipment – 10 truckloads.
10 10
5 5
2D 2D
3 months Roof and wall panel installation
Approximately 20 truckloads of materials. Ancillary materials and equipment – 20 truckloads.
20 20
6 7
3X -----
6 months Dome framing, major utility equipment installation, S&O, building interior construction
Dome contractors trailers and containers – 4 truckloads Delivery of upper enclosure structure – 10 large, heavy, possibly wide loads on flatbeds. Delivery of platform lift and elevator – 4 large loads. Delivery of building fixtures and materials. – 20 truckloads. Ancillary materials and equipment – 10 truckloads
4 10 4 20 10
9 12 4 9 7
3S-2 2S-1-3 B 3S-2 -----
9 months Enclosure work: cladding mechanical fit-up, testing
Delivery of enclosure cladding panels, plate-coil, and mechanical equipment – 20 large, heavy, flatbed loads. Ancillary materials and equipment – 10 truckloads
20 10
9 7
3S-2 -----
12 months Telescope and coudé rotator installation.
Telescope contractors trailers and containers – 4 truckloads Delivery of telescope assemblies to site – 20 large, heavy, often wide loads on flatbed trucks. Construction crane and other equipment disassembled and trucked away from site. – 6 truckloads. Ancillary materials and equipment – 10 truckloads
4 20 6 10
9 12 7 7
3S-2 2S-1-3 ----- -----
3 months Finish site work: Paving of apron and service yard. Concrete walks, finish utilities.
Concrete delivery – 50 truckloads. Concrete waste removal – 3 truckloads. Rebar & embedded steel items – 5 truckloads. Asphalt paving materials and equipment – 10 truckloads. Water for dust control – 10 tank trucks
50 3 5 10 10
7 7 9 9 6
----- ----- 3S-2 3S-2 3X
6 months Primary mirror and other optics coated and installed.
Delivery of primary mirror – 1 heavy, wide, slow moving flatbed. Delivery of coating chamber – 1 heavy, wide, slow, flatbed. Ancillary materials and equipment – 10 truckloads.
1 1 10
12 10 9
2S-1-3 3-3 3S-2
Central Federal Lands Highway Division Haleakala Highway Haleakala Highway Report Haleakala National Park __________________________________________________________________________________________
26
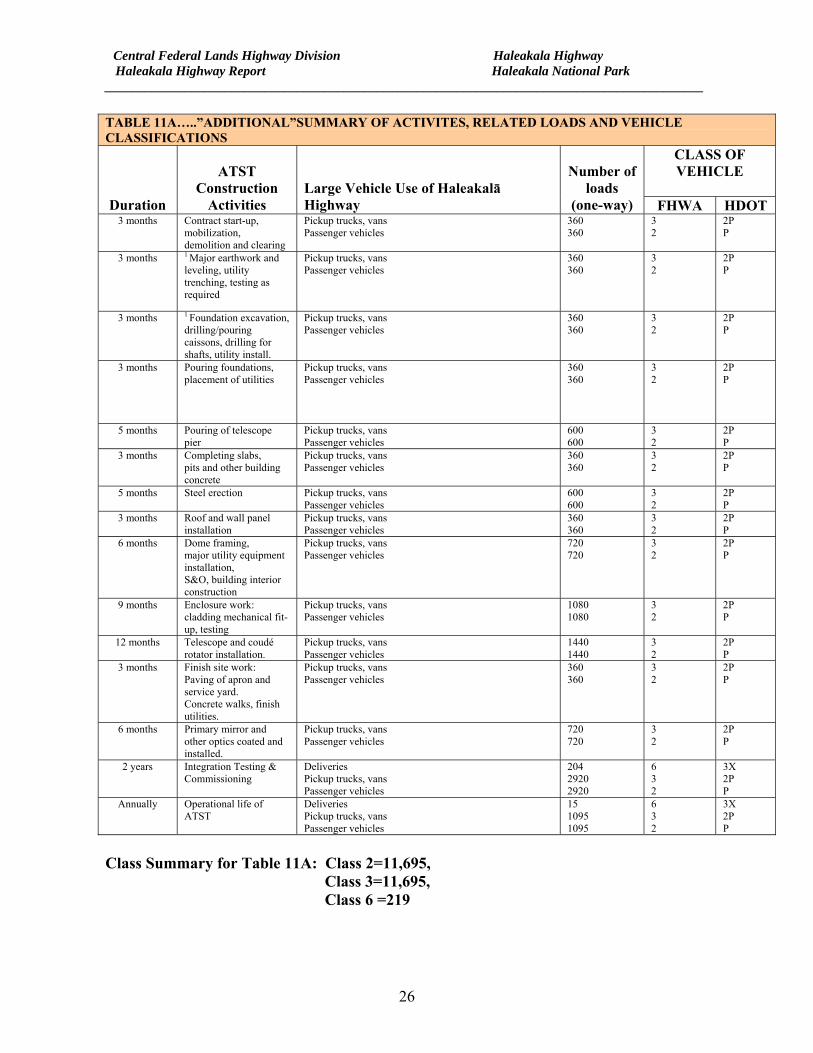
TABLE 11A…..”ADDITIONAL”SUMMARY OF ACTIVITES, RELATED LOADS AND VEHICLE CLASSIFICATIONS
CLASS OF VEHICLE
Duration
ATST Construction
Activities Large Vehicle Use of Haleakalā Highway
Number of
loads (one-way) FHWA HDOT
3 months Contract start-up, mobilization, demolition and clearing
Pickup trucks, vans Passenger vehicles
360 360
3 2
2P P
3 months 1 Major earthwork and leveling, utility trenching, testing as required
Pickup trucks, vans Passenger vehicles
360 360
3 2
2P P
3 months 1 Foundation excavation, drilling/pouring caissons, drilling for shafts, utility install.
Pickup trucks, vans Passenger vehicles
360 360
3 2
2P P
3 months
Pouring foundations, placement of utilities
Pickup trucks, vans Passenger vehicles
360 360
3 2
2P P
5 months Pouring of telescope pier
Pickup trucks, vans Passenger vehicles
600 600
3 2
2P P
3 months Completing slabs, pits and other building concrete
Pickup trucks, vans Passenger vehicles
360 360
3 2
2P P
5 months Steel erection Pickup trucks, vans Passenger vehicles
600 600
3 2
2P P
3 months Roof and wall panel installation
Pickup trucks, vans Passenger vehicles
360 360
3 2
2P P
6 months Dome framing, major utility equipment installation, S&O, building interior construction
Pickup trucks, vans Passenger vehicles
720 720
3 2
2P P
9 months Enclosure work: cladding mechanical fit-up, testing
Pickup trucks, vans Passenger vehicles
1080 1080
3 2
2P P
12 months Telescope and coudé rotator installation.
Pickup trucks, vans Passenger vehicles
1440 1440
3 2
2P P
3 months Finish site work: Paving of apron and service yard. Concrete walks, finish utilities.
Pickup trucks, vans Passenger vehicles
360 360
3 2
2P P
6 months Primary mirror and other optics coated and installed.
Pickup trucks, vans Passenger vehicles
720 720
3 2
2P P
2 years Integration Testing & Commissioning
Deliveries Pickup trucks, vans Passenger vehicles
204 2920 2920
6 3 2
3X 2P P
Annually Operational life of ATST
Deliveries Pickup trucks, vans Passenger vehicles
15 1095 1095
6 3 2
3X 2P P
Class Summary for Table 11A: Class 2=11,695, Class 3=11,695, Class 6 =219
Central Federal Lands Highway Division Haleakala Highway Haleakala Highway Report Haleakala National Park __________________________________________________________________________________________
27
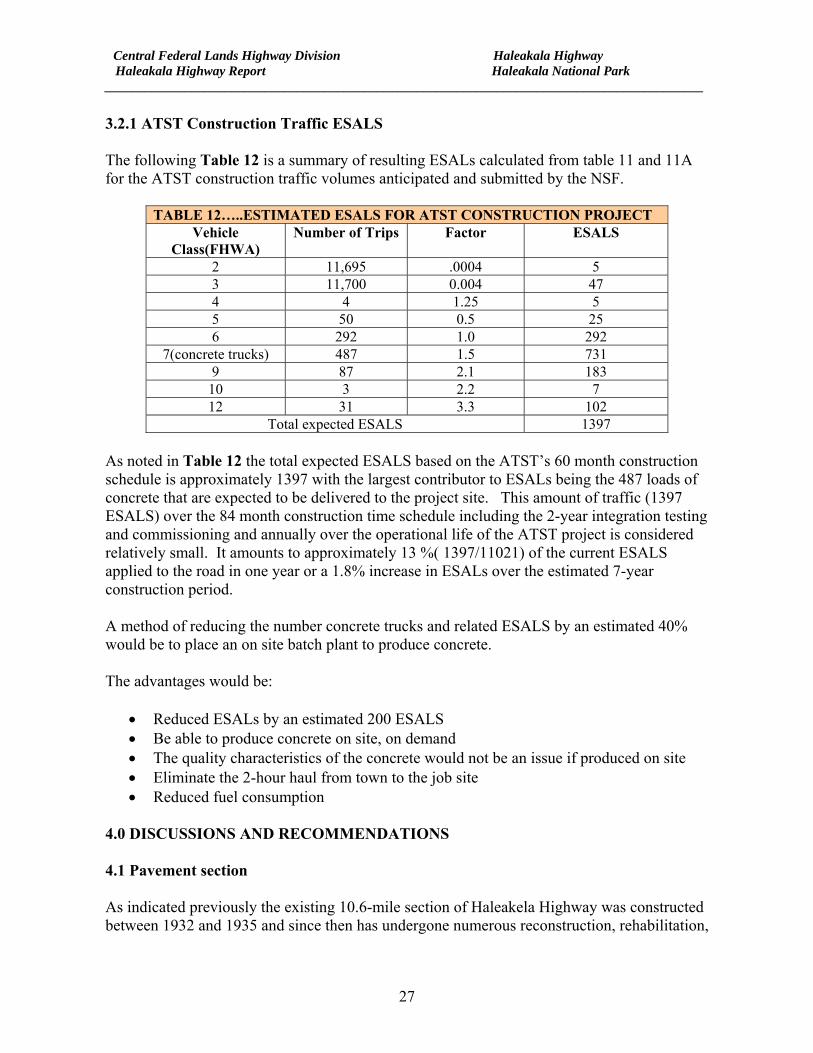
3.2.1 ATST Construction Traffic ESALS The following Table 12 is a summary of resulting ESALs calculated from table 11 and 11A for the ATST construction traffic volumes anticipated and submitted by the NSF.
TABLE 12…..ESTIMATED ESALS FOR ATST CONSTRUCTION PROJECT Vehicle
Class(FHWA) Number of Trips Factor ESALS
2 11,695 .0004 5 3 11,700 0.004 47 4 4 1.25 5 5 50 0.5 25 6 292 1.0 292
7(concrete trucks) 487 1.5 731 9 87 2.1 183
10 3 2.2 7 12 31 3.3 102
Total expected ESALS 1397 As noted in Table 12 the total expected ESALS based on the ATST’s 60 month construction schedule is approximately 1397 with the largest contributor to ESALs being the 487 loads of concrete that are expected to be delivered to the project site. This amount of traffic (1397 ESALS) over the 84 month construction time schedule including the 2-year integration testing and commissioning and annually over the operational life of the ATST project is considered relatively small. It amounts to approximately 13 %( 1397/11021) of the current ESALS applied to the road in one year or a 1.8% increase in ESALs over the estimated 7-year construction period. A method of reducing the number concrete trucks and related ESALS by an estimated 40% would be to place an on site batch plant to produce concrete. The advantages would be:
• Reduced ESALs by an estimated 200 ESALS • Be able to produce concrete on site, on demand • The quality characteristics of the concrete would not be an issue if produced on site • Eliminate the 2-hour haul from town to the job site • Reduced fuel consumption
4.0 DISCUSSIONS AND RECOMMENDATIONS 4.1 Pavement section As indicated previously the existing 10.6-mile section of Haleakela Highway was constructed between 1932 and 1935 and since then has undergone numerous reconstruction, rehabilitation,
Central Federal Lands Highway Division Haleakala Highway Haleakala Highway Report Haleakala National Park __________________________________________________________________________________________
28
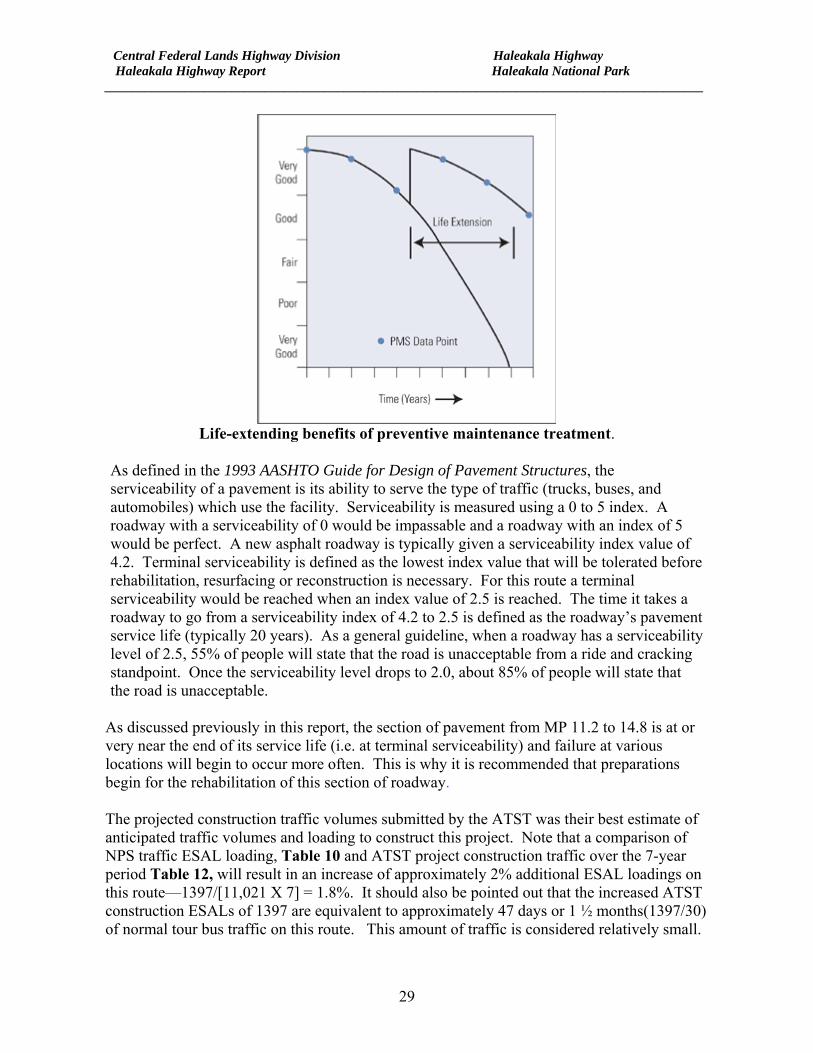
subexcavation and maintenance work consisting of widening, overlays, pulverization w/overlay and surface course (chip seal) construction. Some of the rehabilitation has included corrective rework of the subgrade. The corrective work consisted of sub excavation and patching at numerous locations. From MP 10.3 to MP 11.2 and MP 14.8 to MP 21.2 the roadway appears to be performing adequately without any noted severe structural problems or distresses and should continue to perform well with a continued maintenance program. The remaining service life for MP 10.3 to 11.2 is estimated at 15 years or more and for MP 14.8 to 21.2 the estimated service life is estimated at 7-8 years. This remaining service life however could be reduced with increased traffic volumes and larger than expected traffic loadings. The pavement section from MP 11.2 to MP 14.8 has also received numerous overlays but has not performed as well due to the unstable underlying materials and water issues. This section exhibits severe fatigue cracking and associated water bleeding/pumping and loss of underlying materials as is evident from the presence of fines on the surface of the road and pavement staining. This section will continue to deteriorate at a much faster rate due to water intrusion into the underlying structural layers, continued loadings and loss of fines. The water source is continued precipitation and accumulation of water in the roadway ditches that eventually flows through the highly permeably material into the subgrade under the pavement. This condition was evident during the first investigation as well as this investigation. This section of road appears to have higher moisture/water accumulations on the surrounding slopes and roadway cut/fill slopes and ditches. The surrounding fauna is also more prevalent through this section. Many areas of roadway within this segment are at or very near the end of their service life. Based on the investigation performed and the data gathered the pavement form MP 10.3 -11.2 and MP 14.8 to 21.2 should continue to perform well with a regular maintenance program. However the pavement from MP 11.2 – 14.8 is at or near the end of its service life and will continue to deteriorate at a faster rate over time. The following graph is included to indicate as roads approach the end of their service life they deteriorate at a more rapid rate. While the following graph is intended to show the benefits of a good preventive maintenance treatment and resulting increase in the service life it also depicts the rapid decrease of service life during the later years of the intended design.
Central Federal Lands Highway Division Haleakala Highway Haleakala Highway Report Haleakala National Park __________________________________________________________________________________________
29
Life-extending benefits of preventive maintenance treatment.
As defined in the 1993 AASHTO Guide for Design of Pavement Structures, the serviceability of a pavement is its ability to serve the type of traffic (trucks, buses, and automobiles) which use the facility. Serviceability is measured using a 0 to 5 index. A roadway with a serviceability of 0 would be impassable and a roadway with an index of 5 would be perfect. A new asphalt roadway is typically given a serviceability index value of 4.2. Terminal serviceability is defined as the lowest index value that will be tolerated before rehabilitation, resurfacing or reconstruction is necessary. For this route a terminal serviceability would be reached when an index value of 2.5 is reached. The time it takes a roadway to go from a serviceability index of 4.2 to 2.5 is defined as the roadway’s pavement service life (typically 20 years). As a general guideline, when a roadway has a serviceability level of 2.5, 55% of people will state that the road is unacceptable from a ride and cracking standpoint. Once the serviceability level drops to 2.0, about 85% of people will state that the road is unacceptable.
As discussed previously in this report, the section of pavement from MP 11.2 to 14.8 is at or very near the end of its service life (i.e. at terminal serviceability) and failure at various locations will begin to occur more often. This is why it is recommended that preparations begin for the rehabilitation of this section of roadway. The projected construction traffic volumes submitted by the ATST was their best estimate of anticipated traffic volumes and loading to construct this project. Note that a comparison of NPS traffic ESAL loading, Table 10 and ATST project construction traffic over the 7-year period Table 12, will result in an increase of approximately 2% additional ESAL loadings on this route—1397/[11,021 X 7] = 1.8%. It should also be pointed out that the increased ATST construction ESALs of 1397 are equivalent to approximately 47 days or 1 ½ months(1397/30) of normal tour bus traffic on this route. This amount of traffic is considered relatively small.
Central Federal Lands Highway Division Haleakala Highway Haleakala Highway Report Haleakala National Park __________________________________________________________________________________________
30
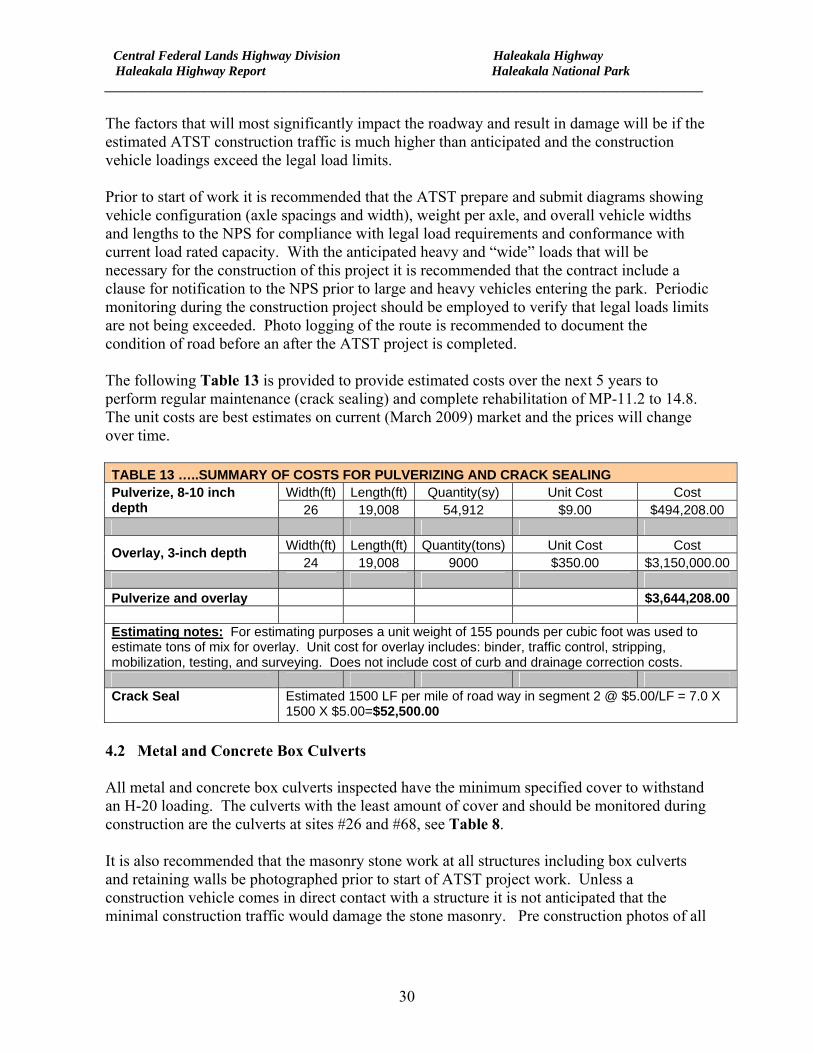
The factors that will most significantly impact the roadway and result in damage will be if the estimated ATST construction traffic is much higher than anticipated and the construction vehicle loadings exceed the legal load limits. Prior to start of work it is recommended that the ATST prepare and submit diagrams showing vehicle configuration (axle spacings and width), weight per axle, and overall vehicle widths and lengths to the NPS for compliance with legal load requirements and conformance with current load rated capacity. With the anticipated heavy and “wide” loads that will be necessary for the construction of this project it is recommended that the contract include a clause for notification to the NPS prior to large and heavy vehicles entering the park. Periodic monitoring during the construction project should be employed to verify that legal loads limits are not being exceeded. Photo logging of the route is recommended to document the condition of road before an after the ATST project is completed. The following Table 13 is provided to provide estimated costs over the next 5 years to perform regular maintenance (crack sealing) and complete rehabilitation of MP-11.2 to 14.8. The unit costs are best estimates on current (March 2009) market and the prices will change over time. TABLE 13 …..SUMMARY OF COSTS FOR PULVERIZING AND CRACK SEALING
Width(ft) Length(ft) Quantity(sy) Unit Cost Cost Pulverize, 8-10 inch depth 26 19,008 54,912 $9.00 $494,208.00
Width(ft) Length(ft) Quantity(tons) Unit Cost Cost Overlay, 3-inch depth 24 19,008 9000 $350.00 $3,150,000.00
Pulverize and overlay $3,644,208.00 Estimating notes: For estimating purposes a unit weight of 155 pounds per cubic foot was used to estimate tons of mix for overlay. Unit cost for overlay includes: binder, traffic control, stripping, mobilization, testing, and surveying. Does not include cost of curb and drainage correction costs. Crack Seal Estimated 1500 LF per mile of road way in segment 2 @ $5.00/LF = 7.0 X
1500 X $5.00=$52,500.00 4.2 Metal and Concrete Box Culverts All metal and concrete box culverts inspected have the minimum specified cover to withstand an H-20 loading. The culverts with the least amount of cover and should be monitored during construction are the culverts at sites #26 and #68, see Table 8. It is also recommended that the masonry stone work at all structures including box culverts and retaining walls be photographed prior to start of ATST project work. Unless a construction vehicle comes in direct contact with a structure it is not anticipated that the minimal construction traffic would damage the stone masonry. Pre construction photos of all
Central Federal Lands Highway Division Haleakala Highway Haleakala Highway Report Haleakala National Park __________________________________________________________________________________________
31
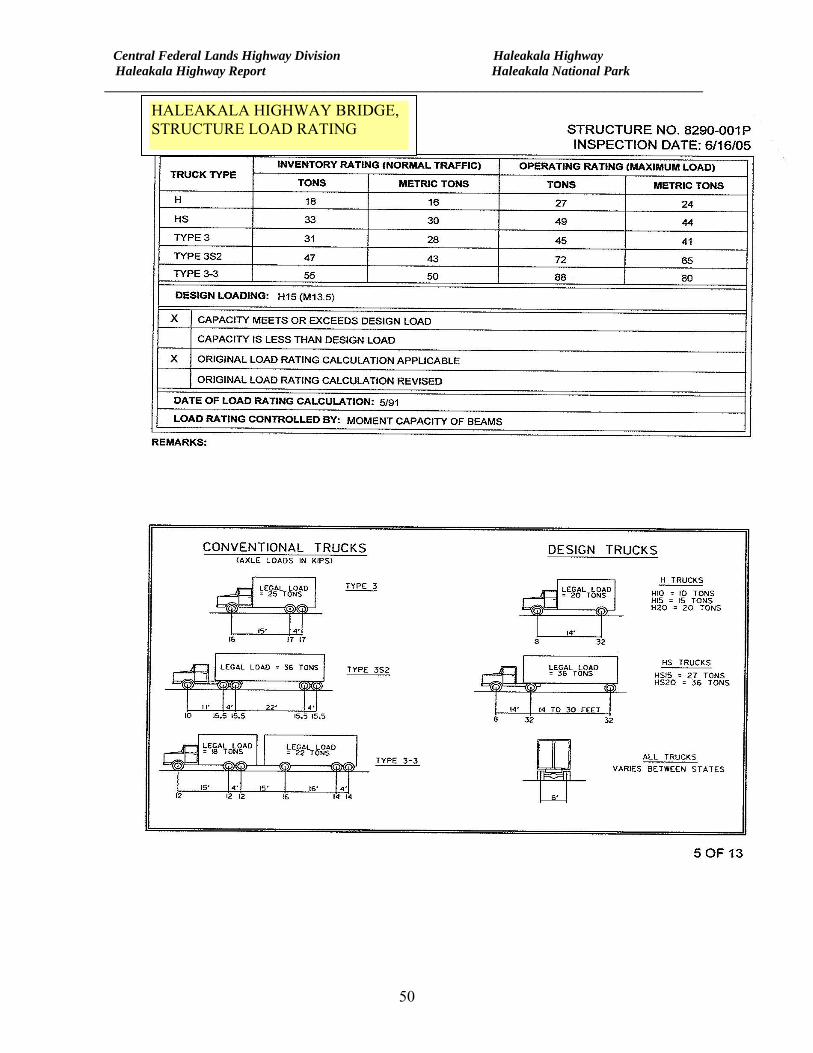
structures are recommended as this may eliminate any issues after the project is completed to address whether any resulting damage was ATST construction related. 4.3 Bridge Based on conversation with ATST representatives and as noted in their table for duration and number of loads it is our understanding that the possibility of heavier than legal loads may be necessary to cross the Haleakala Bridge during the construction of the proposed project. As this bridge is composed of concrete, issues with the number of cycles (fatigue) will not be of concern as much as the actual weight of the loadings themselves. Although constructed in 1934, the bridge has a favorable load rating as was noted in the 2005 inspection report. Nevertheless it would be prudent to require written notification within 30 days of each anticipated occurrence of vehicle loadings above legal limits crossing the structure. Diagrams showing vehicle configuration (axle spacings and width), weight per axle, and overall vehicle widths and lengths should be presented to the NPS for verification by the Federal Lands Highway Bridge Office, for conformance with current load rated capacity. With the anticipated heavy and “wide” loads that will be necessary for the construction, the probability of accidental damage to the bridge will also proportionally increase. It is recommended that prior to the construction notice to proceed that the bridge be photographed, inspected, and documented to existing condition. Periodic monitoring during the construction project may be employed if actual construction traffic deviates from those presented herein or if concerns arise, to verify that the bridge is not being impacted due to construction activities resulting from the project. 4.4 Other Structures UNDERGROUND UTILITIES: Under ground utilities exist under the road in the uphill lane beginning at MP 20.3 and they exist under the mainline roadway into the Haleakala Visitor Center. The utility line, according to construction records is approximately 24-inches below the existing pavement. The line is inside a 6-inch schedule 40 PVC casing and the casing is in enclosed in a 12-inch concrete jacket. There are a total of 4 manhole covers in the roadway approximately 3.5 feet wide by 5.5-feet long in this run of utility line. Precautions should be taken to ensure no damage to the covers is done during the haul of the heavier loads to the project site. Recommended precautions are:
• Avoid direct axle loading on the covers • Replace the existing covers with heavier gage steel • Reinforce the existing covers with additional steel bracing
Central Federal Lands Highway Division Haleakala Highway Haleakala Highway Report Haleakala National Park __________________________________________________________________________________________
32
BITUMINOUS CURB: There are numerous sections of bituminous curb throughout the route. The curb in the upper portion of the route is in tack and functional. The curb in the lower section of the road, below MP 16.0 does not have a fully exposed face as the numerous overlays have decreased the height and thus the water carry capacity. Tires from over sized loads (length) could potentially damage the curb if run over. 5.0 SUMMARY When compared to normal daily traffic using Haleakala Highway (passenger and bus traffic), the low stress/volume of traffic, 1397 ESALs, related to the ATST project is expected to have little effect on the roadway sections from MP 10.3 to 11.2 and 14.8 to 21.2 assuming the traffic axle loadings are legal and the volume of traffic as estimated by the ATST staff is correct. From MP 11.2 to 14.8, the deterioration of this section will continue at relatively rapid pace with or without ATST traffic. There are numerous areas within this section that have failed and are at terminal serviceability. It is recommended that the Park begin planning for a rehabilitation project in this section. While the rehabilitation my not have to occur in the next 3 to 5 years, it is expected that reactive and routine maintenance (small patches & pothole repairs) will increase until rehabilitation is completed. The analysis and information contained is this report is based on measured physical characteristics of the roadway materials and visual evaluation of the roadway. Given the high variability of the nature of soils at varying moisture contents and varying stages of remaining service life it is difficult to ascertain with confidence how a particular structural roadway section will perform. For question or comments concerning this report contact Mike Voth (720-963-3505) or Rick Marquez (720-963-3398).
Central Federal Lands Highway Division Haleakala Highway Haleakala Highway Report Haleakala National Park __________________________________________________________________________________________
33
APPENDIX A
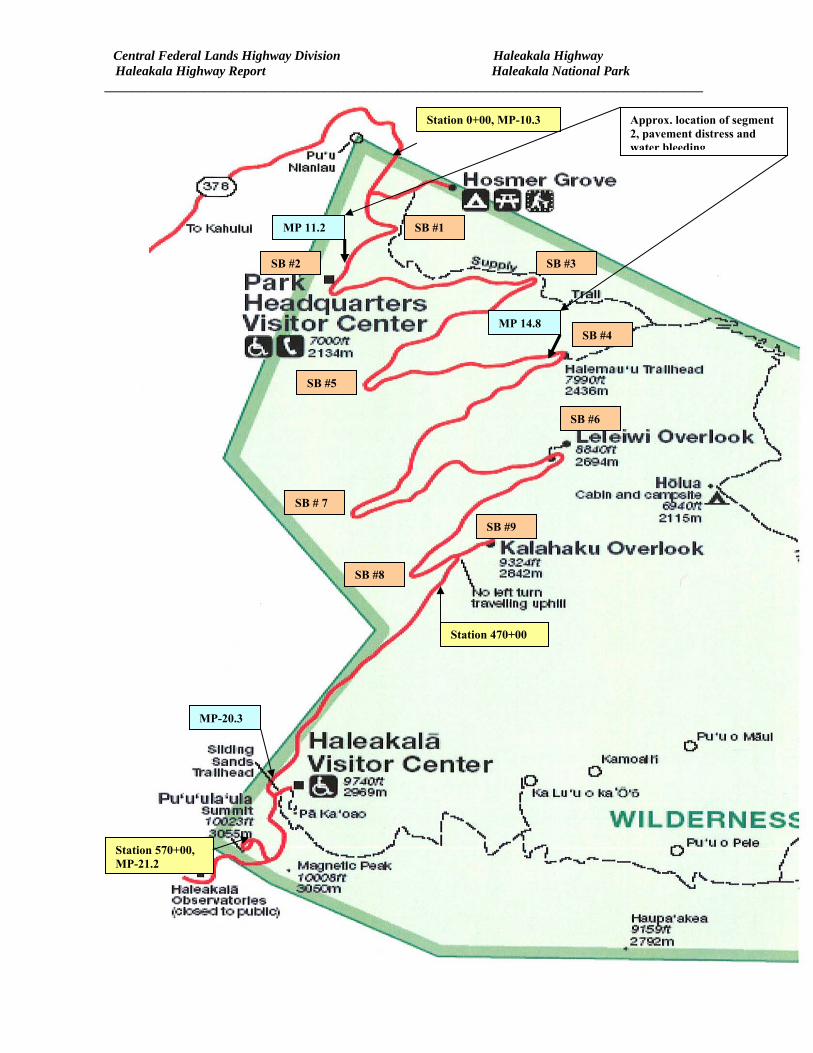
SITE MAP
Central Federal Lands Highway Division Haleakala Highway Haleakala Highway Report Haleakala National Park __________________________________________________________________________________________
34
Station 0+00
SB #9
MP-20.3
SB #1
SB #3
SB #4
SB #6
SB #5
SB # 7
SB #8
Station 570+00, MP-21.2
SB #2
Station 0+00, MP-10.3
MP 14.8
MP 11.2
Station 470+00
Approx. location of segment 2, pavement distress and water bleeding

Central Federal Lands Highway Division Haleakala Highway Haleakala Highway Report Haleakala National Park __________________________________________________________________________________________
35
APPENDIX B
PHOTOS
Central Federal Lands Highway Division Haleakala Highway Haleakala Highway Report Haleakala National Park __________________________________________________________________________________________
36
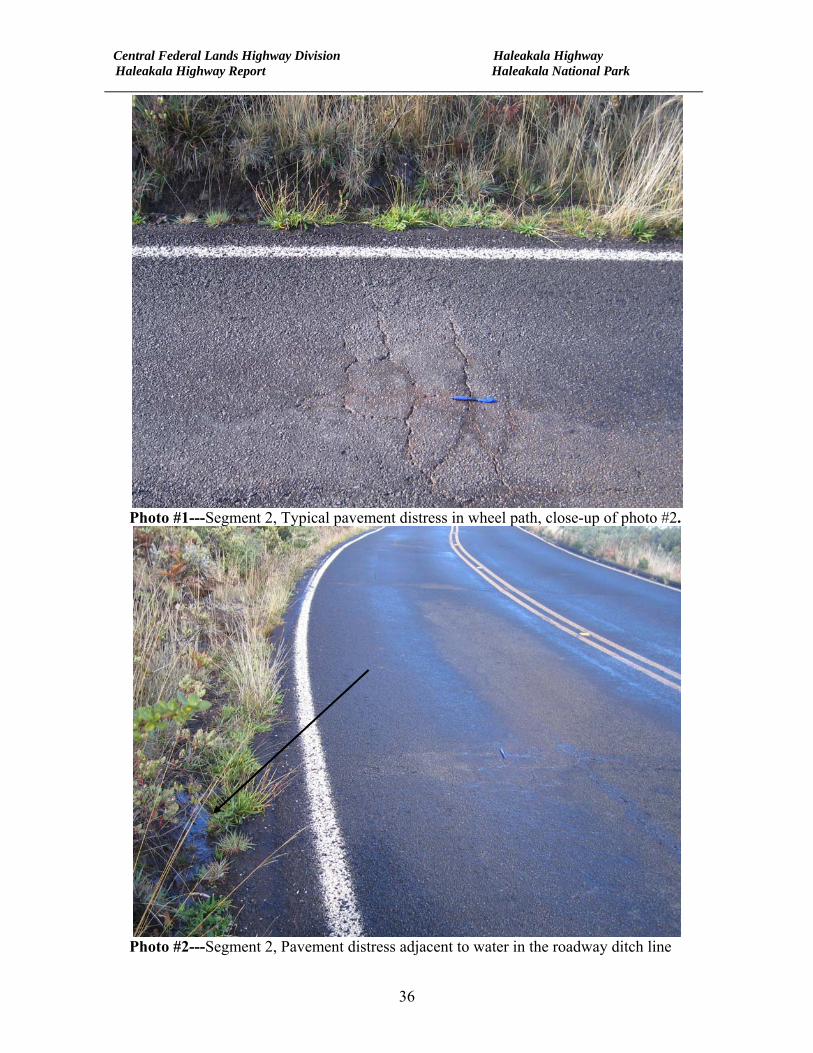
Photo #1---Segment 2, Typical pavement distress in wheel path, close-up of photo #2.
Photo #2---Segment 2, Pavement distress adjacent to water in the roadway ditch line
Central Federal Lands Highway Division Haleakala Highway Haleakala Highway Report Haleakala National Park __________________________________________________________________________________________
37
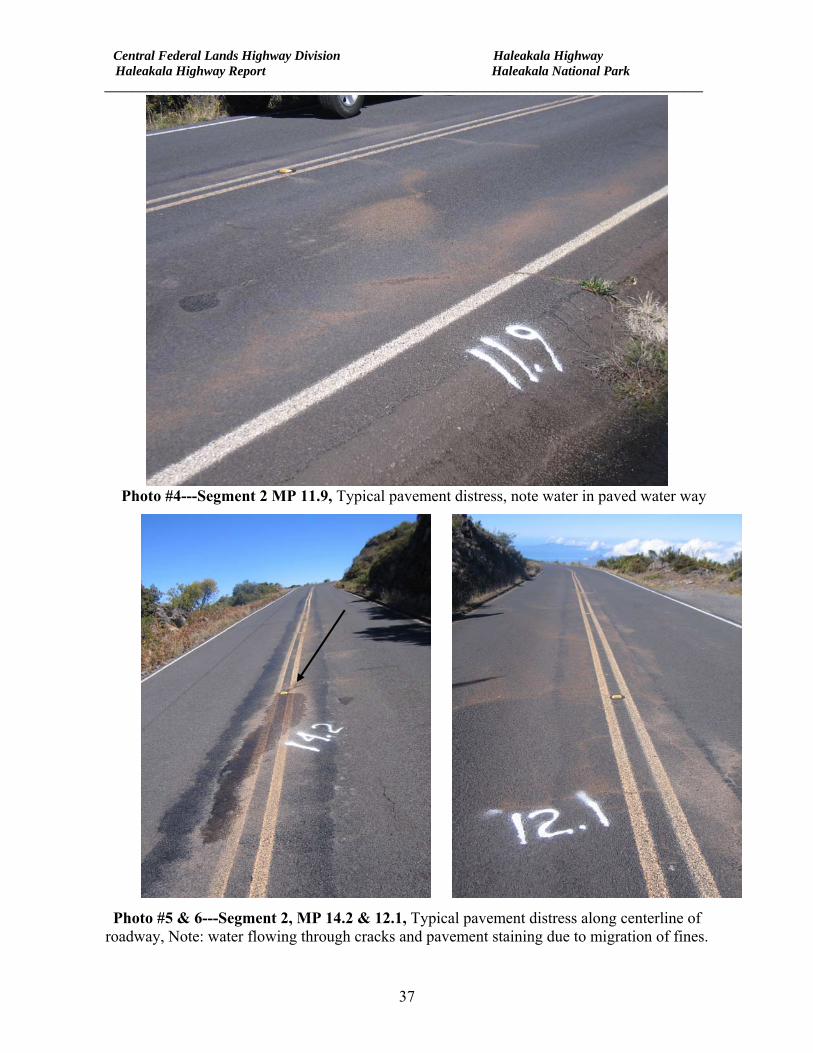
Photo #4---Segment 2 MP 11.9, Typical pavement distress, note water in paved water way
Photo #5 & 6---Segment 2, MP 14.2 & 12.1, Typical pavement distress along centerline of
roadway, Note: water flowing through cracks and pavement staining due to migration of fines.
Central Federal Lands Highway Division Haleakala Highway Haleakala Highway Report Haleakala National Park __________________________________________________________________________________________
38
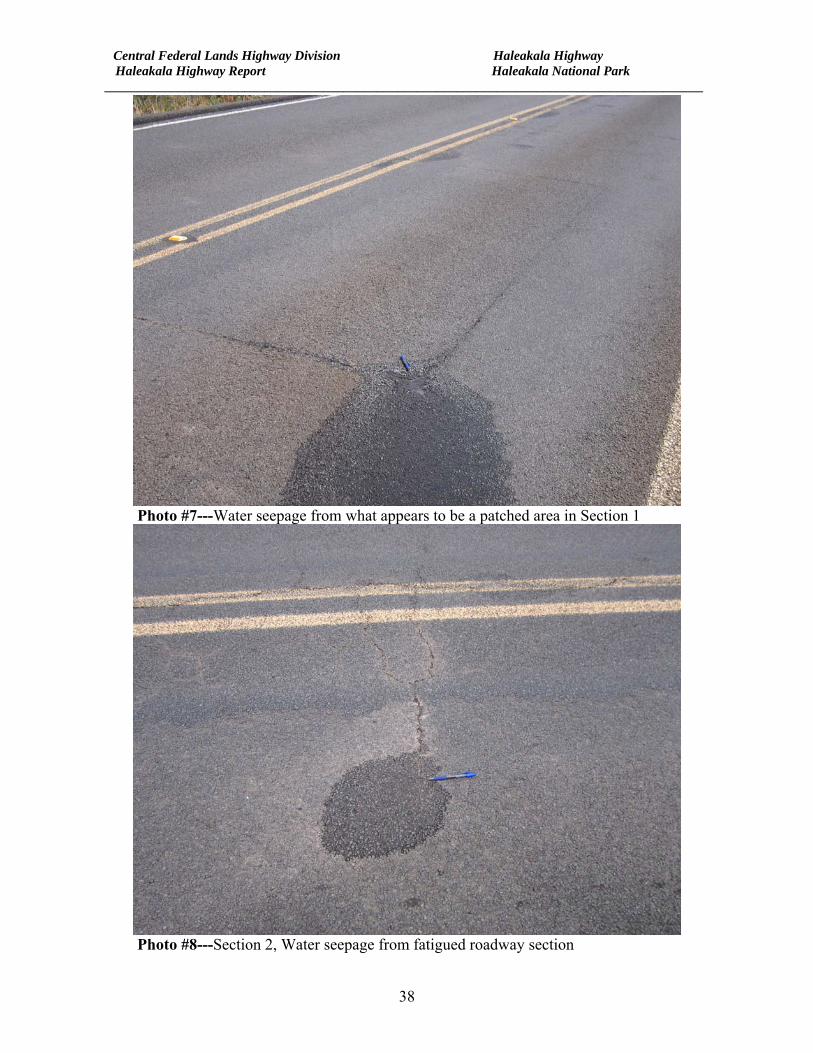
Photo #7---Water seepage from what appears to be a patched area in Section 1
Photo #8---Section 2, Water seepage from fatigued roadway section
Central Federal Lands Highway Division Haleakala Highway Haleakala Highway Report Haleakala National Park __________________________________________________________________________________________
39
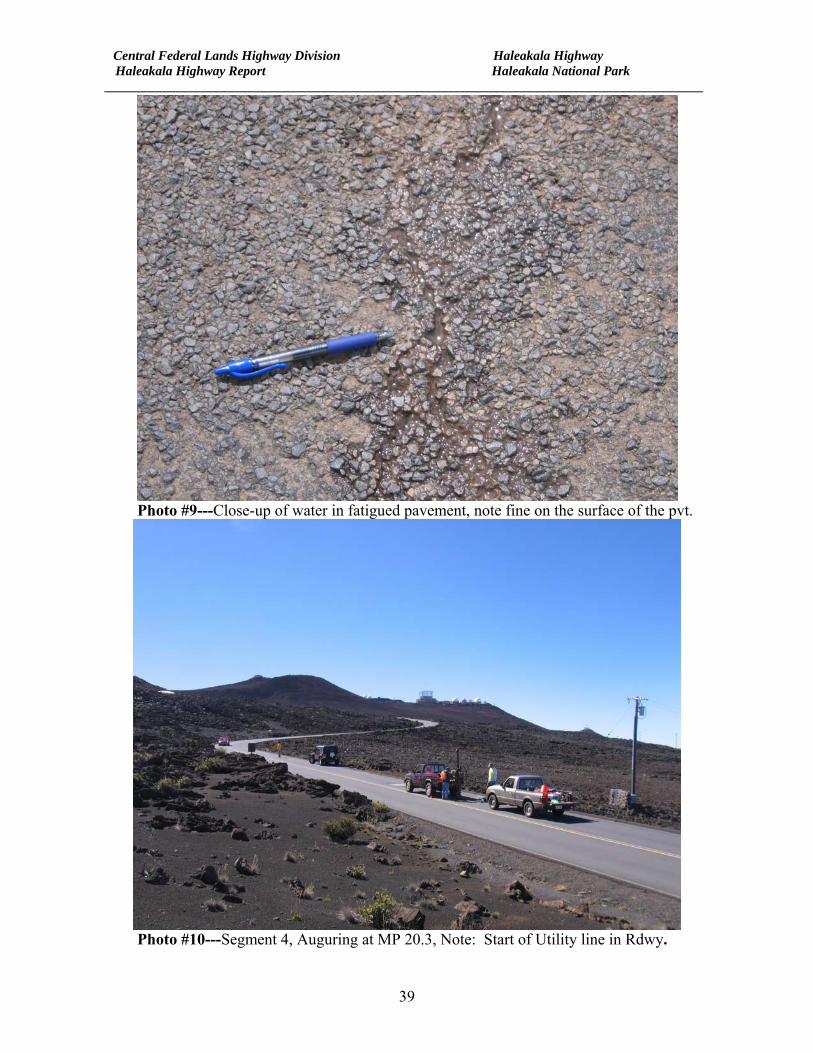
Photo #9---Close-up of water in fatigued pavement, note fine on the surface of the pvt.
Photo #10---Segment 4, Auguring at MP 20.3, Note: Start of Utility line in Rdwy.
Central Federal Lands Highway Division Haleakala Highway Haleakala Highway Report Haleakala National Park __________________________________________________________________________________________
40
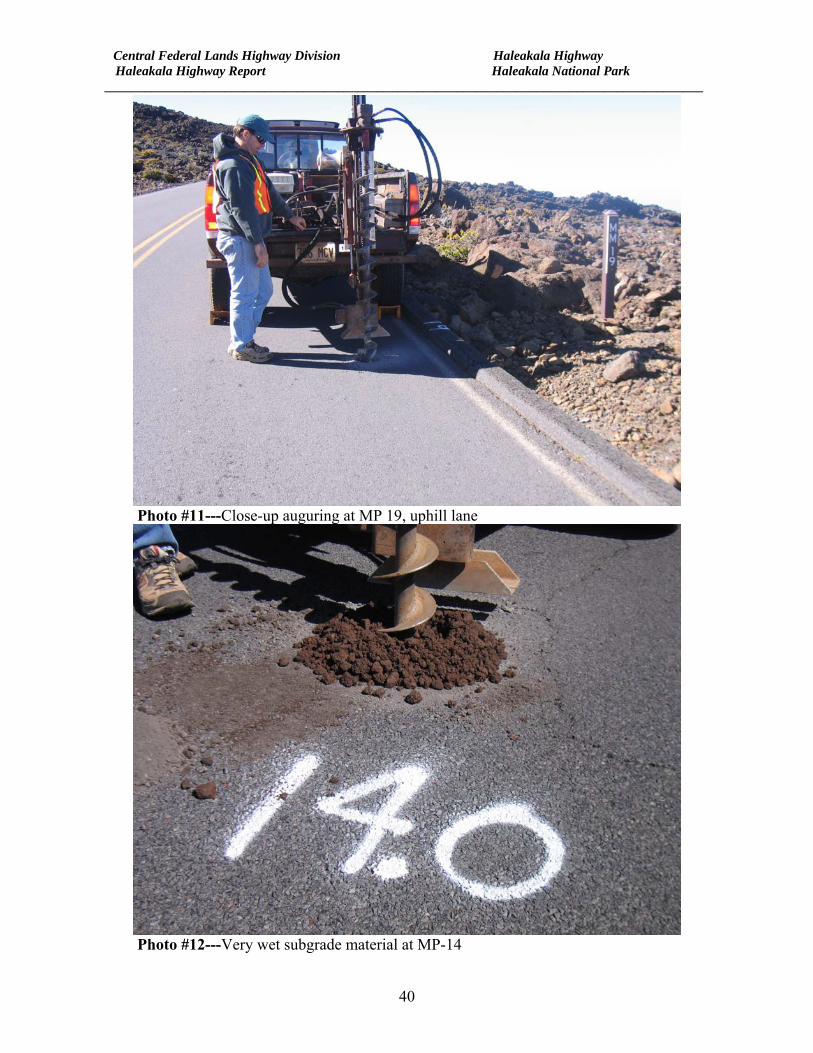
Photo #11---Close-up auguring at MP 19, uphill lane
Photo #12---Very wet subgrade material at MP-14
Central Federal Lands Highway Division Haleakala Highway Haleakala Highway Report Haleakala National Park __________________________________________________________________________________________
41
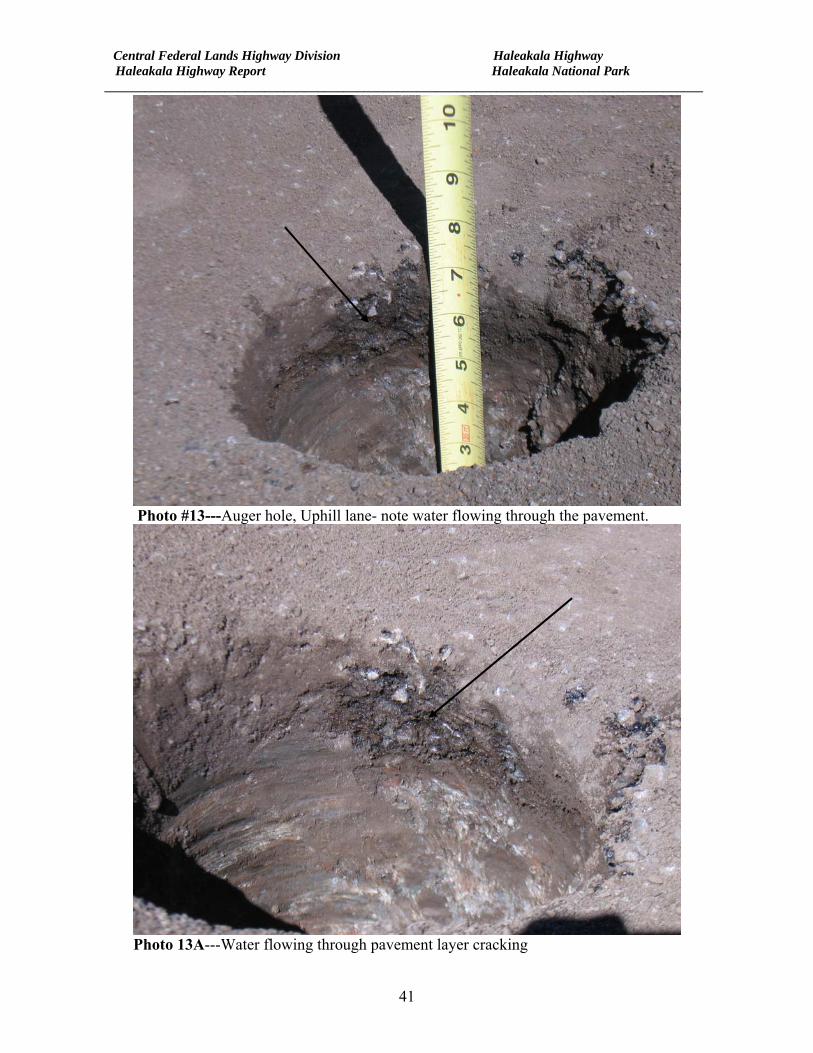
Photo #13---Auger hole, Uphill lane- note water flowing through the pavement.
Photo 13A---Water flowing through pavement layer cracking
Central Federal Lands Highway Division Haleakala Highway Haleakala Highway Report Haleakala National Park __________________________________________________________________________________________
42
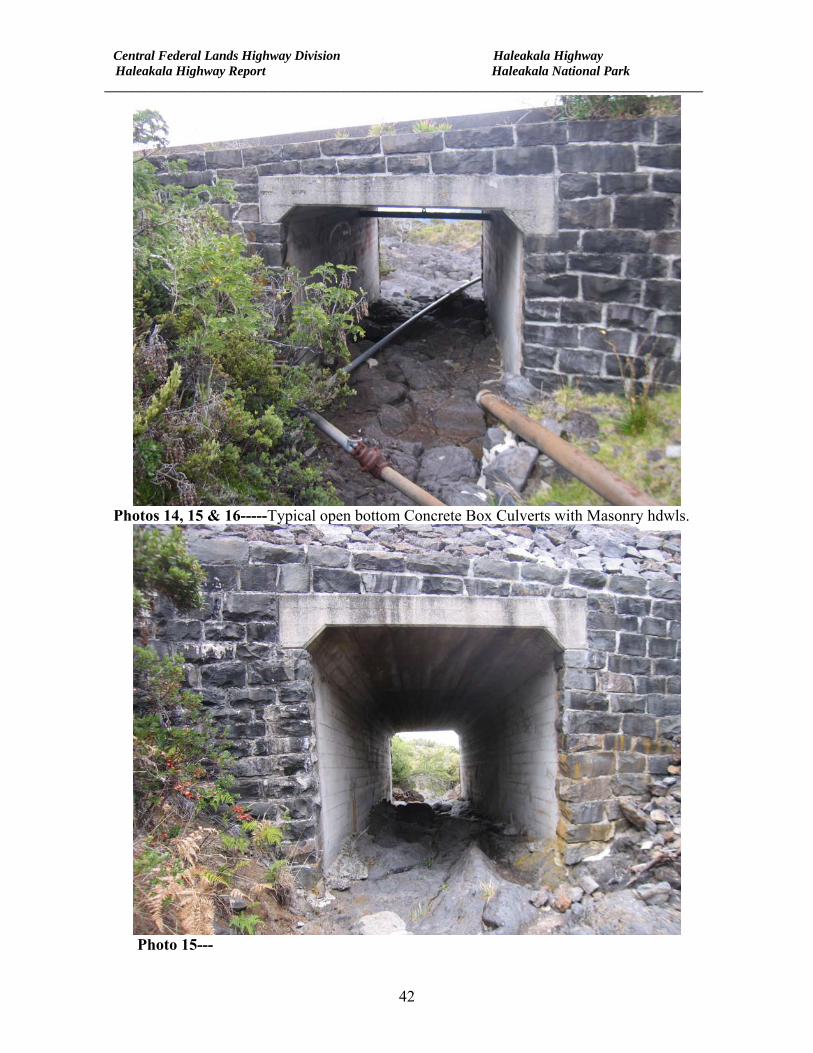
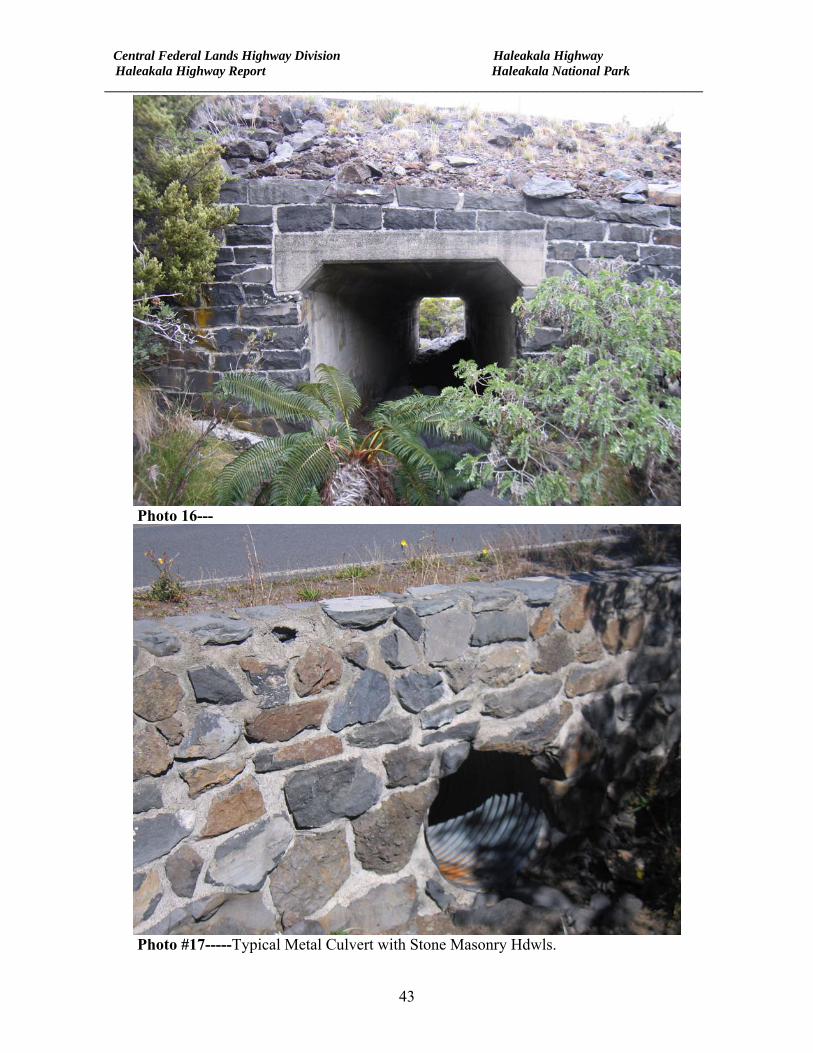
Photos 14, 15 & 16-----Typical open bottom Concrete Box Culverts with Masonry hdwls.
Photo 15---
Central Federal Lands Highway Division Haleakala Highway Haleakala Highway Report Haleakala National Park __________________________________________________________________________________________
43
Photo 16---
Photo #17-----Typical Metal Culvert with Stone Masonry Hdwls.
Central Federal Lands Highway Division Haleakala Highway Haleakala Highway Report Haleakala National Park __________________________________________________________________________________________
44
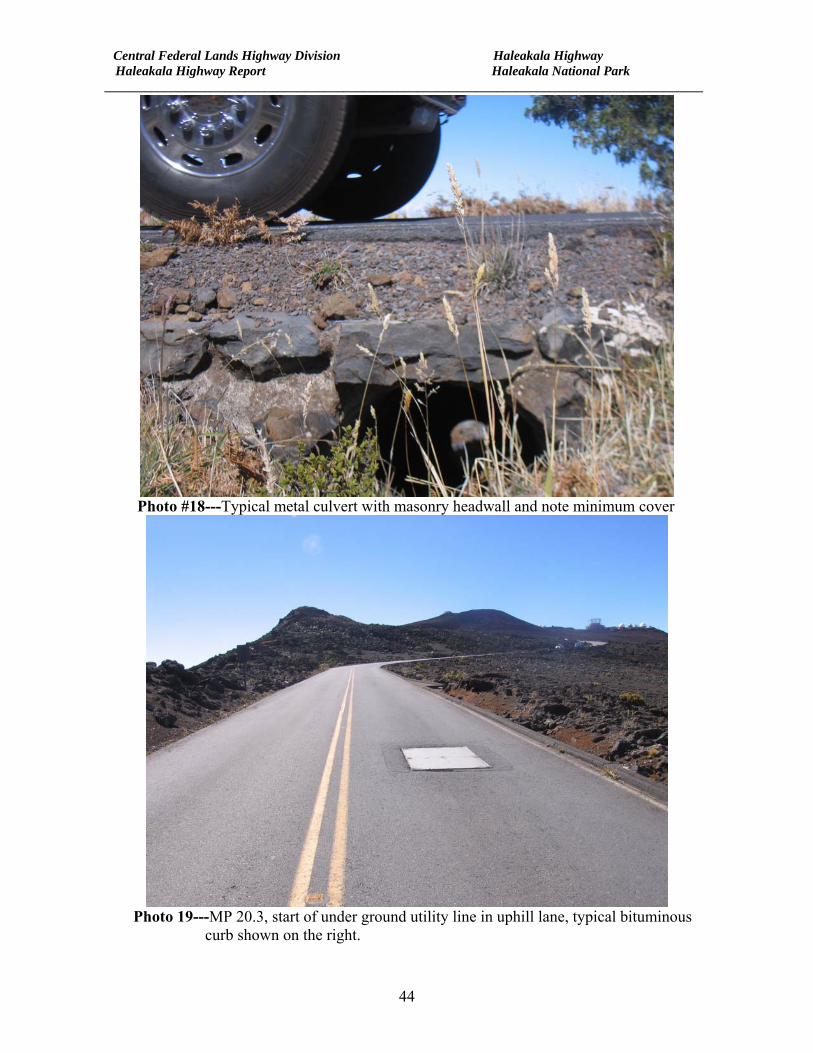
Photo #18---Typical metal culvert with masonry headwall and note minimum cover
Photo 19---MP 20.3, start of under ground utility line in uphill lane, typical bituminous curb shown on the right.
Central Federal Lands Highway Division Haleakala Highway Haleakala Highway Report Haleakala National Park __________________________________________________________________________________________
45
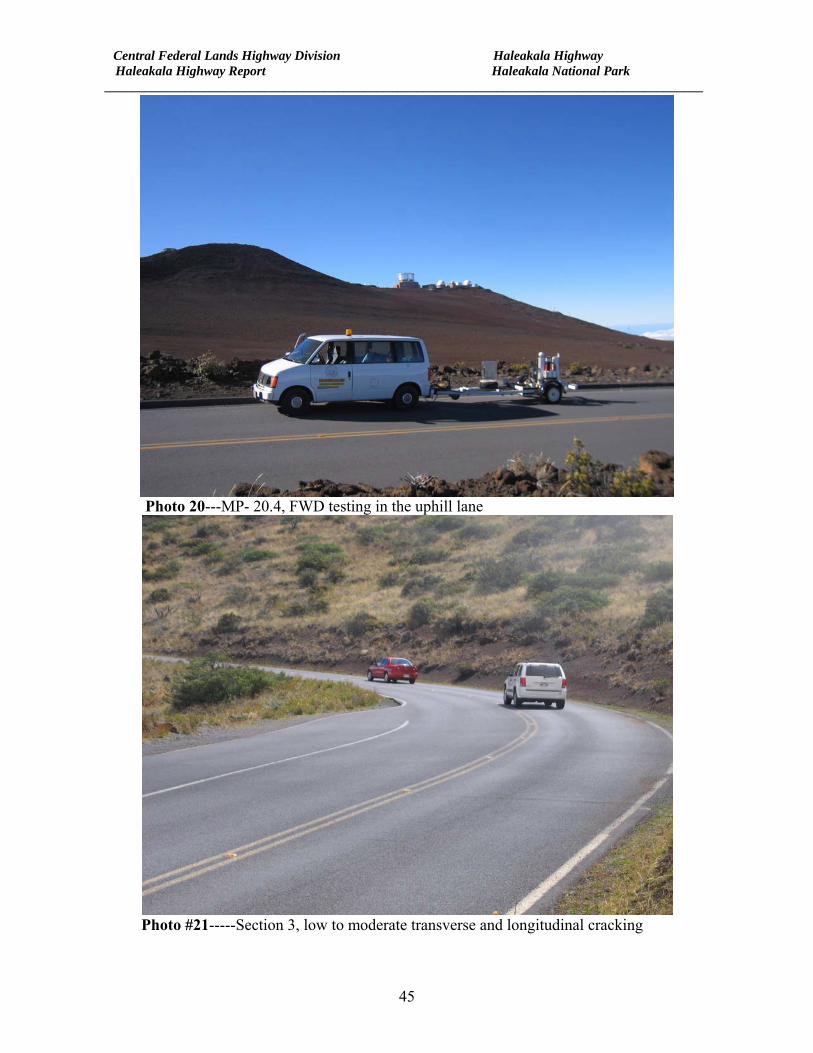
Photo 20---MP- 20.4, FWD testing in the uphill lane
Photo #21-----Section 3, low to moderate transverse and longitudinal cracking
Central Federal Lands Highway Division Haleakala Highway Haleakala Highway Report Haleakala National Park __________________________________________________________________________________________
46
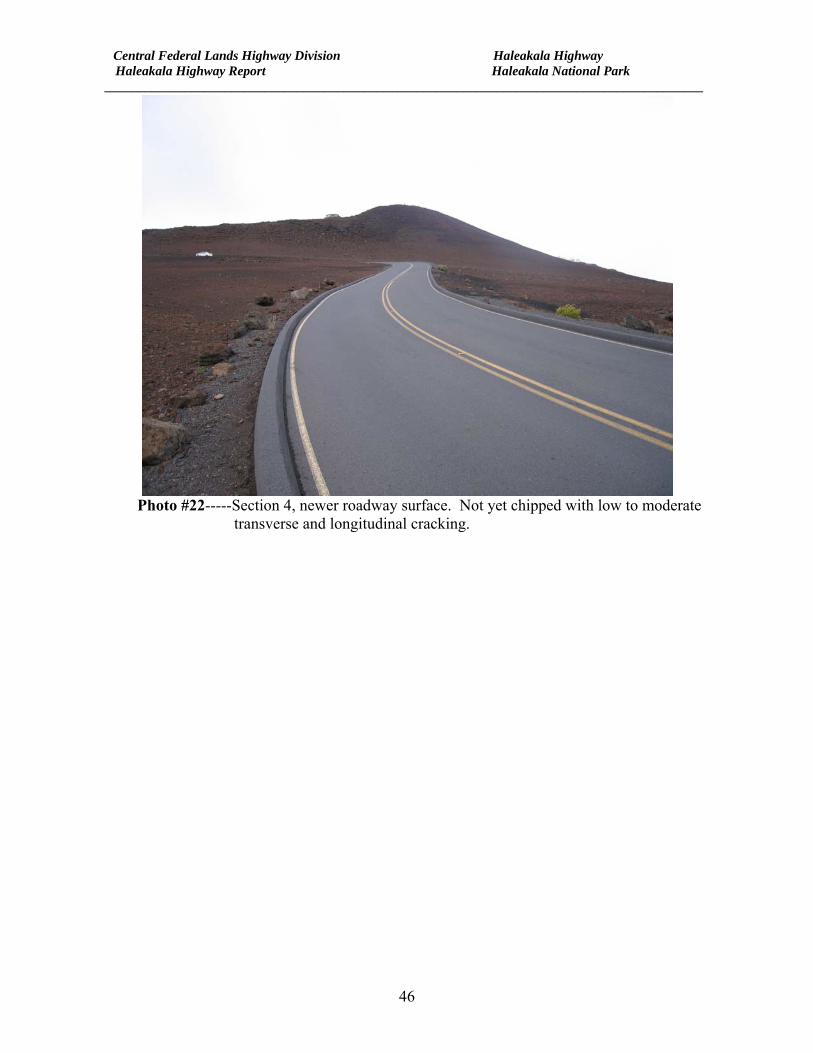
Photo #22-----Section 4, newer roadway surface. Not yet chipped with low to moderate transverse and longitudinal cracking.
Central Federal Lands Highway Division Haleakala Highway Haleakala Highway Report Haleakala National Park __________________________________________________________________________________________
47
APPENDIX C
VEHICLE SCHEMA
Central Federal Lands Highway Division Haleakala Highway Haleakala Highway Report Haleakala National Park __________________________________________________________________________________________
48
FHWA VEHICLE CLASS
Central Federal Lands Highway Division Haleakala Highway Haleakala Highway Report Haleakala National Park __________________________________________________________________________________________
49
HDOT VECHICLE CLASS
Central Federal Lands Highway Division Haleakala Highway Haleakala Highway Report Haleakala National Park __________________________________________________________________________________________
50
HALEAKALA HIGHWAY BRIDGE, STRUCTURE LOAD RATING
Central Federal Lands Highway Division Haleakala Highway Haleakala Highway Report Haleakala National Park __________________________________________________________________________________________
51
APPENDIX D
SOIL CLASSIFICATION CHARTS
Central Federal Lands Highway Division Haleakala Highway Haleakala Highway Report Haleakala National Park __________________________________________________________________________________________
52
AASHTO CLASSIFICATION
Central Federal Lands Highway Division Haleakala Highway Haleakala Highway Report Haleakala National Park __________________________________________________________________________________________
53
USCS CLASSIFICATIONS
Central Federal Lands Highway Division Haleakala Highway Haleakala Highway Report Haleakala National Park __________________________________________________________________________________________
54
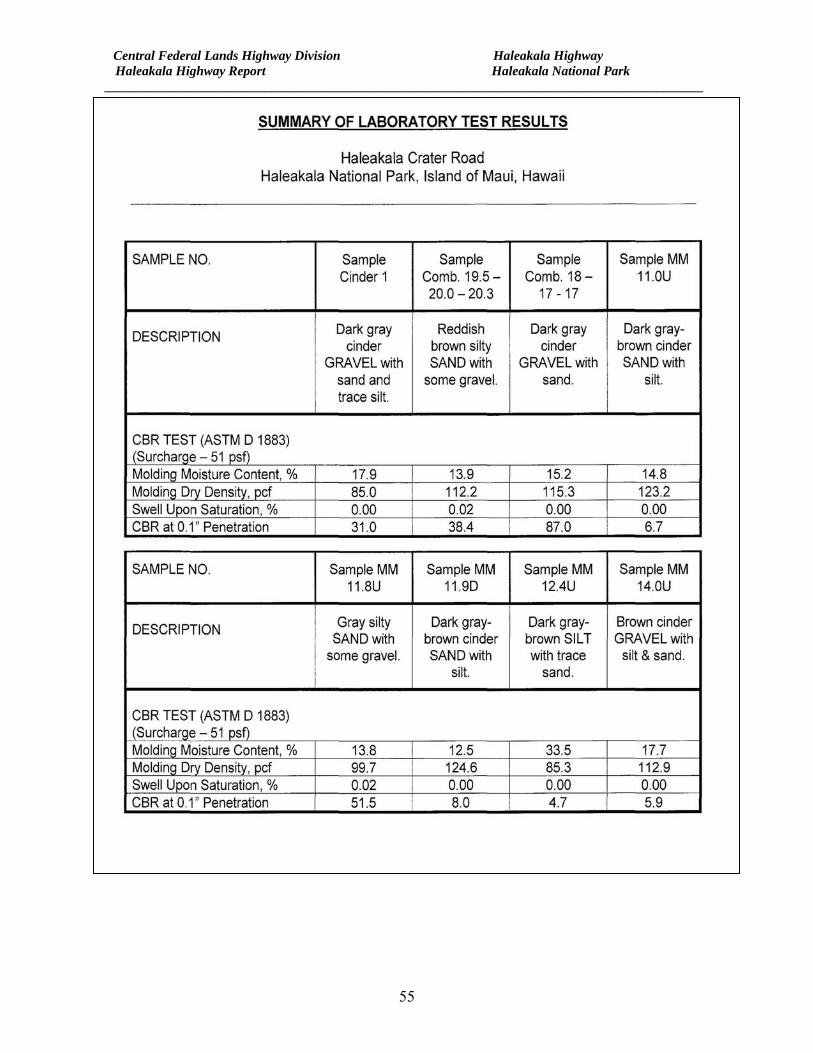
APPENDIX E
SUMMARY OF SOIL TESTS
Central Federal Lands Highway Division Haleakala Highway Haleakala Highway Report Haleakala National Park __________________________________________________________________________________________
55

Central Federal Lands Highway Division Haleakala Highway Haleakala Highway Report Haleakala National Park __________________________________________________________________________________________
56