haiti’s energy sector development plan 2007 – 2017 · ministry for public works, transportation...
TRANSCRIPT

Ministry for Public Works, Transportation and Communications
Bureau of Mines and Energy Electricity of Haiti
(With the technical assistance of the International Atomic Energy Agency)
Haiti Energy Sector Development Plan 2007 - 2017
* This document was prepared by Ministry for Public Works, Transportation and Communications - Bureau of Mines and Energy, and Electricity of Haiti. The IAEA’s role was to provide overall co-ordination and guidance throughout the conduct of the study, and to guarantee that adequate training in the use of IAEA energy planning models was provided to the members of the Haitian national team.
November 2006
i

TABLE OF CONTENTS
ABSTRACT.......................................................................................................................................... IV
PREFACE................................................................................................................................................1
1 COUNTRY OVERVIEW...............................................................................................................2
2 PRESENT STATUS OF THE HAITIAN ENERGY SECTOR .................................................2 2.1 PRESENT FINAL ENERGY CONSUMPTION BY ENERGY FORM AND BY SECTOR...............................2 2.2 PRESENT STATUS OF ENERGY SUPPLY SUBSECTORS....................................................................3
Fuel wood and charcoal, deforestation ............................................................................................3 Petroleum products ...........................................................................................................................4 LPG : Liquefied Petroleum Gas .......................................................................................................5 Coal/Lignite ......................................................................................................................................5 Domestic oil and coal exploration (institutional aspects) ................................................................5
2.3 ELECTRICITY..............................................................................................................................5 Electricity generation system............................................................................................................5 Electrical networks ...........................................................................................................................6 Technical and non-technical electricity losses .................................................................................7 Illegal consumption of electricity in households...............................................................................7 Hydro potential .................................................................................................................................9 Wind energy ......................................................................................................................................9 Solar energy ......................................................................................................................................9
2.4 MUNICIPAL SOLID WASTE ENERGY.............................................................................................9 2.5 OTHER LOCAL ENERGY RESOURCES .........................................................................................10
3 KEY ISSUES INVOLVING THE HAITI ENERGY SECTOR...............................................10 3.1 FIREWOOD AND CHARCOAL......................................................................................................10 3.2 OIL AND GAS SECTOR ...............................................................................................................10 3.3 COAL (LIGNITE) DEPOSIT..........................................................................................................11 3.4 ELECTRICITY SECTOR...............................................................................................................11 3.5 WIND ENERGY..........................................................................................................................11 3.6 SOLAR ENERGY ........................................................................................................................11 3.7 MUNICIPAL SOLID WASTE ENERGY...........................................................................................11 3.8 BAGASSE..................................................................................................................................11
4 FUTURE ENERGY NEEDS AND SUPPLY OPTIONS ..........................................................11
4.1 FINAL ENERGY DEMAND FORECAST BY ENERGY FORM AND BY SECTOR ...................................11 4.2 ENERGY SUPPLY SECTOR DEVELOPMENT OPTIONS ...................................................................12
Fuel wood and charcoal, energy substitution to avoid further deforestation.................................12 Energetic forests .............................................................................................................................14 Energetic crops ...............................................................................................................................14 Petroleum products .........................................................................................................................15 Domestic lignite production............................................................................................................15
4.3 ELECTRICITY............................................................................................................................15 Generation system expansion until 2015 ........................................................................................15 Systematic provision of resources for power generation................................................................21 Transmission and distribution network ..........................................................................................21 Systematic maintenance of capacities.............................................................................................21 Periodic study on electric system development...............................................................................21 Electricity commercialisation .........................................................................................................21 New legal framework ......................................................................................................................22
ii

Logistic and human resources ........................................................................................................22 4.4 WIND ENERGY..........................................................................................................................22 4.5 SOLAR ENERGY ........................................................................................................................23 4.6 MUNICIPAL SOLID WASTE ENERGY...........................................................................................23
5 OBJECTIVES OF THE ENERGY POLICY OF THE HAITIAN GOVERNMENT ...........23
6 ENERGY SECTOR REFORM ...................................................................................................24
7 ENERGY SECTOR DEVELOPMENT PLAN..........................................................................26
8 LIST OF ABBREVIATIONS AND ACRONYMS ....................................................................30
9 REFERENCES..............................................................................................................................31
10 APPENDICES ...........................................................................................................................32
iii

Abstract
Although self-sufficient for about 80% of its energy needs filled by domestic biomass fuel and some hydro-electrical sources, Haiti faces a severe energy crisis. This crisis is characterized by numerous factors, including: (1) the burden to the economy of the importation of petroleum products for fuel, (2) a very low per capita consumption and high energy intensity (energy consumption per GDP), (3) the insufficient development of the manufacture industry sector (19% of total energy consumption) and predominance of the residential sector (65% of consumption), (4) excessive biomass use leading to high levels of deforestation and land degradation, (5) increasing population growth at about 2.02% per year and (6) decreasing growth of the GDP per capita at about 2.6 % per year. Most fuel wood and charcoal (80%) is used in the household sector, mainly for cooking. The efficiency of stoves (mainly open) is very low (around 22% for traditional stoves and 30% for improved charcoal stoves). The intensive use of the fuel wood for cooking and production of charcoal, without systematic regeneration, causes further deforestation of the country. To offer the decision makers and various stakeholders a tool to improve this situation, a National Development Plan of the Energy Sector of Haiti is elaborated, with the support of the International Agency for Atomic Energy (IAEA), covering the period 2007-2032. This Plan has the following objectives: The objectives of the Haitian Government related to the energy sector are as follows:
− Support the recapitalization of enterprises in difficulty (case of EDH1); − Improve and modernize the management of public enterprises in key sectors, including EDH; − Improve the production and distribution of electricity in the country; − Strengthen the State’s regulatory role in key sectors of the economy, including energy; − Prepare and implement the reforms needed to create a favorable environment for local and
foreign investment; − Put a priority on a significant improvement in the provision of electricity in the country; − Promote alternatives to fuel wood and promote renewable energies including energetic crops
and forests. As far as the electricity sub-sector is concerned, the Government of Haiti has established the following priority objectives for the public utility EDH:
− A management contract with clear performance targets for the company. − Maintaining electrical service for at least 12 hours per day in Port-au-Prince and in the rest of
the country; − Increase the billing rate from 47% to 75% in the next 15 years and increase the commercial
profitability of the company; − Stabilization of EDH and establishment of conditions necessary for its recovery; − Improvement of the quality of the provided electricity and customer service; − Reduction of technical losses and increase of efficiency; − Reduction of fraud and theft of electricity; − Obtaining better conditions in the PPA2 contracts with private producers, taking into account
the interests of both parties.
1 EDH : Electricité d’Haïti, the Haitian electrical public utility. 2 PPA : Power Purchase Agreement.
iv
To stabilize EDH and enhance its services, a medium-term (5 years) management contract is considered, as well as implementation of a medium-term investment plan designed to increase access to electricity of the population from 12.5% in present to 20% by 2013. A critical issue, both in terms of energy and of environmental integrity is the conservation of natural resources, especially forests through several measures:
− Support for more efficient use of charcoal and fuel wood; − Reforestation of strategic areas for the safety of the population, environmental protection and
tourism; − Generation of energetic forests and crops; − Conversion to diesel, bio-diesel and to LPG of 1,000 small enterprises that use wood as fuel; − Financial support to cellulose briquette producers; − Initiation of a study to determine the feasibility of wood imports or exchanges with lime; − Promotion of renewable energies (wind and solar) through institutional reinforcement (and
improved access for the poor to energy services). Promotion of bio-fuels through incentives for growing energetic crops and by encouraging investments in facilities for bio-fuels production and use. Main bio-fuels are bio-diesel, ethanol and methanol produced from bagasse and different fast growing plants. Energy sector reform is also a key concern. The reform of the energy sector today should be guided by the idea of finding the most suitable form of partnership between public needs and private interests. There is a need for state intervention through the reform of the energy sector, institutional and legal framework, new institutions and new and immediate measures. In conclusion, the present National Energy Development Plan aims to provide policy makers with quantitative and qualitative information on the Haitian energy sector, in order to design appropriate policy and strategies to achieve sustainable goals. It shall serve as a tool to meet the objectives of the Government strategy. It is consistent with the provisions of the Interim Cooperation Framework (ICF) up to the end of year 2006, but analyzes the energy sector more in detail on a longer time horizon, up to 2032. It also aims at recommending specific improvement and development measures for this sector for short (until end of 2008), medium (2008-2013) and long (2013-2032) terms.
v

vi

Preface
The present Haiti National Energy Sector Development Plan (NESDP) aims at providing policy
makers with quantitative and qualitative information on the Haitian energy sector. With this, decision
makers will be better equipped to design appropriate policy and strategies to achieve sustainable goals.
This Plan shall serve as a tool to meet the objectives of the Government for all forms of energy and in
correlation with related issues such as economic and social development. The NESDP is consistent
with the provisions of the Interim Cooperation Framework (ICF) up to the end of year 2006, but
analyzes the energy sector more in detail, on a much longer 25-year time horizon, up to 2032. This
rather extended period of time is selected in conjunction with the proposal, by the present Government,
to elaborate a long term vision for the sustainable development of Haiti.
The PNDSE also recommends specific improvement and development measures for the Energy sector
of Haiti for the following time horizons: short-term actions (until 2008), medium-term actions (2008-
2013), long-term actions (2013-2032).
1

Energy Development Plan for Haiti until 2017
1 Country overview
1 Haiti is located in the center of the Caribbean region in the Central America, western part of the island of Hispaniola, directly neighbour to Dominican Republic. Total area of the country is 27.250 square kilometres in a very mountainous morphology. In general, the country has two seasons – wet and dry – where the annual weighted average rain accounts for 1300 (from 400 to 3000)3 millimetres.
2 The Haitian population increased by 22.7% during the period 1990-2004, from 6.486 to 7.959 million
inhabitants, leading to an average annual growth rate of 1.56 % over the last fourteen years. Average population density is about 300 inhabitants per square kilometre while in the western part of the country and Port-au-Prince, it exceeds more than double. In rural areas, where 60% of population lives, two third of the workforce is involved in agricultural production. There is considerable additional pressure on the urban areas: the urban population has more than tripled from 1982 to 2003 going from 1.04 million to 3.2 million inhabitants. Overall, the population’s vulnerability is very high: 65% live under the poverty threshold. The principal health indicators are very alarming – infant and maternal mortality rates remain very high, half of the population does not have access to clean drinking water and only 28% have access to decent sanitation facilities. In terms of active population, the country has sufficient potential labour force as the population of the country is relatively young - 50% of population is less than 20 years old.
3 With an annual per capita GDP of US$ 488.6 in 2005 (from US$ 635 in 1986-1988, US$ 510 in 1996 and
US$444 in 2000), Haiti is the only country on the continent that appears on the list of least-developed countries. Over the past decades, Haiti experienced consequent decline of real per capita GDP with negative average annual growth rates of 2.4% in the 1980s and 2.6% in the 1990s, respectively. Such economic performance was particularly affected by the mismanagement of market liberalization of the 1980s, the military coup of 1991 and the (subsequent) international embargo of the beginning of 1990s, and finally the political crisis that lasts until the elections in 2006. Economic situation in the country is still fragile due to continuing socio-political fluctuation, which adversely effects the rehabilitation and maintenance of economic, social and institutional infrastructure. As the results, the country faces at present, considerable decrease of export revenues from industrial goods, increase of unemployment rates and weakening of tax collection and in turn, the control of public expenditures. Imports are three times higher than exports, counting in 2005 for roughly US$ 1,200 million. Any measures to increase imports for energy purposes should be taken with extreme caution due to low revenues of the population and therefore incapacity to afford.
4 In terms of distribution of GDP by economic activities, service sector accounts 45% share to the total GDP
(including 2% of energy) followed by agriculture and mining and construction with 24% and 21%, respectively. Industrial sector appears to represent only 10%. Over the past decades, the distribution of GDP had remained as such due to the limited technology available and the low level of capitalization, in addition to the weak socio-political environment.
5 Per capita annual final electricity consumption is only 84 kWh in 2000 the least amount in the Caribbean
area, as only 12.5% of the population is regularly connected to the grid.
2 Present status of the Haitian energy sector
2.1 Present final energy consumption by energy form and by sector 6 The total final energy consumption for year 2000 was 1,687 thousand toe. Fuel wood and charcoal with
1,262 thousand toe had the biggest share (75%), followed by motor fuels and fossil fuels, accounting 258 thousand toe (15%) and 89 thousand toe (5%), respectively. Electricity accounted 66 thousand toe (4%) and feedstock 12 thousand toe (1%).
3Inventaire des gaz a effet de serre : BME/FAMV pour le compte du MDE, 2000
2

7 By sector, industry consumed 328 thousand toe (19% of the total final energy consumption), transportation sector 203 thousand toe (12%), households 1,094 thousand toe (65%) and services 62 thousand toe (4%).
8 Haiti has a very low final energy consumption per capita, amounting 209 kgoe/capita in year 2001, as
compared to other countries in Latin America and Caribbean [1]: Bolivia 306, Nicaragua 403, Honduras 445, El Salvador 473, Ecuador 542, Guatemala 570, Dominican R. 626, Costa Rica 639, Panama 653, Cuba 806, Jamaica 876, Mexico 945, Venezuela 1501. (see Appendix 1)
9 The final energy intensity, final energy consumption per GDP, shows approximately 570 kgoe/1000
US$1995 in 2001, or the equivalent of 22.8 kgoe/1000Gdes. Compared to other countries in Latin America and Caribbean [1]: Jamaica 431, Cuba 403, Guatemala 361, Dominica R. 306, El Salvador 264, Mexico 195, Panama 195, Costa Rica 167, it shows a very inefficient use of energy in Haiti. (see Appendix 2).
10 The main part of fuel wood and charcoal (80%) is used in household sector mainly for cooking. The
efficiency of stoves (mainly open) is very low (around 22% for traditional stoves and 30% for improved charcoal stoves). The intensive use of the fuel wood for cooking and production of charcoal causes further deforestation of the country.
11 Electricity consumption represents only 4% of the total final energy. Less than 30% of the households are
connected (including illegal connections) to the grid and only 12.5% are regularly connected with meters. The largest sector for electricity consumption is industry (43%). But this sector represents only 10% of the GDP.
12 More than half (59%) of the motor fuels are used for passenger transportation. The car ownership is
relatively low (about 1 car for every 100 persons) as compared to other countries in Latin America and the Caribbean) in year 1994: Colombia 45.3, Brazil 19.0, Venezuela 13.4, Mexico 11.0 and Argentina 7.7. The average distance travelled by car is about 5500 km per car yearly.
2.2 Present status of energy supply subsectors
Fuel wood and charcoal, deforestation 13 As stated in paragraph 6 the most important sources of energy in Haiti are fuel wood and charcoal, which
account for 75% of the final energy consumption by all sectors in the year 2000. Charcoal is used by 90% of the households from Port-au-Prince and other major cities, and the charcoal chain from production to final consumption employs more than 150 thousand persons. Charcoal is made from trees, with a low conversion efficiency of about only 20% (5 kg of wood for 1 kg of charcoal). In terms of heat content, the conversion factor may be higher (60% for high moisture content wood and 40% for average moisture content wood). (see Appendix 3).
14 In the year 1982, available wood stock was estimated to 37.4 millions of cubic meters4 while about 6
millions of cubic meters were used for different purposes, including wood in construction/building sector where metallic pools should be used instead. Such consumption is equivalent to approximately 30 millions of trees annually harvested. At the same time it was estimated that only 20 millions of trees were planted but the survival rate is not given. However, the World Bank has indicated in 19915 a survival rate of about 40%, which implies that over the 20.000 trees planted only 8.000 are saved. The yearly reforestation capacity is then estimated at about 26% of the consumption, which is equivalent to 1.6 millions of cubic meters. However, the annual capacity of self-reproduction of natural wood without new plantations was also evaluated to 1.6 millions of cubic meters, i.e. roughly 26 % of the total wood used annually. If those figures are reliable, the country is left today with less than half of his wood stock of 1982 that is to say 18.6 millions of cubic meters, and if such trends were to be continued without any corrective actions, it is not pessimistic to forecast complete depletion of that resource in a very near future.
4 BDPA, 1989 : Gestion des Ressources Naturelles pour un Développement Durable en Haiti 5 ESMAP, 1991: Stratégie pour l’Energie Domestique
3

Petroleum products 15 Haiti has no domestic production of crude oil and refining capacities. Therefore, all needed petroleum
products are imported. The petroleum products subsector, which represents only 20-25% of the national energy supply, uses more than 35-50% of external receipts of the country. Consequently, it limits the local multiplier effects in economic development through insufficient domestic investment in other economic activities. Between 15 to 25% of these products are used for electricity generation. Moreover, some small distributors are mixing diesel and gasoline with kerosene to take advantage of the comparative low cost of this product.
16 Haiti is importing its petroleum products from Venezuela, via its refinery based in Curacao, from Trinidad
and Tobago (LPG) and sometimes from Panama on a market price basis. Recent years prices increases in oil and oil products put a higher pressure on the import / export commercial balance of the country.
17 During a very short period in the past the country benefited from the preferential terms of the San Jose
Accord according to which Mexico and Venezuela supply a total of 160,000 barrels per day (bpd) of crude oil (half of the total each) to 11 Central American and Caribbean nations (Barbados, Belize, Costa Rica, the Dominican Republic, El Salvador, Guatemala, Haiti, Honduras, Jamaica, Nicaragua and Panama) at discount prices. The accord came into existence on August 3, 1980 (after the second oil price shock) and it has been renewed on August 3, 2004. The pact also establishes “a cooperation mechanism to promote the economic and social development of the beneficiary nations”. The cooperation accord finances social-economic development projects in the participating nations, as well as trade of goods and services by Mexican and Venezuelan firms. The countries may also recoup up to 20% of expenditures under the Pact in the form of low interest long-term loans for development projects. If development projects are not achieved, then the 20% deferred payment is to be settled within five years. Haiti is not currently benefiting from San Jose Accord due to some unpaid balance in the past.
18 The Caracas Energy Accord is an extension of the San Jose Accord and now it co-exists with that accord. It
has been in effect since October 2000, after President Chavez and the leaders of the beneficiary countries, including Haiti, signed separate bilateral agreements. It does not involve Mexico, while Cuba is included in the list of twelve beneficiaries, next to Barbados, Belize, Costa Rica, the Dominican Republic, El Salvador, Guatemala, Haiti, Honduras, Jamaica, Nicaragua and Panama. The accord provides even “softer” conditions than San Jose pact. The Agreement is to be exclusively enforced by the public entities supported by Venezuela and the beneficiary country. However, each country may designate private companies to handle the logistics of transporting the imported volumes of hydrocarbons. The Caracas Accord is currently under full implementation by the Ministry of finance. The accord states that saved money due to the concessionary terms of the accord is dedicated to energy project implementation.
19 The Petro Caribe Accord also with Venezuela was signed in May 2006. According to this accord a credit
will be granted to the State of Haiti for purchasing petroleum products. 20 A total of 4 different institutions are presently managing the petroleum products subsector: Ministry of
Commerce through his Bureau of Petroleum Procurement, the Ministry of Economy and Finance, the Central Bank and the Importer/supplier companies, among them Total/ELF, Texaco, Esso and, Le National (DINASA) which recently took over from SHELL.
21 A very dynamic new commercial company called ECOGAZ is currently operating in the LPG market and
related stoves sales not only in the metropolitan region but also in the north, central and south parts of the country. Together with TOTAL/ELF, ECOGAZ is selling LPG in very small amounts through small refilling facilities to ease LPG penetration in less fortunate areas and even in suburban or rural areas.
22 Total petroleum product storage capacity is 1,688,451 barrels (bbl). Of this total storage capacity, diesel
accounts for 852,405 bbl, gasoline for 369,000 bbl, fuel oil for 178,095 bbl, kerosene for 139,200 bbl and LPG for 23,271 bbl. Comparing this storage capacity to the total annual consumption of petroleum products, including the fuel consumption of power plants, it seems to be currently (2000-2005) sufficient for 5-6 months of petroleum product consumption (see Appendix 4). In terms of storage capacity it is quite sufficient but it is important to know how much of this capacity holds all the time a strategic reserve of petroleum products to decrease the country vulnerability to oil product disruption. As an example, European Union countries are obliged to maintain an oil and oil products stock to cover 90 days of consumption.
4

LPG : Liquefied Petroleum Gas 23 LPG is one of the sources of energy used by the household sector and which represents 1.5% of the energy
balance, with one ton of LPG being the useful energy equivalent of 4.7 tons of charcoal. On this basis, it would require 60,000 tons of LPG to replace the total demand of charcoal [2]. In a previous study [3], the highest annual consumption level for the LPG used in households was evaluated to 6480 tons. Based on the assumption that an average household uses 1.5 cylinders (1 cylinder = 25 pounds) of LPG per month, this means that approximately 31,300 households might be entirely reliant on LPG. Also LPG is used by a number of hotels, restaurants and small enterprises (bakeries, dry cleaners etc.).
Coal/Lignite 24 Lignite is founded in three different locations in the country: Camp Perrin and Lazile in the south, and
Maïssade in the central plateau. Camp Perrin lignite is a very small deposit of about less than one million tons while Lazile is known only for some outcrops. The best deposit according to today studies is located at Maïssade.
25 The Maïssade lignite deposit is located 12 kilometers north-west of Maïssade town (200 kilometers north of
Port-au–Prince), in the central region of the country, with the following characteristics: − Proven amount 8.7 million of tons − Average depth 10 to 35 meters − Average calorific content 2050 kcal/kg − Average ash content 40% − Average sulphur content 6%
26 An oil drill located at about 5 kilometers north-east of the main deposit, made during oil exploration back in
the sixties, indicates that at about 300 meters depth there are several lignite layers totalizing 250 meters of thickness. Furthermore, the feasibility study of the above main 8.7 million tons deposit has indicated that at about 1 km south-east and north-west of this main deposit there are two other probably small lignite deposits to be linked to the main one by two drills of about 100 feet each in order to complete the evaluation of the basin.
27 Imported coal was mainly used in fuelling a cement plant but since mid-1980’s Haiti has stopped its
imports.
Domestic oil and coal exploration (institutional aspects) 28 Haiti is investigating the potential oil and coal reserves. Their exploration is the responsibility of the Bureau
of Mines and Energy (BME), which is in charge of negotiating concession contracts with private companies, supervise their works in accordance with the terms of the contracts and report to the Ministry of Public Works, Transportation and Communications (MTPTC).
2.3 Electricity
Electricity generation system 29 According to the law of August 9, 1971, the Electricité d’Haiti (EDH) was established. EDH is an
autonomous state-owned, vertically integrated enterprise that has the monopoly of the production, transmission, distribution and commercialization of electricity throughout the country. EDH is reporting to the MTPTC that names its Board of Directors.
30 The Board of Directors is based at Port-au-Prince in Metropolitan region while in each other region the
utility maintains delegates to manage its assets. The metropolitan region is the most important area, with three big power plants (total installed capacity: 171.87 MW: two thermal, Varreux (67.95 MW) and Carrefour (49.92 MW), and one hydro, Péligre (54 MW) which is subject to a severe sedimentation since long time yet. The other electric regions are: North (10.65 MW), Artibonite (16.10 MW), South (8.25 MW) and Centre-West (4.92 MW) and the semi-autonomous centre of Jacmel (4.32 MW). They have medium and small power plants with installed capacities between 300 kW and 9850 kW. Countrywide the total
5

installed capacity of EDH is of 216.11 MW, out of which 154.36 MW in thermal technology and 61.75 MW in hydro power plants. The thermal units are diesel motors using generally diesel oil and rarely heavy fuel oil.
31 Independent Power Producers (IPP) have been operating in the electricity sector in Haiti since 1996. The
first IPP to sign a contract with EDH, in Cap Haitian, was Interselect SA in 1996. In 1998 a Power Purchase Agreement (PPA) was signed in Port au Prince with the company Haytian Tractor / Energy International for 20 MW supplied at the Varreux site. Next Asservin signed a contract for a capacity of 20 MW, also at Varreux in 2003. Asservin became Alstom in 2004 and increased its contracted capacity to 30 MW with an additional 20 MW standby capacity. Outside of the capital city, Sogener signed four PPAs in 2002 for a total installed capacity of 24 MW in four regions: Cap Haitien (8 MW), Artibonite (8 MW), Petit-Goave (4 MW) and Cayes (4 MW).
32 The total available capacity is much less than the installed capacity due to serious problems of maintenance,
which lead to frequent scheduled and unscheduled outages. The scheduled overhauls or regular visits cannot be done on schedule due to lack of spare parts. Consequently, EDH has 172 MW installed capacity in Port-au-Prince, however most of the time only 90 MW are available during the rainy season and 45 MW during the dry season. Total available capacity is higher because at this capacity it should be added the generation capacity of the IPPs.
33 For the fiscal year 2001-2002, EDH had generated and distributed 469,906.44 MWh at a very high
production and transmission costs. Relatively to the total installed capacity of 216.11 MW, it shows a very low capacity factor (degree of utilization of installed capacity) of 25%, as compared to other Caribbean countries: Dominican R. 37%, Cuba 37%, Saint Lucia 44%, Trinidad and Tobago 46%, Jamaica 51%, Barbados 54% and Saint Kitts and Nevis 63% and to an average of 44.3% for the entire region. (See Appendix 5.)
34 The electricity generation units are supposed to be retired at the end of their lifetime, i.e. after a standard
number of operating hours. But, because of weak management of scheduled maintenance and also their inappropriate operation, some installations are deteriorating faster than normally expected and sometimes they cannot be repaired or replaced. Even though the scheduled maintenance is applied, other unexpected problems can come up due to bad operation with frequent shortages, unstable network etc. Because of the financial problems the obsolete units cannot be retired in spite of their low efficiency.
35 Because of the deficit of production registered in the country since the late seventies, EDH lost year by year
its capability of investment, and has decided since 1991 to buy energy from private companies to overcome this problem. During the fiscal year 2001-2002, EDH bought from private sector 78,319.181 MWh. Consequently, the total electricity supply for the period was 548,225.621 MWh.
Electrical networks 36 At present, electricity in Haiti is supplied in four main regions. The largest, Port-au-Prince, is the only one
with an integrated distribution network, and in the South, Artibonite, and North there are isolated distribution networks in each region, which are not connected, neither in the region, nor in between regions. Peak load in 2005 was estimated at about 161 MW in Port-au-Prince, 7 MW in the South region, 14 MW in the Artibonite region and 12 MW in the North region.
37 Each region has at least one hydro power plant and several thermal power plants connected to a local grid.
For instance, the Metropolitan Region has a local grid where Carrefour, Varreux and Péligre power plants are interconnected. Péligre, located in Plateau Central, is linked to the Dispatching site in Port-au-Prince by a 115 kV transmission line of 56 km. Dispatching Centre interconnects the three power plants by a 69 kV transmission line of 53 km. The grid is completed by a 7.2/12.47 kV distribution line of 900 km and a 2.4/4.16 kV distribution line of 20 km. The total length of transmission and distribution lines for the Metropolitan Region is of about 1029 km.
38 Because there is no large distance between the power plants and the distribution area in other regions, the
voltage level of transmission and distribution lines is generally the same. Generally it is 13.2/23 kV, but for some power plants and grids of the same region, voltage levels are 7.2/12.47 kV or 2.4/4.16 kV. So,
6

Northern region has 186 km of lines, Artibonite 219 km, Southern 176.5 km and Centre-West 150 km. The countrywide total length of both transmission and distribution lines is of 1760.50 km.
39 The rate of countrywide electrification is 12.5 % (legal connexions), with Metropolitan region 5.6%,
Northern 1.12%, Artibonite 1.32%, Southern 1.06% and Centre-West (Jacmel) 0.9%. 40 The Metropolitan and the Jacmel grids in South-East region were renovated in 1984-1985. Saint Marc grid
in Artibonite region was renovated in 1997. In fact, all the grids are very old and need to be rehabilitated. 41 As the availability rate of the units is low relatively to the demand, the company is forced to limit the
electricity supply in certain regions or/and to purchase energy from private producers. The electricity supply varies in time and from one region to another, depending on the availability of the units, energy purchase capability of EDH and the inflow energy of hydroelectric dams: 12-16 hours in Metropolitan region, 20-24 hours in Northern, Artibonite, Southern and Centre-West regions, and 24 hours in Jacmel in October 2004. (see Appendix 6). In 2005, in Port-au-Prince Metropolitan area the electricity supply was 6 to 12 hours daily.
Technical and non-technical electricity losses 42 As the majority of the grids are old and unreliable, and the rate of countrywide electrification is low, the rate
of losses is very high, and consequently, the rate of billing is very low. (see Appendix 7) 43 Because of the low reliability of the grids, EDH evaluates the technical losses at 18%. So, from the rate of
total losses situated between 46.02% and 53.59%, the non-technical losses or losses by illegal connections vary between 31,02% and 38.59% during the past five years. Although the total losses are also high in other developing countries: Nigeria 32%, India 27%, Togo 27%, Kenya 22%, Cameroon 21%, the ratio of unpaid electricity seems to be nowhere as higher as in Haiti. (see Appendix 8)
44 Non-technical losses represent financial losses to the utility mainly due to illegal connections and bad
revenue collection. Because of the non-technical losses, the utility is not capable to make the current maintenance of installations, to buy fuel and thus to start a new production cycle. The lack of electricity contributes to further increases in non-technical losses and it affects the economic growth, which result in lack of revenues for people and in the impossibility to pay the electricity bill and also in lack of revenues for the budget of the Government, which is not able to give direct subsidies to very poor. Finding a solution for a normal electricity production - selling - money collection - new production cycle is one of the most important and urgent problems for the utility.
Illegal consumption of electricity in households 45 According to Haitian utility data, the invoiced consumption, which was measured with household meters,
was 115 GWh in 2002. Under the assumption that 65% of all commercial (non-technical) losses are in household sector, 151 GWh would be the illegal consumption in households without meters. Total electricity consumption in households was estimated at 266 GWh. About 57% of all consumption of electricity in households of Haiti represents non-technical (commercial) losses.
46 The number of households with meters in 2002 was 158,000, which is 10.6% of total number of households
in Haiti. Based on the rough estimate that 30% of all households are connected to the grid, the number of illegally connected households is 289,000.
7

Residential Annual Consumption in 2002
number number % GWh GWh % KWh/household
with meters 159840 36 115 43 727
Without meters
284160 64 151 57 528
all connected 444000 100 266 100 600
The average annual residential consumption is 600 kWh. Households with meters consume in average more, 727 kWh, and average non metered (illegal consumption) is 528 kWh.
47 The main categories of electricity consumption in households today are refrigerators, lighting and TV-audio.
It is believed that the households illegally consuming electricity use it mostly for lighting, TV-audio and around one third of them also for refrigerators.
Annual Consumption per Appliance
kWh per appliance % of households
kWh per connected household
lighting 100 30 100 TV 100 25 84
refrigerator 900 13 390 wash-machine 100 1 4
Rest 30 20 20 Total 600
48 A complete analysis and comments are based on assumed number of households without meters and their
consumption. Consumer registration, billing and collecting system should be improved also to provide more reliable data. With such improved data it would be possible to make more accurate estimates of consumption in households with and without meters.
49 Analysis conducted over available information shows the following conclusions: 36% of connected and
with meter households consume 43% of the total electricity. Those who mainly consume electricity illegally are the households without meters, but a part of households with meters also use electricity without proper authorization. Out of total electricity consumption by households in 2002, 57% are commercial losses. If we assume that 10 US cents is the average price of electricity for commercial losses, that means that the value of commercial losses in households is as large as 15.1 million US$. Unfortunately, for any under-developed country (with high unemployment, low purchasing power, and high electricity prices compared to purchasing power), illegal use of electricity is very widespread phenomenon in households without meters, but partly also in households with meters. Those who duly pay for electricity see that no measure is taken against those who do not pay for it, moreover, against those who steal energy, and therefore, it works as a motive for them to delay their payments.
50 The program for the stabilization of the situation should start by introducing meters on utility account
(credits, donations) where they do not yet exist. This initiative is affordable for the utility and would give the best results in the shortest period of time. This will contribute to a substantial reduction of commercial losses and the residential consumption could slightly decrease. At least one third of households illegally connected to grid are capable to pay the electricity consumption. In a short period it is possible to install at least 100,000 meters in such households, this measure bringing yearly around 6 million US$ to EDH.
51 With adequate laws, regulations and institutions, the illegal electricity consumption could be reduced.
Possible measures might consist of installment of pre-payment meters for careless clients, considerable penalties for illegal energy consumption, and the possibility of pursuing in court the non-paying consumers.
8

52 The authorities should apply a program to establish the “social” category of inhabitants and take their responsibility for these people, having in mind both needs for energy and social care. Measures to help vulnerable customers to pay the consumed electricity will reduce the illegal electricity consumption.
53 Another option could be the decrease of the consumption by energy efficiency measures as the distribution
of subsidized energy efficient lamps to poor households connected to grid, and have in this way savings on fuel cost of 5 US$ per lamp yearly. On the amount of 200,000 lamps it would represent a saving of 1 million US$ in electricity bills.
Hydro potential
54 National hydro potential of Haiti is about 153 MW of which 15% (22.88 MW) are in 27 micro sites ranking from 0.1 to 2.57 MW with falls going from 50 to 400 meters. These falls can be taped for providing energy services in isolated areas where the lack of adequate energy services is an important constraint for local development. In the remaining potential are included 3 major sites, Artibonite 4C is the most important, totalizing about 130 MW.
Wind energy
55 Based on wind measurements carried out in 2005 and 2006 a general map of the available wind resources was established. Detailed maps for specific regions of interest are currently under elaboration. These measurements confirm past analyses showing that significant wind potential exist in three parts of Haiti (West, North-west and North).
56 In the western part of the country, where the electricity demand is higher, there is a site located in Plaine du
Cul de Sac, at North East of Port-au-Prince, between two big mountain chains named La Selle and Chaine des Matheux known as very windy. This “wind corridor” crossing the Lac Azueï has been confirmed and serious consideration is being made to take advantage of this resource by building a wind farm.
57 In the north-west, a site with good wind potential is located near the island of La Tortue, in the Canal du vent between Haiti and Cuba. In 1978, a wind farm of 150 kW was installed in Port-de-Paix by EDH with the support of the German cooperation. Two years later, this plant was shut down due to lack of technological skill and capacity for maintenance.
Solar energy 58 Haiti has a good solar energy radiation. According to existing estimates, the average radiation is of about 5
kWh/m2/day. But there is not enough detailed data on the solar potential. Moreover, technical and logistic capabilities to carry out appropriate studies are not in place.
59 Solar energy is mainly used by individuals to produce electricity and hot water. The total solar installed
capacity has been evaluated at about 0.7 MW. Most of this capacity (80%) is used for lighting and the rest (20%) goes to vaccines and seafood conservation, pumping, audiovisual and communication. It is important to mention that initial investment costs are very high for photovoltaic and thermal equipments. The propagation of solar technology in Haiti is restricted also by the following local peculiarities: culinary habits preventing the use of solar stoves in household sector, corrosion of the pipeline in the solar water heater, lack of maintenance capability, even theft of photovoltaic panels at private and public installations etc.
60 Solar water heaters are mostly used in hotel, residence and health centres. It is also used in a slap-dash
manner for drying fruits. But as said, culinary habits of the households are also preventing a larger use of the solar stoves.
2.4 Municipal solid waste energy 61 The production of urban wastes in metropolitan area (Port-au-Prince) is evaluated at 730,000 tons/year, at
191,000 tons/year for eight other big agglomerations (Cap Haïtien, Gonaïves, Les Cayes, Saint-Marc, Verrettes, Jérémie, Port-de-Paix, Limbé) and at 766,000 tons/year in the rural regions and small towns. The
9

components of the metropolitan waste6 are the following: organic maters (75%), stones, charcoal and sands (8%), plastics objects (7%), metal (3%), paper and cartoon (3%), tissues (2%) and glasses (2%). Many neighbourhoods do not have public trash removal services. Some small private services exist, but they are relatively expensive. There is no separation of waste from households, companies, hospitals, and construction debris. Then, generally, the gathering is done by hand truck and the removal by truck. The two important landfill sites are located in Truitier, at about 10 kilometers from Port-au-Prince and in Madeline, at Cap-Haïtien. The rate of wastes removal is estimated to be less than 30% in MAPAP. In other cities, they are generally dumped in rivers and ends up on the coasts. Those wastes are generally burnt. However, a little part is used in some areas to produce compost.
62 The legal framework is insufficiently clear regarding the roles of those involved in waste management,
particularly concerning MAPAP and it lacks of technical standards, adequate financial instruments, coordination mechanisms and a true strategy regarding the removal, disposal of waste material and eventual energy recovery. For about 5 years, a Research Unit, with the technical support of the Cooperation University in Development (CUD) of Belgium, based at the Faculty of Sciences (State University of Haiti) carried out some research activities in term of landfill management.
2.5 Other local energy resources
63 Bagasse: Due to closure of the sugar cane industry7, the bagasse production and consumption decreased in Haiti. However, the potential of this local energy resource is still remaining. The quantity of the bagasse available each year in the sugar cane mills and guildives (artisanal alcohol plant) is estimated to 140,000 tons but only 15% are used. The yearly energy potential of the bagasse produced in alcohol industry (distilleries) in Haiti is between 37 and 56 thousand tons oil equivalent – toe.
64 Animal waste (manure): Some pilot experiments have been made in the past to use those wastes to produce
biogas for heating. But the production centres were located in non-appropriate areas. The transportation of the raw materials was a handicap for those activities.
3 Key issues involving the Haiti Energy sector
3.1 Firewood and charcoal
- Deforestation/depletion of forests; - Insufficient reforestation programmes; - Over use of fuel wood in the economy; - High consumption of wood in the small and medium enterprises and in households to generate heat; - Low efficiency of charcoal production technology; - No or inadequate actions in term of fuel wood substitution/conservation and forest protection; - Use of wood in construction/building sector, where metal poles can be used instead; - No incentives to use alternative fuels instead of wood and charcoal;
3.2 Oil and gas sector
- No national oil reserves yet discovered; - No ongoing oil exploration throughout the country; - No use of San Jose accord; - High financial costs to import derivative petroleum products; - High vulnerability to oil product price volatility. No regulation on strategic oil product stockpiling; - Lack of enough LPG filling facilities; - Mixing of gasoline with kerosene to take advantage of the low cost of kerosene; - High profits of LPG retailers in absence of a price regulation or control.
6 Source: CHF (Corporation Housing Foundation) 7 Four sugar plants operated in Haiti during the 1980’s: at Léogâne (Darbonne), Cayes, Cap-Haïtien, Port-au-Prince (Varreux).
10

3.3 Coal (lignite) deposit - Relatively low proven reserves, capable to feed only a 40 MW power plant over 17 years; - High sulphur and ash contents; - Need to have a complete evaluation of the sedimentary basin.
3.4 Electricity sector
- Some thermal plants are not available for operation due to lack of maintenance; - Sedimentation of the main hydro dam (Peligre); - Chronic unsupplied electricity demand; - Illegal connections to the grid and illegal consumption; - Financial resources not available for purchasing fuel, for repairing some existing plants and for
expanding the electricity generation system; - Isolated electric grids are not interconnected in an unique national grid; - Insufficient transformers and meters to replace the damaged ones; - Low reliability of the grid and high technical losses; - Very high production and transmission costs. - Lack of available capacity in the distribution circuits.
3.5 Wind energy
- High wind potential, but not used; - Detailed wind maps under elaboration; - Lack of technical and logistic possibilities to carry out appropriate analysis and implementation; - Relatively high costs of wind technologies.
3.6 Solar energy
- No available data on the solar potential; - Lack of technical and logistic possibilities to carry out appropriate studies; - Initial investment is very high for photovoltaic and thermal equipments; - Difficult access to financial credits to purchase equipments for individuals; - Lack of technical expertise to maintain these equipments; - Corrosion in the pipeline of the solar water heaters; - Culinary habits of the households preventing the use of the solar stoves; - Stealing of the photovoltaic solar panels at private and public installations.
3.7 Municipal solid waste energy
- Uncontrolled landfill waste disposal; - No sorting of the waste.
3.8 Bagasse
- No utilization of the total bagasse production; - Hesitation of the alcohol industry owners to use bagasse as an energy source, under the pretext of its
low calorific content.
4 Future energy needs and supply options
4.1 Final energy demand forecast by energy form and by sector 65 The final energy demand forecast is derived from the MAED (Model for Analysis of Energy Demand)
study, which is part of the “Plan Energetique National” of Haiti undertaken by Bureau des Mines et de l’Energie (BME), Electricité de Haiti (EDH) and Ministère des Travaux Publics Transports et Communications (MTPTC) with the technical support of the International Atomic Energy Agency.
66 The basic assumptions for the final energy demand forecast are as follows: The expected GDP for year
2015 is 109,84 billion Gourdes, that is 48% higher than in year 2000. The corresponding yearly average growth rate during that period is 2.65%. This relatively low growth rate reflects the political and
11

economical situation during last two years and includes an expected yearly growth rate of 1.0% between 2000-2005. With the international support, particularly with the ICF (Interim Cooperation Framework), a better economic situation is expected in the future, reflected by a yearly growth rate of 3% between 2005-2010 and 4% between 2010-2015. As far as the future economic structure is concerned, the Manufacturing subsector of Industry is expected to have the highest growth rate (at least 3.9%) during the period 2000-2015.
67 It is expected to have a slow increase of the population growth rate until 2015 (2% in average for the
period 2005-2015, as compared to 1,96% during the recent past years). Under this assumption, the expected number of inhabitants in 2015 is assumed to be 10,68 million, that represents an increase of 26% compared to 2000. At the same time, the number of households is expected to increase more, i.e. with 41% in the same period, reaching around 2.0 million in 2015. It is assumed that the purchasing power of the population will improve, in turn, more families would be able to connect to the electric grid and use the electricity (at least 50% of the households will be connected to the main electric grid by 2017).
68 It is assumed that more efficient equipment and better technologies will be used in industry, but with
higher penetration of the overall electricity use in this sector. As a result, GDP increase will not imply the same rate of energy consumption.
69 By year 2015, it is expected an improvement in the car ownership to 84 persons per car instead of 100,
and a steady decline of fuel consumption per 100 kilometres due to replacement of the older cars by newer ones and to improvements in the road infrastructure.
70 For year 2015 the total amount of final energy consumption is estimated at 2,04 million toe, which is
more than 20.7% compared to year 2000. As the increase of the GDP is expected to be of 48% in the same period, it means a reduction of the energy intensity at the country level (more efficient use of energy for the generation of value added by economic sectors). The structure of final energy consumption in year 2015 is expected to be as follows: fuel wood and charcoal 50% (75% in 2000), motor fuels 20% (15% in 2000), fossil fuels 20% (5% in 2000), electricity 10% (4% in 2000) and feedstock close to 0% (same as in 2000). It can be noticed that the structure of final energy consumption changes from 2000 to 2015, with the reduction of the share of non-commercial energy, the increase of the share of motor fuels, fossil fuels and electricity and no share of feedstock.
71 The structure of the final energy demand by sector in year 2015 shows that households are expected to
consume 1.14 million toe (56%), industry 0.46 million toe (23%), transportation 0.34 million toe (16%), services 0.1 million toe (5%). Compared to year 2000, it can be noticed a slight decrease in the share of household’s final energy consumption and a slight increase in the share of the other sectors: industry, transportation and services.
72 Elasticity of final energy, defined as the ratio of average annual growth of final energy demand during
2000-2015 and average annual growth rate of GDP for that same period, is 0.48, which shows an improvement in the final energy intensity of the country. On the other hand, elasticity of electricity for the same duration is 2.3, showing a faster increase of electricity penetration in all economic and social activities than the GDP growth.
4.2 Energy supply sector development options
Fuel wood and charcoal, energy substitution to avoid further deforestation 73 Although the industry and service sectors are not affecting considerably the total consumption over time
as compared to household sector, it is important to reduce fuel wood and charcoal use in those two sectors. Indeed, the share of fuel wood in industry will decrease from 60% in the year 2005 to 44% in the year 2015 while in service sector its share will go from 56% in 2005 to approximately 30% in 2015.
74 Available actions are conservation measures through dissemination of more efficient charcoal stoves in
residential and service sectors or improved boilers or ovens in small industry, and substitution of fuel wood by kerosene, LPG, imported charcoal and briquettes produced from waste cellulosic materials,
12

mainly office paper, cartoon and agricultural wastes. Replacement of wood in construction/building sector by metallic pools may also be implemented.
The objectives of ICF concerning the substitution of fuel wood and charcoal with alternative energy forms are:
Deadline Additional households with
Additional SMEs with
Towns quipped with
LPG kerosene LPG/diesel solar panels March 2005 3,500 1,500 100 - September 2005
7,700 3,300 200 3
March 2006 7,000 3,000 350 3 September 2006
2,800 1,200 350 4
Total 21.000 9.000 1.000 10
In addition, ICF provided for the reforestation of 2,000 hectares for energy purposes and financial support for fuel briquette producers by September 2005 and formulated a National Action Plan for Forests by March 2006. Significant efforts in terms of investment must be made in order to achieve efficient results. By 2010, it is urgent that the following programme of actions for reconstructing/rebuilding the wood stocks needs to be implemented: - Starting from 2005, annually 2.5% of the total urban families need to switch to another source of
energy. This implies that by the year 2015, about 25% of those families (509,400) will be converted. Adding the number of existing families (13.5%) that are already using another energy source, the respective achievement for the previous target year is 38.5%.
- Beginning 2005, implementation of a conservation programme consisting in the dissemination of improved stoves to 17% of the families in urban area by the year 2015, that is approximately 166 thousands of households. (see Appendix 9)
75 Indeed, the results of this programme will include 36% of the households using either kerosene, LPG or
improved stoves by the year 2015, the rest will be using electricity and wood and some traditional stoves. Of course, this is a very huge programme but it is urgent to implement it if the target is to provide enough fuel for cooking to the population in a relative comprehensive and effective manner without completely depleting the very small amount of wood stock now available.
76 The number of stoves to be disseminated by 2015 is respectively 153,000 for kerosene, 357,000 for
LPG and 166,000 for improved stoves.
77 In addition to this very important substitution and conservation programme, importation of charcoal must be also implemented and equally effective implementation of laws that prevent improper wood harvesting to expect relative conservation and start increasing wood stock by the year 2015. To achieve this, charcoal import should start with 117,000 tons in 2006, to reach approximately 700,000 tons in the year 2009 and then decreasing significantly to less than 200,000 tons by the year 2015.
78 If the assumption for the today stock of 18 thousands cubic meters is correct, the above four measures
are needed. If the estimated stock is higher than assumed here, there will be no need for such amount of imported charcoal. On the opposite, if the actual estimates are lower, then the wood sector situation is worst.
79 Modeling the future evolution of wood stock as a function of currently available stock, annual wood
consumption, natural reproduction rate and yearly reforestation indicates how sensitive is the future
13

wood stock to the variation of the above parameters. For example, any small negative or positive changes either in the natural reproduction rate of wood or yearly reforestation activities or energy consumption by even less than 10% it implies automatically a huge variation in the available stock. Consequently, there is a very urgent need to carry out a more comprehensive and complete study for the fuel wood subsector.
80 Yearly cost of the LPG program is about 1.2 million US$, while kerosene is about 0.3 million US$ and
improved stoves 0.1 million US$. Those costs count with a 50% of subsidies and also include the managerial cost of 3 US$ per stove. On the other hand, coal import will cost about 166.5 million US$ yearly if a price of US$ 350/ton can be obtained. The price of 350/ton reflects an increment of about 16% of the current price on the local market.
81 Substitution of fuel wood by imported energy sources should be considered carefully. The high cost of
imported fuel might increase the export/import imbalance and deteriorate the economic situation of the country. Also the country will be more exposed to external price variations of primary fuels. Other measures should be considered first, such as increase use of local resources like renewable energy sources and production and use of energetic crops and forests.
82 Some countries in the region like Guyana have lots of wood that can be exchanged for limestone, which
is a very abundant and excellent quality raw material in Haiti. They need limestone for different purposes like soil amendment, construction, pharmaceutical industry etc. They may have interest in such transactions.
Energetic forests
83 Energetic forests are a good way to supply the need for fuel wood and fight deforestation. They consist in reforestation by using fast growing species like “Bayahonde” or regenerating species like “Bamboo”. In fact, the Bayahonde grows anywhere and can be harvested in three years. Concerning the Bamboo it re-grows spontaneously after it is cut. Haiti has a lot of land that can be suitable for energetic forests. For example “La Plantation Dauphin” (6000 hectares in one piece of land), “la plantation de Madras”, Savane désolée, “La-Pierre region”, near Gonaives, the cap of St. Marc, dry region near Port-au-Prince and plain of Cul-de-Sac, west side of the Azuei lac, dry regions of Cotes de Fer, Miragoane and western part of Gonave island. The trees will be used to produce fuel wood and charcoal.
Energetic crops
84 Energetic crops might be used as a primary source for bio-fuels. These are fast growing plants, which
can be harvested once or twice a year. One species of interest is the “Jathropha” plant which grows well in tropical climates and can be used for production of bio-diesel or used as fuel wood.
85 The Government should investigate the possibility to promote energetic crops and bio-fuels and
determine the country’s potential for such products. Main bio-fuels are:
86 Biodiesel is a renewable fuel that can be manufactured from vegetable oils or recycled vegetable cooking oil and greases. (see Appendix 10)
87 Ethanol is an alcohol-based alternative fuel produced from any biological feedstoks that contain
appreciable amounts of sugar (sugar beets, sugar cane) or materials that can be converted into sugar. (see Appendix 10)
88 Methanol is an alcohol fuel made usually from natural gas. It could also be made from landfill gas,
bagasse or wood chips. Methanol is a liquid fuel that can be used in an internal combustion engine or a fuel cell. (see Appendix 10)
14

Petroleum products
89 Haiti, without domestic crude oil resources, nor refining capacities, is highly vulnerable to the oil
product disruptions and to the volatility of oil product prices. Several response measures are possible to diminish this vulnerability.
90 The Government should continue to take advantage of San Jose and Petro Caribe energy accords. They
offer to the country various opportunities: preferential prices for the imported oil products, security of supply and, if necessary, provide low interest long-term loans for development projects.
91 The total petroleum product storage capacity of roughly 1,688,000 barrels (bbl) is currently (2000-2005)
sufficient for 5-6 months of petroleum product consumption and for 2.7 months in year 2015. In terms of storage capacity it is quite sufficient but it is important how much of this capacity holds all the time a strategic reserve of petroleum products. As a reference, the net importing member states of the European Union have the obligation to hold oil reserves equivalent to more than 90 days of the previous year’s average daily consumption. Some countries have special laws that regulate the strategic oil reserves and special agencies that hold and administrate the reserves (Germany, Spain, Hungary, the Republic of Korea, Czech Republic, Finland, Ireland etc.). The experience of Germany [5] in solving the problem of emergency oil reserves could be useful for any oil importing country. The new regulatory body intended to be established in Haiti should study the necessity of including in the future Energy law(s) of the obligation for petroleum companies to hold permanently emergency reserves for a specified period in order to decrease the country vulnerability to oil product disruption.
92 The Government should consider also the implementation of a recycling programme for the used engine
oil around the country, which would reduce the import of this petroleum product and would be also beneficial from environmental viewpoint.
93 The Government should encourage a closer integration of Haitian petroleum product sector with that of
the Dominican Republic, to take advantage of economy of scale in some joint imports of petroleum products.
Domestic lignite production
94 The possible uses of the Maïssade lignite deposit are:
− Feeding a steam power plant of 40 MW running 5,500 hours/year for 17 years or of 30 MW for 25 years, if proved economically effective in comparison with other plant types, or
− Cement production (lignite used as raw material and as fuel in cement plant). The estimated production cost and necessary investment to exploit this deposit are:
− Production cost: 8 cents/kWh − Total investment cost: US$60 million (1980), including the construction of two bridges that
will give access to the mine.
4.3 Electricity Generation system expansion until 2015 95 The MAED study had predicted that the electricity peak load for the Port au Prince grid would reach
about 150 MW between 2000 and 2010 and about 165 MW between 2010 and 2015 due to expected economic and social development of the country. In fact in 2005 the peak load had reached 161 MW. The Artibonite region is expected to be connected to the main transmission grid in 2011-2012, when the maximum load will be 30 MW. The Northern region will be interconnected in 2013-2015 with a peak load of 37 MW. Because of its low consumption and long distance to the existing transmission grid, the South region will not be connected to the main transmission grid until 2020. In 2015, this region will reach the peak load of 26 MW. All load and electrical energy needs of these three regions, in the specified time horizons, will be covered with small diesel units, wind farms and small hydro units. Until 2015 the following new capacities will be required: 25 MW in Artibonite region (until 2012), 25 MW in
15
South region and 30 MW in North region. When interconnection will be in place, a more concentrated generation can be considered with larger, slower running diesel units or steam turbines.
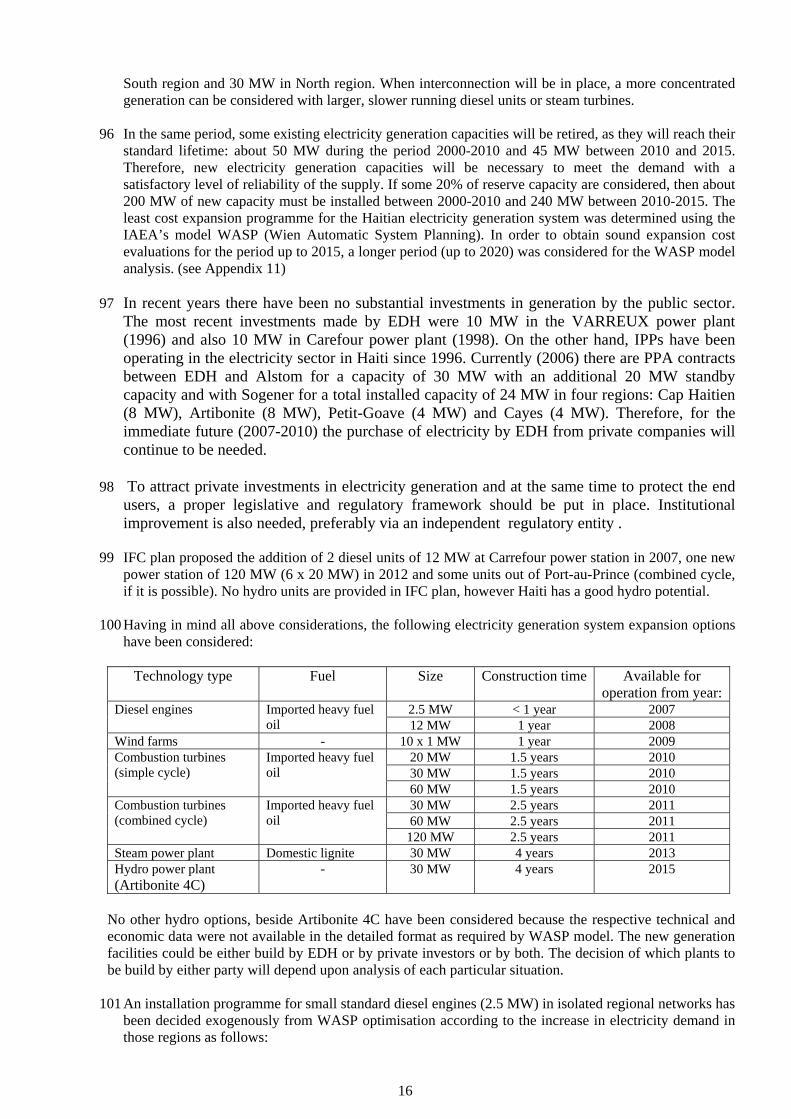
96 In the same period, some existing electricity generation capacities will be retired, as they will reach their
standard lifetime: about 50 MW during the period 2000-2010 and 45 MW between 2010 and 2015. Therefore, new electricity generation capacities will be necessary to meet the demand with a satisfactory level of reliability of the supply. If some 20% of reserve capacity are considered, then about 200 MW of new capacity must be installed between 2000-2010 and 240 MW between 2010-2015. The least cost expansion programme for the Haitian electricity generation system was determined using the IAEA’s model WASP (Wien Automatic System Planning). In order to obtain sound expansion cost evaluations for the period up to 2015, a longer period (up to 2020) was considered for the WASP model analysis. (see Appendix 11)
97 In recent years there have been no substantial investments in generation by the public sector.
The most recent investments made by EDH were 10 MW in the VARREUX power plant (1996) and also 10 MW in Carefour power plant (1998). On the other hand, IPPs have been operating in the electricity sector in Haiti since 1996. Currently (2006) there are PPA contracts between EDH and Alstom for a capacity of 30 MW with an additional 20 MW standby capacity and with Sogener for a total installed capacity of 24 MW in four regions: Cap Haitien (8 MW), Artibonite (8 MW), Petit-Goave (4 MW) and Cayes (4 MW). Therefore, for the immediate future (2007-2010) the purchase of electricity by EDH from private companies will continue to be needed.
98 To attract private investments in electricity generation and at the same time to protect the end
users, a proper legislative and regulatory framework should be put in place. Institutional improvement is also needed, preferably via an independent regulatory entity .
99 IFC plan proposed the addition of 2 diesel units of 12 MW at Carrefour power station in 2007, one new
power station of 120 MW (6 x 20 MW) in 2012 and some units out of Port-au-Prince (combined cycle, if it is possible). No hydro units are provided in IFC plan, however Haiti has a good hydro potential.
100 Having in mind all above considerations, the following electricity generation system expansion options
have been considered:
Technology type Fuel Size
Construction time Available for operation from year:
2.5 MW < 1 year 2007 Diesel engines Imported heavy fuel oil 12 MW 1 year 2008
Wind farms - 10 x 1 MW 1 year 2009 20 MW 1.5 years 2010 30 MW 1.5 years 2010
Combustion turbines (simple cycle)
Imported heavy fuel oil
60 MW 1.5 years 2010 30 MW 2.5 years 2011 60 MW 2.5 years 2011
Combustion turbines (combined cycle)
Imported heavy fuel oil
120 MW 2.5 years 2011 Steam power plant Domestic lignite 30 MW 4 years 2013 Hydro power plant (Artibonite 4C)
- 30 MW 4 years 2015
No other hydro options, beside Artibonite 4C have been considered because the respective technical and economic data were not available in the detailed format as required by WASP model. The new generation facilities could be either build by EDH or by private investors or by both. The decision of which plants to be build by either party will depend upon analysis of each particular situation.
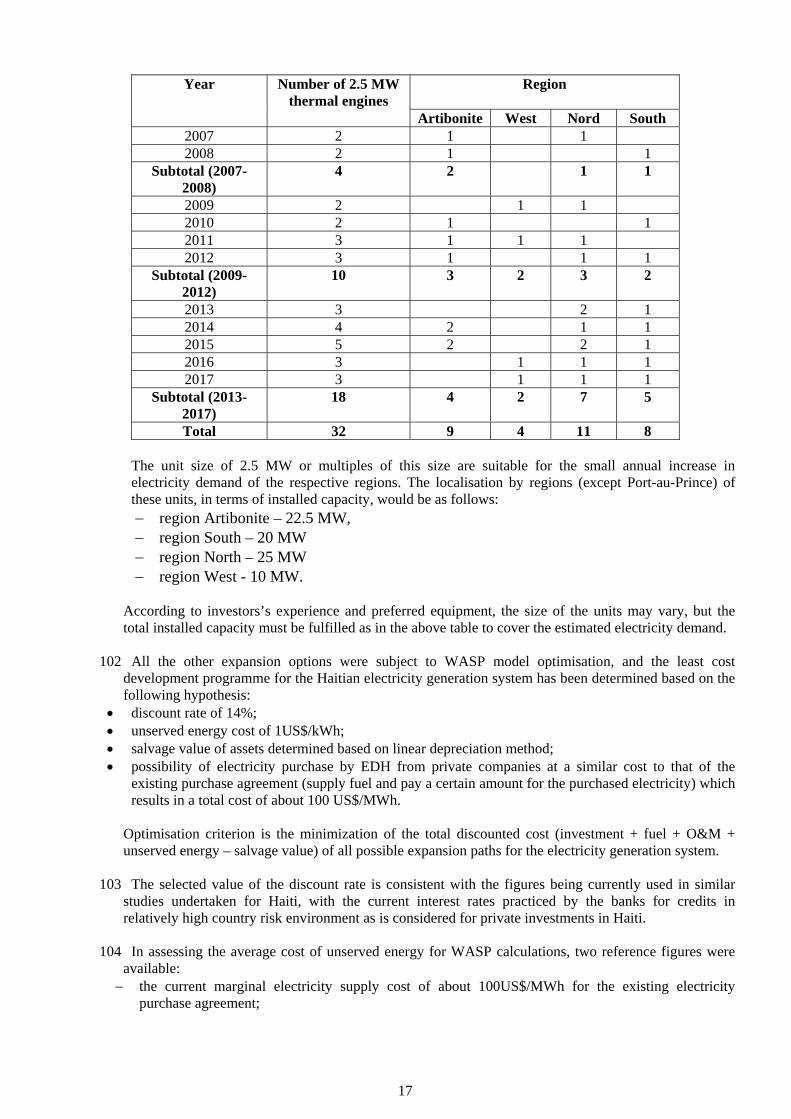
101 An installation programme for small standard diesel engines (2.5 MW) in isolated regional networks has
been decided exogenously from WASP optimisation according to the increase in electricity demand in those regions as follows:
16
Region
Year Number of 2.5 MW thermal engines
Artibonite West Nord South 2007 2 1 1 2008 2 1 1
Subtotal (2007-2008)
4 2 1 1
2009 2 1 1 2010 2 1 1 2011 3 1 1 1 2012 3 1 1 1
Subtotal (2009-2012)
10 3 2 3 2
2013 3 2 1 2014 4 2 1 1 2015 5 2 2 1 2016 3 1 1 1 2017 3 1 1 1
Subtotal (2013-2017)
18 4 2 7 5
Total 32 9 4 11 8
The unit size of 2.5 MW or multiples of this size are suitable for the small annual increase in electricity demand of the respective regions. The localisation by regions (except Port-au-Prince) of these units, in terms of installed capacity, would be as follows: − region Artibonite – 22.5 MW, − region South – 20 MW − region North – 25 MW − region West - 10 MW.
According to investors’s experience and preferred equipment, the size of the units may vary, but the total installed capacity must be fulfilled as in the above table to cover the estimated electricity demand.
102 All the other expansion options were subject to WASP model optimisation, and the least cost
development programme for the Haitian electricity generation system has been determined based on the following hypothesis:
• discount rate of 14%; • unserved energy cost of 1US$/kWh; • salvage value of assets determined based on linear depreciation method; • possibility of electricity purchase by EDH from private companies at a similar cost to that of the
existing purchase agreement (supply fuel and pay a certain amount for the purchased electricity) which results in a total cost of about 100 US$/MWh.
Optimisation criterion is the minimization of the total discounted cost (investment + fuel + O&M + unserved energy – salvage value) of all possible expansion paths for the electricity generation system.
103 The selected value of the discount rate is consistent with the figures being currently used in similar
studies undertaken for Haiti, with the current interest rates practiced by the banks for credits in relatively high country risk environment as is considered for private investments in Haiti.
104 In assessing the average cost of unserved energy for WASP calculations, two reference figures were
available: − the current marginal electricity supply cost of about 100US$/MWh for the existing electricity
purchase agreement;
17

− the final electricity intensity (ratio of annual final electricity consumption to total GDP) for Haiti in year 2000 is, according to MAED study, of 0.256 MWh / 1000 US$ (762 GWh / 2970 million US$), which is equivalent to about 3,900 US$/MWh.
The selected value of unserved energy for WASP calculations is of 1 US$/kWh, which is equivalent to 1000 US$/MWh and represents an intermediate penalty, ten times higher than the current marginal electricity supply option (100 US$/MWh) and 39 times lower than the equivalent (3,900 US$/MWh) of the average final electricity intensity at the country level. (see Appendix 11)
105 In determining the least cost expansion programme for the Haitian electricity generation system, a
difficult decision has to be taken for the very next years (2007-2009) when some of the considered system development options: combustion turbines (simple cycle), combustion turbines (combined cycle), steam power plant, hydro power plant are not available for operation because their respective long construction time and other practical reasons. In fact, for the very near future only the following electricity supply options are available: installation of small diesel engines (2.5 MW) in some isolated regional networks and additional purchase of electricity by EDH from private companies, which can be applied from 2007 and installation of diesel engines (12 MW) and/or wind farms (10x1MW), which could be operational by 2009.
106 After considering of all the above electricity supply options, with their respective constraints, the
reference least cost programme of electricity generation system expansion and operation determined with WASP model is the following:
Year Electricity
purchase Diesel
engines Wind farms
Combustion turbines (simple
cycle)
Combustion turbines (combined
cycle)
Lignite-fired steam
plant
Hydro power plant
(GWh) 2.5 MW
12 MW
10x 1MW
20 MW
30 MW
60 MW
30 MW
60 MW
120 MW
30 MW 30 MW
2007 166 2 - - - - - - - - - - 2008 212 2 - - - - - - - - - -
Subtotal 378 4 - - - - - - - - - - 2009 266 2 - - - - - - - - - - 2010 - 2 - - - - - 5 - - - - 2011 - 3 - - - - - - - - - - 2012 - 3 - - - - - 1 - - - -
Subtotal 266 10 - - - - - 6 - - - - 2013 - 3 - - - - - 1 - - - - 2014 - 4 - - - - - 1 - - - - 2015 - 5 - - - - - - - - - 1 2016 - 3 - - - - - 2 - - - - 2017 - 3 - - - - - 1 - - - -
Subtotal - 18 - - - - - 5 - - - 1 Total 644 32 - - - - - 11 - - - 1
107 The following comments can be made in relation with the reference least cost programme of electricity
generation system expansion and operation: − the installation programme for the small diesel engines (2.5 MW) in isolated regional networks has
been decided exogenously from WASP optimisation according to the increase in electricity demand of those regions;
− the WASP optimisation doesn’t confirm the provisions of the ICF plan related to the addition of 2 diesel units of 12 MW at Carrefour power station in 2007, one new power station of 120 MW (6 x 20 MW) in 2012 and some units out of Port-au-Prince (combined cycle, if it is possible);
− the diesel engines of 12 MW are not chosen in competition with the electricity purchase in period 2007-2009 and with installation of combined cycle units, 30 MW, in period 2010-2017 because of their high overnight pure capital investment cost (950 US$/kW) and of their low efficiency (30-33%);
− the wind farms of 10 x 1 MW are not selected in competition with the electricity purchase in period 2005-2007 and with installation of combined cycle units, 30 MW, in period 2008-2015 because of their high overnight pure capital investment cost (1500 US$/kW) and low capacity factor of 30% (reflected in WASP calculations through the forced outage rate parameter);
18

− the combustion turbines (simple cycle), in all size options, are not selected in competition with the electricity purchase in year 2007 and with installation of combined cycle units, 30 MW, in period 2009-2017 because of their lower efficiency (30-35%);
− the combined cycle units of 30 MW are preferred to all other expansion options, starting with their first year of availability for operation (2010), because of their higher efficiency (40-55%); this technology can have an even higher efficiency but conservative figures have been selected purposely in this study;
− the size of 30 MW for the combined cycle units is preferred to the other two sizes (60 MW and 120 MW) for the same technology, in spite of its higher specific investment cost, because of its better fit to the consumption and the low annual increase of the electricity demand;
− the lignite-fired steam power plant, 30 MW, is not selected in competition with combined cycle units, 30 MW, because of its higher overnight pure capital investment cost (2300 US$/kW) and of its lower efficiency (23-30%);
− the hydro power plant Artibonite 4C is selected for installation in 2014, and its availability for operation the next year(2015).
108 The capital cash flow for electricity generation system expansion and operation for the reference least
cost expansion programme is as follows:
Capital cash flow for electricity generation system expansion and operation, by year and by period
(million US$)
Year Electricity purchase Fuel cost
New capacity construction
(including IDC1) O&M cost Total
2007 16.6 61.5 9.5 9.1 96.72008 21.2 65.2 66.5 9.6 162.5
Subtotal 37.8 126.7 75.9 18.7 259.1 2009 26.6 68.8 78.4 10.1 183.92010 - 91 22.4 12.1 125.52011 - 97.3 42.5 12.6 152.42012 - 100.8 51.5 13 165.3
Subtotal 26.6 357.9 194.8 47.8 627.1 2013 - 110.6 46.5 13.7 170.82014 - 121.1 49.8 14.6 185.52015 - 127 49.7 15.7 192.42016 - 138.8 36.1 16.1 191.02017 - 141.4 45.9 16.7 204.0
Subtotal 0 638.9 228.0 76.8 943.7 Grand total 64.4 1123.5 498.7 143.3 1829.9 Note: 1. IDC - Interest during construction
It should be mentioned that the cost of new capacity construction are not specified for the commissioning year of the unit but for its construction years, according to the “S-curve” of capital expenditure.
109 The average cost of the sent out electricity from the power plants, calculated as the ratio of the
“discounted total expansion and operation cost” and “discounted electricity demand” is of 87.9 US$/MWh (8.79 US¢/kWh) if calculated for the period 2007-2017, and 84.7 US$/MWh (8.47 US¢/kWh) if calculated for the period 2007-2022. The average cost is lower when calculated for the period 2007-2022 because between 2016-2020 many existing generating units with low efficiency are retired and replaced with combined cycle units with higher efficiency.
110 The total costs for electricity generation system expansion and operation will represent between 3.1%
(in 2007) and 5.6% (in 2009) of the total GDP of Haiti, out of which the expansion costs will be between 0.3% (in 2007) and 2.4% (in 2009) of total GDP. As it can be noticed, the year 2009 will be the
19

year with the highest financial effort both for the operation of the electricity generation system and for its expansion (in this year several combined cycle units, 30 MW, and two diesel units, 2.5 MW, will be in different construction stages.
111 The above least cost expansion programme is valid for the following intervals of variation of the main
economic parameters: • discount rate: 14-19%; • cost of unserved energy: 0.6-1.2 US$/kWh; • cost of additional electricity purchases from private companies: inferior or equal to 126 US$/MWh.
112 For the discount rate of 13%, the hydro power plant Artibonite 4C is advanced by one year, in 2014
instead of 2015. For the discount rate of 12%, the hydro power plant Artibonite 4C is also advanced in 2015 but, in addition, one wind farm is included as part of the least cost expansion programme in year 2007 and some combined cycle units, 30 MW, are postponed for one year, the total number in years 2016 and 2021 remaining the same. For the discount rate of 20%, the hydro power plant Artibonite 4C is not selected anymore as part of the least cost expansion programme and, on the other hand, some combined cycle units, 30 MW, are advanced by one year, 12 units being asked until 2016, instead of 11 units in the reference expansion programme.
113 For the cost of unserved energy of 0.5 US$/kWh, only 10 combined cycle units, 30 MW, are selected
until 2016, instead of 11 units in the reference least cost expansion programme and three wind farms of 10 MW are selected in years 2007, 2011 and 2014. For the cost of unserved energy of 1.3 US$/kWh, some combined cycle units, 30 MW, are advanced by one year but the total number of asked units until 2016 remain the same (11 units).
114 For the cost of additional electricity purchases from private companies equal or superior to 127
US$/MWh the installation of a wind farm in year 2007 become more attractive than the electricity purchase.
115 The annual amounts of additional electricity purchases by EDH from private companies or from
Dominican Republic (if possible) are quite large: 166 GWh in 2007 (14.4% of the estimated annual electricity demand), 212 GWh in 2008 (17.0%) and 266 GWh in 2007 (19.8%). If they are not available at a cost inferior or equal to 126 US$/MWh or they are not entirely available, than the only possible alternative options are: • unserved electricity in years 2007-2009, before the commissioning of the five combined cycle units,
30 MW, in 2010, with the inherent damages caused to consumers (see the rationale for the cost of unserved energy);
• installation of five diesel units, 12 MW, and of four wind farms, 10 x 1 MW, in year 2008 (alternative expansion programme).
116 This alternative expansion programme will result in additional total cost of 48.2 million US$, as
shown in the next table.
Difference in costs between the reference expansion programme (with additional electricity purchase) and alternative expansion programme (without additional electricity purchase)
(million US$)
Expansion programme
Electricity purchase Fuel cost
New capacity construction cost (including IDC)
O&M cost Total
Reference 64.4 1123.5 498.7 143.3 1829.9 Alternative 0.0 1135.0 547.5 182.5 1865.0 Alternative –Reference -64.4 11.5 48.8 39.2 35.1
117 The construction costs of the new capacities are higher in the case of Haitian electricity generation
system because of its small size, asking for small unit sizes with higher specific investment cost than the
20
larger similar units. From this point of view, a deeper integration of the electric systems of Haiti and Dominican Republic would be beneficial to both countries, but especially to the lower system, for several reasons:
- Scale effect: larger interconnected system would allow for higher unit sizes with smaller specific investments;
- Peak load of interconnected system lower than the sum of the respective peak loads at isolated operation and, therefore, lower necessary peak capacities;
- Mutual assistance in case of unit outages and, consequently, lower necessary reserve capacities; - Coordination of unit scheduled maintenance.
Systematic provision of resources for power generation
118 Currently EDH is facing many problems in procuring the necessary fuel (diesel oil and heavy fuel oil) for electricity generation. Sometimes, units are not running because EDH doesn’t have enough financial resources to buy fuel or spare parts. Generation division of EDH always elaborates fuel budget that is never applied. Therefore, the company must benefit some financial assistance to restart a normal activity cycle: electricity production – selling - money collection - new production cycle.
Transmission and distribution network
119 Transmission and distribution network must be rehabilitated to facilitate the energy transfer to the customers. Some substations and distribution networks need to be upgraded and due to population growth and extension of cities. 50,000 new customers per year must be reached but only 15 km of extension line are built per year. Broken transformers and poles must be replaced by new ones, too.
Systematic maintenance of capacities
120 EDH must be given the capability to implement the scheduled maintenance program of its generating units and lines according to its internal standards and to the international good practice.
Periodic study on electric system development
121 The Public Utility Ministry, MTPTC, should undertake periodically (every two years, for example) a
comprehensive study, with a time horizon of about 10 years, on electric system development, including generating capacity additions, transmission grid reinforcement, distribution network extension to new areas, the role of renewable energy resources in grid-connected regions and for local electricity production in remote from grid areas (for example, hybrid combinations of small diesel units + wind farms + solar energy) etc. The conclusions of this study, including the list of necessary investments with probable deadlines, should be made available to interested entities (investors, banks etc.). Ministers in other countries usually publish this public document on their web sites [6]. In this way the prospective investors will be informed on the future needs of the utility and will be able to respond to solicited timetable and capacity requirements.
Electricity commercialisation
122 EDH has the objective to increase the billing rate from 47% to 75% during 15 years by: - verifying the good conditions of each meter; - rehabilitating 9,700 existing meters and connections per year (PREPSEL Project); - establishing collective meters for overpopulated areas; - eliminating the illegal connexions by using tough measures as arrest, promotion of new energy law
and acquiring new meters and accessories to connect consumers; - reducing the customer’s debt by implementing an aggressive policy of electricity cost recovery; - building new and “performing” service centres close to the customers;
21

- Increasing the number of customers by extending the networks.
123 The previous measures will contribute also to fulfill the objectives of ICF related to the increase of billing rate in Port-au-Prince (reduction of non-technical losses):
− March 2007: 55% − September 2007: 57% − March 2008: 60% − September 2008: 62%
124 Increase the number of hours of electricity supply per day according to the objectives of ICF:
Port-au-Prince Rest of the provincial networks − September 2007: 12 hours/day 6 hours/day − September 2008: 18 hours/day 18 hours/day − September 2009: 24 hours/day 24 hours/day
New legal framework 125 In order to make possible fulfillment of the above objectives the revision of the existing legislation and
proposal for a new legal framework to appropriately reflect the new situation in the electricity sector is necessary. For example, the proposal for the law against illegal connection to the electric networks was elaborated and submitted to the parliament before 1998. This proposal was never voted until now, in spite of the fact that it is crucial for solving the problem of non-technical losses.
Logistic and human resources
126 The utility company needs to buy new machinery and equipment to improve the maintenance of the grid. EDH needs to upgrade and make reliable also its information and telecommunication (IT) system, which is not working satisfactorily. Due to political and socio-economic problems, a lot of well-trained employees left the company to go abroad or to another job. These human resources have not been replaced and some young employees who just came don’t have enough experience. EDH needs to invest into staff and technician formation and to hire motivated young engineers. Incentives should be used to motivate employees, such as a good salary policy.
4.4 Wind energy
127 Modern wind farms can produce electricity for US$40-110/MWh, all cost (initial capital cost,
maintenance) included, depending on the site wind resource variation. For new large wind turbines (> 1 MW) the investment cost is of about 1500$/kW, while for small wind turbines (< 1 MW) the investment cost will be higher: 2500-4000 $/kW. Therefore, fiscal (tax incentives) and regulatory instruments (“net metering” concept, mandatory dispatching, promoting schemes) might be applied to improve the economic feasibility of small wind development. Average capacity factor (CF) of wind farms is site-dependent and usually ranges between 19-35%. Reliability has improved steadily and most wind turbine manufacturers now guarantee availabilities of 95%.
128 In the case of renewable energy projects, in general, and also for wind energy projects, one of the main
prerequisites for attracting potential investors is a basic set of data identifying key resource and describing the likely quantity and quality of such resources. In this respect, wind mapping of the country and site-specific monitoring is necessary. A wind mapping activity is ongoing and is scheduled to be finished at the end of 2006.
129 United Nations Environment Programme (UNEP) developed the Solar and Wind Energy Resource
Assessment (SWERA) pilot project (June 2001 – July 2004), for wind and solar resource assessment in major areas of developing countries (DCs) in South America, Central America (including Caribbean region), large portions of Africa, and South and East Asia [7]. The thirteen countries included in the SWERA pilot project include: Bangladesh, Brazil, China, Cuba, El Salvador, Ethiopia, Ghana,
22

Guatemala, Honduras, Kenya, Nepal, Nicaragua, and Sri Lanka. The objective of SWERA project is to provide high resolution solar and wind resource data and geographic information assessment tools to public and private sector executives who are involved in energy market development. The overall goal is to promote the integration of wind and solar alternatives in national and regional energy planning and sector restructuring as well as related policy-making. Global and regional maps will be available to all DCs.
4.5 Solar energy
130 Solar energy can be used in two ways: using solar water heaters (SWH) to produce hot water and thus
to offset the need for electric or fossil fuel water heating or using photovoltaic (PV) cells to convert the sun’s light into direct current, which can be used as it is or stored in batteries. United Nations Environment Programme (UNEP), Division for Technology, Industry and Economics (DTIE), Solar and Wind Energy Resource Assessment (SWERA) pilot project, can provide also detailed information (mapping) on the solar resource in Haiti.
4.6 Municipal solid waste energy
131 The transition strategy of the Haiti Government has three priorities related to solid waste:
- Ensuring the effective and efficient collection/removal of solid waste in MAPAP and main secondary cities;
- Ensuring an adequate treatment/elimination of solid waste in compliance with social and environmental norms;
- Strengthening the legal, institutional, and financial framework at the national and municipal level, including the adoption of a “National Plan for Management of Solid Waste” by March 2007 and creation of a National Waste Agency (NWA) by September 2007. No mention is made about the intention of energy from waste recovery.
112 The available options for the resource recovery from solid waste are: recycling, composting, incineration
with/without energy recovery, fuel production through a fermentation process, and landfill disposal (with/without collection of the methane gas generated by the landfill). The future National Waste Agency will certainly decide what are the most suitable actions to take on this matter. However, the technologies for energy from waste recovery are costly and Haiti probably will not afford them until 2017, the time horizon of the present Energy Development Plan.
5 Objectives of the energy policy of the Haitian Government
132 The objectives of the Haiti Government related to the energy sector are as follows: − Support the recapitalization of enterprises in difficulty (case of EDH); − Improve and modernize the management of public enterprises in key sectors, including EDH; − Improving the production and distribution of electricity in the country; − Strengthening the State’s regulatory role in key sectors of the economy, including energy; − Prepare and implement the reforms needed to create favorable environment for local and
foreign investment; − Put priority on a significant improvement in the provision of electricity in the country; − Promotion of alternatives to fuel wood and the promotion of renewable energies.
133 More specifically, the Government of Haiti has established the following priority objectives for EDH: − Establishment of a management contract for EDH − Maintain electrical service for at least 12 hours per day in Port-au-Prince and in the rest of the
country; − Stabilization of EDH and establishment of conditions necessary for its recovery; − Improvement of the quality of services and customer care;
23

− Reduction of technical losses and increase of efficiency; − Special attention to improve collection rate and commercial profitability; − Reduction of fraud and theft of electricity; − Obtaining better conditions in the PPA contracts with private producers, taking into account
the interests of both parties.
134 To stabilize EDH and enhance its services, a medium-term (5 years) management contract is envisaged, as well as implementation of a medium-term investment plan designed to increase access to electricity of the population from 12.5% at present to 20% by 2013.
135 Conservation of natural resources, especially forests. This can be done by several measures: − Support for more efficient use of charcoal and fuel wood; − Reforestation of strategic areas for safety of population, environmental protection and
tourism; − Generation of energetic forests; − Conversion to diesel, bio-diesel and to LPG of 1,000 small enterprises that use wood as fuel; − Financial support to cellulose briquette producers; − Initiation of a study to determine the feasibility of wood imports or exchanges with lime; − Promotion of renewable energies (wind and solar) through institutional reinforcement (and
improved access for the poor to energy services).
136 Promotion of bio-fuels. This can be achieved through incentives for growing energetic crops and by encouraging investments in facilities for bio-fuels production and use. Main bio-fuels are bio-diesel, ethanol and methanol produced from bagasse and different fast growing plants.
6 Energy sector reform
137 The reform of energy sector today should be guided by the idea of finding the most suitable form of partnership between public needs and private interests. Haiti public needs in energy sector are mainly defined by the terrible deforestation of the country and low level of electricity supply. Public interest is to switch cooking from firewood and charcoal to fossil fuels, and increase the efficiency of cooking, and to enlarge electricity distribution network, to connect more households to the grid, to have secure and reliable electricity supply and increase electricity generation capacity. Private interest is to make profit. Only market forces are not capable to acceptably solve all of these issues. There is need for state intervention through the reform of energy sector, institutional and legal framework, new institutions such as a regulatory entity and new and immediate measures. In such a design of rules in energy sector, there must be enough space for private capital, and through the laws and secondary legislation, clear and secure way to make profit in energy activities.
138 There is a need to prepare the Concept of Energy Sector Reform compatible with this National Energy
Plan. This Concept, adopted by government, must have the consensus of all parties in the country. In such a concept must be stressed the basic ideas about all main issues in energy sector, including the ways of privatisation, ways of development of energy markets, ways of regulation, ways of implementing renewable energy sources and energy efficiency, needed new institutions and measures etc. After the adoption of such an integral concept, there is need to prepare Energy law and secondary legislation.
139 Basically, Haiti needs to develop transmission and distribution of electricity. Generation of electricity,
especially in new units could be private through the concept of IPP (Independent Power Producer) is now a reality in Haiti. The presence of IPPs, plus free access to the electric networks define the concept of the “single buyer market”.
140 In order to have a management with better skills immediately, which is really needed, there is the
option to call tender for the operator of the electrical networks. In this way, ownership is by the state, so government can provide energy strategy, but a private company is operator of the electrical networks
24

and can transfer knowledge and technology. In this way the private capital is not an owner, and is not interested to maximise the profit through slow enlargement of networks. If such operators have to build and operate networks, it is necessary to introduce new institutions, regulation of energy activities, to define tariffs and interest rate on invested capital, and to protect the consumers.
141 Oil products market is typically a private activity, but in order to prevent deforestation by replacing
fuel wood and charcoal consumption with LPG and kerosene, there are needs to have clear definition of relations between private investors and government (subsides, incentives), which can be defined in Oil sector law and secondary legislation. For the implementation of these laws a National Authority and agencies working on site need to be established.
25

7 Energy sector development plan
Energy Development Plan for Haiti until 2017
Action Responsible institution Deadline Necessary financial resources (million
US$) Short-term actions (until end 2008)
Fuel wood and charcoal 1
Implement the objectives of ICF concerning the substitution of fuel wood and charcoal with alternative
energy forms: 21,000 households converted to
LPG; 9,000 households converted to
kerosene; 1000 SMEs converted to
LPG/diesel oil; 10 villages equipped with solar
panels 2,000 hectares reforested, and
financial support for fuel briquette producers
SEEMT/BME/MDE
September 2008 (according to ICF)
7.7
2
Implement the following fuel wood and charcoal substitution
programme: 669,000 households converted to
LPG 287,000 households converted to
kerosene 166,000 new stoves in households
143,000,000 tons of imported charcoal
SEEMT/BME/MDE
2007-2017
(according to this Plan)
12,0 (LPG) 2,8 (kerosene) 0,997 (stoves) 4,7 (import of
charcoal)
3
Initiate a feasibility study on an exchange (barter) wood-limestone between Haiti and Guyana or other
countries
SEEMT/BME/MDE
February 2007
COST NOT YET
DEFINED
4
Implement an energetic forest programme in the following regions:
- Dauphin Plantation (6,000 hectares), Madras Plantation,
Savane désolée, “La-Pierre region”, near Gonaives, the cap of St. Marc, dry region near Port-au-Prince and plain of Cul-de-Sac, east side of the Azuei lac, dry regions of Côtes de
Fer, Miragôane and western part of Gonave island.
MDE/MARNDR
May 2007
COST NOT YET DEFINED
Petroleum products 5 Activate and take advantage from
Caracas energy and PETROCARIBE accords
MTPTC/SEEMT/BME/ MEF
March 2006 COST NOT YET DEFINED -
6
Initiate a study on the possibility of producing domestic alternative
fuels: biodiesel, ethanol, methanol etc
MTPTC/SEEMT/BME/
MDE
2007
COST NOT YET
DEFINED
7
Initiate a study on the possibility of implementing a recycling
programme for the used engine oil
MTPTC/SEEMT/EDH/
BME
2007
COST NOT YET
DEFINED
Encourage a closer integration of
26

8 Haitian petroleum product sector with that of the Dominican Republic
MTPTC/SEEMT/MEF/ MCIT/BME
2007-2008 COST NOT YET DEFINED
Electricity 9
Financial audit by international firms launched for EDH
SEEMT/MTPTC February 2006 (according to ICF)
10 Preparation of a management contract for EDH
SEEMT/MTPTC March 2007 (according to ICF)
11 Improvement of the EDH Formation Centre
EDH March 2007 COST NOT YET DEFINED
12
Implement the objectives of ICF related to the increase of billing rate in Port-au-Prince:
− March 2007: 55% − September 2007: 57%
March 2008: 60% September 2008: 62%
EDH
March 2007 - September 2008
(according to ICF)
13
Implement the objectives of ICF for the increase of the number of hours of electricity supply per day in Port-au-Prince:
− September 2007: 12 hours/day − September 2008: 18 hours/day − September 2009: 24 hours/day
and in the rest of the provincial networks:
- September 2007: 6 hours/day - September 2008: 18 hours/day
September 2009: 24 hours/day
EDH
September 2007 – September 2008
(according to ICF)
14
Install at least 100,000 meters in households, this measure bringing yearly around 6 million US$ to EDH
EDH
March 2007
1.0
15
Disseminate 200,000 energy efficient lamps to households and have in this way savings on fuel cost of 1 million US$ yearly
EDH
June 2007
0.28
16
Start undertaking the necessary studies and procedures for the installation until
the end of year 2009 of the five combined cycle units included in the
reference expansion programme of the electricity generation system
EDH
June 2007
COST NOT YET DEFINED
17
Implementation of the reference programme of the electricity generation
system expansion for 2007-2008: 2007: 2 diesel units, 2.5 MW 2008: 2 diesel units, 2.5 MW
EDH
2007-2008
75.9*
18
Rehabilitation of engines at Varreux and Carrefour power plants and rehabilitation of heavy fuel oil
auxiliaries
EDH
2006
5.0
19
Upgrade of the 10 MVA power transformer at Croix des Bouquet
power station
EDH
2007
0.33
20
Upgrade of the 10 MVA power transformer at Canape Vert power
station
EDH
2007
0.33
21
Addition of 2x20 MVA, 69/12.47 kV at Varreux substation
EDH 2007 1.29
22 Renewal of tool sets for network repair EDH 2007 0.5 Conversion of voltage level from 4.16
27

23 kV to 12.47 kV at Carrefour Feuille substation
EDH 2007-2009 2.5
24 Addition of 4 wind farms of 10 MW EDH 2008 40.0 25 Rehabilitate small hydro units EDH 2007 2.13 26 Establish spare parts stock for the
power plants EDH 2007 1.5
27 Study on the interconnection Peligre – Hinche
EDH 2007 2.01
28
Supply of new equipment for Port-au-Prince metropolitan distribution
network
EDH
2007
6.0
29 Expansion of 600 km distribution lines in the Port-au-Prince metropolitan area
EDH 2007 1.9
30 Expansion of 720 km distribution lines in urban area out of Port-au-Prince
EDH 2007 2.34
31 Rehabilitation of 720 km electric lines around Port-au-Prince
EDH 2007 0.73
32 Rehabilitation of 1,200 km electric lines in urban area out of Port-au-
Prince
EDH 2007 0.95
33
Initiate a study on a deeper integration of the electric systems of Haiti and
Dominican Republic
EDH
2007
.0.4
34
Undertaking of a periodic comprehensive study on electric system
development (time horizon of 10 years) with public conclusions
EDH
2007 and every two-three years
0.3
35
Initiate a study on the possible improvements of electricity tariff
system
EDH
2007
COST NOT YET
DEFINED 36 New line Peligre / Hinche + substation EDH 2007-2009 8.71 37 Increasing the level of Peligre dam
from 5 to 6 m EDH 2006-2009 8.19
Wind and solar energy
38 Contact UNEP, SWERA pilot project,
in order to receive all the available information on the wind and solar
resources in the country
SEEMT/BME/MDE
2006
COST NOT YET
DEFINED
Energy sector reform
39 Prepare and summit to the Parliament
for vote the document Concept of Energy Sector Reform
MTPTC/SEEMT/BME
EDH
2007
COST NOT YET DEFINED
40 Prepare Energy law(s) and secondary legislation of the energy sector
MTPTC/SEEMT/BME EDH
2007 COST NOT YET DEFINED
TOTAL Medium-term actions (2009-2012)
Electricity 1
Implementation of the reference programme of the electricity generation
system expansion and operation for 2009-2011:
2009: 2 diesel units, 2.5 MW 2010: 2 diesel units, 2.5 MW and 5
combined cycle units, 30 MW 2011: 3 diesel units, 2.5 MW
2012: 3 diesel units, 2.5 MW and 1 combined cycle unit, 30 MW
EDH
2009-2012
194.8*
2 New Peligre / Cap Haitien, 107 km, 115 kV, single circuit line
EDH 2009-2013 13.2
3 New line Fort Liberté – Ouanaminthe, 24 km, 23 Kv
EDH 2009-2009 1.8
Energy sector reform
28
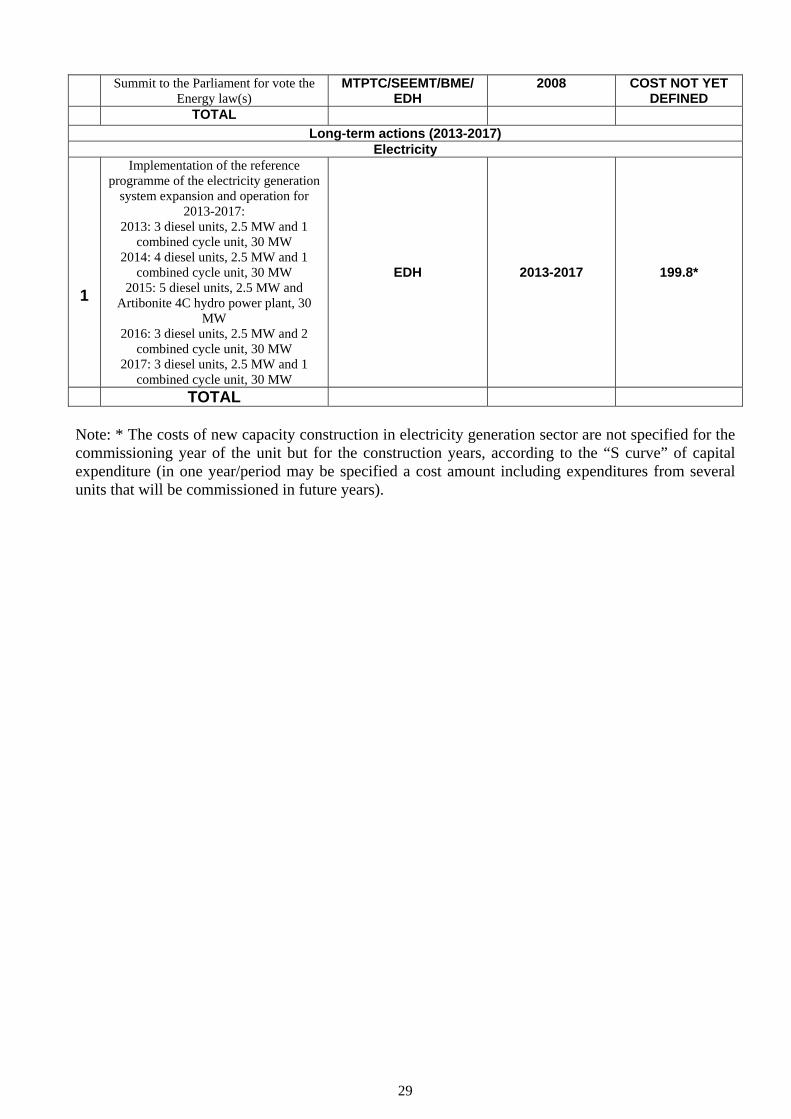
Summit to the Parliament for vote the Energy law(s)
MTPTC/SEEMT/BME/ EDH
2008 COST NOT YET DEFINED
TOTAL Long-term actions (2013-2017)
Electricity 1
Implementation of the reference programme of the electricity generation
system expansion and operation for 2013-2017:
2013: 3 diesel units, 2.5 MW and 1 combined cycle unit, 30 MW
2014: 4 diesel units, 2.5 MW and 1 combined cycle unit, 30 MW
2015: 5 diesel units, 2.5 MW and Artibonite 4C hydro power plant, 30
MW 2016: 3 diesel units, 2.5 MW and 2
combined cycle unit, 30 MW 2017: 3 diesel units, 2.5 MW and 1
combined cycle unit, 30 MW
EDH
2013-2017
199.8*
TOTAL
Note: * The costs of new capacity construction in electricity generation sector are not specified for the commissioning year of the unit but for the construction years, according to the “S curve” of capital expenditure (in one year/period may be specified a cost amount including expenditures from several units that will be commissioned in future years).
29

8 List of abbreviations and acronyms
Bbl Barrel of oil BME Bureau des Mines et de l’Energie (Bureau of Mines and Energy) Bpd Barrels per day CCI (ICF) Cadre de Coopération Intérimaire (Interim Cooperation Framework)DCs Developing countries EDH Electricité de Haiti (Electricity of Haiti) ESMAP Energy Strategic Management Assessment Program GDP Gross Domestic Product IAEA International Atomic Energy Agency IEA International Energy Agency ICF (CCI) Interim Cooperation Framework (Cadre de Coopération Intérimaire)ICFC Institute of Cooperation Franco-Caribbean IHSI L’Institut Haitien de Statistiques et d’Informatique IPP Independent Power Producer Kgoe kilogram of oil equivalent LPG Liquefied petroleum gases MAED Model for Analysis of Energy Demand MAPAP Metropolitan area of Port-au-Prince MARNDR Ministère de l’Agriculture des Ressources Naturelles et du
Développement Rural MDE Ministry of Environment (Ministère de l’Environnement) MSW Municipal solid waste MTPTC Ministère des Travaux Publics Transports et Communications
(Ministry for Public Works, Transportation and Communications) NWA National Waste Agency OLADE Latin American Energy Organization (Organisation Latino-
Américaine de l’Energie) PREPSEL Projet pour la Réduction des Pertes sur le Système Electrique SME Small and Medium-size Enterprise SWERA Solar and Wind Energy Resource Assessment SWH Solar water heater Toe Tons of oil equivalent UNEP United Nations Environment Programme WASP Wien Automatic System Planning package
30
9 References
[1] Latin American Energy Organization, European Commission, Energy-Economic Information System, Energy Statistics, Version No. 14, Quito, July 2002
[2] Pete Young and Bétonus Pierre, Haiti Energy Situation, April 1996 [3] Energy Strategic Management Assessment Program (ESMAP), Stratégie pour l’énergie domestique en
Haiti, 1991 [4] Republic of Haiti, United Nations, World Bank, European Commission, Inter-American Development
Bank, Interim Cooperation Framework 2004-2006, Summary Report, July 2004 [5] Klaus Johanssen, The German Stockholding System and Experience, IEA/China Seminar on Oil Stocks
and Emergency Response, Beijing, China, 9-10 December 2002 [6] National Grid Company, National Grid Seven Year Statement, March 2004, www.nationalgrid.com/uk [7] United Nations Environment Programme (UNEP), Division for Technology, Industry and Economics
(DTIE), Energy and Ozon Action Unit, Solar and Wind Energy Resource Assessment (SWERA) pilot project, www.uneptie.org/energy
31

10 Appendices
Appendix 1: Final energy consumption per capita in Latin America and Caribbean in 2001
Appendix 2: Final energy intensity in Latin America and Caribbean in 2001
32
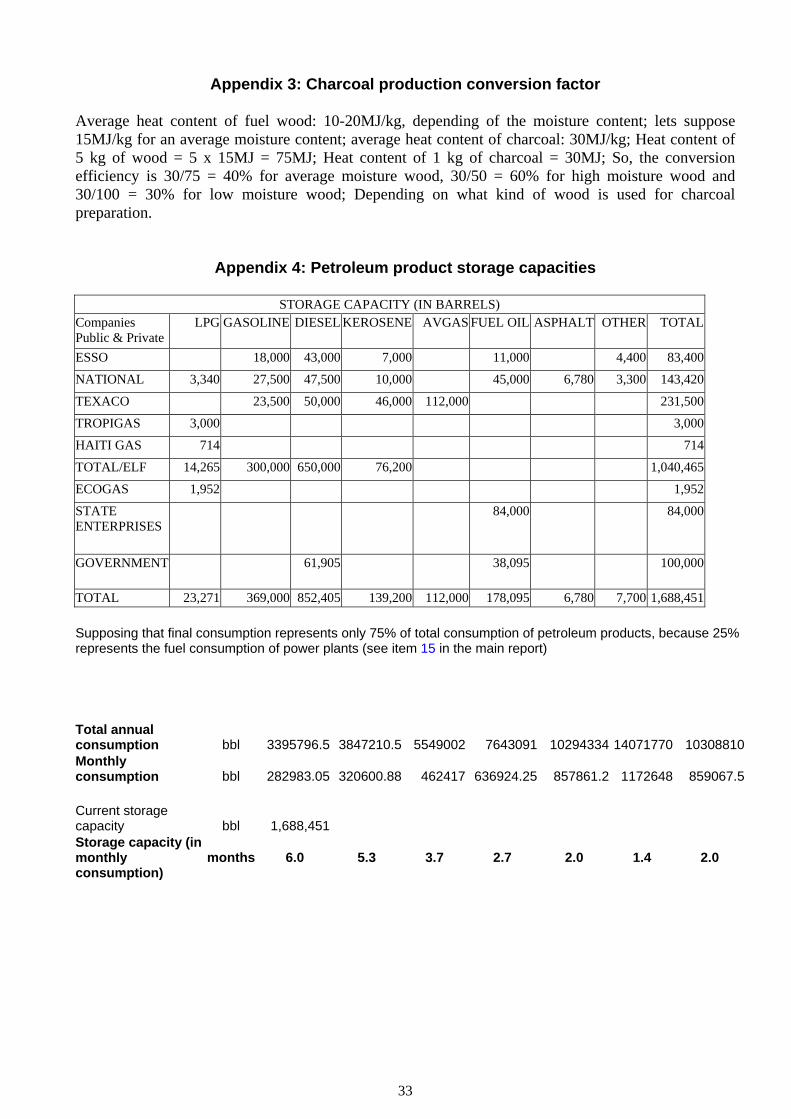
Appendix 3: Charcoal production conversion factor
Average heat content of fuel wood: 10-20MJ/kg, depending of the moisture content; lets suppose 15MJ/kg for an average moisture content; average heat content of charcoal: 30MJ/kg; Heat content of 5 kg of wood = 5 x 15MJ = 75MJ; Heat content of 1 kg of charcoal = 30MJ; So, the conversion efficiency is 30/75 = 40% for average moisture wood, 30/50 = 60% for high moisture wood and 30/100 = 30% for low moisture wood; Depending on what kind of wood is used for charcoal preparation.
Appendix 4: Petroleum product storage capacities
STORAGE CAPACITY (IN BARRELS) Companies Public & Private
LPG GASOLINE DIESEL KEROSENE AVGAS FUEL OIL ASPHALT OTHER TOTAL
ESSO 18,000 43,000 7,000 11,000 4,400 83,400
NATIONAL 3,340 27,500 47,500 10,000 45,000 6,780 3,300 143,420
TEXACO 23,500 50,000 46,000 112,000 231,500
TROPIGAS 3,000 3,000
HAITI GAS 714 714
TOTAL/ELF 14,265 300,000 650,000 76,200 1,040,465
ECOGAS 1,952 1,952
STATE ENTERPRISES
84,000 84,000
GOVERNMENT 61,905 38,095 100,000
TOTAL 23,271 369,000 852,405 139,200 112,000 178,095 6,780 7,700 1,688,451 Supposing that final consumption represents only 75% of total consumption of petroleum products, because 25% represents the fuel consumption of power plants (see item 15 in the main report) Total annual consumption bbl 3395796.5 3847210.5 5549002 7643091 10294334 14071770 10308810Monthly consumption bbl 282983.05 320600.88 462417 636924.25 857861.2 1172648 859067.5 Current storage capacity bbl 1,688,451 Storage capacity (in monthly consumption)
months 6.0 5.3 3.7 2.7 2.0 1.4 2.0
33


Appendix 5: Capacity factor of electricity generation in the Caribbean, 2002
Capacity factor of electricity generation in the Caribbean, 2002
Installed capacity (MW)
Net generation
(GWh)
Capacity factor (%)
Saint Kitts and Nevis 20 110 63 Aruba (NETH) 150 810 62 Barbados 170 800 54 Netherlands Antilles (NETH) 210 1000 54 Jamaica 1400 6290 51 Puerto Rico 4900 22090 51 Saint Vincent/Grenadines 20 90 51 Bahamas, The 400 1720 49 Trinidad and Tobago 1420 5740 46 Virgin Islands, British (U.K.) 10 40 46 Saint Lucia 70 270 44 Grenada 40 150 43 Antigua and Barbuda 30 110 42 Dominica 20 70 40 Cayman Islands (U.K.) 120 410 39 Cuba 4410 14410 37 Dominican Republic 2950 9580 37 Virgin Islands, U.S. 320 1040 37 Guadeloupe (FR) 420 1160 32 Haiti 240 620 30 Martinique (FR) 120 1180 - Montserrat (U.K.) 1 2 - Total 17440 67690 44.3
Source: US-DOE, Energy Information Administration, Caribbean Fact Sheet, July 2004
Appendix 6: Electricity supply hours by Regions in 2004
Region or city Electric supply hours (hours/day) Metropolitan Region From 12 to 16 Northern Region 20 to 24 Artibonite Region 20 to 24 Southern Region 20 to 24 Center-West 4 to 6 Jacmel city 24
Appendix 7: Statistics of EDH commercialization Department from 1998-1999 to 2002-2003
Item 1998-1999 1999-2000 2000-2001 2001-2002 2002-2003 Total production (GWh) 639.58 631.87 441.10 548.23 513.29 Total energy sold (GWh) 304.92 305.95 238.12 255.85 238.22 Total losses (GWh) 334.65 325.92 202.98 292.38 275.07 Rate of total losses 52.32% 51.58% 46.02% 53.33% 53.59% Rate of billing 47.68% 48.42% 53.98% 46.67% 46.41% Rate of money collection 94.72% 98.41% 81.50% 91.04% 105.66% Average tariff
35

gourde/KWh 1.7607 1.7607 4.0934 4.0934 5.1883 Appendix 8: Electricity losses by country (%)
OECD
average Ethiopia Indonesia &
Egypt Philippines Sudan Algeria Cameroon &
Zimbabwe Kenya India &
Togo Nigeria Haiti
6.5 10 11.5 14 15 16 21 22 27 32 46-54 Source: IEA, World Energy Outlook 2002, Chapter 13 - Energy and Poverty.
Appendix 9: Energy substitution and conservation programmes
ENERGY SUBSTITUTION PER PRODUCT 2007 2012 2017 2022LPG number 0,029 0,184 0,357 0,551Existing 0,155 0,155 0,155 0,155Total LPG 0,184 0,339 0,512 0,706LPG usef. GWh 247,273 450,854 669,506 910,683LPG final Toe 5,474 9,692 13,706 17,797LPG final 1000 t Kerosene number 0,012 0,079 0,153 0,236Existing 0,067 0,067 0,067 0,067Total kerosene 0,079 0,145 0,219 0,303kero usef. GWh 105,974 193,223 286,931 390,293kero final Toe 2,346 4,154 5,874 7,627kero final 1000 t
LPG and KERO RELATED INVESTMENT TILL 2017 with a subsidy of 50% of the equipment
L P G KEROSENE Equipment ( US$ ) 30 15 Managerial cost ( US$) 3 3 Investment per unit ( US$) 33 18 Investment for 10 years (106 US$) 18,173 4,248 Yearly cost (106 US$) 1,211 0,283
36

ENERGY CONSERVATION PROGRAMM
2000 2007 2012 2017 2022 2027 2032 Eff. Noncomm. 15,0 15,0 15,5 16,9 19,4 21,9 25,0Eff. Wood 0,100 0,100 0,106 0,115 0,126 0,138 0,150Share 0,600 0,591 0,556 0,520 0,480 0,440 0,400Eff. Charcol 0,220 0,220 0,236 0,259 0,280 0,309 0,340Share 0,400 0,409 0,444 0,480 0,520 0,560 0,600Eff. Noncomm. 0,148 0,149 0,164 0,184 0,206 0,234 0,264number of HH with Charcol 0,509 0,578 0,582 0,587 0,581 0,569 0,547Old 0,509 0,578 0,511 0,421 0,297 0,151 0,000Share 1,000 1,000 0,878 0,717 0,511 0,266 0,000eff. Old 0,220 0,220 0,220 0,220 0,220 0,220 0,220New 0,000 0,000 0,071 0,166 0,284 0,418 0,547Share 0,000 0,000 0,122 0,283 0,489 0,734 1,000eff. New 0,340 0,340 0,340 0,340 0,340 0,340 0,340Eff. Charcoal 0,220 0,220 0,235 0,254 0,279 0,308 0,340new Charcoal stove numb. 0,000 0,000 0,071 0,166 0,284 0,418 0,547
INVESTMENT COST TILL 2017
Equipment cost with 50% of subsidies 3 US$ 1,640 millions US$ Managerial cost per stoves 3 US$ 1,640 millions US$ Total 6 US$ 3,280 millions US$ Yearly investments 0,131 millions US$
Appendix 10: Potential domestic production of alternative transport fuels (biodiesel, ethanol, methanol)
Biodiesel : (Fatty acid methyl ester): domestically produced, renewable fuel that can be manufactured from vegetable oils (which can come from soy, rapeseed, linseed or sunflower seeds), animal fats, or recycled vegetable cooking oil and greases collected from restaurants, hotels, schools etc. Blends of 20% biodiesel with 80% petroleum diesel (B20) can generally be used in unmodified diesel engines. Biodiesel can also be used in its pure form (B100), but it too may require certain engine modifications to avoid maintenance and performance problems. A 5% blend is sold in France. Biodiesel is safe, biodegradable, and reduces serious air pollutants such as particulates, carbon monoxide, hydrocarbons, and air toxics. Emissions of nitrogen oxides increase with the concentration of biodiesel in the fuel. Glycerine (used in pharmaceuticals and cosmetics, among other markets), lecithin and vitamin E are produced also as by-products. Biodiesel production represents also a positively recycling of waste cooking oil, which constitutes a serious environmental problem. Possible incentives: lower taxation than standard diesel.
Ethanol : (Ethyl alcohol): alcohol-based alternative fuel produced from any biological feedstoks that contain appreciable amounts of sugar (sugar beets, sugar cane) or materials that can be converted into sugar, as starch (corn, barley and wheat) or cellulose (trees and grasses). The ethanol produced from "cellulosic biomass" such as trees and grasses is called bioethanol. Ethanol is most commonly used to increase octane and improve the emissions quality of gasoline. Ethanol can be blended with gasoline to create E85 (a blend of 85% ethanol and 15% gasoline) or with even higher concentrations of ethanol, E95. Techniques are under development to make ethanol from waste paper, sawdust and other low-cost materials. All today’s petrol motors can operate with 10% ethanol mixed with gasoline without the need for adjustments. Jamaica is looking into producing ethanol from sugar cane to reduce oil imports and the high cost associated with it.
37

Methanol : an alcohol fuel made usually from natural gas. It could also be made from landfill gas, bagasse or wood chips. Methanol is a liquid fuel that can be used in an internal combustion engine or a fuel cell.
Appendix 11: Electricity generation system least cost expansion programme According to the results of the MAED study, the electricity peak load will increase with about 150 MW from year 2000 to 2010 and with 165 MW from 2010 to 2015 due to economic and social development of the country. Artibonite region is expected to be connected to the main transmission grid in 2013-2015, when the maximal load will be 30 MW. Region North will be interconnected in 2013-2015 with a peak of 37 MW. Because of its low consumption and long distance to the existing transmission grid, the region South will be not connected to main transmission grid until 2022. In 2015, this region will reach the maximal load of 26 MW. All load and electrical energy needs of these three regions, in the specified time horizons, will be covered with small diesel units, wind farms and small hydro units. Until 2015 the following new capacities will be required: 25 MW in region Artibonite (until 2012), 25 MW in region South and 30 MW in region North. In the same time, some existing electricity generation capacities will be retired, as they will reach their standard lifetime: about 50 MW during the period 2000-2010 and 45 MW between 2010 and 2015. Therefore, new electricity generation capacities will be necessary to be installed to meet the electricity demand with a satisfactory level of reliability of the electricity supply. If some 20% of reserve capacities are considered, than about 200 MW of new capacities must be installed between 2000-2012 and 240 MW between 2012-2017. The least cost expansion programme for the Haitian electricity generation system will be determined using the IAEA’s model WASP. WASP model is designed to find the economically optimal expansion policy for an electric utility system within user specified constraints. It utilises probabilistic estimation of system production costs, unserved energy costs, and reliability, linear programming technique for determining optimal dispatch policy satisfying exogenous constraints on environmental emissions, fuel availability and electricity generation by some plants, and the dynamic programming method for optimising the costs of alternative system expansion policies. In order to obtain sound expansion cost evaluations for period until to 2017, a longer period (till 2022) will be considered for the WASP model analysis.
38

39
As during the period 2000-2004 only 10 MW (VAREUX 4) have been added, the main investment effort will have to be done during the period 2007-2017. Building a new power plant requires however a preparation period consisting in studies and construction time, variable from one technology to another. Therefore, for the immediate future (2007-2009) some purchase of electricity by EDH from private companies and technologies requiring quick construction time (diesel engines, wind farms) should be considered. ICF plan propose the addition of 2 diesel units of 12 MW at Carrefour power station in 2007, one new power station of 120 MW (6 x 20 MW) in 2012 and some units out of Port-au-Prince (combined cycle, if it is possible). No hydro units are provided in ICF plan but Haiti has a good hydro potential. Having in mind all above considerations, the following electricity generation system expansion options have been considered:
Technology type Fuel Size
Construction time Available for operation from year:
2.5 MW < 1 year 2007 Diesel engines Imported heavy fuel oil 12 MW 1 year 2009
Wind farms - 10 x 1 MW 1 year 2008 20 MW 1.5 years 2009 30 MW 1.5 years 2009
Combustion turbines (simple cycle)
Imported heavy fuel oil
60 MW 1.5 years 2009 30 MW 2.5 years 2010 60 MW 2.5 years 2010
Combustion turbines (combined cycle)
Imported heavy fuel oil
120 MW 2.5 years 2010 Steam power plant Domestic lignite 30 MW 4 years 2012 Hydro power plant (Artibonite 4C)
- 30 MW 4 years 2014
No other hydro options have been considered because the respective technical and economic data were not available in the detailed format as required by WASP model. In addition to the above electricity generation system expansion options, the purchase of electricity by EDH from private companies or from Dominican Republic, if possible, is considered as a transitory solution for the period 2007-2009.

The technical and economic characteristics assumed for the above electricity generation system expansion options are as follows:
Electricity generation system expansion options ("candidates")
Technical/economic parameter Unit Diesel engines Wind farms
Combustion turbines (simple cycle)
Combustion turbines (combined cycle)
Lignite-fired steam plant
Hydro power plant
2.5 MW 12 MW 10x1MW 20 MW 30 MW 60 MW 30 MW 60 MW 120 MW 30 MW D2.5 DI12 WF10 SC20 SC30 SC60 CC30 CC60 C120 LI30 ART4
Available for operation from year 2007 2006 2008 2009 2009 2009 2010 2010 2010 2012 2014
Maximum unit generating capacity MW 2.5 6 10 20 30 60 30 60 120 30 30
Minimum operating level MW 1.25 12 5 10 15 30 15 30 60 10
Plant (fuel) type number (0,1,2, …, 9) - 1 1 4 1 1 1 0 0 0 5
Efficiency at maximum operating level % 33 33 100 35 35 35 55 55 55 30
Heat rate at maximum operating level kcal/kWh 2606 2606 860 2457 2457 2457 1564 1564 1564 2867
Efficiency at minimum operating level % 30 30 100 30 30 30 40 40 40 23
Heat rate at minimum operating level kcal/kWh 2867 2867 860 2867 2867 2867 2150 2150 2150 3739
Average incremental heat rate between minimum and maximum operating levels
kcal/kWh 2345 3127 860 2048 2048 2048 977 977 977 2430
Unit spinning reserve (% of maximum
generating capacity)
5 5 0 15 10 10 10 10 10 0
Unit forced outage rate % 10 10 70 20 20 20 10 10 10 12
Scheduled maintenance days/year 30 30 0 30 35 40 40 45 50 45
Maintenance class size MW 3 10 10 20 30 60 30 60 120 3030
Domestic fuel cost (¢/Gcal) 0 0 0 0 0 0 0 0 0
Foreign fuel cost (¢/Gcal) 3186 3186 0 3186 3186 3186 3550 3550 3550 0
Fixed O&M cost ($/kW-month) 5.2 5.2 0.7 4.2 4.2 4.2 0.8 0.9 1 2
Variable O&M cost $/MWh 2.8 2.8 5 1.8 1.8 1.8 2.4 2.4 2.4 2
Heat value of the fuel used kcal/kg 9500 9500 0 9500 9500 9500 10150 10150 10150 2050
40

41
Overnight pure capital investment cost $/kW 1000 950 1500 700 650 600 900 850 800 2300 2000
Depreciable capital cost $/kW 900 855 1500 665 617.5 570 855 807.5 760 2185 2000
- Depreciable domestic capital cost $/kW 225 213.75 375 166.25 154.38 142.5 213.75 201.875 190 546.25 600
- Depreciable foreign capital cost $/kW 675 641.25 1125 498.75 463.13 427.5 641.25 605.625 570 1638.75 1400
Non-depreciable capital cost $/kW 100 95 0 35 32.5 30 45 42.5 40 115 0- Non-depreciable domestic capital cost $/kW 0 0 0 0 0 0 0 0 0 0 0
- Non-depreciable foreign capital cost $/kW 100 95 0 35 32.5 30 45 42.5 40 115 0
Construction time years 1 1 1 1.5 1.5 1.5 2.5 2.5 2.5 4 5
Discount rate % 14 14 14 14 14 14 14 14 14 14 14
IDC from pure capital investment cost % 6.03 6.03 6.03 9.21 9.21 9.21 12.5 12.5 12.5 26.91 37.89
Total construction cost (Overnight pure cost + IDC) $/kW 1054.3 1001.6 1590.5 761.2 706.9 652.5 1006.9 950.9 895.0 2888.0 2757.8
IDC from total construction cost % 5.69 5.69 5.69 8.43 8.43 8.43 11.11 11.11 11.11 21.21 27.48
Plant lifetime years 20 20 20 30 30 30 30 30 30 30 50

An installation programme for small diesel engines (2.5 MW) in isolated regional networks has been decided exogenously from WASP optimisation according to the increase in electricity demand in those regions as follows:
Region
Year Number of 2.5 MW thermal engines
Artibonite West Nord South 2007 2 1 1 2008 2 1 1
Subtotal (2007-2008)
4 2 1 1
2009 2 1 1 2010 2 1 1 2011 3 1 1 1 2012 3 1 1 1
Subtotal (2009-2012)
10 3 2 3 2
2013 3 2 1 2014 4 2 1 1 2015 5 2 2 1 2016 3 1 1 1 2017 3 1 1 1
Subtotal (2013-2017)
18 4 2 7 5
Total 32 9 4 11 8 The unit size of 2.5 MW or sometimes multiples of this size are suitable for the small annual increase in electricity demand of the respective regions. The localisation by regions of these units, in terms of installed capacity, would be as follows: region Artibonite – 22.5 MW until 2015, region South – 20 MW, region North – 27.5 MW and 10 MW for West until 2017. All the other expansion options were subject to WASP model optimisation, and the least cost development programme for the Haitian electricity generation system has been determined based on the following hypothesis:
• unserved energy cost of 1US$/kWh; • discount rate of 14%; • salvage value of assets determined based on linear depreciation method; • possibility of electricity purchase by EDH from private companies at a similar cost to that of the
existing purchase agreement (supply fuel and pay a certain amount for the purchased electricity) which results in a total cost of about 100 US$/MWh.
Optimisation criterion is the minimization of the total discounted cost (investment + operation + unserved energy – salvage value) of all possible expansion paths for the electricity generation system. The selected value of the discount rate is consistent with the figures being currently used in similar studies undertaken for Haiti, with the current interest rates practised by the banks for credits and with relatively high country risk for private investments in Haiti. The cost of unserved energy is a kind of penalty for the electricity non-supplied to customers and reflects the average value of damages they may have if not supplied with electricity according to the agreed reliability standards. The rationale of the penalty for the unsupplied electricity demand is the following: • When used in economic productive sectors, the electricity contributes to economic growth, creation of new
jobs, and consequently to additional revenues for individuals, poverty alleviation. • When used in social services (culture, education, medical assistance etc.) and in households, electricity use
has beneficial effects, more difficult to evaluate in monetary terms but undeniable from social viewpoint: - increase in the cultural level of individuals; - better sanitary conditions and medical care;
42

- increased social security etc. Unsupplied electricity constitutes, therefore, a loss of these economic and social benefits and must be penalised in the energy planning studies. If not penalised, the unsupplied electricity represents the cheapest “development” option for electricity generation system. In assessing the average cost of unserved energy for WASP calculations, two reference figures were available: − the current marginal electricity supply cost of about 100US$/MWh for the existing electricity purchase
agreement; − the final electricity intensity (ratio of annual final electricity consumption to total GDP) for Haiti in year
2000 is, according to MAED study, of 0.256 MWh / 1000 US$ (762 GWh / 2970 million US$), which is equivalent to about 3,900 US$/MWh.
The selected value of unserved energy for WASP calculations is of 1 US$/kWh, which is equivalent to 1000 US$/MWh and represents an intermediate penalty, ten times higher than the current marginal electricity supply option (100 US$/MWh) and 39 times lower than the equivalent (3,900 US$/MWh) of the average final electricity intensity at the country level. Sensitivity studies will be necessary to see how robust is the least cost expansion programme to the variation of the above economic parameters. In determining the least cost expansion programme for the Haitian electricity generation system, a difficult decision has to be taken for the very next years (2007-2008) when some of the considered system development options: combustion turbines (simple cycle), combustion turbines (combined cycle), steam power plant, hydro power plant are not available for operation because their respective construction time and other practical reasons. In fact, for the very near future only the following electricity supply options are available: installation of small diesel engines (2.5 MW) in some isolated regional networks and additional purchase of electricity by EDH from private companies, which can be applied from 2007 and installation of diesel engines (12 MW) and/or wind farms, which could be operational from 2008. After the consideration of all the above electricity supply options, with their respective constraints, the reference least cost programme of electricity generation system expansion and operation determined with WASP model is the following:
Year Electricity purchase
Diesel engines
Wind farms
Combustion turbines (simple
cycle)
Combustion turbines (combined
cycle)
Lignite-fired steam
plant
Hydro power plant
(GWh) 2.5 MW
12 MW
10x 1MW
20 MW
30 MW
60 MW
30 MW
60 MW
120 MW
30 MW 30 MW
2007 166 2 - - - - - - - - - - 2008 212 2 - - - - - - - - - -
Subtotal 378 4 - - - - - - - - - - 2009 266 2 - - - - - - - - - - 2010 - 2 - - - - - 5 - - - - 2011 - 3 - - - - - - - - - - 2012 - 3 - - - - - 1 - - - -
Subtotal 266 10 - - - - - 6 - - - - 2013 - 3 - - - - - 1 - - - - 2014 - 4 - - - - - 1 - - - - 2015 - 5 - - - - - - - - - 1 2016 - 3 - - - - - 2 - - - - 2017 - 3 - - - - - 1 - - - -
Subtotal - 18 - - - - - 5 - - - 1 Total 644 32 - - - - - 11 - - - 1
The following comments can be made in relation with the above least cost programme of electricity generation system expansion and operation: − the installation programme for the small diesel engines (2.5 MW) in isolated regional networks has been
decided exogenously from WASP optimisation according to the increase in electricity demand in those regions;
43

- the WASP optimisation doesn’t confirm the provisions of the ICF plan related to the addition of 2 diesel units of 12 MW at Carrefour power station in 2007, one new power station of 120 MW (6 x 20 MW) in 2012 and some units out of Port-au-Prince (combined cycle, if possible);
− the diesel engines of 12 MW are not chosen in competition with the electricity purchase in period 2007-2009 and with installation of combustion turbines (combined cycle), 30 MW, in period 2010-2017 because of their high overnight pure capital investment cost (950 US$/kW) and of their low efficiency (30-33%);
− the wind farms of 10 x 1 MW are not selected in competition with the electricity purchase in period 2007-2009 and with installation of combustion turbines (combined cycle), 30 MW, in period 2010-2017 because of their high overnight pure capital investment cost (1500 US$/kW) and low capacity factor of 30% (reflected in WASP calculations through the forced outage rate parameter);
− the combustion turbines (simple cycle), in all size options, are not selected in competition with the electricity purchase in year 2009 and with installation of combustion turbines (combined cycle), 30 MW, in period 2010-2017 because of their lower efficiency (30-35%);
− the combustion turbines (combined cycle) of 30 MW are preferred to all other expansion options, starting with their first year of availability for operation (2008), because of their higher efficiency (40-55%); this technology can have a even higher efficiency but conservative figures have been selected purposely in this study;
− the size of 30 MW for the combined cycle units is preferred to the other two sizes (60 MW and 120 MW) for the same technology, in spite of its higher specific investment cost, because of its better fit with the low annual increase of the electricity demand;
− the lignite-fired steam power plant, 30 MW, is not selected in competition with combustion turbines (combined cycle), 30 MW, because of its higher overnight pure capital investment cost (2300 US$/kW) and of its lower efficiency (23-30%);
− the hydro power plant Artibonite 4C is selected for installation in 2014, one year after its availability for operation in year 2012.
The capital cash flow for electricity generation system expansion and operation for the above least cost expansion programme is as follows:
Capital cash flow for electricity generation system expansion and operation, by year and by period
(million US$)
Year Electricity purchase Fuel cost
New capacity construction
(including IDC1) O&M cost Total
2007 16.6 61.5 9.5 9.1 96.72008 21.2 65.2 66.5 9.6 162.5
Subtotal 37.8 126.7 75.9 18.7 259.1 2009 26.6 68.8 78.4 10.1 183.92010 - 91 22.4 12.1 125.52011 - 97.3 42.5 12.6 152.42012 - 100.8 51.5 13 165.3
Subtotal 26.6 357.9 194.8 47.8 627.1 2013 - 110.6 46.5 13.7 170.82015 - 121.1 49.8 14.6 185.52016 - 127 49.7 15.7 192.42017 - 138.8 36.1 16.1 191.02018 - 141.4 45.9 16.7 204.0
Subtotal 0 638.9 228.0 76.8 943.7 Grand total 64.4 1123.5 498.7 143.3 1829.9 Note: 1. IDC - Interest during construction
44
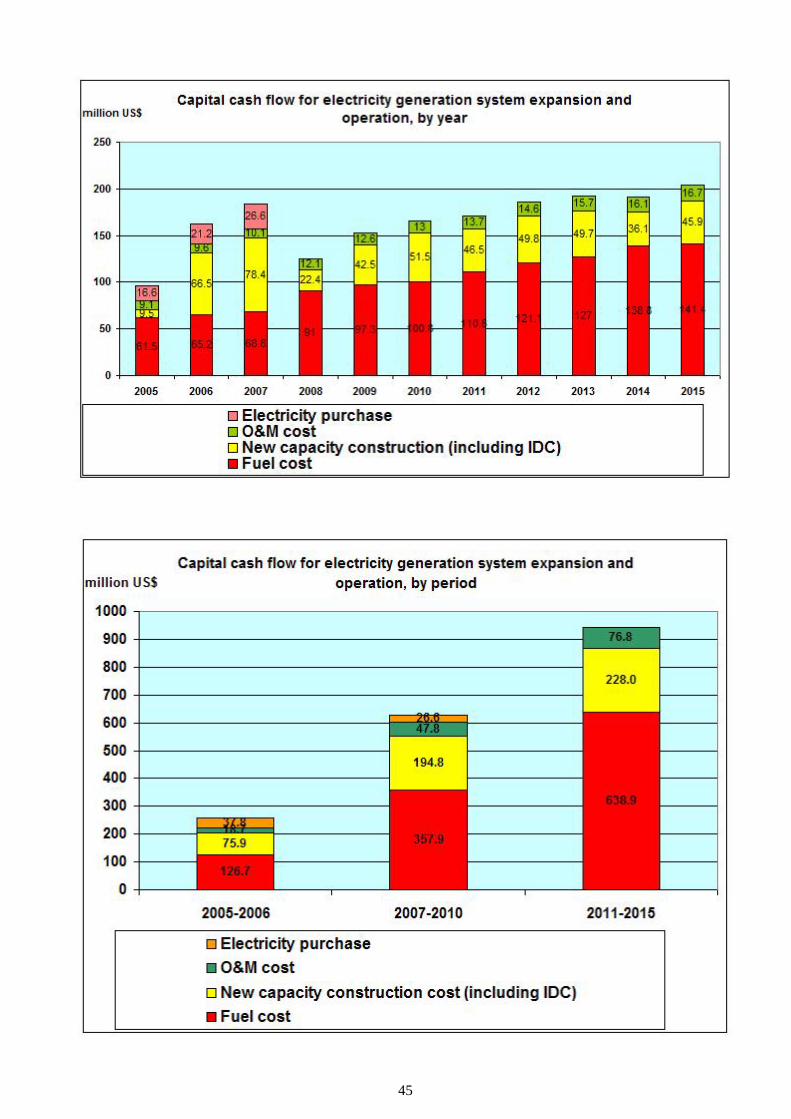
45

It should be mentioned that the cost of new capacity construction are not specified for the commissioning year of the unit but for its construction years, according to the “S curve” of capital expenditure. The average cost of the sent out electricity from the power plants, calculated as the ratio of the “discounted total expansion and operation cost” and “discounted electricity demand” is of 87.9 US$/MWh (8.79 US¢/kWh) if calculated for the period 2007-2017, and 84.7 US$/MWh (8.47 US¢/kWh) if calculated for the period 2005-2020. The average cost is lower when calculated for the period 2007-2022 because between 2018-2022 many existing generating units with low efficiency are retired and replaced with combined cycle units with higher efficiency. The total costs for electricity generation system expansion and operation will represent between 3.1% (in 2007) and 5.6% (in 2009) of the total GDP of Haiti, out of which the expansion costs will be between 0.3% (in 2007) and 2.4% (in 2009) of total GDP. As it can be noticed, the year 2009 will be the year with the highest financial effort both for the operation of the electricity generation system and for its expansion (in this year several combined cycle units, 30 MW, and two diesel units, 2.5 MW, will be in different construction stages. The above least cost expansion programme is valid for the following intervals of variation of the main economic parameters: • discount rate: 14-19%; • cost of unserved energy: 0.6-1.2 US$/kWh; • cost of additional electricity purchases from private companies: inferior or equal to 126 US$/MWh. For the discount rate of 13%, the hydro power plant Artibonite 4C is advanced by one year, in 2014 instead of 2015. For the discount rate of 12%, the hydro power plant Artibonite 4C is also advanced in 2014 but, in addition, one wind farm is included as part of the least cost expansion programme in year 2008 and some combined cycle units, 30 MW, are postponed with one year, the total number in years 2017 and 2022 remaining the same. For the discount rate of 20%, the hydro power plant Artibonite 4C is not selected anymore as part of the least cost expansion programme and, on the other hand, some combined cycle units, 30 MW, are advanced by one year, 12 units being asked until 2017, instead of 11 units in the reference expansion programme. For the cost of unserved energy of 0.5 US$/kWh, only 10 combined cycle units, 30 MW, are asked until 2017, instead of 11 units in the reference least cost expansion programme and three wind farms are selected in years 2008, 2012 and 2014. For the cost of unserved energy of 1.3 US$/kWh, some combined cycle units, 30 MW, are advanced by one year but the total number of asked units until 2017 remain the same (11 units). For the cost of additional electricity purchases from private companies equal or superior to 127 US$/MWh the installation of a wind farm in year 2008 become more attractive than the electricity purchase. The annual amounts of additional electricity purchases by EDH from local private companies or from Dominican Republic (if possible) are quite large: 166 GWh in 2007 (14.4% of the estimated annual electricity demand), 212 GWh in 2008 (17.0%) and 266 GWh in 2007 (19.8%). If they are not available at a cost inferior or equal to 126 US$/MWh or they are not entirely available, than the only possible alternative options are: • unserved electricity in years 2007-2009, before the commissioning of the five combined cycle units, 30
MW, in 2010, with the inherent damages caused to consumers (see the rationale for the cost of unserved energy);
• installation of five diesel units, 12 MW, and of four wind farms, 10 x 1 MW, in year 2008 (alternative expansion programme).
46

This alternative expansion programme will result in additional total costs of 35.1 million US$, as shown in the next table.
Difference in costs between the reference expansion programme (with additional electricity purchase) and alternative expansion programme (without additional electricity purchase)
(million US$)
Expansion programme
Electricity purchase Fuel cost
New capacity construction cost (including IDC)
O&M cost Total
Reference 64.4 1123.5 498.7 143.3 1829.9 Alternative 0.0 1135.0 547.5 182.5 1865.0 Alternative -Reference -64.4 11.5 48.8 39.2 35.1
The construction costs of the new capacities are higher in the case of Haitian electricity generation system because of its small size, asking for small unit sizes with higher specific investment cost than the larger similar units. From this point of view, a deeper integration of the electric systems of Haiti and Dominican Republic would be beneficial to both countries, but especially to the lower system, for several reasons: - Scale effect: larger interconnected system would allow for higher unit sizes with smaller specific
investments; - Peak load of interconnected system lower than the sum of the respective peak loads at isolated operation
and, therefore, lower necessary peak capacities; - Mutual assistance in case of unit outages and, consequently, lower necessary reserve capacities; - Coordination of unit scheduled maintenance.
Appendix 12 Improvement of electricity tariff system MTPTC and the future regulatory entity should consider the improvement of the current electricity tariff system. As a general rule, energy prices in a country should reflect the economic cost of products. If subsidies are to be provided, they must be only on direct bases (for example, for a limited monthly electricity consumption by poor consumers – “life line tariff”). If not targeted correctly, i.e. only for really poor, the subsidised tariff of electricity will benefit primarily to welfare consumers which will be invited to waste energy, and thus to tie up the scarce governmental resources. Energy prices have to provide correct signals to producers and consumers, to encourage energy efficiency and energy conservation. Correct pricing of commercial energy and efficient billing, accounting and collection systems are important elements in a sustainable energy system, as low energy prices or “free” (stolen) energy result in inefficient energy use and economically unsustainable energy supply companies. The electricity rate setting should reflect the following principles: Rates should reflect full costs of generation, transmission, distribution and selling. The shift from the current rates to tentative ones can be done gradually but the ultimate objective must be followed unconditionally; Tariffs should be structured according to long run marginal cost (LRMC) principles: different tariff components for maximum power required (kW) and for energy consumption (kWh), different tariff by voltage level (higher tariff for lower voltage level) and for peak and off peak consumption (higher tariff for peak);
47

Tariffs should be differentiated by categories of consumers according to their energetic behaviour but not to the nature of their activity; allow consumers to choose the favourable type of tariff between the available ones; A form of indexing should be carried out according to the fuel cost and inflation fluctuation.
48