hail spike impacts on doppler radial velocity data during...
TRANSCRIPT

Hail Spike Impacts on Doppler Radial Velocity Data During Recent Convective Events in the Continental United States
CHRIS SMALLCOMB
National Weather Service, Weather Forecast Office Reno, Nevada
Corresponding Author Address:
2350 Raggio Parkway Reno, NV 89512
775.673.8100 x224 [email protected]
(Submitted 7 April 2008; In final form 10 September 2008)
ABSTRACT
The tropospheric mid-level three body scatter spike (TBSS) Doppler radar signature is widely
used by National Weather Service forecasters as an indication of severe hail. Research describes
the radial velocity signature associated with the TBSS as generally weak inbound. However,
during recent severe convective events in the continental United States, several examples of the
TBSS exhibiting high inbound radial velocity signatures have been noted. The cases presented
demonstrate the TBSS can contaminate velocity data, thereby making storm interrogation and
the warning decision process more complicated. It is emphasized that forecasters need to be
cautious in analyzing the placement of these features within the overall storm structure before
making a warning decision, particularly when weighing whether to issue or upgrade to a tornado
warning.
1. Introduction
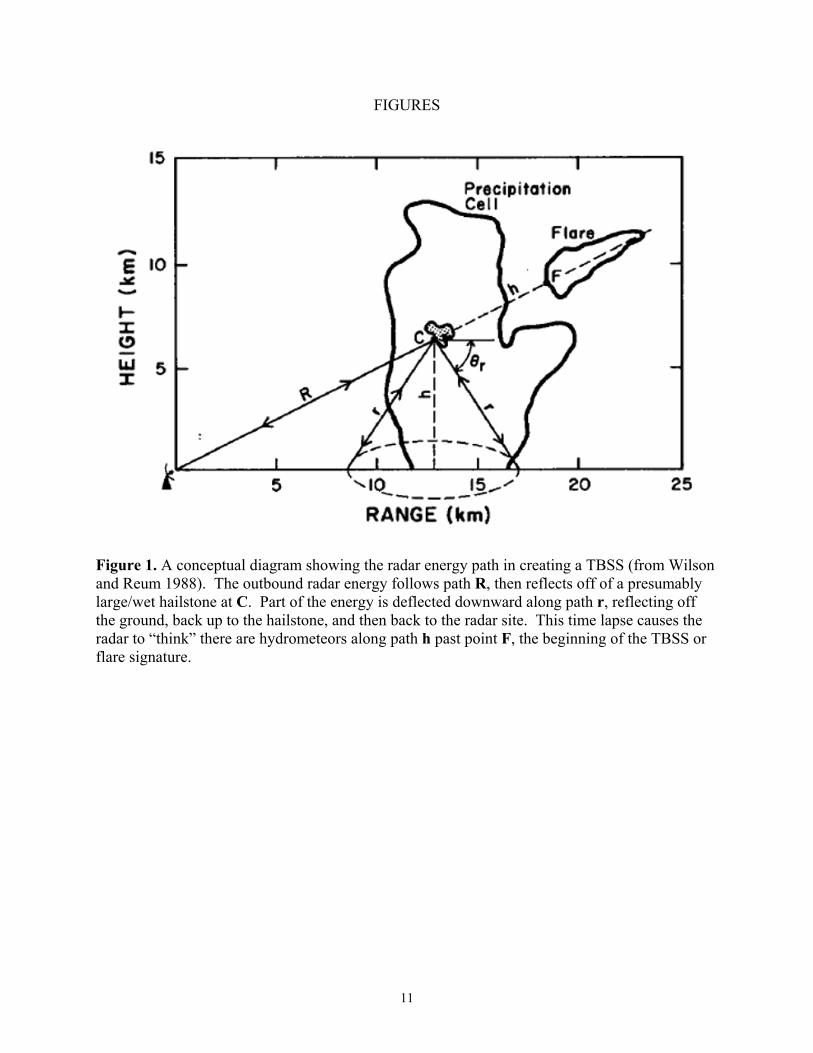
The mid-level three body scatter spike (TBSS) or flare echo Doppler radar signature is a 10-
30 km long region of artifact echo aligned radially downrange from a highly reflective (>63
dBZ) echo core (Fig. 1). Caused by non-Rayleigh radar microwave scattering or Mie scattering
(Zrnić 1987), the TBSS is widely used by National Weather Service (NWS) forecasters as a
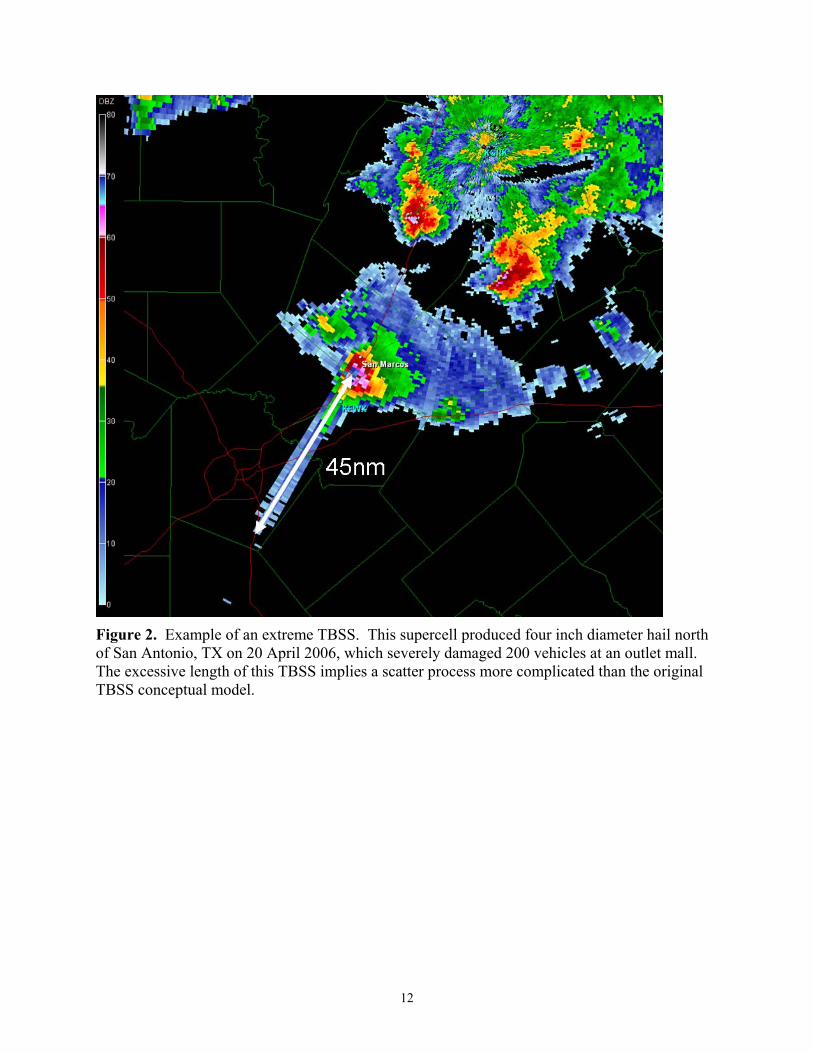
sufficient (not necessary) indication of very large hail within a severe thunderstorm (Fig. 2).
Established research (Zrnić 1987; Lemon 1998; Wilson and Reum 1988) describes the
2
common radial velocity signature associated with the TBSS as weak inbound coupled with high
spectrum width (SW) values. The high SW values are due in part to the combination of
horizontal and vertical air motions along the path of the radar return energy moderated by the
influence of ground targets, and an increased diversity of hydrometeor fall speeds. As such, the
radial velocity data associated with the TBSS are nearly always meaningless.
Wilson and Reum (1988) note that the, “flare echo may cause difficulties for unaware
researchers using multiple Doppler techniques to synthesize wind fields.” Their cases display
maximum flare echo inbound velocities ranging from 10 to 43 m s-1 (20 to 83.5 knots).
However, the actual velocity values are not operationally useful due to the uncertain ratio of
vertical to horizontal air motions. The maximum inbound velocities are mostly near the mirror
point (R+h in Fig. 1) of the TBSS, where beam distance away from the storm core is roughly
equal to beam elevation above ground (h in Fig. 1). If the hail core is particularly close to the
ground, the TBSS will appear closer to the storm core on radar imagery, per Fig. 1. This can be
problematic when mesocyclones or deep convergence zones are immediately downrange of the
hail core and associated TBSS (Lemon 1998).
The fact is the TBSS can contaminate velocity data, regardless of whether the anomalous
velocity values are high or low, thereby making storm interrogation and the warning decision
process more complicated by potentially masking real signatures or by generating false
circulations. In this paper four cases (Fig. 3) are presented in Section 2 in which anomalously
high inbound velocities are associated with the TBSS. Compared to the typical low inbound
velocity values in TBSS, the high velocity anomalies are specifically problematic for warning
decision making due to generating apparent strong circulation or convergence signatures.
Section 3 discusses the significance of these signatures and methods to mitigate operational
effects.
2. Cases
The first two cases are analyzed by Smallcomb (2006) and taken from the NWS Louisville’s
area of responsibility. The remaining cases were found via personal conversation or by simply
looking for occurrences of hail larger than 3.8 cm (1.5 inch) diameter in the National Climatic
Data Center’s Storm Data.

3
a. Clark County, Indiana: 7 April 2006
Immediately south of a west-east oriented warm front, a number of left-moving supercell
thunderstorms formed in the Lower Ohio River Valley region on the afternoon of 7 April 2006.
One storm reached peak intensity from 1930-1950 UTC (all times UTC) as it moved across
Floyd and Clark Counties in extreme southern Indiana. This storm produced estimated 6.3 cm
(2.5 inch) diameter hail in Georgetown, Indiana (Floyd County) at 1931 and near Henryville,
Indiana (central Clark County) at 1942. The latter resulted in numerous reports of car and home
windows smashed, due in part to the storm crossing U.S. Interstate 65.
This storm exhibits classic TBSS signatures aloft, most notably the 1938 volume scan from
the Louisville/Ft. Knox 88-D (KLVX) (Fig. 4). A pronounced hail spike signature is detected in
the base reflectivity data emanating northward from the storm core with high SW values
associated with this hail spike, ≥ 15 m s-1 (30 kt), especially close to the storm. During this same
period, base velocity data exhibit high inbound values associated with the TBSS. The peak
inbound Ground Relative (GR) velocity is -22 m s-1 (-43 kt), with the maximum inbound storm
relative (SRM) motion of -35 m s-1 (-68 kt) at the mirror point.
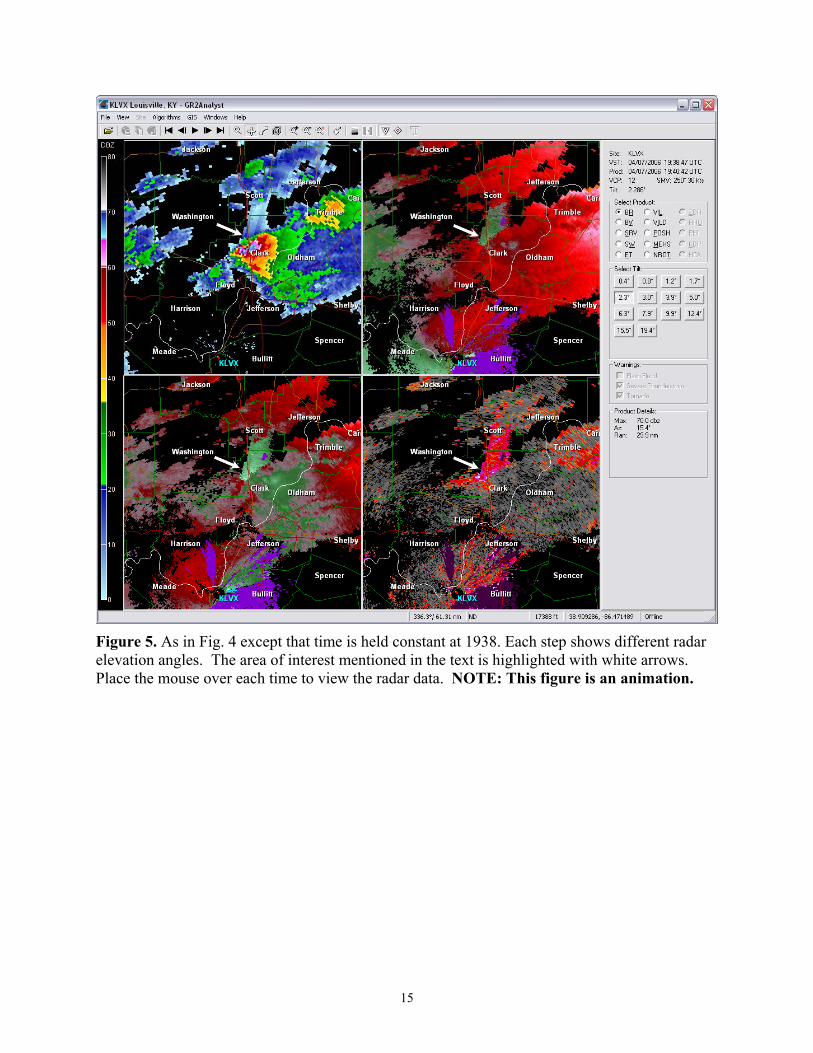
Clearly, the presence of the TBSS impacts the radial velocity data. A pronounced convergent
cyclonic circulation is evident in the velocity data on the poleward side of the Clark County
storm through a fairly deep layer (Fig. 5) including the 0.5 through 3.0° elevation slices. This
cyclonic circulation triggered the WSR-88D mesocyclone (MD) and tornado vortex signature
(TVS) alerts for the 1938 volume scan. The TVS location, while close to the apparent
circulation, is displaced from the strongest inbound velocities at these altitudes. This case also
demonstrates a descending TBSS signature, which is rarely observed possibly due to the
sampling interval in WSR-88D scans, but has been referenced by previous researchers (Lemon
1998; Heinselman et. al. 2006).
Based on discussions with the forecasters involved, this information was used to upgrade an
ongoing severe thunderstorm warning to a tornado warning for Clark County (which had been in
effect since 1932). A report of a tornado touchdown in proximity to the storm at 1951 confirmed
forecaster’s suspicions that a real circulation had developed. However, it was later learned that
this tornado sighting was due to the heavy rain/hail core of the storm, as no tornado damage
4
occurred. Recurrent obstacles to efficient warning operations are false funnel cloud or tornado
reports, especially when they are received from untrained people, especially at night. A further
discussion of the ramifications of contaminated velocity data will be discussed in Section 3.
b. Hart County, Kentucky: 2 April 2006
Along a northward moving warm front, supercell thunderstorms producing large hail
impacted a large part of central Kentucky during the afternoon hours of 2 April 2006. These
storms included a small but intense cell which moved across central Hart County, producing 2.5
cm (1 inch) diameter hail 7 miles east of Munfordville at 2110. This storm’s TBSS reflectivity
signature is largely obscured with significant radar returns both up- and down-radial; however an
examination of KLVX reflectivity imagery prior to the large hail report reveals the presence of a
subtle TBSS signature, as does the SW data at 2059 (Fig. 6). SW values of at least 10 m s-1 (20
kt), with a few pixels of 15 m s-1 (30 kt), are seen in this case within the TBSS. Noting relatively
high SW values is encouraged in Lemon (1998) to detect TBSS, especially in situations with
obscuring reflectivity returns down-radial from the parent TBSS-producing cell. The base
velocity and storm relative motion data at 2059 depict high inbound velocities within the TBSS.
The maximum inbound GR velocity is -33 m s-1 (-64 kt) and the peak inbound SRM velocity is -
28 m s-1 (-55 kt) on the 2.3° elevation angle.
No WSR-88D algorithm alerts occurred with this apparent cyclonic circulation in the SRM
data, likely due to the broader nature of the circulation. However, an ongoing severe
thunderstorm warning, originally issued at 2055, was upgraded to a tornado warning at 2105.
This decision was based on the appearance of a developing mesocyclone aloft, albeit broad, and
due to spotter reports of funnel clouds associated with the storm that likely never occurred.
c. York County, South Carolina: 20 May 2006
During the afternoon of 20 May, numerous supercell thunderstorms developed along a
frontal boundary stretching from middle Tennessee to the North Carolina-South Carolina border.
One storm in particular intensified to severe levels over York County, South Carolina. This cell

5
produced a maximum reported hail-size of 6.3 cm (2.5 inches) at Rock Hill, South Carolina
(eastern York County) around 2025.
At this same time, the Columbia, South Carolina 88-D (KCAE) displayed a modest TBSS
signature in the reflectivity data from the 0.5 to 3.1° elevation scans (Fig. 7). Significant
inbound GR velocity signatures are noted throughout the lifespan on this TBSS, with peak values
of -30 m s-1 (-58 kt) at 2025 on the 1.2° elevation slice. SW values are relatively high within the
TBSS; with values in excess of 9.3 m s-1 (18 kt) near the aforementioned peak inbound velocity.
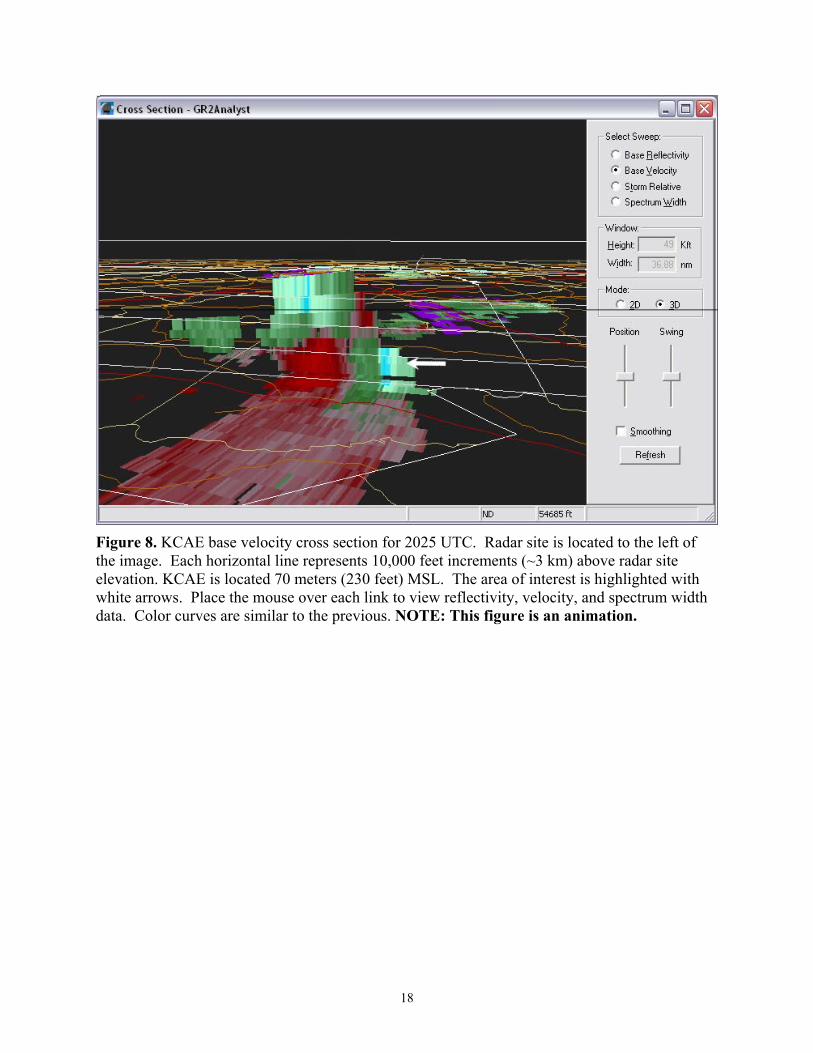
A vertical cross section shows the three-dimensional nature to the velocity contamination, based
on high values of SW collocated with the high inbound GR velocities within a TBSS reflectivity
signature (Fig. 8).
d. Kootenai County, Idaho: 13 June 2006
A synoptic scale 500 hPa trough approaching the region of concern aided the initiation of
scattered convection during the morning hours of 13 June, despite relatively weak surface-based
instability. The severe thunderstorm in question developed rapidly over far western Kootenai
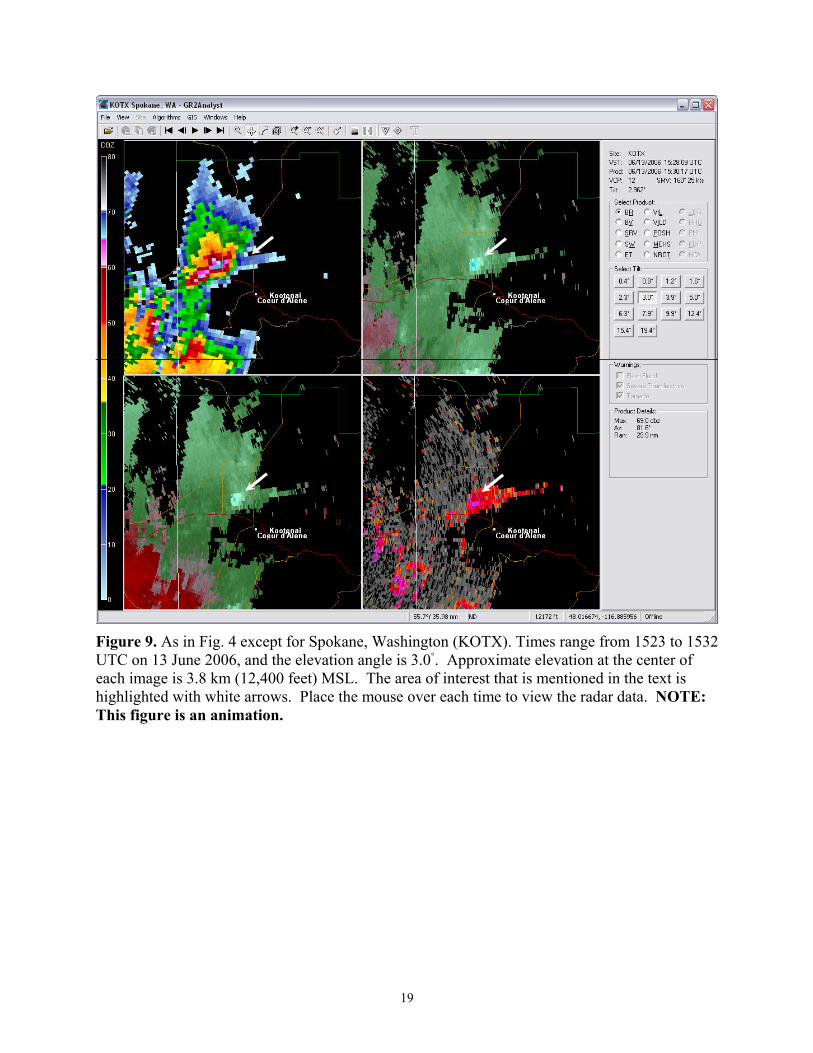
County, Idaho after 1520, developing a classic TBSS signature aloft soon thereafter (Fig. 9).
This small thunderstorm produced golf ball-sized (4.4 cm or 1.75 inch diameter) hail in Post
Falls, ID at 1528, with a 31 m s-1 (61 kt) wind gust at Hauser, ID at 1530.
This cell quickly developed a pronounced TBSS in the reflectivity data from the Spokane,
Washington WSR-88D (KOTX), which persisted even after the occurrence of large hail at Post
Falls. The highest inbound SRM velocities of 30 m s-1 (-58 kt) are near the mirror point on the
3.0° elevation scan at 1528. Similar to the other cases, SW values are 7.7-10 m s-1 (15-20 kt). A
vertical cross section (Fig. 10) shows a similar contamination signature in the reflectivity,
velocity, and spectrum width fields as in the York County case; however the maximum inbound
velocities are closer to the storm core enhancing the potential for masking important signatures.
3. Discussion & Recommendations
These cases present situations where the TBSS significantly contaminates radial velocity data
within severe thunderstorms. In the first two cases (Sections 2a and 2b), the TBSS complicated

6
the process of real-time operational storm interrogation. The following are recommendations for
operational meteorologists to assist with the identification of potential contaminated velocity
data associated with TBSS signatures.
a. Placement of Apparent Feature
An analysis of anomalously high inbound velocity signatures relative to other significant
storm structural features along with consideration of documented conceptual models can yield
clues signifying these velocity anomalies are artificial. In addition, the strong inbound velocities
exhibit a shape similar to that of the quasi-triangular TBSS reflectivity signature, which is
suggestive of a relationship. Looping the radar data to visualize the progression of an apparent
velocity feature in relation to reflectivity and SW fields is found to assist greatly. Forecasters
should always ask of any data set, “Does this match established conceptual models?” especially
those that are remotely sensed.
It is important to reiterate that the velocity anomalies generated by the TBSS signature may
be either weak inbound as has been shown in previous literature or strong inbound as shown in
this paper. Either one could potentially mask real signatures and create problems for radar
interrogation.
In the Clark County, Indiana event (Section 2a, Figs. 4 and 5) the strong inbound velocities
are located just outside the far northern periphery of the storm. Even though it gives the
appearance of an elongated but strong cyclonic circulation, it would have to be treated as suspect
due to its positioning relative to the storm. The TVS alert was likely due to this contaminated
data not only at the 3.0° elevation but in lower elevation slices as well. The TBSS signature is
often located in the mid-levels of a thunderstorm; however it can also occur at lower altitudes
thereby increasing potential impacts to velocity data analysis of low level mesocyclones. The
highest inbound radial velocities associated with the Hart County TBSS (Section 2b, Fig. 6) are
well outside (south) of the storm core if one compares the reflectivity and velocity images.
Therefore, any apparent circulation generated in the velocity data would need to be treated as
suspect. The York County, South Carolina event (Section 2c, Figs. 7 and 8), when viewed from
the KCAE radar where TBSS contamination of the velocity data is apparent, the placement of the
highest inbound velocities are outside (to the north) of the thunderstorm cell.
7
The case from Kootenai County (Section 2d, Fig. 9) over northwest Idaho not only produced
large hail, but severe straight-line winds. Often times, a mid-altitude radial convergence
signature (MARC) will precede a downburst (Schmocker et. al. 1996). The MARC signature is
similar to the observed TBSS contaminated velocities, in that they both show moderate to high
inbound velocities down-radial of outbound values, indicating convergence. To clearly
distinguish between the two, it is imperative that forecasters observing a strong inbound
signature aloft in the vicinity of a thunderstorm also recognize the placement of the feature
relative to the thunderstorm updraft. In this case, the strongest inbound winds are located on the
rearward edge of the northwestward moving thunderstorm core (Figs. 9 and 10), which contrasts
with the typical MARC location within the forward flank of intense convection. This
information, coupled with moderate to high SW values along with a “TBSS shape” to the
velocity and SW anomalies, suggests this was TBSS contamination rather than a MARC
signature.
b. Use of Spectrum Width Data
Though not widely used, high spatial resolution SW data can be a valuable tool when
identifying TBSS. This is especially true when TBSSs are masked by down-radial precipitation
such as the Hart County, Kentucky example given in Section 2b. Based solely on this limited
research, it appears that SW values > ~7.7-10 m s-1 (15 to 20 kt), coupled with a supporting
signature in reflectivity fields, indicates that a TBSS may be present.
In the Clark County event (Section 2a, Fig. 4), the TBSS is very apparent and had been so for
a number of volume scans prior to 1938. The SW values are moderately high within the TBSS
signature (>8.7 m s-1 or 17 kt) in most bins. The Hart County event (Section 2b, Fig. 6) is more
subtle in nature, as the more commonly used TBSS reflectivity signature is obscured by down-
radial convection over far southern Hart County and Barren County. The SW product clearly
indicates the presence of a potential TBSS associated with the Hart County storm, with values
exceeding 8.7 m s-1 (17 kt), coupled with a “TBSS shape” to the anomalous SW values. In the
York and Kootenai County events, SW values are relatively high within the TBSS; with values
on the order of (7.7-10 m s-1 or 15-20 kt) near the peak inbound velocity.
Figure 4 gives a suggested procedure for monitoring SW, by bundling base reflectivity,
8
velocity, SRM, and SW into a single four-panel product. Using an all-tilts or cross-section
functionality can then be used to vertically navigate though the radar elevation angles. While
viewing WSR-88D algorithm output can be supportive during the warning decision making
process, it has been shown in this article and previous literature (Andra et. al. 2002) that
examination of the base data is the most effective radar interrogation strategy.
c. Utilizing Neighboring Radars
If TBSS velocity contamination is suspected, making use of data from surrounding WSR-
88D radar sites is recommended. Given differing perspectives and radar sampling relative to any
cell, neighboring radar sites in close proximity may provide more supportive velocity data.
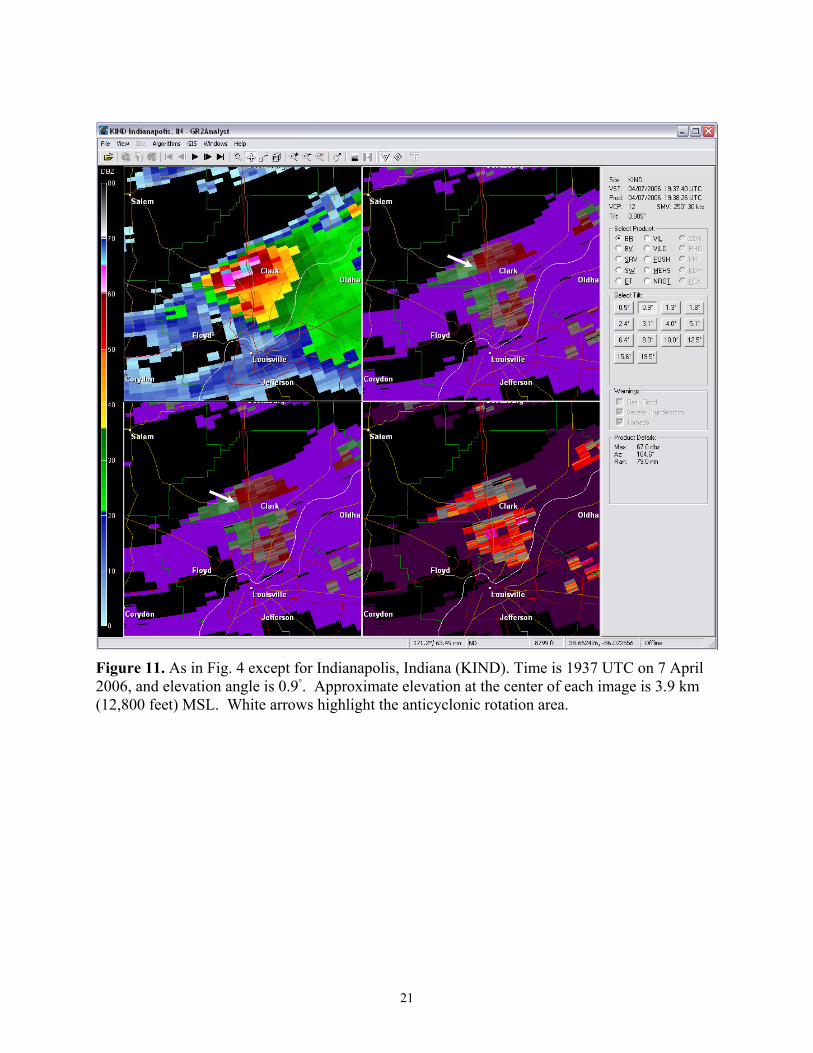
In the Clark County event (Section 2a, Figs. 4 and 5), examination of the cell from a different
radar (i.e., Indianapolis WSR-88D radar (KIND)) reveals a more useful velocity image with
lower SW values (Fig. 11). An apparent meso-anticyclone is detected in the mid-levels of the
thunderstorm, an attribute of storms moving to the left of the mean flow (Nielsen-Gammon and
Read 1995). This typically is associated with supercells producing primarily very large hail
rather than tornadoes.
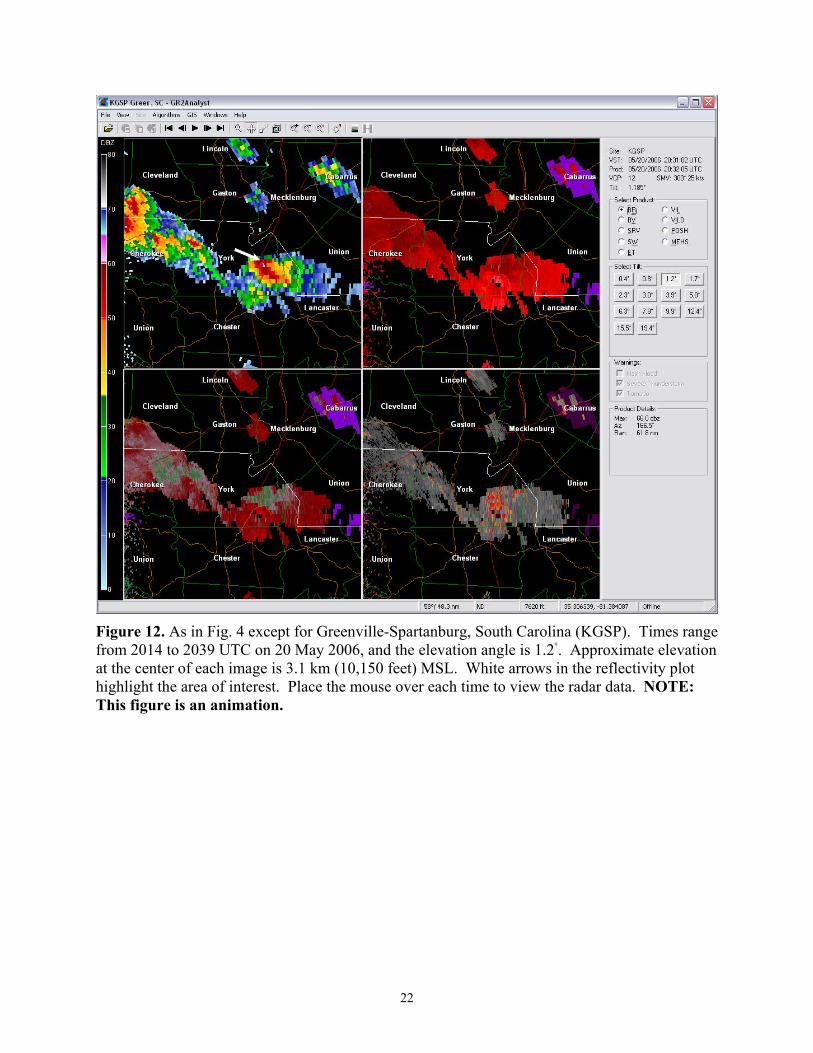
Viewing the York County, South Carolina event (Section 2c, Figs. 7 and 8) the inbound
velocity contamination is pronounced and covers a significant vertical tropospheric depth. When
the storm is viewed from the Greenville-Spartanburg WSR-88D (KGSP), located at
approximately the same distance as the KCAE radar, little or no velocity contamination is
detected (Fig. 12). Modest inbound velocities are revealed by the KGSP radar. However, these
are likely due to a broad mesocyclone within this marginal right-moving supercell thunderstorm.
No discernable TBSSs are observed in the KGSP reflectivity data, nor are there any significant
coherent high SW values down-radial of the thunderstorm core where one would expect to see a
TBSS.
4. Future Work and Final Notes
Additional cases of significant contamination of velocity data by TBSSs not mentioned
causes speculation that this phenomenon is apparently more common than previously thought.

9
Herein lies the primary motivation for continuing this research (i.e., to raise the forecaster’s
awareness to the potential of TBSS velocity data contamination.) Future work includes the
identification of additional cases where TBSSs significantly contaminate velocity data. One key
remaining question is why do some TBSSs exhibit this behavior, while the majority produces
more typical weak inbound radial velocity signatures? Whether this is due to environmental
factors, radar sampling, storm motion, or another cause is uncertain at this time.
Acknowledgements
The author would like to thank John Gordon (Meteorologist-in-Charge, NWS Louisville) and
NWS Louisville Forecasters for providing the inspiration and motivation to examine this topic.
He would also like to thank Jane Hollingsworth (Meteorologist-in-Charge, NWS Reno), for
providing the time and resources to continue this research. Jeffrey Medlin (SOO, NWS Mobile),
James LaDue at the NWS Warning Decision Training Branch, and David Andra (SOO, NWS
Norman), provided constructive formal reviews of this paper. Karen Smallcomb, the author’s
wife, and Mark Jarvis, forecaster at NWS Louisville, also provided beneficial preliminary
reviews. The author would like to thank James W. Wilson at NCAR for giving permission to
reprint Figure 2 from Wilson and Reum 1988, which is used in this paper (Fig. 1).

10
REFERENCES Andra, D.L., E.M. Quoetone, and W.F. Bunting, 2002: Warning Decision Making: The Relative Roles of Conceptual Models, Technology, Strategy, and Forecaster Expertise on 3 May 1999. Wea. Forecasting, 17, 559–566.
Heinselman, P., D. Priegnitz, K. Manross, and R. Adams, 2006: Comparison of Storm Evolution Characteristics: The NWRT and the WSR-88D. Preprints, 23rd Conference on Severe Local Storms, American Meteorological Society, St. Louis, MO, CDROM, 14.1.
Lemon, L. R., 1998: The Radar “Three-Body Scatter Spike”: An Operational Large-Hail Signature. Weather and Forecasting, 13, 327-340
Nielsen-Gammon, J. W., and W. L. Read, 1995: Detection and Interpretation of Left-Moving Severe Thunderstorms Using the WSR-88D: A Case Study. Weather and Forecasting, 10, 127-140
Schmocker, G. K., R. W. Przybylinski, and Y. J. Lin, 1996: Forecasting the initial onset of damaging downburst winds associated with a Mesoscale Convective System (MCS) using the Mid-Altitude Radial Convergence (MARC) signature. Preprints, 15th Conf. On Weather Analysis and Forecasting, American Meteorological Society, Norfolk VA, 306-311.
Smallcomb, C., 2006: Hail Spike Impacts on Doppler Radial Velocity Data during Several Recent Lower Ohio Valley Convective Events. Preprints, 23rd Conference on Severe Local Storms, American Meteorological Society, St. Louis, MO, CDROM, P9.2.
Wilson, J. W., and D. Reum, 1988: The Flare Echo: Reflectivity and Velocity Signature. J. Atmos. and Oceanic Technol., 5, 197-205
Zrnić, D. S., 1987: Three-body scattering produces precipitation signatures of special diagnostic value. Radio Sci., 22, 76-86
11
FIGURES
Figure 1. A conceptual diagram showing the radar energy path in creating a TBSS (from Wilson and Reum 1988). The outbound radar energy follows path R, then reflects off of a presumably large/wet hailstone at C. Part of the energy is deflected downward along path r, reflecting off the ground, back up to the hailstone, and then back to the radar site. This time lapse causes the radar to “think” there are hydrometeors along path h past point F, the beginning of the TBSS or flare signature.
12
Figure 2. Example of an extreme TBSS. This supercell produced four inch diameter hail north of San Antonio, TX on 20 April 2006, which severely damaged 200 vehicles at an outlet mall. The excessive length of this TBSS implies a scatter process more complicated than the original TBSS conceptual model.
13
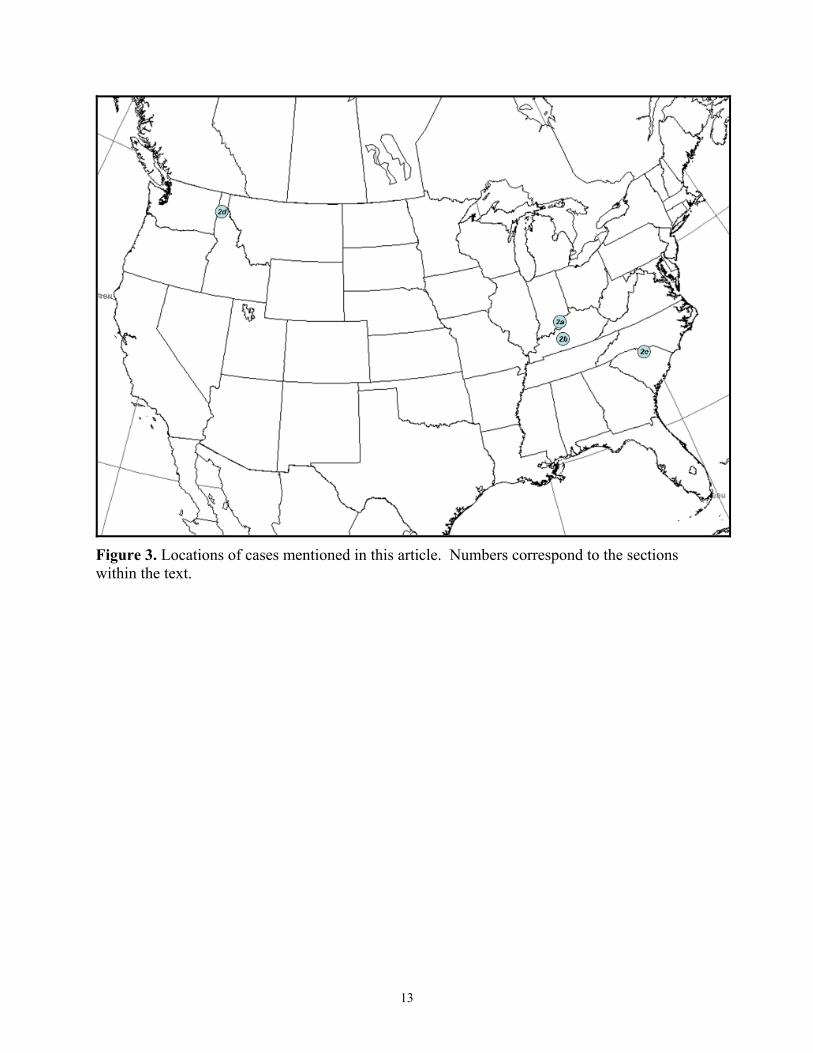
Figure 3. Locations of cases mentioned in this article. Numbers correspond to the sections within the text.

14
Figure 4. Four panel radar loop from the KLVX WSR-88D radar from 1930 to 1947 UTC on 7 April 2006. All data are from the 3.0◦ elevation angle. Upper left: base reflectivity, upper right: base velocity, lower left: storm relative velocity, and lower right: spectrum width. The area of interest mentioned in the text is highlighted with white arrows. County names are highlighted with white text, county outlines in dark green, and highways in red and brown. Beam height at center of each image is approximately 3.1 km (10,200 feet) above mean sea level (MSL). Place the mouse over each time to view the radar data. GRLevel 2 Analyst was used to create all radar graphics in this paper. NOTE: This figure is an animation.
15
Figure 5. As in Fig. 4 except that time is held constant at 1938. Each step shows different radar elevation angles. The area of interest mentioned in the text is highlighted with white arrows. Place the mouse over each time to view the radar data. NOTE: This figure is an animation.

16
Figure 6. As in Fig. 4 except for 2046-2112 UTC, on 2 April 2006. Elevation angle is 2.3◦ with an approximate elevation at the center of each image of 3.6 km (11,700 feet) MSL. White arrows highlight the area of interest over Hart County. A second TBSS velocity contamination area only briefly discussed in the text is located over Barren County. Place the mouse over each time to view the radar data. NOTE: This figure is an animation.

17
Figure 7. As in Fig. 4 except for Columbia, South Carolina (KCAE). Times range from 2013 to 2038 UTC on 20 May 2006, and elevation angle is 1.2◦. Approximate elevation at the center of each image is 3.4 km (11,200 feet) MSL. The area of interest is highlighted with white arrows. Place the mouse over each time to view the radar data. NOTE: This figure is an animation.
18
Figure 8. KCAE base velocity cross section for 2025 UTC. Radar site is located to the left of the image. Each horizontal line represents 10,000 feet increments (~3 km) above radar site elevation. KCAE is located 70 meters (230 feet) MSL. The area of interest is highlighted with white arrows. Place the mouse over each link to view reflectivity, velocity, and spectrum width data. Color curves are similar to the previous. NOTE: This figure is an animation.
19
Figure 9. As in Fig. 4 except for Spokane, Washington (KOTX). Times range from 1523 to 1532 UTC on 13 June 2006, and the elevation angle is 3.0◦. Approximate elevation at the center of each image is 3.8 km (12,400 feet) MSL. The area of interest that is mentioned in the text is highlighted with white arrows. Place the mouse over each time to view the radar data. NOTE: This figure is an animation.

20
Figure 10. KOTX base velocity cross section for 1528 UTC. Radar site is located to the left of the image. Each horizontal line represents 10,000 feet increments (~3 km) above radar site elevation. KOTX is located 727 meters (2,385 feet) MSL. The area of interest is highlighted with white arrows. Place the mouse over each link to view reflectivity, velocity, and spectrum width data. Color curves are the same as in other images. NOTE: This figure is an animation.
21
Figure 11. As in Fig. 4 except for Indianapolis, Indiana (KIND). Time is 1937 UTC on 7 April 2006, and elevation angle is 0.9◦. Approximate elevation at the center of each image is 3.9 km (12,800 feet) MSL. White arrows highlight the anticyclonic rotation area.
22
Figure 12. As in Fig. 4 except for Greenville-Spartanburg, South Carolina (KGSP). Times range from 2014 to 2039 UTC on 20 May 2006, and the elevation angle is 1.2◦. Approximate elevation at the center of each image is 3.1 km (10,150 feet) MSL. White arrows in the reflectivity plot highlight the area of interest. Place the mouse over each time to view the radar data. NOTE: This figure is an animation.