hadley, ryan e comments.pdfninestar connect. ninestar connect was born of a merger between hancock...
TRANSCRIPT
1
Hadley, Ryan E
From: Liane Steffes <[email protected]>
Sent: Friday, June 15, 2018 4:56 PM
To: Comments, Urc; Heline, Beth E.
Cc: Jeremy Fetty; [email protected]
Subject: IUSF-Broadband Study - Comments of INECA
Attachments: INECA - GAO 2018-3 - Comments of INECA with Attachments.PDF
**** This is an EXTERNAL email. Exercise caution. DO NOT open attachments or click links from unknown senders or unexpected email. ****
Good Afternoon:
Attached please find the comments of INECA responsive to the study topics set forth in the Commission’s GAO 2018-3
(IUSF-Broadband Study).
Kind regards,
Liane K. Steffes
251 N. Illinois Street, Suite 1800 | Indianapolis, Indiana 46204
Phone: 317-269-2500 | www.parrlaw.com
This email originated from the law firm Parr Richey Frandsen Patterson Kruse LLP. The information contained in this email may be privileged and confidential and is
intended solely for the use of the addressee(s) indicated above. Anyone receiving this email in error should notify the sender by telephone and destroy the original.
COMMENTS ON BEHALF OF
INDIANA EXCHANGE CARRIER ASSOCIATION, INC.
TO THE INDIANA UTILITY REGULATORY COMMISSION
REGARDING IUSF-BROADBAND STUDY
Comments of Indiana Exchange Carrier Association, Inc. Page 1 of 12
COMMENTS ON BEHALF OF INDIANA EXCHANGE CARRIER ASSOCIATION, INC.
TO THE INDIANA UTILITY REGULATORY COMMISSION REGARDING IUSF-BROADBAND STUDY
The Indiana Exchange Carrier Association, Inc. (“INECA”) and its member companies
are dedicated to the promotion of state-of-the-art telecommunications facilities and services
throughout rural Indiana. The purpose of INECA is to advocate for its member companies on
federal and state issues, to educate government leaders, as well as the public at large, on the
importance of modern telecommunications to rural communities and to ensure that voice,
broadband and video services comparable to those available in urban and suburban areas are
available in the rural areas of Indiana at affordable prices.
INECA consists of 33 local exchange companies1 that service thousands of telephone
access lines throughout rural Indiana. In addition to providing quality telephone service, the
companies and their affiliates also provide a broad array of telecommunications services. These
include broadband Internet services, long-distance services, and in many cases, video, wireless,
security, and information technology services. The INECA companies play a significant role in
the economy and the well-being of the communities they serve. These companies make millions
of dollars in infrastructure investments annually and employ hundreds of Hoosiers.
1 INECA’s membership includes: Bloomingdale Home Telephone Company, Inc.; Citizens Telephone Corporation; Clay County Rural Telephone Cooperative, Inc. d/b/a/ Endeavor Communications; Craigville Telephone Company Inc.; Daviess-Martin Rural Telephone Corporation d/b/a RTC Communications; Geetingsville Telephone Company Inc.; Hancock Rural Telephone Corporation d/b/a NineStar Connect; Ligonier Telephone Co., Inc.; Monon Telephone Company Inc.; Miles Communications, Inc. d/b/a Enhanced Telecommunications Corp.; Mulberry Cooperative Telephone Company, Incorporated d/b/a Mulberry Telephone Company; New Lisbon Telephone Company Inc.; New Paris Telephone Inc.; Northwestern Indiana Telephone Company Inc. d/b/a Nitco; Perry-Spencer Rural Telephone Cooperative Inc. d/b/a PSC; Pulaski White Communications, Inc. d/b/a Lightstream; Rochester Telephone Company Inc.; Southeastern Indiana Rural Telephone Cooperative Inc. d/b/a SEI Communications; Smithville Telephone Company, Incorporated d/b/a Smithville Communications; Swayzee Telephone Company, Inc. d/b/a Swayzee Communications Corp.; Sweetser Rural Telephone Company Inc.; TDS Telecom Companies (Camden Telephone Company Inc., Communications Corporation of Indiana, Communications Corporation of Southern Indiana, Home Telephone Company Inc., Home Telephone Company of Pittsboro Inc., Merchants and Farmers Telephone Company d/b/a TDS Telecom-Hillsboro., S & W Telephone Company, Inc., Tipton Telephone Company Inc., Tri-County Telephone Company Inc., West Point Telephone Company, Incorporated); Washington County Rural Electric Telephone Cooperative Inc. d/b/a Tele-Media Solutions; and Yeoman Telephone Company Inc.

Comments of Indiana Exchange Carrier Association, Inc. Page 3 of 12
IUSF-Broadband Study
In GAO 2018-3, the Indiana Utility Regulatory Commission (the “Commission”) invited
service providers, customers, and interested stakeholders to provide written comments on the
study topics set forth below. INECA hereby provides its comments to those study topics.
Study Topic 1 -The types of service on which the Indiana Universal Service Funds (“IUSF”)
surcharge is imposed.
Response - The IUSF surcharge is imposed on intrastate retail communications services,
examples of which include, but are not limited to, the following:
• Local service • Service establishment charges • Custom calling services • Intrastate subscriber line charges • Intrastate long distance • Directory assistance • Non-published number fees • Paging
The IUSF surcharge is not imposed on interstate or non-telecommunications services,
such as:
• Interstate long distance • Interstate subscriber line charges • Wholesale services • Voicemail • Directory advertising • Video services • Internet access or broadband services
At this time, INECA supports maintaining the status quo regarding the types of service
upon which the IUSF surcharge is imposed.
Comments of Indiana Exchange Carrier Association, Inc. Page 4 of 12
Study Topic 2 - The types of service for which disbursements from the IUSF may be used.
Response: Currently there is no limitation on what type of services for which IUSF
disbursements can be used. INECA supports maintaining the status quo in this respect.
Study Topic 3 - The eligibility requirements for service providers to receive disbursements from
the IUSF.
Response: The Commission’s March 17, 2004 Order in Cause No. 42144 approved a
settlement agreement that created the IUSF (the “Settlement Agreement”). The eligibility
requirements for service providers to receive disbursements from the IUSF, as set forth in the
Settlement Agreement, are as follows:
Disbursement Eligibility:
a) Designation as an ETC (eligible telecommunications carrier);
b) Offer the services and functionalities identified by the FCC’s rules described
in 47 C.F.R. g 54.10 1(a) adopted by the IURC in its order in Cause No.
40785 dated October 28, 1998, which are:
i. Voice grade access to the public switch network;
ii. Local usage;
iii. Dual multi-frequency signaling or its equivalent;
iv. Single party service or its functional equivalent;
v. Access to emergency services;
vi. Access to operator services;
vii. Access to interexchange service;
viii. Access to directory assistance; and
ix. Toll control services for qualifying low-income consumers.
c) Benchmark Rates: RLECs (rural local exchange carriers) required to set rates
at a minimum rate level for residential and single-line business basic local
exchange service; and
d) Qualification test: the passing of a “Qualification Test” required for
disbursements from the IUSF absent special circumstances completed from
Comments of Indiana Exchange Carrier Association, Inc. Page 5 of 12
information provided within the RLECs’ annual reports to the Commission or,
with respect to those RLECs not within Commission jurisdiction, from their
year-end “Part 32” financial statements prepared in compliance with FCC
orders
INECA supports maintaining the status quo with respect to current eligibility
requirements to receive disbursements from the IUSF.
Study Topic 4 - Broadband deployment (expansion and improvement of access to broadband
services).
Response: INECA membership has been at the forefront of broadband deployment in
rural areas of Indiana, experiencing success in deploying broadband in and outside of their ILEC
territories.
However, the INECA members face significant challenges in broadband deployment,
primarily from a financial perspective. See below for information from certain INECA members
regarding broadband deployment projects and the costs thereof (please note, such projects are not
necessarily inclusive of all of a member’s broadband projects), and see also the Indiana
Broadband and Technology Association’s 2018 Indiana Report on Broadband Progress, attached
hereto as Attachment C, and Vantage Point Solutions’ report on Deploying a Broadband
Network – From Start to Finish (and Beyond), outlining procedures associated with deployment
and upkeep of broadband-capable networks, attached hereto as Attachment D.
NineStar Connect. NineStar Connect was born of a merger between Hancock Telecom
Indiana Rural Telephone Company and Central Indiana Power, an Indiana rural electric
membership corporation. NineStar Connect also provides sewer and water services. Currently, it
has approximately 15,000 customers in its electric division, 12,000 customers in its
communication division, and 600 customers in its water and sewer division. As of April 1, 2018,
5,500 of its electric members were also communications customers. By the end of 2018, 100% of
NineStar’s customers will have access to fiber to the home technology. To the far east of
NineStar territory, there are no competitors, and the area is very rural. To the far west, there are
several providers that NineStar competes with, and the area is very suburban.
Comments of Indiana Exchange Carrier Association, Inc. Page 6 of 12
NineStar believes that deploying fiber optics in the underserved areas of rural America
helps communities thrive and, as a result, offers residents better quality of life. One example of
this is in Blue River Township, where a recent college graduate was able to start a global
business in the animal nutrition field and, thus, stay on the family farm. Had it not been for
connectivity, he would have had to move away from the community for the same opportunity.
NineStar Connect began deploying residential Fiber-to-the-Home (FTTH) network to its
regulated telecom territory in 2002. Beginning in 2011, NineStar Connect began phase
deployment in its electric service territory, which will be completed by fall of 2018. NineStar
Connect currently owns, leases, and manages 1,506 miles of backbone and distribution fiber and
currently has 40 miles of work in progress. NineStar Connect offers gigabit Ethernet services, it
can offer speeds of up to 1 gig for residential and its active fiber can provide businesses speeds
of up to 10 gig.
The backbone of the NineStar Connect network was built using legacy Rural Utilities
Service (RUS) funds under the telecom program and its participation in the FCC Universal
Service Fund as a rural telecom provider. Additional extensions to expand the network have been
financed by gross customer telecommunication revenues that have accompanied the growth of
the network. In 2002, NineStar Connect reinvested millions of dollars into building its fiber
network, partly financed through RUS low interest loans, in addition to capital expenditures.
NineStar Connect’s partnerships have allowed it to expand its fiber footprint. Currently,
partners of Johnson County REMC have deployed fiber in their territory for businesses and
residential customers. In 2015, the corporate median expense for customers was $158.68, but
was only $124.36 for Ninestar Connect because of saved deficiencies. NineStar connect finds the
demand which is created for broadband in communities concerning because of the difficulties in
managing expectations with how quickly and cost effectively it can be deployed to all.
Rochester Telephone, RTC Communications. As it already has fiber to the home to all
customers in its exchange, Rochester Telephone Company has been investing in the expansion of
its fiber to the home internet services to underserved areas outside of its exchange. Two years
ago, it took fiber into Argos, Indiana and is currently providing high speed fiber internet service
to over 100 customers in Argos. Most recently, RTC has partnered with Marshall County REMC
creating Marshall County Fiber, LLC. The partnership has built out a neighborhood in Marshall

Comments of Indiana Exchange Carrier Association, Inc. Page 7 of 12
County in order to expand broadband into an area identified by Marshall County REMC as
underserved. The first neighborhood was viewed as a pilot and totaled 60 homes. This took 3.5
miles of fiber and $200,000 in costs, not including approximately$1,000 per customer for
electronics and drop costs to/for each home. 25% of the potential customers signed up for
internet service within the first month with 40% of those taking a speed package above the base
offering of 50Mb. The partnership is now in the process of building to three additional
neighborhoods - passing 170 homes and businesses. In the initial stages of the partnership, RTC
has seen strong interest from consumers in these rural areas. RTC hopes there can be financial
justification to continue the expansion of this partnership and fiber build to Marshall County
REMC’s customers in rural Marshall County.
Perry-Spencer Rural Telephone Cooperative, Inc. d/b/a PSC. PSC has been constructing
a cooperative-wide Fiber-to-the-Home (FTTH) network since late 2010. In order to finance this
project, PSC relies on federal and state revenue and support mechanisms…federal USF, cost
recovery, access, etc. But due to reductions to these revenue streams and support, PSC sought
and received funding from the Rural Utility Service (RUS) in the form of a $30M low interest
rate loan to pay for the bulk of the project.
To date, PSC has completed approximately 72% of its fiber build at an approximate cost
of $32.5M. The average cost of connecting cooperative members to date is $8,430 per drop. The
remaining network build out will cost approximately $17.5M at an average cost of $10,294 per
drop, due to remaining cooperative members residing in higher cost serving areas.
Current plans have 100% of the FTTH network to be completed by year 2022. This,
however, is dependent on any change in the regulatory landscape and its effect on revenue
streams and support mechanisms currently in place.
Citizens Telephone. Citizens has completed its fiber to the home project for the town of
Warren, Indiana and about two miles into the surrounding rural. 100% of the fiber is buried,
which took $4.5 million to accomplish (total for labor/fiber/ back office/ modems, etc.), and
passes about 700 homes. Citizens’ take rate is 65%. Citizens had a lot of people concerned that it
was going to raise its rates. As such, Citizens started with the same price and speed as it had
before on DSL. As Citizens still had 400 people on DSL, it believed it the best way to launch.
Comments of Indiana Exchange Carrier Association, Inc. Page 8 of 12
Customers were immediately unhappy that they were not getting any more speed.
Citizens had offered affordable packages for higher speeds, but had no takers. Eventually,
Citizens doubled the speeds for the same price as before and are now seeing some customers to
upgrade to higher speeds - 64 total so far.
Smithville Telephone. Smithville built 8,278 feet of buried 48 fiber through a residential
subdivision, Windsor Private (North of Bloomington, Monroe County), located in a rural area
that passes 41 residential customers. The project cost $185,000 or $4,512 per home passed. Of
these 41 customers, Smithville signed 33 to internet services and 33 to voice services.
In Overlook/Windfree Estates (South of Bloomington toward Lake Monroe), Smithville
built 16,592 feet of fiber, of which 12,078 was buried and 4,514 was aerial, and the fiber routes
passed 102 residential customers. The project cost $254,408 or $2,651 per home passed. Of these
102 customers, Smithville signed up 46 to Internet services and 46 to voice services.
In Pointe MDU (Rural Monroe County, off Lake Monroe), Smithville built 76,550 feet of
buried fiber in an area where the terrain is mostly bedrock, and the fiber routes passed 987
residential customers. The project cost $6,626,800 or $6,715 per home passed. Of these 987
customers, Smithville signed up 661 to internet services and 460 to voice services.
In Griffin (Posey County), Smithville built 315,674 feet of buried fiber in a very rural
area and the fiber routes passed 345 customers. The project cost $3,937,052 or $11,412 per home
passed. Of these 345 customers, Smithville signed up 168 to internet services and 166 to voice
services.
Daviess-Martin Rural Telephone Corporation d/b/a RTC Communications. In 2017, RTC
was approached by the Daviess County Economic Development Committee to discuss a
partnership to deploy fiber to an area in Washington, Indiana located in Southwest Indiana. This
partnership was a driving force in the city of Washington’s efforts to convince M&C Tech, a
new Japanese residual manufacturing facility, to locate its new American operation to
Washington. This project was also designed to serve over a dozen commercial and enterprise
customers located in an unserved area in Washington.
In late 2017, RTC embarked on additional self-funded edge-out projects located in
Daviess County. These projects were designed to deploy FTTH to an area within Daviess County
that was unserved by a traditional land-based provider. RTC also deployed fiber in an AT&T
Comments of Indiana Exchange Carrier Association, Inc. Page 9 of 12
area south of Plainville, again unserved by a traditional land-based provider. These projects
brought fiber to the home to of an additional 54 rural Daviess County residents as well as to one
sizable enterprise commercial customer and 5 small business. To date, RTC has connected fiber
to nearly 43 residential customers in rural Indiana and to all 6 of the commercial customers,
delivering industry leading fiber internet and access to Gig speed service.
All aforementioned projects were completely funded by RTC with zero outside grants or
loans making the take-rate crucial in delivering a strong return on investment. Unlike most
residential projects located in a competitive area, the take-rates are never at the levels needed to
secure a solid return on investment. The projects had no competitive environment from a land-
based provider, so the RTC project located 3 miles south of Washington was able to net 36
residential data customers out of 43 households, and the Plainville project netted 7 data
customers out of the 12 households served. In a competitive area, the take-rates would have
prevented these projects from meeting a reasonable return on investment as nearly $80,000
dollars was spent to deliver said services.
As a side note; the projects, though unserved by a traditional land-based provider, were
ineligible for any USDA funding, as cellular data was available in the relevant areas.
New Lisbon Telephone Company, Inc. One of New Lisbon’s fiber projects is six miles in
length, cost approximately $266,000 ($44,333 per mile) to construct, and has the potential of
serving 34 customers. New Lisbon estimates cutover costs of $1,000 per subscriber (fiber drop,
ONT, and labor) and a total cost per customer of $8,824.
TDS Telecom. See Attachment E.

Comments of Indiana Exchange Carrier Association, Inc. Page 10 of 12
Study Topic 5 - Any other matter concerning universal service reform that the Commission
consider appropriate.
Response:
INECA members support finding ways to support and fund rural broadband and are
committed to providing broadband services to their customers, as illustrated above. However, the
IUSF, put in place to replace lost intrastate revenues as a result of mirroring, is not the
appropriate funding mechanism for broadband. The IUSF was established in 2004 to promote
universal telephone service by ensuring its availability at just, reasonable and affordable rates
that are reasonably comparable between rural and urban areas of Indiana.
There is a strong continued need for support for providing telephone service to Indiana’s
rural residents and businesses. The importance of reliable landline phone service cannot be
overstated, and landlines continue to play an important role in telecommunications for rural
residents and businesses. People in rural areas use landline telephone to apply for jobs, call 911,
run their businesses, and reach their doctor, loved ones, and elected officials. Currently, landline
service is the most affordable, accessible and reliable communications tool in rural communities.
There remain practical limitations of wireless, fiber, and other broadband mechanisms in rural
areas. We must ensure that the current technology transition remains an opportunity to increase
investment in rural communities and does not become a process that takes away communications
tools from rural Americans.
The decline in the number of access lines and Federal Communications Commission
(FCC) intercarrier compensation reforms have led to a substantial loss of intrastate revenues for
the INECA members and have the potential to result in further reductions in revenue. As
addressed in the direct testimonies of Chad Duval and Larry Landis, filed in the most recent
IUSF Triennial Review in Cause No. 45064 and attached hereto as Attachments A and B,
respectively, this situation is becoming increasingly dire, with most of INECA’s members
currently operating at significantly below their nominally authorized rate of return and some at
negative rates of return.
As discussed by Mr. Duval in his testimony, based on an analysis of 25 INECA member
companies that receive IUSF support who provided five years of historical IUSF Qualifications
Test data for the years 2013 through 2017, a five-year average rate of return for each company
Comments of Indiana Exchange Carrier Association, Inc. Page 11 of 12
and all 25 companies in total was developed. Of the 25 companies, only one was found to be
earning more than the rate of return cap of 11.50% based on a five-year average. The remaining
24 companies earned less than 11.50% on average, including 10 companies that had negative
rates of return for the five-year period.
As discussed by Mr. Duval in his testimony, in its 2011 USF/ICC Transformation Order,2
the FCC ordered the unification of interstate and intrastate terminating switched access rates over
two years, which was completed in 2013, and a further seven year transition of interstate and
intrastate terminating switched access rates to bill and keep ($0.00 per minute of use). Effective
July 1, 2018, intrastate terminating switched access revenues will be approximately 69.83% of
what they were at the same point in 2011. The FCC has yet to address reform of intrastate
originating switched access. However, in a Public Notice dated September 8, 2017, the FCC
sought further comment to refresh the record on intercarrier compensation reform related to the
network edge, tandem switching and transport, and transit.3 In doing so, the FCC made it clear
that it continues to consider further reforms to terminating and originating intercarrier
compensation rates, both of which could impact the intrastate revenues of the INECA member
companies as the result of mirroring interstate rates. There is no way to know for sure what the
FCC will do if and when it addresses further reform of intercarrier compensation. Depending on
the FCC’s treatment of intrastate originating switched access, it is possible that further reductions
in intrastate switched access revenues will occur at some point in the future.
It is important to recognize that INECA members must satisfy the provider of last resort
(“POLR”) statutory requirements under Indiana Code § 8-1-32.4 et seq. and, as a result of such
requirements, irrespective of number of access lines and declining revenues, must financially
support the maintenance of the telephone network. Thus, even though the number of access lines,
and, coincident thereto, revenues, have declined, INECA members are statutorily required to
continue maintaining their systems regardless.
Given these revenue declines that INECA members are experiencing and are likely to
continue experiencing due to loss of access lines and FCC ICC reforms, IUSF disbursements are
critical, more so now than ever, to support INECA members in providing affordable, accessible
2 Connect America Fund et al., WC Docket No. 10-90 et al., Report and Order and Further Notice of Proposed Rulemaking, 26 FCC Rcd 17663 (2011) (2011 USF/ICC Transformation Order and/or FNPRM), aff’d sub nom, In re: FCC 11-161, 753 F.3d 1015 (10th Cir. 2014). 3 See DA 17-863, released September 8, 2017.

Comments of Indiana Exchange Carrier Association, Inc. Page 12 of 12
and reliable landline service to the least served, Hoosiers living in low-income, rural, and high
cost areas, and in meeting their POLR statutory obligations.
Please Address Questions to:
Alan Terrell INECA 2820 Manitou Park Drive Rochester, IN 46975 317-407-3357 [email protected]
868222
STATE OF INDIANA
INDIANA UTILITY REGULATORY COMMISSION
IN THE MATTER OF THE COMMISSION’S ) TRIENNIEL REVIEW OF THE INDIANA ) CAUSE NO. 45064 UNIVERSAL SERVICE FUND )
SUBMISSION OF DIRECT TESTIMONY
The Indiana Exchange Carrier Association, Inc. (“INECA”), by counsel, hereby submits
in the above referenced Cause the Direct Testimony of Chad Duval.
Respectfully submitted,
By: /s/ Jeremy L. Fetty Jeremy L. Fetty Liane K. Steffes PARR RICHEY 251 N. Illinois Street, Suite 1800 Indianapolis, Indiana 46204 Telephone: (317) 269-2500 Facsimile: (317) 269-2514 E-mail: [email protected] [email protected]
Attorneys for Indiana Exchange Carrier Association, Inc.
Attachment A

CERTIFICATE OF SERVICE
I hereby certify that a copy of the foregoing Direct Testimony of Chad Duval was served
upon the following via electronic mail this 24th day of May, 2018:
Karol H. Krohn Indiana Office of the Utility Consumer Counselor 115 W. Washington Street, 1500 South Indianapolis, IN 46204 [email protected] [email protected]
Anne E. Becker Richard E. Aikman, Jr. Lewis & Kappes, P.C. One American Square, Suite 2500 Indianapolis, IN 46282 [email protected] [email protected]
Dale E. Sporleder Frontier Communications 5089 Huntington Drive Carmel, IN 46033 [email protected]
Brian D. Robinson AT&T Indiana 225 W. Randolph, Room 25A430 Chicago, IL 60606 [email protected]
Pamela H. Hollick CenturyLink 4625 West 86th Street, Suite 500 Indianapolis IN 46037 [email protected]
Nikki G. Shoultz Bose McKinney & Evans 111 Monument Circle - Suite 2700 Indianapolis, IN 46204 [email protected]
Michael B. Cracraft Steven W. Krohne Ice Miller LLP One American Square, Suite 2900 Indianapolis, IN 46282-0200 [email protected] [email protected]
Teresa E. Morton Nyhart Barnes & Thornburg 1313 Merchants Bank Bldg. 11 S. Meridian Street Indianapolis, IN 46204 [email protected]
Robert K. Johnson PO Box 329 Greenwood, IN 46143 [email protected]
William B. Powers 121 Monument Circle - Suite 518 Indianapolis, IN 46204 [email protected]
Rick D. Doyle, Esq. Law Office of Rick Doyle 4561 Hickory Ridge Blvd. Greenwood, IN 46143 [email protected]
Kenneth Schifman Director Government Affairs 6450 Sprint Parkway Overland Park, KS 66251 [email protected]
Attachment A

Clayton C. Miller Stoll Keenon Ogden PLLC 201 N. Illinois Street, Suite 1225 Indianapolis, IN 46204 [email protected]
Charles R. Mercer, Jr. CenturyLink 5320 Singleton Street Indianapolis, IN 46227 [email protected]
Robert E. Stewart Frontier Communications 224 W Exchange Owosso, MI 48867 [email protected]
Thomas J. Moorman WOODS & AITKEN LLP 2154 Wisconsin Avenue, N.W., Suite 200 Washington, D.C. 20007 [email protected]
Jack Phillips Director- Gov't and External Affairs Frontier Communications Corp. 14450 Burnhaven Drive Burnsville, MN 55306 [email protected]
Peter S. Kovacs PETER KOVACS LAW, P.C. 11650 Olio Road Suite 1000 PMB 275 Fishers, IN 46037 [email protected]
Kathy Buckley Verizon 4700 MacCorkle Ave, SE Box 3 Charleston, WV 25304 [email protected]
De O'Roark General Counsel - South Verizon One Verizon Place Alpharetta, GA 30004 [email protected]
Charles R. Mercer, Jr. 5523 Blairwood Drive Indianapolis, IN 46237 [email protected]
By: /s/ Jeremy L. Fetty Jeremy L. Fetty PARR RICHEY 251 N. Illinois Street, Suite 1800 Indianapolis, Indiana 46204 Telephone: (317) 269-2500 Facsimile: (317) 269-2514 E-mail: [email protected]
861634
Attachment A

STATE OF INDIANA
INDIANA UTILITY REGULATORY COMMISSION
IN THE MATTER OF THE COMMISSION’S ) TRIENNIAL REVIEW OF THE INDIANA ) CAUSE NO. 45064 UNIVERSAL SERVICE FUND )
PREFILED TESTIMONY OF CHAD A. DUVAL
ON BEHALF OF
INDIANA EXCHANGE CARRIER ASSOCIATION, INC.
Attachment A

Testimony of Chad A. Duval Indiana Exchange Carrier Association, Inc.
Page 1 of 17
IURC CAUSE NO. 45064 1
PREFILED TESTIMONY OF CHAD A. DUVAL 2 3
4 Q. WHAT IS YOUR NAME, TITLE, AND BUSINESS ADDRESS? 5 6 A. My name is Chad A. Duval. I am a Principal at Moss Adams LLP (Moss Adams), an 7
accounting and business consulting firm. My business address is 3121 W. March Lane, 8
Suite 200, Stockton CA, 95219. 9
10
Q. PLEASE DESCRIBE YOUR EDUCATIONAL BACKGROUND AND 11
EXPERIENCE. 12
13 A. My educational background includes a Bachelor of Science degree in Business 14
Administration, with an emphasis in Statistics, from the University of Denver, in Denver, 15
Colorado. In 1995, I was hired by GVNW Inc./Management to serve as a Consulting 16
Analyst in the Company's Colorado Springs office. In 1998, I was promoted to 17
Management Consultant. In 1999, I accepted the position of Manager of Strategic Pricing 18
with US WEST Communications in Denver, Colorado. In January of 2000, I was 19
promoted to Group Manager of Strategic Pricing. In October of 2000, I accepted the 20
position of Director of Product Management with Vanion, Inc., a competitive local 21
exchange carrier headquartered in Colorado Springs, Colorado. In September of 2001, I 22
accepted the position of Senior Consultant with GVNW in Colorado Springs, Colorado. 23
In October of 2004, I accepted the position of Senior Manager with Moss Adams in 24
Stockton, California. In October of 2007, I became a Principal at Moss Adams in that 25
office. In August of 2015, I was named the National Practice Leader of Moss Adams’ 26
Communications and Media practice. 27
28 Q. CAN YOU PLEASE DESCRIBE YOUR DUTIES AND RESPONSIBILITIES AS A 29
PRINCIPAL AT MOSS ADAMS? 30
31
Attachment A

Testimony of Chad A. Duval Indiana Exchange Carrier Association, Inc.
Page 2 of 17
A. Moss Adams is a regional accounting and consulting firm with offices in major cities in 32
the states of Arizona, California, Kansas, New Mexico, Oregon, Texas and Washington. 33
Moss Adams’ Communications and Media practice provides audit, tax, and financial and 34
regulatory consulting services to the telecommunications industry, particularly to rural 35
telecommunications carriers. I am the National Practice Leader of the Communications 36
and Media practice. In that role I provide technical and strategic guidance to a team of 37
approximately 80 professionals in our audit, tax and consulting groups. In addition, I 38
provide consulting services to companies in several states, including state and federal 39
universal service funding, cost separations studies, business plans, budgets, depreciation 40
studies, regulatory policy and compliance, and management analysis on various 41
regulatory and business issues. 42
43 Q. FOR WHOM ARE YOU APPEARING IN THIS PROCEEDING? 44 45 A. I am appearing on behalf of Indiana Exchange Carrier Association, Inc. (“INECA”). 46
INECA, on behalf of its enumerated members,1 is a party to the Settlement Agreement 47
(“Settlement Agreement”) on the Indiana Universal Service Fund (“IUSF”) filed on May 48
24, 2018m in this Cause. 49
50 Q. HAVE YOU EVER TESTIFIED BEFORE THE INDIANA UTILITY 51
REGULATORY COMMISSION OR ANY OTHER REGULATORY AGENCY? 52
1 INECA’s membership includes: Bloomingdale Home Telephone Company, Inc.; Citizens Telephone Corporation; Clay County Rural Telephone Cooperative, Inc. d/b/a/ Endeavor Communications; Craigville Telephone Company Inc.; Daviess-Martin Rural Telephone Corporation d/b/a RTC Communications; Geetingsville Telephone Company Inc.; Hancock Rural Telephone Corporation d/b/a NineStar Connect; Ligonier Telephone Co., Inc.; Monon Telephone Company Inc.; Miles Communications, Inc. d/b/a Enhanced Telecommunications Corp.; Mulberry Cooperative Telephone Company, Incorporated d/b/a Mulberry Telephone Company; New Lisbon Telephone Company Inc.; New Paris Telephone Inc.; Northwestern Indiana Telephone Company Inc. d/b/a Nitco; Perry-Spencer Rural Telephone Cooperative Inc. d/b/a PSC; Pulaski White Communications, Inc. d/b/a Lightstream; Rochester Telephone Company Inc.; Southeastern Indiana Rural Telephone Cooperative Inc. d/b/a SEI Communications; Smithville Telephone Company, Incorporated d/b/a Smithville Communications; Swayzee Telephone Company, Inc. d/b/a Swayzee Communications Corp.; Sweetser Rural Telephone Company Inc.; TDS Telecom Companies (Camden Telephone Company Inc., Communications Corporation of Indiana, Communications Corporation of Southern Indiana, Home Telephone Company Inc., Home Telephone Company of Pittsboro Inc., Merchants and Farmers Telephone Company d/b/a TDS Telecom-Hillsboro., S & W Telephone Company, Inc., Tipton Telephone Company Inc., Tri-County Telephone Company Inc., West Point Telephone Company, Incorporated); Washington County Rural Electric Telephone Cooperative Inc. d/b/a Tele-Media Solutions; and Yeoman Telephone Company Inc.
Attachment A
Testimony of Chad A. Duval Indiana Exchange Carrier Association, Inc.
Page 3 of 17
A. Yes, I previously testified before the Indiana Utility Regulatory Commission (the 53
“Commission”) during the 2015 Triennial Review of the IUSF in Cause No. 44681 on 54
behalf of INECA. In addition, I have testified before the California Public Utilities 55
Commission, the Colorado Public Utilities Commission, the Georgia Public Service 56
Commission, the Public Utilities Commission of Nevada, the North Dakota Public 57
Service Commission, the Oklahoma Corporation Commission, the Oregon Public 58
Utilities Commission, the Public Service Commission of Utah, and the Wyoming Public 59
Service Commission. Further, I regularly consult with carriers around the country on 60
issues related to universal service funding, both at the state and federal levels. 61
62 Q. WHAT IS THE PURPOSE OF YOUR TESTIMONY? 63 64 A. The purpose of my testimony is to support maintaining the status quo with the current 65
IUSF until at least the Commission’s next triennial review. In this testimony I will: 66
explain the original purpose of the IUSF and how that purpose is still being served today, 67
outline the ongoing reforms of federal universal service funding that continue to create 68
uncertainty for INECA’s member companies, discuss how the IUSF is an integral 69
component in keeping local rates just, reasonable and affordable for customers in rural 70
areas of Indiana, and address the purpose and scope of the triennial review and explain 71
why it is recommended that the Commission maintain the status quo. 72
73 Q. PLEASE PROVIDE THE BACKGROUND PROMPTING INECA TO FILE 74
DIRECT TESTIMONY IN THIS CAUSE. 75
76 A. The Commission’s March 17, 2004 Order in Cause No. 42144 approved a settlement 77
agreement that created the IUSF. The IUSF settlement agreement included a periodic 78
review of the IUSF on a triennial basis, stating: 79
80 The primary purpose and scope of the reviews shall be: (1) to ensure that the operations 81 of the IUSF are meeting the Commission’s objectives of preserving and advancing 82 universal service within the state of Indiana; (2) to ensure that universal service is 83 continuing to be made available at rates reasonably comparable to rates for basic 84 residential and single-line business local exchange service in urban areas, and that are 85 just, reasonable and affordable; (3) to ensure that the processes, funding levels, size, and 86
Attachment A

Testimony of Chad A. Duval Indiana Exchange Carrier Association, Inc.
Page 4 of 17
the operation and administration of the IUSF remain adequate and sufficient; and (4) to 87 review the operation of the IUSF relative to the federal universal service fund as may be 88 appropriate.2 89
90 On March 21, 2018, in furtherance of the aforementioned review process, the 91
Commission issued an Order in Cause No. 45064, scheduling a prehearing conference 92
and defining a preliminary, but non-exhaustive issues list to be addressed in the context 93
of the 2018 Triennial Review. 94
95
Q. CAN YOU SUMMARIZE THE FCC’S ONGOING REVIEW AND REFORM OF 96
INTERCARRIER COMPENSATION FOR RATE-OF-RETURN CARRIERS? 97
A. In its 2011 USF/ICC Transformation Order,3 the FCC ordered the unification of interstate 98
and intrastate terminating switched access rates over two years, which was completed in 99
2013, and a further seven year transition of interstate and intrastate terminating switched 100
access rates to bill and keep ($0.00 per minute of use). Interstate originating switched 101
access rates were also frozen at the levels in effect at the time. At the same time, the 102
FCC instituted a new end user charge, the Access Recovery Charge (ARC), to help offset 103
the reduction in switched access revenues as a result of the rate phase down. In addition, 104
the FCC froze interstate switched access revenues and intrastate terminating switched 105
access revenues at their 2011 level4 and provided for a 5% annual phase down in these 106
revenues. The phased down annual revenues are referred to as the annual revenue 107
baseline. 108
109
2 In The Matter of the Investigation on the Commission’s Own Motion Under Indiana Code § 8-1-2-72, Into Any and All Matters Related to the Commission’s Mirroring Policy Articulated in Cause No. 40785 and the Effect of the FCC’s Mag Order on Such Policy, Access Charge Reform, Universal Service Reform, and High Cost or Universal Service Funding Mechanisms Relative to Telephone and Telecommunications Services Within the State of Indiana, Cause No. 42144, pp. 11-12 (Ind. Util. Reg. Comm’n March 17, 2004). 3 Connect America Fund et al., WC Docket No. 10-90 et al., Report and Order and Further Notice of Proposed Rulemaking, 26 FCC Rcd 17663 (2011) (2011 USF/ICC Transformation Order and/or FNPRM), aff’d sub nom, In re: FCC 11-161, 753 F.3d 1015 (10th Cir. 2014). 4 Interstate switched access revenue was frozen at the revenue requirement submitted to the FCC in the 2011 switched access tariff filing, which was effective on July 1, 2011. This revenue requirement is the average of the forecasted revenue requirement for each company for 2011 and 2012. Intrastate terminating switched access was frozen at the revenue billed from October 1, 2010 through September 30, 2011 and collected by March 31, 2012.
Attachment A
Testimony of Chad A. Duval Indiana Exchange Carrier Association, Inc.
Page 5 of 17
As a result of this freeze and phase down of interstate and intrastate terminating switched 110
access revenues, and the phase down of interstate and intrastate terminating switched 111
access rates, the FCC implemented the Connect America Fund Intercarrier Compensation 112
(the “CAF ICC”) support to provide cost recovery for the difference between the annual 113
revenue baseline and the switched access revenues received from interexchange carriers 114
and ARC revenue received from end users. Any shortfall in cost recovery from the 115
annual revenue baseline is made up from CAF ICC support, less the 5% annual phase 116
down in the annual revenue baseline. CAF ICC support is a joint interstate and intrastate 117
cost recovery mechanism, so a portion of this support is assigned to offset reductions in 118
intrastate terminating switched access revenues. 119
120
In the FNPRM, the FCC indicated that it was further analyzing its authority to regulate 121
intrastate originating switched access and that it would address reform of originating 122
switched access in a future order. The FCC has yet to address reform of intrastate 123
originating switched access. However, in a Public Notice dated September 8, 2017, the 124
FCC sought further comment to refresh the record on intercarrier compensation reform 125
related to the network edge, tandem switching and transport, and transit.5 In doing so, the 126
FCC made it clear that it continues to consider further reforms to terminating and 127
originating intercarrier compensation rates, both of which could impact the intrastate 128
revenues of the INECA member companies as the result of mirroring interstate rates 129
discussed below. There is no way to know for sure what the FCC will do if and when it 130
addresses further reform of intercarrier compensation. 131
132
Q. HOW HAS THE FCC’S REFORM OF TERMINATING SWITCHED ACCESS 133
IMPACTED SWITCHED ACCESS REVENUES IN INDIANA? 134
A. First and foremost, the 5% annual reduction in intrastate terminating switched access 135
revenues from 2011 levels ensures that intrastate terminating switched access revenues 136
decline by 5% every year. This 5% annual reduction takes effect each July 1, so effective 137
July 1, 2018, intrastate terminating switched access revenues will be approximately 138
5 See DA 17-863, released September 8, 2017.
Attachment A
Testimony of Chad A. Duval Indiana Exchange Carrier Association, Inc.
Page 6 of 17
69.83% of what they were at the same point in 2011. Any reduction beyond the 5% 139
annual phase down is recovered from CAF ICC support. This 5% annual reduction will 140
continue unless and until the FCC modifies the annual phase down, which the FNPRM 141
indicated could increase at some point in the future. 142
143
In addition to the annual phase down of intrastate terminating switched access revenues, 144
intrastate originating switched access revenues could be impacted as well. Commission 145
policy and the Indiana Code6 support the mirroring of intrastate rates and interstate rates, 146
which is consistent with the FCC’s 2011 USF/ICC Transformation Order for terminating 147
switched access. However, depending on the FCC’s treatment of intrastate originating 148
switched access, it is possible that further reductions in intrastate switched access 149
revenues will occur at some point in the future. Of significant concern is the fact that the 150
FCC has maintained a $2 billion budget for universal service funding for rate-of-return 151
carriers, including CAF ICC support. As a result of this cap on federal universal service 152
funding, rate-of-return carriers have seen significant reductions in high-cost support 153
disbursements relative to the amount of support that is determined based on individual 154
carrier costs. Unless the FCC considerably increases its budget for rate-of-return USF, it 155
is highly likely that there will not be sufficient funding for the reductions in originating 156
switched access if and when the FCC implements its reform. 157
158
Q. CAN YOU SUMMARIZE THE FCC’S ONGOING REVIEW AND REFORM OF 159
UNIVERSAL SERVICE FUNDING? 160
A. Yes. There has been a significant amount of USF reform over the last several years. This 161
started with the 2011 USF/ICC Transformation Order, in which the FCC implemented a 162
variety of reforms to universal service funding for rate-of-return carriers. An overall 163
limitation on the amount of High Cost Support that a rate-of-return carrier can receive 164
was implemented at $250 per line per month, beginning in 2012. The National Average 165
Cost Per Loop that determines how much High Cost Loop Support (“HCLS”) a company 166
6 Indiana Code § 8-1-2.6-1.5(c)(2) provides, “the commission shall consider the provider’s rates and charges for intrastate access service to be just and reasonable if the intrastate rates and charges mirror the provider’s interstate rates and charges.”
Attachment A
Testimony of Chad A. Duval Indiana Exchange Carrier Association, Inc.
Page 7 of 17
receives was frozen effective July 1, 2015, which results in a Pro-Rata Adjustment 167
(reduction) in support to maintain the FCC’s HCLS-specific budget. 168
169
In March of 2016, the FCC issued the Rate-of-Return Reform Order, in which it adopted 170
a variety of reforms to universal service funding for rate-of-return carriers. It 171
implemented the Alternative Connect America Cost Model (“A-CAM”) as an optional 172
replacement of legacy high-cost support mechanisms. The A-CAM provides a fixed 173
amount of support for a 10-year funding period, from 2017 through 2026, in exchange for 174
meeting specific broadband buildout obligations. In adopting the A-CAM, the FCC 175
increased funding for rate-of-return carriers by $2 billion over the 10-year funding period 176
(approximately $200 million per year), but this additional funding is only available to A-177
CAM electing carriers and some carriers are actually receiving less support from the A-178
CAM than they were under the legacy rate-of-return support mechanisms. Of the 33 179
study areas served by INECA member companies, 11 elected A-CAM support while the 180
remaining 22 chose to stay on legacy rate-of-return support.7 181
182
The Rate-of-Return Reform Order also established a new funding program for broadband 183
only service, called Connect America Fund Broadband Loop Support (“CAF-BLS”). 184
CAF-BLS replaces Interstate Common Line Support (“ICLS”), by continuing to provide 185
support for the portion of the local loop that is assigned to interstate in the jurisdictional 186
separations process, while also providing support for broadband only local loops. Doing 187
so closes a loophole in federal funding for the cost of the local loop, in which rate-of-188
return carriers were obligated to provide broadband in order to be eligible for federal 189
universal service funding, but did not previously receive support for broadband only 190
loops. CAF-BLS recipients must also meet specific broadband deployment obligations. 191
However, the FCC did not provide any additional funding for CAF-BLS, so the support 192
provided for broadband only loops is also subject to the $2 billion annual budget for rate-193
7 The 11 study areas that elected A-CAM support are: Bloomingdale Home Telephone Co., Camden Telephone Company, Inc., Communications Corporation of Indiana, Communications Corporation of Southern Indiana, Home Telephone Company of Pittsboro, Inc., Home Telephone Company of Waldron, Inc., The Merchants and Farmers Telephone Co., Inc., S & W Telephone Company, Inc., Tipton Telephone Company, Inc., Tri-County Telephone Company, Inc., West Point Telephone Company, Inc.
Attachment A

Testimony of Chad A. Duval Indiana Exchange Carrier Association, Inc.
Page 8 of 17
of-return high-cost support. As a result, the FCC implemented a Budget Control 194
Mechanism (“BCM”) to ensure that annual support does not exceed the budget, by 195
reducing or deferring HCLS and CAF-BLS to meet the annual budget. The result of the 196
BCM is that HCLS will be approximately 84.48% of the calculated amount8 in the 3rd 197
quarter of 2018, while CAF-BLS will be approximately 87.65%.9 198
199
In addition, the Rate-of-Return Reform Order implemented a variety of other reforms of 200
rate-of-reform high-cost support. The Operating Expense Limitation establishes an upper 201
limit of annual operating expenses that a rate-of-return carrier may include in its annual 202
high-cost support filings. The Capital Investment Allowance establishes an upper limit 203
of annual investment in loop plant, as well as a per-location cost limitation, that a carrier 204
may include in its annual high-cost support filings. The Rate-of-Return Reform Order 205
also established a process for the elimination of high-cost support in areas served by a 206
qualifying competitor, although this provision has yet to be implemented. Further, the 207
Rate-of-Return Reform Order re-prescribed the interstate authorized rate of return to 208
9.75% through a six-year transition from 11.25%, in equal annual increments of 0.25%. 209
As of the date of this testimony, the interstate authorized rate of return is 10.75%. 210
Finally, the Rate-of-Return Reform Order included a Further Notice of Proposed 211
Rulemaking (“FNPRM”), which outlined a series of further potential reforms to be 212
addressed by the FCC. 213
214
In its latest USF Reform Modification Order,10 dated March 23, 2018, the FCC addressed 215
a variety of outstanding matters and clarifications from prior orders. The most extensive 216
change in this order was the identification of costs that have been deemed ineligible for 217
recovery through federal high-cost support, including personal expenses, expenses 218
unrelated to operations and corporate luxury goods. While most of the items deemed 219
8 The BCM is applied to HCLS after the application of the HCLS-specific pro-rata adjustment, which is currently estimated at 79.61% for the 3rd quarter of 2018. The result of these two adjustments is that the support provided is 67% of the amount required based on an individual carrier’s reported costs. 9 The BCM for CAF-BLS does not result in an actual reduction in support. If a carrier provides broadband only service, the BCM for CAF-BLS is recovered through the rate for this service. If a carrier does not provide broadband only service, the BCM for CAF-BLS is deferred for two years and included in support for that year. 10 This order has not been named at this time, so I am referring to it as the USF Reform Modification Order.
Attachment A

Testimony of Chad A. Duval Indiana Exchange Carrier Association, Inc.
Page 9 of 17
ineligible for recovery have not been common practice for the INECA member 220
companies, there are certain items that have historically been deemed eligible for 221
recovery that will no longer be supported. Some of the items that are no longer eligible 222
for recovery include food and beverage for certain company events, charitable 223
contributions, memberships in professional organizations and associations, and public 224
relations related expenses. 225
226
In addition to these limitations, the USF Reform Modification Order provided additional 227
funding for both A-CAM and legacy rate-of-return carriers. The order increased funding 228
for A-CAM carriers by approximately $365 million over the 10-year funding period in 229
return for additional broadband buildout obligations. It also provided relief of the BCM 230
for legacy rate-of-return carriers for the period from July 1, 2017 through June 30, 2018 231
(Tariff Year 2018/2019), but did not address periods before or after those dates. This will 232
provide an estimated $180 million in one-time funding for these carriers, which is likely 233
to be paid in the 4th quarter of 2018 or the 1st quarter of 2019.11 On May 1, 2018, the 234
Universal Service Administrative Company (“USAC”) announced that the Budget 235
Control Mechanism for Tariff Year 2018/2019 is estimated to be 15.52%, so the relief 236
will be short lived and the reduction in support continues to increase. In addition, the 237
USF Reform Modification Order implemented an inflationary factor into the calculation 238
of the Operating Expense Limitation implemented in the Rate-of-Return Reform Order 239
and also updated the calculation of the FCC’s Corporate Operations Expense Limitation 240
to include broadband only lines. 241
242
Finally, the USF Reform Modification Order included a Notice of Proposed Rulemaking 243
(“NPRM”) that identifies a variety of USF-related issues that the FCC still intends to 244
address. These items include: a review of the high-cost support budget for rate-of-return 245
carriers, a potential new offer of A-CAM support for carriers still receiving legacy rate-246
of-return support, further funding for existing A-CAM recipients, establishing a threshold 247
11 Based on publicly available information from the Universal Service Administrative Company, INECA member companies will receive approximately $3.195 million in one-time relief from the BCM. I will later discuss the overall impact that the BCM has, and likely will continue to have, on INECA member companies.
Attachment A

Testimony of Chad A. Duval Indiana Exchange Carrier Association, Inc.
Page 10 of 17
of support that would not be subject to the BCM, additional broadband deployment 248
obligations for legacy rate-of-return carriers, and other miscellaneous items that could 249
impact the amount of federal high-cost support that rate-of-return carriers receive. 250
251
Q. HOW HAVE THESE FCC REFORMS OF UNIVERSAL SERVICE FUNDING 252
IMPACTED COST RECOVERY FOR THE INECA MEMBER COMPANIES? 253
A. I have performed an analysis of the impacts of both the HCLS-specific Pro-Rata 254
Adjustment and the overall Budget Control Mechanism on the HCLS support received, or 255
projected to be received, by the 33 INECA member companies from 2016 through 2018. 256
This analysis is based on information produced by USAC and the National Exchange 257
Carrier Association (“NECA”). The analysis begins with the amount of HCLS that each 258
company is projected to receive after the impact of the HCLS-specific Pro-Rata 259
Adjustment, as the pre-adjustment support is not as readily available. I calculated the 260
pre-adjustment support by dividing the post-adjustment support by the Pro-Rata 261
Adjustment factor for the year. I then included the estimated Budget Control Mechanism 262
impact for the year based on quarterly, semi-annual, or annual estimates available on 263
USAC’s public website. Finally, the HCLS-specific Pro-Rata Adjustment and the 264
Budget Control Mechanism impacts on HCLS are added together to determine the 265
estimated annual reduction in HCLS, which is intended to provide recovery for intrastate 266
costs. For the period from July 1, 2017 through June 30, 2016, I removed the impacts of 267
the Budget Control Mechanism, as the FCC has announced that it will make companies 268
whole for this time period. 269
270
The results of this analysis are summarized in the following table for all INECA member 271
companies combined. 272
Table 1 273
Adjustment 2016 2017 2018
Pro-Rata Adjustment $ (3,694,634) $ (5,427,619) $ (5,948,388)
Budget Control Mechanism $ (404,527)12 $ (1,095,448) $ (1,798,645)
12 The Budget Control Mechanism was not instituted until September 1, 2016, so the impact is limited to 4 months.
Attachment A
Testimony of Chad A. Duval Indiana Exchange Carrier Association, Inc.
Page 11 of 17
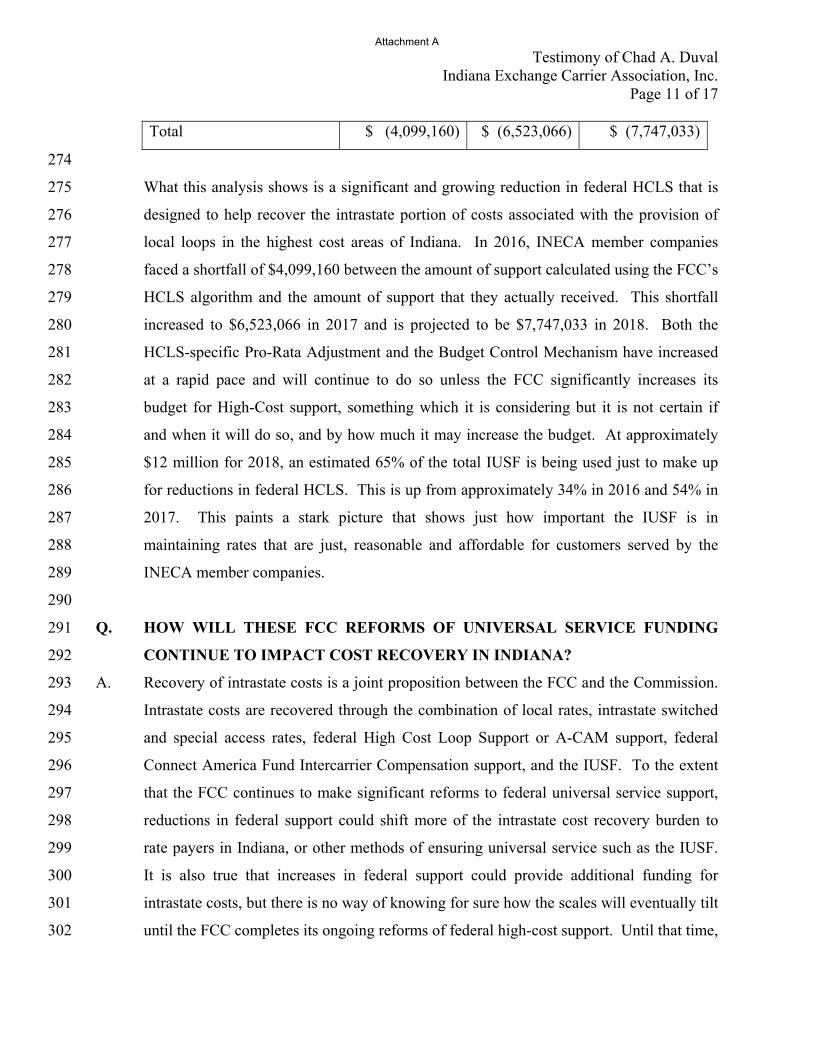
Total $ (4,099,160) $ (6,523,066) $ (7,747,033)
274
What this analysis shows is a significant and growing reduction in federal HCLS that is 275
designed to help recover the intrastate portion of costs associated with the provision of 276
local loops in the highest cost areas of Indiana. In 2016, INECA member companies 277
faced a shortfall of $4,099,160 between the amount of support calculated using the FCC’s 278
HCLS algorithm and the amount of support that they actually received. This shortfall 279
increased to $6,523,066 in 2017 and is projected to be $7,747,033 in 2018. Both the 280
HCLS-specific Pro-Rata Adjustment and the Budget Control Mechanism have increased 281
at a rapid pace and will continue to do so unless the FCC significantly increases its 282
budget for High-Cost support, something which it is considering but it is not certain if 283
and when it will do so, and by how much it may increase the budget. At approximately 284
$12 million for 2018, an estimated 65% of the total IUSF is being used just to make up 285
for reductions in federal HCLS. This is up from approximately 34% in 2016 and 54% in 286
2017. This paints a stark picture that shows just how important the IUSF is in 287
maintaining rates that are just, reasonable and affordable for customers served by the 288
INECA member companies. 289
290
Q. HOW WILL THESE FCC REFORMS OF UNIVERSAL SERVICE FUNDING 291
CONTINUE TO IMPACT COST RECOVERY IN INDIANA? 292
A. Recovery of intrastate costs is a joint proposition between the FCC and the Commission. 293
Intrastate costs are recovered through the combination of local rates, intrastate switched 294
and special access rates, federal High Cost Loop Support or A-CAM support, federal 295
Connect America Fund Intercarrier Compensation support, and the IUSF. To the extent 296
that the FCC continues to make significant reforms to federal universal service support, 297
reductions in federal support could shift more of the intrastate cost recovery burden to 298
rate payers in Indiana, or other methods of ensuring universal service such as the IUSF. 299
It is also true that increases in federal support could provide additional funding for 300
intrastate costs, but there is no way of knowing for sure how the scales will eventually tilt 301
until the FCC completes its ongoing reforms of federal high-cost support. Until that time, 302
Attachment A

Testimony of Chad A. Duval Indiana Exchange Carrier Association, Inc.
Page 12 of 17
the INECA member companies believe that it is prudent to maintain the IUSF in its 303
current form and only make changes to this vital program once there is greater certainty 304
of support available from the FCC. 305
306
Q. WHAT IS CURRENTLY HAPPENING WITH INTRASTATE SWITCHED 307
ACCESS MINUTES OF USE FOR THE INECA MEMBER COMPANIES? 308
I performed an analysis of 24 INECA member companies that are recipients of IUSF 309
support and who were able to provide five years of historical intrastate switched access 310
minutes of use for the years 2013 through 2017. What this analysis shows is that 311
intrastate originating switched access minutes of use are in significant decline. The total 312
intrastate originating minutes of use in 2013 was almost 42.9 million and by 2017 had 313
declined to just over 29 million. This is an average annual reduction of more than 8% per 314
year. Each lost minute of use means lost intrastate revenue for the INECA member 315
companies. This is concerning because the INECA member companies currently have no 316
way to recover this lost revenue, and, unless the FCC or the Commission comes up with a 317
significantly greater budget for CAF ICC or IUSF, there may be no means of recovering 318
this lost revenue in the future if and when intrastate originating switched access is 319
reformed. 320
321
Q. ARE THE INECA MEMBER COMPANIES EXPERIENCING A SIMILAR 322
REDUCTION IN THEIR INTRASTATE SWITCHED ACCESS REVENUE 323
REQUIREMENTS? 324
A. No. I performed a similar analysis, this time of 20 INECA member companies13 that 325
receive IUSF support and were able to provide five years of historical intrastate switched 326
access revenue requirement data for the years 2013 through 2017. What this analysis 327
shows is that intrastate switched access revenue requirements are in decline, but not at the 328
same pace as intrastate switched access minutes of use. The total intrastate switched 329
access revenue requirement for the INECA member companies has declined from 330
13 The number of INECA member companies included in each of the referenced analyses varies due to the ready availability of data from each company to perform that particular analysis.
Attachment A

Testimony of Chad A. Duval Indiana Exchange Carrier Association, Inc.
Page 13 of 17
approximately $3.54 million in 2013 to $2.86 million in 2017, an average annual 331
reduction of nearly 3.7%. This is concerning because intrastate switched access minutes 332
of use, and therefore the revenues derived from those minutes, are declining faster than 333
the associated revenue requirement, leaving a greater portion of the costs to be recovered 334
from sources other than per minute of use access charges. 335
336
Q. ARE THE INECA MEMBER COMPANIES EARNING RATES OR RETURN 337
THAT ARE HIGHER OR LOWER THAN THE RATE OF RETURN CAP IN 338
INDIANA? 339
A. No. I performed an analysis of 2514 INECA member companies that receive IUSF 340
support and were able to provide five years of historical IUSF Qualifications Test data for 341
the years 2013 through 2017. Rather than look at any individual year, which can be 342
skewed by anomalies (for example, 2017 may be skewed due to the financial statement 343
impacts of the Tax Cuts and Jobs Act on deferred income tax expense), I developed a 344
five-year average rate of return for each company and all 25 companies in total. Of the 345
25 companies, only one was found to be earning more than the rate of return cap of 346
11.50% based on a five-year average. The remaining 24 companies earned less than 347
11.50% on average, including 10 companies that had negative rates of return for the five-348
year period. 349
350
Q. IS THE IUSF CURRENTLY MEETING THE COMMISSION’S OBJECTIVES 351
OF PRESERVING AND ADVANCING UNIVERSAL SERVICE WITHIN 352
INDIANA? 353
A. Yes. The IUSF serves an important role in providing intrastate cost recovery for the high 354
cost of providing service in rural and areas of the state. This funding assists the rate-of-355
return carriers in these high cost areas to continue to build and maintain communication 356
networks that are consistent with those in more urban areas of Indiana. As a result, 357
customers throughout the State of Indiana have access to high quality local exchange and 358
switched access services at rates that are just, reasonable and affordable. While the 359
14 See Footnote 13.
Attachment A

Testimony of Chad A. Duval Indiana Exchange Carrier Association, Inc.
Page 14 of 17
INECA member companies would like to have even more IUSF support, to bridge some 360
or all of the shortfall identified above, they are also understanding of the burden that 361
doing so would place on rate payers in the State of Indiana. 362
363
Q. IS UNIVERSAL SERVICE IN INDIANA CONTINUING TO BE MADE 364
AVAILABLE AT RATES REASONABLY COMPARABLE TO RATES FOR 365
BASIC RESIDENTIAL AND SINGLE-LINE BUSINESS LOCAL EXCHANGE 366
SERVICE IN URBAN AREAS AND AT RATES THAT ARE JUST, 367
REASONABLE AND AFFORDABLE? 368
A. Yes. All of the recipients of IUSF have rates for basic residential and single-line business 369
local exchange service that are consistent with the IUSF benchmark local rates to be 370
eligible for IUSF support. This benchmark rate was established, and continues, to ensure 371
that universal service is provided in Indiana at rates that are consistent with rates in urban 372
areas and are just, reasonable and affordable. In addition, each of the INECA member 373
companies has maintained residential rates that are consistent with the FCC’s benchmark 374
local rates to be eligible for the full amount of HCLS available (after the application of 375
the Pro-Rata Adjustment and Budget Control Mechanism). 376
377
Q. DO THE PROCESSES, FUNDING LEVELS, SIZE, AND OPERATION AND 378
ADMINISTRATION OF THE IUSF REMAIN ADEQUATE AND SUFFICIENT? 379
A. Yes, Solix, the IUSF administrator, the IUSF Oversight Committee, and the Commission 380
perform regular monitoring functions to ensure that the processes, funding levels, size 381
and operation of the IUSF remain adequate and sufficient. Solix, the IUSF administrator, 382
provides quarterly financial reports on the status of the fund and performs an Annual 383
Report of Activity in which it provides a management discussion and analysis and 384
unaudited financial statements. The last Annual Report of Activity for the IUSF for 385
calendar year 2017 was submitted to the Commission by Solix on February 15, 2018.15 386
15 See In the Matter of Issues Relating to Universal Service and Lifeline Assistance Fund Administration Articulated in Cause Nos. 40785, 42144, and 43082, and the Provisions Set Forth in HEA 1279, Codified as I.C. § 8-1-36, Cause No. 42144-S3.
Attachment A
Testimony of Chad A. Duval Indiana Exchange Carrier Association, Inc.
Page 15 of 17
387
In addition to receiving reports from Solix and recommendations from the IUSF 388
Oversight Committee, the Commission conducts a triennial Qualifications Test and 389
Triennial Review of the IUSF, which is the subject of this Cause. The most recent 390
Qualifications Test was performed in 2016 for calendar years 2013, 2014, and 2015 to 391
determine the amount of IUSF support for which each of the recipients is eligible. 392
393
Finally, an independent audit of the IUSF is conducted periodically. The most recent 394
independent audit was conducted by Hurlbert CPA LLC for the years ending December 395
31, 2015 and December 31, 2016, which was issued September 21, 2017. The Auditor’s 396
Report concluded that, “In our opinion, the financial statements referred to above present 397
fairly, in all material respects, the financial position of the IUSF administered by Solix as 398
of December 31, 2016 and 2015”; that “Given these limitations, during our audit, we did 399
not identify any deficiencies in internal control that we consider to be material 400
weaknesses.”; and that “The results of our tests disclosed no instances of noncompliance 401
or other matters that are required to be reported under Government Auditing Standards.” 402
The Auditor’s Report was reviewed by the members of the IUSF Oversight Committee 403
and determined to be a comprehensive and completely satisfactory independent audit. 404
405
Q. PLEASE EXPLAIN THE PUBLIC INTEREST BENEFITS THAT WOULD 406
ACCRUE IF THE COMMISSION WERE TO APPROVE THE SETTLEMENT 407
AGREEMENT. 408
A. One primary public interest benefit that would accrue upon Commission approval of the 409
Settlement Agreement is that the Commission and parties would not devote time and 410
resources on an extended proceeding regarding issues that would likely need to be 411
revisited when the FCC completes its reforms of originating switched access and federal 412
universal service funding. In addition, the public interest is served when carriers that 413
serve high cost areas have sufficient financial resources to ensure that rates are just, 414
reasonable and affordable. 415
416
Attachment A

Testimony of Chad A. Duval Indiana Exchange Carrier Association, Inc.
Page 16 of 17
Q. WOULD APPROVAL OF THE SETTLEMENT AGREEMENT PRECLUDE ANY 417
CHANGES TO THE IUSF PRIOR TO THE COMMISSION’S NEXT TRIENNIAL 418
REVIEW? 419
A. No. As provided in Section 14.B of the Settlement Agreement, any interested party may 420
bring issues before the IUSF Oversight Committee or the Commission at any point prior 421
to the next triennial review if it believes that changes to the IUSF are necessary. The 422
IUSF Oversight Committee meets on a regular basis in order to take up any issues that 423
may arise. As a result, changes to the IUSF could occur at any time between the effective 424
date of the Settlement Agreement and the next Triennial Review. 425
426
Q. WHAT DO THE SETTLING PARTIES RECOMMEND FOR THE IUSF? 427
A. The Parties to the Settlement Agreement recommend that the IUSF be continued under 428
the status quo until the next triennial review, currently scheduled to commence in 2021. 429
By that time, it is currently anticipated that the FCC will have completed the 430
development and implementation of its reforms of intercarrier compensation and federal 431
universal service funding, or at least developed greater consistency in support, which will 432
allow the Commission the opportunity to ensure that the impacts on intrastate revenues 433
are fully understood and incorporated in the 2021 triennial review of the IUSF. While the 434
INECA member companies also believed this would be the case between 2015 and 2018, 435
the FCC has made significant strides on the reforms of high-cost support in the 436
intervening years and is currently working on further reforms. At the time of the 2015 437
IUSF Triennial Review, the first of two significant high-cost support reform orders had 438
not yet been released. These orders have now been released and the FCC has issued a 439
Notice of Proposed Rulemaking to address outstanding issues, so the likelihood of 440
resolution before the 2021 IUSF Triennial Review is now even greater. 441
442
Q. PLEASE SUMMARIZE YOUR DIRECT TESTIMONY. 443
A. The IUSF is currently meeting the Commission’s objectives of preserving and enhancing 444
universal service in the State of Indiana, as evidenced by the availability of high quality 445
telecommunications services throughout the state. Universal service in Indiana continues 446
Attachment A
Testimony of Chad A. Duval Indiana Exchange Carrier Association, Inc.
Page 17 of 17
to be provided at just, reasonable and affordable rates, consistent with those provided in 447
urban areas as a result of the ongoing application of the IUSF benchmark rate. The 448
processes, funding levels, size and operation and administration of the IUSF remain 449
adequate and sufficient, as documented in the Annual Audit of the fund, the Solix Annual 450
Report, the 2018 IUSF surcharge increase, and the extension of the Solix contract to 451
continue to administer the fund. The Commission’s identified goals of the triennial 452
review have been met, so it is in the public interest to close the current triennial review. 453
454
The amount of IUSF that the Parties require is highly dependent on sources of revenue 455
that are impacted by the actions of the FCC, including both intercarrier compensation and 456
federal universal service funding. The FCC continues to review potential reforms of 457
originating switched access services (including intrastate rates) and the associated CAF 458
ICC support, as well as HCLS and A-CAM, portions of which are treated as intrastate 459
revenue in the determination of IUSF. Of major consideration by the FCC at this time is 460
the overall budget for high-cost support for rate-of-return carriers, which has a direct and 461
meaningful impact on the IUSF. As a result of these ongoing reforms and their potential 462
impacts on the IUSF, the Parties recommend that the Commission approve the Settlement 463
Agreement to maintain the status quo until the next triennial review, scheduled for 2021. 464
Doing so will allow the FCC the time necessary to complete its ongoing reforms, and the 465
Commission the ability to fully weigh the impacts of such reforms on the IUSF. 466
467
Q. DOES THIS CONCLUDE YOUR TESTIMONY? 468
A. Yes.469
Attachment A

VERIFICATION
The undersigned affirms under the penalties of perjury that the facts stated in the foregoing testimony are true to his best information and belief.
Chad A. Duval
861631
Attachment A
STATE OF INDIANA
INDIANA UTILITY REGULATORY COMMISSION
IN THE MATTER OF THE COMMISSION’S ) TRIENNIEL REVIEW OF THE INDIANA ) CAUSE NO. 45064 UNIVERSAL SERVICE FUND )
SUBMISSION OF DIRECT TESTIMONY AND EXHIBITS
The Indiana Exchange Carrier Association, Inc. (“INECA”), by counsel, hereby submits
in the above referenced Cause the Direct Testimony and exhibits of Larry S. Landis.
Respectfully submitted,
By: /s/ Jeremy L. Fetty Jeremy L. Fetty Liane K. Steffes PARR RICHEY 251 N. Illinois Street, Suite 1800 Indianapolis, Indiana 46204 Telephone: (317) 269-2500 Facsimile: (317) 269-2514 E-mail: [email protected] [email protected]
Attorneys for Indiana Exchange Carrier Association, Inc.
Attachment B

CERTIFICATE OF SERVICE
I hereby certify that a copy of the foregoing Direct Testimony of Chad Duval was served
upon the following via electronic mail this 24th day of May, 2018:
Karol H. Krohn Indiana Office of the Utility Consumer Counselor 115 W. Washington Street, 1500 South Indianapolis, IN 46204 [email protected] [email protected]
Anne E. Becker Richard E. Aikman, Jr. Lewis & Kappes, P.C. One American Square, Suite 2500 Indianapolis, IN 46282 [email protected] [email protected]
Dale E. Sporleder Frontier Communications 5089 Huntington Drive Carmel, IN 46033 [email protected]
Brian D. Robinson AT&T Indiana 225 W. Randolph, Room 25A430 Chicago, IL 60606 [email protected]
Pamela H. Hollick CenturyLink 4625 West 86th Street, Suite 500 Indianapolis IN 46037 [email protected]
Nikki G. Shoultz Bose McKinney & Evans 111 Monument Circle - Suite 2700 Indianapolis, IN 46204 [email protected]
Michael B. Cracraft Steven W. Krohne Ice Miller LLP One American Square, Suite 2900 Indianapolis, IN 46282-0200 [email protected] [email protected]
Teresa E. Morton Nyhart Barnes & Thornburg 1313 Merchants Bank Bldg. 11 S. Meridian Street Indianapolis, IN 46204 [email protected]
Robert K. Johnson PO Box 329 Greenwood, IN 46143 [email protected]
William B. Powers 121 Monument Circle - Suite 518 Indianapolis, IN 46204 [email protected]
Rick D. Doyle, Esq. Law Office of Rick Doyle 4561 Hickory Ridge Blvd. Greenwood, IN 46143 [email protected]
Kenneth Schifman Director Government Affairs 6450 Sprint Parkway Overland Park, KS 66251 [email protected]
Attachment B

Clayton C. Miller Stoll Keenon Ogden PLLC 201 N. Illinois Street, Suite 1225 Indianapolis, IN 46204 [email protected]
Charles R. Mercer, Jr. CenturyLink 5320 Singleton Street Indianapolis, IN 46227 [email protected]
Robert E. Stewart Frontier Communications 224 W Exchange Owosso, MI 48867 [email protected]
Thomas J. Moorman WOODS & AITKEN LLP 2154 Wisconsin Avenue, N.W., Suite 200 Washington, D.C. 20007 [email protected]
Jack Phillips Director- Gov't and External Affairs Frontier Communications Corp. 14450 Burnhaven Drive Burnsville, MN 55306 [email protected]
Peter S. Kovacs PETER KOVACS LAW, P.C. 11650 Olio Road Suite 1000 PMB 275 Fishers, IN 46037 [email protected]
Kathy Buckley Verizon 4700 MacCorkle Ave, SE Box 3 Charleston, WV 25304 [email protected]
De O'Roark General Counsel - South Verizon One Verizon Place Alpharetta, GA 30004 [email protected]
Charles R. Mercer, Jr. 5523 Blairwood Drive Indianapolis, IN 46237 [email protected]
By: /s/ Jeremy L. Fetty Jeremy L. Fetty PARR RICHEY 251 N. Illinois Street, Suite 1800 Indianapolis, Indiana 46204 Telephone: (317) 269-2500 Facsimile: (317) 269-2514 E-mail: [email protected]
861634
Attachment B
STATE OF INDIANA
INDIANA UTILITY REGULATORY COMMISSION
IN THE MATTER OF THE COMMISSION’S ) TRIENNIAL REVIEW OF THE INDIANA ) CAUSE NO. 45064 UNIVERSAL SERVICE FUND )
PREFILED TESTIMONY OF LARRY S. LANDIS
ON BEHALF OF
INDIANA EXCHANGE CARRIER ASSOCIATION, INC.
Attachment B

Testimony of Larry Landis Indiana Exchange Carrier Association, Inc.
Page 1 of 14
IURC CAUSE NO. 45064 PREFILED TESTIMONY OF LARRY S. LANDIS
Q. WHAT IS YOUR NAME, TITLE, AND BUSINESS ADDRESS? A. I am Larry S. Landis. I was appointed to the Indiana Utility Regulatory
Commission (the “Commission”) in 2003 to fill an unexpired term, by the late
Governor Frank O’Bannon. I was reappointed to a full term by former Governor
Joe Kernan, and twice by former Governor Mitch Daniels. I also served during the
administration of former Governor Mike Pence, before retiring in 2014. I was
active with the National Association of Regulatory Utility Commissioners
(NARUC), serving on the Board for six years and also serving as Co-Chair of the
Washington Action Committee, NARUC’s liaison to the Federal legislative and
executive branches of government. I served in numerous capacities while on
NARUC’s Telecommunications Committee, including service on both of the FCC-
State Joint Boards and the FCC-State Joint Conference (the 706 Joint Conference)
on Advanced Telecommunications (“broadband”) of which I was State Chair. A
complete background may be found as Attachment 1 to this testimony.
Q. FOR WHOM ARE YOU APPEARING IN THIS PROCEEDING? A. I am appearing on behalf of Indiana Exchange Carrier Association, Inc. (“INECA”).
INECA, on behalf of its enumerated members,1 is a party to the Settlement Agreement
1 INECA’s membership includes: Bloomingdale Home Telephone Company, Inc.; Citizens Telephone Corporation; Clay County Rural Telephone Cooperative, Inc. d/b/a/ Endeavor Communications; Craigville Telephone Company Inc.; Daviess-Martin Rural Telephone Corporation d/b/a RTC Communications; Geetingsville Telephone Company Inc.; Hancock Rural Telephone Corporation d/b/a NineStar Connect; Ligonier Telephone Co., Inc.; Monon Telephone Company Inc.; Miles Communications, Inc. d/b/a Enhanced Telecommunications Corp.; Mulberry Cooperative Telephone Company, Incorporated d/b/a Mulberry Telephone Company; New Lisbon Telephone Company Inc.; New Paris Telephone Inc.; Northwestern Indiana Telephone Company Inc. d/b/a Nitco; Perry-Spencer Rural Telephone Cooperative Inc. d/b/a PSC; Pulaski White Communications, Inc. d/b/a Lightstream; Rochester Telephone Company Inc.; Southeastern Indiana Rural Telephone Cooperative Inc. d/b/a SEI Communications; Smithville Telephone Company, Incorporated d/b/a Smithville Communications; Swayzee Telephone Company, Inc. d/b/a Swayzee Communications Corp.; Sweetser Rural Telephone Company Inc.; TDS Telecom Companies (Camden Telephone Company Inc., Communications Corporation of Indiana, Communications Corporation of Southern Indiana, Home Telephone Company Inc., Home Telephone Company of Pittsboro Inc.,
Attachment B
Testimony of Larry Landis Indiana Exchange Carrier Association, Inc.
Page 2 of 14
(“Settlement Agreement”) on the Indiana Universal Service Fund (“IUSF”) filed on May
24, 2018, in this Cause.
Q. PLEASE PROVIDE THE BACKGROUND PROMPTING INECA TO FILE
DIRECT TESTIMONY IN THIS CAUSE.
A. The Commission’s March 17, 2004 Order in Cause No. 42144 approved a settlement
agreement that created the IUSF. The IUSF settlement agreement included a periodic
review of the IUSF on a triennial basis.
On March 21, 2018, in furtherance of the aforementioned review process, the
Commission issued an Order in Cause No. 45064, scheduling a prehearing conference
and defining a preliminary, but non-exhaustive issues list to be addressed in the context
of the 2018 Triennial Review.
Q. WHAT IS THE PURPOSE OF YOUR TESTIMONY? A. The purpose of my testimony is to respond to the questions posed in the
Commission’s order dated March 21, 2018.
Q. COULD YOU PLEASE PROVIDE A BRIEF OVERVIEW OF
DEVELOPMENTS IN THE TELECOMMUNICATIONS SECTOR OVER
THE PAST QUARTER CENTURY SINCE DIVESTITURE OF AT&T IN
1984?
A. In order to address the questions posed from the Commission in this proceeding, it is
useful to briefly review the recent history of state and federal regulation regarding the
obligation to achieve universal telecommunications service and to understand the
Merchants and Farmers Telephone Company d/b/a TDS Telecom-Hillsboro., S & W Telephone Company, Inc., Tipton Telephone Company Inc., Tri-County Telephone Company Inc., West Point Telephone Company, Incorporated); Washington County Rural Electric Telephone Cooperative Inc. d/b/a Tele-Media Solutions; and Yeoman Telephone Company Inc.
Attachment B
Testimony of Larry Landis Indiana Exchange Carrier Association, Inc.
Page 3 of 14
obligations that remain despite dramatic (and some would suggest radical) changes at the
Federal level.
The Telecommunications Act of 1996 (TA96)2 laid the framework for support necessary
to assure that all consumers, including “low-income consumers and those in rural, insular
and high cost areas, should have access to telecommunications and information services,
including interexchange services and advanced telecommunications and information
services (i.e., broadband), that are reasonably comparable to those services that are
provided in urban areas and that are available at rates that are reasonably comparable
to rates charged for similar services in urban areas.” 3
In today’s contentious political environment, it is important to note that there was not
only strong bipartisan support for the legislation, but there was near-unanimous support
among all segments of the telecommunications industry and allied sectors, with initiation
at the state level being primarily responsible for opening the door to support other
communication providers such as cable(notably here in Indiana). An important part of
that consensus was a recognition that true universal service required what might almost
be dubbed a covenant with the small rural companies and (to a lesser but significant
extent) with the larger (price cap) companies which likewise served rural areas.
For rural customers served by small, independent co-ops and investor-owned companies,
a construct was devised for the singular purpose of serving customers and prospects, and
for the networks that serve those customers, not for the benefit of the companies.
“Industry experts point to a distinction related to the concept of support rather than
subsidies. ‘Subsidies’ are, in the strictest sense, assistance to a troubled business or to an
economic sector to help the producer. [Universal Service Fund (IUSF)] is not
fundamentally an ‘assistance’ to help a struggling carrier or sector. In fact, wireline
carriers can often have successful businesses if they are able to concentrate their
2 Pub. LA. No. 104-104, 110 Stat. 56 (1996). 3 47 U.S.C. § 254(b)(3) (emphasis added).
Attachment B

Testimony of Larry Landis Indiana Exchange Carrier Association, Inc.
Page 4 of 14
operations on profitable services and customer clusters. However, state and federal
governments have chosen to ‘purchase’ another ‘product set’ in high cost regions, which
is customer service that otherwise would not be provided in those regions.”4
In order to meet the need for support to maintain and sustain service to the high cost,
truly rural, and uneconomic areas served by the rural local exchange carriers (RLECs),
policy makers devised a revenue system with three components, much like a three-legged
stool. The first source was earned revenue from customers for services provided. The
second source was USF funding, generated from a levy on long distance revenues. And
the third source was intercarrier compensation (ICC), payments made by the originating
carriers for long distance calls placed to customers of the rural local exchange carriers
(RLECs) and others, for delivering those calls to their customers.
While this construct was not perfect (for example, competition and other factors led to
long distance, originally viewed as a cash cow, increasingly becoming a commodity
characterized by decreasing margins), and while it became increasingly urgent to address
its problems, the challenge to reformers was to find a solution which generated relatively
stable funding to cover the total operation of those who served customers that were
uneconomic to serve, and to do so year in and year out.
The order of magnitude related to customers that are uneconomic to serve, which can be
seen clearly by the fact that while “…small rural carriers account for about 5% of the
U.S. telephone access lines but serve more than 40% of the land mass.”5 Even at the most
intuitive level, there is a glaring need to cover costs of service, given the decades-long
commitment to universal service.
4 Balhoff & Williams, LLC, White Paper: State USF New Rural Investment Challenges, 7 (June 2013), https://c.ymcdn.com/sites/www.wyotelassn.org/resource/resmgr/imported/State%20USF%20White%20Paper%20June%202013.pdf (emphasis added). 5 Id.
Attachment B
Testimony of Larry Landis Indiana Exchange Carrier Association, Inc.
Page 5 of 14
The same economic considerations which have discouraged Indiana’s RLECs from
building out broadband to the “truly rural” areas have provided a hefty disincentive to
competitive local exchange carriers (CLECs) from overbuilding in those areas, also
dissuading cable and wireless providers from building out on their own. Dispersion of
population (i.e., low population density), frequently combined with challenging terrain,
are equal opportunity disincentives to buildout and to competitive entry. It is not the
responsibility of any carrier or provider to deliberately undertake buildout for the sake of
universal service when there is a high likelihood of incurring serial losses, starting with
the cost of buildout and continuing with the annual cost of operation.
TA96 provided the first explicit legislation of a national universal service policy, with
significant reforms of universal service and intercarrier compensation following in 2000
and 2001.6
Recalling the significance of the three legs of the stool to the business model of the
RLECs, the “reforms” initiated by the FCC in October, 2011, as established in its
Connect America Fund, A National Broadband Plan for Our Future,7 dramatically
changed and some would argue, eviscerated the existing model.8
Buried in the 2011 USF/ICC Transformation Order establishing the Connect America
Fund (CAF) in the short term is a retreat from a core principle that all consumers,
including low-income consumers and those in rural, insular and high cost areas, should
have access to telecommunications and information services, including advanced
telecommunications and information services (i.e., broadband), that are reasonably
comparable to those services that are provided in urban areas and that are available at
rates that are reasonably comparable to rates charged for similar services in urban areas.
The FCC’s restatement of this basic principle without referencing a commitment to
6 See id. at 10-16. 7 Connect America Fund et al., WC Docket No. 10-90 et al., Report and Order and Further Notice of Proposed Rulemaking, 26 FCC Rcd 17663 (2011) (2011 USF/ICC Transformation Order and/or FNPRM), aff’d sub nom, In re: FCC 11-161, 753 F.3d 1015 (10th Cir. 2014). 8 See id. at 12-16.
Attachment B
Testimony of Larry Landis Indiana Exchange Carrier Association, Inc.
Page 6 of 14
reasonably comparable rates indicates a repudiation of one of the two basic principles
underlying universal service.
Still less obvious but no less serious is the dramatic step back from “reasonably
comparable services.” In the 2011 USF/ICC Transformation Order, the FCC defines
broadband as 4/1 (that is 4 megabits “down,” or to the user, and 1 megabits “up”),9 only
to subsequently redefine broadband as 25 megabits down and 3 megabits up at the
national level, an action which resulted in much of the early broadband buildout being
defined out of existence.10 Moreover, what constituted “broadband” was sector-
dependent; given relative capabilities at the time, differing speeds were required of
differing technologies.
Q. SHOULD THE COMMISSION CONFORM TO THE FCC’S CURRENT
DEFINITION OF SUPPORTED SERVICES, AS THE COMMISSION’S MARCH
21, 2018 ORDER SUGGESTS?
A. To do so would be premature, and quite possibly mean the abandonment of universal
service, and ultimately to cutoff of service to the truly rural. It is worth stating:
“State legislators and commissioners should assess the costs, benefits, risks and
alternative mechanisms of providing universal telecommunications service in
their states. Notably, where broadband does not exist at present and will not be
supported sufficiently, all terrestrial universal service funding – for voice and
broadband – will cease.”11
Moreover, because the ultimate goal of the 2011 USF/ICC Transformation Order is to
move to a single, seamless IP network, any customers who cannot be migrated to an IP
9 2011 USF/ICC Transformation Order at 94. 10 Federal Communications Commission, Archive of Released Broadband Progress Notices of Inquiry, available at https://www.fcc.gov/general/ archive-released-broadband-progress-notices-inquiry. 11 Id.
Attachment B
Testimony of Larry Landis Indiana Exchange Carrier Association, Inc.
Page 7 of 14
platform may well be denied all services, including voice, services to the disabled, 911
service, other numbering services…even basic dial tone.
“USF/ICC support benefitting rural customers served by larger price-cap carriers under
the Transformation Order could be reduced by an estimated 85-90% during the period
2012-2020, and by approximately 35% on average for those served by the RLECs.”12
In effect, the FCC has taken a Federal-state partnership in support of the urban-rural
covenant and converted it into yet another unfunded liability thrust upon the states,
leaving the states with a Hobson’s Choice of increasing support (and therefore
appropriations) for rural customers, or forcing the companies which have served them for
decades to cut off the truly rural among us.
Moreover, the FCC’s “solution” to broadband buildout has proven to be ill-conceived and
ill-informed. Scale and scope contribute to efficiency in major markets, which is why the
light regulatory touch worked well in urban areas. Such is not the case in “truly rural”
Indiana or America. This, coupled with a deeply flawed pricing strategy, is why nearly
two-thirds of the CAF one-time broadband buildout funding (with accompanying further
requirements) released by the FCC in 2012 was rejected by the carriers,13
Q. YOU MAINTAIN THAT THE FCC HAS ADOPTED POLICIES WHICH
HAVE CRIPPLED RURAL BUILDOUT OF BROADBAND THROUGH
UNIVERSAL SERVICE. ARE THERE OTHER EXAMPLES WHICH
WOULD SUGGEST THE FCC HAS CRIPPLED BROADBAND
PROPAGATION SINCE ADOPTION OF THE 2011 USF/ICC
TRANSFORMATION ORDER?
A. Fundamentally, given alternative investment options, a rational investor will choose to
invest first in those options which best meet the investment objectives of the investor and
12 Id. at 1. 13 Id. at 3.
Attachment B

Testimony of Larry Landis Indiana Exchange Carrier Association, Inc.
Page 8 of 14
conventionally, in those options which produce the highest return consistent with the risk
of the investment.
Translated into network investments, the RLECs (and for that matter, all broadband
providers) will build out first in those areas which are easiest to serve and which will
produce the highest return. They will reserve for later those areas which are more costly
to build out.
In the wake of the issuance of the Transformation Order, AT&T Chairman Randall
Stephenson announced that going forward, his company – the largest wireline carrier in
the US – can no longer justify investing in 25% of its landline network because of high
costs, presumably without USF support.
Mr. Stephenson’s announcement is a mixed bag. It suggests a retreat from the goal of
universal service, with the 25% of AT&T’s customers’ needs being met with lesser
service, a step back from delivering comparable services at comparable prices, but note
that it does indicate that in an IP world at least some form of service will be continued.
Apart from corporate assurances such as those of AT&T, the Transformation Order
provides no such assurance. The reality is that Mr. Stephenson’s action is a rational
response to the deeply flawed Transformation Order.
Verizon, on the other hand, has dramatically stepped back from service to rural, insular
and high cost areas, through several sales of its land lines, each involving one or more
states, for the most part outside Verizon’s RBOC territory. With the sole exception of the
package sale of several states to Frontier, primarily consisting of former GTE territory,
every other acquiring company either wound up in bankruptcy reorganization or being
acquired, at least in part due to issues of deferred maintenance and investment. While one
can take umbrage at this behavior and whether the necessary investment needs were fully
disclosed, Verizon’s action can be defended as an earlier recognition of the burden of
Attachment B

Testimony of Larry Landis Indiana Exchange Carrier Association, Inc.
Page 9 of 14
maintaining and enhancing service to the “truly rural,” and to the diminished likelihood
of continued funding under the legacy USF and intercarrier compensation structure.
Q. FROM 1996 THROUGH 2010, WE SAW EXTENSIVE INVESTMENTS IN
THE BUILDOUT OF BROADBAND UNDER THE “LIGHT
REGULATORY TOUCH” THEN IN PLACE, WHICH RECEIVED
STRONG BIPARTISAN SUPPORT. THIS OCCURRED THROUGHOUT
THE STATE IN ALL BUT THE MOST RURAL, MOST DIFFICULT TO
REACH AREAS. WHAT IS THE OUTLOOK FOR COMPLETING THE
PROCESS?
A. Candidly, the outlook is not good. The recent policies of the FCC have hurt rather than
facilitated broadband buildout. In 2010, then-FCC Chair Julius Genachowski proposed a
dramatic reformulation of “net neutrality,” including a retrograde reclassification of
broadband under Title II (of TA96) common carrier telecommunications service. That
policy was ultimately implemented as the FCC’s 2015 Open Internet Order14 under
subsequent FCC Chair Tom Wheeler, thereby abrogating a 20-year bipartisan regulatory
framework known as “light touch.” This action set off a firestorm of debate over, among
other things, whether the result would be to stifle capital expenditures on broadband.
Several studies purported to examine whether such expenditures had risen or fallen. Only
two studies, both by the same author,15 address the “…relevant question…not [emphasis
in original] whether capital expenditures rise or fall, but rather whether such
expenditures are below the level [where] they would have been “but for” [emphasis in
original] the regulatory intervention.”
“…[R]esults indicate that investment in total fixed assets would have been about $30
billion more annually “but for” reclassification. Investment in equipment and property 14 Federal Communications Commission, FCC-15-24, In re Protecting And Promoting the Open Internet (Mar. 12, 2015) (2015 Open Internet Order). 15 George S Ford Ph.D., Chief Economist of the Phoenix Center for Advanced Legal and Economic Public Policy Studies, Net Neutrality, Reclassification and Investment: A Counterfactual Analysis, Phoenix Center Policy Perspective No. 17-02 (April 2017) and A Further Analysis, Phoenix Center Policy Perspective No.17-03 (May 2017) available at http://phoenix-center.org/perspectives.
Attachment B

Testimony of Larry Landis Indiana Exchange Carrier Association, Inc.
Page 10 of 14
would have been $20 billion more “but for” reclassification. Over the five-years since
2010 [for which data is available] total investment is down $150 billion and investment in
equipment and property, which excludes intellectual property, is down $100 million.”16
Q. SHOULD WE USE IUSF FUNDING TO UNDERWRITE BROADBAND
BUILDOUT?
A. As has already been indicated, the cost of operation in the service areas of the RLECs is a
multiple of the cost of delivering service in urban, suburban and even exurban areas.
Within the total service area, in the cities and towns served by the RLECs costs are
significantly less than in the truly rural areas. But offsetting that advantage of lower costs
in the cities and towns is the fact that the RLECs generally have at least one competitor
(cable) in those “less rural” areas. As has been the case in larger markets, margins have
been competed away, to the benefit of ratepayers. But for the rurals, that means that
earned income is declining as customers are lost to competition in their core markets and
revenues per customer decline due to competitively-driven lower prices.
The revenue provided by USF, IUSF and intercarrier compensation is necessary if the
rural providers are to remain solvent, let alone profitable. Funding to build out in those
truly rural areas is meaningless if it is essentially a matter of taking money out of one
pocket and putting it into the other...it does no good to build out those last miles if the
company is slipping into bankruptcy because the FCC is starving it of the funds
established to sustain the network that is the backbone of the urban/rural covenant. And
in some of the very rural areas, there are no other viable options for broadband.
Most of INECA’s members are currently operating at significantly below their nominally
authorized rate of return; some are currently losing money, as demonstrated in
Attachment 4.
16 Id. at 4.
Attachment B
Testimony of Larry Landis Indiana Exchange Carrier Association, Inc.
Page 11 of 14
Because of this (1) it cannot be expected that the FCC re-evaluate its broadband policies,
and (2) the State of Indiana needs to find an alternate mechanism other than IUSF to fund
the capital expenditures to complete broadband buildout.
Q. SHOULD THE METHOD OF DIRECTING SUPPORT BE MODIFIED, SO
THAT “HIGH COST AREAS” ARE DEFINED AT THE CENSUS BLOCK
LEVEL RATHER THAN ON THE BASIS OF THE INCUMBENT LOCAL
EXCHANGE CARRIER’S (ILEC’S) SERVICE TERRITORY?
A. It is possible that IUSF could be distributed on a more granular basis than the total
service territory, but that should be done based on network logic rather than arbitrary
political designations (census tracts). Keep in mind that high-cost support was
specifically designed to support a universally-available network. Any unserved areas are
going to be built out, regardless of the technology employed, with the existing network in
mind, so that connections are as efficient as possible.
Since the FCC has abandoned its commitment to support of efficient networks in favor of
piecemeal support, and it falls to the State of Indiana to take up the unfunded liability
pushed on the states by the FCC, it makes sense to allocate our resources based on the
architecture of efficient networks built over several decades.
Q. SHOULD THE IUSF EMULATE THE FCC IN DISBURSEMENT OF
FUNDS TO SUPPORT BUILDOUT BY WILLING PROVIDERS – I.E.,
RURAL ELECTRIC COOPERATIVES, CABLE COMPANIES, CLECS?
A. In a word, no. Over the last several years, the FCC has repeatedly demonstrated its
ineptitude at estimating the cost of buildout to unserved areas. The census tract is not a
particularly useful geographic variable.
Given the collective expertise of the parties to this Cause, the Commission could create a
subdocket or a separate docket to design a simpler and less costly approach for selecting
participants, in the event the Commission chooses to emulate the FCC’s practice. Given
Attachment B

Testimony of Larry Landis Indiana Exchange Carrier Association, Inc.
Page 12 of 14
the FCC’s challenges in the CAF-1 proceeding, the track record is not encouraging. IUSF
should focus on assuring a reasonable return to RLECs that meet qualifying test
requirements.
Q. SHOULD THE IURC ADOPT THE RATEMAKING PROCESS OUTLINED IN
THE FCC’S RATE OF RETURN ORDER (FCC 16-37 RELEASED MARCH 30,
2016) TRANSITIONING THE RATE OF RETURN TO 9.75%?
A. No. The action of the FCC, measured against virtually universal procedures for
establishing a rate of return, is suspect. The roots of the Rate-of-Return Reform Order
are to be found in the FCC’s action capping funds available for the high cost fund shortly
prior to the issuance of the Transformation Order. This action was taken without effort to
determine whether the capped amount was “…sufficient to support networks and services
in rural regions.”17
The Rate of Return Reform Order was actually driven by the cap on funding. Since there
were not sufficient funds available to meet the demonstrable needs, the FCC acted to cut
the rate of return.
The FCC’s contention that the cost of capital has fallen is not even remotely defensible.
Assuming, arguendo, that 11.25% (the prevailing Federal rate) was correct when the
ILECs’ costs were spread over the entirety of communications users (as with water,
natural gas and electric utilities), enjoyed monopoly status with no competitive risk or
exposure to revenue being competed away, when volatility was markedly lower, the
regulatory environment was stable-to-evolutionary and predictable… to suggest that
today’s environment warrants a lower rate of return is quite simply disingenuous.
Should the IURC adopt the FCC’s approach and rate of return? At a minimum, the
current 11.5% rate should stand.
17 Michael J Balhoff, CFA, Testimony Before the Senate Committee on Commerce, Science and Transportation, Subvommittee on Communications, Technology, Innovation and the Internet, 2 (June 20, 2017).
Attachment B
Testimony of Larry Landis Indiana Exchange Carrier Association, Inc.
Page 13 of 14
It would be difficult to overstate the importance of this issue. For this reason, with his
permission, I have appended Attachment 2, inclusive of the Balhoff’s education and
business background, prefiled opening testimony, and rebuttal testimony, representing
testimony before the Senate and in a similar California proceeding, prepared by Michael
Balhoff, CFA. Mr. Balhoff is perhaps the pre-eminent analyst and student of rural
finance. Mr. Balhoff is associated with two entities, Balhoff & Williams, a consultancy;
and Charlesmead Advisors, LLC, an investment banking firm.
In addition to examining the rate of return issue through rate-setting models, Mr. Balhoff
brings a confirming perspective as an investment banker intimately involved with M&A
in the communications sector. In his Senate testimony, he notes that “…valuations of
rural telephone companies have demonstrably collapsed from ten years ago when rural-
carrier sales were valued at approximately eight times each dollar of operating cash flow
[EBITDA]. Since then, the valuations have settled generally between 4.5 and 5.5 times
operating cash flow….investors perceive new risks that have caused a startling
contraction of 30%-40% in value.”18 As Mr. Balhoff persuasively argues, the best
indicator of value is the price agreed to by a willing buyer and willing seller.
But it gets worse. Many, probably most, RLECs are earning significantly below the
authorized rate of return…not, as is often the case with other utility sectors, by 50 to 150
basis points, but by half or more of their FCC-set rate of return.
At a time when the remaining unserved areas will be the most difficult and costly to build
out, and when actions of the FCC in the last 5 years have created a climate of greater
instability and uncertainty than at any time in a generation, it makes little sense to reduce
the proposed rate of return solely based on the FCC’s actions. Reducing the rate-of-
return would compound the damage done by the FCC. The rate-of-return should not be
adjusted below the authorized rate of return set in simpler, more stable and more
predictable times.
18 Id. at 5.
Attachment B

Testimony of Larry Landis Indiana Exchange Carrier Association, Inc.
Page 14 of 14
In conclusion, in addition to his Senate testimony (Attachment 2), I would direct your
attention to Mr. Balhoff’s prefiled testimony dated September 1, 2015, at pages 49-71,
for those interested in a detailed dissection of the FCC order, attached hereto as
Attachment 3.
Q. DOES THIS CONCLUDE YOUR TESTIMONY?
A. Yes
Attachment B

VERIFICATION
The undersigned affirms under the penalties of perjury that the facts stated in the foregoing testimony are true to his best information and belief.
Attachment B
Attachment No. 1 IURC Cause No. 45064
Indiana Exchange Carrier Association, Inc. Page 1 of 1
Updated: June, 2013
Larry S. Landis, Commissioner Emeritus Indiana Utility Regulatory Commission
Narrative Biography
Larry S. Landis was founder and President of Marketrends, Inc., a marketing/communications company in
Indianapolis; and co-founder of American Grassroots, LLC, prior to being appointed to the Indiana Utility Regulatory Commission in January 2003 by Indiana’s late Governor Frank O’Bannon (D-IN), and reappointed to a full term by former Governor Joe Kernan (D-IN) in July of 2004. In December of 2007 and 2011, he was appointed to consecutive full terms by former Governor Mitch Daniels (R-IN). He retired from the Commission in 2014.
In August, 2003, he was named to the National Association of Regulatory Utility Commissioners’ (NARUC) Telecommunications Committee, and was active in a number of roles on that Committee. Landis served on NARUC’s Legislative Task Force, charged with developing recommendations for a rewrite of the nation’s telecommunications laws; he was Vice Chair of NARUC’s Intercarrier Compensation Task Force.
In January of 2005, Landis was named to the Federal-State Joint Conference on Advanced Telecommunications Services. In November of 2005 he was also appointed to the Federal-State Joint Board on Universal Service, serving two terms (2005-2011). In 2012, he was appointed to the Federal-State Joint Board on Jurisdictional Separations. In May of 2008, Commissioner Landis was appointed to the NARUC Board of Directors, and to a second term in 2010. In 2013, he was appointed Co-Chair of NARUC’s Washington Action Committee (WAC).
Landis was also a member of the Advisory Board of the Financial Research Institute at the Trulaske
College of Business, University of Missouri/Columbia of which he was Vice Chair in 2009-2010 and Chair in 2010-11; and is a member of the Society of Utility and Regulatory Financial Analysts (SURFA).
He worked on the campaigns of former Indianapolis Mayor and Indiana’s longest serving Senator, Richard
G. Lugar (1967); former Senate candidate from Indiana and first Administrator of the U.S. Environmental Protection Agency William D. Ruckelshaus (1968); the late former Indiana Governor and former U.S. Health and Human Services Department Secretary Dr. Otis R. Bowen; and former Indiana Secretary of State and Congressional candidate William N. Salin (both in 1972). He also served as Assistant to the Mayor in the Lugar administration from 1969-71.
Other career highlights include 15 years of service with three separate Indianapolis advertising agencies.
Landis also served four years as Vice President of Corporate Advertising for American Fletcher National Bank, now part of JP Morgan Chase. In 1999 he co-founded American Grassroots LLC, established to introduce new “grassroots” communications technologies to member organizations (such as trade associations), public policy organizations, political campaigns and utilities. These solutions empowered users to engage, notify, mobilize, and activate members and/or customers through more cost-effective, more efficient grassroots telecommunications tools. In all, he spent 30 years in the private sector prior to being named to the IURC.
A cum laude graduate of Wabash College (1967) with a double major in political science and economics,
Landis also pursued graduate work in organizational theory and political behavior at the University of North Carolina/Chapel Hill and at Indiana University. Born in Princeton, NJ, Landis grew up in Goshen, Indiana. He and his wife Carol L. (Butz) Landis are the parents of an adult son, Christopher, who resides with his wife Heather and their daughters Lauren, Anna and Emily in nearby Carmel.
Attachment B
STATEMENT OF MICHAEL J. BALHOFF, CFA
CHARLESMEAD ADVISORS, LLC
SENIOR PARTNER AND COFOUNDER
BEFORE THE
SENATE COMMITTEE ON COMMERCE, SCIENCE ANDTRANSPORTATION
SUBCOMMITTEE ON COMMUNICATIONS, TECHNOLOGY,INNOVATION, AND THE INTERNET
JUNE 20, 2017
Attachment No. 2 IURC Cause No. 45064
Indiana Exchange Carrier Association, Inc. Page 1 of 173
Attachment B

HEARING
UNIVERSAL SERVICE FUND AND RURAL BROADBAND INVESTMENT
Chairman Wicker, Ranking Member Schatz, and distinguished Members of the CommerceCommittee. Thank you for inviting me to testify today regarding the “Universal Service Fund andRural Broadband Investment.”
My name is Michael J. Balhoff. I am a senior partner at Charlesmead Advisors, LLC, which is aBaltimore based investment banking firm that I co founded with two partners in June 2011. Weprovide merger and acquisition as well as valuation related services to companies in thetelecommunications industry, notably the rural telecommunications industry. I have providedindependent financial analysis and advice in the telecommunications industry for nearly 30 years.My education and business background are found in Appendix 1, attached to this testimony.
I would like to address two questions in this hearing.
The first concerns whether the universal service fund (USF)—more recently known as the“Connect America Fund” (CAF)—is sufficient to support networks and services required inrural regions.
The second question concerns how to improve the targeting of USF/CAF monies to betterachieve the policy goals associated with those programs.
I. IS USF/CAF SUFFICIENT TO SUPPORT NETWORKS AND SERVICES IN RURALREGIONS?
The simple answer is “no.” Setting aside the shortfall for larger price cap carriers for themoment, I believe that small rate of return (RoR) carriers are insufficiently funded,possibly by $260 million annually. I have two comments in support of my response.
A. THE FCC ITSELF ACKNOWLEDGES THAT THE FUND, AS CURRENTLYCONSTITUTED TO SUPPORT SMALLER CARRIERS, DOES NOT HAVESUFFICIENT FUNDING.
The FCC authorizes the actual payments of universal service funding through theUniversal Service Administrative Company (USAC). Pursuant to the FCC’s March2016 Rate of Return Reform Order, USAC recently released its calculation of a budgetdriven reduction in payments to small RoR carriers for fiscal year mid 2017 to mid
Attachment No. 2 IURC Cause No. 45064
Indiana Exchange Carrier Association, Inc. Page 2 of 173
Attachment B

2018. I summarize the calculation in a table below. The calculation preserves paymentsto Alaska carriers, to carriers that have chosen to receive Alternative Connect AmericaCost Model (ACAM) funding (albeit at levels lower than the original offer as I willexplain below), and to carriers that are eligible for certain intercarrier support.
Because of a cap of $2 billion on annual support for small RoR carriers—a cap set in the2011 Transformation Order—funding for RoR carriers that continue to receive supportthrough rate of return mechanisms will be adjusted lower by the full amount of theshortfall.
The $2 billion cap was determined based on 2011 levels of support approved for RoRcarriers. To the best of my knowledge, no analysis was performed to determine that $2billion was sufficient in 2011 or that the funding would be sufficient in future years. Iemphasize this important point because the Telecommunications Act of 1996 presentsseveral fundamental principles for the Act, including at Section 254(b)(5) where the lawstated that “[t]here should be specific, predictable and sufficient Federal and Statemechanisms to preserve and advance universal service.” (Emphasis added.)
Because the statute mandates that USF should be sufficient, a question has been posedabout whether there is a fundamental inconsistency if “sufficiency” was not, and is not,assessed?
As noted above, the shortfall in payments is borne, in this calculation, by the small RoRcarriers (those that did not elect the ACAM). Parenthetically, I note that small carrierswith specified broadband buildouts to at least 90% of their service region could notaccept the ACAMmodel and were compelled—due to their successful deployments—to remain under the rate of return regime.
The calculated shortfall in available funding for mid year 2017 to mid year 2018 resultsin a $173 million, or a 12.4%, RoR reduction in “allowed support” in the upcomingfiscal year—2017 to 2018. The shortfall appears to be prima facie evidence that thefunding level—once assumed appropriate for 2011—is now insufficient for the smallercarriers. This upcoming adjustment follows on the reduction for smaller carriers in thefirst half of calendar year 2017 when the FCC cut CAF Broadband Loop Support (BLS)by $80 million, again to remain within the 2011 based budget.
The FCC is not simply reducing funding for carriers that remain under rate of return.The FCC determined “budget” is also affecting ACAM carriers. Even the carriers thataccepted the ACAM are not receiving the support offered in the initial proposal lastyear. The reason is that the ACAM was oversubscribed.1 As a result, in December
1 The FCC reported on December 16, 2016 that 216 rate of return carriers submitted letters electing 274separate offers of ACAM support in 43 states.
Attachment No. 2 IURC Cause No. 45064
Indiana Exchange Carrier Association, Inc. Page 3 of 173
Attachment B
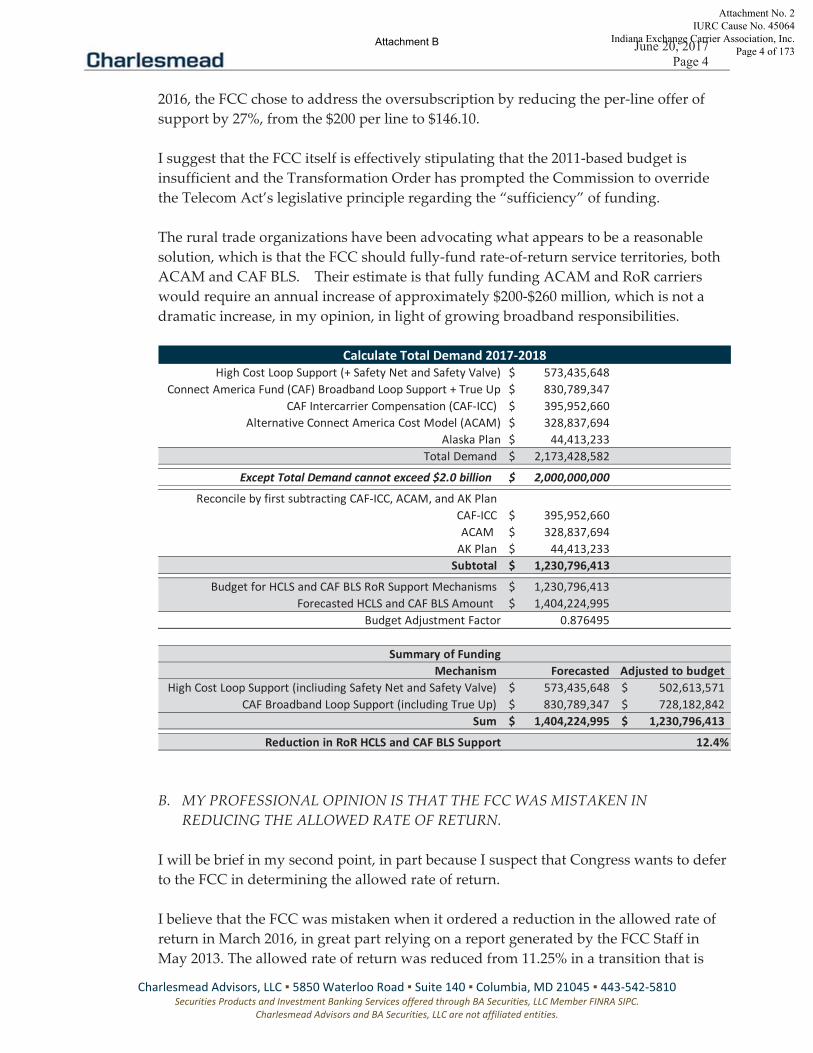
2016, the FCC chose to address the oversubscription by reducing the per line offer ofsupport by 27%, from the $200 per line to $146.10.
I suggest that the FCC itself is effectively stipulating that the 2011 based budget isinsufficient and the Transformation Order has prompted the Commission to overridethe Telecom Act’s legislative principle regarding the “sufficiency” of funding.
The rural trade organizations have been advocating what appears to be a reasonablesolution, which is that the FCC should fully fund rate of return service territories, bothACAM and CAF BLS. Their estimate is that fully funding ACAM and RoR carrierswould require an annual increase of approximately $200 $260 million, which is not adramatic increase, in my opinion, in light of growing broadband responsibilities.
B. MY PROFESSIONAL OPINION IS THAT THE FCC WAS MISTAKEN INREDUCING THE ALLOWED RATE OF RETURN.
I will be brief in my second point, in part because I suspect that Congress wants to deferto the FCC in determining the allowed rate of return.
I believe that the FCC was mistaken when it ordered a reduction in the allowed rate ofreturn in March 2016, in great part relying on a report generated by the FCC Staff inMay 2013. The allowed rate of return was reduced from 11.25% in a transition that is
Attachment No. 2 IURC Cause No. 45064
Indiana Exchange Carrier Association, Inc. Page 4 of 173
Attachment B

gradually implemented annually through a 25 basis point reduction until the ratesettles at 9.75% on July 1, 2021. The effect, obviously, is to reduce the potentialfunding available to small carriers.
I provided a long and carefully sourced analysis of the Commission Staff’s report onwhich the FCC based its decision.2 That analysis was filed before the California PublicUtilities Commission, in a proceeding in which I represented ten small Californiacarriers. I have attached that long testimony as Appendices 2 (September 2015 prefileddirect testimony) and 3 (March 2016 rebuttal testimony), in the event the Subcommitteewishes to review the issue.
Because I assume the Subcommittee is not interested in technical cost of capital theoryor capital asset pricing models, I will make a simpler comment about the trends in ruralcosts of capital, based on my real world investment banking experience.
Valuations of rural telephone companies have demonstrably collapsed from ten yearsago when rural carrier sales were valued at approximately eight times each dollar ofoperating cash flow. Since then, the valuations have settled generally between 4.5 and5.5 times operating cash flow, which means that investors perceive new risks that havecaused a startling contraction of 30% 40% in value. Certain fundamentals of the ruralbusiness have not changed significantly in that period as voice lines continue tocontract and broadband continues to expand, but other risks have increased includingcompetitive and regulatory developments. The effect is a valuation contraction that isunlikely to reverse in the foreseeable future.
The financial principle is straightforward. When values contract and expected futurecash flows are not appreciably changed, the explanation is that the cost of capital—thediscount rate applied to those cash flows—is rising.
I note that this analysis is similar to valuing a home in an area where there aredemographic changes. You may believe your house should attract a higher valuebecause you are aware of historical values and you can tabulate your actual investment;but, if the neighborhood has changed and other economic factors have created negativepressures, the best indicator of value is the price agreed to by a willing buyer andwilling seller. Whatever the FCC may argue from a theoretical point of view—and Idisagree with specific elements of those arguments as spelled out in the Appendices—the willing buyers and willing sellers are telling you that the cost of capital for ruralcarriers is up sharply as reflected in the deeply depressed prices. Respectfully, Irepresent that the FCC is not correct and is therefore assigning returns on capital thatare well below those indicated by the capital markets.
2 See Appendix 3, which includes the Balhoff Rebuttal Testimony, California Public Utilities Commission, A.15 09 005, filed March 11, 2016, notably at pages 63 80.
Attachment No. 2 IURC Cause No. 45064
Indiana Exchange Carrier Association, Inc. Page 5 of 173
Attachment B

Quite simply, rural carriers are no longer protected, monopoly utilities withgovernmental oversight and ready access to capital. It is nonsense to suggest that arural carrier’s cost of capital which was 11.25% in 1990 (the last time the rate wasadjusted before 2011) or in 2001 when the 11.25% was reaffirmed, should now be lowerwhen competition, technology and regulatory risks have dramatically increased.
If I am correct, then the shortfall outlined by USAC is not 12.4%, but well higher, as issupported in my California testimony.3 For further perspective, if the FCC hadmaintained an allowed rate of return at 11.25%—and again I believe it has gone higherstill—the shortfall for the RoR carriers in the upcoming year would be approximately16.2%, by my calculation. If the rate should be 12.00%, then this coming year’sshortfall is 21.5%.
I state again that I believe that RoR carriers are insufficiently funded.
II. MIGHT THERE BE IMPROVED TARGETING OF THE USF/CAF MONIES TOBETTER ACHIEVE THE POLICY GOALS ASSOCIATEDWITH THOSEPROGRAMS?
Yes. I respond again in two parts, one regarding small carriers and the secondregarding larger, price cap carriers.
A. ROR CARRIERS ARE INSUFFICIENTLY FUNDED BUT THE TARGETINGAPPEARS GENERALLY REASONABLE.
The FCC and USAC have generally done a good job in determining how the funding isallocated for small RoR carriers—based on investment and operating costs that arecarefully tracked. And the FCC models indicate, with some degree of accuracy, thatfunding levels are too low. I believe that the reason for the shortfall, in part, is theaccelerating pace of required upgrades to meet customer needs in a rapidly evolvingbroadband world, but the systems appear to me at this time to be generally reasonable.
B. MOST RURAL AREAS OF LARGE CARRIERS, PRICE CAP CARRIERS ARE OFTENWHERE THE PROBLEMS EXIST.
In the 2011 Transformation Order, the FCC stated at paragraph 21 that “[m]ore than 83percent of the approximately 18 million Americans that lack access to residential fixedbroadband at or above the Commission’s broadband speed benchmark live in areasserved by price cap carriers—Bell Operating Companies and other large and mid sizedcarriers.”
3 See Appendix 2, which is the prefiled testimony, September 1, 2015, notably at pages 49 71. An analysis ofthe implied cost of equity arising from transactional data is included from pages 62 to 71.
Attachment No. 2 IURC Cause No. 45064
Indiana Exchange Carrier Association, Inc. Page 6 of 173
Attachment B
This paragraph is stunning in making two important points. First, the FCC is statingthat 15 million Americans lack residential broadband access in larger carrier regions.For perspective, the large price cap carriers served a total of approximately 60 millionlines at that time; it can be inferred that the vast majority of large carrier rural lines areunderinvested, assuming that the large carrier broadband capable lines areconcentrated in non rural regions. Second, at most, 17% of the underinvested lines arein regions served by smaller carriers, which suggests that the former USF system wasworking with laudable effectiveness. This second insight of course raises the questionabout why the new system should further limit support to companies that have beeninvesting successfully to achieve policy goals.
Since the time of the Transformation Order, the FCC has attempted to address thisunderinvestment problem, notably in large carrier, price cap regions. TheCommission authorized initiatives such as the Connect America Fund II to offerincremental funding to build out to specified high cost service locations.
Still, my experience is that very little widespread investment is occurring in ruralregions of the large carriers. And the reason, in my opinion, is that many of thosecarriers are focused on more urban, more wireless, more enterprise, and moreinternational opportunities that provide superior opportunity for growth. The failureto invest in rural areas, therefore, may not explained by insufficient capital orinsufficient universal service funding in most cases, but by the strategic focus of thoselarger carriers which is dedicated to other “more productive” businesses.
This is the major “targeting” problem, in my opinion. Large carriers own substantialswaths of rural America, but are not likely to make significant financial commitments inthose areas. The largest carriers have major other responsibilities, which are not inrural regions in any state. To illustrate, the table nearby indicates that the large carriersin Mississippi have the greatest number of high cost rural properties—150,000 in thestate—compared with small carriers that serve a total of 67,000 lines in the state.4 Thetable summarizes state by state how that illustration is the rule rather than theexception as the high cost locations and extremely high cost locations where large,price cap carriers are the providers of service are generally larger than the number oflines served by small carriers (rural local exchange carriers). Again, I contend thosesmaller carriers are investing in rural America at approximately appropriate levels. Ifthe FCC is right that large carriers are underinvesting—and I think it is correct—thenthe problem of targeting is not a capital allocation issue. It is a problem that isexplained by the fact that the wrong carriers own those properties.
4 USAC at https://usac.org/hc/rules and orders/rate of return reform order.aspx. See, also,https://apps.fcc.gov/edocs_public/attachmatch/DA 15 509A1_Rcd.pdf andhttps://apps.fcc.gov/edocs_public/attachmatch/DA 16 929A1_Rcd.pdf. Note that the column for large,price cap carriers includes only FCC designated high cost or extremely high cost locations, not the totalnumber of lines served by the large carriers in the states. The rural local exchange carrier (RLEC) columnprovides the total number of lines served by RLEC, that is, RoR carriers, in the state.
Attachment No. 2 IURC Cause No. 45064
Indiana Exchange Carrier Association, Inc. Page 7 of 173
Attachment B
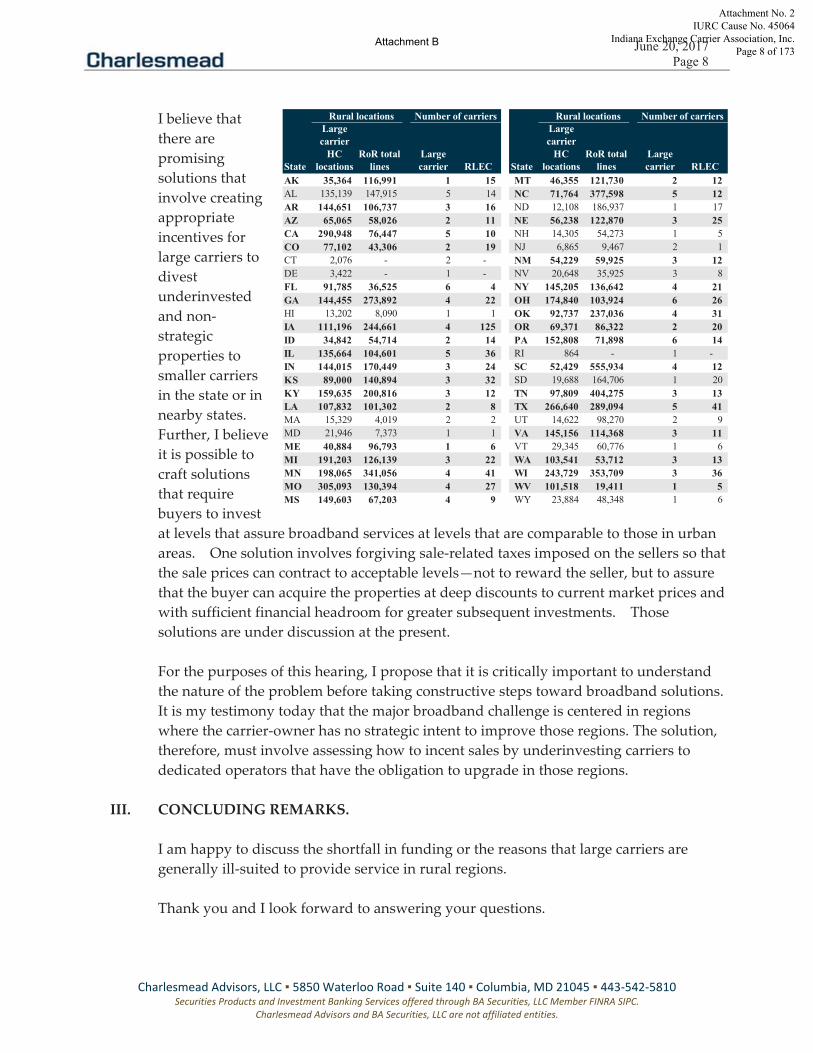
I believe thatthere arepromisingsolutions thatinvolve creatingappropriateincentives forlarge carriers todivestunderinvestedand nonstrategicproperties tosmaller carriersin the state or innearby states.Further, I believeit is possible tocraft solutionsthat requirebuyers to investat levels that assure broadband services at levels that are comparable to those in urbanareas. One solution involves forgiving sale related taxes imposed on the sellers so thatthe sale prices can contract to acceptable levels—not to reward the seller, but to assurethat the buyer can acquire the properties at deep discounts to current market prices andwith sufficient financial headroom for greater subsequent investments. Thosesolutions are under discussion at the present.
For the purposes of this hearing, I propose that it is critically important to understandthe nature of the problem before taking constructive steps toward broadband solutions.It is my testimony today that the major broadband challenge is centered in regionswhere the carrier owner has no strategic intent to improve those regions. The solution,therefore, must involve assessing how to incent sales by underinvesting carriers todedicated operators that have the obligation to upgrade in those regions.
III. CONCLUDING REMARKS.
I am happy to discuss the shortfall in funding or the reasons that large carriers aregenerally ill suited to provide service in rural regions.
Thank you and I look forward to answering your questions.
Attachment No. 2 IURC Cause No. 45064
Indiana Exchange Carrier Association, Inc. Page 8 of 173
Attachment B

Appendix 1—Bio of Michael J. Balhoff, CFA
Michael Balhoff is a Senior Partner and co founder of Charlesmead Advisors, LLC, and isManaging Partner at Balhoff & Williams, LLC, a professional services firm that provides financialregulatory consulting and advisory services to companies, investors and policymakers in thecommunications and energy industries.
Before founding Charlesmead Advisors and the predecessor firm to Balhoff & Williams, Mikeheaded the Technology and Telecommunications Equity Research Group at Legg Mason and, inthe final seven of his sixteen years as a senior analyst at Legg Mason, he covered equities in theincumbent local exchange carrier industry.
Prior to joining Legg Mason in 1989, Mike taught as a graduate and undergraduate teacher. Mikehas a doctorate in Canon Law and four master s degrees, including an MBA concentration financefrom the University of Maryland. He is a CFA charterholder and is a member of the BaltimoreSecurity Analysts Society. Mike has been named in six annual awards as a Wall Street Journal AllStar Analyst for his recommendations on the Telecommunications industry. His coverage oftelecommunications, and especially rural telecommunications, was named by Institutional Investormagazine as the top telecommunications boutique in the country in 2003.
Mike is a Registered Representative of and Securities Products are offered through BA Securities,LLC Member FINRA SIPC. Any testimonial or endorsement may not be representative of theexperience of other customers and is no guarantee of future performance or success.
Contact Information:
Michael J. Balhoff, CFASenior PartnerCharlesmead Advisors, LLC5850 Waterloo Road, Suite 140Columbia, MD 21045Cell: 410 984 8400Office: 443 542 5810Fax: 443 542 [email protected]
Attachment No. 2 IURC Cause No. 45064
Indiana Exchange Carrier Association, Inc. Page 9 of 173
Attachment B
Appendix 2—California Prefiled Testimony
of
Michael J. Balhoff, CFA
Attachment No. 2 IURC Cause No. 45064
Indiana Exchange Carrier Association, Inc. Page 10 of 173
Attachment B
Page 1 of 79
BEFORE THE PUBLIC UTILITIES COMMISSION
OF THE STATE OF CALIFORNIA
Application ofCalaveras Telephone Company (U 1004 C)Cal-Ore Telephone Co. (U 1006 C)Ducor Telephone Company (U 1007 C)Foresthill Telephone Company (U 1009 C)Kerman Telephone Co. (U 1012 C)Pinnacles Telephone Co. (U 1013 C)The Ponderosa Telephone Co. (U 1014 C)Sierra Telephone Company, Inc. (U 1016 C)The Siskiyou Telephone Company (U 1017 C)Volcano Telephone Company (U 1019 C)for a Determination of Applicants’ Cost ofCapital for Ratemaking Purposes_______________________________________
))))))))))))))
Application ____________________
(Filed September 1, 2015)
PREFILED OPENING TESTIMONY
OF MICHAEL J. BALHOFF
ON BEHALF OF THE APPLICANTS
Attachment No. 2 IURC Cause No. 45064
Indiana Exchange Carrier Association, Inc. Page 11 of 173
Attachment B
Page 2 of 79
1047102.2
I. Introduction and Purpose1
Q. Please state your name and position for the record.2
A. My name is Michael J. Balhoff. I am Managing Partner of Balhoff & Williams, LLC3
(“B&W”), and my business address is 5850 Waterloo Road, Suite 140, Columbia,4
Maryland 21045. I am also Senior Partner of Charlesmead Advisors, LLC5
(“Charlesmead”), and Charlesmead has the same business address as B&W.6
Q. What services do B&W and Charlesmead provide?7
A. B&W provides advisory services, including financial and regulatory consulting. Our8
clients are various telecommunications, cable television, and energy companies.9
B&W previously was known as Balhoff & Rowe, LLC, and then Balhoff, Rowe &10
Williams, LLC. The firm changed its name to reflect the active partners, but the11
services of the firm have remained consistent since the company was established in12
2004. With two other partners, I also co-founded Charlesmead in June 2010 to13
provide investment banking services to telecommunications companies. My services14
in this proceeding are provided through B&W.15
Q. Please describe your relevant educational and professional background.16
A. I have a doctorate and four masters degrees, including an M.B.A., with a concentration17
in finance, from the University of Maryland. I am a Chartered Financial Analyst and18
am a member of the Baltimore Security Analysts Society. During a period of 16 years,19
I was a senior equity analyst and Managing Director with responsibility for leading the20
telecommunications and technology sell-side equity research group at Legg Mason21
Wood Walker, Inc., which was the wholly-owned capital markets division of Legg22
Mason, Inc. (“Legg Mason”), headquartered in Baltimore, Maryland. In that role, I23
Attachment No. 2 IURC Cause No. 45064
Indiana Exchange Carrier Association, Inc. Page 12 of 173
Attachment B

Page 3 of 79
1047102.2
staffed and supervised a team of sell-side equity analysts providing research coverage1
of technology and telecommunications companies. With respect to regulated2
companies, I supervised and provided research coverage of incumbent local exchange3
carriers (“ILECs”), long-distance providers, and competitive local exchange carriers.4
Over the last seven years of my time at Legg Mason, I was also the primary analyst5
providing research coverage of local exchange telephone companies, including the6
regional Bell operating companies and publicly-traded rural telephone companies. My7
practice at Legg Mason was recognized notably for detailed coverage of rural8
telephony and the specific questions that arise related to the financial effects of9
regulation on equity securities in that sector. My more extensive resume, including10
publications, presentations, and testimonies, is included as Exhibit MJB - 1.11
Q. On whose behalf are you offering testimony in this proceeding?12
A. I am offering testimony on behalf of ten small, rural California ILECs in this13
proceeding. The rural ILECs are Calaveras Telephone Company, California-Oregon14
Telephone Co., Ducor Telephone Company, Foresthill Telephone Co., Kerman15
Telephone Company, Pinnacles Telephone Co., The Ponderosa Telephone Co., Sierra16
Telephone Company, Inc., The Siskiyou Telephone Company, and Volcano Telephone17
Company. I understand that the companies generally refer to themselves as the18
“Independent Small LECs.”19
Q. What is your relationship with the companies?20
A. I have no current relationship with any of these companies except that they have asked21
me to analyze the appropriate cost of capital for them. Prior to this work, I have not22
had any relationship with these companies.23
Attachment No. 2 IURC Cause No. 45064
Indiana Exchange Carrier Association, Inc. Page 13 of 173
Attachment B
Page 4 of 79
1047102.2
Q. Have you appeared before the California Public Utilities Commission1
(“Commission”) in any other proceedings?2
A. No, I have not. However, I have provided regulatory testimony concerning3
telecommunications matters before the Regulatory Commission of Alaska, the Iowa4
Utilities Board, the Public Utility Commission of Texas, the Vermont Public Service5
Board, the New Hampshire Public Utilities Commission, and the Maine Public6
Utilities Commission.7
II. PURPOSE AND SUMMARY OF TESTIMONY8
Q. What is the purpose of your testimony in this proceeding?9
A. I have been asked to provide testimony addressing cost of capital related to the10
Independent Small LECs in connection with an application to be submitted on11
September 1, 2015 to this Commission. In D.15-06-048, the Commission ordered the12
Independent Small LECs to initiate a consolidated proceeding where the issue of Cost13
of Capital (“COC”) would be examined for each carrier.1 I understand that the results14
of the COC proceeding are to be applied in the next cycle of General Rate Cases15
(“GRCs”) to take place generally from 2015 through 2019. My testimony is focused16
on estimating an appropriate cost of capital for application in these rate cases. I will17
provide recommendations regarding an appropriate cost of equity capital and related18
cost of capital metrics to aid the CPUC in determining an appropriate Weighted Cost19
of Capital (“WACC”) for each of the companies.20
21
1 See Decision 15-06-048 June 25, 2015 at 20.
Attachment No. 2 IURC Cause No. 45064
Indiana Exchange Carrier Association, Inc. Page 14 of 173
Attachment B

Page 5 of 79
1047102.2
Q. What are your specific qualifications for evaluating cost of capital for rural1
telephone companies?2
A. As I explained above, at Legg Mason, I developed a financial specialization in the3
equities of rural telephone companies in addition to my broader telecommunications4
coverage. I have given numerous presentations to the National Association of5
Regulatory Utility Commissioners (“NARUC”) and appeared before Congressional6
and federal agency groups. Most recently, after the Federal Communications7
Commission’s (“FCC”) sweeping 2011 reforms of universal service and intercarrier8
compensation, I was invited to brief the Department of Agriculture’s Rural Utilities9
Service (“RUS”), the White House, the Secretary of Agriculture, and the FCC10
concerning the financial effects of those policy changes. On the basis of coverage of11
rural companies, my Legg Mason practice was named by Institutional Investor12
magazine as the top telecommunications financial analysis boutique in the country in13
2003. I was also honored to be named as a Wall Street Journal All-Star Analyst in six14
annual awards for the performance of my equity recommendations.15
Q. Please summarize your professional career after leaving Legg Mason.16
A. In 2004, I had the opportunity to co-found a company with Robert Rowe, who was17
chairman of the Montana Public Service Commission as well as former president of18
NARUC and former chairman of NARUC’s telecommunications committee. The19
professional focus at Balhoff, Rowe & Williams and at Charlesmead has been on rural20
telecommunications carriers and services. Our primary work today is investment21
banking-related as we represent buyers and sellers in the ILEC industry, advising in22
transactions involving the sales or purchases of entire companies, or advising23
Attachment No. 2 IURC Cause No. 45064
Indiana Exchange Carrier Association, Inc. Page 15 of 173
Attachment B
Page 6 of 79
1047102.2
regarding transactions involving segments of businesses such as wireless assets,1
towers, fiber transport, cable television operations and data centers. Our services2
require us to value telecommunications assets and advise managements and boards of3
directors regarding strategic opportunities.4
Q. What information did you review related to this testimony?5
A. I evaluated, among other sources, the procedural record in Commission Rulemaking6
11-11-007, prior cases involving cost of capital brought before the Commission,7
United States Supreme Court decisions related to cost of capital, orders of the FCC8
concerning rate-of-return matters, cost-of-capital resources related to telephone9
companies as compiled by Ibbotson/Morningstar2 and Duff & Phelps,3 as well as10
transactional data that we maintain at our firm, Charlesmead Advisors. I have also11
studied the financial reports of each of the Independent Small LECs, reviewing their12
capital structure and debt costs, with a focus on the last six years from 2009 through13
2014.14
15
16
2 In March 2006, Morningstar, Inc. completed its previously announced acquisition of Ibbotson Associates, aleading provider of asset allocation research and services. Ibbotson Associates was founded by ProfessorRoger Ibbotson in 1977, and expanded over time to compile and publish annual valuation data widely used bythe financial community. As of 2014, Morningstar no longer publishes the Ibbotson valuation materials,which, as of 2015, are included in the Duff & Phelps publications. Ibbotson/Morningstar still publishes itsClassic Yearbook with important financial information in support of valuation professionals. All the Ibbotsonand Duff & Phelps cited pages and tables are included in Exhibit MJB - 2.3 Duff & Phelps is a respected global valuation and corporate finance advisor focused on services includingcomplex valuation, dispute consulting, M&A and restructuring. The company publishes annual statisticalvaluation resources that are widely used by the financial community. All the Ibbotson and Duff & Phelps citedpages and tables are included in Exhibit MJB - 2.
Attachment No. 2 IURC Cause No. 45064
Indiana Exchange Carrier Association, Inc. Page 16 of 173
Attachment B
Page 7 of 79
1047102.2
Q. Please summarize your testimony.1
A. I recommend a cost of capital for the Independent Small LECs to be utilized for2
ratemaking purposes in the rate case cycle to take place from 2015 through 2019. My3
testimony is generally divided into the following sections:4
Approaches in calculating cost of capital. The initial section of this5
testimony outlines the theoretical framework for estimating the cost of capital,6
detailing the standard approaches for calculating a corporate cost of capital,7
including capital structure, cost of debt and cost of equity. I explain that the8
use of several cost-of-capital assessment methods in a proceeding such as this9
one allows the regulator or analyst to arrive at improved confidence that the10
conclusions are reasonable. Conclusions based on just one methodology or11
data source are less reliable. I emphasize that determinations of the cost of12
capital are not slavish applications of one formula or even several formulae,13
but are judgments arising from testing multiple inputs and thoughtful14
considerations of industry data. Accordingly, I begin with traditional valuation15
approaches, using the Buildup Method, which is a variation of the Capital16
Asset Pricing Model (“CAPM”), with a modification (using an average 1.0617
beta based on five ILECs) to make the industry-specific factor better match the18
Independent Small LECs’ industry. I then use several time periods and19
approaches to assess any variations in the results. Then I test those results20
based on transactional data to ensure their validity.21
Industry changes that affect the corporate cost of capital for small ILECs.22
The second section emphasizes that the Commission should assess industry23
Attachment No. 2 IURC Cause No. 45064
Indiana Exchange Carrier Association, Inc. Page 17 of 173
Attachment B
Page 8 of 79
1047102.2
forces to understand how those factors affect the companies and the degree to1
which those forces impose new and greater financial pressures. An analyst2
uses historical statistics with the assumption that the future may be like the3
past, but I explain that assumption should be tested because the future may be4
riskier or safer than the past, depending on the current or reasonably5
anticipated risk drivers in a given industry. Valuation and determinations of6
costs of capital always involve judgment. I provide data and arguments in7
support of the fact that the industry risks are not less—but demonstrably8
greater—than they were nearly two decades ago when the Commission settled9
on a presumptive 10% WACC for the ten Independent Small LECs. I also10
supply data from real-world mergers and acquisitions (“M&A”), which show11
that valuations have contracted sharply since the early 2000s, notably over the12
last five or six years, signaling that the rural ILEC cost of equity has been13
raised to a significant extent, almost certainly because of adverse changes in an14
industry undergoing a fundamental transformation from monopoly to15
competition and from a focus on voice telephony to a focus on broadband16
services. These data provide the rationale and a compelling confirmation of17
increased costs of equity over recent years. To be clear, while interest costs18
have declined recently, there is little question in reviewing the data that the net19
cost of equity has risen steeply in the last decade.20
Calculation of an appropriate range and estimate for equity costs. To21
calculate a cost of equity, I begin with the well-tested Buildup Method, which22
is conceptually the same in implementation as the CAPM, both of which are23
Attachment No. 2 IURC Cause No. 45064
Indiana Exchange Carrier Association, Inc. Page 18 of 173
Attachment B

Page 9 of 79
1047102.2
traditional valuation approaches. Using those methods, and by making1
appropriate adjustments for equity risk, industry-specific risk, and size risk, I2
identify an appropriate range for the Independent Small LECs’ equity costs.3
On the basis of the historical data, I estimate that a realistic range for the4
Independent Small LECs’ cost of equity is 17% to 22%, and I recommend5
18.5%, which I will show to be a conservative calculation. I also testify that an6
assessment of industry risks provides the Commission with a high degree of7
confidence that the cost of equity for the Independent Small LECs is8
substantially higher than it was eighteen years ago when the Commission set9
the 10% target WACC. Given the relatively low costs of equity that are often10
applied in public utility sectors, I recognize that some may initially be skeptical11
about a 18.5% equity cost estimate, but I am confident that it is reasonable for12
these companies and appropriate for adoption in this proceeding. If anything,13
the cost of equity I recommend may be lower than will be required to attract14
capital for investments in rural telecommunications infrastructure. As I explain15
above, I rely on multiple methodologies to test and re-test my findings, and16
then I check the results against M&A data in an approach that is rigorous,17
intellectually honest, and convincing. In this section, I also provide a summary18
of other premia that I have chosen not to add to my estimate, including premia19
for liquidity and marketability risks, in spite of the fact that there is significant20
authority for including those incremental adjustments. The data and the21
methodologies demonstrate that my proposed cost of equity in this proceeding22
is both responsible and conservative.23
Attachment No. 2 IURC Cause No. 45064
Indiana Exchange Carrier Association, Inc. Page 19 of 173
Attachment B
Page 10 of 79
1047102.2
Debt costs. There is evidence that the Independent Small LECs will have1
lesser access to debt capital in the future and that debt costs are likely to rise in2
the future. The average and median costs of debt in 2014 for the seven3
Independent Small LECs with debt on their balance sheets were 4.5% and4
4.8%, respectively. If the Commission wishes to use a target cost of debt to5
calculate a target WACC, I recommend the use of 5.5% as the cost for6
forward-looking debt. The interest rate is in line with Sierra Telephone’s7
current cost of debt and less than the 5.6% average for the AAA corporate8
monthly rate from January 1997 to June 2015. I will provide a full explanation9
for this recommendation below.10
Capital structure. I present the actual capital structures for each of the11
Independent Small LECs, and report that the 2014 equity ratios averaged12
70.1%. The capital structure ratios have remained relatively stable over recent13
years (e.g., there was a 68% average equity ratio five years ago in 2010). I also14
offer my opinion about how a hypothetical capital structure might be15
formulated, if the Commission were to use such an approach. I testify that it is16
my judgment that the appropriate capital structure is toward the high end of the17
Commission’s 1997 equity ratio “zone of reasonableness,” which was18
previously defined as 60% to 80%. It is my opinion that an imputed capital19
structure might reasonably incorporate equity percentages between 70% and20
80%, particularly as lenders and other investors have become more cautious21
about the industry. If the Commission chooses to use a target for the22
companies’ cost of capital, I recommend that the Commission use the equity23
Attachment No. 2 IURC Cause No. 45064
Indiana Exchange Carrier Association, Inc. Page 20 of 173
Attachment B

Page 11 of 79
1047102.2
and debt costs that are presented in this testimony as reasonable. In the event1
that the Commission seeks to set an overall rate of return for all companies, I2
have calculated a standardized WACC that assumes a 70% equity ratio (at the3
low end of the range I believe is reasonable for such a hypothetical figure), a4
cost of equity of 18.5% and a cost of debt of 5.5%, resulting in a WACC of5
14.6%. I test that WACC, using the underlying data and actual transactional6
prices over the last several years, to provide convincing support for the costs of7
equity and the proposed WACC that I present in this testimony. I demonstrate8
that M&A data are the most reliable test of “reasonableness” for valuations and9
hence for costs of equity, and those data confirm the conservative nature of the10
estimates that I calculate using the CAPM-related methodologies. The data11
from these various analyses are compelling and support my conclusions.12
III. LEGAL BACKGROUND.13
Q. Please briefly summarize the legal precedents regarding equity cost of capital.14
A. As a preliminary matter, I want to clarify that I am not an attorney. However, as a15
financial expert, I am aware of and familiar with the legal precedents that define the16
legal constraints on state commissions in setting appropriate rates of return for17
regulated utilities. The Supreme Court of the United States has confirmed well-18
established legal precedents for defining the allowed fair rate of return in ratemaking19
proceedings. In Bluefield Water Works & Improvement Co. v. Public Service20
Commission of West Virginia, 262 U.S. 679 (1923) (“Bluefield”), the Supreme Court21
concluded that:22
Attachment No. 2 IURC Cause No. 45064
Indiana Exchange Carrier Association, Inc. Page 21 of 173
Attachment B
Page 12 of 79
1047102.2
A public utility is entitled to such rates as will permit it to earn a1return on the value of the property which it employs for the2convenience of the public equal to that generally being made at the3same time and in the general part of the country on investments in4other business undertakings which are attended by the corresponding5risks and uncertainties. . . . The return should be reasonable,6sufficient to assure confidence in the financial soundness of the7utility, and should be adequate, under efficient and economical8management, to maintain and support its credit and enable it to raise9money necessary for the proper discharge of its public duties.10
In Federal Power Commission v. Hope Natural Gas Company, 320 U.S. 391 (1944)11
(“Hope”), which expanded on Bluefield and emphasized that a utility’s revenues must12
also cover “capital costs,” the Supreme Court further found that:13
From the investor or company point of view it is important that there14be enough revenue not only for operating expenses but also for the15capital costs of the business. These include service on the debt and16dividends on the stock. . . . By that standard the return to the equity17owner should be commensurate with returns on investments in other18enterprises having corresponding risks. That return, moreover,19should be sufficient to assure confidence in the financial integrity of20the enterprise, so as to maintain its credit and attract capital.21(Emphasis added.)22
In Duquesne Light Company et al. v. David M. Barasch et al., 488 U.S. 299 (1989),23
the Supreme Court reiterated the standard of Hope and Bluefield and then added24
important new guidelines, including “regulatory risk,” which is a distinct risk to be25
recognized by regulators in defining a fair rate of return:26
Admittedly, the impact of certain rates can only be evaluated in the27context of the system under which they are imposed. One of the28elements always relevant to setting the rate under Hope is the return29investors expect given the risk of the enterprise. Id., at 603, 64 S.Ct.,30at 288 ("[R]eturn to the equity owner should be commensurate with31returns on investments in other enterprises having corresponding32risks"); Bluefield Water Works & Improvement Co. v. Public Service33Comm'n of West Virginia, 262 U.S. 679, 692-693, 43 S.Ct. 675, 679,3467 L.Ed. 1176 (1923) ("A public utility is entitled to such rates as35will permit it to earn a return . . . equal to that generally being made36at the same time and in the same general part of the country on37investments in other business undertakings which are attended by38
Attachment No. 2 IURC Cause No. 45064
Indiana Exchange Carrier Association, Inc. Page 22 of 173
Attachment B
Page 13 of 79
1047102.2
corresponding risks and uncertainties"). The risks a utility faces are1in large part defined by the rate methodology . . . . Consequently, a2State's decision to arbitrarily switch back and forth between3methodologies in a way which required investors to bear the risk of4bad investments at some times while denying them the benefit of5good investments at others would raise serious constitutional6questions.7
The three standards of fairness related to returns are financial integrity, capital8
attraction, and comparable earnings, which were reiterated in the Permian Basin Area9
Rate Cases.410
In short, an equity owner in a rate-regulated utility should be allowed the opportunity11
to earn returns that are comparable with those derived from investments in other12
businesses that have equivalent risks, with appropriate adjustments for other risks such13
as regulatory risk. The issue to be determined by the Commission, therefore, is what14
rate of return is necessary to allow the Independent Small LECs to earn on their15
investments a return that is commensurate with the risk-adjusted, market-based rate16
available for other similar investments. My professional opinion is that the current17
10% overall rate of return applied in ratemaking for Independent Small LECs should18
be significantly raised to reflect the increased risks since 1997. The remainder of this19
testimony will develop and support that opinion, relying on relevant data and20
authoritative sources.21
Q. Why should a commission be concerned about ensuring that a utility is assigned a22
reasonable return on capital?23
4 Permian Basin Area Rate Cases. 390 U.S. 747 (1968). See also Federal Power Commission v. MemphisLight, Gas & Water Division, 411 U.S. 458 (1973).
Attachment No. 2 IURC Cause No. 45064
Indiana Exchange Carrier Association, Inc. Page 23 of 173
Attachment B

Page 14 of 79
1047102.2
A. A commission should be concerned about what is “fair” to conform with the law as1
defined by the U.S. Supreme Court (e.g., financial integrity, capital attraction, and2
comparable earnings). That is, the investors who have dedicated capital to the utility3
have a right to a return that is legally justified. But, even setting aside the legal4
standard, a commission that is focused on customer welfare will also recognize that a5
utility without an appropriate equity return will be at-risk in attracting future capital6
because no rational investor will commit capital investment if the equity or other7
returns are insufficient. The rational investor will seek alternative and superior returns8
in investments other than the utility if expected returns at the utility fall short of9
market-based rates. To be clear, if the Commission were to assign a return on10
investment that does not reward an investor for the industry’s risk, the outcome is11
predictable. An insufficient return on investment is likely to result in a redirection of12
capital away from the utility, not because the investor is a “bad actor,” but because the13
investor should not be expected to act irrationally by committing capital where risk is14
not properly rewarded.15
Federal and California regulators have identified a wide range of broadband16
deployment goals and continued network investment is needed to meet those goals.517
However, an improperly low cost of capital could thwart achievement of these18
objectives. Moreover, an insufficient rate of return could disincent investments19
necessary to ensure service quality and network reliability in rural areas. In short, if20
the cost of capital is too low, it will hurt rural consumers and rural communities.21
5 See FCC 2015 Broadband Report and Notice of Inquiry, FCC 15-10 (rel. February 4, 2015); Pub. Util Code§ 275.6.
Attachment No. 2 IURC Cause No. 45064
Indiana Exchange Carrier Association, Inc. Page 24 of 173
Attachment B
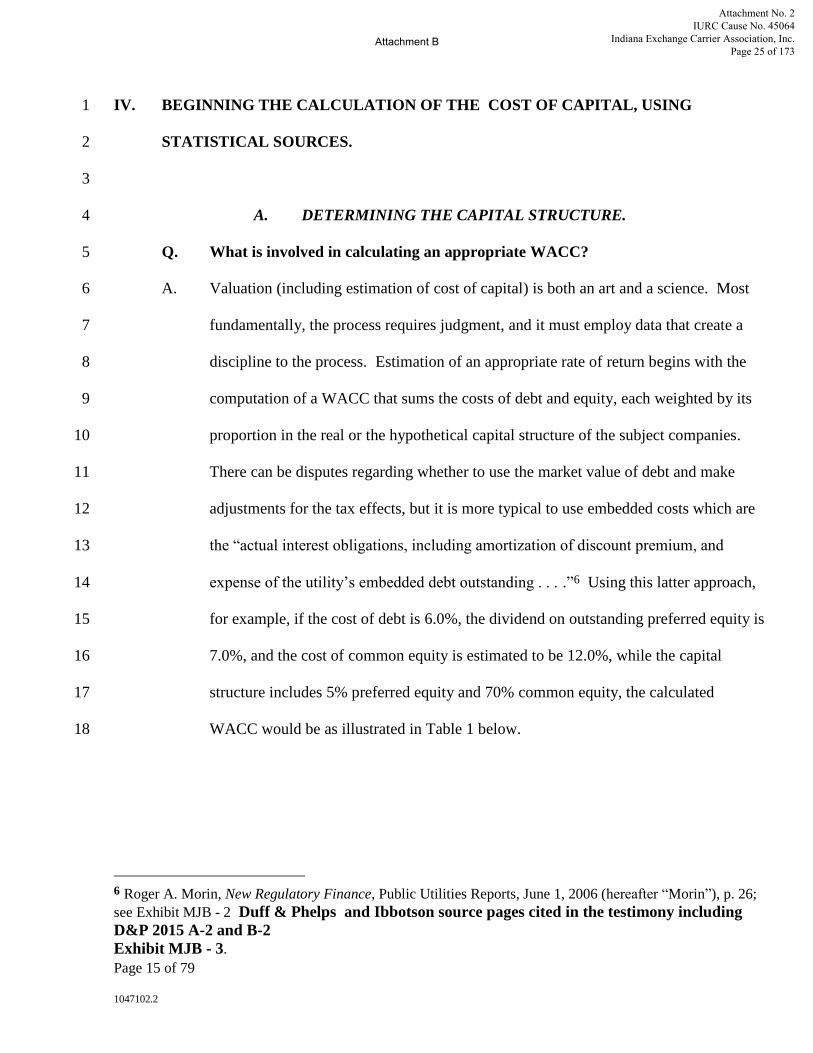
Page 15 of 79
1047102.2
IV. BEGINNING THE CALCULATION OF THE COST OF CAPITAL, USING1
STATISTICAL SOURCES.2
3
A. DETERMINING THE CAPITAL STRUCTURE.4
Q. What is involved in calculating an appropriate WACC?5
A. Valuation (including estimation of cost of capital) is both an art and a science. Most6
fundamentally, the process requires judgment, and it must employ data that create a7
discipline to the process. Estimation of an appropriate rate of return begins with the8
computation of a WACC that sums the costs of debt and equity, each weighted by its9
proportion in the real or the hypothetical capital structure of the subject companies.10
There can be disputes regarding whether to use the market value of debt and make11
adjustments for the tax effects, but it is more typical to use embedded costs which are12
the “actual interest obligations, including amortization of discount premium, and13
expense of the utility’s embedded debt outstanding . . . .”6 Using this latter approach,14
for example, if the cost of debt is 6.0%, the dividend on outstanding preferred equity is15
7.0%, and the cost of common equity is estimated to be 12.0%, while the capital16
structure includes 5% preferred equity and 70% common equity, the calculated17
WACC would be as illustrated in Table 1 below.18
6 Roger A. Morin, New Regulatory Finance, Public Utilities Reports, June 1, 2006 (hereafter “Morin”), p. 26;see Exhibit MJB - 2 Duff & Phelps and Ibbotson source pages cited in the testimony includingD&P 2015 A-2 and B-2Exhibit MJB - 3.
Attachment No. 2 IURC Cause No. 45064
Indiana Exchange Carrier Association, Inc. Page 25 of 173
Attachment B
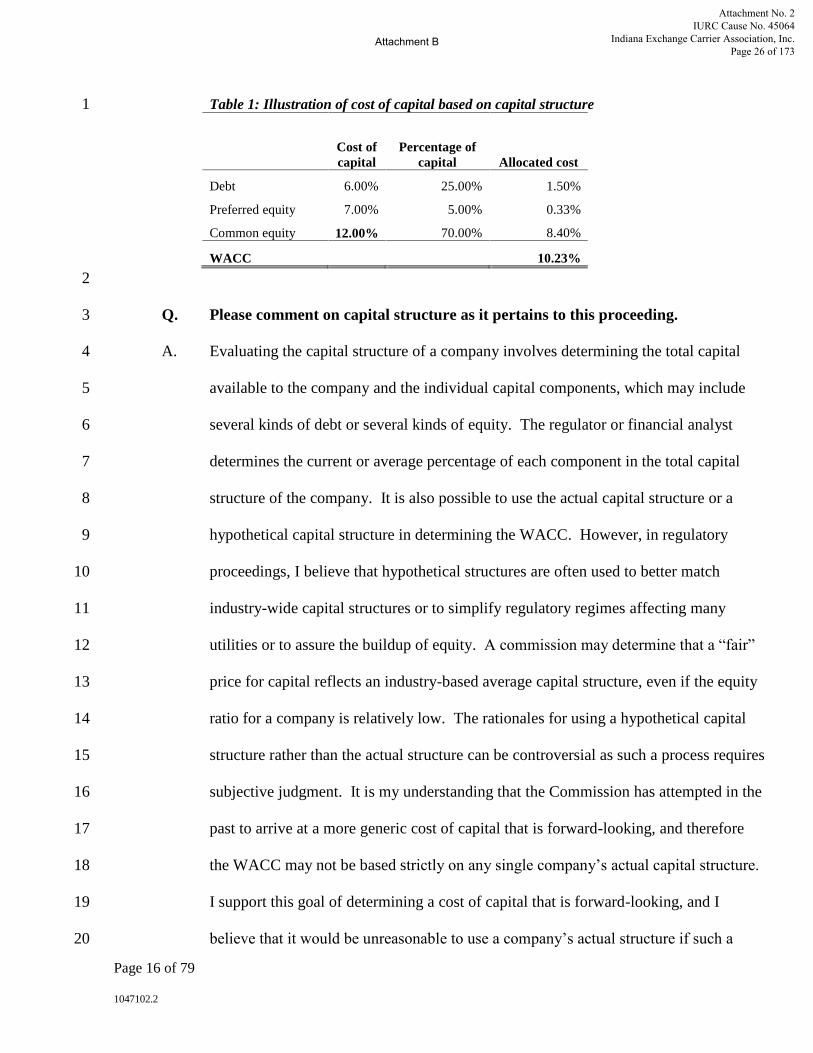
Page 16 of 79
1047102.2
Table 1: Illustration of cost of capital based on capital structure1
Cost ofcapital
Percentage ofcapital Allocated cost
Debt 6.00% 25.00% 1.50%
Preferred equity 7.00% 5.00% 0.33%
Common equity 12.00% 70.00% 8.40%
WACC 10.23%
2
Q. Please comment on capital structure as it pertains to this proceeding.3
A. Evaluating the capital structure of a company involves determining the total capital4
available to the company and the individual capital components, which may include5
several kinds of debt or several kinds of equity. The regulator or financial analyst6
determines the current or average percentage of each component in the total capital7
structure of the company. It is also possible to use the actual capital structure or a8
hypothetical capital structure in determining the WACC. However, in regulatory9
proceedings, I believe that hypothetical structures are often used to better match10
industry-wide capital structures or to simplify regulatory regimes affecting many11
utilities or to assure the buildup of equity. A commission may determine that a “fair”12
price for capital reflects an industry-based average capital structure, even if the equity13
ratio for a company is relatively low. The rationales for using a hypothetical capital14
structure rather than the actual structure can be controversial as such a process requires15
subjective judgment. It is my understanding that the Commission has attempted in the16
past to arrive at a more generic cost of capital that is forward-looking, and therefore17
the WACC may not be based strictly on any single company’s actual capital structure.18
I support this goal of determining a cost of capital that is forward-looking, and I19
believe that it would be unreasonable to use a company’s actual structure if such a20
Attachment No. 2 IURC Cause No. 45064
Indiana Exchange Carrier Association, Inc. Page 26 of 173
Attachment B
Page 17 of 79
1047102.2
structure is inconsistent with forward-looking expectations regarding the appropriate1
mix of capital sources.2
Q. Are you familiar with the Commission’s historical approach with respect to3
capital structure?4
A. I understand that the Commission sought in the past to establish a target WACC that5
allowed for differing capital structures at small telephone companies.7 In the cases6
that were decided in 1997, for example, the Commission determined a WACC of 10%,7
which was deemed to be a reasonable target, and then it tested that WACC by using8
the actual cost of debt for California ILECs and by evaluating the residual returns (an9
implied cost of equity) for the Independent Small LECs. The Commission’s10
conclusion at that time was that a WACC of 10% resulted in returns on the11
Independent Small LECs’ actual debt and equity that were within acceptable ranges.812
The adoption of this overall rate of return allowed companies to manage their own13
capital resources, while maintaining a reasonable overall cost of capital for ratemaking14
purposes. See, e.g. D.97-04-036, at p. 12 (“[c]onsistent with our treatment of cost of15
capital for large and mid-size telecommunications companies, and as an incentive for16
applicant to manage its capital structure, we decline to adopt a specific capital17
structure.”).18
7 My understanding is that the CPUC resolved cost-of-capital proceedings in 1997 for each of the IndependentSmall LECs. See D.97-04-036 (California-Oregon Telephone Co.); D.97-04-034 (Calaveras TelephoneCompany); D.97-04-035 (Ducor Telephone Company); D.97-04-032 (Sierra Telephone Company, Inc.); seealso Res. T-16003 (Kerman); Res. T-16004 (Pinnacles); Res. T-16005 (Ponderosa); Res. T-16006 (Siskiyou);Res. T-16007 (Volcano).8 See, e.g., D.97-04-036 (California-Oregon Telephone Co.), p. 9; D.97-04-034 (Calaveras TelephoneCompany), p. 9; D.97-04-035 (Ducor Telephone Company), p. 9; D.97-04-032 (Sierra Telephone Company,Inc.), p. 9.
Attachment No. 2 IURC Cause No. 45064
Indiana Exchange Carrier Association, Inc. Page 27 of 173
Attachment B
Page 18 of 79
1047102.2
B. ESTIMATING THE COST OF DEBT.1
Q. Is the cost of debt difficult to determine?2
A. For regulatory purposes, the cost of debt is usually the actual cost as specified in the3
lending documents.9 However, it is possible to use a different cost of debt, for4
example, to generalize for an industry or to normalize in a time period when debt costs5
are assumed to be unsustainably high or low, as I will explain below. In all cases, the6
regulator or analyst should assess a realistic set of debt costs that are forward-looking.7
As is well known, the current prices for debt are today at historic low levels, due8
significantly to the Federal Reserve’s (“Fed”) bond-buying program; and there is an9
expectation that those rates will rise as the Fed alters its monetary policy. I will also10
explain below that debt resources appear to be increasingly unavailable to smaller11
ILECs because the primary lenders to the industry have grown increasingly cautious.1012
For rural ILECs, the effects of greater industry-wide risk combined with lesser13
availability of debt can shift the capital structure toward a higher percentage of more14
costly equity or even toward having virtually no debt at all.1115
Q. Can we simply use the debt costs as reflected in the market today in assessing the16
debt component to cost of capital?17
A. No. Again, the Commission must look for “reasonable” calculations for forward-18
looking costs, including debt costs. The Fed has engaged in a policy that has driven19
9 Morin, p. 26.10 The challenges including contracting numbers of switched access lines, increasing required capitalcommitments necessary to meet growing data demand, and regulatory uncertainties including shrinkingrevenues from access charges and universal service support mechanisms.11 The ten Independent Small LECs appear to be maintaining relatively stable capital structures over the lastfive years. The equity ratios were 70%, on average, in 2014 and generally fall within the range of the zone ofreasonableness referenced in the Commission’s 1997 rate case decisions (60% to 80% equity).
Attachment No. 2 IURC Cause No. 45064
Indiana Exchange Carrier Association, Inc. Page 28 of 173
Attachment B

Page 19 of 79
1047102.2
interest rates to extraordinarily low levels in recent years, with a goal of stimulating1
growth and investment. However, the Fed’s activities are widely regarded as2
“unsustainable” as reflected in Duff & Phelps’ discussion in its 2015 Handbook:3
The yields of U.S. government bonds in certain periods during and4after the [financial crisis of 2008] may have been artificially5repressed, and therefore [are] likely unsustainable. Many market6participants will agree that nominal U.S. government bond yields7in recent periods have been artificially low. Even members of the8Federal Open Market Committee (FOMC) have recently discussed9the need to ‘normalize’ interest rates.” (Emphasis in original.) 1210
At a meeting occurring on December 16-17, 2014, the Federal Open Market11
Committee (“FOMC”), which is a committee of the Federal Reserve Bank, issued a12
statement, signaling the need to “normalize” federal policy in the future:13
Based on its current assessment, the [FOMC] judges that it can be14patient in beginning to normalize the stance of monetary policy.15The [FOMC] sees this guidance as consistent with its previous16statement that it likely will be appropriate to maintain the 0 to ¼17percent target range for the federal funds rate for a considerable18time following the end of its asset purchase program in October . . .19. (Emphasis added by Duff & Phelps.)1320
In short, it would be unreasonable to use today’s unsustainable debt rates as a proxy21
for future debt costs.22
C. ESTIMATING THE COST OF EQUITY.23
Q. Why is the process of assessing the appropriate return on equity more24
challenging than determining the cost of debt?25
12 2015 Duff & Phelps Valuation Handbook: Guide to Cost of Capital, Market Results through 2014,(Hoboken, NJ: John Wiley & Sons, Inc., 2015) (hereafter “Duff & Phelps 2015 Valuation Handbook Guide toCost of Capital”), p. 3-3; see Exhibit MJB - 2.13 Id.
Attachment No. 2 IURC Cause No. 45064
Indiana Exchange Carrier Association, Inc. Page 29 of 173
Attachment B
Page 20 of 79
1047102.2
A. Debt has clear legal documentation and interest obligations, and debt can be traded in1
the public markets, making it possible to achieve a better determination of market-2
based costs. By contrast, common equity costs cannot be observed directly for3
privately-held companies.14 Common equity for the vast majority of rural telephone4
companies has no documentation or defined obligation that would allow its specific5
costs to be easily computed. Common equity can be traded publicly, but the6
Independent Small LECs, like most rural ILECs in the United States, do not have7
publicly-traded common equity.8
Q. How are the costs of preferred equity estimated?9
If a company’s preferred equity has no defined return, then that security would present10
the same valuation problem as common equity. If there is a defined return, the cost of11
preferred equity can be estimated using the dividend on the security. Four of the12
Independent Small LECs—Pinnacles, Ponderosa, Siskiyou, and Volcano—have13
preferred equity that is, on average, approximately 2 percent of total capital, and those14
companies have been paying preferred dividends at a consistent rate, as will be15
detailed below. I have estimated the cost of those preferred equity securities using the16
companies’ preferred dividend yields, that are 5.0%, 6.0%, 5.5% and 7.0%,17
respectively.18
Q. How does a financial expert typically estimate common equity costs?19
A. Most financial experts with whom I have been associated seek to estimate common20
equity costs using multiple valuation methodologies. The goal of the financial21
14 I use the term “common equity” to distinguish from preferred equity, and I include capital contributions andretained earnings as common equity.
Attachment No. 2 IURC Cause No. 45064
Indiana Exchange Carrier Association, Inc. Page 30 of 173
Attachment B
Page 21 of 79
1047102.2
professional or the regulator in valuing common equity should be to check and re-1
check the reasonableness of his or her estimates to ensure that they are accurate and2
sensible. When I analyzed stocks and published while at Legg Mason, I always3
employed multiple approaches that included company-specific discounted cash flow4
(“DCF”) models, valuations relative to the value of other companies, and historical5
data and trends. At Charlesmead, we do the same when we advise companies in our6
M&A business in connection with sales or acquisitive transactions. In the M&A7
business, financial advisors virtually always test valuations by studying comparable8
publicly-traded equities as well as DCFs that assess probable operating performance9
for each year over the projected five to ten years of the model. Additionally, financial10
professionals use comparable M&A transactional data to observe valuations and11
trending in the markets over time. The most responsible approach is to analyze12
valuation from multiple viewpoints to provide confirmation of the reasonableness of13
the results generated by the methods chosen..14
D. USE OF THE COMMON METHODOLOGIES—DCF AND CAPM.15
Q. What are the most commonly-used methodologies to compute equity costs in16
regulatory proceedings?17
A. The most common approaches used in regulatory proceedings today rely on DCF18
models and on the CAPM, the latter of which is also the basis for the Buildup or Risk19
Premium Method. The federal allowed rate of return for interstate services, which was20
last reduced to 11.25% from 12% in 1990, was derived using a constant-growth DCF21
model to compute equity costs, using data from the Regional Bell Operating22
Attachment No. 2 IURC Cause No. 45064
Indiana Exchange Carrier Association, Inc. Page 31 of 173
Attachment B
Page 22 of 79
1047102.2
Companies, also known as Regional Holding Companies (“RHCs”).15 In the 19901
represcription order, the FCC clarified at paragraph 35 that the formula for that DCF2
is:3
Ke = D/P + G45
Where:6Ke = Cost of equity7D = Annual dividend on a share of common stock8P = Price of a share of common stock9D/P = Dividend yield on a share of common stock10G = Annual dividend growth rate11
12The DCF model, as traditionally used by the FCC or state commissions, is based on an13
assumption of predictable dividends in a stable industry with a predictable growth14
trend. The formula was assumed to be reliable in 1990. I note that those assumptions15
are no longer applicable today because the industry is no longer a predictable16
monopoly with high assurances of receiving returns. Rather, local17
telecommunications dividends—essentially payments for equity costs—can no longer18
be assumed to expand at a constant rate nor can they be assumed to be perpetual.19
Pertinent to this proceeding, I note that the DCF model relies on two other important20
assumptions. The first is that the price of the equity can be known, which is of course21
not true for privately-held companies such as the Independent Small LECs, whose22
equity market value cannot be observed or verified. The second assumption is that23
there are reliable publicly-traded proxies (the RHCs were assumed to be sufficiently24
similar to other ILECs in 1990); in that regard, as I explain below, the large dividend-25
15 FCC, In the Matter of Represcribing the Authorized Rate of Return for Interstate Services of LocalExchange Carriers, 68 Rad. Reg. 2d (P&F) 771 (F.C.C), 5 FCC Rcd. 7507. 1990 WL 604105, FCC 90-315.See, e.g., Exhibit MJB - 4, pp. 8-9; the Exhibit makes clear that the 1990 estimates of equity costs were derivedfrom data related to very large companies with multi-state operations serving rural and urban areas. As Iexplain below, these companies had – and continue to have – lower risk profiles than rural telephonecompanies like the Independent Small LECs.
Attachment No. 2 IURC Cause No. 45064
Indiana Exchange Carrier Association, Inc. Page 32 of 173
Attachment B
Page 23 of 79
1047102.2
paying ILECs—the ones that were the basis for the 1990 DCF—are no longer suitably1
similar to the Independent Small LECs.16 The simple constant-growth DCF formula,2
in my opinion, cannot be used for this testimony, and I am unaware of any commission3
that is using such a formula today.4
Q. Are there variants of the DCF model used by financial analysts?5
A. As I noted above, financial investors and investment bankers use company-specific6
DCF models that rely on estimating the individual company’s cash flows for each7
modeled year based on highly-detailed revenue, cost and capital expenditure inputs8
over a period of time, such as five to ten years. These models involve discounting to9
the present the estimated future cash flows plus a final-year “terminal value.” The10
FCC and regulatory commissions have used the simpler, constant-growth DCF, and11
not the detailed discount cash flow model that I describe above.12
Q. What is the CAPM?13
A. The CAPM is a computation of the expected return on a security, based on concepts14
derived from the work of Harry Markowitz and the subsequent study of William15
Sharpe in 1960. The premise underlying this method is that the expected return of a16
security, or of a portfolio, equals the rate on a risk-free security (generally assumed to17
be the long-term U.S. Treasury Bond for which the risk of principal loss or failure-to-18
pay is very low) plus certain other risk-premia to adjust for systematic (market) risk.19
This approach reflects the overall market risk (the broad market rising or falling), plus20
adjustments for individual-company risk captured by a “beta,” plus adjustments for21
size (generally called a “size premium”). “Beta” is a factor that is multiplied by the22
16 Id. The differences will be identified in the testimony below.
Attachment No. 2 IURC Cause No. 45064
Indiana Exchange Carrier Association, Inc. Page 33 of 173
Attachment B

Page 24 of 79
1047102.2
expected market return to adjust for a public company’s risk that is determined to be1
higher or lower (more or less volatile) than the overall market risk.17 The size2
premium is founded on the well-established premise that smaller firms present higher3
risks than larger ones, and it is possible to add other premia as will be discussed4
below. The CAPM formula defines a theoretical linear relationship between expected5
return on equity (cost of equity) and risk as:186
Ke = Rf +( β x RPm) + RPs78
Where:9Ke = Expected return (cost) on equity10Rf = Risk-free rate11β = Beta of the security (statistical volatility v. the market)12RPm = Equity Risk Premium13RPs = Size premium14
If the expected return on the security does not meet or exceed the required return, then15
the model suggests that the rational investor will not purchase the equity security in16
question. She or he will choose to invest money in other investments where the risk-17
return relationship is more favorable.18
Q. What is the Buildup Method?19
A. The Buildup Method is an additive Risk Premium approach that relies on CAPM20
concepts in computing the cost of equity. In reality, it is the CAPM, with the beta21
calculation divided into two parts: one for the overall market risk (the equity risk22
premium) and the second for a proxy premium related to the industry (an industry-risk23
premium). The Buildup Method begins with the risk-free rate and then adds a24
17 A beta of 1.0 equals the market risk, and a beta under 1.0 adjusts the equity risk premium for companieswith a volatility in returns that suggests lower-than-market-risk, while, conversely a beta above 1.0 adjusts forvolatility that suggests higher-than-market-risk.18 Duff & Phelps 2015 Valuation Handbook Guide to Cost of Capital, p. 2-8; see Exhibit MJB - 2.
Attachment No. 2 IURC Cause No. 45064
Indiana Exchange Carrier Association, Inc. Page 34 of 173
Attachment B
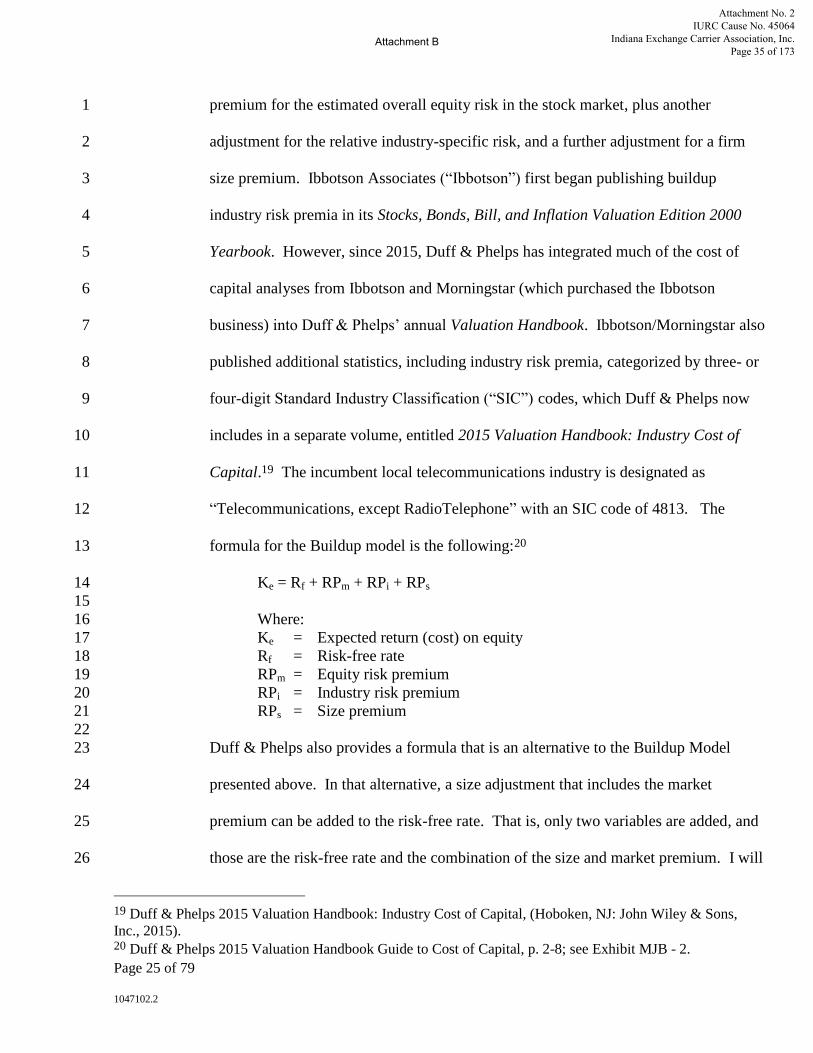
Page 25 of 79
1047102.2
premium for the estimated overall equity risk in the stock market, plus another1
adjustment for the relative industry-specific risk, and a further adjustment for a firm2
size premium. Ibbotson Associates (“Ibbotson”) first began publishing buildup3
industry risk premia in its Stocks, Bonds, Bill, and Inflation Valuation Edition 20004
Yearbook. However, since 2015, Duff & Phelps has integrated much of the cost of5
capital analyses from Ibbotson and Morningstar (which purchased the Ibbotson6
business) into Duff & Phelps’ annual Valuation Handbook. Ibbotson/Morningstar also7
published additional statistics, including industry risk premia, categorized by three- or8
four-digit Standard Industry Classification (“SIC”) codes, which Duff & Phelps now9
includes in a separate volume, entitled 2015 Valuation Handbook: Industry Cost of10
Capital.19 The incumbent local telecommunications industry is designated as11
“Telecommunications, except RadioTelephone” with an SIC code of 4813. The12
formula for the Buildup model is the following:2013
Ke = Rf + RPm + RPi + RPs1415
Where:16Ke = Expected return (cost) on equity17Rf = Risk-free rate18RPm = Equity risk premium19RPi = Industry risk premium20RPs = Size premium21
22Duff & Phelps also provides a formula that is an alternative to the Buildup Model23
presented above. In that alternative, a size adjustment that includes the market24
premium can be added to the risk-free rate. That is, only two variables are added, and25
those are the risk-free rate and the combination of the size and market premium. I will26
19 Duff & Phelps 2015 Valuation Handbook: Industry Cost of Capital, (Hoboken, NJ: John Wiley & Sons,Inc., 2015).20 Duff & Phelps 2015 Valuation Handbook Guide to Cost of Capital, p. 2-8; see Exhibit MJB - 2.
Attachment No. 2 IURC Cause No. 45064
Indiana Exchange Carrier Association, Inc. Page 35 of 173
Attachment B

Page 26 of 79
1047102.2
provide that estimate, which further confirms the results of my analysis, although the1
calculation is relatively crude.2
E. USE OF TRANSACTIONAL DATA TO CONFIRM CAPM ESTIMATES.3
Q. Are these the primary approaches to assess the cost of capital in regulatory4
proceedings?5
A. In my experience, the CAPM, Buildup and DCF models are the most commonly-used6
cost-of-capital estimation tools in regulatory proceedings.21 Before the mid-1960s, the7
Comparable Earnings approach was used almost exclusively in regulatory valuation8
exercises, but it was replaced by the DCF after that time.22 In the investment banking9
industry, including at our firm, Charlesmead, value (with calculations that rely on cost10
of equity estimates) is assessed using the CAPM, with adjustments for size or11
company-specific differences from the industry, and detailed (not the constant growth)12
DCFs. As I explained earlier, we also rely on two other methodologies that are not13
typically used in regulatory proceedings, but which help to confirm the validity of our14
conclusions. Specifically, we assess multiples (ratios) of enterprise value (“EV”),15
which is defined as equity value plus net debt (total debt less cash and equivalents),16
divided by cash flows, most often using operating cash flow (earnings before interest,17
taxes, depreciation and amortization or “EBITDA”). We compile those EV/EBITDA18
multiples and other ratios from actual transactions, so we can understand the market19
21 There are variations of the CAPM, including the Empirical Capital Asset Pricing Model (“ECAPM”), theArbitrage Pricing Model (“APM”), and the Fama-French Three-Factor Model. These models rely on similarconcepts related to proxy groups and market risk estimations. As I will explain, I believe that the larger“proxy” companies do not sufficiently capture regulatory and small-business risks, and that alternative CAPM-based models do not refine an estimation of those risks.22 Morin, page 18.
Attachment No. 2 IURC Cause No. 45064
Indiana Exchange Carrier Association, Inc. Page 36 of 173
Attachment B

Page 27 of 79
1047102.2
perception of value and the trends over time.23 The resultant ratios permit us to1
“normalize” our comparisons of one transaction with other transactions. We are2
convinced that the most informative valuation approaches are based on real-world3
transactions between a knowledgeable buyer and seller. As such, these data provide4
insights into efficient and real-time assessments of value and risks.5
Q. How do you utilize actual transactional data in your analysis?6
A. Especially instructive are the insights derived from transactions when companies are7
bought or sold in their entirety. Transactions provide direct data related to private and8
public companies, large and small enterprises, without any control discount. Like all9
professional financial advisors, Charlesmead tracks M&A data over time to understand10
the trends and provide appropriate advice to buyers and sellers. Those insights are11
even more valuable when an industry is undergoing dramatic change, as is happening12
with companies such as the Independent Small LECs. Dr. Roger Morin, Professor of13
Finance and author of the oft-cited text, New Regulatory Finance, notes the problem14
with historical models when the future is not like the past.15
[S]hifts in growth prospects take some time before they are fully16reflected in the historical growth rates. Hence, backward-looking17growth and statistical analysis may fail to fully reflect the fact that18the risks and growth prospects of utilities have escalated, and may19only provide limited evidence that the risk and the cost of capital to20these utilities have increased.2421
It is clear to me that we are in such a period for telecommunications carriers, both22
large and small ILECs, as these markets are driven by rapidly-shifting customer23
23 The approach is analogous to real-estate metrics such as price per square foot or grocery store labels withprice per unit. In the case of ILEC transactions, we assess how much a buyer is willing to pay for one dollar ofoperating cash flow (EBITDA).24 Morin, p. 436.
Attachment No. 2 IURC Cause No. 45064
Indiana Exchange Carrier Association, Inc. Page 37 of 173
Attachment B

Page 28 of 79
1047102.2
demand for voice, video, broadband, as well as the ongoing overhauls of regulatory1
support mechanisms, more limited access to capital, and evolving competitive threats.2
It is my opinion that the transactional valuations are most instructive and specific as3
they capture risk that is not fully explained in the CAPM or the Buildup Methods4
which rely on historical as well as broader and less-specific data sets. To be clear, I5
believe that the historical data are drawn from a less turbulent time for the industry,6
which means that the CAPM-based data are inclined to understate the cost of an7
ILEC’s equity today. The transactional approach provides a corrective as it is more8
current information and is based on the concept of “fair value” which involves an9
arms’ length transaction between a “willing buyer and willing seller.”25 Using M&A10
data, we track rising value (declining risk) over time, stable value (unchanged risk) or11
deteriorating value (increasing risk). While we rely on these data in our transactional12
work, I will only use the M&A data in this proceeding to confirm the findings derived13
from the CAPM-based approaches, and not to establish a baseline cost of equity.14
Q. Are you able to provide data to verify all the transactions in the marketplace?15
A. Some, but not all, transactional data are available. Exhibit MJB - 5 provides the16
publicly-available data related to small ILEC transactions from 2001 to the present.17
Some of the transactions listed in the Exhibit appear to have higher valuations in18
recent periods but the ILEC valuations that rely primarily on LEC services—sales of19
25 Ibbotson SBBI 2013 Valuation Yearbook, Market Results for Stocks, Bonds, Bills, and Inflation 1926-2012(Chicago, IL: Morningstar, Inc., 2013) (hereafter “Ibbotson 2013 Valuation Yearbook”); see Ibbotson 2015Classic Yearbook Market Results for Stocks, Bonds, Bills and Inflation 1926-2014, (Chicago, IL: Morningstar,Inc., 2015), (hereafter “Ibbotson 2015 Classic Yearbook”), p. 11; “Fair market value is defined by IRSRevenue Ruling 59-60 [sec. 2.02] as ‘. . . the price at which the property would change hands between awilling buyer and a willing seller when the former is not under any compulsion to buy and the latter is notunder any compulsion to sell, both parties having reasonable knowledge of relevant facts.” (Emphasis inoriginal); see Exhibit MJB - 2.
Attachment No. 2 IURC Cause No. 45064
Indiana Exchange Carrier Association, Inc. Page 38 of 173
Attachment B
Page 29 of 79
1047102.2
ILECs without cable TV, wireless, significant fiber transport, or tax benefits—are1
valued consistently lower over the last several years, in a range today of 4.5 to 5.52
times last-twelve-month EBITDA. I frequently report on the generalized trends and I3
regularly explain those trends at industry conferences.264
Q. Can a valid cost of capital analysis use the cost of equity from the stocks of the5
publicly-traded ILECs to estimate the capital costs for small ILECs?6
A. The analysis can begin with data derived from guideline or proxy ILECs, as has been7
done for many years. However, small ILECs have characteristics that make their risks8
considerably different from the risks at larger companies, and the differences appear to9
growing. Accordingly, we cannot rely exclusively on those data. Indeed, the10
differences between diversified publicly-traded carriers and small private carriers are11
much larger than when the FCC set the interstate rate of return in 1990.12
Q. Please explain the differences between large and small ILECs as it pertains to13
their investment and market risk.14
First, and probably most significantly, the regulatory factors affecting small rural15
carriers are fundamental to the business of those companies, which have a high16
proportion of their operations in regions that are uneconomic or less economic than17
those served by large carriers. Large carriers rely on relatively little or no regulatory18
support revenues because their businesses are concentrated in denser areas and those19
carriers provide lesser-regulated or non-regulated products such as wireless, enterprise,20
and extensive video products. In light of the rural carriers’ relative dependence on21
26 See, e.g., Michael J. Balhoff, Slide Presentation: Emerging Strategic Value Creation, June 2014, presentedat the Georgia Telecommunications Association Conference, Orlando, Florida (hereafter “GeorgiaPresentation”), slide 7. See Exhibit MJB - 6.
Attachment No. 2 IURC Cause No. 45064
Indiana Exchange Carrier Association, Inc. Page 39 of 173
Attachment B
Page 30 of 79
1047102.2
universal service support and intercarrier compensation revenues, regulatory threats to1
these revenue sources disproportionately increase the risk profiles for these smaller2
carriers compared with those of larger carriers. Second, the larger carriers are all3
engaging in significant acquisition activities, based on their financial capacity to4
acquire other assets and businesses. The purpose of those acquisitions is to generate5
efficiencies (synergies), which often reduce the target companies’ cash operating costs6
by 20%-30%, and allow for critical diversification of operations. It is important to7
note that every large ILEC is or has been engaged in sweeping acquisitions in8
transforming the carrier’s businesses, made possible by significant size and access to9
capital.27 The large ILECs’ capacity to mitigate today’s operating risks through major10
acquisitions is a strategic advantage that is not being employed to a meaningful extent11
by smaller ILECs and is likely not available to smaller ILECs.28 Finally, large carriers12
generally have extensive access to publicly-traded equity capital and cost-effective13
debt capital. The Independent Small LECs do not have public equity and have limited14
access to cost-effective debt, as will be explained below.15
16
27 AT&T Inc., SEC Form 10-K Annual Report 2014. Retrieved from SEC EDGAR websitehttp://www.sec.gov/edgar.shtml, Seq 4, AT&T Inc. 2014 Annual Report, “Other Business Matters,” p. 21.Verizon Communications, Inc., SEC Form 10-K Annual Report 2014. Retrieved from SEC EDGAR websitehttp://www.sec.gov/edgar.shtml, Seq 4, Exhibit 13, “Acquisitions and Divestitures,” p. 34. CenturyLink, Inc.,SEC Form 10-K Annual Report 2014. Retrieved from SEC EDGAR website http://www.sec.gov/edgar.shtml,“Acquisitions,” p. 13. Frontier Communications Corporation (2014). Form 10-K Annual Report 2014.Retrieved from SEC EDGAR website http://www.sec.gov/edgar.shtml, “Acquisitions,” p. F-12. Windstream(2014). Form 10-K Annual Report 2014. Retrieved from SEC EDGAR websitehttp://www.sec.gov/edgar.shtml. “Strategic Acquisitions,” p. 4. Consolidated Communications Holdings,Inc., SEC Form 10-K Annual Report 2014. Retrieved from SEC EDGAR websitehttp://www.sec.gov/edgar.shtml, “Recent Business Developments,” p. F-7.28 For a summary graphical presentation on the transformation of large ILECs, see Georgia Presentation,Exhibit MJB - 6, slides 10-14.
Attachment No. 2 IURC Cause No. 45064
Indiana Exchange Carrier Association, Inc. Page 40 of 173
Attachment B

Page 31 of 79
1047102.2
Q. Do valuation professionals typically make adjustments for size of the companies?1
A. Yes. Most professionals rely on the data and resources provided by companies such as2
Morningstar, Inc. (Ibbotson Stocks, Bonds, Bills, and Inflation (“SBBI”)) and Duff &3
Phelps, LLC.29 Both Ibbotson/Morningstar and Duff & Phelps are clear that4
adjustments should be made for size effects and other risk factors. For example, Duff5
& Phelps in its 2013 Risk Premium Report writes:6
Research tells us that the CAPM often misprices risk for certain7investments. Specifically, researchers have observed that commonly8used methods of measuring risk used in the CAPM (specifically,9beta) often understate the risk (and thus understate the required10return) for small company stocks. Examination of market evidence11shows that within the context of CAPM, beta does not fully explain12the difference between small company returns and large company13returns. In other words, the historical (observed) excess return of14portfolios comprised of smaller companies is greater than the excess15return predicted by the CAPM for these portfolios. This ‘premium16over CAPM’ is commonly known as a “beta-adjusted size premium”17or simply “size premium”.3018
To be clear, investors require a return for smaller companies that exceeds that19
predicted in the CAPM for larger companies, as proven in the historical studies. This20
investor behavior cannot be ignored in valuation. Moreover, Duff & Phelps is clear in21
its Valuation Handbook, cited above, that research verifies the existence of a size22
premium. This premium is appropriately added to the equity return to reflect market-23
based risk that is greater for smaller companies compared with larger companies.24
Ibbotson/Morningstar also provides statistics to demonstrate the effect of size on25
29 Ibbotson 2015 Classic Yearbook; Ibbotson 2014 Classic Yearbook, Market Results for Stocks, Bonds, Bills,and Inflation 1926-2013 (Chicago, IL: Morningstar, Inc., 2014)(hereafter “Ibbotson 2014 Classic Yearbook”);Duff & Phelps, 2014 Valuation Handbook, Guide to Cost of Capital (Chicago, IL: Duff & Phelps, LLC,2014)(hereafter “Duff & Phelps 2014 Guide to Cost of Capital”).30 Duff & Phelps, Risk Premium Report 2013 (Chicago, IL: Duff & Phelps, LLC, 2013), p. 60, available athttp://www.duffandphelps.com/SiteCollectionDocuments/Reports/(EXCERPT)%202013%20Duff%20Phelps%20Risk%20Premium%20Report.pdf.
Attachment No. 2 IURC Cause No. 45064
Indiana Exchange Carrier Association, Inc. Page 41 of 173
Attachment B
Page 32 of 79
1047102.2
returns, and summarizes this relationship with the comment that “[i]f small companies1
did not provide higher long-term returns, investors would be more inclined to invest in2
the less risky stocks of large companies.”313
F. OTHER REASONABLE PREMIA,4
WHICH ARE NOT USED IN THIS ANALYSIS.5
Q. Are there sources justifying adjustments that must be made in calculating the6
cost of equity other than the size premium cited above?7
A. Yes. I will not use any other adjustments in this testimony, but it is important to8
recognize that there is ample evidence that further adjustments can and possibly9
should be made. The Internal Revenue Service (“IRS”) has issued guidance on10
valuation over the years, including in its Revenue Ruling 59-60, which provides a11
framework for valuation of the stock of closely-held corporations or the stock of12
corporations where market quotations are either lacking or too scarce to be recognized.13
Morningstar, Inc, in its 2013 Ibbotson/Morningstar SBBI Valuation Yearbook, states14
that Ruling 59-60 “changed the way businesses are valued and is the cornerstone of15
the valuation process.32 That Ruling begins with the counsel that an appraiser should:16
. . . maintain a reasonable attitude in recognition of the fact that17valuation is not an exact science. A sound valuation will be based18upon all the relevant facts, but the elements of common sense,19
31 Ibbotson 2014 Classic Yearbook, p. 109; see Exhibit MJB - 2.32 Ibbotson 2013 Valuation Yearbook, p. 12; see Exhibit MJB - 2. See also, Ibbotson 2014 Classic Yearbook,pp. 123-127 in which liquidity-related investing issues are explained, as they require an adjustment because the“premium is the extra return an investor would demand in order to hold a security that cannot costlessly betraded” (p. 124); see Exhibit MJB - 2.
Attachment No. 2 IURC Cause No. 45064
Indiana Exchange Carrier Association, Inc. Page 42 of 173
Attachment B
Page 33 of 79
1047102.2
informed judgment and reasonableness must enter into the process of1weighing those facts and determining their aggregate significance.332
IRS Revenue Ruling 77-287 recognizes that there are important valuation differences3
and considerations for small and closely-held companies.34 Further, various United4
States Tax Court and Court of Federal Claims cases support the application of5
discounts or premia arising from illiquidity, lack of marketability, lack of control, and6
industry risk.35 In particular, there is substantive support that the cost of equity should7
include additional premia for illiquid and less-marketable securities.8
9
33 IRS Revenue Ruling 59-60, sec. 3.01, available at http://www.aticg.com/Documents/Revenue/RevRule59-60.pdf. See Exhibit MJB - 7.34 IRS Revenue Ruling 77-287, available at http://www.aticg.com/Documents/Revenue/RevRule77-287.pdf.See Exhibit MJB - 7. This ruling pertains to discounts that are used for securities that cannot be resoldimmediately because they are restricted from resale pursuant to Federal securities laws. At Sec. 4.02, theRuling notes:
Pursuant to Congressional direction, the SEC undertook an analysis of the purchases, sales, andholding of securities by financial institutions, in order to determine the effect of institutional activityupon the securities market. The study report was published in eight volumes in March 1971. The fifthvolume provides an analysis of restricted securities and deals with such items as the characteristics ofthe restricted securities purchasers and issuers, the size of transactions (dollars and shares), themarketability discounts on different trading markets, and the resale provisions. This research projectprovides some guidance for measuring the discount in that it contains information, based on the actualexperience of the marketplace, showing that, during the period surveyed (January 1, 1966, throughJune 30, 1969), the amount of discount allowed for restricted securities from the trading price of theunrestricted securities was generally related to the following four factors [earnings, sales, tradingmarket, and resale agreement provisions].
The smaller the sales, according to the SEC study and the IRS Revenue Ruling, the greater the discount.35 See, e.g., Mandelbaum v. Commissioner, T.C. Memo 1995-255 (June 12, 1995); Huber v. Commissioner,T.C. Memo 2006-96; 2006 Tax Ct. Memo LEXIS 97 (May 9, 2006); Estate of Frazier Jelke III v.Commissioner, T.C. Memo 2005-131 (May 31, 2005); Estate of Webster E. Kelley v. Commissioner, T.C.Memo 2005-235 (Oct. 11, 2005). See the American Institute of Public Accountants, Statement on Standardsfor Valuation Services, para 40, available at(http://www.aicpa.org/InterestAreas/ForensicAndValuation/DownloadableDocuments/SSVS_Full_Version.pdf): “During the course of a valuation engagement, the valuation analyst should consider whether valuationadjustments (discounts or premiums) should be made to a pre-adjustment value. Examples of valuationadjustments for valuation of a business, business ownership interest, or security include a discount for lack ofmarketability or liquidity and a discount for lack of control.” (Emphasis in the original.)
Attachment No. 2 IURC Cause No. 45064
Indiana Exchange Carrier Association, Inc. Page 43 of 173
Attachment B

Page 34 of 79
1047102.2
Q. Can you expand on your comments about adjusting for illiquidity or lack of1
marketability?2
A. I will not make any specific adjustments in this testimony for illiquidity or lack of3
marketability, but I note that the omission of such a premium is a further signal of the4
conservatism of the estimates in this analysis. Financial professionals have developed5
a consensus view that cost of capital should be adjusted based on size effects, as6
explained above. However, in addition, there is a convincing case that there should be7
another premium related to liquidity/marketability. Because the size effect premium is8
premised on larger or smaller stocks that are marketable and liquid, a premium to9
account for insufficient marketability and liquidity can, and likely should, also be10
applied. In 2009, the IRS provided a 115-page “Discount for Lack of Marketability:11
Job Aid for IRS Valuation Professionals” in which the IRS authors, clarifying that the12
document was not the official position of the IRS, set out the study’s purpose “to13
identify issues around [the discount for lack of marketability or ‘DLOM’] and to14
present techniques to assist valuators in the field [with information] . . . of value not15
only to our own personnel but also to our valuation customers.”36 The guide does not16
recommend a specific approach or premium but concludes that the DLOM in the17
marketplace may be 20% to 25% based on Securities and Exchange (“SEC”) studies,18
approximately the same amount based on tax court rulings.37 Thus, there is evidence19
36 IRS Engineering/Valuation Program DLOM Team, Discount for Lack of Marketability: Job Aid for IRSValuation Professionals, September 25, 2009, available at http://www.irs.gov/pub/irs-utl/dlom.pdf, [hereafter“IRS DLOM”], p. 1.37 IRS DLOM, p. 77: “Greatest weighting of [SEC-study] transactions occurred within the ‘15%’ and ‘25%’implied discount groupings. This suggests a most-common discount for lackof marketability of 20%”; p. 80: “the valuator will review the results of several cases such as McCord, Lappoand Peracchio and then base the choice of discount on the discounts accepted by the court in the reviewed
Attachment No. 2 IURC Cause No. 45064
Indiana Exchange Carrier Association, Inc. Page 44 of 173
Attachment B

Page 35 of 79
1047102.2
that an adjustment should be made related to both size and lack of marketability. It1
has been my experience that marketability is reduced further in environments where2
investors find that regulatory obligations are greater than in other jurisdictions and3
where sales are perceived to be accompanied by more challenging regulatory4
conditions. While I am convinced that such a discount for lack of marketability likely5
should be included, the omission of such a discount makes the inclusion of a size6
premium even more critical in the calculation of the cost of equity to assure an7
appropriate return on equity.8
V. INDUSTRY CHANGES THAT AFFECT THE CORPORATE COST OF CAPITAL9
FOR SMALL ILECS.10
Q. Please summarize the major changes in the ILEC industry that have affected the11
cost of equity for the Independent Small LECs.12
A. Over the last 15-20 years, changes have occurred that have dramatically increased risk13
for ILECs in general and notably for the small, rural ILEC industry, including the14
carriers involved in this proceeding. The changes can be explained as sequential15
forces. Technology changes accelerated, increasing the number of competitors. New16
competitors have forced changes in regulatory systems. And the changed regulations,17
particularly for ILECs focused on less economic service regions, have created a18
significant uncertainty among debt and equity investors.19
cases. For example, the range of court discounts might have been from 20% to 25% so the valuator chooses22.5% with the rationale that his valuation subjectis similar to the subjects under consideration in the cases cited. Judges are sometimes found to adopt thisapproach as well. The judge will look at McCord with its 20% discount and add a factor of say 3% based onhis analysis of the special factors of his case to arrive at a chosen DLOM level of 23%.” p. 80: “Wruck found adiscount for lack of marketability of 17.6%, Hertzel & Smith found a discount of 13.5% for lack of liquidity orthat Bajaj et al determined that the discount for lack of marketability should be 7.23%.”
Attachment No. 2 IURC Cause No. 45064
Indiana Exchange Carrier Association, Inc. Page 45 of 173
Attachment B

Page 36 of 79
1047102.2
Q. How have technology changes affected the telecommunications marketplace?1
A. The pattern is clear that competitors are using new technologies – notably using IP-based and2
wireless platforms – to target customers in highly-profitable markets and then subsequently adding3
customers in relatively less profitable markets. As digital technologies developed and wireless has4
become more pervasively reliable, competitors have been able to attract not only business customers,5
but also residential customers. Figure 1 and6
7
8
9Figure 2, below, depict current nationwide data from USTelecom, the major ILEC trade10
organization, which tracks access line loss and competitive market share.38 Notably,11
the competitive losses of voice services have remained significant over time and the12
“voice” losses are primarily driven by the migration toward wireless service.13
Figure 1: Annual Switched Access Line Loss14
15
38 Patrick Brogan, Voice Competition Has Ended ILEC Dominance, (Washington, DC: US Telecom, April2014), available at http://www.ustelecom.org/blog/voice-competition-has-ended-ilec-dominance-0.
Attachment No. 2 IURC Cause No. 45064
Indiana Exchange Carrier Association, Inc. Page 46 of 173
Attachment B

Page 37 of 79
1047102.2
Source: US Telecom, April 2014.1
2345
Figure 2: Share of Nationwide U.S. Households6
7
Source: US Telecom, April 2014.8
Q. Is increased competition a positive development as competitors and ILECs offer9
products more efficiently?10
A. Yes, as a general matter, competition is a constructive force that, in the big picture,11
benefits customers. The competitive thrust into rural America is also positive from a12
broad policy perspective, but it is notable that competitive gains appear to be13
concentrated in clustered populated regions or along major roadways where customers14
can be served economically. It is also notable that competition is significant, even15
when the markets have not been designated as “competitive” by regulators, because16
wireless is the primary threat to landline residential voice service, even where it is not17
Attachment No. 2 IURC Cause No. 45064
Indiana Exchange Carrier Association, Inc. Page 47 of 173
Attachment B
Page 38 of 79
1047102.2
a complete functional substitute.39 Intermodal competitive threats have meant that1
rural ILECs are left with an increasingly higher proportion of high-cost and often2
uneconomic properties along with a Carrier of Last Resort (“COLR”) responsibility3
that requires them to fulfill any reasonable request within their defined service4
territories. Recent FCC policy has amplified this effect by requiring rural carriers to5
fulfill all reasonable requests for broadband access at specified download and upload6
speeds.40 The result is approximately the same fixed network costs and investments7
but fewer customers over which to spread those costs.8
I generated a study related to this problem, relying on extensive data in Texas.41 The9
Texas study evaluated 350,000 access lines, using confidential financial data. Among10
other conclusions, the study highlighted that without universal service funding, 77% of11
the rural wire centers generated on average a negative 9.7% return on investment. And12
13% of the wire centers generated an average positive return of 2.9% , which was13
insufficient to justify investment. Finally, 10% of the wire centers generated a 10%14
return or higher. The conclusion was that, without universal service support funding15
(“USF”), 90% of the wire centers are candidates to lose service entirely. From a16
financial perspective, then, the vast majority of rural wire centers are uneconomic –17
39 Even where wireless service may not be ubiquitously functional, as I understand is the case in manyIndependent Small LEC areas, some customers choose wireless services as a substitute for wireline service.This phenomenon makes wireless services a serious threat to the financial stability of a rural telephonecompany in spite of the fact that the wireless service may be less reliable or not ubiquitously available forcustomers..40 See FCC Connect America Fund ETC Order, FCC 14-190 (rel. Dec. 18, 2014) (establishing the 10 Mbpsdownload / 1 Mbps upload standard as a requirement for receipt of federal high-cost support).41 Michael J. Balhoff, Robert C. Rowe, and Bradley P. Williams, Universal Service Funding: Realities ofServing Telecom Customers in High-Cost Regions, (Columbia, MD: Balhoff & Rowe, 2007), available athttp://www.balhoffrowe.com/pdf/USF%20Funding%20Realities%20of%20Serving%20Telecom%20Customers%20in%20High%20Cost%20Regions%207-9-07.pdf.
Attachment No. 2 IURC Cause No. 45064
Indiana Exchange Carrier Association, Inc. Page 48 of 173
Attachment B
Page 39 of 79
1047102.2
and would not be served – absent high-cost support. The data in that 2007 report1
assumed that the ILEC would continue to have intercarrier compensation revenues and2
margins. This study also relied on the assumption that the universal service system3
would continue in substantially the same form as it had for the decade preceding 2007.4
However, the most recent FCC reform in November 2011 has mandated the5
elimination of terminating access charges by 2020 and implemented a sweeping and6
evolving set of reforms of the federal universal service system.42 The import of the7
2011 reforms is that the financial outlook for small carriers is today more dire than the8
cases I studied in 2007, where the situation was already challenging.9
Q. Does the rate-of-return regulatory platform or the Independent Small LECs’10
access to California High Cost Fund A (“CHCF-A”) shield the Independent Small11
LECs from the effects which you describe?12
A. The Independent Small LECs are not shielded if there is a failure to determine and set13
appropriate rates of return. While the rate-of-return regulatory structure should result14
in a fair opportunity for companies to earn a reasonable rate of return, that opportunity15
only exists to the extent that the rate structure is set, based on reasonable assumptions.16
Rate-of-return regulation provides no guarantee that a company will achieve any17
particular revenue level, and I believe that CHCF-A support is not retroactively18
increased to remedy revenue shortfalls that carriers may have incurred. Moreover, I19
42 Connect America Fund, WC Docket No. 10-90, A National Broadband Plan for Our Future, GNDocket No. 09-51, Establishing Just and Reasonable Rates for Local Exchange Carriers, WC Docket No.07-135, High-Cost Universal Service Support, WC Docket No. 05-337, Developing an UnifiedIntercarrier Compensation Regime, CC Docket No. 01-92, Federal-State Joint Board on UniversalService, CC Docket No. 96-45, Lifeline and Link-Up, WC Docket No. 03-109, Universal Service –Mobility Fund, WT Docket No. 10-208, Report and Order and Further Notice of Proposed Rulemaking,26 FCC Rcd. 17663 (2011) (“USF/ICC Transformation Order”).
Attachment No. 2 IURC Cause No. 45064
Indiana Exchange Carrier Association, Inc. Page 49 of 173
Attachment B

Page 40 of 79
1047102.2
believe that the Commission has introduced certain high-cost fund reductions from the1
federal system and applied them to CHCF-A calculations, including the imposition of2
a “corporate cap” that is designed to disallow companies’ corporate expenses. See3
D.14-12-084, at p. 101 (O.P. 3). Further, the CHCF-A program remains under review4
in R.11-11-007, and the scope of that proceeding could further threaten Independent5
Small LEC revenue streams. See D.14-12-084, at p. 12.43 Regulatory changes and6
risks must be taken as a whole in assessing the financial stability of carriers whose7
service is targeted to customers in a high proportion of less-economic regions.8
43 Notably, this decision defines Phase 2 to include a reconsideration of whether rate of return regulation willcontinue and other major potential changes to the regulatory structure under which the Independent SmallLECs operate. I offer no opinion as to the likelihood of any of these adjustments being made, but theircontinued consideration underscores the profound uncertainty and associated risk that Independent areexperiencing.
Attachment No. 2 IURC Cause No. 45064
Indiana Exchange Carrier Association, Inc. Page 50 of 173
Attachment B
Page 41 of 79
1047102.2
Q. Is support for wireline networks less important given the rise of wireless services?1
A. No, it would not be correct to say that wireless is the future of all telecommunications.2
I make this point because the Commission might ask whether it is appropriate to3
maintain a utility, and hence its cost of capital, if the industry is dying. I do not4
believe the wireline industry is dying, but rather I believe that it is evolving toward a5
new core service. I note that customers are today increasingly reliant on broadband,6
which is now an important service. The FCC’s 2011 reforms of USF and intercarrier7
compensation (“ICC”) outlined this migration in its USF/ICC Transformation Order8
cited above. At paragraph 10 of the USF/ICC Transformation Order, the FCC stated9
that it was “modernizing USF and ICC from supporting just voice service to10
supporting voice and broadband, both fixed and mobile, through IP networks is11
required by statute.”12
Broadband is likely to remain primarily a wired service. The FCC reported in 200913
that the average monthly consumption of wired data services was 9 gigabytes (“GB”)14
and the agency expected the average to rise to 15 GB by the end of 2010.44 The FCC15
now reports that the average fiber user and average DSL user consumes each month 3216
GB and 22 GB of data, respectively.45 The growth in volume is up over a year ago by17
42% and 79%, respectively. Further “proving” the value of the wired broadband18
network, the two dominant U.S. wireless carriers—Verizon and AT&T, Inc.19
(“AT&T”)—have invested, respectively, over $20 billion in FiOS and over $14 billion20
44 FCC, Broadband Performance, OBI Technical Paper No. 4, available at http://transition.fcc.gov/national-broadband-plan/broadband-performance-paper.pdf, p. 6.45 FCC, A Report on Consumer Wireline Broadband Performance in the U.S., Charts 19 and 20; available athttp://www.fcc.gov/measuring-broadband-america/2013/February.
Attachment No. 2 IURC Cause No. 45064
Indiana Exchange Carrier Association, Inc. Page 51 of 173
Attachment B
Page 42 of 79
1047102.2
in U-verse.46 The reason for that huge capital commitment is that the average home or1
business uses too much bandwidth to be cost-effectively served by a commercial2
wireless provider at today’s rates. Furthermore, a consumer, using today’s average3
wireline volumes, would be required to pay over $200 monthly for commercial4
wireless broadband from Verizon Wireless or AT&T Wireless. Commercial wireless5
is not today a substitute, and, in my opinion, is not likely to be a price-effective6
substitute in the foreseeable future in light of the growing demand for broadband7
bandwidth.8
In short, wireless and wireline platforms provide complementary services. Consumers9
currently rely on data-centric communications services that are growing at a rapid rate,10
requiring carriers to continue to invest in wireline plant that is not likely to be replaced11
by commercial wireless services. The federal policy is clear that both wireless and12
wireline services will be needed and should be supported in rural and low-density13
regions, as ubiquitous, high-quality wired service will continue to be important, and14
will likely remain a major policy goal for the foreseeable future.4715
Q. What do you mean by the statement that investors are more uncertain about the16
wireline industry than they have been in the past?17
46 While Verizon and AT&T have slowed or stopped high levels of investment in recent years, the reasonrelates to the fact that they have completed their buildout in higher density regions, and those companies haveapparently determined that certain lower-density regions are too expensive or that there are alternativebusinesses in which to invest capital to earn superior returns (compared with the low-density regions.)47 See USF/ICC Transformation Order, para. 10: “Under these circumstances, modernizing USF and ICCfrom supporting just voice service to supporting voice and broadband, both fixed and mobile, through IPnetworks is required by statute. The Communications Act directs the Commission to preserve and advanceuniversal service: ‘Access to advanced telecommunications and information services should be provided in allregions of the Nation.’ It is the Commission’s statutory obligation to maintain the USF consistent with thatmandate and to continue to support the nation’s telecommunications infrastructure in rural, insular, andhigh-cost areas.”
Attachment No. 2 IURC Cause No. 45064
Indiana Exchange Carrier Association, Inc. Page 52 of 173
Attachment B
Page 43 of 79
1047102.2
A. Investors are now assigning lower valuations (higher required return on equity) to1
ILECs and becoming even more cautious in light of the regulatory uncertainty and the2
changing competitive marketplace. The equity prices of the ILEC-centric carriers, that3
is, those without major wireless operations, have lagged, as is illustrated in Figure 3.4
The graphic provides an indexed view beginning in 2000 for the stock prices of5
CenturyLink (ticker symbol CTL), Frontier (FTR) and Windstream (WIN), and6
tracking their performance relative to the S&P 500, which is widely used as an index7
for the overall market.48 The three carriers are the largest of the publicly-traded ILECs8
with no wholly-owned wireless business and with extensive service in rural areas.9
Figure 3 illustrates that, from the low point in the market collapse in 2008, the S&P10
500 has sharply outperformed the three ILEC companies, which I believe are11
approximately representative of investor sentiment about ILECs prior to considering12
any “size effects” or rural carrier regulatory risks. The stocks of CenturyLink and13
Windstream have outperformed Frontier’s stock, in part because those two carriers14
have diversified within the last five years into business and data services where15
investors may be expecting higher growth. Windstream’s stock weakened at the end16
of April 2015, as the company spun-off its operating assets to a real estate investment17
trust (“REIT”) in a sales-leaseback, and investors appear to be uncertain about18
valuations for the surviving operating company and the REIT. Frontier has the largest19
percentage of ILEC-only operations and has at least recently slipped below the20
performance of the other two carriers and that of the S&P 500. It is my conviction that21
the market has a negative view of the ILEC businesses, and this graphic is illustrative22
48 Standard & Poor's 500, is a widely-used stock market index based on the market capitalizations of 500 largecompanies having common stock listed on the NYSE or NASDAQ.
Attachment No. 2 IURC Cause No. 45064
Indiana Exchange Carrier Association, Inc. Page 53 of 173
Attachment B
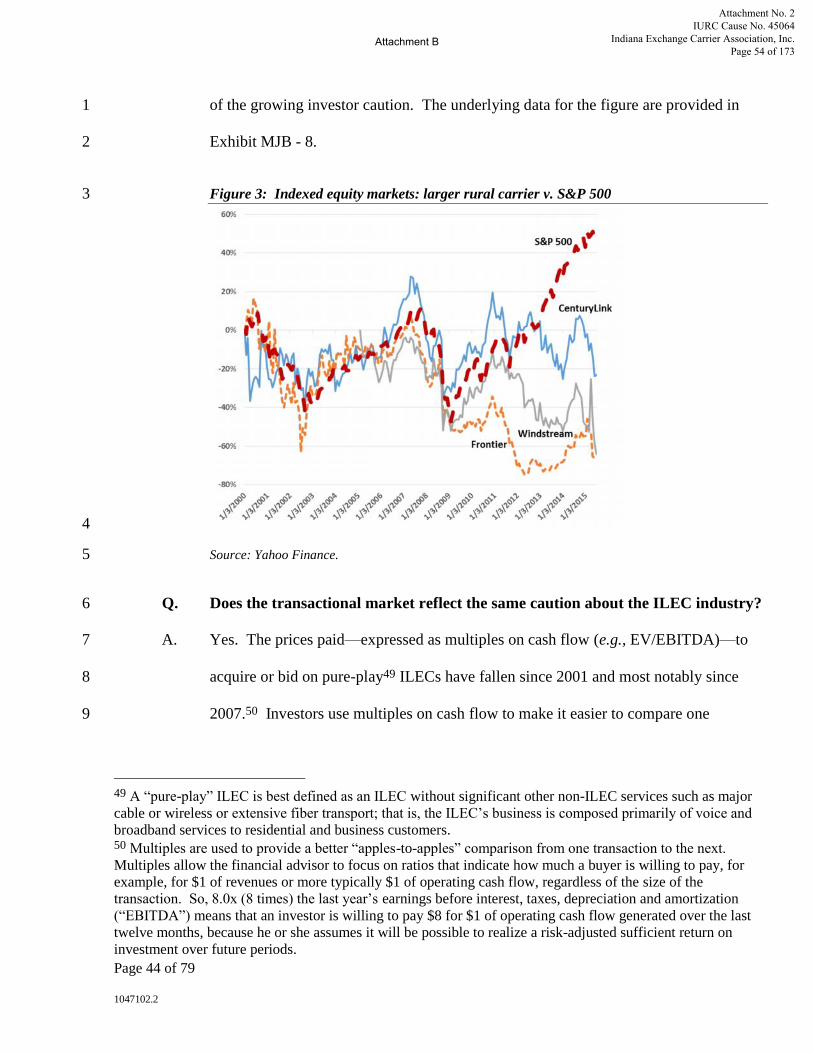
Page 44 of 79
1047102.2
of the growing investor caution. The underlying data for the figure are provided in1
Exhibit MJB - 8.2
Figure 3: Indexed equity markets: larger rural carrier v. S&P 5003
4
Source: Yahoo Finance.5
Q. Does the transactional market reflect the same caution about the ILEC industry?6
A. Yes. The prices paid—expressed as multiples on cash flow (e.g., EV/EBITDA)—to7
acquire or bid on pure-play49 ILECs have fallen since 2001 and most notably since8
2007.50 Investors use multiples on cash flow to make it easier to compare one9
49 A “pure-play” ILEC is best defined as an ILEC without significant other non-ILEC services such as majorcable or wireless or extensive fiber transport; that is, the ILEC’s business is composed primarily of voice andbroadband services to residential and business customers.50 Multiples are used to provide a better “apples-to-apples” comparison from one transaction to the next.Multiples allow the financial advisor to focus on ratios that indicate how much a buyer is willing to pay, forexample, for $1 of revenues or more typically $1 of operating cash flow, regardless of the size of thetransaction. So, 8.0x (8 times) the last year’s earnings before interest, taxes, depreciation and amortization(“EBITDA”) means that an investor is willing to pay $8 for $1 of operating cash flow generated over the lasttwelve months, because he or she assumes it will be possible to realize a risk-adjusted sufficient return oninvestment over future periods.
Attachment No. 2 IURC Cause No. 45064
Indiana Exchange Carrier Association, Inc. Page 54 of 173
Attachment B

Page 45 of 79
1047102.2
transaction or one valuation with another.51 In 2001, as detailed in Exhibit MJB - 5,1
there were three rural ILEC transactions at an average price that was 10.2 times last-2
twelve-month trailing EBITDA.52 Figure 4 illustrates more recent, large and medium-3
sized ILEC transactions since the beginning of 2006, depicting how the pricing trend,4
based on multiples of EV to EBITDA, has weakened.53 In the period since the end of5
2008, the average purchase price of the seven announced transactions was 5.4 times6
EBITDA.54 Because small ILECs do not typically announce sale prices, most of the7
data remain confidential and we are not able to discuss specific pricing for certain8
transactions on which we have worked. However, my partners and I have been9
reporting in our presentations at conferences that the “going rate” for a pure-play ILEC10
appears to have collapsed to approximately 4.5 to 5.5 times trailing (last full year)11
EBITDA, which means that the value today is about half the value reflected in the12
EBITDA multiples realized in 2001 and about 56% to 69% (based on 4.5x and 5.5x13
51 Multiples are standardizations. In the financial world, multiples are analogous to housing prices per squarefoot, or, for tires, pounds per square inch. Big homes can be compared with small homes, and inflation in largetires with inflation in small tires.52 In 2001, Country Road acquired Saco River (8.5x trailing EBITDA), TDS acquired MCT, Inc. (9.6x), andD&E acquired Conestoga (12.5x).53 Again, the data are included in Exhibit MJB - 5. The abbreviations include CNSL (ConsolidatedCommunications), CTCO (Commonwealth Telephone), CTL (CenturyTel which became CenturyLink),CZN/FTR (Citizens Communications which became Frontier), D&E (D&E Communications), SNET(Southern New England Telephone which are the Connecticut operations of AT&T), WIN (Windstream), andVZ (Verizon). The green bubbles (FairPoint-Verizon, CenturyTel-Embarq, Frontier-Verizon, andCenturyLink-Qwest) in the graphic were tax-advantaged transactions (Reverse Morris Trusts or stock-for-stock), which means that the sales prices would likely have been somewhat higher if there had been no taxbenefits. In the case of several recent transactions, the prices were higher than they might otherwise have beenbecause they included non-ILEC operations that added incremental value (Windstream-Iowa Telecom,Blackfoot-FairPoint, and Consolidated-SureWest, Consolidated-Enventis), which also suggests that the pureILEC value is lower than the bubble depicts. For example, the Iowa Telecom sale included $130 million in netoperating losses, which means that the EV/EBITDA calculation should be adjusted lower.54 Charlesmead has tracked 71 transactions in the period announced from the beginning of 2008 to the present,and has provided services related to nine announced ILEC transactions in that period. The publicly-availabledata are unfortunately scarce, but our public discussions at conferences over the last several years providescorroboration of this testimony.
Attachment No. 2 IURC Cause No. 45064
Indiana Exchange Carrier Association, Inc. Page 55 of 173
Attachment B

Page 46 of 79
1047102.2
EBITDA) of the 8.0 times EBITDA value realized on average between 2001 and the1
end of 2007.55 To be clear, investors appear to be signaling that there is significantly2
greater risk today compared with ten years ago or even five years ago, as will be3
discussed further below.4
55 The most recent transactions are Consolidated Communications’ purchase of Enventis which includedsubstantial fiber transport (4,200 miles) and business-centric services (business and broadband account formore than 50% of revenues), providing the reason for the relatively high valuation, and FrontierCommunications’ proposed purchase of Verizon’s operations in three states, including California, where thevaluation of 5.9x EV/EBITDA is likely lower as Frontier reports that it is paying 3.7 times EBITDA afterexcluding avoided (unallocated) costs on Day 1 of the acquisition. The statistics above use Day 1 EBITDAcalculations for the Frontier-AT&T transaction (announced Day 1 EV/EBITDA of 4.8x, Frontier’s FinancialAnalyst presentation 12/17/13, slide 3) and for the proposed Frontier-Verizon transaction (Frontier’s FinancialAnalyst presentation, 2/5/15, slide 6); and Enventis is excluded because it is not appropriate to compare afiber-transport and business-centric company to ILEC-only operations. Illustrating the presentations we havemade, I have attached a slide deck projected and distributed June 16, 2014 as part of my keynote for theGeorgia Telecom Association; I cited at slide 7 that the appropriate value for ILEC assets was 5.0x trailingEBITDA; see Exhibit MJB - 6.
Attachment No. 2 IURC Cause No. 45064
Indiana Exchange Carrier Association, Inc. Page 56 of 173
Attachment B

Page 47 of 79
1047102.2
Figure 4: Reported Multiples on EBITDA for ILEC Acquisitions12
3
Source: Company press releases and filings.4
Q. Are there cautionary signs in the debt markets for small ILECs?5
A. Yes. Lenders have become more cautious in lending to small ILECs, if the banks are6
willing to lend at all to the carriers. For example, CoBank ($95 billion in assets),7
which has been a large lender to rural wireline companies, reports that it is making few8
loans, almost none of which are principally for infrastructure improvements. CoBank9
sent a letter to the FCC in 2012 that elucidates its concerns about the current10
regulatory environment for the financial viability of rural ILECs:11
CoBank is concerned about the negative impact the USF/ICC12Transformation Order (the Order) . . . . Unfortunately, we view13many of the provisions of the Order . . . as antithetical to that goal.14Affordable broadband for all Americans cannot be achieved15without increasing the funding spent to support broadband16deployment. The rate-of-return regulated Rural Local Exchange17Carrier has historically done the lion’s share of the work in18deploying truly robust broadband in rural America. Instead of19trying to find ways to cut and curtail support to these carriers, we20continue to believe the Commission’s goals would be better served21in finding ways to help these carriers continue to succeed in their22
Attachment No. 2 IURC Cause No. 45064
Indiana Exchange Carrier Association, Inc. Page 57 of 173
Attachment B

Page 48 of 79
1047102.2
decades-long mission of bringing modern telecommunications1services to their subscribers. 562
3Similarly, the RUS, which is part of the Department of Agriculture, has $4.7 billion in4
principal outstanding for telecom infrastructure loans and the Farm Bill Broadband5
Loan Program. The RUS has been able to place its full loan portfolio every year that I6
have been able to track—until 2012 (immediately after the FCC’s November 20117
Transformation Order) when borrowers were lent only 11.6% of the $690 million that8
was available. This means that the RUS and/or the borrowers have become more9
cautious in light of regulatory instability in the industry. Further, of another $73610
million available for RUS broadband loans, only 9.4% ($68.9 million) was placed with11
carriers in 2012.57 As presented in Table 2, the percentage of available funding placed12
in 2013 and 2014 improved to 28% and 31%, respectively, but it is still profoundly13
troublesome that total dollars loaned declined by more than two-thirds from the pre-14
2012 levels even in the most recent period. Our conversations with companies and15
with the RUS indicate that the low investment is a combination of caution at the RUS16
and uncertainty among the companies. In either case, the financial import is similar.17
56 Letter of Robert F. West to FCC, Marlene H. Dortch, May 18, 2012, available athttps://prodnet.www.neca.org/publicationsdocs/wwpdf/0511cobank.pdf.57 The United States Department of Agriculture / Rural Development, “The Telecommunications Program,”presentation by RUS Deputy Administrator Jessica Zufolo to the National Association of Regulatory UtilityCommissioners, Washington, DC, February 2, 2013; see Exhibit MJB - 9, slide 5. See, also, “Vilsack, RUSMeet With Genachowski To Discuss The Need For More Changes In Implementation Of USF-ICCTransformation Order: Warn Of Unintended Consequences And Need For USF-ICC Support To Be Sufficientand Predictable,” Independent Telecom Report, Volume 12, Issue 3 (February 18, 2013), pp. 3-5); “In themeeting [with FCC Chairman Julius Genachowski and his staff], [Secretary Vilsack and] USDA officials notedthat demands for RUS loans dropped dramatically in 2012. RUS reported “demand” for only 37 percent of thefunds that were actually appropriated by Congress. USDA cited the reductions in USF and ICC that will resultfrom the implementation of the FCC’s Transformation Order as the reason for the decline in loan applications.Rural carrier advocates have noted that the reduced loan activity reflects the adverse impact of the FCC Orderon infrastructure investment and rural community economic development.” The figures were also reported inan ex parte filed at the FCC on February 15, 2013. The reconciliation is that the “demand” for loans wasreported as 37% according to Secretary Vilsack, but the RUS actually “obligated” the amounts reported by Ms.Zufolo.
Attachment No. 2 IURC Cause No. 45064
Indiana Exchange Carrier Association, Inc. Page 58 of 173
Attachment B

Page 49 of 79
1047102.2
Table 2: RUS loan activity to traditional telecommunications1
2
As important or possibly more important than the overall trend, it appears that the3
lower costs of debt are generally unavailable to the small ILECs, based on the4
comments from CoBank cited above and the statistics of the RUS.5
6
7
8
VI. CALCULATION OF AN APPROPRIATE RANGE AND ESTIMATE FOR EQUITY9
COSTS.10
Q. How does the changing ILEC marketplace affect the Independent Small LECs’11
cost of equity?12
A. The federal rate of return was adopted as 11.25% in 1990 and reiterated in the FCC’s13
Multi-Association Group Order of 2001. It is difficult to believe or argue that the14
appropriate return on equity is lower today. In fact, industry risks are demonstrably15
greater than ten or twenty or twenty-five years ago, as described in the previous16
section of this testimony. In 1990, the ILEC industry had monopoly characteristics;17
Fiscalyear
Loansapproved
Amount($000)
Availablefunding($000)
% ofavailablefunding
2011 41 689,999 690,000 100.0%2012 7 79,765 690,000 11.6%2013 13 196,159 690,000 28.4%2014 14 213,993 690,000 31.0%
2015*
13 203,783 690,000 29.5%Total 88 1,383,699 3,450,000 40.1%
*Approximate as of end of fiscal year, June 2015.
Source: Rural Utilities Service
Attachment No. 2 IURC Cause No. 45064
Indiana Exchange Carrier Association, Inc. Page 59 of 173
Attachment B
Page 50 of 79
1047102.2
there was ongoing growth in switched minutes of use and in access lines; the carriers1
had virtually 100% market share across which to manage internal cost-shifting and the2
high fixed-cost nature of the business; and there was a regulatory safety net that was3
predictable and well understood.4
There is only one change since 1990 that might reduce the appropriate return on5
equity, and that is the lower cost of debt in the last several years, but this factor is far6
outweighed by the profound countervailing risks of the current environment. Further,7
with respect to today’s debt levels, I note that most observers believe the Fed has been8
committed to an “unsustainable” approach in manipulating interest rates to low levels,9
which means that the forward-looking rates are likely to be significantly higher than10
today’s rates.58 I provide data related to the change in debt costs in a later section of11
this testimony. However, low interest rates can only be part of a cost of capital12
calculus if they are really available in the future. The evidence for rural carriers points13
toward increased risks, lesser availability of debt, and the probability of higher interest14
rates going forward for the general market and for the ILECs, assuming debt capital15
can even be obtained given the uncertainties affecting the rural telecommunications16
industry.17
Q. How do you derive the specific inputs appropriate for use of the CAPM and the18
Buildup calculations to be developed in this proceeding?19
A. The inputs most commonly used for the CAPM or Buildup Models are drawn from20
data compiled in annual publications from Ibbotson/Morningstar and from Duff &21
Phelps. The publications provide statistical information about annual risk-free rates,22
58 Duff & Phelps 2015 Valuation Handbook Guide to Cost of Capital, p. 3-3; see Exhibit MJB - 2.
Attachment No. 2 IURC Cause No. 45064
Indiana Exchange Carrier Association, Inc. Page 60 of 173
Attachment B

Page 51 of 79
1047102.2
annual returns on equity for the market as a whole, and returns for specific industries1
relative to the overall market. Ibbotson/Morningstar has continued to publish its2
Classic Yearbook, but it ceased publishing its Valuation Handbook after 2013. The3
Ibbotson valuation data and analyses are now consolidated into the publications4
provided by Duff & Phelps, as of 2015. I make reference in this testimony to both5
sources, which are the principal authoritative resources.6
Q. Do you use cost of equity inputs from different periods?7
A. Yes. I provide input from several different periods. The approach is consistent with8
my professional view that multiple methodologies help to test assessments of the costs9
of equity. The expectations for returns on the “risk-free rate,” returns on the equity10
market and returns on specific industries vary from one period to the next. Inflation11
may be high or low; the stock market may be depressed or inflated; and the global12
markets may be affected by turbulence (higher risk) or more peaceful growth (lower13
risk). We are using inputs from longer periods to reduce the effects of cyclical14
conditions that may show up in the data. And we assess different periods to compare15
returns to confirm our findings with respect to a “normalized” expectation of equity16
returns (costs).17
Q. Is it appropriate to use lower risk-free rates from one period and lower market18
equity returns from another period to create a lower estimate for costs of equity?19
Attachment No. 2 IURC Cause No. 45064
Indiana Exchange Carrier Association, Inc. Page 61 of 173
Attachment B

Page 52 of 79
1047102.2
A. No. The statistical data compiled by Ibbotson and Duff & Phelps provide information1
about the equity returns in a period relative to the risk-free rate in that same period.592
The markets expect certain returns in total, which include that period’s risk-free rate3
and that period’s equity premium. It is not appropriate to use a market equity risk4
premium derived from one period with a risk-free rate from another period. Again, I5
provide information for several periods so the Commission can confirm that the6
estimates are reasonable.7
Q. What periods are most appropriate to use in computing the cost of equity for the8
Independent Small LECs?9
A. I begin with the longest period available, which is the Ibbotson data from 1926 to10
2014. I also use readily available information in the most recent Duff & Phelps 201511
Valuation Handbook, which details inputs for the period from 1963 to 2014, Finally, I12
use the Ibbotson years 1995 to 2014, which are absorbed into and reported in the Duff13
& Phelps 2015 Valuation Handbook. I provide specific citations to each of these14
sources in my subsequent testimony. The CAPM/Buildup data are included in Table 315
below. I also present the Duff & Phelps Risk Premium data in the final column for16
1963 to 2014. As I will explain below, the Duff & Phelps’ Risk Premium approach17
uses a different size premium, which is more general because it does not include an18
industry-specific or company-specific adjustment.19
59 Duff & Phelps 2015 Valuation Handbook Guide to Cost of Capital, p. 3-1; “The risk-free rate and the ERP[equity risk premium] are interrelated concepts. All ERP estimates are, by definition, developed in relation tothe risk-free rate.” (Emphasis in original); see Exhibit MJB - 2.
Attachment No. 2 IURC Cause No. 45064
Indiana Exchange Carrier Association, Inc. Page 62 of 173
Attachment B
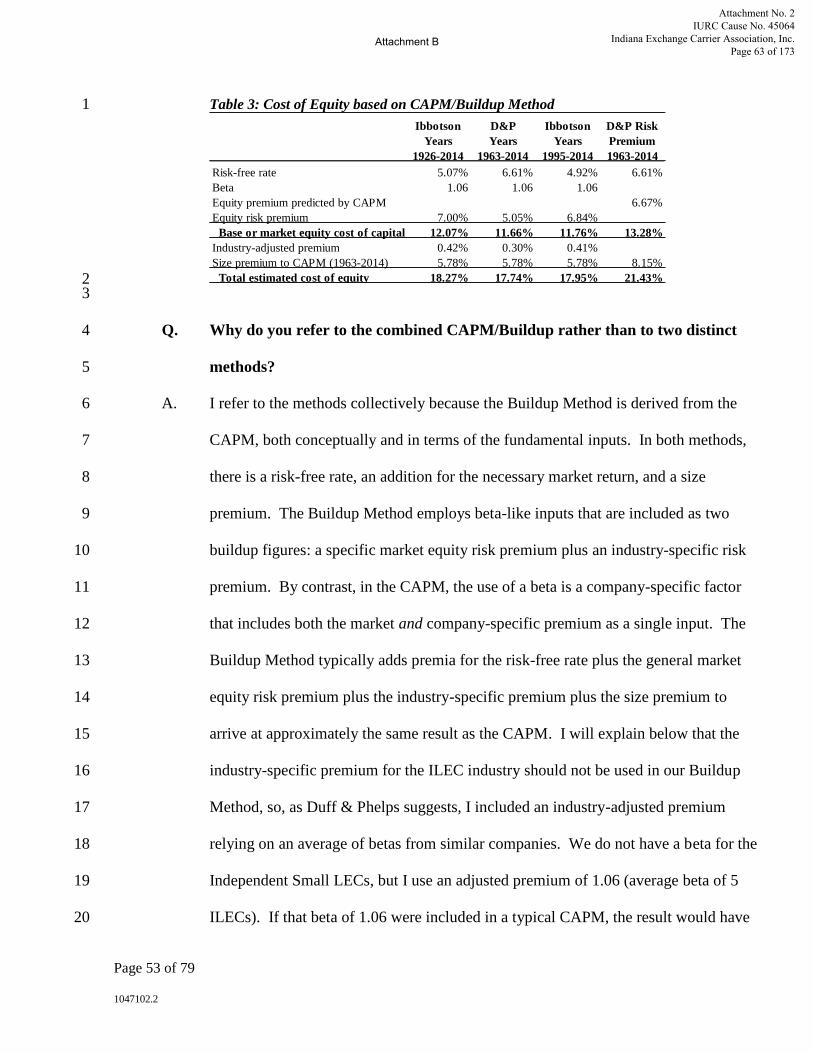
Page 53 of 79
1047102.2
Table 3: Cost of Equity based on CAPM/Buildup Method1
23
Q. Why do you refer to the combined CAPM/Buildup rather than to two distinct4
methods?5
A. I refer to the methods collectively because the Buildup Method is derived from the6
CAPM, both conceptually and in terms of the fundamental inputs. In both methods,7
there is a risk-free rate, an addition for the necessary market return, and a size8
premium. The Buildup Method employs beta-like inputs that are included as two9
buildup figures: a specific market equity risk premium plus an industry-specific risk10
premium. By contrast, in the CAPM, the use of a beta is a company-specific factor11
that includes both the market and company-specific premium as a single input. The12
Buildup Method typically adds premia for the risk-free rate plus the general market13
equity risk premium plus the industry-specific premium plus the size premium to14
arrive at approximately the same result as the CAPM. I will explain below that the15
industry-specific premium for the ILEC industry should not be used in our Buildup16
Method, so, as Duff & Phelps suggests, I included an industry-adjusted premium17
relying on an average of betas from similar companies. We do not have a beta for the18
Independent Small LECs, but I use an adjusted premium of 1.06 (average beta of 519
ILECs). If that beta of 1.06 were included in a typical CAPM, the result would have20
IbbotsonYears
1926-2014
D&PYears
1963-2014
IbbotsonYears
1995-2014
D&P RiskPremium1963-2014
Risk-free rate 5.07% 6.61% 4.92% 6.61%Beta 1.06 1.06 1.06Equity premium predicted by CAPM 6.67%Equity risk premium 7.00% 5.05% 6.84% Base or market equity cost of capital 12.07% 11.66% 11.76% 13.28%Industry-adjusted premium 0.42% 0.30% 0.41%Size premium to CAPM (1963-2014) 5.78% 5.78% 5.78% 8.15% Total estimated cost of equity 18.27% 17.74% 17.95% 21.43%
Attachment No. 2 IURC Cause No. 45064
Indiana Exchange Carrier Association, Inc. Page 63 of 173
Attachment B
Page 54 of 79
1047102.2
been precisely the same as that presented in the table above. I am referring in the table1
to CAPM/Buildup as one and the same in this case because the computations, using2
the proxy beta, generate the same results.3
Q. Please explain the sources for and variations in the risk-free rate.4
A. The risk-free rate is based on the yield of the 20-year U.S. treasury bond, which is5
assumed to be the best credit available over a twenty-year period (expectation that6
there will be no loss of principal and guaranteed dividend payments). This horizon is7
appropriate because we are seeking a rate for companies that expect to be in business8
indefinitely. The risk-free rates used for the 1963-2014 period (6.61%) and 1995-20149
period (4.92%) are drawn from Duff & Phelps’ 2015 Valuation Handbook and the10
Ibbotson/Morningstar 2015 Classic Yearbook, respectively.6011
Q. Are there differences of opinion about which risk-free rate should be used?12
A. Yes. It might be argued—with strong authority—that the appropriate rate is higher13
than the yield alone. According to this school of thought, the risk-free rate is not14
simply the yield for the 20-year treasury bond, but also includes inflation as well as15
maturity risk.61 In certain years, the underlying bond value is up or down, depending16
on fluctuations in market-based interest rates, which affect the price for the bonds. So,17
60 Duff & Phelps 2015 Valuation Handbook Guide to Cost of Capital, p. 7-10 to 7-11 reports that from 1963-2014, “the ‘historical’ average annual long-term equity risk premium is 5.05%. The average annual risk-freerate is 6.61%.” See also Ibbotson, 2015 Classic Yearbook, Long-Term Government Bond Yields, A-9, ExhibitMJB - 2; 4.92% is the monthly average for the period.61 Shannon Pratt and Roger Grabowski, Cost of Capital: Applications and Examples, Third Ed. (Hoboken, NJ:John Wiley & Sons, Inc., 2008) (“Cost of Capital”), p. 71. “The so-called risk-free rate reflects threecomponents: 1. Rental rate. A real return for lending funds over the investment period, thus forgoingconsumption for which the funds otherwise could be used. 2. Inflation. The expected rate of inflation over theterm of the risk-free investment. 3. Maturity risk or investment rate risk. . . . the risk that the principal’smarket value will rise or fall during the period to maturity as a function of changes in the general level ofinterest rates.” This text explains how the 20-year treasury bond can be significantly negative or very high in agiven year, as the underlying bond appreciates or depreciates in the period. See Exhibit MJB - 11.
Attachment No. 2 IURC Cause No. 45064
Indiana Exchange Carrier Association, Inc. Page 64 of 173
Attachment B

Page 55 of 79
1047102.2
while the expected dividend has been paid in a given period, the market-driven price1
of the bond fell or appreciated in the year in question compared with the prior year.2
For example, in 2014, the total return on the 20-year treasury was up 24.5% after3
being down 11.4% in 2013, primarily due to the movement of market-based interest4
rates during those years.62 If I had used the total return for the risk-free rate, Table 35
above would have been replaced by the following table:6
Table 4: Alternative cost of equity calculation with total-return-risk-free rate7
8
I have not used this alternative in my calculations, but point out that this approach is9
supported by significant authorities. A comparison of this table with the previous10
table reveals that this alternative computation, which is included immediately above in11
Table 4, generates higher estimated costs of equity for the first three columns and the12
same cost of equity for the last column. My choice to avoid using this formulation13
again highlights the conservative nature of the approach in this testimony.14
Q. How did you generate the beta to be used in your calculations?15
62 Ibbotson 2015 Classic Yearbook, Table C-4, pp. 2, 4; see Exhibit MJB - 2. See also Tom Copeland et al.,McKinsey & Company, Valuation: Measuring and Managing the Value of Companies (New York: John Wiley& Sons, 1990), p. 192. See Exhibit MJB - 12.
IbbotsonYears
1926-2014
D&PYears
1963-2014
IbbotsonYears
1995-2014
D&P RiskPremium1963-2014
Risk-free rate (2015 Ibbotson Table C-4) 5.70% 7.40% 8.60% 7.40%Beta 1.06 1.06 1.06Equity premium predicted by CAPM 6.67%Equity risk premium 7.00% 5.05% 6.84% Base or market equity cost of capital 12.70% 12.45% 15.44% 14.07%Industry-adjusted premium 0.42% 0.30% 0.41%Size premium to CAPM (1963-2014) 5.78% 5.78% 5.78% 7.36%Size premium above risk-free rate Total estimated cost of equity 18.90% 18.53% 21.63% 21.43%
Attachment No. 2 IURC Cause No. 45064
Indiana Exchange Carrier Association, Inc. Page 65 of 173
Attachment B

Page 56 of 79
1047102.2
A. Duff & Phelps provides industry-specific adjustments that can be used in the1
calculation of the Buildup analysis, which is a useful approach when no company-2
specific beta is available, and such is the case with the Independent Small LECs. The3
industry-specific adjustment relies on data compiled for SIC codes, which, in this case,4
is SIC code 4813 (Telephone Communications, except Radiotelephone).63 The 20155
adjustment for SIC 4813 is recommended to be -1.44%, which would offset the long-6
term historical equity premium (dropping it lower by 1.44%) because the industry7
companies in 4813 are perceived, according to the data in Duff & Phelps, as having8
less risk compared with the overall market. However, Duff & Phelps explains that an9
analyst can review the companies included in the industry-specific group to determine10
whether they are truly comparable, and then Duff & Phelps provides a formula for11
adjusting the industry-specific risk if a “custom” beta is used.64 The companies12
included in SIC code 4813, upon review, are very different from the Independent13
Small LECs, as revealed in a quick glance at the entire list in the footnote below.6514
The companies include CenturyLink, multi-national Cogent which is an Internet15
Service Provider, and General Communications Inc., which is primarily a cable and16
63 Duff & Phelps 2015 Valuation Handbook Guide to Cost of Capital, pp. 5-12 to 5-22. Ibbotson 2015 ClassicYearbook, Appendix C-4, p. 6. See Exhibit MJB - 2.64 Duff & Phelps 2015 Valuation Handbook Guide to Cost of Capital, pp. 5-14 to 5-15; and the adjustment is“(PeerGroupBeta x RPm) – RPm”; see Exhibit MJB - 2. In the CAPM table, the adjustment is (1.06 x theequity risk premium) – equity risk premium, which is shown as the “industry-adjusted industry risk premium.Windstream would have been included in our calculation of the industry beta, but the company recentlydivested its assets, and Value Line now reports Windstream’s beta as “NMF”.65 The company list for SIC 4813 can be downloaded from Duff & Phelps athttp://www.duffandphelps.com/SiteCollectionDocuments/Services/Valuation/Cost%20of%20Capital/March%202015_IRP%20Company%20List_vFINAL%206.15.15.pdf. The companies are Alaska CommunicationsSys., Alteva, AT&T Inc., Cablevision Sys Corp., Centurylink Inc., Cincinnati Bell Inc., CogentCommunications Holdings, Consolidated Communications Holdings Inc., Elephant Talk Communications Inc.,Empire District Electric Co., Frontier Communications, Corp., General Communications, Hawaiian TelcomHoldco Inc., Hc2 Holdings Inc, IDT Corp, Level 3 Communications Inc., LICT Corp, New Ulm Telecom Inc.,Otelco Inc., Sprint Corp., Verizon Communications Inc., Windstream Holdings Inc.
Attachment No. 2 IURC Cause No. 45064
Indiana Exchange Carrier Association, Inc. Page 66 of 173
Attachment B
Page 57 of 79
1047102.2
wireless company. The listed companies serve multiple states and/or non-U.S.1
regions, with a variety of businesses including enterprise services, wireless and cable2
television products. These companies bear no reasonable resemblance to very small,3
localized, wireline carriers with between 300 and approximately 20,000 customers,4
such as the Independent Small LECs. Because of the fundamental differences between5
the SIC Code 4813 proxy group and the Independent Small LECs, I then reviewed6
reports from Value Line Funds to compile betas for companies that might be relatively7
more comparable in terms of concentrated ILEC services and relatively smaller size.8
The companies that are more comparable, in my estimation, are FairPoint9
Communications, Inc. (Value Line beta of 1.4), Telephone & Data Systems, Inc.10
(Value Line beta 1.2), NTELOS Holding Corp. (Value Line beta 1.0), Frontier11
Communications (Value Line beta 0.95) and Consolidated Communications (Value12
Line beta 0.75).66 On the basis of the five companies, I used the average beta of 1.06,13
but believe that the figure is still low for the Independent Small LECs, again because14
the comparison companies are larger and more diversified, thereby likely resulting in15
an understated (too low) beta. This underscores the critical need for a size premium,16
which I will discuss later.17
18
Q. What is the equity risk premium and how do you estimate that premium?19
A. The equity risk premium is the difference between what a risk-free investment—20
generally using the long-term Treasury Bond as a proxy—would generate and what21
stocks in the market over the same period would produce. Generating a market equity22
66 See Exhibit MJB - 13.
Attachment No. 2 IURC Cause No. 45064
Indiana Exchange Carrier Association, Inc. Page 67 of 173
Attachment B

Page 58 of 79
1047102.2
risk premium is a simple exercise in subtraction, taking the total market return or1
expectation, based on historical data, for equities and subtracting the risk-free rate.2
The appropriate market premium data are tabulated in studies such as Duff & Phelps3
2015 Valuation Handbook which builds on the data previously published by4
Ibbotson/Morningstar. In Exhibit 3.10 of the Duff & Phelps Valuation Handbook5
Guide to Cost of Capital, the Handbook reports that the long-horizon equity risk6
premium is 7.0%, which is the observed premium from 1926 to the present. For the7
period from 1963-2014, the equity risk premium is 5.05% as reported by Duff &8
Phelps. For the period from 1995 to 2014, the premium is 6.84% as also reported by9
Duff & Phelps.6710
Q. What size premium should be applied?11
A. As Ibbotson/Morningstar did in the past, Duff & Phelps provides two approaches to12
size premia based on its longer-term observations of data. The size effects can be13
captured by adding them to CAPM results or to the risk-free rate, using one of two14
different size premia, each appropriate to the different respective starting points for the15
analysis. I used the former because the latter approach is less precise, but I also report16
the latter result below. The data, based on statistics from 1963 to the present, are17
compiled in the Duff & Phelps 2015 Valuation Handbook Guide to Cost of Capital in18
the Appendices, with Exhibit B-2 providing size premia above the CAPM and with19
Exhibit A-2 providing size premia over the risk-free rate. I provide the pages from the20
relevant Appendices in Exhibit MJB - 2. The pages in question divide companies into21
groupings (portfolios) ranked by size from 1 to 25, with 25 being the smallest.22
67 Duff & Phelps 2015 Valuation Handbook Guide to Cost of Capital, pp. 7-11 and 3-23. See Exhibit MJB - 2.
Attachment No. 2 IURC Cause No. 45064
Indiana Exchange Carrier Association, Inc. Page 68 of 173
Attachment B
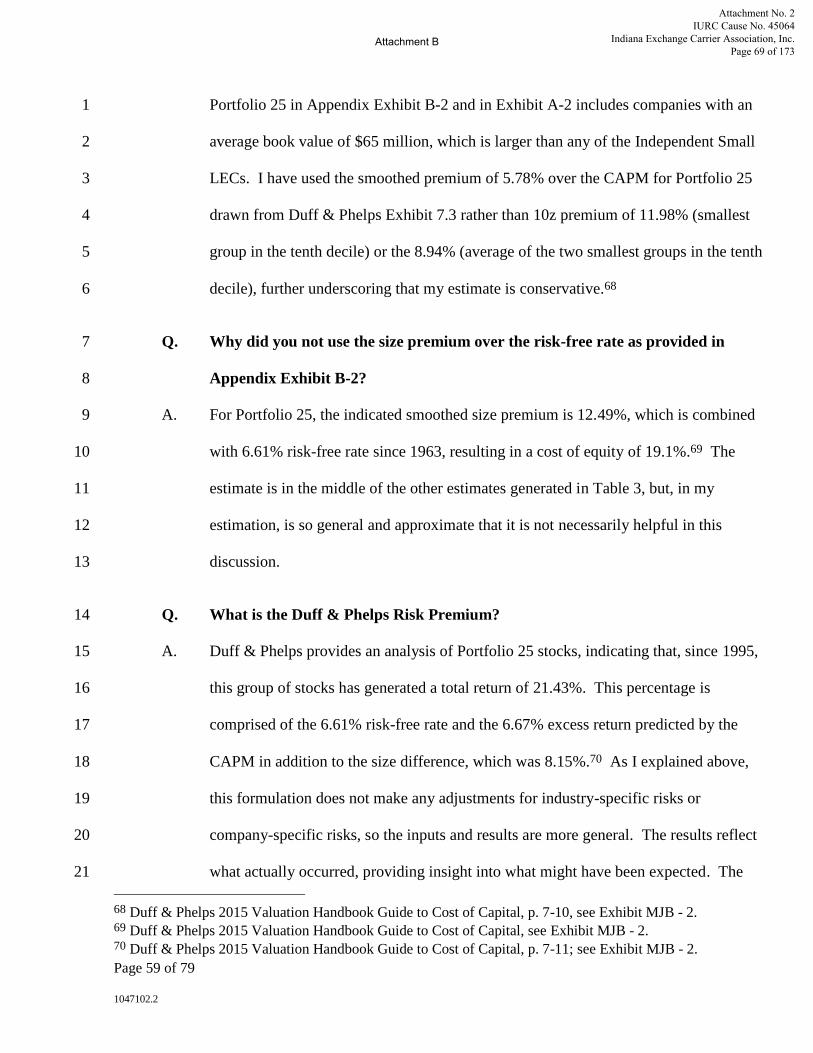
Page 59 of 79
1047102.2
Portfolio 25 in Appendix Exhibit B-2 and in Exhibit A-2 includes companies with an1
average book value of $65 million, which is larger than any of the Independent Small2
LECs. I have used the smoothed premium of 5.78% over the CAPM for Portfolio 253
drawn from Duff & Phelps Exhibit 7.3 rather than 10z premium of 11.98% (smallest4
group in the tenth decile) or the 8.94% (average of the two smallest groups in the tenth5
decile), further underscoring that my estimate is conservative.686
Q. Why did you not use the size premium over the risk-free rate as provided in7
Appendix Exhibit B-2?8
A. For Portfolio 25, the indicated smoothed size premium is 12.49%, which is combined9
with 6.61% risk-free rate since 1963, resulting in a cost of equity of 19.1%.69 The10
estimate is in the middle of the other estimates generated in Table 3, but, in my11
estimation, is so general and approximate that it is not necessarily helpful in this12
discussion.13
Q. What is the Duff & Phelps Risk Premium?14
A. Duff & Phelps provides an analysis of Portfolio 25 stocks, indicating that, since 1995,15
this group of stocks has generated a total return of 21.43%. This percentage is16
comprised of the 6.61% risk-free rate and the 6.67% excess return predicted by the17
CAPM in addition to the size difference, which was 8.15%.70 As I explained above,18
this formulation does not make any adjustments for industry-specific risks or19
company-specific risks, so the inputs and results are more general. The results reflect20
what actually occurred, providing insight into what might have been expected. The21
68 Duff & Phelps 2015 Valuation Handbook Guide to Cost of Capital, p. 7-10, see Exhibit MJB - 2.69 Duff & Phelps 2015 Valuation Handbook Guide to Cost of Capital, see Exhibit MJB - 2.70 Duff & Phelps 2015 Valuation Handbook Guide to Cost of Capital, p. 7-11; see Exhibit MJB - 2.
Attachment No. 2 IURC Cause No. 45064
Indiana Exchange Carrier Association, Inc. Page 69 of 173
Attachment B

Page 60 of 79
1047102.2
size premium in this case is higher than in the first three scenarios in Table 3, but it is1
still below the Ibbotson/Morningstar finding that the smallest group should be2
assigned an 11.98% premium.713
Q. Are you concerned about the magnitude of these premia?4
A. No. Size premia are standard modifications in CAPM calculations, and they are5
clearly appropriate for application here.72 Ibbotson/Morningstar and Duff & Phelps6
have compiled extensive data to show that very small companies, such as the7
Independent Small LECs, should have a size premium that is substantially higher than8
the 5.78% premium that I use above. The tenth decile (grouping of the smallest9
companies) is subdivided in Duff & Phelps Exhibit 7.3 into four categories, 10w, 10x,10
10y, and 10z, with respective size premia of 3.18%, 5.54%, 7.51%, and 11.98%. The11
Ibbotson/Morningstar 2015 Yearbook provides data in Table C-1.73 Ibbotson/12
Morningstar explains that the smallest sub-category of “10z” includes companies with13
a market capitalization of up to $96.16 million.74 At the same time, I have chosen to14
be conservative and use a premium of 5.78% rather than 11.98%, and have applied this15
figure to each of the periods being analyzed.16
Q. Can you provide the debt and equity information for the Independent Small17
LECs?18
71 Duff & Phelps 2015 Valuation Handbook Guide to Cost of Capital, p. 7-10; see Exhibit MJB - 2.72 See, e.g., Duff & Phelps 2015 Valuation Handbook Guide to Cost of Capital, pp. 4-1 to 4-24; see ExhibitMJB - 2.73 Duff & Phelps 2015 Valuation Handbook Guide to Cost of Capital, p. 7-10, Exhibit 7-3. Ibbotson 2013Valuation Yearbook Table C-1. See Exhibit MJB - 2.74 Ibbotson 2013 Valuation Yearbook, p. 216, Table C-1. See Exhibit MJB - 2.
Attachment No. 2 IURC Cause No. 45064
Indiana Exchange Carrier Association, Inc. Page 70 of 173
Attachment B
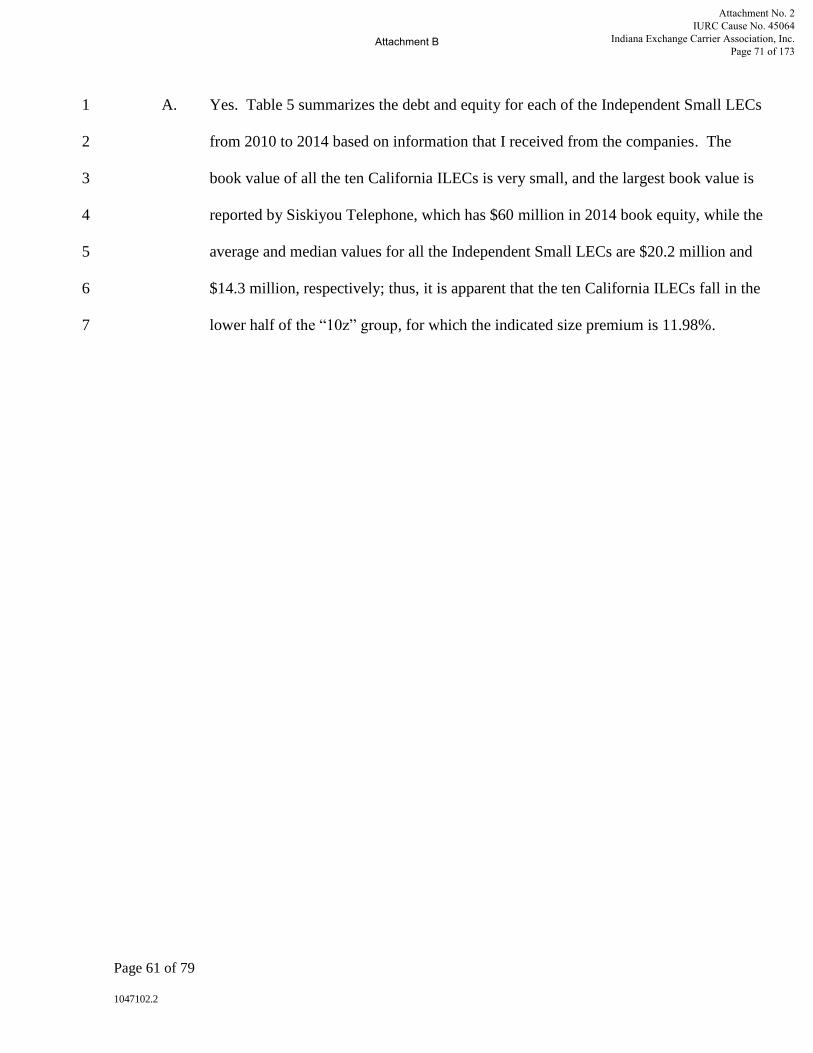
Page 61 of 79
1047102.2
A. Yes. Table 5 summarizes the debt and equity for each of the Independent Small LECs1
from 2010 to 2014 based on information that I received from the companies. The2
book value of all the ten California ILECs is very small, and the largest book value is3
reported by Siskiyou Telephone, which has $60 million in 2014 book equity, while the4
average and median values for all the Independent Small LECs are $20.2 million and5
$14.3 million, respectively; thus, it is apparent that the ten California ILECs fall in the6
lower half of the “10z” group, for which the indicated size premium is 11.98%.7
Attachment No. 2 IURC Cause No. 45064
Indiana Exchange Carrier Association, Inc. Page 71 of 173
Attachment B

Page 62 of 79
1047102.2
Table 5: Small LECs total debt and equity 2010-2014 ($)1
2
Q. Do you believe that any other adjustments are appropriate?3
A. As I explained in a previous section of this testimony, I believe that a good case can be4
made for assigning a cost to illiquidity to capture the lack of marketability in the5
equity of the Independent Small LECs. I have little question that this factor is6
appropriate because small companies generally trade at discounts that reflect a higher7
2010 2011 2012 2013 2014Common Equity
Calaveras 8,474,778 9,104,216 8,842,007 8,513,358 8,513,358Cal-Ore 13,882,635 14,517,314 15,647,046 16,552,928 17,560,657Ducor 4,999,962 5,251,571 4,706,568 3,560,678 3,061,029Foresthill 5,878,103 6,744,103 7,320,103 7,666,103 8,065,319Kerman 9,953,000 10,835,000 10,802,000 10,802,000 10,967,000Pinnacles 3,512,226 2,819,751 2,623,554 2,705,413 2,911,150Ponderosa 26,749,383 26,508,056 31,127,582 36,423,316 38,068,157Siskiyou 50,805,747 58,305,399 59,897,477 59,914,384 59,602,160Sierra 38,172,169 37,133,193 33,013,887 39,619,212 31,088,208Volcano 16,551,253 21,560,425 19,289,744 20,955,729 22,085,190Average 17,897,926 19,277,903 19,326,997 20,671,312 20,192,223Median 11,917,818 12,676,157 13,224,523 13,677,464 14,263,829
Preferred equityPinnacles 70,000 70,000 70,000 70,000 70,000Ponderosa 792,720 792,720 792,720 792,720 792,720Siskiyou 418,000 418,000 418,000 418,000 418,000Volcano 1,295,250 1,295,250 1,295,250 1,295,250 1,295,250Average 643,993 643,993 643,993 643,993 643,993Median 605,360 605,360 605,360 605,360 605,360
DebtCalaveras 8,004,652 7,301,284 7,180,350 6,446,570 5,659,346Cal-Ore - - - - -Ducor 3,229,791 3,069,108 2,903,308 2,743,589 2,604,140Foresthill 8,141,911 10,282,551 9,854,670 10,993,194 9,259,383Kerman 9,061,177 9,869,591 10,253,699 12,588,721 11,364,864Pinnacles - - - - -Ponderosa 18,067,143 16,157,886 19,123,394 24,961,238 21,934,990Siskiyou - - - - -Sierra 23,072,963 20,975,945 18,901,086 16,548,092 14,304,846Volcano 14,027,900 13,487,505 12,918,209 12,319,170 11,688,418Average 8,360,554 8,114,387 8,113,472 8,660,057 7,681,599Median 8,073,281 8,585,437 8,517,510 8,719,882 7,459,364
Attachment No. 2 IURC Cause No. 45064
Indiana Exchange Carrier Association, Inc. Page 72 of 173
Attachment B
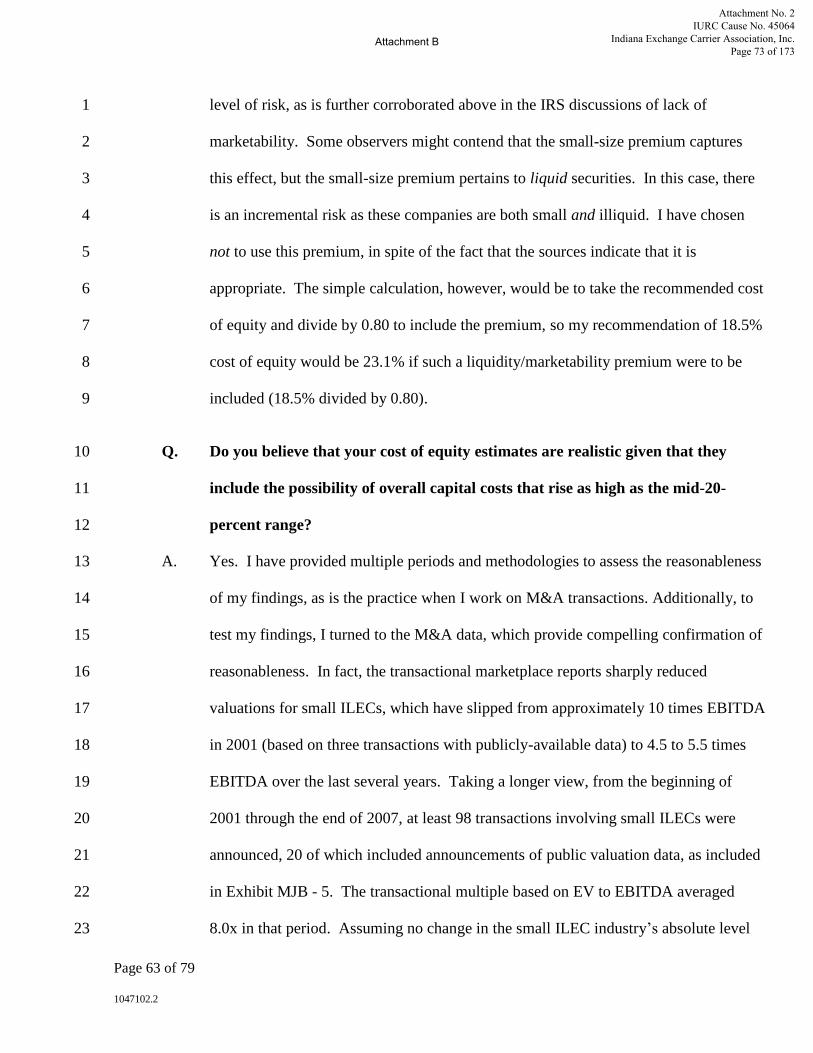
Page 63 of 79
1047102.2
level of risk, as is further corroborated above in the IRS discussions of lack of1
marketability. Some observers might contend that the small-size premium captures2
this effect, but the small-size premium pertains to liquid securities. In this case, there3
is an incremental risk as these companies are both small and illiquid. I have chosen4
not to use this premium, in spite of the fact that the sources indicate that it is5
appropriate. The simple calculation, however, would be to take the recommended cost6
of equity and divide by 0.80 to include the premium, so my recommendation of 18.5%7
cost of equity would be 23.1% if such a liquidity/marketability premium were to be8
included (18.5% divided by 0.80).9
Q. Do you believe that your cost of equity estimates are realistic given that they10
include the possibility of overall capital costs that rise as high as the mid-20-11
percent range?12
A. Yes. I have provided multiple periods and methodologies to assess the reasonableness13
of my findings, as is the practice when I work on M&A transactions. Additionally, to14
test my findings, I turned to the M&A data, which provide compelling confirmation of15
reasonableness. In fact, the transactional marketplace reports sharply reduced16
valuations for small ILECs, which have slipped from approximately 10 times EBITDA17
in 2001 (based on three transactions with publicly-available data) to 4.5 to 5.5 times18
EBITDA over the last several years. Taking a longer view, from the beginning of19
2001 through the end of 2007, at least 98 transactions involving small ILECs were20
announced, 20 of which included announcements of public valuation data, as included21
in Exhibit MJB - 5. The transactional multiple based on EV to EBITDA averaged22
8.0x in that period. Assuming no change in the small ILEC industry’s absolute level23
Attachment No. 2 IURC Cause No. 45064
Indiana Exchange Carrier Association, Inc. Page 73 of 173
Attachment B
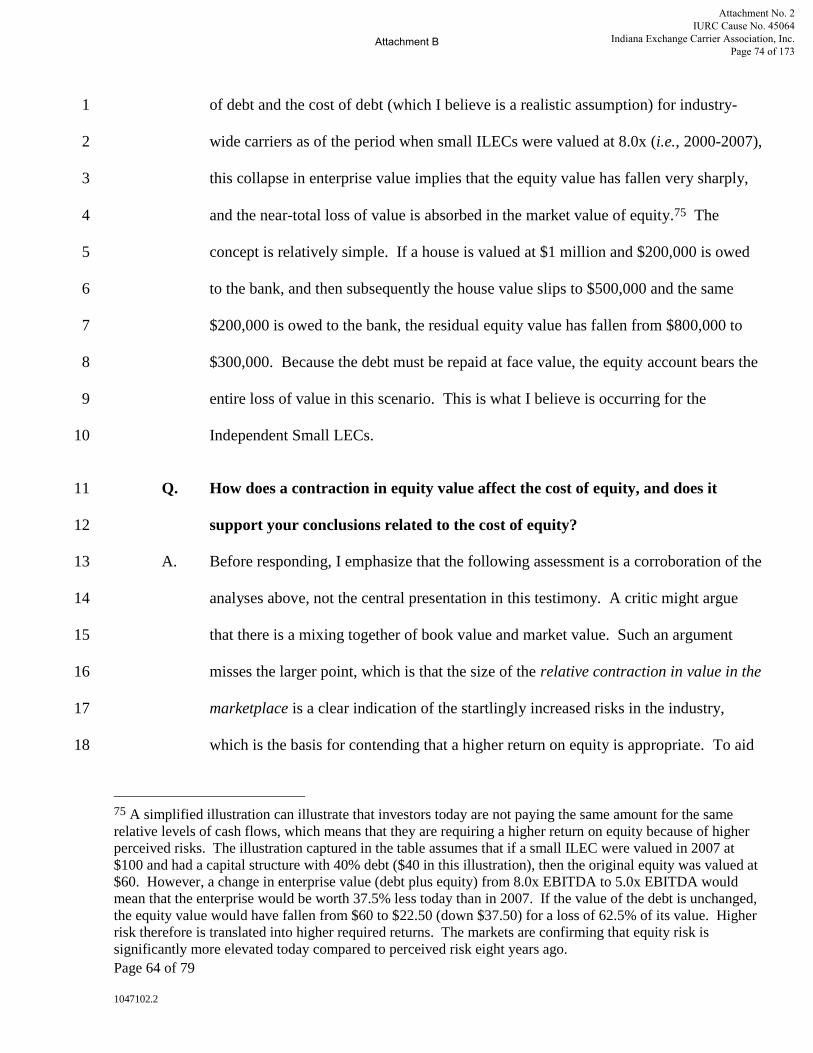
Page 64 of 79
1047102.2
of debt and the cost of debt (which I believe is a realistic assumption) for industry-1
wide carriers as of the period when small ILECs were valued at 8.0x (i.e., 2000-2007),2
this collapse in enterprise value implies that the equity value has fallen very sharply,3
and the near-total loss of value is absorbed in the market value of equity.75 The4
concept is relatively simple. If a house is valued at $1 million and $200,000 is owed5
to the bank, and then subsequently the house value slips to $500,000 and the same6
$200,000 is owed to the bank, the residual equity value has fallen from $800,000 to7
$300,000. Because the debt must be repaid at face value, the equity account bears the8
entire loss of value in this scenario. This is what I believe is occurring for the9
Independent Small LECs.10
Q. How does a contraction in equity value affect the cost of equity, and does it11
support your conclusions related to the cost of equity?12
A. Before responding, I emphasize that the following assessment is a corroboration of the13
analyses above, not the central presentation in this testimony. A critic might argue14
that there is a mixing together of book value and market value. Such an argument15
misses the larger point, which is that the size of the relative contraction in value in the16
marketplace is a clear indication of the startlingly increased risks in the industry,17
which is the basis for contending that a higher return on equity is appropriate. To aid18
75 A simplified illustration can illustrate that investors today are not paying the same amount for the samerelative levels of cash flows, which means that they are requiring a higher return on equity because of higherperceived risks. The illustration captured in the table assumes that if a small ILEC were valued in 2007 at$100 and had a capital structure with 40% debt ($40 in this illustration), then the original equity was valued at$60. However, a change in enterprise value (debt plus equity) from 8.0x EBITDA to 5.0x EBITDA wouldmean that the enterprise would be worth 37.5% less today than in 2007. If the value of the debt is unchanged,the equity value would have fallen from $60 to $22.50 (down $37.50) for a loss of 62.5% of its value. Higherrisk therefore is translated into higher required returns. The markets are confirming that equity risk issignificantly more elevated today compared to perceived risk eight years ago.
Attachment No. 2 IURC Cause No. 45064
Indiana Exchange Carrier Association, Inc. Page 74 of 173
Attachment B
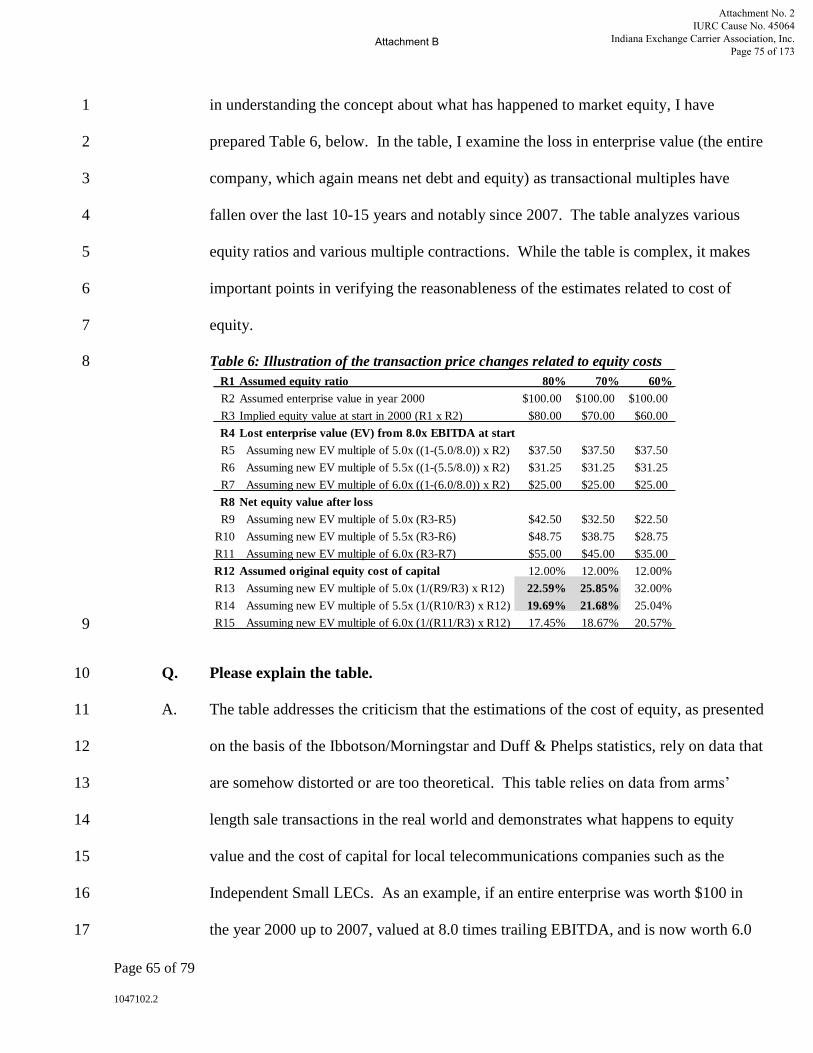
Page 65 of 79
1047102.2
in understanding the concept about what has happened to market equity, I have1
prepared Table 6, below. In the table, I examine the loss in enterprise value (the entire2
company, which again means net debt and equity) as transactional multiples have3
fallen over the last 10-15 years and notably since 2007. The table analyzes various4
equity ratios and various multiple contractions. While the table is complex, it makes5
important points in verifying the reasonableness of the estimates related to cost of6
equity.7
Table 6: Illustration of the transaction price changes related to equity costs8
9
Q. Please explain the table.10
A. The table addresses the criticism that the estimations of the cost of equity, as presented11
on the basis of the Ibbotson/Morningstar and Duff & Phelps statistics, rely on data that12
are somehow distorted or are too theoretical. This table relies on data from arms’13
length sale transactions in the real world and demonstrates what happens to equity14
value and the cost of capital for local telecommunications companies such as the15
Independent Small LECs. As an example, if an entire enterprise was worth $100 in16
the year 2000 up to 2007, valued at 8.0 times trailing EBITDA, and is now worth 6.017
R1 Assumed equity ratio 80% 70% 60%
R2 Assumed enterprise value in year 2000 $100.00 $100.00 $100.00
R3 Implied equity value at start in 2000 (R1 x R2) $80.00 $70.00 $60.00
R4 Lost enterprise value (EV) from 8.0x EBITDA at start
R5 Assuming new EV multiple of 5.0x ((1-(5.0/8.0)) x R2) $37.50 $37.50 $37.50
R6 Assuming new EV multiple of 5.5x ((1-(5.5/8.0)) x R2) $31.25 $31.25 $31.25
R7 Assuming new EV multiple of 6.0x ((1-(6.0/8.0)) x R2) $25.00 $25.00 $25.00
R8 Net equity value after loss
R9 Assuming new EV multiple of 5.0x (R3-R5) $42.50 $32.50 $22.50
R10 Assuming new EV multiple of 5.5x (R3-R6) $48.75 $38.75 $28.75
R11 Assuming new EV multiple of 6.0x (R3-R7) $55.00 $45.00 $35.00
R12 Assumed original equity cost of capital 12.00% 12.00% 12.00%
R13 Assuming new EV multiple of 5.0x (1/(R9/R3) x R12) 22.59% 25.85% 32.00%
R14 Assuming new EV multiple of 5.5x (1/(R10/R3) x R12) 19.69% 21.68% 25.04%
R15 Assuming new EV multiple of 6.0x (1/(R11/R3) x R12) 17.45% 18.67% 20.57%
Attachment No. 2 IURC Cause No. 45064
Indiana Exchange Carrier Association, Inc. Page 75 of 173
Attachment B

Page 66 of 79
1047102.2
times EBITDA with no change in the amount of the debt, then the loss of value ($25 in1
this illustration) is entirely subtracted from the market value of the equity. If the2
equity ratio was 80%, then one has to subtract $25 from $80, or if the equity ratio was3
70%, then the loss of value is $25 from $70, and if the equity ratio was 60%, the loss4
is $25 from $60. The table demonstrates that if the current multiple is actually 5.55
times EBITDA, then the losses to equity value are greater, and if the current multiple6
is 5.0 times EBITDA, the losses are greater still.7
Q. Should the Commission care about the loss of equity value over this period?8
A. In theory, no, but given public policy objectives that the Commission cannot ignore,9
the answer should be “yes.” One could argue that the answer is “no” because all10
companies incur risk in operating their businesses, and operations always result in11
capital appreciation or loss of value for the shareholders. These are privately-owned12
public utilities, so the loss of market equity value is borne by the shareholders and not13
by the ratepayer or the Commission. But the answer is “yes” in this case because these14
carriers are responsible for achieving certain public policy objectives and a strong15
equity position for a utility will better assure access to debt-capital and will reduce the16
risk associated with operations. Conversely, loss of market equity value can reduce17
access to debt and raise the risk associated with operations. One must only imagine18
the problem in refinancing a home when the housing market weakens sharply. Lower19
market equity value in the home reduces or eliminates the homeowner’s access to debt20
capital and may result in higher interest rates. The Independent Small LECs’ access to21
the debt markets and their forwarding-looking debt prices are part of the calculation22
with respect to WACC, and those factors will have an effect on the costs of equity.23
Attachment No. 2 IURC Cause No. 45064
Indiana Exchange Carrier Association, Inc. Page 76 of 173
Attachment B
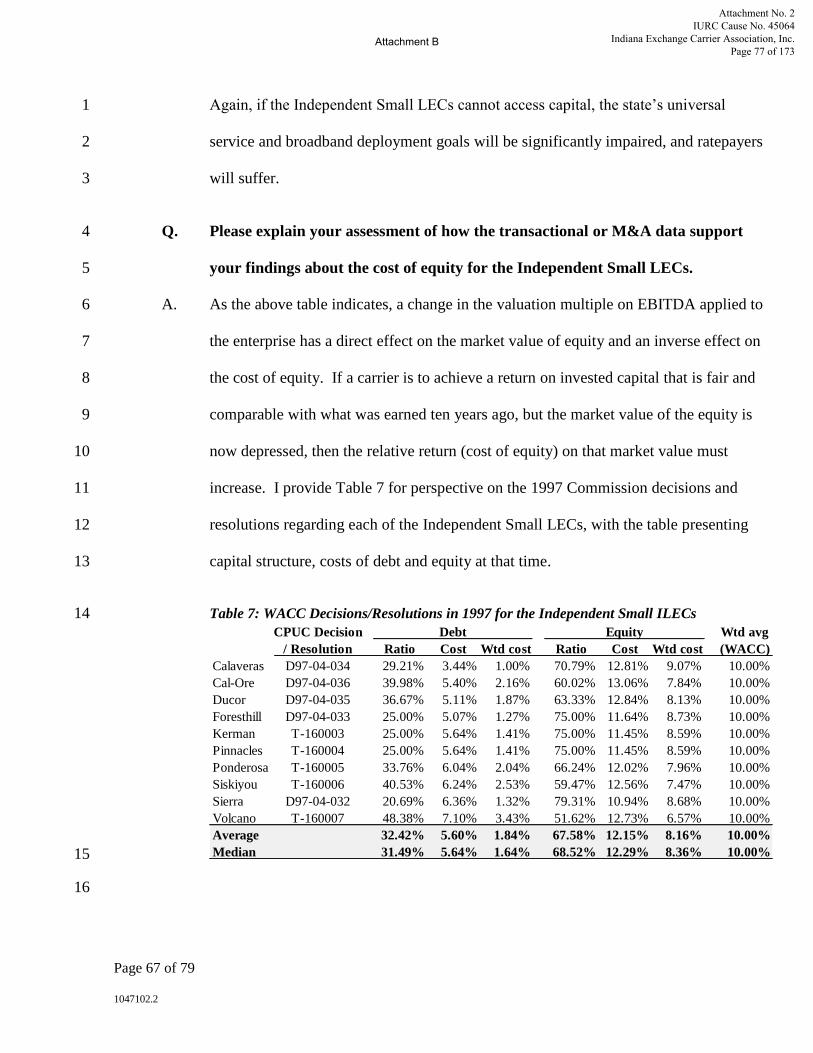
Page 67 of 79
1047102.2
Again, if the Independent Small LECs cannot access capital, the state’s universal1
service and broadband deployment goals will be significantly impaired, and ratepayers2
will suffer.3
Q. Please explain your assessment of how the transactional or M&A data support4
your findings about the cost of equity for the Independent Small LECs.5
A. As the above table indicates, a change in the valuation multiple on EBITDA applied to6
the enterprise has a direct effect on the market value of equity and an inverse effect on7
the cost of equity. If a carrier is to achieve a return on invested capital that is fair and8
comparable with what was earned ten years ago, but the market value of the equity is9
now depressed, then the relative return (cost of equity) on that market value must10
increase. I provide Table 7 for perspective on the 1997 Commission decisions and11
resolutions regarding each of the Independent Small LECs, with the table presenting12
capital structure, costs of debt and equity at that time.13
Table 7: WACC Decisions/Resolutions in 1997 for the Independent Small ILECs14
15
16
CPUC Decision Debt Equity Wtd avg/ Resolution Ratio Cost Wtd cost Ratio Cost Wtd cost (WACC)
Calaveras D97-04-034 29.21% 3.44% 1.00% 70.79% 12.81% 9.07% 10.00%Cal-Ore D97-04-036 39.98% 5.40% 2.16% 60.02% 13.06% 7.84% 10.00%Ducor D97-04-035 36.67% 5.11% 1.87% 63.33% 12.84% 8.13% 10.00%Foresthill D97-04-033 25.00% 5.07% 1.27% 75.00% 11.64% 8.73% 10.00%Kerman T-160003 25.00% 5.64% 1.41% 75.00% 11.45% 8.59% 10.00%Pinnacles T-160004 25.00% 5.64% 1.41% 75.00% 11.45% 8.59% 10.00%Ponderosa T-160005 33.76% 6.04% 2.04% 66.24% 12.02% 7.96% 10.00%Siskiyou T-160006 40.53% 6.24% 2.53% 59.47% 12.56% 7.47% 10.00%Sierra D97-04-032 20.69% 6.36% 1.32% 79.31% 10.94% 8.68% 10.00%Volcano T-160007 48.38% 7.10% 3.43% 51.62% 12.73% 6.57% 10.00%Average 32.42% 5.60% 1.84% 67.58% 12.15% 8.16% 10.00%Median 31.49% 5.64% 1.64% 68.52% 12.29% 8.36% 10.00%
Attachment No. 2 IURC Cause No. 45064
Indiana Exchange Carrier Association, Inc. Page 77 of 173
Attachment B
Page 68 of 79
1047102.2
Q. Please use the transactional data to demonstrate how your conclusions are1
reasonable.2
A. The demonstration is straightforward. Today’s capital structure of the Independent3
Small LECs, on average, is approximately the same as in 1997, as the equity ratio falls4
within the Commission’s previously-defined zone of reasonableness which, in 1997,5
was described as 60% to 80%, and when the cost of equity was, on average, near 12%,6
as presented in Table 7.76 In Table 6, above, I then tested my finding of 18.5% using7
the following base formula: [old cost of equity x old market equity] = [new cost of8
equity x new market equity]. The calculation attempts to generate an equity return9
today that is the same as that generated in 1997, again assuming that returns are10
relatively matched with capital invested. If I assume that the old return on equity11
should approximately equal the new return, the new cost of equity is derived by an12
algebraic adjustment to divide the [old cost of equity x old market equity] by the [new13
market equity] to get the [new cost of equity], as indicated in Table 6. Again, I used14
12% as the old cost of equity and the other calculations are spelled out in that table.7715
Taking the top (5.5 times) of today’s EV valuation range (assuming 4.5 to 5.5 times16
EBITDA), the result is that today’s cost of equity should rise to 19.7% to offset the17
loss in equity value if the equity ratio is 80% or to 21.7% if the equity ratio is 70%.18
Similarly, if we assume the market equity value has fallen to 5.0 times EBITDA (the19
76 As I previously noted, the zone for the equity ratio was set at 60%-80% in the Commission’s 1997 rate casesand today’s average equity ratio is about 70% for the Independent Small LECs.77 It is also consistent with the commentary in each of the 1997 Decisions outlined in the table above, wherethe Commission explains “Upon consideration, evaluation, and weighting of applicant’s and ORA’s financialand risk analyses with the above-mentioned observations of mitigated and increased risks, we find that areasonable equity range for small telephone companies, such as applicant, should be 10.10% to 14.06%.” See,e.g., Sierra Telephone, 1997 Cal. PUC LEXIS 1245;, *29, p. 8 of 18. The 12% cost of equity is the approximatemidpoint of the low and high values.
Attachment No. 2 IURC Cause No. 45064
Indiana Exchange Carrier Association, Inc. Page 78 of 173
Attachment B
Page 69 of 79
1047102.2
mid-point of today’s valuation ranges, shaded in the table), then the cost of equity has1
risen to 22.6% and 25.9% for 80% and 70% equity ratios, respectively. As I explain, I2
am currently using 5.0 times EBITDA in my conference presentations to ILEC3
executives and boards, as that figure is the mid-point of valuation for the smaller ILEC4
industry, so this calculation suggests that the cost of equity has risen above 20%.5
Once again, I emphasize that this transactional analysis is not intended to be the6
principal cost of capital methodology, but the analysis is corroborative of my other7
CAPM and Buildup findings above as it highlights the increased risk in the8
marketplace.9
Q. Please summarize your analysis of the transactional data.10
A. The likely fully-valued enterprise value for the Independent Small LECs today is 5.011
times EBITDA, but I have used 5.5 times to be conservative. If I accept that the12
Commission effectively stipulated in 1997 that a reasonable capital structure was 60%13
to 80% equity, and I take the mid-point of 70% (consistent with today’s capital14
structure for the Independent Small LECs), the implied equity cost today, using the15
straightforward calculation in Table 6 is 21.7%.16
Q. Should we adjust for the lower interest rates today compared with those ten or17
fifteen years ago?18
A. No. The formula provides for the Commission to input debt costs and determine how19
to adjust the WACC. Debt costs should have no effect on the calculation of the20
previous or the current cost of equity (although the practical reality is that the costs of21
Attachment No. 2 IURC Cause No. 45064
Indiana Exchange Carrier Association, Inc. Page 79 of 173
Attachment B
Page 70 of 79
1047102.2
equity could be expected to rise if the carriers have diminished access to debt).78 I did1
review those changes in preparing this testimony, and note that the change in AAA2
corporate bond rates, using the monthly average of 20-year corporates between3
January 1997 and December 2000 compared with June 2015, as reported by the4
Federal Reserve Bank of St. Louis, was about 287 basis points, which would reduce5
today’s WACC by only 86 basis points (change of 287 basis points times 30% debt6
ratio). But again, this is a separate input and theoretically does not affect the7
calculation of the equity cost (excluding the effects in increased equity risk).798
Q. What are the fundamental points of this analysis?9
A. The recent transactional data tell us that the cost of equity capital is sharply higher10
than it was previously. This is not speculative or theoretical, but demonstrable in the11
transactional markets. I also believe that there is no sign that valuations will rise, as12
risks remain significant and competition is growing. This assessment leads me to13
several important conclusions. First, the figures in the shaded section of Table 614
confirm the direction and demonstrate the reasonableness of the estimates calculated15
using the Ibbotson/Morningstar and Duff & Phelps statistical information in the earlier16
CAPM/Buildup analyses. Second, the M&A-based costs of equity are higher because17
they likely reflect the fact that the Duff & Phelps and Ibbotson/Morningstar analyses18
relied on historical valuation data that were too conservative or did not include other19
risk factors, such as the changing ILEC marketplace as well as liquidity and20
marketability factors. Finally, the table makes a strong point in defense of higher21
78 To be clear, equity investors would logically want a higher return if debt were unavailable to a carrier, as theperceived risk is increased in operating the business.79 I have supplied the monthly AAA 20-year corporate bond interest rates from the Federal Reserve Bank ofSt. Louis in Exhibit MJB - 14.
Attachment No. 2 IURC Cause No. 45064
Indiana Exchange Carrier Association, Inc. Page 80 of 173
Attachment B
Page 71 of 79
1047102.2
equity capital-structure ratios, as low equity ratios result in increased risk when market1
equity values are falling. That is, when market values are falling, the proportion of2
market equity is also falling relative to debt, which means that the company’s debt3
costs are likely to rise in the future and its operating risk is likely to increase. Thus, I4
suggest that the Commission consider whether the former zone of reasonableness5
(60%-80%) should be shifted higher above 70% and likely to 80% to preserve6
forward-looking access to capital and to manage operating risk.7
Q. Please provide data for the capital structure of the Independent Small LECs.8
A. I provide the data in the following table about the companies’ debt and equity capital9
structure and the costs of debt.8010
80 While the debt ratio is not included in the table, it can be readily calculated as the residual, subtracting thecommon equity and preferred equity ratios from 100% in the table.
Attachment No. 2 IURC Cause No. 45064
Indiana Exchange Carrier Association, Inc. Page 81 of 173
Attachment B

Page 72 of 79
1047102.2
Table 8: Capital structure and cost of debt and preferred equity for Small LECs1
2
3
2010 2011 2012 2013 2014Common equity ratio
Calaveras 51.43% 55.49% 55.19% 56.91% 60.07%Cal-Ore 100.00% 100.00% 100.00% 100.00% 100.00%Ducor 60.75% 63.11% 61.85% 56.48% 54.03%Foresthill 41.93% 39.61% 42.62% 41.08% 46.55%Kerman 52.35% 52.33% 51.30% 46.18% 49.11%Pinnacles 98.05% 97.58% 97.40% 97.48% 97.65%Ponderosa 58.65% 61.00% 60.98% 58.58% 62.62%Siskiyou 99.18% 99.29% 99.31% 99.31% 99.30%Sierra 62.33% 63.90% 63.59% 70.54% 68.49%Volcano 51.93% 59.32% 57.58% 60.62% 62.98%Average 67.66% 69.16% 68.98% 68.72% 70.08%Median 59.70% 62.06% 61.42% 59.60% 62.80%
Preferred equity ratioPinnacles 1.95% 2.42% 2.60% 2.52% 2.35%Ponderosa 1.74% 1.82% 1.55% 1.27% 1.30%Siskiyou 0.82% 0.71% 0.69% 0.69% 0.70%Volcano 4.06% 3.56% 3.87% 3.75% 3.69%Average 2.14% 2.13% 2.18% 2.06% 2.01%Median 1.85% 2.12% 2.08% 1.90% 1.83%
Cost of preferred equityPinnacles 5.00% 5.00% 5.00% 5.00% 5.00%Ponderosa 6.00% 6.00% 6.00% 6.00% 6.00%Siskiyou 5.75% 5.75% 5.75% 5.75% 5.75%Volcano 7.00% 7.00% 7.00% 7.00% 7.00%Average 5.94% 5.94% 5.94% 5.94% 5.94%Median 5.88% 5.88% 5.88% 5.88% 5.88%
Cost of DebtCalaveras 4.66% 4.67% 4.51% 4.51% 4.50%Cal-OreDucor 5.10% 5.10% 5.10% 5.10% 5.10%Foresthill 5.10% 5.08% 5.07% 4.82% 4.77%Kerman 4.20% 4.10% 3.75% 3.69% 3.66%PinnaclesPonderosa 4.53% 4.16% 3.42% 3.06% 2.93%SiskiyouSierra 5.60% 5.58% 5.55% 5.52% 5.53%Volcano 5.20% 5.20% 5.20% 5.20% 5.20%Average 5.11% 4.98% 4.72% 4.59% 4.55%Median 5.20% 5.20% 5.20% 5.20% 5.20%
Attachment No. 2 IURC Cause No. 45064
Indiana Exchange Carrier Association, Inc. Page 82 of 173
Attachment B
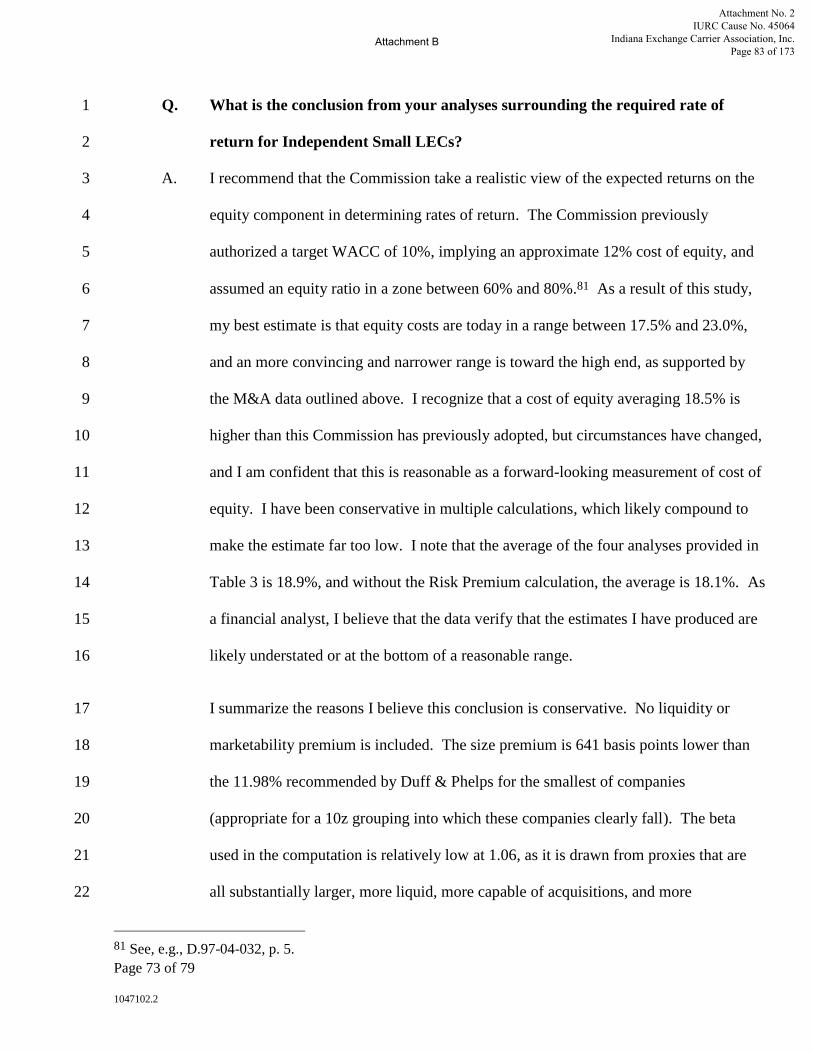
Page 73 of 79
1047102.2
Q. What is the conclusion from your analyses surrounding the required rate of1
return for Independent Small LECs?2
A. I recommend that the Commission take a realistic view of the expected returns on the3
equity component in determining rates of return. The Commission previously4
authorized a target WACC of 10%, implying an approximate 12% cost of equity, and5
assumed an equity ratio in a zone between 60% and 80%.81 As a result of this study,6
my best estimate is that equity costs are today in a range between 17.5% and 23.0%,7
and an more convincing and narrower range is toward the high end, as supported by8
the M&A data outlined above. I recognize that a cost of equity averaging 18.5% is9
higher than this Commission has previously adopted, but circumstances have changed,10
and I am confident that this is reasonable as a forward-looking measurement of cost of11
equity. I have been conservative in multiple calculations, which likely compound to12
make the estimate far too low. I note that the average of the four analyses provided in13
Table 3 is 18.9%, and without the Risk Premium calculation, the average is 18.1%. As14
a financial analyst, I believe that the data verify that the estimates I have produced are15
likely understated or at the bottom of a reasonable range.16
I summarize the reasons I believe this conclusion is conservative. No liquidity or17
marketability premium is included. The size premium is 641 basis points lower than18
the 11.98% recommended by Duff & Phelps for the smallest of companies19
(appropriate for a 10z grouping into which these companies clearly fall). The beta20
used in the computation is relatively low at 1.06, as it is drawn from proxies that are21
all substantially larger, more liquid, more capable of acquisitions, and more22
81 See, e.g., D.97-04-032, p. 5.
Attachment No. 2 IURC Cause No. 45064
Indiana Exchange Carrier Association, Inc. Page 83 of 173
Attachment B

Page 74 of 79
1047102.2
diversified. The risk-free rate employed is the lower of the two options (a higher1
result is generated when using total return on the Treasury). And, the strongest2
evidence of reasonableness, in my judgment, is the M&A data where I have again3
been conservative, as my experience leads me to the judgment that the multiple on4
EBITDA for these companies is likely closer to 5.0 times, which suggests a higher5
cost of equity than the one I have used. The transactional data indicate that the actual6
cost of equity is between 19.7% and 25.9%, which is well above 18.5% that I7
recommend to the Commission here. I assume that the Commission recognizes that8
risks in this industry are well higher than they were in 1997.9
Q. Do you recommend a single target weighted average cost of capital for the10
Independent Small LECs?11
A. I leave that decision to the Commission. My testimony is focused on analyzing the12
costs of capital, with a greater focus on the question related to the cost of equity. I can13
recommend 18.5% as a conservative estimate that can be used in a hypothetical14
structure or it can be used in assessing a specific company’s costs of capital. The15
financial health of each of these companies is important to its customers, and the16
Commission should continue to assess how the companies are able to cope with17
important risks many of which are outside their control. In Table 9, I have presented18
the WACC calculations for each of the Independent Small LECs based on the two-19
year average of their actual capital structure and the two-year average of their costs of20
debt. The capital structures of the companies vary significantly, and I believe they21
may become more conservative in the future as the companies cope with competition,22
regulatory pressures, and limited access to capital.23
Attachment No. 2 IURC Cause No. 45064
Indiana Exchange Carrier Association, Inc. Page 84 of 173
Attachment B
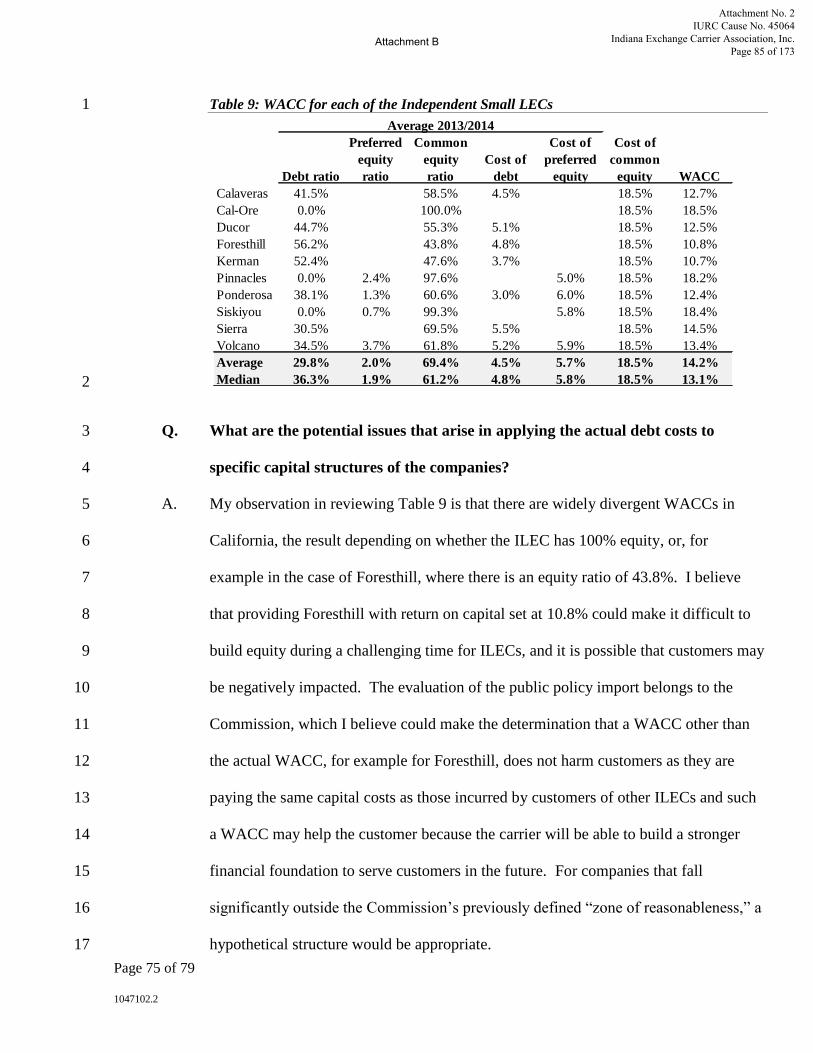
Page 75 of 79
1047102.2
Table 9: WACC for each of the Independent Small LECs1
2
Q. What are the potential issues that arise in applying the actual debt costs to3
specific capital structures of the companies?4
A. My observation in reviewing Table 9 is that there are widely divergent WACCs in5
California, the result depending on whether the ILEC has 100% equity, or, for6
example in the case of Foresthill, where there is an equity ratio of 43.8%. I believe7
that providing Foresthill with return on capital set at 10.8% could make it difficult to8
build equity during a challenging time for ILECs, and it is possible that customers may9
be negatively impacted. The evaluation of the public policy import belongs to the10
Commission, which I believe could make the determination that a WACC other than11
the actual WACC, for example for Foresthill, does not harm customers as they are12
paying the same capital costs as those incurred by customers of other ILECs and such13
a WACC may help the customer because the carrier will be able to build a stronger14
financial foundation to serve customers in the future. For companies that fall15
significantly outside the Commission’s previously defined “zone of reasonableness,” a16
hypothetical structure would be appropriate.17
Average 2013/2014
Debt ratio
Preferredequityratio
Commonequityratio
Cost ofdebt
Cost ofpreferred
equity
Cost ofcommon
equity WACCCalaveras 41.5% 58.5% 4.5% 18.5% 12.7%Cal-Ore 0.0% 100.0% 18.5% 18.5%Ducor 44.7% 55.3% 5.1% 18.5% 12.5%Foresthill 56.2% 43.8% 4.8% 18.5% 10.8%Kerman 52.4% 47.6% 3.7% 18.5% 10.7%Pinnacles 0.0% 2.4% 97.6% 5.0% 18.5% 18.2%Ponderosa 38.1% 1.3% 60.6% 3.0% 6.0% 18.5% 12.4%Siskiyou 0.0% 0.7% 99.3% 5.8% 18.5% 18.4%Sierra 30.5% 69.5% 5.5% 18.5% 14.5%Volcano 34.5% 3.7% 61.8% 5.2% 5.9% 18.5% 13.4%Average 29.8% 2.0% 69.4% 4.5% 5.7% 18.5% 14.2%Median 36.3% 1.9% 61.2% 4.8% 5.8% 18.5% 13.1%
Attachment No. 2 IURC Cause No. 45064
Indiana Exchange Carrier Association, Inc. Page 85 of 173
Attachment B

Page 76 of 79
1047102.2
Q. What do you recommend if the Commission were choose to use a hypothetical1
capital structure and establish a target WACC?2
A. I would propose that the Commission employ a hypothetical capital structure with3
approximately 70% to 80% equity. I use 70% in my calculations below. This opinion4
relies on the Commission’s previous adoption of a zone of reasonableness of 60%-5
80%. It also reflects my conclusion that the market value of equity has fallen and that6
the companies will increasingly have to rely on book equity ratios that are relatively7
higher in the future than in the past. In calculating a target WACC, I also assume that8
the cost of debt will rise, both because we are going to emerge from the artificially-9
low interest rates in today’s markets and because I believe the risk for telephone10
companies will grow greater in the future. If the Commission were to posit a cost of11
debt figure as part of a hypothetical capital structure calculation, I recommend that the12
Commission use a hypothetical debt rate of 5.5% for companies without any actual13
debt rates. This is above the current median of 5.2% of the Independent Small LECs.14
However, it is approximately the interest rate that Sierra Telephone currently pays15
(5.53%), and approximates a rate that might be expected in the future for any of these16
carriers, although it is very possible the rates will rise higher. Again, this exercise is17
purely to arrive at a target WACC. Using the figures above and the recommended18
18.5% cost of equity, a realistic target WACC is 14.6%.19
Figure 5: Calculation of a target WACC20
21
22
Capitalstructure
Cost ofCapital
Allocatedcost
Debt 30% 5.50% 1.65%Equity 70% 18.50% 12.95% Total 14.60%
Attachment No. 2 IURC Cause No. 45064
Indiana Exchange Carrier Association, Inc. Page 86 of 173
Attachment B
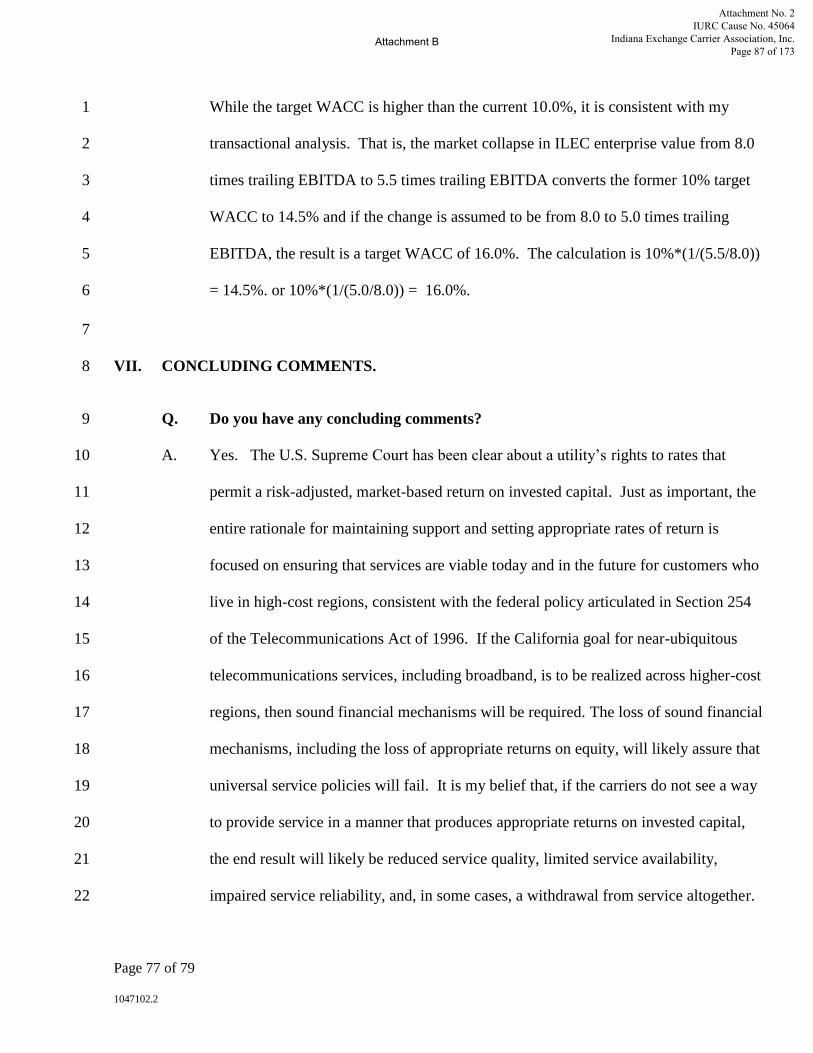
Page 77 of 79
1047102.2
While the target WACC is higher than the current 10.0%, it is consistent with my1
transactional analysis. That is, the market collapse in ILEC enterprise value from 8.02
times trailing EBITDA to 5.5 times trailing EBITDA converts the former 10% target3
WACC to 14.5% and if the change is assumed to be from 8.0 to 5.0 times trailing4
EBITDA, the result is a target WACC of 16.0%. The calculation is 10%*(1/(5.5/8.0))5
= 14.5%. or 10%*(1/(5.0/8.0)) = 16.0%.6
7
VII. CONCLUDING COMMENTS.8
Q. Do you have any concluding comments?9
A. Yes. The U.S. Supreme Court has been clear about a utility’s rights to rates that10
permit a risk-adjusted, market-based return on invested capital. Just as important, the11
entire rationale for maintaining support and setting appropriate rates of return is12
focused on ensuring that services are viable today and in the future for customers who13
live in high-cost regions, consistent with the federal policy articulated in Section 25414
of the Telecommunications Act of 1996. If the California goal for near-ubiquitous15
telecommunications services, including broadband, is to be realized across higher-cost16
regions, then sound financial mechanisms will be required. The loss of sound financial17
mechanisms, including the loss of appropriate returns on equity, will likely assure that18
universal service policies will fail. It is my belief that, if the carriers do not see a way19
to provide service in a manner that produces appropriate returns on invested capital,20
the end result will likely be reduced service quality, limited service availability,21
impaired service reliability, and, in some cases, a withdrawal from service altogether.22
Attachment No. 2 IURC Cause No. 45064
Indiana Exchange Carrier Association, Inc. Page 87 of 173
Attachment B

Page 78 of 79
1047102.2
This would be harmful or possibly devastating to ratepayers in these regions and likely1
represent a policy failure for all users of the telephone network.2
Q. Does this conclude your testimony?3
A. Yes.4
5
Attachment No. 2 IURC Cause No. 45064
Indiana Exchange Carrier Association, Inc. Page 88 of 173
Attachment B

Attachment No. 2 IURC Cause No. 45064
Indiana Exchange Carrier Association, Inc. Page 89 of 173
Attachment B

Appendix 3—California Rebuttal Testimony
of
Michael J. Balhoff, CFA
Attachment No. 2 IURC Cause No. 45064
Indiana Exchange Carrier Association, Inc. Page 90 of 173
Attachment B
BEFORE THE PUBLIC UTILITIES COMMISSION
OF THE STATE OF CALIFORNIA
Application of Calaveras Telephone Company (U 1004 C) Cal-Ore Telephone Co. (U 1006 C) Ducor Telephone Company (U 1007 C) Foresthill Telephone Company (U 1009 C) Kerman Telephone Co. (U 1012 C) Pinnacles Telephone Co. (U 1013 C) The Ponderosa Telephone Co. (U 1014 C) Sierra Telephone Company, Inc. (U 1016 C) The Siskiyou Telephone Company U 1017 C) Volcano Telephone Company (U 1019 C) for a Determination of Applicants' Cost of Capital for Ratemaking Purposes
A. 15-09-005 (Filed September 1, 2015)
REBUTTAL TESTIMONY OF MICHAEL J. BALHOFF ON BEHALF OF
CALAVERAS TELEPHONE COMPANY (U 1004 C)
CAL-ORE TELEPHONE CO. (U 1006 C) DUCOR TELEPHONE COMPANY (U 1007 C)
FORESTHILL TELEPHONE COMPANY (U 1009 C) KERMAN TELEPHONE CO. (U 1012 C)
PINNACLES TELEPHONE CO. (U 1013 C) THE PONDEROSA TELEPHONE CO. (U 1014 C)
SIERRA TELEPHONE COMPANY, INC. (U 1016 C) THE SISKIYOU TELEPHONE COMPANY U 1017 C)
VOLCANO TELEPHONE COMPANY (U 1019 C) ("INDEPENDENT SMALL LECS")
March 11, 2016
Attachment No. 2 IURC Cause No. 45064
Indiana Exchange Carrier Association, Inc. Page 91 of 173
Attachment B

REBUTTAL TESTIMONY OF MICHAEL J. BALHOFF 1
I. INTRODUCTION AND PURPOSE 2
Q1. Would you please state your name and position for the record. 3
A. My name is Michael J. Balhoff. 4
Q2. Are you the same Michael J. Balhoff who provided prefiled 5
opening testimony on September 1, 2015 in this proceeding? 6
A. Yes, I provided prefiled testimony (“Opening Testimony”) on 7
behalf of the Applicants (the “Independent Small LECs”).1 8
II. SUMMARY OF REBUTTAL TESTIMONY 9
Q3. What is the purpose of your rebuttal testimony in this 10
proceeding? 11
A. This rebuttal testimony addresses misconceptions, errors, and 12
policy concerns raised by the testimony of the Office of Ratepayer 13
Advocates (“ORA”) of the California Public Utilities Commission 14
(“Commission” or “CPUC”) submitted in this proceeding on 15
February 12, 2016.2 16
1 Opening Testimony of Michael J. Balhoff on Behalf of Applicants, Independent Small LECs’ Application for a Determination of Applicants’ Cost of Capital for Ratemaking Purposes in Proceeding No. A. 15-09-005 (“Balhoff Opening Testimony”). 2 The Office of Ratepayer Advocates, Report and Recommendations on the Cost of Capital for Independent Small Local Exchange Carriers, filed on February 12, 2016 (“ORA Testimony”). I note that ORA’s testimony is organized as a
Attachment No. 2 IURC Cause No. 45064
Indiana Exchange Carrier Association, Inc. Page 92 of 173
Attachment B
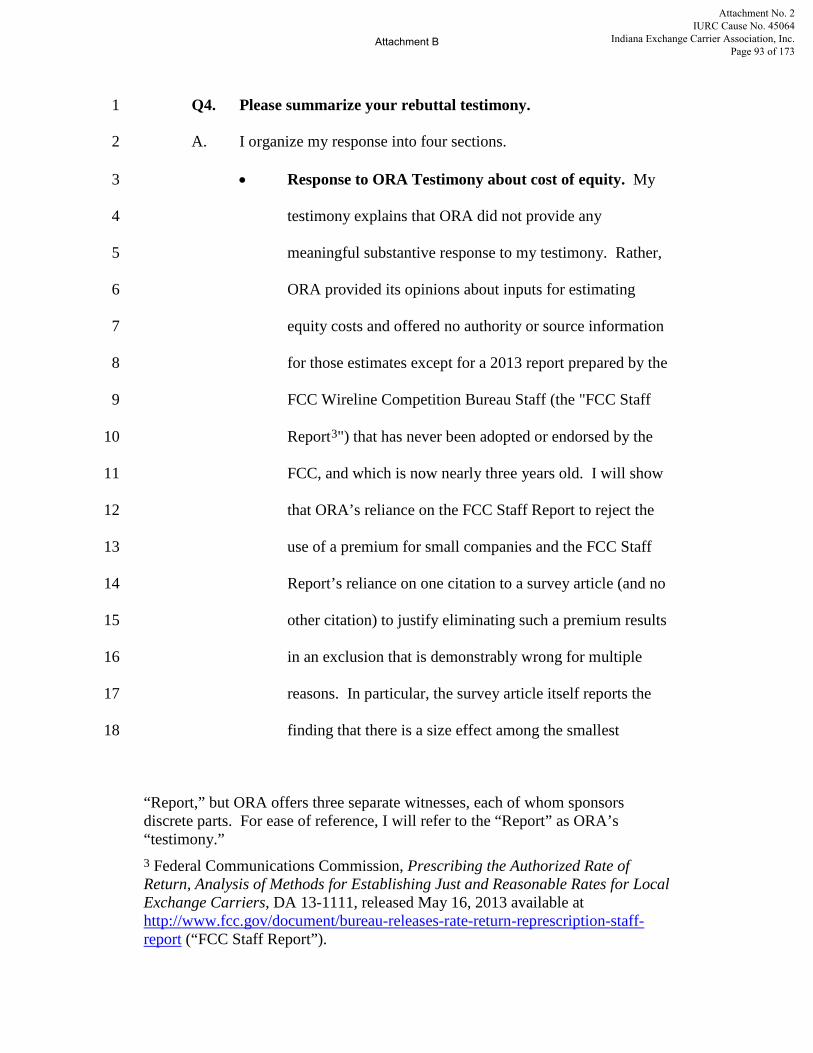
Q4. Please summarize your rebuttal testimony. 1
A. I organize my response into four sections. 2
• Response to ORA Testimony about cost of equity. My 3
testimony explains that ORA did not provide any 4
meaningful substantive response to my testimony. Rather, 5
ORA provided its opinions about inputs for estimating 6
equity costs and offered no authority or source information 7
for those estimates except for a 2013 report prepared by the 8
FCC Wireline Competition Bureau Staff (the "FCC Staff 9
Report3") that has never been adopted or endorsed by the 10
FCC, and which is now nearly three years old. I will show 11
that ORA’s reliance on the FCC Staff Report to reject the 12
use of a premium for small companies and the FCC Staff 13
Report’s reliance on one citation to a survey article (and no 14
other citation) to justify eliminating such a premium results 15
in an exclusion that is demonstrably wrong for multiple 16
reasons. In particular, the survey article itself reports the 17
finding that there is a size effect among the smallest 18
“Report,” but ORA offers three separate witnesses, each of whom sponsors discrete parts. For ease of reference, I will refer to the “Report” as ORA’s “testimony.” 3 Federal Communications Commission, Prescribing the Authorized Rate of Return, Analysis of Methods for Establishing Just and Reasonable Rates for Local Exchange Carriers, DA 13-1111, released May 16, 2013 available at http://www.fcc.gov/document/bureau-releases-rate-return-represcription-staff-report (“FCC Staff Report”).
Attachment No. 2 IURC Cause No. 45064
Indiana Exchange Carrier Association, Inc. Page 93 of 173
Attachment B

deciles, which include the Independent Small LECs at the 1
bottom of the tenth decile. The Staff’s sole source 2
therefore arrives at a conclusion entirely opposite what is 3
proposed in the FCC Staff Report, and that source actually 4
serves to support my testimony by justifying the inclusion 5
of a premium for size effect in the cost of equity 6
calculation. In my Opening Testimony, I provided analyses 7
based on all the major valuation resources, including data 8
drawn from multiple periods and using multiple 9
approaches. Finally, I corroborated my findings in my 10
Opening Testimony using merger and acquisition data, 11
which was not presented as the basis for my findings, but 12
was presented as an additional verification of those 13
findings. ORA offers no analysis to respond to or attempt 14
to contradict the principal conclusions in my Opening 15
Testimony. ORA’s summary dismissal of my testimony 16
relies on sources that can be impeached easily and 17
effectively. 18
• Response to ORA Testimony about debt. My testimony 19
explains that I recommended the use of actual, embedded 20
costs for carriers that have reported debt on their balance 21
sheets, and I recommend that the rates for that actual debt 22
should be supplied in the carriers’ rate cases. I do not 23
Attachment No. 2 IURC Cause No. 45064
Indiana Exchange Carrier Association, Inc. Page 94 of 173
Attachment B

recommend imputation of debt or the development of a 1
“forecast” for debt. However, in the event that the 2
Commission chooses to impute debt costs, I proposed a 3
reasonable cost of debt of 5.5%, a rate lower than the AAA 4
cost of debt and slightly below the rate being paid by Sierra 5
Telephone, one of the Independent Small LECs.4 ORA 6
proposes to use a lower figure (4.53%), computed as the 7
average of the seven Independent Small LECs that report 8
having debt, but in arguing that the carriers have access to 9
inexpensive debt in a range of 2.47%-2.82%, ORA does not 10
explain why all the carriers have higher debt costs than 11
these figures, and five of the seven have costs well higher 12
than the government-subsidized rates that ORA claims are 13
available to the carriers. I testify that rates are rising from 14
the artificially-depressed levels referenced by ORA and the 15
Federal Reserve is currently in the process of easing the 16
controls that are depressing those rates. I also explain that 17
the largest lender to rural carriers, CoBank with $95 billion 18
in assets, has publicly commented on the increased 19
regulatory risks that are dampening the credit markets for 20
small Incumbent Local Exchange Carriers (“ILECs”), 21
meaning that debt is less available for the small carriers. 22
4 Balhoff Opening Testimony, p. 10, lines 7-9; Exhibit MJB-14.
Attachment No. 2 IURC Cause No. 45064
Indiana Exchange Carrier Association, Inc. Page 95 of 173
Attachment B

CoBank also warns that the allowed rate of return should 1
not be reduced, because such an action—ORA’s precise 2
recommendation in this proceeding—will create even 3
greater limitations on credit, and potentially render the 4
industry as “not bankable.” 5
• Response to ORA Testimony about capital structure. 6
ORA asks the Commission to rely on the companies’ actual 7
capital structures or to possibly reduce the hypothetical 8
equity ratio, but my testimony shows that this approach 9
would overlook current and reasonably foreseeable trends 10
toward more conservative, equity-based balance sheets. 11
Carriers are migrating to a greater reliance on equity 12
because of higher risks attendant to their businesses. Three 13
of the Independent Small LECs have virtually 100% equity 14
ratios and five of the remaining seven companies have 15
improved their equity ratios by an average of 689 basis 16
points from 2010 to 2014. The conservatism related to the 17
companies’ capital management practices suggests 18
increasing caution as industry risks rise. Since 1997, the 19
Commission has relied on a hypothetical capital structure, 20
which appears to be a reasonable approach today and, if 21
adopted, should reflect the growing and justifiable 22
Attachment No. 2 IURC Cause No. 45064
Indiana Exchange Carrier Association, Inc. Page 96 of 173
Attachment B
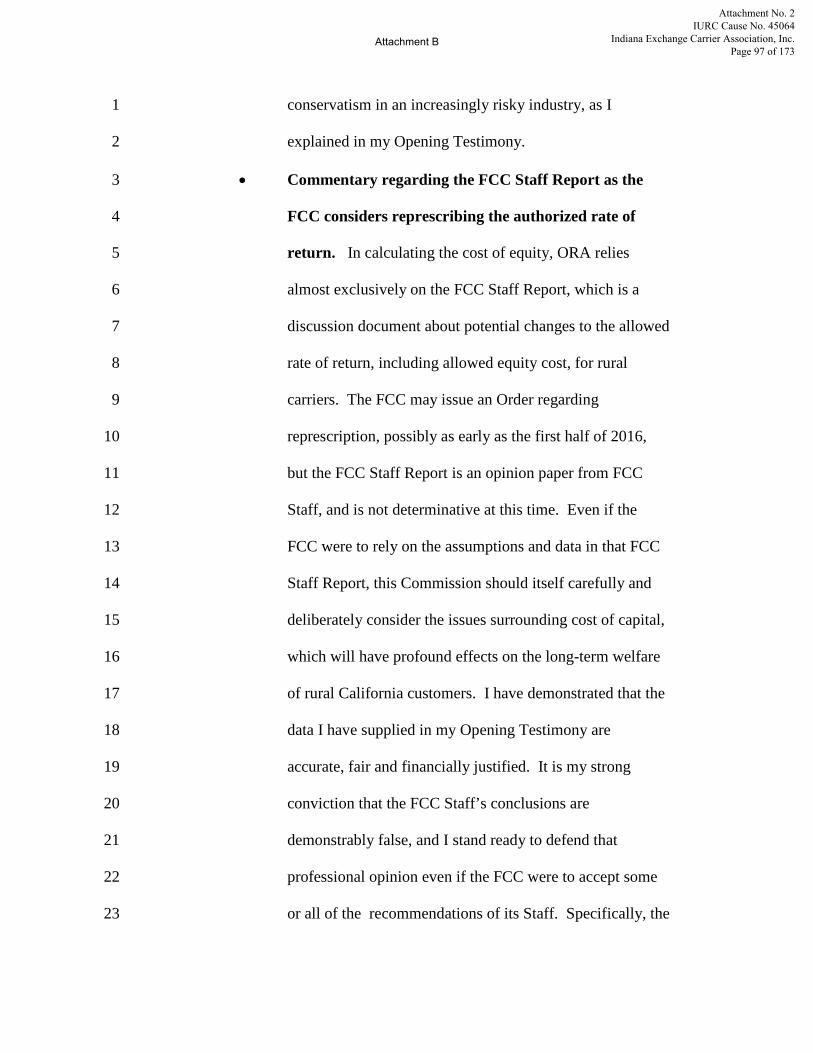
conservatism in an increasingly risky industry, as I 1
explained in my Opening Testimony. 2
• Commentary regarding the FCC Staff Report as the 3
FCC considers represcribing the authorized rate of 4
return. In calculating the cost of equity, ORA relies 5
almost exclusively on the FCC Staff Report, which is a 6
discussion document about potential changes to the allowed 7
rate of return, including allowed equity cost, for rural 8
carriers. The FCC may issue an Order regarding 9
represcription, possibly as early as the first half of 2016, 10
but the FCC Staff Report is an opinion paper from FCC 11
Staff, and is not determinative at this time. Even if the 12
FCC were to rely on the assumptions and data in that FCC 13
Staff Report, this Commission should itself carefully and 14
deliberately consider the issues surrounding cost of capital, 15
which will have profound effects on the long-term welfare 16
of rural California customers. I have demonstrated that the 17
data I have supplied in my Opening Testimony are 18
accurate, fair and financially justified. It is my strong 19
conviction that the FCC Staff’s conclusions are 20
demonstrably false, and I stand ready to defend that 21
professional opinion even if the FCC were to accept some 22
or all of the recommendations of its Staff. Specifically, the 23
Attachment No. 2 IURC Cause No. 45064
Indiana Exchange Carrier Association, Inc. Page 97 of 173
Attachment B
FCC Staff used a guideline or so-called proxy group with 1
characteristics significantly different from those of the 2
small rate-of-return ILECs, predetermining that its analysis 3
is unreliable in setting a cost of capital in this proceeding. 4
Further, the FCC Staff used a risk-free rate that was 5
distressed and well lower than any suggested by the major 6
professional valuation services. The FCC Staff also 7
rejected the incorporation of key size and marketability 8
premia, based on an argument that we will show leads to a 9
very different conclusion. The ORA Testimony that is 10
reliant upon the FCC Staff Report leads to an incorrect 11
estimation model. 12
13
III. RESPONSE TO ORA TESTIMONY ABOUT RETURN ON 14
EQUITY 15
Q5. ORA expresses concern that your calculation of the cost of 16
equity is higher by 50% over the implied cost of equity in the 17
1997 rate case decisions for the Independent Small LECs. How 18
do you respond? 19
A. As I noted in my Opening Testimony, I understand that my 20
recommendation is significantly higher than the implied cost of 21
Attachment No. 2 IURC Cause No. 45064
Indiana Exchange Carrier Association, Inc. Page 98 of 173
Attachment B
equity range referenced in the 1997 decisions.5 However, capital 1
markets and ILEC industry dynamics have evolved significantly 2
since the late 1990s, as regulatory, political, and competitive 3
developments have sharply increased the risk profiles of these 4
companies. I urge the Commission to look past ORA’s superficial 5
skepticism regarding my proposal, as the proof of its 6
reasonableness lies in its details. I was careful in my testimony to 7
provide the highest-quality sources for data and applications of 8
premia, relying on the most respected resources provided by 9
Ibbotson/Morningstar and Duff & Phelps. I used not one or two, 10
but multiple analytical estimation tools to test and re-test the data, 11
including assessments of data across various historical periods to 12
appropriately smooth any anomalous results.6 I rejected any 13
estimations that might have been interpreted as aggressive. 14
Specifically, I was conservative by: (i) applying no incremental 15
liquidity or marketability premium; (ii) using a size premium that 16
is 641 basis points lower than the 11.98% recommended by Duff & 17
Phelps for the smallest of companies (appropriate for a 10z 18
grouping into which the Independent Small ILECs clearly fall); 19
(iii) relying on an industry beta that is relatively low at 1.06, as it is 20
drawn from proxies that are all substantially larger, more liquid, 21
5 Balhoff Opening Testimony, p. 9, lines 10-13. 6 Balhoff Opening Testimony, p. 53, Table 3.
Attachment No. 2 IURC Cause No. 45064
Indiana Exchange Carrier Association, Inc. Page 99 of 173
Attachment B
more capable of acquisitions, and more diversified; and (iv) using 1
a risk-free rate that is the lower of the two options for each of the 2
periods studied (a higher result is generated when using total return 3
on the Treasury).7 Finally, I tested the results on the basis of 4
M&A data where I have again been conservative. My experience 5
leads me to the judgment that the appropriate valuation multiple 6
based on enterprise value to earnings before interest, taxes, 7
depreciation and amortization (“EBITDA”) for these companies is 8
likely closer to 5.0 times, which suggests a higher cost of equity 9
than the one I used.8 10
Q6. Did ORA provide any sources that directly addressed the data 11
and the premia you provided in your testimony? 12
A. ORA provides virtually no sourcing for the estimates or the 13
opinions it offers in its testimony. ORA’s single source for its 14
Capital Asset Pricing Model (“CAPM”) equity risk premium is the 15
FCC Staff Report. I will address in detail the deficiencies in the 16
FCC Staff Report in a later section of this testimony. ORA also 17
reported that it “looked at data collected by Professor Aswath 18
Damordan [sic],” but the detailed company-specific performance 19
7 Balhoff Opening Testimony, p. 73, lines 17 ff. 8 Balhoff Opening Testimony, p. 74, lines 6-8; “The transactional data indicate that the actual cost of equity is between 19.7% and 25.9%, which is well above 18.5% that I recommended.”
Attachment No. 2 IURC Cause No. 45064
Indiana Exchange Carrier Association, Inc. Page 100 of 173
Attachment B

data are not available for my review.9 Finally, ORA provides 1
footnote 51, which references four reports as the foundation for its 2
generalized claim that authorized rates of return for other regulated 3
utilities—electric, natural gas, and water—have declined.10 As I 4
will discuss, these utility sectors are fundamentally different from 5
the industry of the small, rural telephone companies. 6
Q7. Did ORA provide any substantive data in response to your 7
calculations? 8
A. ORA provided no substantive sources, except to reference the FCC 9
Staff Report, to which I respond in detail below. ORA gratuitously 10
supplies its views and opinions, but does not address the clear and 11
convincing data compiled from authoritative sources that are 12
presented in my Opening Testimony. 13
Q8. Does ORA disagree with your general approach to the CAPM? 14
A. No. ORA relies on a CAPM, which is fundamentally the same as 15
the Build-up Method used in my testimony, but ORA suggests its 16
own inputs that are different from those drawn from the various 17
Ibbotson and Duff & Phelps data.11 Most surprising, ORA reduces 18
the CAPM to two inputs, which are the forecasted risk-free rate 19
9 ORA Testimony, p. 43, lines 12-13. 10 ORA Testimony, p. 44. 11 ORA Testimony, p. 36, lines 11-21.
Attachment No. 2 IURC Cause No. 45064
Indiana Exchange Carrier Association, Inc. Page 101 of 173
Attachment B
and the equity risk premium.12 There are no other variables, 1
meaning that ORA recommends that the Independent Small LECs 2
have equity costs that are no different from the equity costs in the 3
general market. This remarkable proposition has never been 4
endorsed by the financial community and has never been supported 5
by a regulatory body, to the best of my knowledge. As the data 6
show, ORA’s attempt to equate the equity cost of these companies 7
with the general equity market cannot be correct. 8
Q9. What risk-free rate does ORA utilize? 9
A. ORA notes that the ten-year Treasury rate has fallen from 6.68% in 10
1997 to 3.07% in 2014. Then, ORA proposes to use the most 11
recent reported three-year average rate of 2.91%. ORA provides no 12
citation or authority for its recommended approach, nor does it 13
comment on today’s extraordinarily anomalous rate-environment. 14
Q10. Is the use of 2.91% appropriate? 15
A. No. As I explained in my Opening Testimony, the risk-free rate 16
and the equity premium should be matched in terms of the time 17
periods from which they are drawn, as is clear in the valuation data 18
provided by Ibbotson or Duff & Phelps.13 ORA’s estimated equity 19
12 ORA Testimony, p. 36, lines 15-18. 13 Balhoff Opening Testimony, p. 51, lines 4-12; the market expects a total return
Attachment No. 2 IURC Cause No. 45064
Indiana Exchange Carrier Association, Inc. Page 102 of 173
Attachment B
premium is apparently based on data from 1928 to 2012, a 76-year 1
period,14 yet its Treasury rate is drawn from a three-year average. 2
The result is a mismatch that is problematic. Even more 3
troublesome, however, is the fact that ORA’s proposed Treasury 4
rate is not a sound data point, as it is drawn from a period in which 5
the rate is at historically low levels and, according to most or all 6
financial experts, is artificially depressed.15 Using a rate that is at 7
extremely low levels, and demonstrably constrained by the Federal 8
Reserve’s interventions, does not provide a good indication of rates 9
that might be projected over extended future periods. It would be 10
just as wrong as if one were to use the 1981 Treasury Bond rate of 11
13.72% or the five-year Treasury Bond average of 12.09% for 12
1980 to 1984. Using a short period with extreme data is not 13
appropriate as such an approach leads to intellectually dishonest 14
and unreliable results. ORA’s use of these artificially low starting 15
“risk free” rates appears to be opportunistic and is, in my strong 16
opinion, not based on reasoned judgment and informative data. 17
Q11. How did you determine the appropriate risk-free rate? 18
so equity premia must be matched to the risk-free rate. 14 ORA Testimony, p. 39, lines 9-11; see also FCC Staff Report, p. 27, para. 72. 15 Balhoff Opening Testimony, p. 19, lines 1 ff.; 2015 Duff & Phelps Valuation Handbook: Guide to Cost of Capital, Market Results through 2014, (Hoboken, NJ: John Wiley & Sons, Inc., 2015) (“Duff & Phelps, 2015 Cost of Capital”).
Attachment No. 2 IURC Cause No. 45064
Indiana Exchange Carrier Association, Inc. Page 103 of 173
Attachment B

A. I matched the term of the risk-free rate from several periods with 1
the equity market premium drawn from those same periods. I used 2
extended periods to estimate an appropriate risk-free rate, thereby 3
smoothing data that would otherwise be too high or too low in 4
various periods. This is the standard practice in valuations. I also 5
used multiple periods to test the findings. The extended time 6
periods used in my testimony were 1926-2014, 1963-2014 and 7
1995-2014, and I provided the source data from 8
Ibbotson/Morningstar and from Duff & Phelps, so the Commission 9
can assess so-called “risk-free” rates in different, protracted 10
periods.16 As I have explained, the valuation-discipline requires 11
evaluating data that eliminate the distortive effects of extreme data 12
points, such as the depressed interest rates reported at the present 13
time. I have sourced the commentary about the Federal Open 14
Market Committee’s comments on the artificiality of today’s 15
Treasury rates.17 It is my professional opinion that ORA’s 16
approach cannot be viewed as reasonable, which may explain why 17
ORA provides no authorities to affirm its recommendation. My 18
testimony provides the Commission with data, sources, and 19
alternative time periods to justify, test, and confirm the results. 20
16 Balhoff Opening Testimony, p. 52, lines 5-7; p. 54, lines 9-10. Strictly speaking, there is no “risk-free” rate, but the U.S. Treasury is generally regarded as close to “risk-free.” 17 Balhoff Opening Testimony, p. 19, lines 6-22.
Attachment No. 2 IURC Cause No. 45064
Indiana Exchange Carrier Association, Inc. Page 104 of 173
Attachment B
ORA has not responded to my supporting authorities nor has it 1
provided any contrary authority, and ORA volunteers a depressed 2
rate from a period different from the period used to calculate the 3
equity premium. These errors are fundamental to ORA’s approach 4
and profoundly weaken its estimation of the Independent Small 5
LECs’ cost of equity. 6
Q12. What equity risk premium does ORA propose? 7
A. ORA cites to the FCC Staff Report and suggests using the Staff’s 8
figure of 5.88%, which it states is a figure comparable to the one 9
the CPUC used in 1997; the 5.88% rate is based on the period 1928 10
to 2012.18 ORA reports that recent estimates range from 4.51% to 11
6.21%, but ORA defaults to the FCC Staff Report proposal of 12
5.88%.19 My Opening Testimony provides equity premia that 13
were 5.1%, 6.6% and 4.9%, for the periods 1926-2014, 1963-2014 14
and 1995-2014, respectively, and alternative data using total 15
Treasury returns (yield plus capital appreciation) of 5.7%, 7.4% 16
and 8.6%, respectively, which, to be conservative, were not the 17
basis of my recommendations.20 Again, ORA does not consider 18
18 ORA Testimony, p. 39, lines 6-13; p. 43, lines 3-4. 19 ORA Testimony, p. 43, lines 4-6. 20 Balhoff Opening Testimony, p. 52, lines 5-7; p. 54, lines 9-10. The alternative rates were based on total Treasury returns (yield plus capital appreciation), but, because they generated higher equity costs of capital, were not used; this is another example of the conservative nature of my analysis in the Opening
Attachment No. 2 IURC Cause No. 45064
Indiana Exchange Carrier Association, Inc. Page 105 of 173
Attachment B

evidence drawn from different time periods and ORA does not 1
respond to the data compiled in my testimony, declining to explain 2
why my findings should be rejected or adjusted. In response, I 3
once again affirm that the data I used were drawn from the most 4
reliable sources and they provide the Commission with alternative 5
and confirmatory data. ORA does not provide a rationale for its 6
figure, except that it relies on the FCC Staff Report, which will be 7
addressed in a later section of my testimony. 8
Q13. Have you reviewed ORA’s Attachment 9, which presents a 9
6.43% averaged return on equity? 10
A. Yes. It appears that ORA is attempting to argue that its use of the 11
FCC market premium of 5.88% is reasonable by calculating actual 12
returns on equity (“ROE”) over the twelve-month period ended in 13
June 2015 for twelve telecommunications companies listed in 14
Attachment 9. 15
Q14. Do the data confirm the 5.88% return on equity that ORA is 16
advancing? 17
A. No. The Attachment is not instructive in any way. Fourteen 18
companies are included in the Attachment, but only twelve are 19
accompanied by a calculated ROE. The data are flawed upon even 20
a cursory examination. Alteva is primarily a software company, 21
with virtually no ILEC cash flow, and the ROE that ORA reported 22
Testimony.
Attachment No. 2 IURC Cause No. 45064
Indiana Exchange Carrier Association, Inc. Page 106 of 173
Attachment B

was a negative 11.4%. On April 26, 2015, Windstream spun off its 1
assets into a real estate investment trust which began to trade that 2
day as CSAL, so the negative 34.2% ROE resulted from no 3
adjustment being made for the spin-off. Verizon has a book equity 4
that reflects the company’s many acquisitions, which distorts the 5
ROE in the Attachment. Frontier has been in the process of 6
acquiring large-ILEC assets, including Verizon’s California, Texas 7
and Florida operations, with the result that integration-related 8
expenses skew the ROE. Similarly, Consolidated Communications 9
was recently in the process (closed October 16, 2014) of acquiring 10
and integrating Enventis (the former HickoryTech), meaning that 11
its results in 2015/2014 included acquisition expenses. In short, 12
the table provides data that are not instructive, and they certainly 13
do not support ORA’s argument that “[a]ctual earned return on 14
equity at this level suggests that ORA’s estimate for return on 15
equity in this proceeding is more reasonable than Mr. Balhoff’s.”21 16
Q15. Have you reviewed the data that ORA reported that it had 17
“looked at” regarding Professor Damodaran’s calculation of 18
ROE? 19
A. I did not have access to the underlying company-specific 20
performance data because the company-specific performance data 21
are not available in Professor Damodaran’s online spreadsheets, 22
21 ORA Testimony, p. 42, lines 10-12.
Attachment No. 2 IURC Cause No. 45064
Indiana Exchange Carrier Association, Inc. Page 107 of 173
Attachment B

and I understand that this data was not produced by ORA in 1
response to the Independent Small LECs' request for the 2
underlying data collected by Professor Damodaran that ORA 3
reviewed in connection with its Opening Testimony. I note that 4
ORA reported that Professor Aswath Damodaran calculated that 5
Telecommunications Services companies generated an ROE of 6
8.31% in 2014.22 A review of the Professor’s spreadsheet reveals 7
that he lists global securities, which, when sorted, yields 65 stocks 8
in the U.S. telecommunications services sector, only 16 of which 9
have ILEC businesses. The stocks that are included are so 10
disparate—including equipment, long-haul fiber, cable operators, 11
standalone Voice over Internet Protocol (“VoIP”) companies and 12
large conglomerates—that the calculated ROE proves meaningless 13
in the ORA testimony.23 Without conceding that ORA’s citation 14
to Damodaran is instructive or proper, I note that the spread 15
between the Treasury rate proposed by ORA (2.9%) and the 16
generalized reported Damodaran Telecom Services ROE is about 17
540 basis points (“bps”). Even this crude metric shows the 18
reasonableness of my testimony, which reports equity market 19
premia of 700 bps, 505 bps, and 684 bps, for the three periods 20
22 ORA Testimony, p. 43, lines 13-14. 23 It is necessary to sort Professor Damodaran’s spreadsheet to extract U.S. telecom services companies. See http://www.stern.nyu.edu/~adamodar/pc/datasets/indname.xls.
Attachment No. 2 IURC Cause No. 45064
Indiana Exchange Carrier Association, Inc. Page 108 of 173
Attachment B

1926-2014, 1963-2014 and 1995-2014, respectively, and an ILEC 1
beta of 1.06, which is only slightly riskier than the overall market. 2
Another salient problem with the ORA analysis—again noting that 3
it is not possible to review the underlying Damodaran company-4
specific performance data to assess potential outliers—is that ORA 5
is relying on one single year to “sample” telecommunications 6
services companies’ equity returns. As such, the approach 7
employed by ORA is so imprecise that it offers no meaningful 8
insight in this proceeding. Again, to reach accurate results, it is 9
necessary to use a longer period of years in assessing a comparable 10
industry group, consistent with the approach employed in my 11
testimony. 12
Q16. What is your view regarding ORA’s proposal not to use an 13
industry-specific adjustment? 14
A. ORA is fundamentally arguing that the CAPM should be reduced 15
to a “proposed” risk-free rate and a generic market equity return. 16
ORA proposes to use a very depressed Treasury rate and simply 17
add a low equity risk premium of 5.88%, again employing only 18
two inputs to estimate its so-called “reasonable cost of equity.”24 19
ORA reveals its fundamentally flawed “logic” when it explains 20
that “[h]olding all other variables fixed, one would expect the cost 21
of equity estimates to be lower when a lower risk-free rate is 22
2424 ORA Testimony, p. 3, line 8; p. 38, lines 9-10;
Attachment No. 2 IURC Cause No. 45064
Indiana Exchange Carrier Association, Inc. Page 109 of 173
Attachment B
employed in the financial models used to calculate costs of 1
capital.”25 According to ORA’s proposal, only the change in the 2
risk-free rate matters, as it is “holding all other variables fixed,” 3
meaning that the market return remains essentially the same over 4
the protracted 1928 to 2014 period. ORA does not evaluate any 5
other variables, and believes that it is sufficient to assign the LECs 6
a cost of equity that is the sum of a lower Treasury rate plus a 7
market-wide return—without any premium for industry-specific 8
risk and without an allowance for any other risks. ORA summarily 9
rejects market or company analyses, which is an approach that, to 10
the best of my knowledge, no professional source endorses. In 11
addition, I believe the failure to account for industry-specific risks 12
is inconsistent with the plain language of applicable legal guidance 13
from the United States Supreme Court. 14
Q17. In what way do you believe ORA’s approach to equity risk is 15
inconsistent with applicable Supreme Court guidance? 16
A. I am not an attorney, but I am familiar with the seminal U.S. 17
Supreme Court cases addressing the legal parameters within which 18
state commissions must examine rate-of-return issues. ORA 19
acknowledges some of these U.S. Supreme Court authorities in its 20
“Cost of Equity” section, but it fails to follow the critical guidance 21
25 ORA Testimony, p. 39, lines 15-17.
Attachment No. 2 IURC Cause No. 45064
Indiana Exchange Carrier Association, Inc. Page 110 of 173
Attachment B

that is evident in those opinions.26 The Supreme Court calls for 1
industry-specific assessments, including a consideration of relevant 2
regulatory risks. In Bluefield Water Works & Improvement Co. v. 3
Public Service Commission of West Virginia, 262 U.S. 679 (1923) 4
(“Bluefield”), the Court states that a public utility is entitled to 5
such rates that will permit a return “equal to that generally being 6
made at the same time and in the general part of the country on 7
investments in other business undertakings which are attended by 8
the corresponding risks and uncertainties . . .” (emphasis added). 9
Federal Power Commission v. Hope Natural Gas Company, 320 10
U.S. 391 (1944), makes a similar point, citing “the return to the 11
equity owner should be commensurate with returns on investments 12
in other enterprises having corresponding risks” (emphasis added.) 13
Finally, Duquesne Light Company et al. v. David M. Barasch et 14
al., 488 U.S. 299 (1989), reiterated the standard of Hope and 15
Bluefield and then added important new factors, including 16
“regulatory risk,” noting that a “decision to arbitrarily switch back 17
and forth between methodologies in a way which required 18
investors to bear the risk of bad investments at some times while 19
denying them the benefit of good investments at others would raise 20
serious constitutional questions.” From the plain language, these 21
opinions point to a required assessment of industry-specific risks, 22
26 ORA Testimony, pp. 34-35.
Attachment No. 2 IURC Cause No. 45064
Indiana Exchange Carrier Association, Inc. Page 111 of 173
Attachment B

including risks in a period of significant regulatory change, that 1
should be reflected in cost of equity capital. My experience and 2
my reading of these constitutional rulings lead me to believe that it 3
is not defensible to argue that the Independent Small LECs deserve 4
a return that simply mirrors the overall market return for equity. 5
Q18. What basis does ORA offer for its rejection of a size premium? 6
A. ORA devotes a mere twelve lines in its testimony to the size 7
premium, and fails to address the sources and data provided in my 8
Opening Testimony. ORA dismisses the premium with the 9
summary comment that because the Independent Small LECs are 10
rate-regulated, the companies experience no risk that exceeds the 11
overall market risk.27 ORA supports its view with a single citation 12
to the FCC Staff Report that also did not recommend a size 13
premium.28 Finally, ORA states, without further explanation, that 14
“even if size was determined to be a relevant factor, it is quite 15
possible that the relatively small size of the ILECs would afford 16
them an opportunity to more nimbly adjust strategy and budgets in 17
response to competitive forces . . .”29 18
Q19. Is it appropriate to dismiss the size premium? 19
27 ORA Testimony, p. 43, lines 14-16. 28 ORA Testimony, p. 43, lines 16-18; footnote 50. 29 ORA Testimony, p. 43, lines 18-21.
Attachment No. 2 IURC Cause No. 45064
Indiana Exchange Carrier Association, Inc. Page 112 of 173
Attachment B

A. No. Significant research supports the validity of enhanced risk that 1
is either due to, or closely related to, size. That is, a CAPM model 2
that relies only on a risk-free rate and a market equity risk 3
premium is not sufficient to estimate the costs of equity for small 4
companies. Again, ORA cites to the FCC Staff Report.30 No 5
other justification is provided for ignoring this widely-used factor. 6
I will explain below that the FCC Staff Report on which ORA 7
relies also devotes a mere six lines to the size premium, citing only 8
a single source which is a 25-page survey article in 2011 as the 9
justification for rejecting the premium, and overlooking the 10
article’s findings that the size effect is significantly related to 11
illiquidity and concentrated in the three smallest deciles of the 12
market.31 The Independent Small LECs fall in the lowest quartile 13
30 ORA Testimony, p. 40, line 1. 31 Crain, Michael A., A Literature Review of the Size Effect (October 29, 2011), (“Crain”) available at SSRN: http://ssrn.com/abstract=1710076, pp. 11-12; 15:
Studies reveal that market liquidity may be an important risk factor underlying firm size. Amihud & Mendelson (1986) examine American stocks from 1961 to 1980 and find that the size effect is linked to liquidity when measured by bid-ask spread. They regress stock returns on CAPM beta, firm size, and bid-ask spread; they find that size is insignificant. But when the bid-ask spread variable is omitted, size is significant. Amihud & Mendelson reason that firm size is a proxy for liquidity. More recently, Amihud (2002) finds market illiquidity effects on returns are significant and stronger in smaller firms. He examines NYSE stocks from 1964 to 1997 by regressing returns on firm size, market liquidity, and other variables. From the findings, he suggests that temporal variations in the size effect are related to changes in market liquidity over time. Further, Pastor & Stambaugh (2003) examine American firms from 1966 to 1999 and find that marketwide liquidity is a factor in explaining returns by adding a liquidity variable to Fama & French’s (1993) three-factor model. Since this three-factor model has a
Attachment No. 2 IURC Cause No. 45064
Indiana Exchange Carrier Association, Inc. Page 113 of 173
Attachment B

of the smallest decile. The article’s author, Michael Crain, devotes 1
Section 6 of his survey to address findings that the size effect is 2
concentrated in the smallest companies. 3
Researchers find the size effect, when observed, is 4 concentrated in smaller firms. It seems the size 5 effect is not linear across listed firms. Horowitz et 6 al. (2000a) observe the size effect seems to occur 7 only in smaller listed firms. . . . Since Horowitz et 8 al. replicate the methodology of Fama & French 9 (1992), they argue that the findings of Fama & 10 French are concentrated in very small firms and not 11 across all small firms as Fama & French claim. In 12 another study, Fama & French (2008) observe that 13 the size effect exists in U.S. listed firms but it is 14 strongest among microcap firms using data from 15 1963 to 2005.32 16
17
variable for firm size, Pastor & Stambaugh’s study essentially finds marketwide liquidity is important in addition to firm size. Subsequently, Liu (2006) confirms that market liquidity has power in explaining returns by examining U.S. stocks from 1960 to 2003. He illustrates that market liquidity varies significantly over time and, thus, so does investor liquidity risk (Liu 2006, Figure 1). Further, he finds that liquidity subsumes effects due to size (and other factors). In a later study, Chen et al. (2010) examine American stocks from 1972 to 2009 and find the liquidity effect does not completely capture the size effect but that liquidity is highly correlated with firm size. A model without a variable for liquidity might cause the size effect to vary (or, perhaps, even disappear) as market liquidity changes over time. Horowitz et al. (2000a) are implicitly examining the liquidity hypothesis when they find the size effect disappears after a small-cap fund was introduced. That fund provided more access and, thus, liquidity to smaller listed firms. Moreover, Amihud (2002) finds that returns of smaller firms are more sensitive to market illiquidity and that smaller firms have more liquidity risk than larger firms. He asserts that such findings may explain variations of the size effect. Market liquidity changes over time, he contends, due to shifts in sentiment whereby investors sometimes flee to liquidity, which makes large stocks relatively more attractive. Amihud also finds that market liquidity is consistent over time, unlike firm size, as a factor explaining returns.
32 Crain, p. 15.
Attachment No. 2 IURC Cause No. 45064
Indiana Exchange Carrier Association, Inc. Page 114 of 173
Attachment B
Thus, the survey article cited by the FCC Staff in its Report—on 1
which ORA relies—finds that size effects do exist in the smallest 2
firms. The Fama & French study, referenced by Crain, affirms size 3
effects in “microcap” companies which are typically described as 4
companies with market capitalizations of $50 million to $300 5
million. For perspective, the 2014 average common book equity of 6
the Independent Small LECs is $20.2 million and the median book 7
equity is $14.3 million.33 The Crain article, therefore, finds the 8
exact opposite of what the FCC and ORA is claiming as that article 9
justifies a size premium for companies that are even larger than the 10
Independent Small LECs. 11
Q20. Does other scholarly research reject the addition of a size 12
premium? 13
A. No. As I have explained, the widely-accepted approach 14
recommended by valuation experts and scholars applies a size 15
premium to account for increased risks among the smallest 16
companies. Data seeking to quantify the size-effect premium are 17
reflected in seminal valuation reports, such as those released by 18
Ibbotson/Morningstar and Duff & Phelps. In the face of these 19
authorities supporting a size premium and/or related factors such 20
as liquidity, ORA’s rejection of the approach is startling. Indeed, 21
33 The largest of the Independent Small LECs is Siskiyou, which reported 2014 book equity of $59.6 million, which is still at the bottom of the microcap range.
Attachment No. 2 IURC Cause No. 45064
Indiana Exchange Carrier Association, Inc. Page 115 of 173
Attachment B

even the article referenced by the FCC Staff Report states that the 1
CAPM does not explain the risk associated with all companies, 2
particularly firms that are in the smallest deciles. The survey 3
article considers whether there are other factors that better explain 4
the size effect, and it provides sources with alternative – but 5
confirmatory – explanations for the size effect, which include 6
liquidity and size factors concentrated in the three smallest deciles 7
of the stocks studied. 34 In the final section of his survey, Crain 8
summarizes his article as follows: 9
When the size effect is observed, theory suggests that 10 superior returns in smaller firms arise from higher 11 risk in these firms compared to larger firms. 12 Researchers do not claim that size per se is a source 13 of risk that drives superior returns of smaller firms. 14 Instead, firm size may be a proxy for one or more 15 underlying risk factors linked to smaller firms. Such 16 factors could be endogenous or exogenous and 17 explain variations in the size effect. Empirical 18 research suggests one such embedded factor in 19 smaller firms is liquidity risk. Logically, these 20 findings on liquidity seem linked to the emergence of 21 small-cap investment funds in the 1980s. Small-cap 22 funds increase the liquidity of smaller firms and, thus, 23 liquidity risk in these firms ought to be lower on 24 average after these kinds of funds launch. It follows 25 that superior returns of smaller firms should decline 26 when liquidity risk decreases. In addition to the 27 discoveries of the size effect and variations in the 28 effect, two areas of research are related to these 29 findings. First, research shows that when the size 30 effect is observed, it is nonlinear and concentrated in 31 smaller listed firms. One study finds the effect is five 32 times larger in firms in the 20th percentile using 33
34 Crain, p. 4, citing a Michou study in 2010.
Attachment No. 2 IURC Cause No. 45064
Indiana Exchange Carrier Association, Inc. Page 116 of 173
Attachment B

NYSE breakpoints for size and only marginal across 1 the remaining larger firms.35 2
3 In addition to the sources cited in Crain’s article, including those 4
referenced in footnote 31, above, the highly-respected valuation 5
experts. Shannon Pratt and Roger Grabowski, dedicate two entire 6
chapters and an appendix to size effect— “Chapter 14: Size 7
Effect,” “Chapter 15: Criticism of the Size Effect,” and “Appendix 8
15A: Other Data Issues Regarding the Size Effect”—in their Cost 9
of Capital text.36 Pratt and Grabowski report that: 10
Two results of the Size Study [of 11 Ibbotson/Morningstar and Duff & Phelps] seem 12 strikingly similar. 13 1. In spite of the different time period, the size effect 14
results corroborate the Morningstar results that the 15 size effect is empirically observed. 16
2. The results are significantly similar for all eight 17 measures of company size. 18
Although the market value of common equity has 19 both the highest degree of statistical significance and 20 the steepest slope when regressing average returns 21 against size, all size measures show a high degree of 22 statistical significance. . . . 23 While there have been many criticisms of the size 24 effect, it continues to be observed in data sources that 25 utilize the CAPM methodology. . . . Studies have 26 shown the limitations of beta as a sole measure of 27 risk. The size premium is an empirically derived 28 correction to the textbook CAPM.37 29
35 Crain, pp. 21-22. 36 Shannon Pratt and Roger Grabowski, Cost of Capital: Applications and Examples, Fifth Ed. (Hoboken, NJ: John Wiley & Sons, Inc., 2014), (“Pratt and Grabowski Cost of Capital 2014”), pp. 301-371. See also Shannon Pratt and Roger Grabowski, Cost of Capital: Applications and Examples, Third Ed. (Hoboken, NJ: John Wiley & Sons, Inc., 2008) (“Cost of Capital”), pp. 179-223. 37 Cost of Capital 2008, pp. 207, 219. See also, Pratt and Grabowski Cost of
Attachment No. 2 IURC Cause No. 45064
Indiana Exchange Carrier Association, Inc. Page 117 of 173
Attachment B
1
In this discussion, “beta” is the company or industry adjustment (a 2
single number) multiplied times the CAPM equity premium and 3
the result is added to the “risk-free rate.” As I explained in my 4
Opening Testimony, “beta” is a number used in the CAPM to 5
adjust the overall market return to account for the greater or lesser 6
risk associated with a stock or with an industry relative to the 7
overall market risk.38 Notably, in the quotation above, Pratt and 8
Grabowski state that the use of an industry beta in the CAPM is 9
not sufficient, in the absence of a size premium, which is a view 10
consistent with my experience and my testimony about the 11
necessity for a size-related adjustment. Pratt and Grabowski are 12
criticizing the proposal that the FCC Staff has made—that a risk-13
free rate plus an industry beta (applied to the equity market return) 14
with no size premium is sufficient. ORA’s proposal is even more 15
extreme, as it proposes no size premium and no industry 16
Capital 2014, p. 361, which repeats the last two sentences of the quotation above. 38 See Balhoff Opening Testimony, pp. 23-24; “beta: is a number that represents statistical volatility that is calculated by performing regressions on stock price changes related to the overall equity market and similar regressions for the stock or industry in question. If the equity market premium is 6% above the risk-free rate, then a stock with a beta of 1.1 is 10% more volatile (riskier) than the overall market and should have an equity premium of 6.6% (1.1 times 6%), and a stock with a beta of 0.9 is 10% less volatile (risky) than the overall market and should have an equity premium of 5.4% (0.9 times 6%). Industry betas are calculated on the basis of the betas of the individual stocks in an industry, which makes industry betas dependent on choosing companies similar to the companies whose equity premia are being studied.
Attachment No. 2 IURC Cause No. 45064
Indiana Exchange Carrier Association, Inc. Page 118 of 173
Attachment B

adjustment. ORA’s approach contains no citations because, to the 1
best of my knowledge, there are no credible authorities available to 2
support such a methodology. 3
Q21. Is there evidence that a size premium is appropriate for 4
regulated utilities? 5
A. Yes. Dr. Roger Morin, who is referenced in more than 20 6
footnotes in the FCC Staff Report, writes the following in his oft-7
cited text, New Regulatory Finance:39 8
Investment risk increases as company size diminishes, 9 all else remaining constant. Small companies have 10 very different returns than large ones, and on average 11 they have been higher. The greater risk of small 12 stocks does not fully account for their higher returns 13 over many historical periods. The size phenomenon 14 is well-documented in the finance literature. 15 Empirical studies by Banz (1981) and Reinganum 16 (1981A) have found that investors in small 17 capitalization stocks require higher returns than 18 predicted by the standard CAPM. . . . The relationship 19 between firm size and return cuts across the entire 20 size spectrum but is most evident among companies 21 that have higher returns than larger ones on average. 22 Ibbotson Associates’ well-known historical return 23 series publication covering the period 1926 to the 24 present reinforces this evidence (Ibbotson Associates’ 25 2005 Yearbook, Valuation Edition). To illustrate, the 26 Ibbotson data suggests that under SIC Code 49, 27 Electric, Gas & Sanitary Services, the average return 28 for that group over almost an 80-year period was 29 14.03% for the small-cap company group and 10.86% 30 for the large-cap group, more than a 300-basis point 31 difference. This is true for all industry groups.40 32
39 Roger A. Morin, New Regulatory Finance (Vienna, VA: Public Utilities Reports, Inc., 2006) (“Morin”). 40 Morin, pp. 181-182.
Attachment No. 2 IURC Cause No. 45064
Indiana Exchange Carrier Association, Inc. Page 119 of 173
Attachment B

1
Even for utilities that are true monopolies, which the Independent 2
Small LECs are not, Dr. Morin’s observed difference in the costs 3
of equity between larger and smaller companies is striking 4
(approximately 300 bps). I am convinced that there should be the 5
addition of a size premium, and the actual difference is larger for 6
companies in a highly competitive market, such as 7
telecommunications, compared with traditional public utility 8
sectors, such as water or energy, where there is essentially no 9
competition. 10
Q22. Can you respond to ORA’s claim that “even if size was 11
determined to be a relevant factor, it is quite possible that the 12
relatively smaller size of the ILECs would afford them an 13
opportunity to more nimbly adjust strategy and budgets in 14
response to competitive forces, changing customer demands, 15
and technological innovations, thereby lowering risk”?41 16
A. Yes. ORA’s conclusion is nothing but speculation and is wrong, in 17
my opinion. Small companies have greater risk, particularly in the 18
ILEC industry, which is a high fixed-cost business in which large, 19
long-term investments are necessary. Customer losses often 20
translate to proportionately higher losses of operating cash flows, 21
because the plant does not go away; the result is that operating risk 22
41 ORA Testimony, p. 43, line 18 ff.
Attachment No. 2 IURC Cause No. 45064
Indiana Exchange Carrier Association, Inc. Page 120 of 173
Attachment B

rises rapidly as competition grows. Greater size permits carriers to 1
spread marginal costs over a large number of customers, and 2
smaller firms are severely disadvantaged in managing their costs. 3
As a result, small carriers require more federal and state support to 4
supplement their investments and operations, while keeping rates 5
within reasonable bounds. Further, small carriers have relatively 6
low diversification of revenues compared with large carriers, and, 7
as in a stock portfolio, diminished diversification results in 8
increased risk. Finally, small carriers have limited access to the 9
capital markets, which creates significantly greater risks. Dr. 10
Morin addresses the greater risk for smaller utilities, effectively 11
responding to ORA. 12
Smaller companies are less able to deal with 13 significant events that affect revenues and cash flows 14 than larger companies. For example, the loss of sales 15 from a few large customers would exert a far greater 16 effect on a small company . . . . Presumably, small 17 stocks provided less utility to the investor, and require 18 a higher return.42 19
20 ORA’s statement is not only speculative—and offered without any 21
citation or justification—but it is also contrary to prevailing 22
authority and common sense. 23
42 Morin, p. 187.
Attachment No. 2 IURC Cause No. 45064
Indiana Exchange Carrier Association, Inc. Page 121 of 173
Attachment B

Q23. How do you respond to ORA’s commentary that since 1997, 1
authorized rates of return for U.S. regulated electric, natural 2
gas, and water utilities have declined?43 3
A. The other U.S-regulated industries—electric, natural gas, and 4
water—have monopoly characteristics that are distinguishable 5
from those in the ILEC industry. ILECs are no longer monopolies, 6
and even rural carriers are affected by increasing competitive 7
pressures. The ILEC industry is challenged by significant capital 8
expenditure pressures due to technology transitions with shorter 9
lives, and, as recent trends in FCC policy amply demonstrate, the 10
ILEC industry is buffeted by regulatory turbulence. These ”risks” 11
create a significantly higher uncertainty, and, hence, higher equity 12
cost for ILECs. 13
Q24. Did you consider ORA’s argument regarding the decline in 14
authorized ROEs for regulated utilities since 1997? 15
A. Yes. While not quantified in ORA’s testimony, the 2009 report 16
from Regulatory Research Associates (cited in the ORA testimony 17
at footnote 51), reveals that the average equity returns for electric 18
and gas utilities have declined from 11.34% in 1997 to 10.42% in 19
2008, that is, by approximately 92 bps over that 12-year period.44 20
In that same footnote, ORA also cites an April 2009 slide 21
43 ORA Testimony, p. 44, lines 13-15. 44 Regulatory Research Associates, Regulatory Focus, (January 12, 2009), p. 4.
Attachment No. 2 IURC Cause No. 45064
Indiana Exchange Carrier Association, Inc. Page 122 of 173
Attachment B
presentation from Moody’s Investors Service (“Moody’s”), which 1
tracks what appear to be authorized and realized utility ROEs for 2
the electric industry. At the time of the presentation, the 3
authorized returns were slightly above 10%, while the realized 4
ROEs were graphed at levels approximately 50 bps lower.45 The 5
February 2013 Industry Outlook report from Moody’s, also cited in 6
ORA’s footnote 51, explains that the stable outlook for the electric 7
and gas sector is the result of a “sustained period of low natural gas 8
prices,” a “flight to quality” in the capital markets (when investors 9
are fearful they usually trade out of riskier securities and flee to 10
quality securities that are large, dividend paying and predictable 11
equities or higher-grade debt instruments), and anticipated large 12
capital expenditures that “will contribute to rate base growth.”46 13
In the 2015 “Capital Market Conditions” article cited by ORA in 14
footnote 51, Dr. Randall Woolridge reports that gas and electric 15
companies have authorized ROEs that have fallen to approximately 16
9.7% by 2015.47 17
45 Moody’s Investor’s Service, Estimating the Cost of Capital in Today’s Economic & Capital Market Environment, 41st Financial Forum, Society of Utility and Regulatory Financial Analysts (April 2009), slides 7-8. 46 Moody’s Investor Services, Industry Outlook: US Regulated Utilities (February 6, 2013), p. 1. 47 J. Randall Woolridge, Capital Market Conditions, Authorized Utility ROEs, and Hope and Bluefield Standards, October 22, 2015, p. 7 (Table 1).
Attachment No. 2 IURC Cause No. 45064
Indiana Exchange Carrier Association, Inc. Page 123 of 173
Attachment B
Q25. Do these sources support an argument that the Independent 1
Small LECs’ equity costs are consistent with those of gas and 2
electric utilities? 3
A. No. The ORA sources listed in footnote 51 all refer to gas and 4
electric companies that have little or no competition, and which are 5
readily distinguishable from ILECs. Moody’s Industry Outlook 6
focuses primarily on the costs for natural gas, resulting in reduced 7
expenditures that should enable higher generation profitability. In 8
contrast, today’s ILEC profitability and cash flows are shrinking as 9
the carriers work to respond to competitive pressures and 10
regulatory mandates for modern, broadband-capable infrastructure. 11
As an illustration of a telling difference between the utilities cited 12
by ORA and telecommunications carriers, Duff & Phelps in its 13
most recent Industry Cost of Capital Handbook indicates that, in 14
2015, the median cost of equity for the gas and electric industry 15
(SIC code 493) is approximately 240 bps lower than the cost of 16
equity for the telecommunications industry (SIC Code 4813), 17
which is a clear sign of the greater risk in the telecommunications 18
industry.48 So, if Dr. Woolridge is correct that gas and electric 19
utilities should have authorized ROEs of approximately 9.7%, the 20
Duff & Phelps data suggest that the telecommunications services 21
48 Duff & Phelps 2015 Valuation Handbook: Industry Cost of Capital, (Hoboken, NJ: John Wiley & Sons, Inc., 2015); unnumbered pages—SIC Codes 493 and 4813.
Attachment No. 2 IURC Cause No. 45064
Indiana Exchange Carrier Association, Inc. Page 124 of 173
Attachment B
industry should start with ROEs closer to 12.1%, before adding 1
size or liquidity premia for the Independent Small LECs. It is clear 2
that the electric and gas industry is not comparable with the ILEC 3
industry, as the risks for telecommunications carriers are greater 4
than those of monopoly utilities and are becoming arguably even 5
larger as regulatory uncertainties increase. 6
Q26. Has the CPUC found that there is a difference in risk for 7
smaller utilities compared with larger ones? 8
A. Yes. In 1997, the CPUC wrote that the Commission “concur[s] 9
that applicant’s [Foresthill’s] risk is impacted by its small size in 10
relation to the large size of the companies in the study group.”49 11
However, the Commission did not adopt an explicit size premium, 12
nor did it adopt any specific risk premium, because the CPUC 13
chose to approach setting rates in a different way; that is, it 14
adopted a 10% rate of return for each of the carriers, independent 15
of capital structure or specific costs of debt. 16
Q27. Does ORA correctly assess the effects of regulation on the risk 17
profiles of the Independent Small LECs? 18
A. No. ORA fails to acknowledge the significant political and 19
regulatory risks attendant to rural telephone company revenue 20
streams, and ORA wrongly alleges that the companies are 21
49 D.97-04-033 (Foresthill), at 20.
Attachment No. 2 IURC Cause No. 45064
Indiana Exchange Carrier Association, Inc. Page 125 of 173
Attachment B

“shielded” from risks by virtue of their access to certain federal 1
and state high-cost support. 2
Q28. Does ORA explain how it believes that universal service 3
programs “shield” the companies from risk? 4
A. No. ORA simply asserts that “the USF and CHCF-A [California 5
High Cost Fund A] provide known levels of revenue for the Small 6
LECs” and that “revenues derived from revenue requirements 7
adopted in general rate cases . . . are updated annually.”50 8
Q29. Do the USF and CHCF-A provide “known levels of revenue” 9
for the Independent Small LECs? 10
A. No. The federal Universal Service Fund program and the CHCF-A 11
do not guarantee that Independent Small LECs will achieve any 12
particular level of total revenue. The support programs provide 13
important revenue sources for the Independent Small LECs, but 14
Independent Small LECs also depend upon revenue from end users 15
and intercarrier compensation. As one reference point, Public 16
Utilities Code Section 275.6(b)(3) defines small independent 17
telephone corporations’ “rate design” to include a “mix of end user 18
rates, high-cost support, and other revenue sources.” The 19
Independent Small LECs do not “know” what their revenues will 20
50 ORA Testimony, p. 38.
Attachment No. 2 IURC Cause No. 45064
Indiana Exchange Carrier Association, Inc. Page 126 of 173
Attachment B
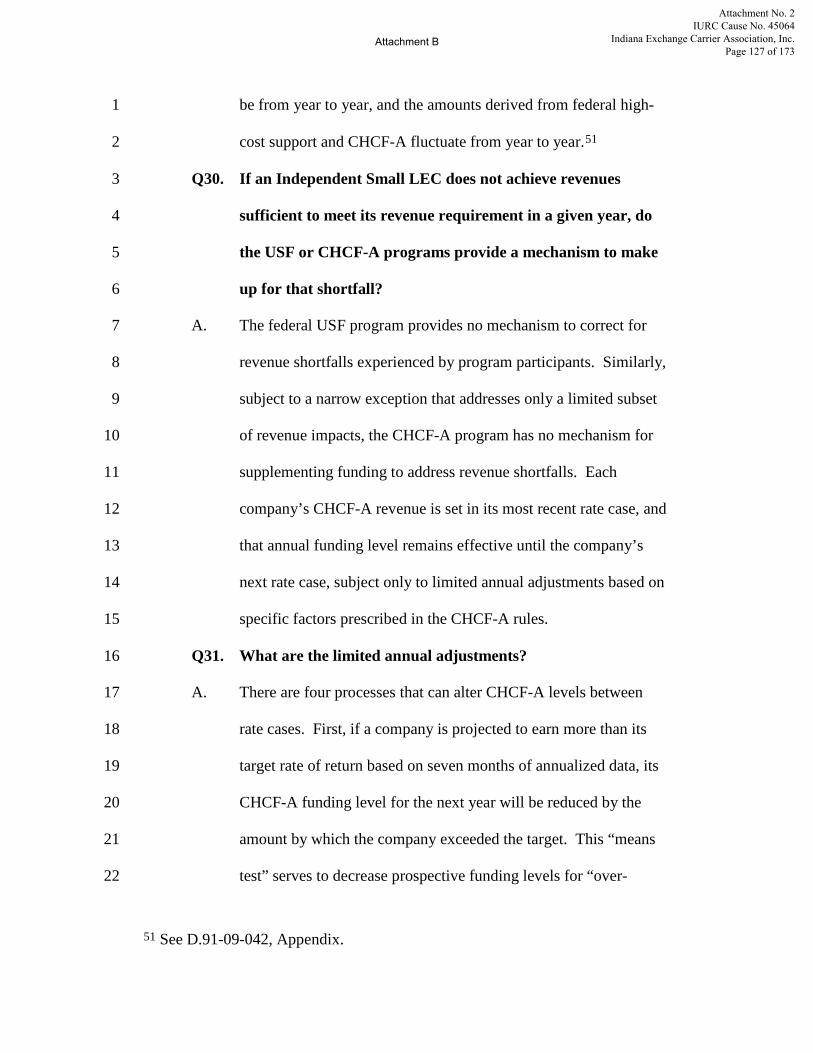
be from year to year, and the amounts derived from federal high-1
cost support and CHCF-A fluctuate from year to year.51 2
Q30. If an Independent Small LEC does not achieve revenues 3
sufficient to meet its revenue requirement in a given year, do 4
the USF or CHCF-A programs provide a mechanism to make 5
up for that shortfall? 6
A. The federal USF program provides no mechanism to correct for 7
revenue shortfalls experienced by program participants. Similarly, 8
subject to a narrow exception that addresses only a limited subset 9
of revenue impacts, the CHCF-A program has no mechanism for 10
supplementing funding to address revenue shortfalls. Each 11
company’s CHCF-A revenue is set in its most recent rate case, and 12
that annual funding level remains effective until the company’s 13
next rate case, subject only to limited annual adjustments based on 14
specific factors prescribed in the CHCF-A rules. 15
Q31. What are the limited annual adjustments? 16
A. There are four processes that can alter CHCF-A levels between 17
rate cases. First, if a company is projected to earn more than its 18
target rate of return based on seven months of annualized data, its 19
CHCF-A funding level for the next year will be reduced by the 20
amount by which the company exceeded the target. This “means 21
test” serves to decrease prospective funding levels for “over-22
51 See D.91-09-042, Appendix.
Attachment No. 2 IURC Cause No. 45064
Indiana Exchange Carrier Association, Inc. Page 127 of 173
Attachment B
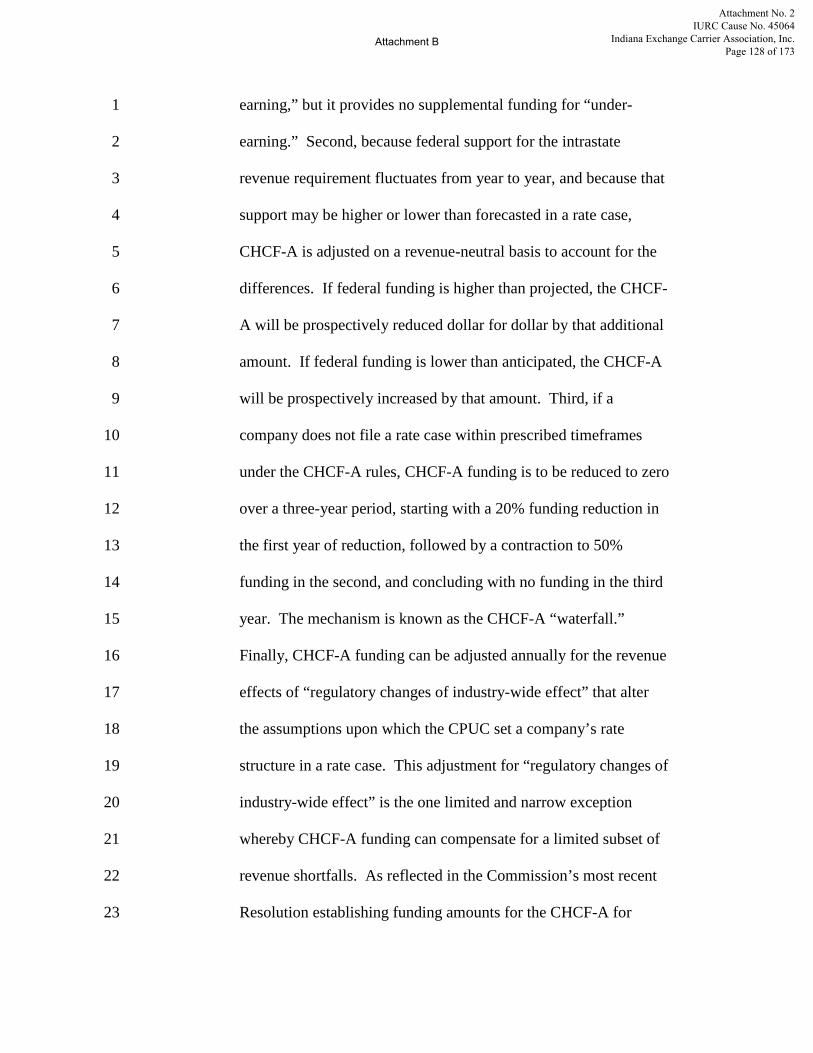
earning,” but it provides no supplemental funding for “under-1
earning.” Second, because federal support for the intrastate 2
revenue requirement fluctuates from year to year, and because that 3
support may be higher or lower than forecasted in a rate case, 4
CHCF-A is adjusted on a revenue-neutral basis to account for the 5
differences. If federal funding is higher than projected, the CHCF-6
A will be prospectively reduced dollar for dollar by that additional 7
amount. If federal funding is lower than anticipated, the CHCF-A 8
will be prospectively increased by that amount. Third, if a 9
company does not file a rate case within prescribed timeframes 10
under the CHCF-A rules, CHCF-A funding is to be reduced to zero 11
over a three-year period, starting with a 20% funding reduction in 12
the first year of reduction, followed by a contraction to 50% 13
funding in the second, and concluding with no funding in the third 14
year. The mechanism is known as the CHCF-A “waterfall.” 15
Finally, CHCF-A funding can be adjusted annually for the revenue 16
effects of “regulatory changes of industry-wide effect” that alter 17
the assumptions upon which the CPUC set a company’s rate 18
structure in a rate case. This adjustment for “regulatory changes of 19
industry-wide effect” is the one limited and narrow exception 20
whereby CHCF-A funding can compensate for a limited subset of 21
revenue shortfalls. As reflected in the Commission’s most recent 22
Resolution establishing funding amounts for the CHCF-A for 23
Attachment No. 2 IURC Cause No. 45064
Indiana Exchange Carrier Association, Inc. Page 128 of 173
Attachment B

2016, the only “regulatory changes of industry-wide effect” that 1
generated annual adjustments were changes to the California 2
LifeLine program that shifted LifeLine-related administrative 3
expenses to the CHCF-A program, and changes related to the 4
FCC’s intercarrier compensation reforms.52 5
Q32. Does this fourth mechanism, accounting for the revenue effects 6
of regulatory changes, “shield” the companies from 7
“fluctuations in revenue”? 8
A. No. In fact, the effects of regulatory changes are generally small 9
relative to the universe of factors that could influence a company’s 10
cost structure and realized revenue. The limited annual 11
adjustments for fundamental regulatory changes do not provide a 12
sufficient mechanism for increased funding in response to changes 13
in a company’s income statement. If, for example, a company 14
must spend significantly more than anticipated to provide its 15
employees with health benefits, the CHCF-A provides no 16
additional funding. If more customers than expected drop their 17
landlines to rely on wireless services, the CHCF-A provides no 18
additional funding. If a catastrophic event occurs, which requires 19
significant additional costs to be incurred, the CHCF-A provides 20
no additional funding. ORA is not correct that the CHCF-A 21
“shields” from fluctuations in revenues and therefore eliminates 22
52 See Res. T-17505.
Attachment No. 2 IURC Cause No. 45064
Indiana Exchange Carrier Association, Inc. Page 129 of 173
Attachment B
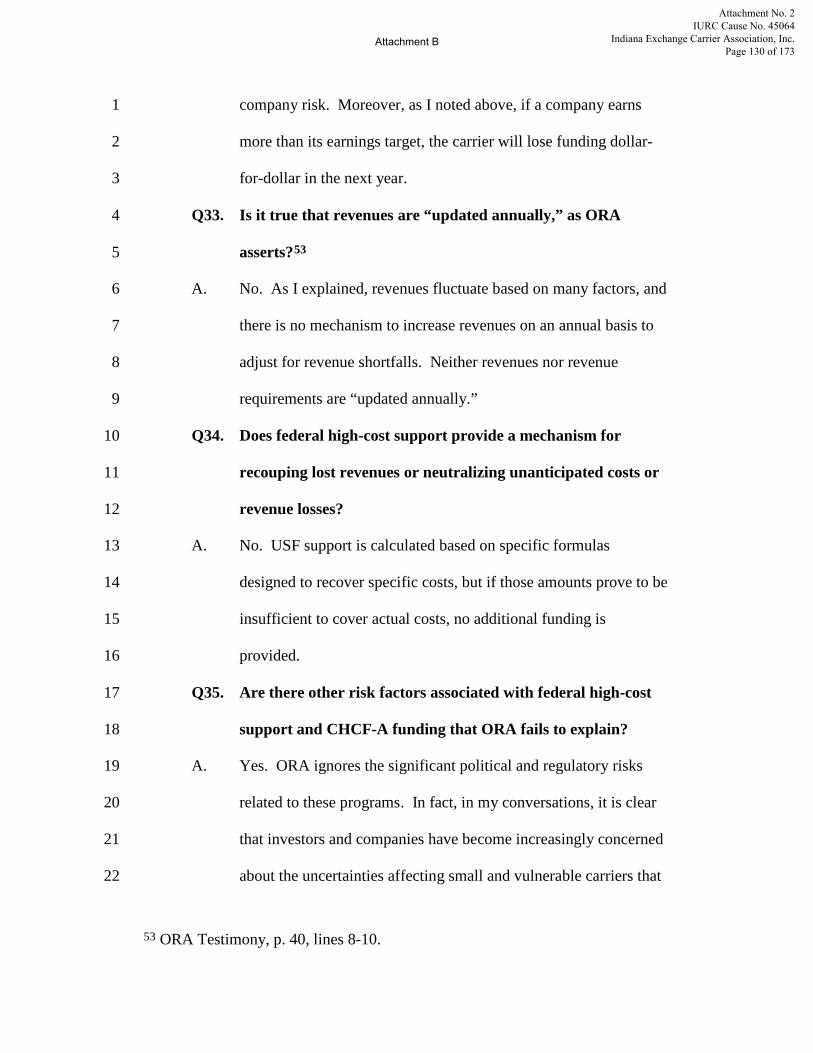
company risk. Moreover, as I noted above, if a company earns 1
more than its earnings target, the carrier will lose funding dollar-2
for-dollar in the next year. 3
Q33. Is it true that revenues are “updated annually,” as ORA 4
asserts?53 5
A. No. As I explained, revenues fluctuate based on many factors, and 6
there is no mechanism to increase revenues on an annual basis to 7
adjust for revenue shortfalls. Neither revenues nor revenue 8
requirements are “updated annually.” 9
Q34. Does federal high-cost support provide a mechanism for 10
recouping lost revenues or neutralizing unanticipated costs or 11
revenue losses? 12
A. No. USF support is calculated based on specific formulas 13
designed to recover specific costs, but if those amounts prove to be 14
insufficient to cover actual costs, no additional funding is 15
provided. 16
Q35. Are there other risk factors associated with federal high-cost 17
support and CHCF-A funding that ORA fails to explain? 18
A. Yes. ORA ignores the significant political and regulatory risks 19
related to these programs. In fact, in my conversations, it is clear 20
that investors and companies have become increasingly concerned 21
about the uncertainties affecting small and vulnerable carriers that 22
53 ORA Testimony, p. 40, lines 8-10.
Attachment No. 2 IURC Cause No. 45064
Indiana Exchange Carrier Association, Inc. Page 130 of 173
Attachment B

are clearly dependent on support mechanisms. More specifically, 1
the USF/ICC Transformation Order (FCC 11-161) and the various 2
subsequent FCC orders have put in motion dramatically more 3
unpredictable support mechanisms. Those federal reforms are 4
ongoing, creating significant uncertainties and risks. Similarly, the 5
CPUC has adopted changes to the CHCF-A program, and it is 6
considering additional changes.54 In D. 14-12-084, the CPUC 7
adopted a rebuttable presumption that Independent Small LECs’ 8
revenue requirements could not include corporate expenses beyond 9
the levels applicable to federal support mechanisms, thereby 10
placing a significant limitation on the use of CHCF-A funding. 11
Phase II of the CHCF-A rulemaking includes even more sweeping 12
proposals for change, including the potential for imputation of 13
unregulated broadband revenues into intrastate ratemaking and 14
considerations of “alternative forms of regulation.”55 The breadth 15
of Phase II of the rulemaking contradicts ORA’s claim that the 16
CHCF-A “shields” the companies from risk. This regulatory risk 17
is further compounded by the political reality that the CHCF-A is 18
subject to a “sunset” provision, such that the program will 19
terminate at the end of 2018 if it is not legislatively renewed.56 20
54 See R.11-11-007 (CHCF-A rulemaking). 55 D.14-12-084, at p. 12. 56 See Pub. Util. Code § 275.6(g).
Attachment No. 2 IURC Cause No. 45064
Indiana Exchange Carrier Association, Inc. Page 131 of 173
Attachment B
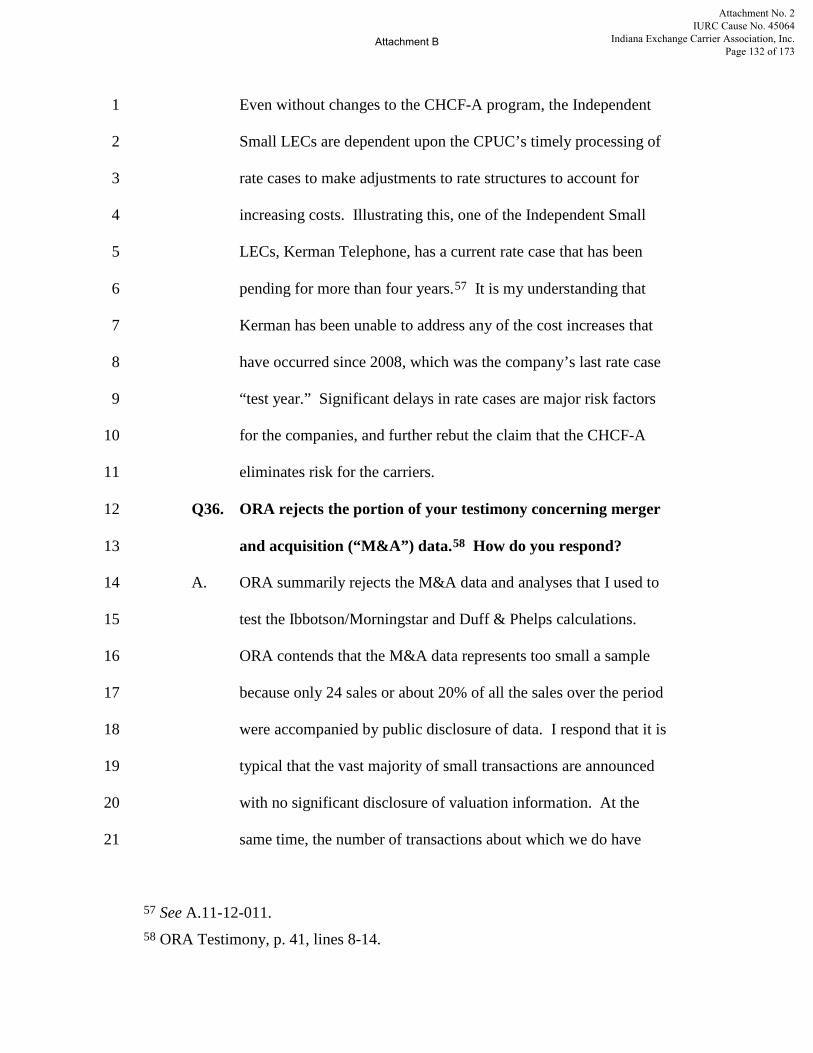
Even without changes to the CHCF-A program, the Independent 1
Small LECs are dependent upon the CPUC’s timely processing of 2
rate cases to make adjustments to rate structures to account for 3
increasing costs. Illustrating this, one of the Independent Small 4
LECs, Kerman Telephone, has a current rate case that has been 5
pending for more than four years.57 It is my understanding that 6
Kerman has been unable to address any of the cost increases that 7
have occurred since 2008, which was the company’s last rate case 8
“test year.” Significant delays in rate cases are major risk factors 9
for the companies, and further rebut the claim that the CHCF-A 10
eliminates risk for the carriers. 11
Q36. ORA rejects the portion of your testimony concerning merger 12
and acquisition (“M&A”) data.58 How do you respond? 13
A. ORA summarily rejects the M&A data and analyses that I used to 14
test the Ibbotson/Morningstar and Duff & Phelps calculations. 15
ORA contends that the M&A data represents too small a sample 16
because only 24 sales or about 20% of all the sales over the period 17
were accompanied by public disclosure of data. I respond that it is 18
typical that the vast majority of small transactions are announced 19
with no significant disclosure of valuation information. At the 20
same time, the number of transactions about which we do have 21
57 See A.11-12-011. 58 ORA Testimony, p. 41, lines 8-14.
Attachment No. 2 IURC Cause No. 45064
Indiana Exchange Carrier Association, Inc. Page 132 of 173
Attachment B

data is large and consistent, revealing the collapse in valuation 1
over the period. Moreover, the transactions include sales and 2
purchases of properties by sophisticated sellers and buyers, so 3
those publicly-disclosed purchase prices provide compelling 4
evidence about the sharply-lower valuations. If, for example, 5
Verizon were to sell its California assets to Frontier at values 6
meaningfully below market value, Verizon would be legally liable 7
to its shareholders, some of whom would certainly file lawsuits.59 8
If Qwest were to sell to CenturyLink at valuations below fair 9
value, it too would be at risk for shareholder actions.60 The data 10
reveal a clear and convincing downward value trend that is in 11
sharp contrast to valuations ten years ago. The factual trend cannot 12
be dismissed, and it provides important corroborative evidence 13
about the increasing cost of equity reflected in the CAPM 14
valuation methodology. 15
59 Frontier reported on February 5, 2015, when the company announced the transaction to purchase Verizon’s California, Texas and Florida wireline operations that it was paying 3.7x 2014 estimate pro forma EBITDA, a figure below the 4.5x to 5.5x EBITDA that I used as a typical value in my Opening Testimony. See Frontier Investor Presentation, Frontier Communications to Acquire Verizon Wireline Operations in California, Florida and Texas (Feb. 5, 2015), available at http://investor.frontier.com/common/download/download.cfm?companyid=AMDA-OJWDG&fileid=807528&filekey=D05E3F23-F896-4B56-AB6C-3D69DB74DBFB&filename=Frontier_Communications_to_Acquire_Verizon_Wireline_Operations_in_California_Florida_and_Texas.pdf, slide 6. 60 See Balhoff Opening Testimony, p. 47, Figure 4; Qwest sold for 5.1x EBITDA, which is well below the prices that averaged 8.0x EBITDA from 2001 to 2007; see Balhoff Opening Testimony, p. 46.
Attachment No. 2 IURC Cause No. 45064
Indiana Exchange Carrier Association, Inc. Page 133 of 173
Attachment B
Q37. What about ORA’s argument that regulators rely on book 1
value and not market value?61 2
A. I make the point clearly in the Opening Testimony: 3
I emphasize that the following assessment is a 4 corroboration of the analyses above, not the central 5 presentation in this testimony. A critic might argue that 6 there is a mixing together of book value and market value. 7 Such an argument misses the larger point, which is that the 8 size of the relative contraction in value in the marketplace 9 is a clear indication of the startlingly increased risks in the 10 industry, which is the basis for contending that a higher 11 return on equity is appropriate.62 (Emphasis in original.) 12
13
The M&A testimony was not proposed as the foundation for 14
setting a rate of return, but as confirmation of the reasonableness of 15
the increase in equity costs and the relative size of the change. 16
ORA does not respond to these data from the real world which, in 17
my view, provide convincing evidence that equity costs have risen 18
steeply. These data offer the CPUC an ultimate test about whether 19
the rising cost of equity and falling equity values are reasonable. 20
IV. RESPONSE TO ORA TESTIMONY ABOUT COST OF DEBT 21
Q38. Does ORA accurately state that “the applicants request the 22
Commission to use a forward looking debt rate of 5.5%,” 23
61 ORA Testimony, p. 41, lines 14-19. 62 Balhoff Opening Testimony, p. 64, lines 14-18.
Attachment No. 2 IURC Cause No. 45064
Indiana Exchange Carrier Association, Inc. Page 134 of 173
Attachment B
including for the three Independent Small LECs which do not 1
have any debt on their balance sheets?63 2
A. No. I was far more precise than ORA suggests, and it was not my 3
testimony that a 5.5% cost of debt is more appropriate than actual 4
debt costs for carriers that have debt. I stated from the outset that 5
“it is more typical to use embedded [debt] costs which are the 6
‘actual interest obligations, including amortization of discount 7
premium, and expense of the utility’s embedded debt 8
outstanding.’”64 Second, I recommended using 5.5% for the 9
carriers that had no debt . . . if the Commission wishes to use a 10
hypothetical capital structure.65 I offered my professional opinion 11
and recommendation that such a rate was reasonable because it 12
was below the AAA rate and was slightly lower than the rate 13
actually being paid by Sierra Telephone.66 And my testimony was 14
careful in stating that the rate might be reasonable if the CPUC 15
were to determine that a hypothetical capital structure were 16
appropriate.67 Finally, I explained that the current Treasury rates 17
63 ORA Testimony, p. 10, lines 9-13; see also p. 10, line 14. 64 Balhoff Opening Testimony, p. 15, lines 12-14. 65 Balhoff Opening Testimony, p. 10, lines 13-16; p. 76, lines 1-17. 66 Balhoff Opening Testimony, p. 10, lines 5-9; see also, Exhibit MJB-14. 67 Balhoff Opening Testimony, p. 76, lines 11-17.
Attachment No. 2 IURC Cause No. 45064
Indiana Exchange Carrier Association, Inc. Page 135 of 173
Attachment B

are at levels that are unsustainable, a proposition that ORA fails to 1
address.68 2
Q39. Do you agree with ORA that actual debt costs should be used 3
for the LECs with debt on their balance sheets?69 4
A. Yes, I agree that it is most appropriate to use embedded debt costs 5
for the carriers that have actual debt. 6
Q40. ORA cites the current Treasury and Federal Financing Bank 7
(“FFB”) rates, which are 2.82% and 2.47%, respectively.70 8
Are these legitimate rates to use in calculating the cost of debt? 9
A. No. As I explained above and in my Opening Testimony, the low 10
Treasury-based rates noted by ORA are artificially depressed. 11
ORA’s use of those rates to demonstrate the conservatism of its 12
proposal is not convincing, as those rates are historically low, due 13
to the temporary intervention of the Federal Reserve, and will 14
almost certainly increase and return to more normalized levels. 15
68 Balhoff Opening Testimony, p. 19, lines 2-10; Duff & Phelps 2015 Cost of Capital, p. 3-3 “The yields of U.S. government bonds in certain periods during and after the [financial crisis of 2008] may have been artificially repressed, and therefore [are] likely unsustainable. Many market participants will agree that nominal U.S. government bond yields in recent periods have been artificially low. Even members of the Federal Open Market Committee (FOMC) have recently discussed the need to ‘normalize’ interest rates.” (Emphasis in original.) 69 ORA Testimony, p. 21, lines 12-14. 70 ORA Testimony, p. 23, lines 1-9.
Attachment No. 2 IURC Cause No. 45064
Indiana Exchange Carrier Association, Inc. Page 136 of 173
Attachment B
Q41. How does ORA determine that an imputed cost for debt for the 1
Independent Small LECs should be 4.53%? 2
A. ORA averages the debt costs for the seven Independent Small 3
LECs that have debt on their balance sheet to arrive at 4.53%.71 4
ORA attempts to support its proposal as purportedly conservative 5
based on its belief that the carriers could access far less expensive 6
FFB (2.47%-2.82%) or Rural Utilities Service (“RUS”) funding. 7
In fact, three of the seven Independent Small LECs have 2014 debt 8
costs above 5.0% and two carriers have debt costs in the 4.5% to 9
4.8% range, and the remaining two have 2014 debt costs of 2.9% 10
and 3.7%. However, all the California carriers have rates above 11
those cited by ORA, including five of the seven with rates well 12
higher than the government subsidized rates, so ORA's claims 13
about the availability of lower debt are not reflected in carriers' 14
actual experiences.72 It is my understanding that carriers find 15
certain conditions in the application process and in the covenants 16
imposed by the government to be unfavorable, and the effect is that 17
the government-subsidized loans are not as readily available as 18
ORA implies. 19
71 ORA Testimony, p. 23, lines 1-2. 72 Id.; Calaveras reports debt costs of 4.5%; Ducor reports 5.1%; Foresthill reports 4.77%; Sierra reports 5.53%; and Volcano reports 5.2%. Balhoff Opening Testimony, p. 72, Table 8.
Attachment No. 2 IURC Cause No. 45064
Indiana Exchange Carrier Association, Inc. Page 137 of 173
Attachment B

Q42. Is ORA correct in stating that your testimony is incorrect or 1
unsubstantiated about the current lending environment, 2
including RUS loans?73 3
A. No. The RUS reports that FFB funding has contracted sharply, as I 4
reported in my Opening Testimony. Less than one-third of the 5
available funds have been placed each year since the federal 6
telecommunications reforms at the end of 2011.74 My 7
conversations with the RUS have confirmed that the recent federal 8
reforms have precipitated changes at the RUS. The federal 9
regulatory reforms have prompted the RUS to be more 10
conservative, requiring more detailed five-year forecasts and 11
extending the approval process from a previous approval period of 12
6-12 months to today’s 12-18 months. I am aware of the RUS 13
concerns because I was requested to brief the entire senior 14
leadership at the RUS on several occasions regarding the 2011 15
reforms. The senior RUS personnel were candid in reporting 16
concerns about deteriorating operating and financial performance 17
of the carriers to which they were lending. Because of the 18
concerns, I was also requested to brief the Under Secretary of the 19
Department of Agriculture. Subsequently I was invited to discuss 20
the challenging environment in two briefings, one with the White 21
73 ORA Testimony, p. 25, lines 14-17. 74 Balhoff Opening Testimony, p. 49, Table 2.
Attachment No. 2 IURC Cause No. 45064
Indiana Exchange Carrier Association, Inc. Page 138 of 173
Attachment B
House and the second with the Secretary of Agriculture, in part 1
because of their concern that certain carriers might fail. Based on 2
my professional experience and conversations, I am confident that 3
the funding environment has become significantly more difficult 4
for lenders and for smaller LECs, as evidenced by the sharp 5
contraction in actual lending. 6
Q43. Did the FCC Staff Report, to which ORA cites, state that the 7
small carriers have access to less expensive debt through 8
subsidies, and, hence, lower-than-market cost, for loans 9
provided by CoBank?75 10
A. Yes, but CoBank, which is part of the Farm Credit System and is 11
the largest private lender to small LECs, corrected the FCC Staff 12
Report within weeks of the release of the study, clarifying that: 13
We ask that the Staff Report be corrected to reflect 14 accurately CoBank’s requirement to charge a market 15 interest rate to all telecommunications company 16 borrowers and to remove any comments that suggest in 17 any way that CoBank provides subsidized interest rate 18 loans to telecommunications companies. We further 19 ask that the paragraph 49 of the Staff Report be 20 removed in its entirety given it is misleading with 21 respect to the availability of funding to RLECs [rural 22 local exchange carriers].76 23
24
75 FCC Staff Report, para. 49. 76 Comments of CoBank, ACB, In the Matter of Rate Represcription Staff Report, Connect America Fund, WC Docket No. 10-90, July 25, 2013 (“CoBank”), June 21, 2013, available at https://prodnet.www.neca.org/publicationsdocs/wwpdf/62113cobank.pdf, p. 5.
Attachment No. 2 IURC Cause No. 45064
Indiana Exchange Carrier Association, Inc. Page 139 of 173
Attachment B
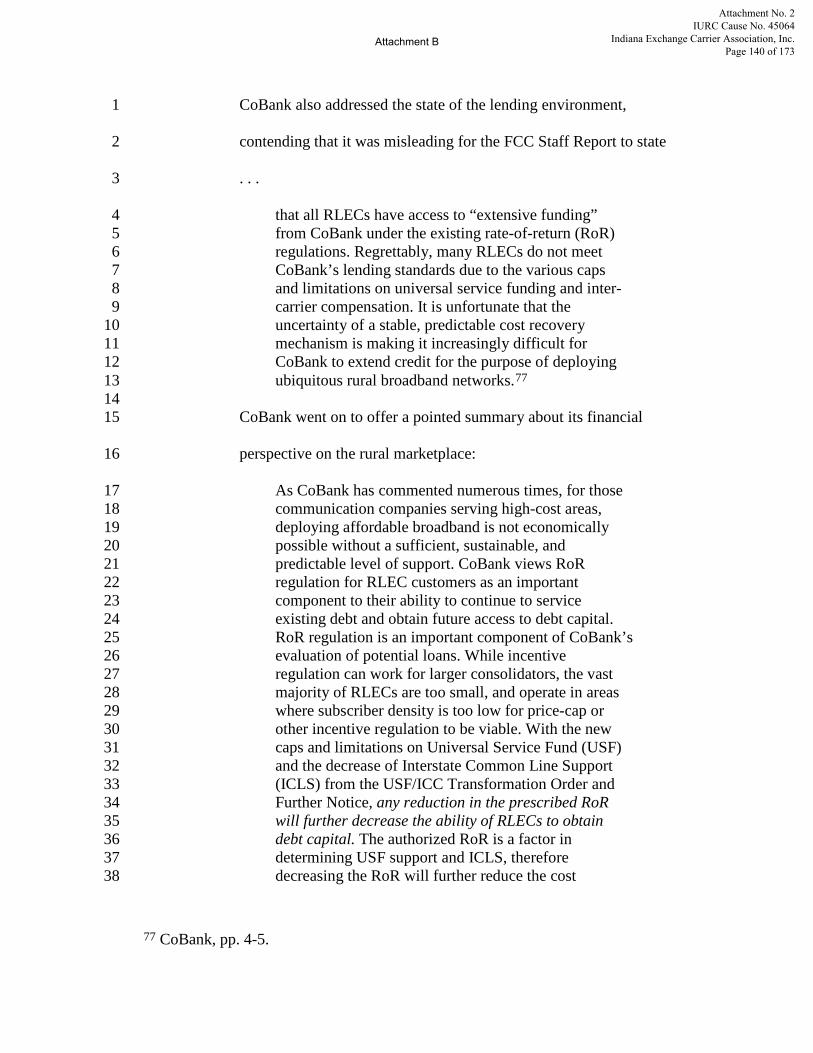
CoBank also addressed the state of the lending environment, 1
contending that it was misleading for the FCC Staff Report to state 2
. . . 3
that all RLECs have access to “extensive funding” 4 from CoBank under the existing rate-of-return (RoR) 5 regulations. Regrettably, many RLECs do not meet 6 CoBank’s lending standards due to the various caps 7 and limitations on universal service funding and inter-8 carrier compensation. It is unfortunate that the 9 uncertainty of a stable, predictable cost recovery 10 mechanism is making it increasingly difficult for 11 CoBank to extend credit for the purpose of deploying 12 ubiquitous rural broadband networks.77 13 14
CoBank went on to offer a pointed summary about its financial 15
perspective on the rural marketplace: 16
As CoBank has commented numerous times, for those 17 communication companies serving high-cost areas, 18 deploying affordable broadband is not economically 19 possible without a sufficient, sustainable, and 20 predictable level of support. CoBank views RoR 21 regulation for RLEC customers as an important 22 component to their ability to continue to service 23 existing debt and obtain future access to debt capital. 24 RoR regulation is an important component of CoBank’s 25 evaluation of potential loans. While incentive 26 regulation can work for larger consolidators, the vast 27 majority of RLECs are too small, and operate in areas 28 where subscriber density is too low for price-cap or 29 other incentive regulation to be viable. With the new 30 caps and limitations on Universal Service Fund (USF) 31 and the decrease of Interstate Common Line Support 32 (ICLS) from the USF/ICC Transformation Order and 33 Further Notice, any reduction in the prescribed RoR 34 will further decrease the ability of RLECs to obtain 35 debt capital. The authorized RoR is a factor in 36 determining USF support and ICLS, therefore 37 decreasing the RoR will further reduce the cost 38
77 CoBank, pp. 4-5.
Attachment No. 2 IURC Cause No. 45064
Indiana Exchange Carrier Association, Inc. Page 140 of 173
Attachment B
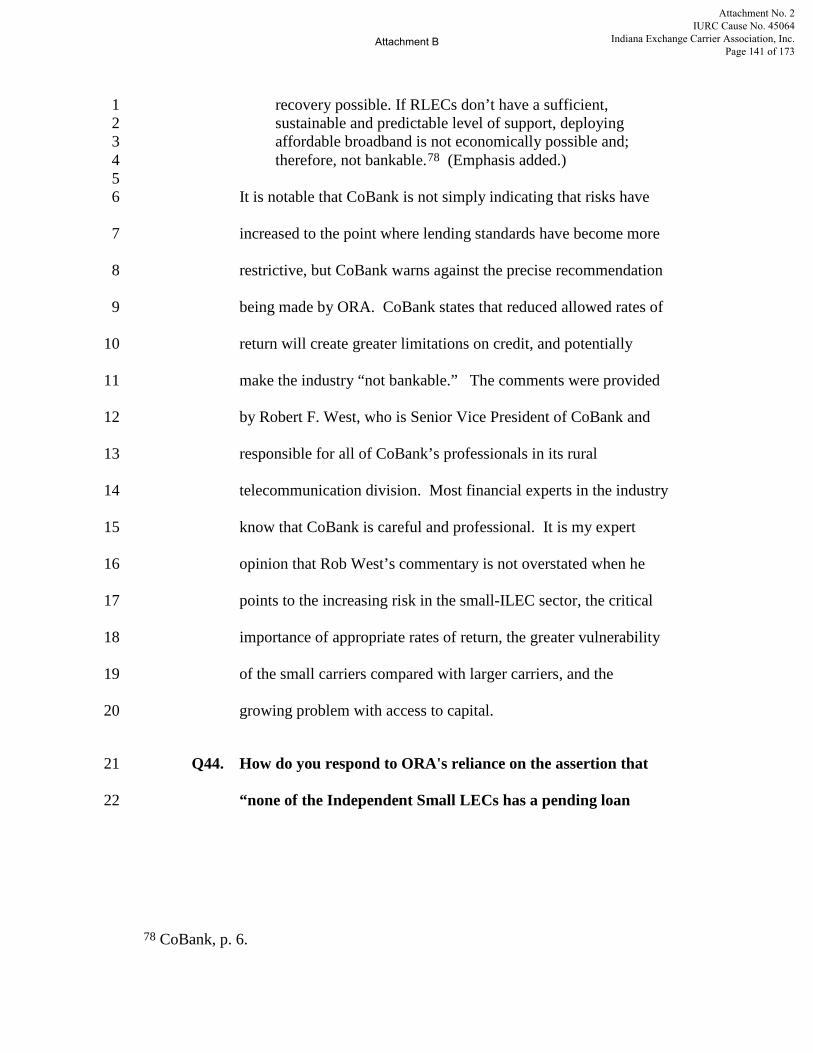
recovery possible. If RLECs don’t have a sufficient, 1 sustainable and predictable level of support, deploying 2 affordable broadband is not economically possible and; 3 therefore, not bankable.78 (Emphasis added.) 4
5 It is notable that CoBank is not simply indicating that risks have 6
increased to the point where lending standards have become more 7
restrictive, but CoBank warns against the precise recommendation 8
being made by ORA. CoBank states that reduced allowed rates of 9
return will create greater limitations on credit, and potentially 10
make the industry “not bankable.” The comments were provided 11
by Robert F. West, who is Senior Vice President of CoBank and 12
responsible for all of CoBank’s professionals in its rural 13
telecommunication division. Most financial experts in the industry 14
know that CoBank is careful and professional. It is my expert 15
opinion that Rob West’s commentary is not overstated when he 16
points to the increasing risk in the small-ILEC sector, the critical 17
importance of appropriate rates of return, the greater vulnerability 18
of the small carriers compared with larger carriers, and the 19
growing problem with access to capital. 20
Q44. How do you respond to ORA's reliance on the assertion that 21
“none of the Independent Small LECs has a pending loan 22
78 CoBank, p. 6.
Attachment No. 2 IURC Cause No. 45064
Indiana Exchange Carrier Association, Inc. Page 141 of 173
Attachment B

application with RUS” and none “has had a loan request 1
denied from January 1, 2010 to the present”?79 2
A. The fact that none of the Independent Small ILECs has sought a 3
new loan is indicative of the regulatory challenges about which 4
Mr. West was writing and the growing concern in the industry 5
about the risk of holding debt in a more uncertain regulatory and 6
capital environment. The lack of pending applications is also 7
another data point supporting the sharply-reduced loan totals and 8
the increasingly careful review of pending loans at RUS. ORA 9
posits that the Independent Small LECs were, at a time in the past, 10
able to obtain loans from RUS and that no loans have recently been 11
denied (a tautology because the Independent Small LECs did not 12
apply for loans). The logic is difficult to follow when ORA 13
concludes that RUS’ current lower cost of debt provides an 14
important marker for the carriers.80 In response, I have cited the 15
clear language of CoBank’s senior officer, Rob West, who states 16
unequivocally to the contrary in his communications with the FCC. 17
Additionally, while the RUS is not making public pronouncements, 18
this government agency is in fact reporting that loan totals have 19
fallen by more than 70% annually, on average, from 2012 to the 20
present. Something more ominous is occurring here and ORA 21
79 ORA Testimony, p. 24, lines 19-22. 80 ORA Testimony, p. 23, lines 5-9; p. 24, lines 1-22.
Attachment No. 2 IURC Cause No. 45064
Indiana Exchange Carrier Association, Inc. Page 142 of 173
Attachment B

chooses to dismiss it with the claim that “no actual evidence” 1
exists in support of my testimony that the debt markets are today 2
not what they were previously. As I have summarized, my views 3
are amply supported by the statements and actions of actual 4
lenders, as well as the debt-related behavior of the carriers. 5
Q45. ORA states that your testimony includes an implied 6
assumption that a “sudden and significant increase in 7
Treasury rates is imminent.”81 Is that a correct representation 8
of your testimony or your opinion? 9
A. Absolutely not. My testimony is that interest rates are artificially 10
and historically low due to extraordinary monetary policies. I do 11
not expect a sudden and significant increase, but I do expect the 12
easing of monetary controls, which will allow rates to rise to more 13
normalized levels. In fact, ORA’s testimony points to the same 14
insight, as ORA cites a statement from the Chairwoman of the 15
Federal Reserve to the effect that rates will rise in a “prudent and 16
gradual manner.”82 Naturally, this means that rates will rise, as the 17
Federal Reserve eases the repressive controls that have reduced 18
those rates. It is my professional view and it is the view of the 19
experts to which I pointed in my Opening Testimony that Treasury 20
81 ORA Testimony, p. 27, lines 5-8. 82 Id.
Attachment No. 2 IURC Cause No. 45064
Indiana Exchange Carrier Association, Inc. Page 143 of 173
Attachment B
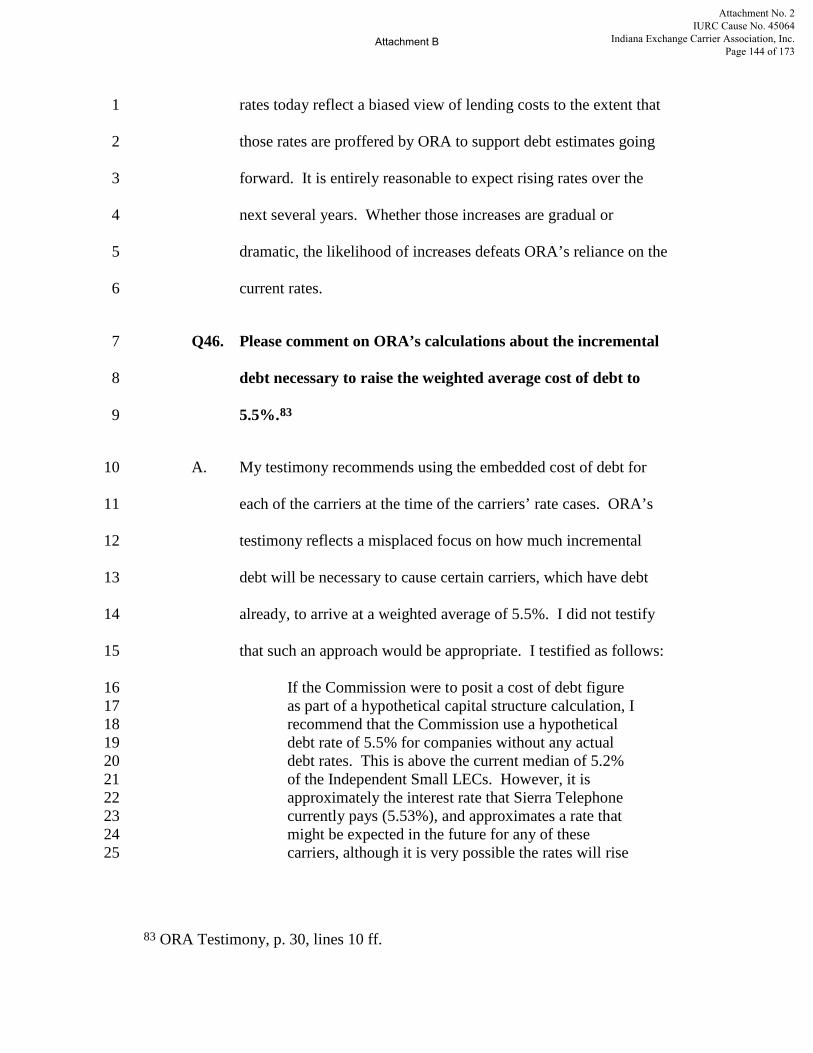
rates today reflect a biased view of lending costs to the extent that 1
those rates are proffered by ORA to support debt estimates going 2
forward. It is entirely reasonable to expect rising rates over the 3
next several years. Whether those increases are gradual or 4
dramatic, the likelihood of increases defeats ORA’s reliance on the 5
current rates. 6
Q46. Please comment on ORA’s calculations about the incremental 7
debt necessary to raise the weighted average cost of debt to 8
5.5%.83 9
A. My testimony recommends using the embedded cost of debt for 10
each of the carriers at the time of the carriers’ rate cases. ORA’s 11
testimony reflects a misplaced focus on how much incremental 12
debt will be necessary to cause certain carriers, which have debt 13
already, to arrive at a weighted average of 5.5%. I did not testify 14
that such an approach would be appropriate. I testified as follows: 15
If the Commission were to posit a cost of debt figure 16 as part of a hypothetical capital structure calculation, I 17 recommend that the Commission use a hypothetical 18 debt rate of 5.5% for companies without any actual 19 debt rates. This is above the current median of 5.2% 20 of the Independent Small LECs. However, it is 21 approximately the interest rate that Sierra Telephone 22 currently pays (5.53%), and approximates a rate that 23 might be expected in the future for any of these 24 carriers, although it is very possible the rates will rise 25
83 ORA Testimony, p. 30, lines 10 ff.
Attachment No. 2 IURC Cause No. 45064
Indiana Exchange Carrier Association, Inc. Page 144 of 173
Attachment B
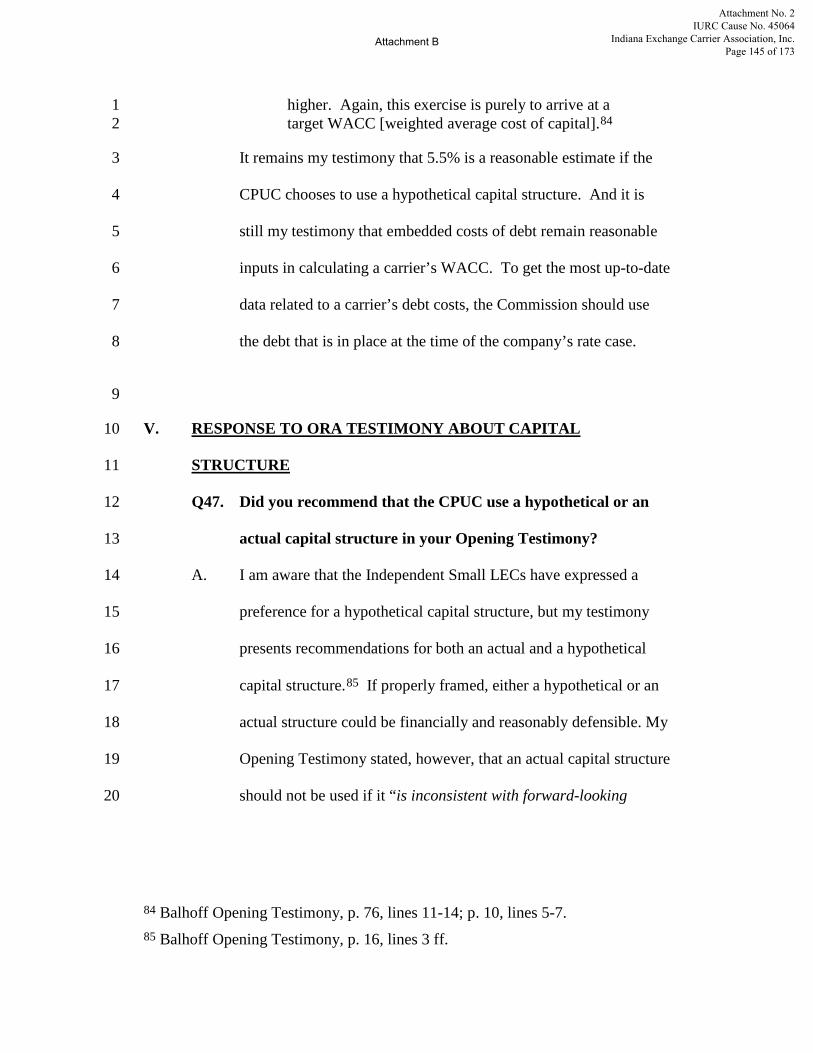
higher. Again, this exercise is purely to arrive at a 1 target WACC [weighted average cost of capital].84 2
It remains my testimony that 5.5% is a reasonable estimate if the 3
CPUC chooses to use a hypothetical capital structure. And it is 4
still my testimony that embedded costs of debt remain reasonable 5
inputs in calculating a carrier’s WACC. To get the most up-to-date 6
data related to a carrier’s debt costs, the Commission should use 7
the debt that is in place at the time of the company’s rate case. 8
9
V. RESPONSE TO ORA TESTIMONY ABOUT CAPITAL 10
STRUCTURE 11
Q47. Did you recommend that the CPUC use a hypothetical or an 12
actual capital structure in your Opening Testimony? 13
A. I am aware that the Independent Small LECs have expressed a 14
preference for a hypothetical capital structure, but my testimony 15
presents recommendations for both an actual and a hypothetical 16
capital structure.85 If properly framed, either a hypothetical or an 17
actual structure could be financially and reasonably defensible. My 18
Opening Testimony stated, however, that an actual capital structure 19
should not be used if it “is inconsistent with forward-looking 20
84 Balhoff Opening Testimony, p. 76, lines 11-14; p. 10, lines 5-7. 85 Balhoff Opening Testimony, p. 16, lines 3 ff.
Attachment No. 2 IURC Cause No. 45064
Indiana Exchange Carrier Association, Inc. Page 145 of 173
Attachment B
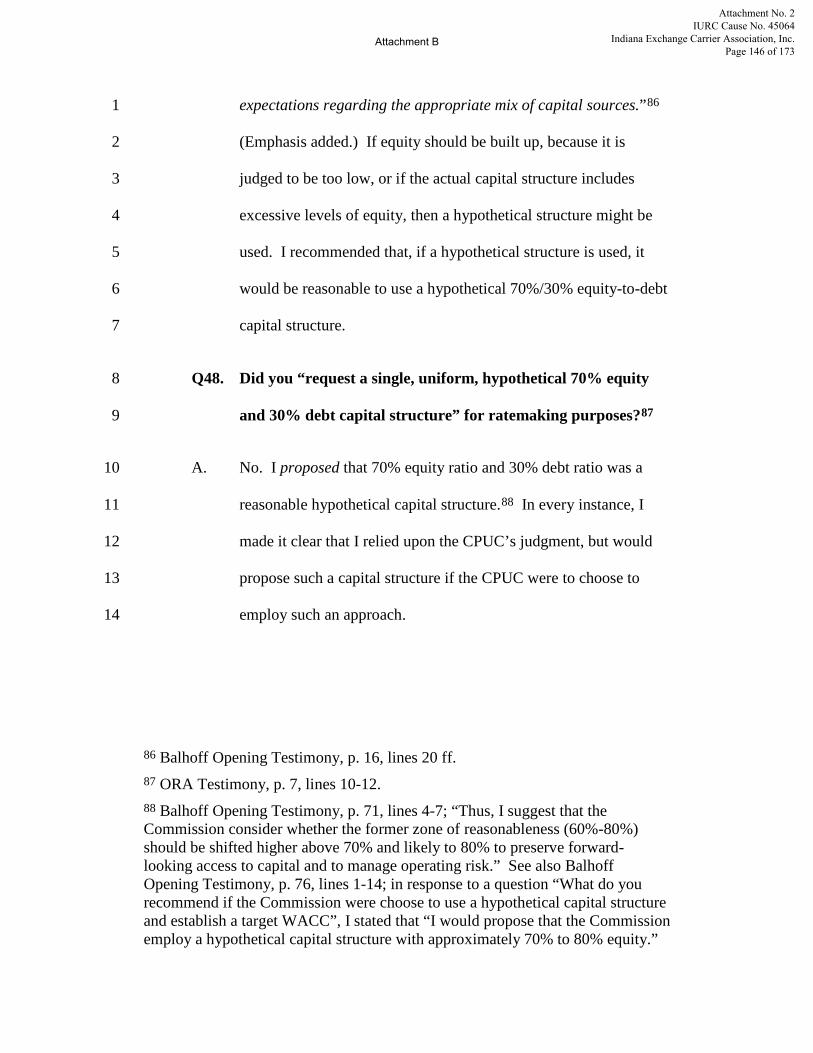
expectations regarding the appropriate mix of capital sources.”86 1
(Emphasis added.) If equity should be built up, because it is 2
judged to be too low, or if the actual capital structure includes 3
excessive levels of equity, then a hypothetical structure might be 4
used. I recommended that, if a hypothetical structure is used, it 5
would be reasonable to use a hypothetical 70%/30% equity-to-debt 6
capital structure. 7
Q48. Did you “request a single, uniform, hypothetical 70% equity 8
and 30% debt capital structure” for ratemaking purposes?87 9
A. No. I proposed that 70% equity ratio and 30% debt ratio was a 10
reasonable hypothetical capital structure.88 In every instance, I 11
made it clear that I relied upon the CPUC’s judgment, but would 12
propose such a capital structure if the CPUC were to choose to 13
employ such an approach. 14
86 Balhoff Opening Testimony, p. 16, lines 20 ff. 87 ORA Testimony, p. 7, lines 10-12. 88 Balhoff Opening Testimony, p. 71, lines 4-7; “Thus, I suggest that the Commission consider whether the former zone of reasonableness (60%-80%) should be shifted higher above 70% and likely to 80% to preserve forward-looking access to capital and to manage operating risk.” See also Balhoff Opening Testimony, p. 76, lines 1-14; in response to a question “What do you recommend if the Commission were choose to use a hypothetical capital structure and establish a target WACC”, I stated that “I would propose that the Commission employ a hypothetical capital structure with approximately 70% to 80% equity.”
Attachment No. 2 IURC Cause No. 45064
Indiana Exchange Carrier Association, Inc. Page 146 of 173
Attachment B

Q49. Did you request that no specific capital structure should be 1
mandated for anything more than ratemaking purposes, as 2
ORA has claimed?89 3
A. Such a question was not posed to me in my Opening Testimony 4
and I offered no such opinion. I believe, however, that, whether a 5
hypothetical or actual structure is used, a reasonable function of 6
that structure is to calculate a resulting cost of capital for 7
application in the ongoing round of rate cases. 8
Q50. ORA recommends the use of a capital structure that reflects 9
the five-year average of the Independent Small LECs’ capital 10
structure.90 Is this reasonable? 11
A. The Commission’s analysis of capital structure should employ an 12
appropriate forward-looking view of capital structure.91 The risk 13
in relying primarily on the historic five-year average, which is 14
ORA’s recommendation, is that the historical data do not properly 15
capture higher or lower risk in an industry that is undergoing rapid 16
89 ORA Testimony, p. 7, lines 12-13. 90 ORA Testimony, p. 8, lines 11-13. 91 Balhoff Opening Testimony, p. 16, lines 16 ff.; “It is my understanding that the Commission has attempted in the past to arrive at a more generic cost of capital that is forward-looking, and therefore the WACC may not be based strictly on any single company’s actual capital structure. I support this goal of determining a cost of capital that is forward-looking, and I believe that it would be unreasonable to use a company’s actual structure if such a structure is inconsistent with forward-looking expectations regarding the appropriate mix of capital sources.”
Attachment No. 2 IURC Cause No. 45064
Indiana Exchange Carrier Association, Inc. Page 147 of 173
Attachment B
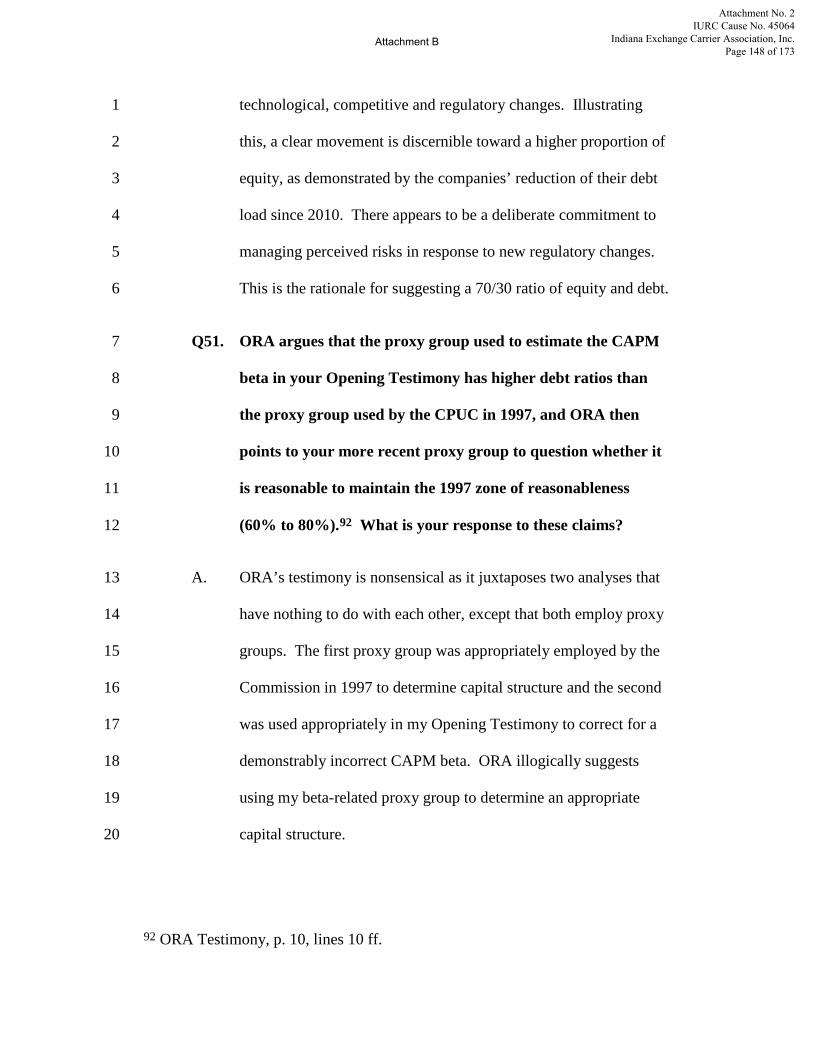
technological, competitive and regulatory changes. Illustrating 1
this, a clear movement is discernible toward a higher proportion of 2
equity, as demonstrated by the companies’ reduction of their debt 3
load since 2010. There appears to be a deliberate commitment to 4
managing perceived risks in response to new regulatory changes. 5
This is the rationale for suggesting a 70/30 ratio of equity and debt. 6
Q51. ORA argues that the proxy group used to estimate the CAPM 7
beta in your Opening Testimony has higher debt ratios than 8
the proxy group used by the CPUC in 1997, and ORA then 9
points to your more recent proxy group to question whether it 10
is reasonable to maintain the 1997 zone of reasonableness 11
(60% to 80%).92 What is your response to these claims? 12
A. ORA’s testimony is nonsensical as it juxtaposes two analyses that 13
have nothing to do with each other, except that both employ proxy 14
groups. The first proxy group was appropriately employed by the 15
Commission in 1997 to determine capital structure and the second 16
was used appropriately in my Opening Testimony to correct for a 17
demonstrably incorrect CAPM beta. ORA illogically suggests 18
using my beta-related proxy group to determine an appropriate 19
capital structure. 20
92 ORA Testimony, p. 10, lines 10 ff.
Attachment No. 2 IURC Cause No. 45064
Indiana Exchange Carrier Association, Inc. Page 148 of 173
Attachment B
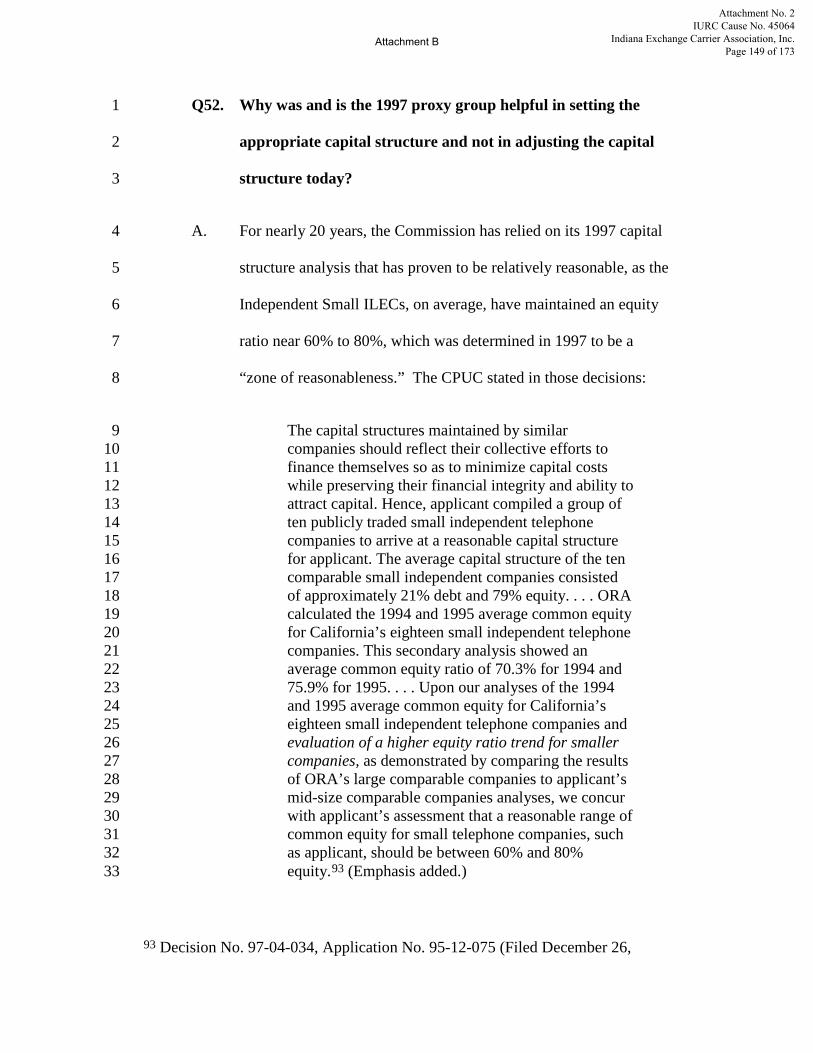
Q52. Why was and is the 1997 proxy group helpful in setting the 1
appropriate capital structure and not in adjusting the capital 2
structure today? 3
A. For nearly 20 years, the Commission has relied on its 1997 capital 4
structure analysis that has proven to be relatively reasonable, as the 5
Independent Small ILECs, on average, have maintained an equity 6
ratio near 60% to 80%, which was determined in 1997 to be a 7
“zone of reasonableness.” The CPUC stated in those decisions: 8
The capital structures maintained by similar 9 companies should reflect their collective efforts to 10 finance themselves so as to minimize capital costs 11 while preserving their financial integrity and ability to 12 attract capital. Hence, applicant compiled a group of 13 ten publicly traded small independent telephone 14 companies to arrive at a reasonable capital structure 15 for applicant. The average capital structure of the ten 16 comparable small independent companies consisted 17 of approximately 21% debt and 79% equity. . . . ORA 18 calculated the 1994 and 1995 average common equity 19 for California’s eighteen small independent telephone 20 companies. This secondary analysis showed an 21 average common equity ratio of 70.3% for 1994 and 22 75.9% for 1995. . . . Upon our analyses of the 1994 23 and 1995 average common equity for California’s 24 eighteen small independent telephone companies and 25 evaluation of a higher equity ratio trend for smaller 26 companies, as demonstrated by comparing the results 27 of ORA’s large comparable companies to applicant’s 28 mid-size comparable companies analyses, we concur 29 with applicant’s assessment that a reasonable range of 30 common equity for small telephone companies, such 31 as applicant, should be between 60% and 80% 32 equity.93 (Emphasis added.) 33
93 Decision No. 97-04-034, Application No. 95-12-075 (Filed December 26,
Attachment No. 2 IURC Cause No. 45064
Indiana Exchange Carrier Association, Inc. Page 149 of 173
Attachment B

More recently, the Independent Small LECs are becoming even 1
more conservatively capitalized, which was a similar observation 2
in 1997, with equity ratios rising, in spite of the fact that the 3
carriers derive no incremental benefit in terms of their rates. The 4
equity ratio is rising because risk is increasing, which is precisely 5
the reason that a forward-looking hypothetical equity ratio should 6
not be reduced. ORA contends that it is not reasonable “to rely on 7
the previously established zone of reasonableness . . .” because the 8
beta-related proxy group in my Opening Testimony yields different 9
results for a capital structure (reducing the equity ratio).94 Again, I 10
was simply using the group to estimate a more useful figure for the 11
industry beta. However, when applied to the capital structure, 12
ORA’s argument results in a nonsensical outcome—that the 13
carriers should be assumed to have greater debt and lesser equity. 14
Moreover, the market-based evidence indicates precisely the 15
opposite—that carriers are becoming more cautious and increasing 16
their equity ratios, apparently because the carriers believe that such 17
conservatism is prudent. 18
Q53. Is ORA stating that your proxy group is incorrect in 19
generating an appropriate beta? 20
1995), No. I.96-04-016 (Filed April 10, 1996). 94 ORA Testimony, p. 11, lines 1-4.
Attachment No. 2 IURC Cause No. 45064
Indiana Exchange Carrier Association, Inc. Page 150 of 173
Attachment B

A, No. The use of the proxy group that I proposed to generate a beta 1
is reasonable and unchallenged by ORA. ORA is apparently only 2
arguing that the capital structure might be modified, and the equity 3
ratio assumed for the Independent Small LECs might be reduced. 4
Q54. So, is it your opinion that the appropriate proportion of equity 5
should be higher now for the Independent Small LECs 6
compared with the ratio in 1997? 7
A. Yes. Risks have increased in the LEC sector since 1997, which 8
suggests that companies will capitalize themselves more 9
conservatively today than they did nearly twenty years ago. Rural 10
carriers are attempting to reduce their fixed obligations—including 11
interest costs—to manage the higher risks associated with growing 12
competition, rapid technological change, and uncertain regulatory 13
revenues. Again, it is not reasonable or prudent to reduce the 14
previously-established range of 60%-80% equity today. If 15
anything, it should be increased to assume relatively more equity 16
which mitigates risks. 17
Q55. Is ORA correct in excluding the 100% equity-financed 18
companies on the basis that they skew the average equity 19
Attachment No. 2 IURC Cause No. 45064
Indiana Exchange Carrier Association, Inc. Page 151 of 173
Attachment B

structure higher and thus result in a higher WACC or rate of 1
return?95 2
A. No. ORA presents a table that shows that the elimination of three 3
companies with 100% equity ratios results in a lower equity ratio 4
of 56.8%, using average statistics from the last five years. This is 5
apparently an argument sponsored by ORA with a view to reduce 6
the 20-year-old zone of reasonableness. Of course, it is a 7
mathematical certainty that the equity ratio is reduced when one 8
eliminates the three highest equity ratios among the ten ILECs, just 9
as certainly as the equity ratio would be raised if one eliminated 10
the three lowest ratios. It is unreasonable to perform either of 11
these exclusions, which serve only to distort the data. More 12
important, the companies with 100% equity are part of a clear 13
trend toward greater equity, underscoring the increasing risks 14
associated with maintaining significant debt burdens. Three of the 15
ten companies currently have 100% equity ratios and five of the 16
other seven companies have increased equity ratios in 2014 by an 17
average 689 basis points compared with the ratios in 2010. This 18
suggests a growing financial conservatism that cannot be 19
ignored.96 And, this increasing equity ratio undercuts ORA’s 20
95 ORA Testimony, p. 14, lines 1-6. 96 Balhoff Opening Testimony, p. 72, Table 8; Calaveras’ equity ratio improved from 2010 to 2014 by 864 bps, Foresthill by 463 bps, Ponderosa by 397 bps,
Attachment No. 2 IURC Cause No. 45064
Indiana Exchange Carrier Association, Inc. Page 152 of 173
Attachment B

argument that debt costs are actually low. If ORA were correct, 1
the low government-subsidized debt rates assumed by ORA might 2
motivate a company to incur increasing levels of debt to benefit 3
from the spread between debt costs and equity costs. Contrary to 4
what ORA expects, the companies are behaving in a manner that 5
clearly communicates that it is appropriate to have higher 6
proportions of equity in today’s higher-risk LEC environment. 7
Since the Commission has not mandated that any of the companies 8
actually maintain any particular capital structure, the carriers’ 9
migration toward equity represents an undeniable trend reflecting 10
on the Independent Small LECs’ views of the capital markets and 11
the judgment of the carriers regarding prudent risk-mitigation. 12
VI. PROBLEMS WITH THE FCC STAFF REPORT 13
Q56. Can you comment on ORA’s reference to, and reliance on, the 14
FCC Staff’s Report entitled “Prescribing the Authorized Rate 15
of Return”? 16
A. Yes. First, the ORA testimony makes reference in its “Return on 17
Equity” section to “the FCC’s Report,” which appears in those 18
words or similar words four times in its filing.97 However, in the 19
second paragraph of the FCC Staff document to which ORA refers, 20
Sierra by 616 bps, and Volcano by 1,105 bps. 97 ORA Testimony, pp. 39, 40, 42, and 43.
Attachment No. 2 IURC Cause No. 45064
Indiana Exchange Carrier Association, Inc. Page 153 of 173
Attachment B
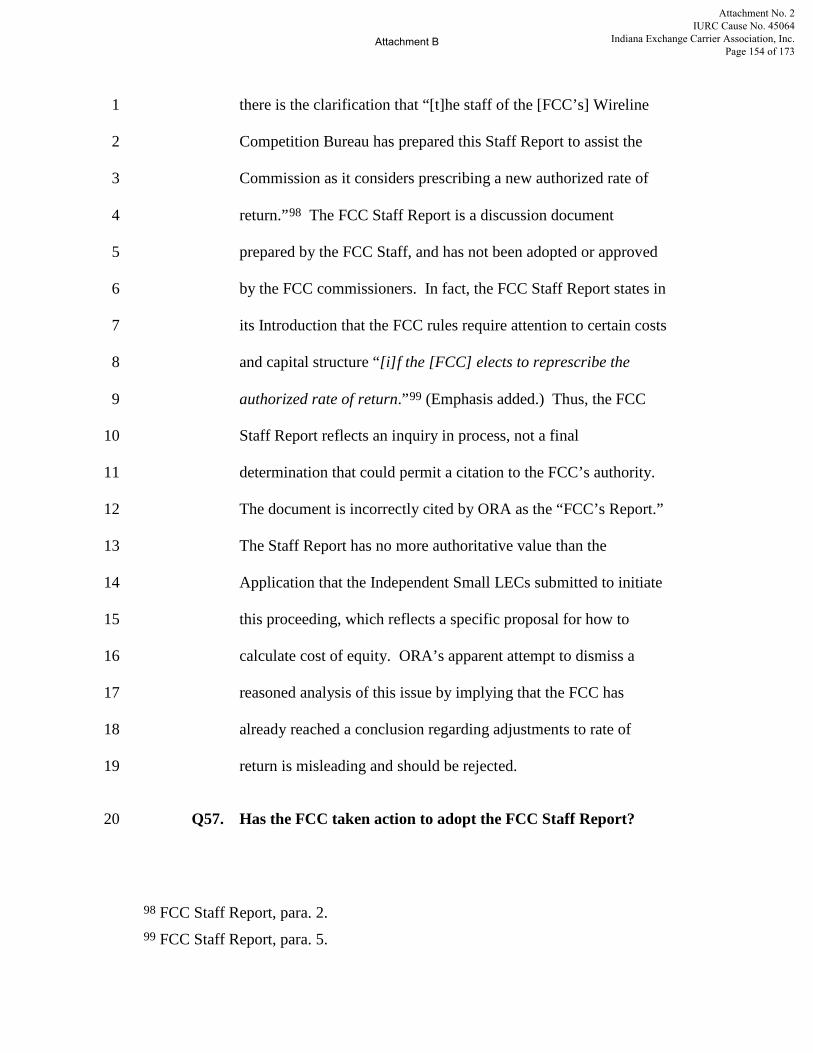
there is the clarification that “[t]he staff of the [FCC’s] Wireline 1
Competition Bureau has prepared this Staff Report to assist the 2
Commission as it considers prescribing a new authorized rate of 3
return.”98 The FCC Staff Report is a discussion document 4
prepared by the FCC Staff, and has not been adopted or approved 5
by the FCC commissioners. In fact, the FCC Staff Report states in 6
its Introduction that the FCC rules require attention to certain costs 7
and capital structure “[i]f the [FCC] elects to represcribe the 8
authorized rate of return.”99 (Emphasis added.) Thus, the FCC 9
Staff Report reflects an inquiry in process, not a final 10
determination that could permit a citation to the FCC’s authority. 11
The document is incorrectly cited by ORA as the “FCC’s Report.” 12
The Staff Report has no more authoritative value than the 13
Application that the Independent Small LECs submitted to initiate 14
this proceeding, which reflects a specific proposal for how to 15
calculate cost of equity. ORA’s apparent attempt to dismiss a 16
reasoned analysis of this issue by implying that the FCC has 17
already reached a conclusion regarding adjustments to rate of 18
return is misleading and should be rejected. 19
Q57. Has the FCC taken action to adopt the FCC Staff Report? 20
98 FCC Staff Report, para. 2. 99 FCC Staff Report, para. 5.
Attachment No. 2 IURC Cause No. 45064
Indiana Exchange Carrier Association, Inc. Page 154 of 173
Attachment B
A. No. As of today, about 34 months after the release of the FCC 1
Staff discussion paper, the FCC has not yet represcribed the 2
allowed rate of return, nor, to the best of my knowledge, has it 3
opined publicly about the value of any of the content in the FCC 4
Staff Report. A review of the comments in response to the FCC 5
Staff Report, as compiled on the FCC’s website indicates that the 6
majority of the replies contest the reductions proposed in the 7
Report.100 It is my opinion that the commentaries arguing against 8
lowering the rate of return provide more substantive analyses and 9
are better reasoned. 10
Q58. In your opinion, are there material flaws in the analysis in the 11
FCC Staff Report? 12
A. Yes. First, the FCC Staff Report relies on a proxy group of 13
companies that appears to be fundamentally different from rural 14
ILECs and certainly different from the Independent Small LECs 15
before the Commission in this proceeding. Second, the calculation 16
of equity costs does not include necessary adjustments to reflect 17
risks arising from size or liquidity/marketability. Third, for the 18
CAPM, the FCC Staff Report uses a very low risk-free rate, which 19
is today artificially depressed by economic conditions and an 20
100 While certain commenters noted that the criticisms came from rural trade associations, consultants and rural carriers, such input is logical—not simply because the carriers are self-interested, but also because they are more knowledgeable about the issues and risks.
Attachment No. 2 IURC Cause No. 45064
Indiana Exchange Carrier Association, Inc. Page 155 of 173
Attachment B

aggressive fiscal policy.101 Fourth, the Staff Report does not 1
accurately reflect rural ILECs’ reduced access to the debt markets. 2
Finally, the Staff Report does not account in any way for the 3
unique political, regulatory, and market risks that the Independent 4
Small LECs face in California. I believe the flaws are so profound 5
that they render the FCC Staff Report unreliable. Even if the FCC 6
commissioners were to use the same approach, in whole or in part, 7
the analysis remains seriously flawed. This Commission should 8
examine the issue more closely and consider the full range of 9
factors that I have outlined here and in my Opening Testimony. 10
Q59. What proxy group does the Staff use and why has the selection 11
been criticized? 12
A. The Staff uses a proxy group of companies identified on the basis 13
of certain criteria: companies that (i) report that 10% of their 14
overall operations include price-regulated interstate 15
telecommunications services, (ii) serve some rural regions, and (iii) 16
were ILECs that were judged to publish reliable financial data.102 17
The criteria, therefore, provided a very low 10% threshold for 18
similarity of regulated operations, failed to account for the 19
101 FCC Staff Report, para. 65: “Because we believe the interest rate that is the best predictor of the future interest rate on government securities is the current interest rate (which is consistent with the hypothesis that interest rates follow a random walk), we use the current rate as the risk-free interest rate." 102 FCC Staff Report, para. 12.
Attachment No. 2 IURC Cause No. 45064
Indiana Exchange Carrier Association, Inc. Page 156 of 173
Attachment B

financial challenge when a relatively large proportion of the 1
business is rural, and chose to emphasize an analysis of carriers 2
that were required to publish significant financial information and 3
attract financial analytical coverage. Thus, the financial profile of 4
the universe of companies—the so-called “proxy group”—used in 5
the FCC Staff Report is, by definition, markedly different from that 6
of the Independent Small LECs’, which are not remotely as 7
diversified as the large carriers, have 100% of their intrastate 8
telephone operations regulated, and 100% of their territories 9
focused on rural regions. Based on criteria that support the 10
inclusion of patently non-comparable companies, the FCC Staff 11
proposed a “proxy group” that included the large regional holding 12
companies—AT&T, Verizon and CenturyLink. Additionally, the 13
FCC included mid-sized companies Alaska Communications 14
Systems, Cincinnati Bell, FairPoint, Frontier, Hawaiian Telcom, 15
and Windstream. Finally, the Staff rounded out the sixteen proxy 16
companies with publicly-traded “rural” carriers, including 17
HickoryTech (which was then Enventis and is now merged into 18
Consolidated Communications), Shenandoah Telecommunications, 19
TDS, Consolidated Communications, New Ulm, Lumos and 20
Alteva (which at that time owned an ILEC, Warwick Valley). The 21
Staff made a judgment that the smaller RLECs were less reliable 22
proxies, which created an obvious definitional bias, because fewer 23
Attachment No. 2 IURC Cause No. 45064
Indiana Exchange Carrier Association, Inc. Page 157 of 173
Attachment B

analyst estimates were available to use for the Discounted Cash 1
Flow ("DCF") model and because the stocks for those companies 2
are traded infrequently. In short, the FCC Staff presents a set of 3
criteria that pre-determines reliance on large public and diversified 4
companies with a risk profile—regulatory dependence, 5
diversification of operations, concentrated service regions, and 6
access to capital markets—that is entirely different from the 7
Independent Small LECs. 8
Q60. Do you have further comments about the proxy group? 9
A. Yes. I recognize the FCC Staff’s challenges in choosing a proxy 10
group, particularly as so many smaller carriers with publicly-traded 11
stocks have been merged into other entities or sold in the last 12
decade. Despite these limitations, a rational and knowledgeable 13
investor would see no meaningful similarities between the larger 14
carriers and the Independent Small LECs. In some ways, the 15
businesses of smaller ILECs and the larger carriers may have once 16
been more similar, but those similarities have disappeared over the 17
last twenty years. Today, the differences are increasingly 18
consequential from an operational and financial perspective. 19
Q61. Please explain the consequential differences that you see 20
between the proxy group and smaller ILECs. 21
I can summarize the differences. 22
Attachment No. 2 IURC Cause No. 45064
Indiana Exchange Carrier Association, Inc. Page 158 of 173
Attachment B
• Verizon and AT&T have wireless operations that have 1
generated more revenue than any other segment of their 2
businesses, making their businesses very different from 3
those of the Independent Small LECs. For 2015, AT&T 4
reported that 50% of its revenues were generated by 5
wireless, while Verizon reported 71% of its revenues were 6
generated by wireless and the wireless proportion is 7
growing. Thus, Verizon and AT&T have growth 8
opportunities and meaningful diversification that do not 9
exist for rural telephone companies, and those trends are 10
moving in the opposite direction for the Independent Small 11
LECs. 12
• Virtually every other carrier on the FCC Staff’s proxy list 13
has other significant differences from the majority of rural 14
ILECs, including and perhaps especially from the 15
Independent Small LECs. 16
o Specifically, as of the time when the FCC Staff 17
Report was released, CenturyLink was a large 18
multi-state carrier with significant enterprise and 19
data center operations (the legacy ILEC operations 20
at the end of 2013 were 42% of total revenues) and 21
growth was generated by those two sectors; 22
Attachment No. 2 IURC Cause No. 45064
Indiana Exchange Carrier Association, Inc. Page 159 of 173
Attachment B

o Cincinnati Bell serves a dense cluster of customers 1
in and around a major metropolitan city, supporting 2
a very different regulatory and cost profile; 3
o Alteva was an integrated communications provider 4
(the small ILEC operations contribute virtually no 5
cash flow), making the core of that company vastly 6
different from the rural carriers; and 7
o Windstream relied on multi-state operations with 8
diversified data center services and competitive 9
local exchange carrier (“CLEC”) businesses (only 10
22% of total 2013 revenues were from consumer 11
services). 12
The FCC Staff explained that the reason for including these 13
carriers was the FCC’s requirement for a large enough sample of 14
analysts’ estimates to ensure the value of the DCF constant growth 15
model. Because the FCC purportedly sought reliable data, it 16
included carriers that had risks and prospects vastly different from 17
the smaller, private ILECs. From an investment point of view, 18
which is what should inform the determination of the appropriate 19
return on equity and allowed rate of return, there are some 20
superficial similarities between the proxy group and the 21
Independent Small LECs; however, the significant differences 22
require adjustments to the cost-of-capital estimation models, 23
Attachment No. 2 IURC Cause No. 45064
Indiana Exchange Carrier Association, Inc. Page 160 of 173
Attachment B

particularly because the size and diversified operations of the large 1
carriers result in lower equity risk compared with the smaller 2
carriers. 3
Q62. What about the other problems you note regarding the FCC 4
Staff Report? 5
A. Two other fundamental problems with the Staff Report 6
unavoidably lead to a flawed analysis. First, the Staff assumes it 7
has correctly determined the risk-free rate, which the FCC Staff 8
astonishingly sets at 1.92% based on the ten-year Treasury note at 9
the time. As detailed in my Opening Testimony, the adoption of so 10
low a “risk-free rate” in a forward-looking proceeding is not 11
defensible because the current interest rates are at historic low 12
levels, which are generally regarded as unsustainable.103 I have 13
already noted that the major valuation firms—14
Ibbotson/Morningstar and Duff & Phelps—set the risk-free rate 15
well higher than the figure in the FCC Staff Report based on the 16
fact that the current Treasury rates have been managed to 17
extraordinarily depressed levels. The FCC does not attempt to 18
match the risk-free rate’s term with the equity premium which, is 19
103 FCC Staff Report, para. 64: “In our detailed analysis below, we take the interest rate on the 10-year Treasury note as the risk free rate because the standard deviation of the mean historical equity premium measured relative to returns on 10-year Treasury securities is readily available. This rate was 1.92 percent as of March 26, 2013.”
Attachment No. 2 IURC Cause No. 45064
Indiana Exchange Carrier Association, Inc. Page 161 of 173
Attachment B
reported to be 5.88% by Professor Damodaran.104 A second major 1
problem is that the FCC uses a DCF valuation, which estimates 2
value using dividend and growth expectations that should be 3
applied to a stable industry, which the ILEC sector is not. The 4
ILEC business model is undergoing a wrenching set of 5
technological, competitive and regulatory changes, as I have 6
described at length in my Opening Testimony. The assumption 7
that dividends will be paid into perpetuity in such an environment 8
is a highly questionable—and I believe, incorrect—proposition. 9
Q63. Are those issues the extent of the problems with the FCC Staff 10
Report? 11
A. No. The problems with the FCC Report include other factors. If 12
one studies the FCC Staff Report more carefully, it becomes clear 13
that there are other anomalies. For example, the embedded cost of 14
debt is higher than the computed cost of equity for six of the 15
104 FCC Staff Report, paras. 71-72. Aswath Damodaran, Professor of Finance at the Stern School of Business at New York University, available at
http://pages.stern.nyu.edu/~adamodar/New_Home_Page/datafile/histretSP.html. See also Professor Damodaran’s spreadsheet available at http://www.stern.nyu.edu/~adamodar/pc/datasets/indname.xls. While Professor Damodaran provides the companies included in, for example, “Telecom. Services,” and provides ticker symbols as well as the countries where services are provided, there are no data which would permit us to understand and analyze the summary results which he reports.
Attachment No. 2 IURC Cause No. 45064
Indiana Exchange Carrier Association, Inc. Page 162 of 173
Attachment B

sixteen carriers.105 The FCC Staff admits that this makes no sense, 1
and I agree that it does not.106 However, the FCC Staff Report 2
dispenses with the anomalies, stating that when it finds that the 3
debt costs are higher than the equity costs, it is making adjustments 4
to the cost of equity to ensure that the cost of equity is no lower 5
than the cost of calculated debt. It is my opinion that, when data 6
do not make sense, a more careful examination of the assumptions, 7
the inputs, and the model is needed. It is not sufficient to make 8
arbitrary adjustments to offset irrational results, especially when 9
the results are likely signaling that the model itself and the inputs 10
are wrong. The FCC Staff Report, however, chooses to adjust 11
certain of the unreasonable outputs, apparently without re-12
examination of the underlying premises. The FCC Staff Report—13
and its conclusions—do not provide a reasonable foundation for 14
105 FCC Staff Report, para. 84: “We note that the CAPM estimates of the cost of debt for six of the sixteen carriers - New Ulm, Alteva, Alaska, Hawaiian, and Frontier - are actually higher than the cost of equity. For New Ulm: the cost of debt is 5.41 percent (versus 4.83 percent cost of equity); for Alteva: 5.89 percent (versus 5.0 percent); for Alaska: 7.38 (versus 6.84 percent); for Hawaiian: 7.52 (versus 6.30 percent); and for Frontier, 8.27 (versus 7.56 percent).” 106 FCC Staff Report, paras. 86-87: “[r]equiring a minimum return to equity necessary to ensure all carriers’ cost of equity is not less than their cost of debt, we conclude that the CAPM analysis suggests the WACC most likely lies between 7.39 and 8.58 percent. Any equity premium less than 7.57 percent results in a cost of equity that is less than the cost of debt for some of our firms, which violates a fundamental precept of financial economics, strongly implying error in our estimates. As an approximation designed to remove this anomaly, we performed the cost of equity calculation using 7.57 percent as the lower bound of the market premium, obtaining cost of equity ranges of 8.69-11.35 percent.”
Attachment No. 2 IURC Cause No. 45064
Indiana Exchange Carrier Association, Inc. Page 163 of 173
Attachment B

decision-making by the FCC or by the CPUC. ORA’s reliance 1
upon the FCC Staff Report is misplaced. 2
Q64. Do you have estimates about the impact on rural carriers if the 3
cost of equity were to be set at the reduced levels recommended 4
in the FCC Staff Report? 5
A. I do not know the specific financial effect, but John Staurulakis, 6
Inc. (“JSI”) stated in an FCC filing, on the basis of its analysis of 7
151 cost-company clients, that the effect on rural carriers would be 8
to reduce per-line per-month regulated revenues by approximately 9
$4.99 or $3.99, depending on whether one assumes the low or high 10
rate of return that the FCC Staff proposes.107 While JSI did not 11
comment further, no avoided costs are associated with such a 12
revenue reduction, and therefore the operating cash flows should 13
fall by the same amount. If one were to assume that the rates were 14
$30 monthly and the EBITDA margins were 40%, rate reductions 15
arising from the very low 8.06% and 8.72% allowed return on 16
equity capital proposed by the FCC Staff would result in the carrier 17
losing operating cash flow per customer that amounts to 41% or 18
33% of its regulated total operating cash flow, respectively. This 19
is not an inconsequential reduction, if JSI is correct. I do not 20
107 Comments of John Staurulakis, Inc., On Rate of Return Represcription Staff Report, July 25, 2013, available at http://www.jsitel.com/files/JSI_Rate_of_Return_Represcription_Comments.pdf, pp. 5-6.
Attachment No. 2 IURC Cause No. 45064
Indiana Exchange Carrier Association, Inc. Page 164 of 173
Attachment B

believe that reasonable investment in rural telephone company 1
infrastructure could be sustained at these levels. This was the same 2
point that CoBank made earlier when it suggested that the sector 3
could become “not bankable.” 4
Q65. Does the FCC Staff Report make adjustments to the cost of 5
capital to reflect risk arising from size, liquidity, and 6
marketability? 7
A. No. The FCC Staff Report does not provide any allowance for 8
factors reflecting size or marketability/liquidity premia to adjust 9
the CAPM. In fact, citing a single source that purports to 10
summarize other studies, the FCC Staff suggests that any size 11
premium disappears over time.108 This is a startling conclusion 12
based on one citation, particularly when that source states that 13
there is a liquidity risk for smaller companies and concedes that 14
there is demonstrably higher risk for the smallest-decile 15
companies, as I explained earlier. Most valuation professionals 16
rely on the data and resources provided by companies such as 17
Morningstar, Inc. (Ibbotson Stocks, Bonds, Bills, and Inflation 18
108 FCC Staff Report, para. 75: “NECA asserts that ‘[e]xtensive research documents that small capitalization firms such as the average RLEC also require an additional risk premium of about 1.53 percent.’ However, recent research [the FCC Staff cites one 2011 report] indicates that the size effect ‘seems to vary over time or even disappears,’ with smaller firms in the United States not performing significantly better than large ones from 1980 onward. Therefore, we do not recommend adding a risk premium based on size to the cost of equity.”
Attachment No. 2 IURC Cause No. 45064
Indiana Exchange Carrier Association, Inc. Page 165 of 173
Attachment B
(“SBBI”)) and Duff & Phelps, LLC.109 As I outline below, 1
significant authorities have responded to those claims, providing 2
specific explanations for the cyclical anomalies, and analyzing 3
additional data that refute the 1980s-based data. Both 4
Ibbotson/Morningstar and Duff & Phelps are clear that adjustments 5
should be made for size effects and possibly other factors. For 6
example, Duff & Phelps in its 2013 Valuation Handbook writes: 7
Research tells us that the CAPM often misprices risk for 8 certain investments. Specifically, researchers have observed 9 that commonly used methods of measuring risk used in the 10 CAPM (specifically, beta) often understate the risk (and thus 11 understate the required return) for small company stocks. 12 Examination of market evidence shows that within the 13 context of CAPM, beta does not fully explain the difference 14 between small company returns and large company returns. 15 In other words, the historical (observed) excess return of 16 portfolios comprised of smaller companies is greater than the 17 excess return predicted by the CAPM for these portfolios. 18 This “premium over CAPM” is commonly known as a “beta-19 adjusted size premium” or simply “size premium.”110 20
Duff & Phelps is clear that research verifies the necessity for 21
application of a premium to reflect market-based risk beyond the 22
overall equity return for smaller companies compared with larger 23
companies. Ibbotson/Morningstar also provides statistics to 24
109 Ibbotson SBBI 2013 Valuation Yearbook, Market Results for Stocks, Bonds, Bills, and Inflation 1926-2012 (Chicago, IL: Morningstar, Inc., 2013) (“Ibbotson 2013 Yearbook”); Ibbotson SBBI 2014 Classic Yearbook, Market Results for Stocks, Bonds, Bills, and Inflation 1926-2013 (Chicago, IL: Morningstar, Inc., 2014) (“Ibbotson 2014 Classic Yearbook”); Duff & Phelps, 2014 Valuation Handbook, Guide to Cost of Capital (Chicago, IL: Duff & Phelps, LLC, 2014). 110 Duff & Phelps, 2013 Valuation Handbook, Guide to Cost of Capital (Chicago, IL: Duff & Phelps, LLC, 2013), p. 60.
Attachment No. 2 IURC Cause No. 45064
Indiana Exchange Carrier Association, Inc. Page 166 of 173
Attachment B

demonstrate the effect of size on returns, and explains that “[i]f 1
small companies did not provide higher long-term returns, 2
investors would be more inclined to invest in the less risky stocks 3
of large companies.111 4
Q66. Are there critiques in the current financial literature 5
addressing the issues raised by the FCC concerning the 6
“disappearance” of the size premium in the early 1980s? 7
A. Yes. Pratt and Grabowski explain that the methodology of the new 8
studies use average returns that obscure “performance.”112 They 9
describe how, using a more appropriate methodology, small stocks 10
actually “outperformed” large stocks even using early 1980s start 11
dates (contrary to the argument that small-company stocks 12
performed similarly to large-company stocks beginning in that 13
period), which means that the cost of equity is higher for smaller 14
companies. The exception to this “outperformance” occurred 15
when the start date was 1983-1984, when there were, according to 16
Hou and Van Dijk, specific cash flow shocks in the market that the 17
111 Ibbotson 2014 Classic Yearbook, p. 109. 112 Pratt and Grabowski Cost of Capital 2014, p. 352, Exhibit 15.13; Pratt and Grabowski posit a $1 investment in Fund A that rises each year by 10% over the ten year period except in year 5 when it falls by 70%, resulting in an annual average performance of 2%, and an ending principal of $0.71. Fund B rises by 3% in year one, 1% in year two, and then alternates 3% and 1% in subsequent years, to average 2% annual returns, but to end the decade with $1.22. The annual averages in the two funds were the same 2%, but the “performance” of Fund B was superior.
Attachment No. 2 IURC Cause No. 45064
Indiana Exchange Carrier Association, Inc. Page 167 of 173
Attachment B
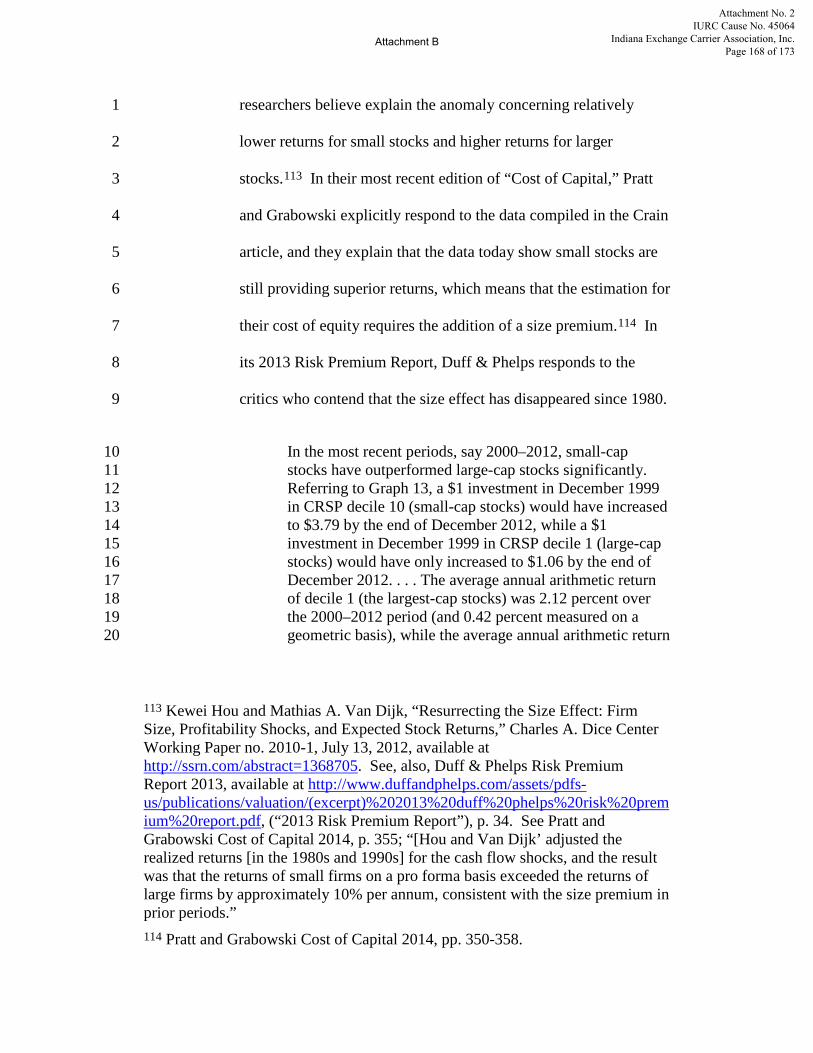
researchers believe explain the anomaly concerning relatively 1
lower returns for small stocks and higher returns for larger 2
stocks.113 In their most recent edition of “Cost of Capital,” Pratt 3
and Grabowski explicitly respond to the data compiled in the Crain 4
article, and they explain that the data today show small stocks are 5
still providing superior returns, which means that the estimation for 6
their cost of equity requires the addition of a size premium.114 In 7
its 2013 Risk Premium Report, Duff & Phelps responds to the 8
critics who contend that the size effect has disappeared since 1980. 9
In the most recent periods, say 2000–2012, small-cap 10 stocks have outperformed large-cap stocks significantly. 11 Referring to Graph 13, a $1 investment in December 1999 12 in CRSP decile 10 (small-cap stocks) would have increased 13 to $3.79 by the end of December 2012, while a $1 14 investment in December 1999 in CRSP decile 1 (large-cap 15 stocks) would have only increased to $1.06 by the end of 16 December 2012. . . . The average annual arithmetic return 17 of decile 1 (the largest-cap stocks) was 2.12 percent over 18 the 2000–2012 period (and 0.42 percent measured on a 19 geometric basis), while the average annual arithmetic return 20
113 Kewei Hou and Mathias A. Van Dijk, “Resurrecting the Size Effect: Firm Size, Profitability Shocks, and Expected Stock Returns,” Charles A. Dice Center Working Paper no. 2010-1, July 13, 2012, available at http://ssrn.com/abstract=1368705. See, also, Duff & Phelps Risk Premium Report 2013, available at http://www.duffandphelps.com/assets/pdfs-us/publications/valuation/(excerpt)%202013%20duff%20phelps%20risk%20premium%20report.pdf, (“2013 Risk Premium Report”), p. 34. See Pratt and Grabowski Cost of Capital 2014, p. 355; “[Hou and Van Dijk’ adjusted the realized returns [in the 1980s and 1990s] for the cash flow shocks, and the result was that the returns of small firms on a pro forma basis exceeded the returns of large firms by approximately 10% per annum, consistent with the size premium in prior periods.” 114 Pratt and Grabowski Cost of Capital 2014, pp. 350-358.
Attachment No. 2 IURC Cause No. 45064
Indiana Exchange Carrier Association, Inc. Page 168 of 173
Attachment B

of decile 10 (the smallest-cap stocks) was 16.62 percent 1 (and 10.78 percent measured on a geometric basis).115 2
Still, the FCC Staff Report’s approach excludes size-effect, citing 3
the one article (and its sources) as justification, and summarily 4
arguing that cost of capital is fundamentally a market return, 5
modified by a telecommunications industry beta that slightly 6
reduces the market return. This approach is contrary to that 7
recommended by the major financial sources and it is inconsistent 8
with the significant data compiled over multiple periods, including 9
the most recent two decades. 10
Q67. What adjustments typically are made by regulatory 11
commissions and financial analysts to account for specific 12
risks? 13
A. Small companies are assumed to carry greater risk, as explained 14
above, which supports an adjustment to the large-company proxy 15
calculation by adding a size premium. This straightforward 16
rationale is spelled out by the American Society of Appraisers, 17
which explains: 18
A discount or premium is warranted when 19 characteristics affecting the value of the subject 20 interest differ sufficiently from those inherent in the 21
115 2013 Risk Premium Report, p. 35.
Attachment No. 2 IURC Cause No. 45064
Indiana Exchange Carrier Association, Inc. Page 169 of 173
Attachment B

base value to which the discount or premium is 1 applied.116 2
In fact, there are material and obvious differences between the 3
Independent Small LECs and the FCC Staff Report’s proxy group. 4
As explained above, the FCC proxy group includes large, 5
diversified carriers with services in meaningful growth segments, 6
such as wireless, fiber transport and data centers.117 Further, the 7
larger carriers in the proxy group are nearly all engaged in 8
aggressive acquisition and diversification activities, which provide 9
them with opportunities for cash flow growth and risk mitigation. 10
These factors are size-related “characteristics affecting the value of 11
the subject interest” such that adjustments to reflect the increased 12
risk in the equity cost of the Independent Small LECs are 13
required.118 14
116 Shannon Pratt, “Overview of Business Valuation Discounts and Premiums and the Bases to Which They are Applied”, p. 2, available at http://www.shannonpratt.com/article/overview_business_valuation_discounts_premiums.pdf. 117 The proxy group is presented in the FCC Staff’s Appendix F: Enventis Corp., TDS, New Ulm, Shenandoah Telecom, Consolidated Communications, Lumos, Alteva, Windstream, Alaska Communications Systems, Hawaiian Telcom, Frontier Communications, FairPoint, Cincinnati Bell, CenturyLink, Verizon and AT&T. 118 Also, see the American Institute of Public Accountants, Statement on Standards for Valuation Services, para 40, available at (http://www.aicpa.org/InterestAreas/ForensicAndValuation/DownloadableDocuments/SSVS_Full_Version.pdf): “During the course of a valuation engagement, the valuation analyst should consider whether valuation adjustments (discounts or premiums) should be made to a pre-adjustment value. Examples of valuation adjustments for valuation of a business, business ownership interest, or security
Attachment No. 2 IURC Cause No. 45064
Indiana Exchange Carrier Association, Inc. Page 170 of 173
Attachment B
Q68. Are you saying that ORA’s exclusion of the size effect is not 1
justified? 2
A. Yes. ORA points to literature that actually supports the opposite 3
conclusion, which is that a size factor should be included. ORA 4
has provided no justification for excluding a size factor that the 5
CPUC found to be appropriate in 1997, except to cite to the FCC 6
Staff Report. The FCC Staff Report justifies its exclusion of the 7
size factor only by citing to the Michael Crain literature survey. 8
However, this study explains that other factors may better explain 9
the size effect, and that the size effect is observable in the three 10
smallest deciles. The Independent Small LECs fall in the smallest 11
of the four quartiles of the tenth or smallest decile. Thus, ORA has 12
not only failed to show that a size factor should be excluded, but 13
has pointed to sources that justify the inclusion of a size factor. 14
VIII. CONCLUDING COMMENTS 15
Q69. Please summarize your testimony in response to ORA. 16
A. I have provided a disciplined and comprehensively sourced 17
framework for the CPUC’s consideration of capital structure, 18
imputed debt costs and an estimation of equity costs. The CPUC 19
and ORA can assess those sources, data, and the logic based on 20
include a discount for lack of marketability or liquidity and a discount for lack of control.” [Emphasis in the original]
Attachment No. 2 IURC Cause No. 45064
Indiana Exchange Carrier Association, Inc. Page 171 of 173
Attachment B

rigorous and scholarly approaches that test and re-test the 1
conclusions. In response, ORA has provided virtually no sources 2
and does not directly challenge the specific findings in my 3
Opening Testimony. Without valid citations, ORA simply 4
proposes use of a CAPM that is driven by two inputs that ORA 5
believes are appropriate—a very low three-year average Treasury 6
rate of 2.91%—plus 5.88%, which ORA adopted from the FCC 7
Staff Report. Contrary to the Supreme Court opinions and the 8
opinions of reputable financial experts, ORA does not propose 9
analysis of any industry-specific risks, and ORA rejects important 10
sources that call for size and liquidity factors. ORA also proposes 11
a capital structure that is below the 1997 CPUC-defined zone of 12
reasonableness (equity ratio of 60%-80%) and ORA relies on an 13
average capital structure calculated after arbitrarily excluding the 14
three companies with the highest equity ratios. ORA also proposes 15
4.53% as the imputed debt costs for carriers that do currently have 16
debt, by contrast with our recommendation of 5.5%. I believe that 17
I have presented and supported a balanced and clearly defensible 18
set of findings that ORA has not refuted. As surprising as the data 19
may appear to be, the cost of equity has certainly risen since 1997. 20
The data support a cost of equity that is above 20% based on M&A 21
data. However, I have relied on the traditional CAPM formulae, 22
and have found an equity cost of 18.5% and proposed a WACC of 23
Attachment No. 2 IURC Cause No. 45064
Indiana Exchange Carrier Association, Inc. Page 172 of 173
Attachment B

14.6%. As I have explained and sourced, I was conservative by 1
applying no liquidity or marketability premium. I used a size 2
premium that is 641 basis points lower than the 11.98% 3
recommended by Duff & Phelps for the smallest of companies (the 4
10z grouping into which the Independent Small ILECs clearly 5
fall). I also used a beta that is relatively low at 1.06, in spite of the 6
fact that it is drawn from proxies that are all substantially larger, 7
more liquid, more capable of acquisitions, and more diversified. 8
Finally, I used a risk-free rate that is the lower of the two options 9
(a higher result is generated when using total return on the 10
Treasury note). My testimony is well-founded in valuation and 11
regulatory practice, and is not aggressive. It should guide the 12
Commission’s consideration of establishing a cost of capital in this 13
proceeding. 14
Q70. Does this conclude your testimony? 15
A. Yes. Thank you. 16
17
Attachment No. 2 IURC Cause No. 45064
Indiana Exchange Carrier Association, Inc. Page 173 of 173
Attachment B
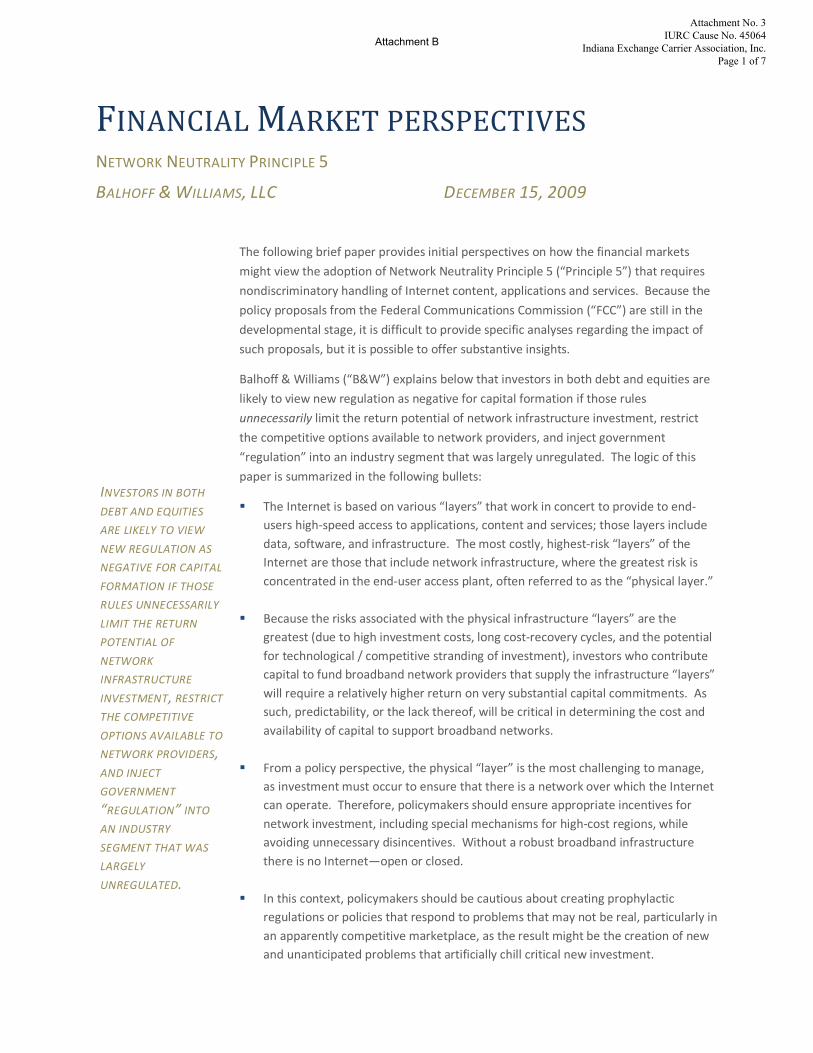
FINANCIAL MARKET PERSPECTIVES NETWORK NEUTRALITY PRINCIPLE 5
BALHOFF & WILLIAMS, LLC DECEMBER 15, 2009
The following brief paper provides initial perspectives on how the financial markets might view the adoption of Network Neutrality Principle 5 (“Principle 5”) that requires nondiscriminatory handling of Internet content, applications and services. Because the policy proposals from the Federal Communications Commission (“FCC”) are still in the developmental stage, it is difficult to provide specific analyses regarding the impact of such proposals, but it is possible to offer substantive insights.
Balhoff & Williams (“B&W”) explains below that investors in both debt and equities are likely to view new regulation as negative for capital formation if those rules unnecessarily limit the return potential of network infrastructure investment, restrict the competitive options available to network providers, and inject government “regulation” into an industry segment that was largely unregulated. The logic of this paper is summarized in the following bullets:
The Internet is based on various “layers” that work in concert to provide to end-users high-speed access to applications, content and services; those layers include data, software, and infrastructure. The most costly, highest-risk “layers” of the Internet are those that include network infrastructure, where the greatest risk is concentrated in the end-user access plant, often referred to as the “physical layer.”
Because the risks associated with the physical infrastructure “layers” are the greatest (due to high investment costs, long cost-recovery cycles, and the potential for technological / competitive stranding of investment), investors who contribute capital to fund broadband network providers that supply the infrastructure “layers” will require a relatively higher return on very substantial capital commitments. As such, predictability, or the lack thereof, will be critical in determining the cost and availability of capital to support broadband networks.
From a policy perspective, the physical “layer” is the most challenging to manage,
as investment must occur to ensure that there is a network over which the Internet can operate. Therefore, policymakers should ensure appropriate incentives for network investment, including special mechanisms for high-cost regions, while avoiding unnecessary disincentives. Without a robust broadband infrastructure there is no Internet—open or closed.
In this context, policymakers should be cautious about creating prophylactic
regulations or policies that respond to problems that may not be real, particularly in an apparently competitive marketplace, as the result might be the creation of new and unanticipated problems that artificially chill critical new investment.
INVESTORS IN BOTH DEBT AND EQUITIES ARE LIKELY TO VIEW NEW REGULATION AS NEGATIVE FOR CAPITAL FORMATION IF THOSE RULES UNNECESSARILY LIMIT THE RETURN POTENTIAL OF NETWORK INFRASTRUCTURE INVESTMENT, RESTRICT THE COMPETITIVE OPTIONS AVAILABLE TO NETWORK PROVIDERS, AND INJECT GOVERNMENT “REGULATION” INTO AN INDUSTRY SEGMENT THAT WAS LARGELY UNREGULATED.
Attachment No. 3 IURC Cause No. 45064
Indiana Exchange Carrier Association, Inc. Page 1 of 7
Attachment B

THE RATIONALE FOR PRINCIPLE 5 Policymakers are seeking input regarding a proposal that the FCC should adopt network neutrality Principle 5. The proposed rule is that . . .
5. Subject to reasonable network management, a provider of broadband Internet access service must treat lawful content, applications, and services in a nondiscriminatory manner.
At first glance, the principle appears reasonable, especially when viewed from the perspective of policymakers who have overseen a highly-regulated telecommunications monopoly for more than a century. The proposed rule focuses on the infrastructure “layers” of the Internet where it is assumed that a network owner (“a provider of broadband Internet access service”) may engage in discriminatory behavior that is viewed as anti-competitive.1
A closer look, however, leads to a more informed view. The more detailed view reveals that today (1) there is no meaningful evidence of significant anti-competitive behavior on the part of network operators; (2) there are alternative competitive platforms for Internet service delivery; and (3) there is a growing national concern about network investment to enable rapid and ubiquitous deployment of broadband, including services to uneconomic areas that are often rural. Thus, the fundamental question for policymakers is whether there is a valid rationale for requiring Principle 5—a rationale based on truly well-defined risks or harms, and based on the sufficient probability that the principle itself will not have a detrimental effect on a growing national imperative that the U.S. should keep pace in the Internet economy.
INVESTMENT RISK IS CONC ENTRATED IN PHYSICAL LAYER The Internet is not a single service, nor is it provided by a single industry. It is a complex set of services that include data sources, applications, management services, peering and transport facilities, switching and routing, as well as access plant, among others. Policymakers understand this complexity that is, in some ways, extraordinarily difficult to manage.
The U.S. has grown increasingly concerned about its national communications infrastructure policy, as other nations appear to be leading in terms of broadband network deployment, at least based on certain studies. While vast network infrastructure remains fundamental to the Internet, the U.S. has relied almost exclusively on private investment to enable the Internet business opportunity, even in the face of major capital risks. The most basic capital risk is that networks are very
1 The concept of layers is often traced to MCI which worked to define different layers, from highest to lowest, as application, presentation, session, transport, network, data link, and physical. The logic was that certain layers might be “chokepoints” and should be regulated differently, with the lower levels, such as the transport, data or physical treated as more highly regulated commodity services. Principle 5 appears to reflect the same viewpoint and concerns.
TODAY (1) THERE IS NO MEANINGFUL EVIDENCE OF SIGNIFICANT ANTI-COMPETITIVE BEHAVIOR ON THE PART OF NETWORK OPERATORS; (2) THERE ARE ALTERNATIVE COMPETITIVE PLATFORMS FOR INTERNET SERVICE DELIVERY; AND (3) THERE IS A GROWING NATIONAL CONCERN ABOUT NETWORK INVESTMENT TO ENABLE RAPID AND UBIQUITOUS DEPLOYMENT OF BROADBAND.
Attachment No. 3 IURC Cause No. 45064
Indiana Exchange Carrier Association, Inc. Page 2 of 7
Attachment B

costly, as new and rapidly changing technologies must be deployed in ever shorter investment cycles to allow networks to cope with escalating demand for greater bandwidth and speed. Second, the majority of the network investment is concentrated in the end-user access plant, particularly for wireline operations where the labor component is high, and where stranded investment can be costly if the customer does not subscribe or cuts off service for any reason. Third, the competitive value proposition is based on a complicated combination of consumer judgments that can change quickly, including reliability of the network, throughput speeds, pricing, content (e.g., NFL network or local sports or other video programming), end-user devices (modems, iPhones, etc.), and convenience (e.g., wireless mobility). Finally, there is meaningful risk in terms of the technology cycle. The competitive performance of the technologies grows shorter and shorter by contrast with traditional telephony, for example, and alternative platforms continue to leap-frog the performance of today’s networks, with faster cable technologies, the promise of mobile LTE and WiMAX, and growing fiber capacity. The risks are already high, and performance is evaluated carefully and actively by the consumer and by the investor. These capital risks apply in all geographic areas, but policymakers should be aware that the risks are exacerbated in lower-density rural markets that are particularly costly to serve.
While there are risks to all companies in the Internet value chain, it is clear that there are extraordinarily high financial risks arising from the significant capital commitments being made by network providers. And, this physical “layer”2
The risk related to the physical “layer” network investment is substantial and is likely to continue to grow as technologies and competitive pressures evolve. Verizon is dedicating $20+ billion to deploy what it hopes is a “future-proof” fiber-based wireline network in a high-risk initiative, while AT&T is upgrading its U-verse investment (pegged at $7 billion to $10 billion) to provide broadband services with current speeds of up to 24 Mbps downstream (in addition to video). Rural-focused ILECs, such as CenturyLink, Frontier Communications, Windstream, Consolidated Communications and Iowa Telecom, are achieving very high broadband availability using combinations of fiber and newer copper technologies even in very low-density markets. In addition, the largest wireless carriers will soon upgrade to Long-Term Evolution (“LTE”) network technology with 5-12 Mbps download speeds, while Clearwire (in partnership with Sprint and several cable operators) continues to invest heavily to expand a WiMax 4G wireless
is most critical to the development of a strong Internet economy. Other elements remain important, but companies such as Google or eBay or Yahoo or peering companies provide services over an Internet which makes their products available to all who are connected. However, the capital investments of the application and service providers are not remotely as large or as risky as those of the network providers. While companies supplying other Internet “layers” face different and unique challenges, none of those companies must manage investment requirements and financial uncertainties that are as significant as those of the network providers.
2 For purposes of this paper, the “physical” layer is the access plant, involving end-user connectivity and devices, as well as the electronics that support those connections.
WHILE THERE ARE RISKS TO ALL COMPANIES IN THE INTERNET VALUE CHAIN, IT IS CLEAR THAT THE MOST SIGNIFICANT CAPITAL COMMITMENTS ARE BEING MADE BY NETWORK PROVIDERS. AND, THIS PHYSICAL “LAYER” IS MOST CRITICAL TO THE DEVELOPMENT OF A STRONG INTERNET ECONOMY.
Attachment No. 3 IURC Cause No. 45064
Indiana Exchange Carrier Association, Inc. Page 3 of 7
Attachment B

network. Meanwhile, cable companies report that they have committed more than $146 billion to their U.S. plant since 1996, and that they invested nearly $15 billion in 2008 alone.3
The cable operators are enhancing their broadband network capabilities through Data over Cable Service Interface Specification (“DOCSIS”) 3.0 modems that can deliver speeds that they represent as approaching 200 Mbps.
INVESTORS FOCUS ON HIGH RISKS FOR TH E PHYSICAL LAYER As described above, the U.S. broadband “policy” to-date has relied heavily on Internet capabilities developed through private investment. The reality is that the system has “worked” because investors believed that they had the potential for sound and appropriate returns on their investment in network operators. However, policymakers generally realize that the providers of capital to competitive enterprises have always and will always require a risk-adjusted return-on-investment that is almost certainly higher than the rate in the traditional monopoly utility model.4
Investors continue to assess carefully recent network investments that are high-risk. For example, Verizon’s major commitment to FiOS was (and is still) viewed somewhat skeptically in terms of the company’s ability to generate appropriate returns on a huge investment.
5
3 See data from the National Cable and Telecommunications Association, available at http://www.ncta.com/StatsGroup/Investments.aspx.
As a result, most telecommunications financial analysts have understood that the markets valued Verizon’s stock at a discount to its peers, premised on the uncertain FiOS returns. Verizon pushed ahead with its investment plans in spite of that skepticism, but was able to do so only after regulators clarified that fiber-to-the-premise investments would be exempt from traditional telephony regulation.
4 The FCC is today attempting to determine how to assure appropriate investment, based on appropriate returns and supplementary universal service funding through the National Broadband Plan, including assuring service in uneconomic regions. See Public Notice # 19, Comment Sought on the Role of the Universal Service Fund and Intercarrier Compensation in the National Broadband Plan, GN Docket Nos. 09-47, 09-51, and 09-137, DA 09-2419 (rel. Nov. 13, 2009). See, also, A National Broadband Plan for Our Future, Notice of Inquiry, 24 FCC Rcd 4342, ¶ 5 (2009). 5 See Om Malik, Who Wins: Verizon FiOS vs AT&T U-Verse, August 19, 2008, available at http://gigaom.com/2008/08/19/who-wins-verizon-fios-vs-att-u-verse/; “Verizon recently launched its FiOS TV and fiber-based broadband service in New York City, The New York Times is taking stock of the service, which seems to be doing well. Verizon’s $23 billion investment into FiOS wasn’t viewed kindly, and Wall Street viewed AT&T’s cheaper U-Verse plan as more practical and affordable. Despite such early shellacking on Wall Street, the company’s decision to go with the more expensive fiber is proving to be smarter, even though it is still not clear if (and when) Verizon is going to start making big money on its bet . . .” See also, Saul Hansell, A bear Speaks: Why Verizon’s Pricey FiOS Bet Won’t Pay Off, August 19, 2008, available at http://bits.blogs.nytimes.com/2008/08/19/a-bear-speaks-why-verizons-pricey-fios-bet-wont-pay-off/?pagemode=print; citing Sanford C. Bernstein analyst Craig Moffett, “Mr. Moffett has tried to figure out all the money Verizon will spend building and selling FiOS, the interest it pays on the money it borrowed to pay for it, the savings because the new system is cheaper to maintain and all the fees its customers will pay. He compares this to what he figures Verizon would have earned had it not built FiOS. Add up all the figures and discount it to present value and Mr. Moffett figures that FiOS puts Verizon some $6 billion behind.”
THE FINANCIAL MARKETS ARE NOT FACTORING ANY POLICY-RELATED RISK INTO BROADBAND NETWORK COMMITMENTS TODAY. THE REASON IS THAT THE FCC AND CONGRESS HAVE MAINTAINED POLICIES THAT, IN TERMS OF ADVANCED NETWORKS AND BROADBAND, ENSURED THAT THE COMPETITIVE MARKETS WOULD BE DETERMINATIVE OF THE OUTCOMES.
Attachment No. 3 IURC Cause No. 45064
Indiana Exchange Carrier Association, Inc. Page 4 of 7
Attachment B

B&W believes that the financial markets are not factoring any policy-related risk into broadband network commitments today. The reason is that the FCC and Congress have maintained policies that, in terms of advanced networks and broadband, ensured that the competitive markets would be determinative of the outcomes. Further, investors have seen that there are no meaningful signs that anti-competitive or discriminatory behavior is a real threat to consumers. From a financial point of view, then, investors view network-based companies as relatively free to compete effectively while attempting to generate appropriate returns on very high levels of capital investment.
What will investors think about Principle 5, which adds some undefined limitations to a network provider’s potential return on investment? B&W suggests that investors, at least initially, will focus on three simple conclusions. First, government is adding regulatory constraints on an industry (Internet and broadband) where there was light regulation previously. Adopting regulatory principles that potentially reduce returns on previously invested capital will be viewed by the financial markets as the government changing the rules in the course of the game. As such, investors’ will estimate that regulatory risk and uncertainty in the industry are greater. Second, once government begins to regulate more actively, Wall Street will assume the probabilities are higher still that more regulation will be forthcoming. Third, because there is elevated regulatory risk and uncertainty regarding operations, investors will require more certitude to commit capital for investment (slowing incremental investment) and/or higher returns to reflect the perceived risks. For carriers serving rural areas where capital costs and operating costs are particularly high, access to external capital at reasonable terms is particularly important in order to continue advancing the policy goal of universal broadband availability for the benefit of customers.
As such, there is real risk that unnecessary controls on network investment could commoditize network services, reduce expected returns on investment, and choke the critical capital formation process.
POLICY CHALLENGE IS TO CREATE INV ESTMENT INC ENTIVES AND AVOID UNNEC ESSARY DISINC ENTIV ES Most recent national conversations regarding broadband networks concern the creation of incentives for more infrastructure upgrades. If the broadband network is in fact a critical component in assuring that America remains competitive in the Internet economy, the challenge for policymakers is to assure that a robust network infrastructure exists as widely as possible.
There are other concerns in terms of changing telecommunications regulations, intercarrier compensation regimes, and universal service funding. However, the migration toward robust and constantly evolving communications networks available in all markets—urban, suburban, and rural—appears to be the overriding policy imperative. And, to some extent, the challenge is even greater in more tenuously economic regions where policymakers are seeking more rapid and greater investment in the next years.
IF THE BROADBAND NETWORK IS IN FACT A CRITICAL COMPONENT IN ASSURING THAT AMERICA REMAINS COMPETITIVE IN THE INTERNET ECONOMY, THE CHALLENGE FOR POLICYMAKERS IS TO ASSURE THAT A ROBUST NETWORK INFRASTRUCTURE EXISTS AS WIDELY AS POSSIBLE.
Attachment No. 3 IURC Cause No. 45064
Indiana Exchange Carrier Association, Inc. Page 5 of 7
Attachment B

B&W believes that regulators and legislators have important roles in advancing policy outcomes, or in protecting against abuses, but the current challenge remains that investment capital should be properly channeled to expand and enhance broadband networks, and this will require a rigorous focus. Without a robust broadband infrastructure there is no Internet—open or closed.
B&W believes that the competitive markets are working effectively today in terms of capital commitments. As noted above, policy is not working everywhere and government likely will have to intervene in support of rural geographic areas where the economic case for investing in high-cost broadband network deployment and operations is tenuous or non-existent. Additionally, it is possible that policymakers should provide other incentives even in economically viable areas to speed the deployment and upgrade of services. However, there do not appear to be substantive examples of policy failure in the majority of the markets regarding discriminatory handling of traffic.
It might also be pointed out that it is an affirmative policy initiative to continue applying a “light hand” to regulation of the Internet as there remain important uncertainties about the kind of network that will be required for the future, about the consumer demand for various kinds of products, about the technology platform that will provide the best foundation for evolution, and so on. It might also be argued that it is a bad policy to create uncertainties where no problems actually exist. B&W believes that the appropriate policy approach today should be to provide incentives and avoid disincentives that might raise meaningful concerns among investors about unnecessarily constrained returns.
SOLUTIONS FOR PROBLEMS THAT MAY NOT BE REAL An important related debate surrounds the relative merit of post facto versus ex ante definitions of policy; that is, whether regulatory rules should anticipate potential problems before they develop or whether policy should wait and address specific abuses that consumers or firms are actually encountering in the market. The question is particularly apropos when there appear to be already-powerful market forces that provide protections for consumers in an environment that is changing rapidly.
In response, some policymakers might ask whether failing to adopt Principle 5 means that network companies will be permitted to engage in anti-competitive or discriminatory behavior. The answer is that anti-competitive behavior generally occurs when a carrier or company has dominant market power. In this case, it appears that no such power is possible in today’s communications markets, and it seems that there are sufficient substitute technologies and competitors to discipline any such behavior on the part of network operators. Investors appear to believe that this is the case, as they are requiring relatively higher returns on their investment due to higher capital risk and growing levels of competition. In fact, B&W knows of no stock price or debt security that reflects the potential that a single carrier or industry will be able to control or dominate the broadband access services market.
NO STOCK PRICE OR DEBT SECURITY REFLECTS THE POTENTIAL THAT A SINGLE CARRIER OR INDUSTRY WILL BE ABLE TO CONTROL OR DOMINATE THE BROADBAND ACCESS SERVICES MARKET.
Attachment No. 3 IURC Cause No. 45064
Indiana Exchange Carrier Association, Inc. Page 6 of 7
Attachment B

In the case of prophylactic regulation, then, adopting a fifth “network neutrality principle” in the absence of specific harmful behavior on the part of network owners will require policymakers to decide various issues based largely on speculations about the future, including the extent to which regulators should possibly intervene and impose traditional telephony-like regulatory controls on broadband networks. In a dynamic industry that is characterized by relentless improvements in technology and ever-increasing levels of competition, B&W believes that it is dangerous to speculate on how the industry will or should develop or how financial performance might evolve. A more appropriate approach is to allow competitive behaviors to unfold in response to market forces. If harmful discriminatory or anti-competitive actions by network owners should develop in the future, targeted solutions can be crafted to address those specific problematic behaviors. However, until those problems become real, it is unnecessary and risky to attempt to develop speculative solutions such as Principle 5 that ultimately may cause more harm than they deter.
SUMMARY The core insight of this paper is based on the financial “reality” that appropriate incentives and return opportunities are necessary for every “layer” of the Internet, if such segregation into layers is sensible at all. Most notably, because the risk is so great at the “physical layer” — huge capital commitments (particularly in lower density, higher cost rural areas), potential for stranded investment, rapid technological changes, competitive last-mile networks (wireless, cable, etc.) — the business case for ongoing broadband investment likely will require rigorous protection of the opportunity for meaningful and sustainable returns.
B&W believes that the financial realities of the business and capital formation process remain critical in framing policy outcomes. Public policy is a construct that supports and provides incentives in accomplishing socially beneficial goals — and that construct must abide by the financial realities that ultimately determine whether or not companies successfully can achieve desired policy goals.
PUBLIC POLICY IS A CONSTRUCT THAT SUPPORTS AND PROVIDES INCENTIVES IN ACCOMPLISHING SOCIALLY BENEFICIAL GOALS — AND THAT CONSTRUCT MUST ABIDE BY THE FINANCIAL REALITIES THAT ULTIMATELY DETERMINE WHETHER OR NOT COMPANIES SUCCESSFULLY CAN ACHIEVE DESIRED POLICY GOALS.
Attachment No. 3 IURC Cause No. 45064
Indiana Exchange Carrier Association, Inc. Page 7 of 7
Attachment B
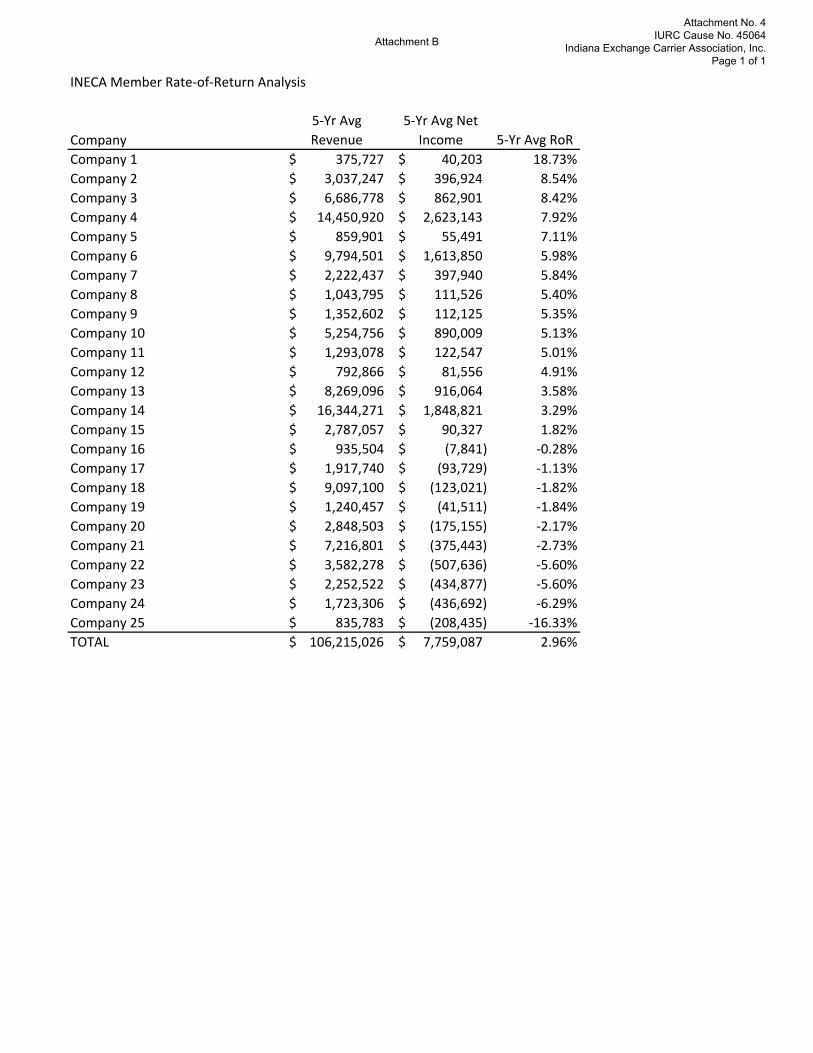
INECA Member Rate‐of‐Return Analysis
Company
5‐Yr Avg
Revenue
5‐Yr Avg Net
Income 5‐Yr Avg RoR
Company 1 375,727$ 40,203$ 18.73%
Company 2 3,037,247$ 396,924$ 8.54%
Company 3 6,686,778$ 862,901$ 8.42%
Company 4 14,450,920$ 2,623,143$ 7.92%
Company 5 859,901$ 55,491$ 7.11%
Company 6 9,794,501$ 1,613,850$ 5.98%
Company 7 2,222,437$ 397,940$ 5.84%
Company 8 1,043,795$ 111,526$ 5.40%
Company 9 1,352,602$ 112,125$ 5.35%
Company 10 5,254,756$ 890,009$ 5.13%
Company 11 1,293,078$ 122,547$ 5.01%
Company 12 792,866$ 81,556$ 4.91%
Company 13 8,269,096$ 916,064$ 3.58%
Company 14 16,344,271$ 1,848,821$ 3.29%
Company 15 2,787,057$ 90,327$ 1.82%
Company 16 935,504$ (7,841)$ ‐0.28%
Company 17 1,917,740$ (93,729)$ ‐1.13%
Company 18 9,097,100$ (123,021)$ ‐1.82%
Company 19 1,240,457$ (41,511)$ ‐1.84%
Company 20 2,848,503$ (175,155)$ ‐2.17%
Company 21 7,216,801$ (375,443)$ ‐2.73%
Company 22 3,582,278$ (507,636)$ ‐5.60%
Company 23 2,252,522$ (434,877)$ ‐5.60%
Company 24 1,723,306$ (436,692)$ ‐6.29%
Company 25 835,783$ (208,435)$ ‐16.33%
TOTAL 106,215,026$ 7,759,087$ 2.96%
Attachment No. 4 IURC Cause No. 45064
Indiana Exchange Carrier Association, Inc. Page 1 of 1
Attachment B
INDIANA REPORT ON BROADBAND PROGRESS
2018Attachment C

“Today, high-speed Internet access (or broadband) is critical to economic opportunity, job creation, and civic engagement.”
FCC CHAIRMAN Ajit Pai
A Note About This Data
Since 2014 the FCC has collected Form 477 data from every broadband provider in the country. Providers are required to report broadband speeds and technology for each census block in which they offer service. This “IBTA Report on Broadband Progress” utilizes that data, as well as information from FCC annual broadband reports. Information from more than one hundred Indiana telecommunications providers are included in these maps and charts.
Form 477 data is filed twice a year. Data accurate as of June 30 is filed in September. Data accurate as of December 31 is filed in March. The FCC usually releases the data six to ten months after it is filed. For example, this “IBTA Report on Broadband Progress” was completed in December 2017, using data that was filed in March 2017, but not made available until November 2017. Accordingly, this report utilizes the most up-to-date Form 477 information available.
2
Attachment C

Indiana has long been a leader in telecommunications, and one reason for that has been the common-sense regulatory approach established by the General Assembly and the Utility Regulatory Commission. Policy-makers and regulators, especially in recent years, have understood how a light-touch regulatory environment can foster innovation and investment.
IBTA members are seizing that opportunity by investing in networks that serve this state. Today, more than 90% of Hoosiers have access to 10 Mbps speeds or better. When the FCC released their sixth Broadband Deployment Report in 2010, it noted that only 14% of Indiana connections were capable of those speeds.
The Indiana approach is working, and the maps and charts in this report are evidence of that. The Indiana Broadband and Technology Association looks forward to continuing to work with our state leaders to ensure that Indiana continues to be served with the best in modern broadband services.
There’s no doubt that broadband access is critical to our modern world. And IBTA member companies are proud to be in the business of bringing that access to the families and businesses of Indiana.
For more than a hundred years, telecommunications firms have been investing in the Hoosier state. These investments have transitioned our technologies from hand-cranked magneto phones, operator-assisted calling, and party lines, to world-class fiber and wireless services. Long distance calls and internet searches can zip across the globe with a speed and quality that were impossible to fathom not all that long ago. The history of the telecom industry in our state is one of investment and improvement.
We know the job isn’t done, of course. Consumers have increasing demands for faster and faster broadband speeds. New and evolving applications in telemedicine, advanced manufacturing, agriculture and the Internet of Things (IoT) will require incredible speed and quality. It will take significant investment and continued leadership from our elected officials to meet the needs of Indiana. IBTA members are up to the challenge, just as they have been for more than a century.
Bill SoardsIBTA CHAIRMAN
John KoppinIBTA PRESIDENT
3
Attachment C
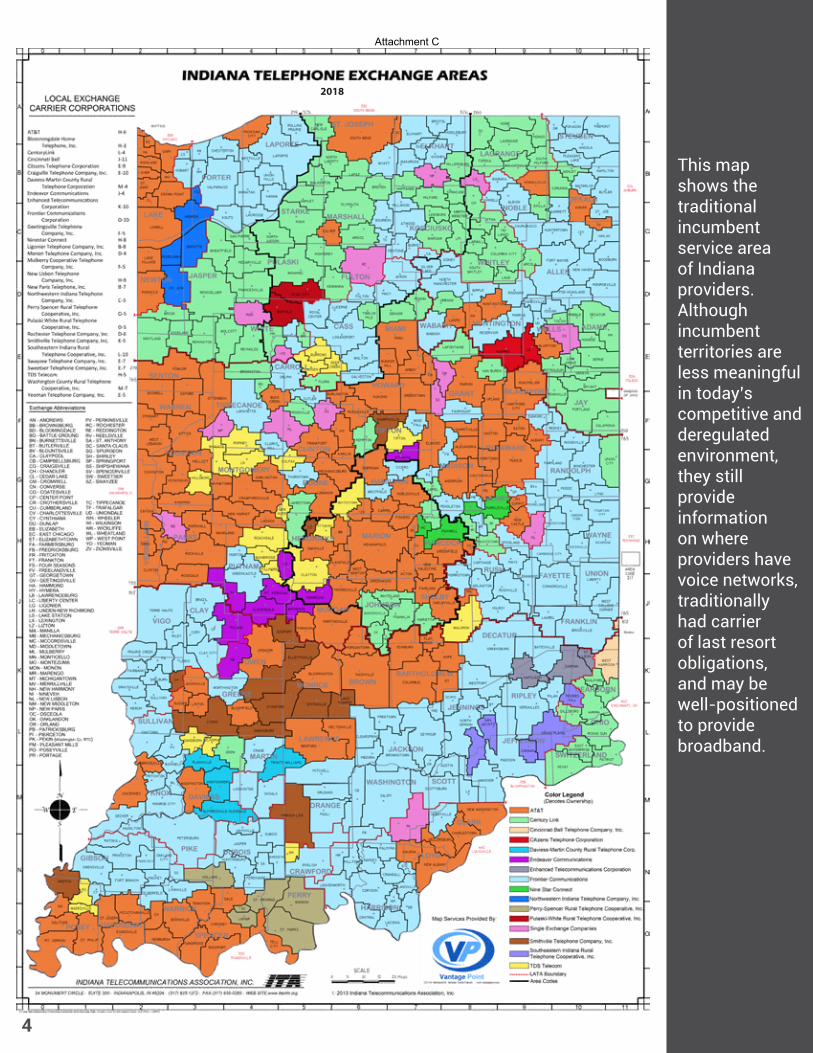
This map shows the traditional incumbent service area of Indiana providers. Although incumbent territories are less meaningful in today’s competitive and deregulated environment, they still provide information on where providers have voice networks, traditionally had carrier of last resort obligations, and may be well-positioned to provide broadband.
4
2018
Attachment C

The chart below lists the more than one hundred telecommunication providers who have broadband facilities within Indiana. Several dozen provide residential service at 10 Mbps or better, with others serving business customers or other telecommunications providers.
ProviderMax Reported
Residential Speed (Mbps)
Max Reported Business
Speed (Mbps)
Indiana Census Blocks Served (#)
Indiana Census Blocks
Served (%)
Access One 0 3 6 0%
Acme Communications 120 120 28,559 11%
Advanced Integrated Technologies 0 3 1 0%
Agile Network Builders 0 100 320 0%
AgPro Wireless 30 0 1,614 1%
Alliance Internet Communications 20 0 9 0%
Alpheus Data Services 0 50 1 0%
ALTIUS Communications 10 0 2,276 1%
APX Net 0 100 11 0%
Asset Black 0 100 1 0%
AT&T Services 1000 0 151,207 57%
Auburn Essential Services 100 1000 706 0%
Avenue Broadband, NewWave 100 0 7,815 3%
Big Sandy Telecom 50 50 3 0%
Birch Communications 6 300 105 0%
Bloomingdale Home Telephone Company 100 100 184 0%
Blu Sky Wireless 25 25 108 0%
Blueriver Networking Services 10 0 697 0%
BroadRiver Communication Corporation 0 100 1 0%
Broadview Networks Holdings 0 1.5 1 0%
BullsEye Telecom 0 1.5 4 0%
Call One 0 1.5 1 0%
Central Indiana Communications 1000 1000 1,941 1%
CenturyLink 100 0 22,620 8%
Charter Communications 300 1000 32,362 12%
Cincinnati Bell Any Distance 0 0 2 0%
Cincinnati Bell Telephone Company 1000 0 267 0%
Citizens Communications 100 0 6,592 2%
Citizens Telephone 100 100 584 0%
Clay County Rural Telephone Cooperative 1000 1000 2,089 1%
CMN-RUS 1000 1000 9,840 4%
Cogent Communications Group 0 1000 15 0%
Colo Telephone Company 25 25 1 0%
Comcast Cable 987 0 88,981 33%
Community Fiber Solutions 50 50 3,775 1%
Compudyne 0 30 1 0%
Comteck of Indiana 50 50 223 0%
Convergence Technologies 0 20 31 0%
Craigville Telephone Company 1000 0 511 0%
Crossroads Broadband 3 0 12 0%
Cyber Broadcasting 30 0 45 0%
Daviess-Martin County Rural Telephone 13 13 1,442 1%
DMCI Broadband 15 20 558 0%
DoveTel Communications 0 20 1 0%5
Attachment C

ProviderMax Reported
Residential Speed (Mbps)
Max Reported Business
Speed (Mbps)
Indiana Census Blocks Served (#)
Indiana Census Blocks
Served (%)
EarthLink Business 0 100 1,025 0%
Eastern Indiana WIFI 300 102 281 0%
Essex Telcom 75 1000 7,577 3%
Everstream GLC Holding Company 0 1000 3 0%
eVolve Business Solutions 0 0 269 0%
FBN Indiana 100 1000 7,449 3%
First Communications 0 150 19 0%
Fourway Computer Products 25 100 85 0%
Frontier Communications Corporation 30 0 130,558 49%
Gallatin County Fiscal Court 8 5 7 0%
Global Capacity 6 45 425 0%
Geetingsville Telephone Co. 100 100 409 0%
Gtek Computers & Wireless 4 0 2 0%
Lightbound 0 1000 117 0%
iLOKA, NewCloud Networks 10 10 2 0%
Independents Fiber Network 0 1000 736 0%
Indiana Fiber Network 0 1000 73 0%
IP Global 0 20 1 0%
Joink 35 0 546 0%
KC Online 40 0 19 0%
King Street Wireless L.P. 1 0 61,384 23%
Lebanon Utilities 10 100 3,781 1%
Level 3 Communications 0 1000 1,424 1%
Lightower Fiber Networks I 0 1000 3,227 1%
Ligonier Telephone Co. 30 0 563 0%
LigTel 15 0 6,413 2%
LocaLoop 20 0 16 0%
McClure Services 0 0 7 0%
MCI Communications Corporation 0 750 715 0%
McLeodUSA Telecommunications 0 1000 1,784 1%
Mediacom Indiana 1000 0 8,489 3%
Mercury Wireless Indiana 7 7 36,205 14%
MetaLINK Technologies 25 25 6,853 3%
Metro Fibernet 1000 1000 9,840 4%
Midwest Connections 1000 1000 1,016 0%
Midwest Telecom of America 20 20 12,741 5%
Miles Communications 1000 1000 9,571 4%
Mobilcomm 5 0 778 0%
Monon Telephone Company 50 50 1,637 1%
Mulberry Cooperative Telephone Co. 10 10 396 0%
National Mobile Communications 0 0 1 0%
NetCarrier Telecom 0 1000 1 0%
NetFortris Acquisition Co. 0 1.5 8 0%
Network Services Solutions 0 45 5 0%
New LisbonTelephone 1000 0 2,622 1%
New Paris Telephone 8 1000 1,953 1%
New Paris Telephones Quality Cablevision 14 14 542 0%
NineStar Connect 1000 1000 867 0%
NLBC 100 100 4,039 2%
Northern Indiana Technologies 3 0 693 0%
6
Attachment C
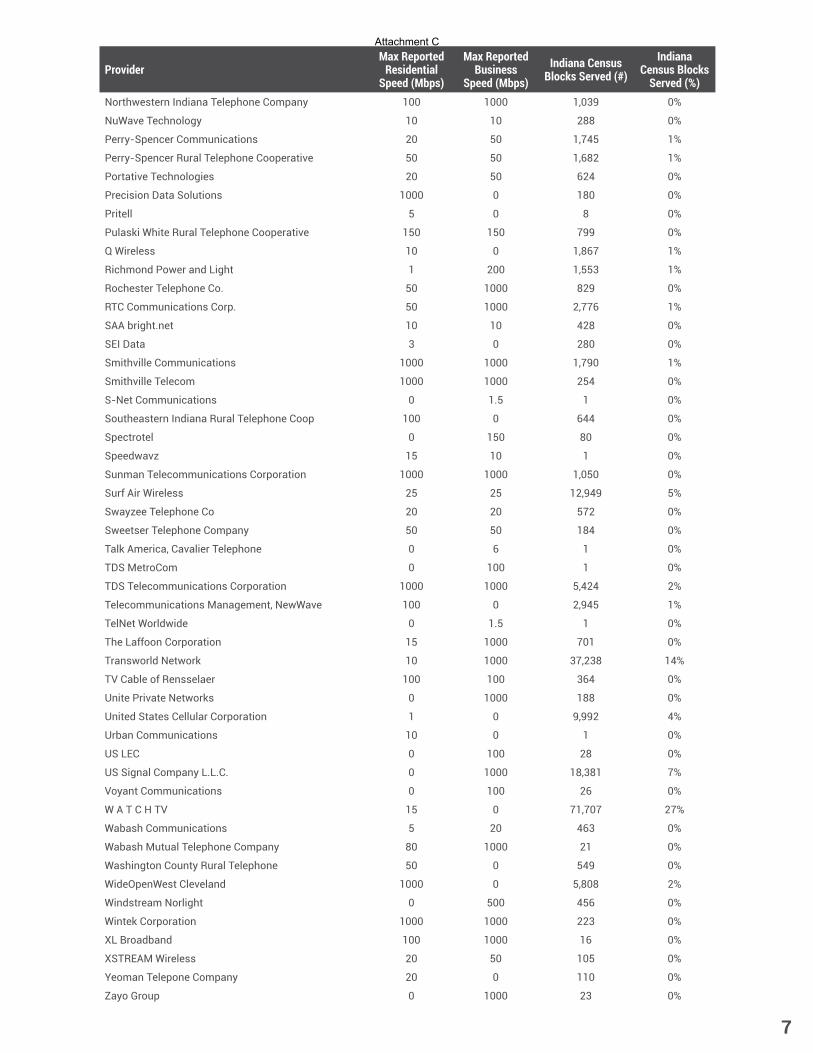
ProviderMax Reported
Residential Speed (Mbps)
Max Reported Business
Speed (Mbps)
Indiana Census Blocks Served (#)
Indiana Census Blocks
Served (%)Northwestern Indiana Telephone Company 100 1000 1,039 0%
NuWave Technology 10 10 288 0%
Perry-Spencer Communications 20 50 1,745 1%
Perry-Spencer Rural Telephone Cooperative 50 50 1,682 1%
Portative Technologies 20 50 624 0%
Precision Data Solutions 1000 0 180 0%
Pritell 5 0 8 0%
Pulaski White Rural Telephone Cooperative 150 150 799 0%
Q Wireless 10 0 1,867 1%
Richmond Power and Light 1 200 1,553 1%
Rochester Telephone Co. 50 1000 829 0%
RTC Communications Corp. 50 1000 2,776 1%
SAA bright.net 10 10 428 0%
SEI Data 3 0 280 0%
Smithville Communications 1000 1000 1,790 1%
Smithville Telecom 1000 1000 254 0%
S-Net Communications 0 1.5 1 0%
Southeastern Indiana Rural Telephone Coop 100 0 644 0%
Spectrotel 0 150 80 0%
Speedwavz 15 10 1 0%
Sunman Telecommunications Corporation 1000 1000 1,050 0%
Surf Air Wireless 25 25 12,949 5%
Swayzee Telephone Co 20 20 572 0%
Sweetser Telephone Company 50 50 184 0%
Talk America, Cavalier Telephone 0 6 1 0%
TDS MetroCom 0 100 1 0%
TDS Telecommunications Corporation 1000 1000 5,424 2%
Telecommunications Management, NewWave 100 0 2,945 1%
TelNet Worldwide 0 1.5 1 0%
The Laffoon Corporation 15 1000 701 0%
Transworld Network 10 1000 37,238 14%
TV Cable of Rensselaer 100 100 364 0%
Unite Private Networks 0 1000 188 0%
United States Cellular Corporation 1 0 9,992 4%
Urban Communications 10 0 1 0%
US LEC 0 100 28 0%
US Signal Company L.L.C. 0 1000 18,381 7%
Voyant Communications 0 100 26 0%
W A T C H TV 15 0 71,707 27%
Wabash Communications 5 20 463 0%
Wabash Mutual Telephone Company 80 1000 21 0%
Washington County Rural Telephone 50 0 549 0%
WideOpenWest Cleveland 1000 0 5,808 2%
Windstream Norlight 0 500 456 0%
Wintek Corporation 1000 1000 223 0%
XL Broadband 100 1000 16 0%
XSTREAM Wireless 20 50 105 0%
Yeoman Telepone Company 20 0 110 0%
Zayo Group 0 1000 23 0%
7
Attachment C

>=1<3 Mbps
>=3<10 Mbps
>=10<25 Mbps
>=25 Mbps
IN Broadband DOWNLOAD
Dec 2016
Three-quarters of Indiana geographically is covered with download speeds of 10 Mbps or better (shown in green and yellow). The populated areas of the state are generally well-served, and more than 86% of Indiana residents have access to broadband speeds of 25 Mbps or better, according to www.broadbandnow.com.
8
Attachment C
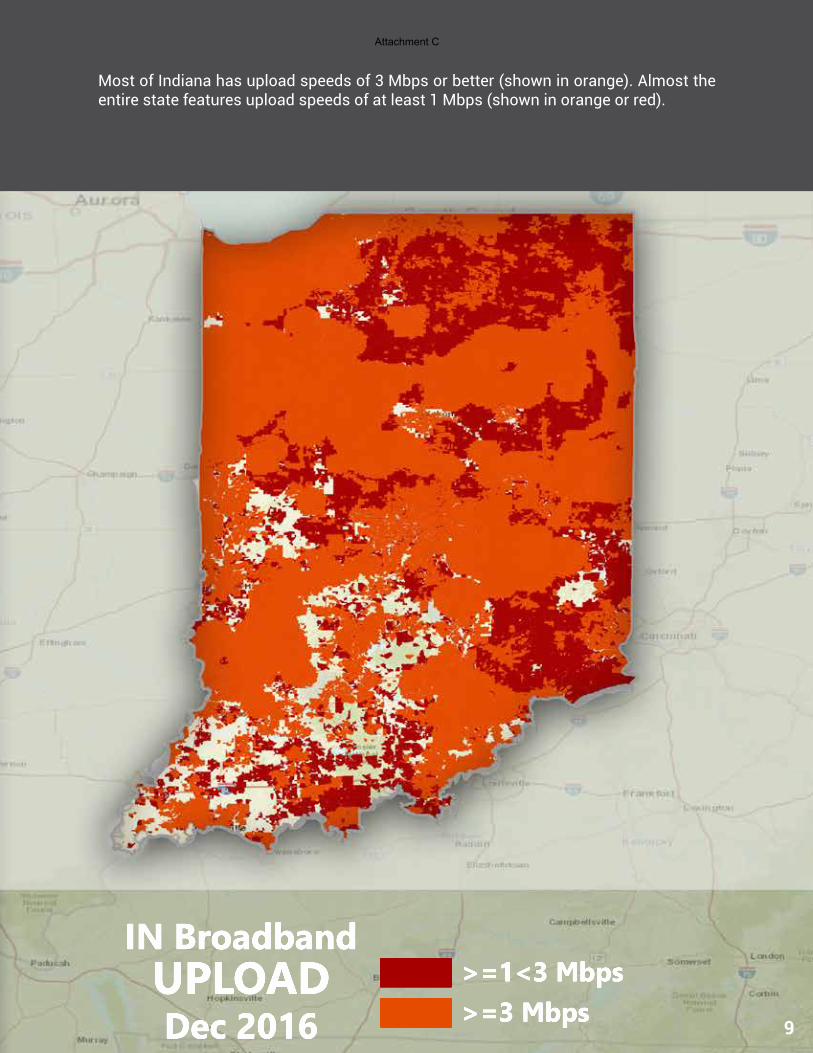
>=1<3 Mbps
>=3 Mbps
IN Broadband UPLOADDec 2016
Most of Indiana has upload speeds of 3 Mbps or better (shown in orange). Almost the entire state features upload speeds of at least 1 Mbps (shown in orange or red).
9
Attachment C
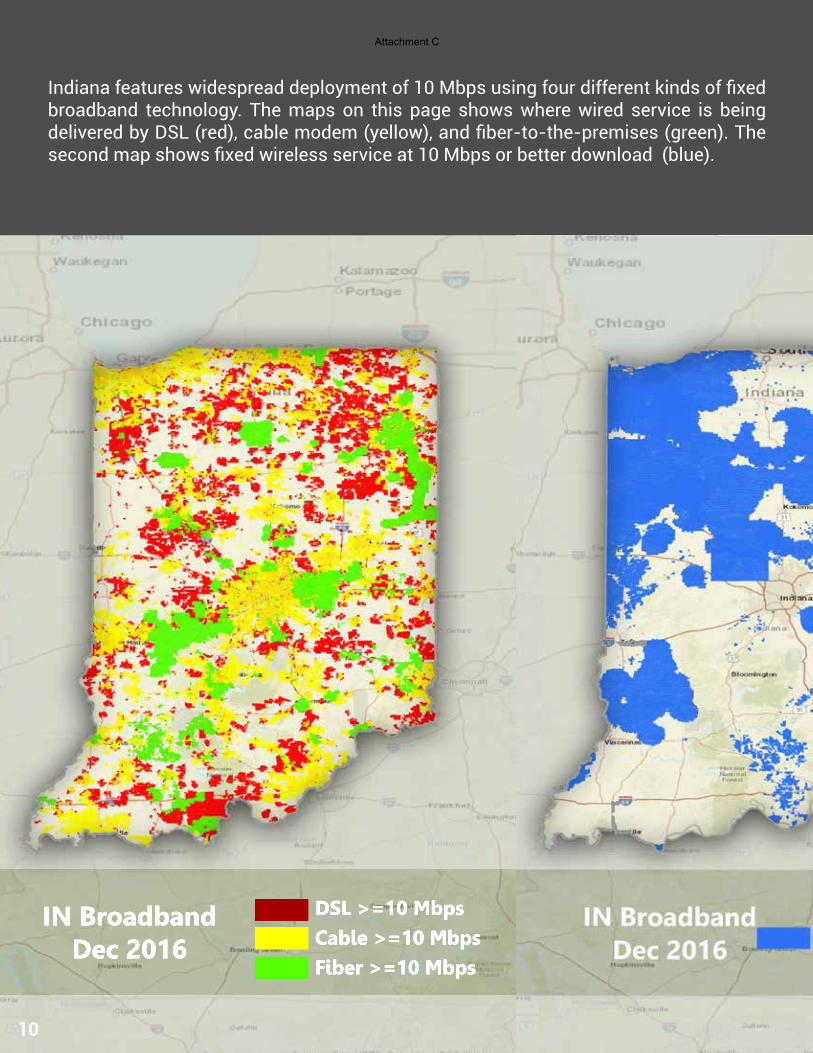
DSL >=10 Mbps
Cable >=10 Mbps
Fiber >=10 Mbps
IN Broadband Dec 2016
Indiana features widespread deployment of 10 Mbps using four different kinds of fixed broadband technology. The maps on this page shows where wired service is being delivered by DSL (red), cable modem (yellow), and fiber-to-the-premises (green). The second map shows fixed wireless service at 10 Mbps or better download (blue).
10
kf
Sorner ... �t Lot1don
Corbin
• P CJ, pl\i1aprry n
Attachment C

Access to 10 Mbps in Indiana has increased dramatically in recent years. As noted earlier, today, more than 90% of Hoosiers have access to 10 Mbps speeds or better. When the FCC released their sixth Broadband Deployment Report in 2010, it noted that only 14% of Indiana connections were capable of those speeds.
In 2008
14%of Hoosiers had access to 10 Mbps
In 2016
91%of Hoosiers had access to 10 Mbps
11
kf
Sorner ... �t Lot1don
Corbin
• P CJ, pl\i1aprry n
Attachment C

>=10 MbpsIN Broadband Dec 2014
Substantial network investment has helped improve Indiana broadband access over the last two years, especially in northern and southwestern Indiana. The FCC didn’t require filing of Form 477 data of broadband speeds at the census block level until December 2014, and that data is mapped on this page to show baseline access to 10/1 Mbps.
Access to 10 Mbps
Indiana Square Miles Served (#)
Indiana Square Miles Served (%)
Dec 2014 20,221 56%Dec 2016 26,767 73%Increase 6,546 18%
12
Attachment C

>=10 MbpsIN Broadband Dec 2016
This map shows the most recent publicly-available 10 Mbps data.
Access to 10 Mbps
Indiana Square Miles Served (#)
Indiana Square Miles Served (%)
Dec 2014 20,221 56%Dec 2016 26,767 73%Increase 6,546 18%
13
Attachment C

Indiana’s high-speed connectivity stacks up well to other states in the region, with access to 1 Gbps service and access to fiber-optic service that is better than what is found in a number of neighboring states.
Access to 25 Mbps or better
Indiana 86%Illinois 92%Ohio 92%Kentucky 88%Michigan 88%
Access to 1 Gbps or better
Indiana 8%Illinois 4%Ohio 9%Kentucky 13%Michigan 6%
Access toFiber-Optic Service
Indiana 17%Illinois 5%Ohio 12%Kentucky 18%Michigan 7%
14
Attachment C
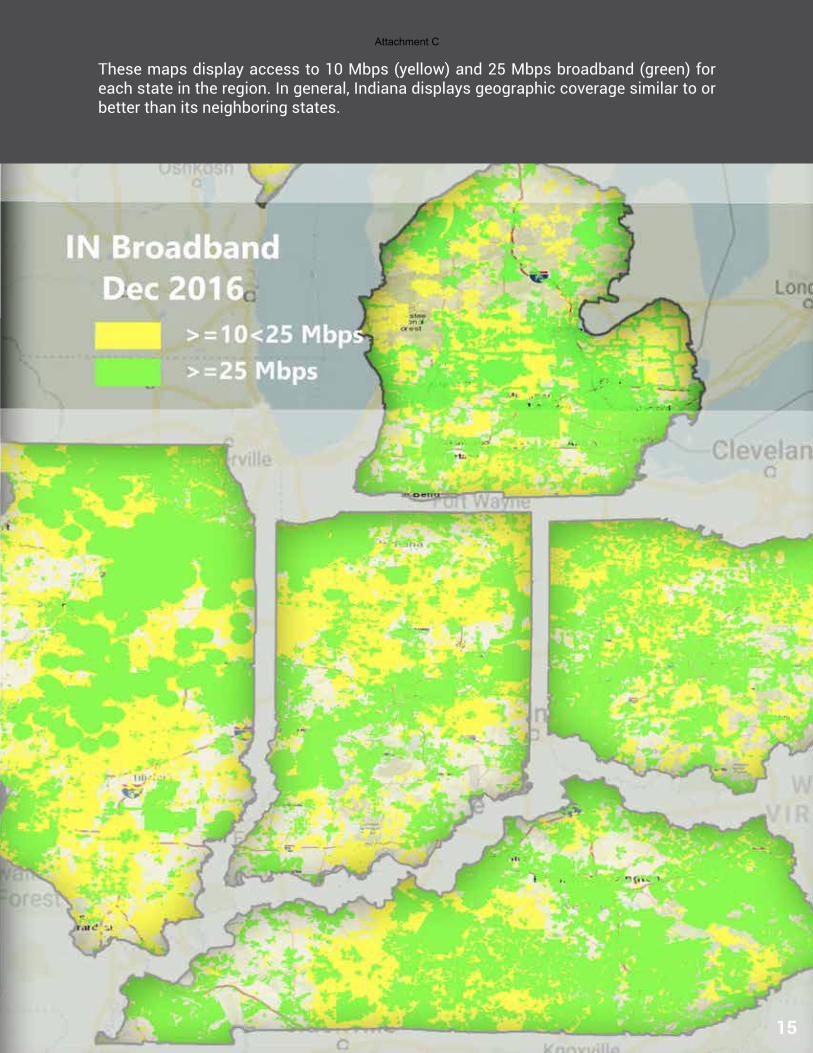
s, These maps display access to 10 Mbps (yellow) and 25 Mbps broadband (green) for each state in the region. In general, Indiana displays geographic coverage similar to or better than its neighboring states.
15
Attachment C
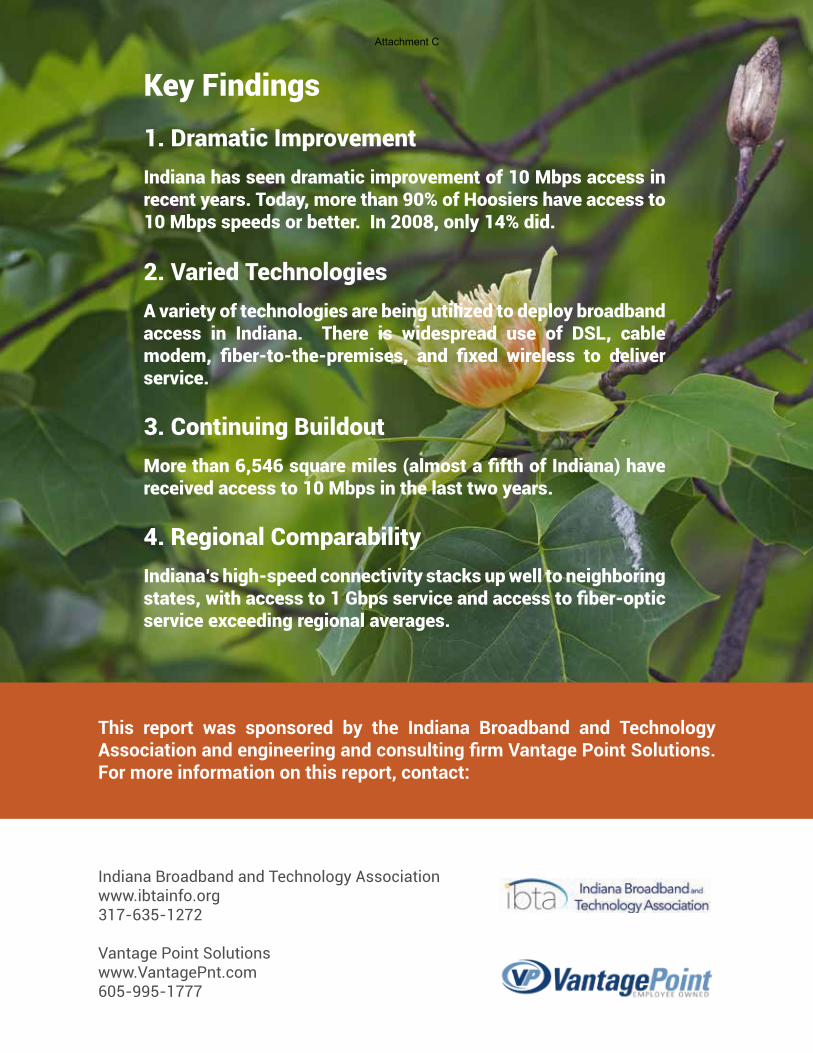
Indiana Broadband and Technology Associationwww.ibtainfo.org317-635-1272
Vantage Point Solutionswww.VantagePnt.com605-995-1777
This report was sponsored by the Indiana Broadband and Technology Association and engineering and consulting firm Vantage Point Solutions. For more information on this report, contact:
Key Findings1. Dramatic Improvement Indiana has seen dramatic improvement of 10 Mbps access in recent years. Today, more than 90% of Hoosiers have access to 10 Mbps speeds or better. In 2008, only 14% did.
2. Varied Technologies A variety of technologies are being utilized to deploy broadband access in Indiana. There is widespread use of DSL, cable modem, fiber-to-the-premises, and fixed wireless to deliver service.
3. Continuing Buildout More than 6,546 square miles (almost a fifth of Indiana) have received access to 10 Mbps in the last two years.
4. Regional Comparability
Indiana’s high-speed connectivity stacks up well to neighboring states, with access to 1 Gbps service and access to fiber-optic service exceeding regional averages.
Attachment C

JANUARY 2018
Deploying a Broadband Network – From Start to Finish (and Beyond)
Attachment D

2
Table of Contents
1 Executive Overview ............................................................................................................... 3
2 Network Deployment Steps ................................................................................................... 4
3 Business Planning ................................................................................................................. 5
3.1 Market Analysis ................................................................................................................. 5
3.2 Competition Analysis ......................................................................................................... 5
3.3 Determine Network Required to Deliver Services ............................................................. 6
3.4 Develop Preliminary Schedules and Budgets ................................................................... 7
4 Financing ............................................................................................................................... 8
4.1 Evaluation of Funding Sources ......................................................................................... 8
4.2 Feasibility Study and Financing Application ...................................................................... 8
4.3 Post Financing Award ....................................................................................................... 9
5 Design and Engineering ...................................................................................................... 10
5.1 Design ............................................................................................................................. 10
5.2 Engineering ..................................................................................................................... 12
6 Construction ......................................................................................................................... 17
6.1 Outside Plant ................................................................................................................... 17
6.2 Inside Plant ..................................................................................................................... 19
6.3 Quality Assurance / Quality Control ................................................................................ 19
6.4 Turn-over Coordination ................................................................................................... 20
6.5 Customer Location Construction ..................................................................................... 20
7 Operations and Management .............................................................................................. 21
7.1 Operations ....................................................................................................................... 21
7.2 Support Systems ............................................................................................................. 22
Appendices ................................................................................................................................. 23
Appendix A – Business Plan Examples .................................................................................. 24
Appendix B – Design and Engineering Examples ................................................................... 29
Appendix C - Construction Examples ...................................................................................... 38
Attachment D

3
1 Executive Overview Building a broadband network is a time-consuming, capital-intensive endeavor, which requires a considerable amount of planning and analysis to be successful. To be successful, a broadband network must be able to meet the customer's demands both today and into the future. Much of the investment in a broadband network is used to install elements that have economic lives of 30 years or longer, a term for which it can be difficult – if not impossible – to accurately predict customer demands over the life of the network. Long-term capital investments such as this can therefore be very risky ventures for the broadband provider and their investors.
The risk is significantly greater still in rural areas where the cost to construct to any given customer is much higher than urban areas. The lower population densities in the rural areas require the provider to make much larger investments in infrastructure and incur more expense associated with environmental permitting processes. The low customer density and large geographies of rural areas also result in higher operational costs as well.
There are a variety of network architectures being used today to deliver broadband, but nearly all providers understand that fiber provides the best broadband capabilities both immediately and over the longer term. Wireline networks are most commonly based on copper cables, such as coaxial or twisted pair, which struggle to keep up with the rapidly increasing broadband demands. As these copper networks reach the end of their useful lives, it is common for the copper cables to be replaced with fiber.
Like wireline copper networks, many wireless networks also struggle to deliver adequate broadband speeds because of limited spectrum availability, environmental effects, or over-loading. To minimize these broadband bottlenecks, wireless and wireline providers alike are replacing large portions of their networks with fiber.
It is costly to deploy a broadband network even in ideal conditions. However, there are many local factors and customer demographics that can dramatically increase the costs. Customer density is one of the largest contributors to network costs. There is often no business case to serve customers who live outside areas with customer densities less than what is typical for a town customer. In rural areas that surround larger metropolitan areas, the broadband provider may be able to justify serving the rural customers by cost averaging the lower cost town customers with the higher cost rural customers. However, in some rural areas, the towns themselves are too small to have enough lower cost customers to make the rural areas economical to serve. In these instances, even where capital to build is on hand or otherwise in theory available, the provider must rely on mechanisms such as Universal Service Funding to make a business case to serve the rural customers.
Deploying a broadband network is a very capital-intensive undertaking, regardless if it is in a greenfield environment or when replacing an existing network. The extensive planning, long construction timeframes, and the coordination of approvals and permits from various regulatory, government and private entities add to the complexity and cost. The intent of this document is to give a brief overview of the process often needed to deploy a broadband network. This document is not intended to be exhaustive, since there are often local or regional rules and regulations that impact deployment costs and increase timeframes. This document will overview the processes common to nearly all deployments, focusing on the initial deployment but also covering some aspects of the operational expense and complexity introduced once the network is built.
Attachment D
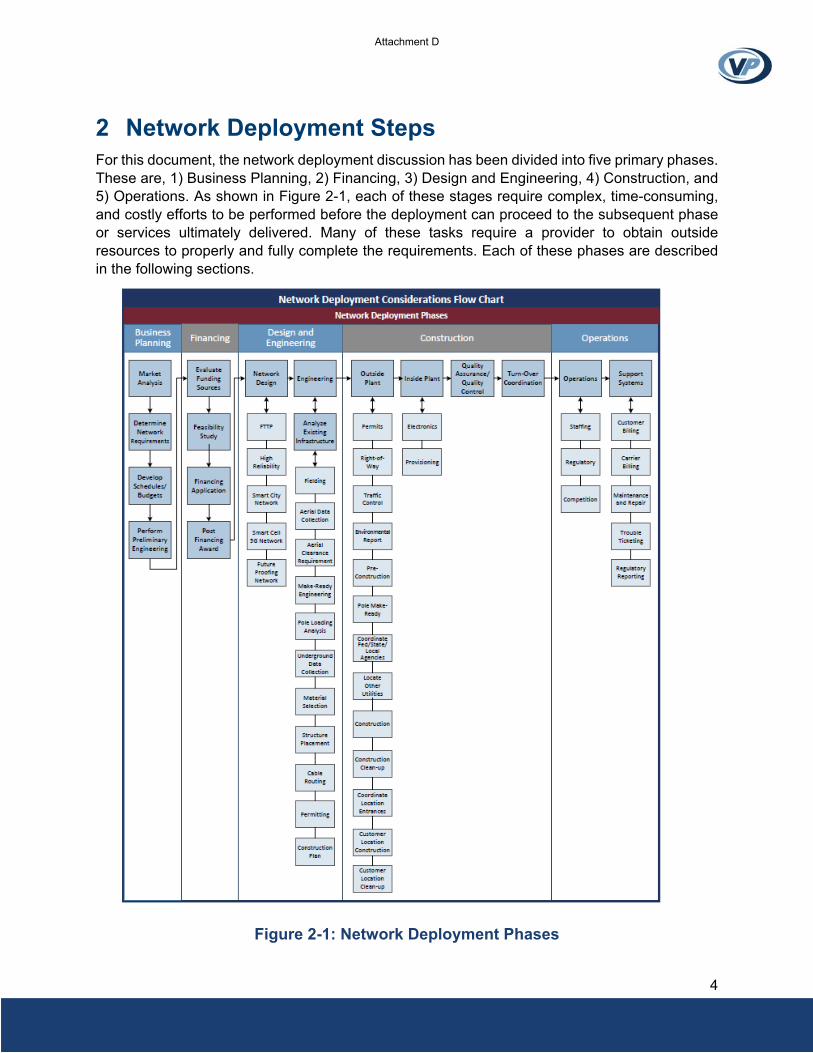
4
2 Network Deployment Steps For this document, the network deployment discussion has been divided into five primary phases. These are, 1) Business Planning, 2) Financing, 3) Design and Engineering, 4) Construction, and 5) Operations. As shown in Figure 2-1, each of these stages require complex, time-consuming, and costly efforts to be performed before the deployment can proceed to the subsequent phase or services ultimately delivered. Many of these tasks require a provider to obtain outside resources to properly and fully complete the requirements. Each of these phases are described in the following sections.
Figure 2-1: Network Deployment Phases
Attachment D

5
3 Business Planning The initial step of a network deployment is the business planning phase. The business planning determines the area to be built, the services to be offered, the deployment schedule, and the overall project budget. The business planning requires a significant amount of effort and research and often requires outside resources to perform surveys, market studies, and high-level technical studies for compiling estimated budgets and schedules.
Once a business plan has been developed, it is typically reviewed by the provider’s senior management, board of directors, business partners, and/or investors to decide whether to proceed with the project or not. A viable business plan is often a balance between the cost to deploy the broadband network along with anticipated upgrade costs and the expected revenues from customers and other sources that will provide at least some reasonable return and/or the ability to repay any debt.
3.1 Market Analysis When offering new services to existing customers or building a network outside of a service provider’s existing footprint, it is important to study the demographics and needs of the potential customers. To determine market demand and penetration rates, the provider must analyze the current wireline and wireless competition in the market. A detailed market analysis often includes a survey process to gather information from the potential customers to determine many key factors, such as:
Capabilities and product pricing of current service providers
Customer satisfaction with current service providers
Customer demand
Estimates of take rates
Pricing sensitivity
This process is time consuming and typically utilizes outside sources to make phone calls and conduct focus groups.
The market analysis may also include coordinating with the local governments to determine interest in Smart City-type applications and identify potential anchor institutions. This could include service to local institutions (schools, libraries, public safety and other government buildings), as well as sensors (street lights and traffic signals).
3.2 Competition Analysis Another item to consider when deploying a broadband network is determining the competitive environment in the areas being overbuilt. This step is often missed or only partially completed. In reviewing the market, a competitive analysis should be completed to determine how the service take rates may be impacted. In completing a competitive analysis, the main items to be considered consist of the following:
Attachment D
6
Identify the Incumbent Service Provider(s) – The incumbent could be a price cap carrier, a wireless carrier, and/or a cable provider. Research of the market should be completed to determine which carriers are currently providing service today.
Determine Presence of Competitive Providers – In addition to incumbent providers, determine if there are any competitive providers which may include both wireline/cable providers as well as wireless carriers.
Strength of Name Recognition – Having a strong name and/or brand recognition and being known for high quality service would carry over in to a new market. Customers’ perception of the services provided will have a significant impact on whether a new broadband provider will have a solid take rate and customer following.
Current Services and Rates – A review of what services are currently being offered to the market as well as the current rates being charged will be the precursor of the services and rates to be offered when deploying a new broadband network.
In addition, an assessment must be made regarding the incumbent’s ability and willingness to react to an additional competitor. Since building a competing network takes months or years of effort, the incumbent has the opportunity to upgrade its network if able and willing to do so, which could have impacts on the business plan.
3.3 Determine Network Required to Deliver Services Following the market analysis, the second element of business planning is to determine the network topologies that would support the services the customers desire. This is necessary for compiling high-level project cost estimates and schedules. The correct network may be a combination of more than one network technology to meet the needs of all types of users including residential, business, and anchor institutions.
Much planning goes into the network topology planning and requires engineering resources to perform preliminary designs and options, cost estimates and technical reports regarding the pros and cons of various options. The following are types of modern wireline networks that are often considered, although the processes and procedures outlined in this paper are not limited to such networks; most are equally applicable to other terrestrial networks, particularly when one considers again that even “wireless” networks are in most cases dependent upon increasing densification of cells and wired backhaul to handle current and future data needs. To use a colloquial phrase: Wireless needs wires.
Fiber to the Premises (FTTP) Network
Most broadband networks today, regardless if they are wireless or wireline, rely heavily on fiber optic cable. Most modern wireline networks are constructed entirely of fiber because it is the least expensive medium to deploy and operate measured over the life of the network assets and has the largest bandwidth capabilities as an initial matter and as a matter of scalability in the future. These wireline networks are generically referred to as Fiber-to-the-Premises (FTTP) networks. FTTP networks can be architected as either a shared or dedicated design depending on the service needs of subscribers.
The shared network architecture utilizes passive optical network (PON) topology. Optical splitters are utilized in the network to share the broadband capacity between groups of subscribers
Attachment D

7
(typically up to 32 subscribers). It is generally targeted to residential subscribers and small businesses that require up to 1 Gbps services, and has a cost advantage over a dedicated system because not every fiber has to “home run” back to an active equipment location, which results in fewer fibers and fewer fiber splices.
Some FTTP architectures rely on a dedicated fiber to each customer and often utilize Active Ethernet (AE) technology. This design implements a point-to-point architecture with dedicated fiber to serve residential and business customers. This means that each subscriber is served by a fiber strand that is dedicated from their premises back to the site where the distribution electronics are located. AE technology provides for speeds of 1 Gbps or more both upstream and downstream for each user. It is generally targeted to businesses and “power user” residential subscribers that require 1 Gbps or higher services, with 10 Gbps services planned for some areas.
Dedicated Circuit Services
While FTTP services are typically utilized for providing Internet service, some end users may request services to enable private transport connections between the sites. For example, this could be a large business with multiple sites. Carrier Ethernet technologies such as Ethernet Private Line (EPL) can be utilized to enable these private circuits between customer locations.
Custom Services
The network can also be designed to support a variety of Smart City services depending on the needs of the city. This could include supporting Smart City applications such as street light sensors, traffic sensors, cameras and connecting various city institutions. Depending on specific needs of the applications, the network could support dedicated dark fiber, private dedicated circuits, or broadband connections such as 1 Gbps or 10 Gbps, and be ready for 100 Gbps when demand requires.
Likewise, the network can also be designed to support Small Cell services depending on the needs of service providers. This could include dark fiber or broadband connections (such as 1 Gbps or 10 Gbps) to the Small Cell locations.
3.4 Develop Preliminary Schedules and Budgets A final step of the business planning phase is to determine preliminary project schedules and budgets. The project schedules may include a phased plan for how the network will be constructed over several years. The project phases could be determined by specific geographic areas based on ease of construction, customer density, or political or government factors, or based on expected penetration rates. Alternatively, the project phases could be determined by the prioritization of services that are being provided, such as residential and business.
Once the project phases are determined, budgetary estimates can be compiled for each of the phases of the projects. This would include outside plant, electronics, operations and maintenance budgets. Additionally, operations and maintenance budgets are compiled. This includes staff salary and benefits requirements for the provider’s various departments. It also includes areas such as vehicles, test equipment, billing systems, trouble ticket systems, and mapping systems.
Attachment D
8
4 Financing
4.1 Evaluation of Funding Sources Depending on the geographic location, the status of competition, and the types of services to be offered, there are several state and federal financing options in addition to private lending institutions that are typically evaluated as potential funding sources.
Several states have developed broadband grant programs to provide funds for broadband deployments in areas that are currently unserved or underserved. Minnesota and New York are a couple of examples of states that have recently offered broadband grant awards.
Additionally, federal grant and low interest loan programs are available through the USDA’s Rural Utilities Service (RUS). These include the Telecommunications Infrastructure, Farm Bill Broadband, and Community Connect programs.
These programs are often targeted to providing broadband to customers that meet specific criteria such as rurality of the serving area, currently available broadband speeds, number of competitors, and proposed service offerings that affect the eligibility of the specific proposed project. Therefore, considerable effort is required to understand the requirements of each program and to identify potential projects that satisfy the requirements.
In some areas, the cost to serve the customer is simply too great. The end user revenues needed to deploy and then support the network over time are beyond what the end user is willing or able to pay. In these instances, a business case cannot be made with a low interest loan (or even a federal, state, or local grant or the provider’s own cash on hand), and the provider must therefore rely upon outside sources of funding such as what is available through the Universal Service Funds (USF) to make the business case.
4.2 Feasibility Study and Financing Application Any external funding source will require some form of feasibility study to be provided. Depending on the program, it is likely that portions of the application may need to be developed and certified by a provider’s professional engineering firm and financial consultant.
These studies incorporate the budgets, market penetration, rates and service offering information from the business planning phase to develop a multi-year financial forecast. A financial forecast includes the capital costs and depreciation, balance sheet, operating revenues and expenses and cash flows for each future year. Sample feasibility study information is included in Appendix A. Some key financial statements in the feasibility study include:
Projected balance sheet
Projected income statement
Projected cash flow
Projected ROR on investment
Projected breakeven
Projected financing ratios (DSCR, Debt-to-Equity, TIER)
Attachment D

9
In addition to the feasibility study, there is a large amount of additional information that most financing applications require. This may include:
Company history
Management experience
Service plans and pricing
Marketing plan
Competition analysis
Network maps
Existing and proposed network descriptions
Demonstration of community support
Financial references
4.3 Post Financing Award Once a provider has been awarded financing, there is typically a large amount of reporting requirements and procedures that must be followed, including:
Construction progress reports
Periodic financial reports
Requests for reimbursement
Audit support
The financing entity may also have specific procedures that the provider must adhere to regarding how construction contracts are awarded. This may include utilizing the entity’s contract forms and obtaining approvals prior to the award of contracts.
Attachment D

10
5 Design and Engineering Assuming the business plan and financial studies look positive, the design and engineering of the network commences. This is a time- and labor-intensive phase in which detailed designs and engineering plans are developed. A detailed engineering plan requires extensive on-site surveys and research to develop construction maps. Licensed professional engineers are often engaged to ensure that the plans meet local, state, and national codes in addition to industry standards, as well as protect the public safety.
5.1 Design The overall design is based on delivering the services that were determined to be required in the business plan in the most cost-effective manner. Each of the service offerings require that specific network design needs be met.
Rural network designs are almost always more expensive on a per-subscriber basis than urban designs. It is not uncommon for the cost to serve a rural customer to be 4 or more times the cost to serve a town customer. The lower subscriber density of rural networks results in fewer subscribers over which to spread the network costs across. Additionally, rural network designs are unable to obtain the efficiencies of scale that can be achieved with urban networks. For example, a centralized electronics building in an urban network typically serves thousands of subscribers. This allows an urban provider to spread the building, back-up power, and other infrastructure elements across many subscribers. Rural networks typically must distribute their electronics across remote cabinets or huts that serve small numbers of subscribers. This is unavoidable and results in less efficiency in a rural network design.
Early in the design phase, aggregation sites must be identified. These are the primary locations of the electronics which directly serve the locations within the serving area, and all the local connections within the serving area must have a connection path back to an aggregation site. The aggregation site may serve as a co-location site for multiple entities that are utilizing the network to place their service electronics. The aggregation site may be a cabinet or a small building, or it may be located inside an existing building somewhere within the network footprint. Aggregation sites are typically placed in secure locations with 24/7 access and backup power capabilities. Some local codes may require that the aggregation sites be entirely underground or disguised as another type of building such as a house.
Next, the backbone fiber network that connects the various aggregation sites is designed. The backbone fiber network is typically deployed in ring architectures to provide network redundancy. To provide additional resiliency, backbone fiber typically enters the aggregation locations in two separate entrances and separation of the ring segments is maintained throughout the network. This allows for aggregation sites to remain connected in the event of a fiber cut, and for customers paying for ring protected services to maintain service during most network outage events.
Once the aggregation site and backbone fiber designs have been completed, the distribution networks, as described in the following sections, can be designed. The selection of the distribution architecture or combination of architectures affects the size of fiber cables and the amount and type of electronics that are required. Figure 5-1 depicts the various distribution network elements that are addressed in the design phase.
Attachment D
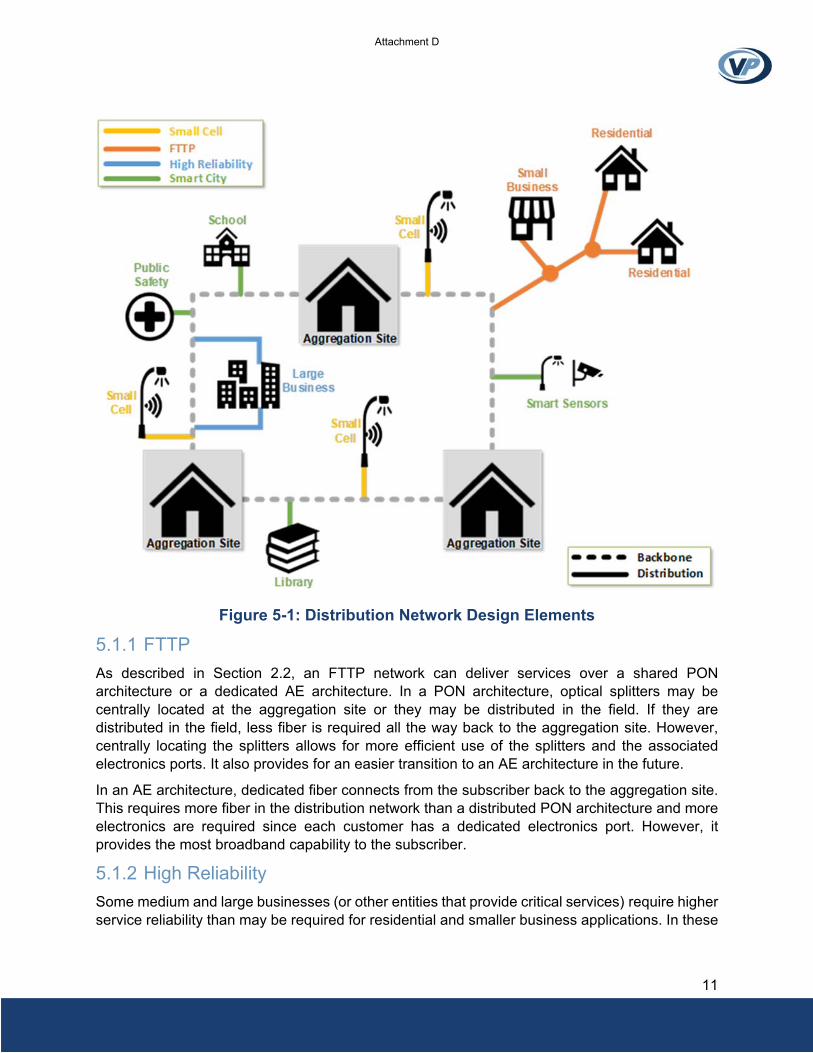
11
Figure 5-1: Distribution Network Design Elements
5.1.1 FTTP
As described in Section 2.2, an FTTP network can deliver services over a shared PON architecture or a dedicated AE architecture. In a PON architecture, optical splitters may be centrally located at the aggregation site or they may be distributed in the field. If they are distributed in the field, less fiber is required all the way back to the aggregation site. However, centrally locating the splitters allows for more efficient use of the splitters and the associated electronics ports. It also provides for an easier transition to an AE architecture in the future.
In an AE architecture, dedicated fiber connects from the subscriber back to the aggregation site. This requires more fiber in the distribution network than a distributed PON architecture and more electronics are required since each customer has a dedicated electronics port. However, it provides the most broadband capability to the subscriber.
5.1.2 High Reliability
Some medium and large businesses (or other entities that provide critical services) require higher service reliability than may be required for residential and smaller business applications. In these
Attachment D

12
cases, a fiber ring topology can be utilized to connect the businesses and provide redundancy that can survive a fiber cut or network outage on a portion of the ring.
5.1.3 Smart City Network
Smart City architectures could include items such as cameras at intersections, connections to traffic signal boxes, light sensors, and SCADA systems. It may also include fiber to city institutions such as schools, municipal buildings and libraries. The fiber design develops terminal locations for sensor connections and may include ring architectures for applications that require high levels of redundancy.
5.1.4 Small Cell 5G Network
A fiber deployment design may include working with carriers to design appropriate endpoints, route diversity and redundancy for Small Cell 5G deployments. This is typically designed based on coordination with the wireless carrier’s backhaul and fronthaul requirements.
5.1.5 Future Proofing the Network
It is also important to build capacity and flexibility into the network design to accommodate future growth and technologies. The growth capacity can be built into the fiber network by increasing spare fiber availability at various network locations. Growth capacity can also be included in the aggregation sites to allow for more equipment racks. In addition to spare fiber and space availability, future growth and technology support can sometimes be accommodated by replacing the electronics that are attached to the fiber network. This capacity planning helps minimize future capital expenditures in the event of customer growth.
5.2 Engineering Once the network design has been completed, detailed engineering is performed. This engineering results in construction plans that dictate construction materials, facility placement and network routing. Additionally, permit packages are completed and submitted during the engineering phase.
In preparation of the field engineering and permitting, the first step is to determine all agency jurisdictions that are impacted by the project. This includes municipal, state, federal, railroad, water, and environmental agencies that have jurisdiction in the project area. Once this list has been established, the next step is to meet with each agency to obtain their specific requirements.
5.2.1 Fielding
Fielding involves detailed onsite data collection, material selection, structure placement, and cable routing. The fielding staff develop construction plans that ensure the network design parameters, pole owner, and jurisdictional agency requirements are being met. The following describe the primary fielding tasks in more detail. Many providers utilize outside engineering firm resources to perform the fielding. Examples of fielding design maps are included in Appendix B.
Aerial Fielding
Data collection of existing and proposed aerial facilities is required on all poles that the new infrastructure will be framed on. This includes mainline, drop, and guy poles. The fielding staff gather both telecommunications and power infrastructure information.
Attachment D

13
Regional, state, and national regulating bodies have established minimum clearance requirements that all aerial installations must uphold. These entities include the National Electric Safety Code (NESC) and the National Electric Code (NEC). The fielding staff review the existing aerial infrastructure to determine if new cables can be added to the poles while meeting clearance and loading requirements.
In many instances additional communications plant cannot be added to a pole without creating a clearance violation. This violation may be a ground clearance issue or an overcrowding of different attachments. To resolve these violations, engineers perform make-ready engineering. This involves determining the work that needs to be performed on the pole to allow for the new attachment while not creating any violations. This commonly involves relocating existing attachments to a different height to create additional room on the pole. If no existing cables can be moved to create room on a pole, while maintaining all code requirements, the engineer often proposes a pole changeout to a taller pole or proposes an alternate construction method, such as underground construction.
Using the data collected in the field for each pole, an engineer also performs pole loading analysis (PLA) to ensure that the pole will not be overloaded. PLA is performed to meet federal, state, local, and pole owner requirements. In some instances, pole owners have higher standards than national, state, or local codes. If a pole does not meet the loading requirements, the engineer develops alternative solutions. This may be in the form of a pole change out or an alternate construction method. A sample PLA report for a single pole is included in Appendix B.
Underground Fielding
For underground data collection, the fielding staff determine the optimal running line of the underground fiber cable. To do this, the fielding staff must first research the existing utilities and right-of-way information in the project area. This research process includes meeting with local officials and residents to obtain maps and preliminary information and can take weeks or months depending upon the size of the area being constructed.
In determining existing utilities locations, cable and utility locates are also conducted. Any entity who has infrastructure near the proposed facilities will mark the exact location of their utility. The fielding staff will note the existing utilities from a reference point, such as the centerline of the road, along with the proposed fiber. Additionally, the fielding staff meets with local officials and residents to discuss items such as storm sewer information, soil conditions, and areas that may contain high amount of rock in the soil.
Material Selection
As part of the engineering process, an approved material list is created. During the fielding, this material list is utilized to select the actual products to be utilized for each facility placement. In the selection of materials, the engineer must review local codes, environmental requirements, manufacturer requirements and unique requirements of each placement location. For example, a structure that is being placed in a high-traffic area will have different requirements than a structure placed in a low traffic area. The engineer must also evaluate the upfront costs and long-term maintenance expenses associated with various materials choices.
There are numerous choices within each of the material types that must be decided upon. Each of these choices have cost and maintenance trade-offs and sometimes reliability or regulatory tradeoffs. This includes materials such as:
Attachment D

14
Field cabinets
Optical splitters
Aerial cable
Underground cable
Conduit
Aerial strand and materials
Splice closures
Manholes, handholes and vaults
Grounding
Structure Placement
Structure placement is determined to minimize construction and operations/maintenance costs while meeting the design, engineering and agency jurisdiction requirements. This includes structures such as cabinet, handholes, vaults, and manholes. Some areas considered in the structure placement include:
Permitting requirements – The permitting agency may have specific requirements that detail the acceptable placement of the structures.
Location access – The placement must be evaluated to ensure that it can be easily accessed in the future for maintenance. For example, typically areas that require significant traffic control to access the structure are avoided.
Interference with sidewalks or driveways
Americans with Disabilities Act (ADA) compliance work – Placing a structure within an ADA area may result in significant cost to restore the area to ADA compliance.
Grade of the terrain – Areas of steep grade of terrain are typically avoided as significant effort may be required in order to meeting permit and manufacturer requirements for the installation of the structure.
Cable Routing
The fielding staff plan the cable routing for the network. The fielding staff design the most efficient routes while adhering to the design and engineering specifications. Some considerations during the routing include:
Minimum separations with other utilities, as specified in NESC and local codes, must be maintained along the route
Locating splices where they can be easily accessed
Avoiding easements that may be time consuming or expensive to obtain
Avoiding locations that may have extensive permit requirements
Attachment D
15
The cable routing selection is critical, since a significant amount of the network investment is the labor associated with the placement of this cable. If this cable must be relocated for some reason before the end of the cable’s economic life, the feasibility of the business plan can change dramatically.
5.2.2 Permitting
The permitting process is usually conducted in parallel to the fielding process. For a typical rural project there are usually many more agencies that require permits than an urban deployment. An urban deployment may only require coordination with a single municipality, while a rural deployment may require coordination with federal, state, county, and tribal agencies. Rural deployments may also require substantial amounts of private right-of-way coordination in some states depending on the rural roadway right-of-way laws. The permitting process often takes at least 30-60 days and involves the following entities:
Department of Transportation (DOT) - DOT agencies often have specific permit drawing requirements. These include showing existing utilities, detailing the placement of cable relative to center line or right-of-way line, and inclusion of stationing and mile post information for all equipment placed in the right-of-way. The agencies may also require traffic control plans and storm water prevention plans. Often, they also request drive throughs with the field personnel to review proposed cable placement.
State/School - Some states own land for purposes of recreation or wildlife conservation. To cross state-owned lands, a survey completed by a licensed surveyor may be required. In environmental sensitive areas, additional surveys may be required to ensure endangered species will not be affected. Completing these types of surveys requires significant time of three to six months to complete the necessary paperwork.
County Roads - Counties may have specific construction requirements that need to be determined in the permitting process. This may include items such as: all roads and approaches must be bored, boring extra depth under culverts, cables may need to be placed on the edge of the road or in the actual road bed.
Municipal Permits – Municipal entities may require such items as showing existing utilities, meetings with the city council to review the project, traffic control plans, and storm water prevention plans. These all require significant time and resources to engineer, compile drawings, and meet with the local officials.
Railroad - Railroads often require engineered drawings to be submitted with the permits. The fees for crossing railroads can often be high cost and may take as long as 6 months for permits to be approved by the railroad.
Relevant particularly to rural construction and operations, the Federal government owns 28% of the land in the United States. When constructing in rural areas, it is therefore not uncommon to have to cross Federal land. When constructing on Federal lands, there are a variety of agencies that also require permits, which can be a time-consuming and costly process. These agencies could include one or more of the following:
Bureau of Reclamation
Bureau of Land Management
Attachment D
16
US Forest Service/Grasslands
US Park Service
US Fish & Wildlife Waterfowl Areas
Army Corp of Engineers
Department of Natural Resources
These Federal entities often require additional information before permits will be granted. They may require cultural resource surveys and/or biological surveys (botany, mammalian, reptilian, insect). They may also require that construction only occur during specific times of the year to reduce impact to specific plant or wildlife species. They may require cable placement at deeper than normal depths, especially crossing larger water bodies. These items add significant time to reach an approved permit. Most Federal lands require a minimum of 6 months and often longer to receive an approved permit.
In many areas of the country, the provider may be constructing on tribal areas which may include the following coordination:
Obtaining a tribal business license
Complying with a Tribal Employment Rights Ordinance (TERO)
Performing cultural surveys (could be in addition to other environmental surveys)
Bureau of Indian Affairs (BIA) road and land permit approvals
Tribal council permit/easement approvals for construction on tribal-owned tracts
Allotted land easements (may require surveys, payment and signatures of 50% of interest holders)
To complete all the necessary paperwork and signatures for easements may require 6 months. Completion of the permit packages is often prioritized based on the processing lead-times indicated by the permitting agencies. Each required permit package is assembled according the specific permitting agency standards.
Once submitted, there is ongoing coordination that occurs with the permitting agency. This includes obtaining periodic updates from the permitting agency to verify that the permit is being processed and to answer questions.
5.2.3 Construction Plans
Once the design and engineering has been completed, the construction plans are developed. The construction plans include the proposed construction maps, guide drawings, and construction standards. The construction plans are typically combined with contract requirement documents and then utilized in a competitive bid process to select a construction contractor for the project.
The competitive bid process typically requires pre-bid meetings with the potential contractors to answer questions and ensure that the bidders have full understanding of the project. Once the bids are received, they are tabulated and reviewed to ensure the accuracy of the bids and to select the successful contractor.
Attachment D

17
6 Construction
6.1 Outside Plant The construction of the outside plant network is very time-intensive and requires many resources. Again, rural networks are more expensive to construct on a per-subscriber basis than urban networks. Factors that make the costs more expensive include higher contractor deployment costs to these remote areas, long subscriber drops, and low density of subscribers in the service area. There is also typically a shorter construction season for rural networks since the buried construction techniques utilized in rural areas are impacted more by the freezing of the soil. Urban construction typically utilizes existing conduit and boring techniques that are not as impacted by freezing soil.
Outside plant construction requires large amounts of construction equipment, construction materials, contractor staff, and service provider representatives. Much effort is taken to ensure that the network is properly constructed. Improper construction can result in safety issues, expensive rework costs, and long-term maintenance issues.
6.1.1 Pre-Construction
Prior to actual construction, there are many logistical and communication items that need to be coordinated between the provider, the engineer, and the outside plant contractor.
Once awarded the contract, an initial step of the contractor is to place the order for the materials required by the construction plans. To receive, store, and distribute these materials, the contractor will need to procure a warehouse. Additionally, the contractor will need to obtain an equipment staging area for storing equipment when not in use and for performing equipment maintenance.
The contractor may also be required to conduct crew training prior to construction. This could include training certification by local government agencies for street cuts and restoration as well as safety training. It may also include training by specific material manufacturers regarding acceptable construction techniques.
The contractor and the provider also finalize the sequencing of the construction areas to be built. This may be prioritized by customer demand, status of construction permits, type of construction, or other factors. Based on the agreed upon sequencing, the contractor provides the provider a projection of the number of crews and construction schedule for each of the build areas.
Finally, prior to construction, the provider and contractor establish communication and escalation protocols. This typically includes contact lists and discussion regarding the types of issues that various staff should be notified of when they occur. These communication protocols may also include third-party provider representatives that will assist the provider through the construction process, such as quality control.
6.1.2 Construction
The contractor’s construction is dictated by the construction and permit packages for the work. This includes ensuring that all material is installed per the provider’s requirements, material manufacturer instructions, and local, state and national codes. The construction also includes performing more than just the placement of the fiber cable and materials, encompassing tasks such as tree trimming, aerial pole make-ready, locating of utilities, and restoration of the impacted
Attachment D
18
area after construction. Each of these items requires teams of workers to perform the necessary work.
Once construction has commenced, there is much ongoing coordination between the contractor and the provider’s representatives. It is important for the provider to be aware of daily contractor crew locations and activities. This is necessary for notifying residents and business of upcoming construction in the area, performing quality control inspections and providing updates to local government officials. For aerial construction, is also necessary for keeping poles owners aware of make-ready and cable placement schedule and construction status.
During the construction, there are many safety processes that are implemented. Traffic control plans are implemented to provide for safe construction along roadways. Additionally, protocols are implemented that dictate zones around the construction where only specific personnel with the appropriate safety equipment can be located. Other safety procedures include digging holes to visually observe utilities that are being crossed by the new constructions.
Inspection of the contractor’s work is performed by the provider’s representatives throughout the construction process. This process is described in more detail in section 6.3. Additionally, the provider’s representatives answer questions regarding construction plans, make decisions regarding field changes, and ensure that construction is being performed according to the plans and specifications.
Daily production is typically reported by the contractor and verified by the provider’s representatives. The production information is utilized to assess construction status, such as whether construction timeline goals are being met and the accuracy of contractor payment requests. When goals are not being met, the production reports are useful in determining potential resolutions, such as additional crew personnel, additional crew training, or more efficient construction techniques.
The provider also keeps the permit agencies and pole owners informed of construction status to ensure timely inspection of the construction and to close-out permits and applications as soon as possible.
Once the construction in an area has been completed, the construction corridor must be restored to its previous condition. This includes removing any waste materials and filling and repairing holes in roads, sidewalks and driveways. It may also include restoring residents’ lawns and seeding areas with grass.
After the fiber has been constructed, the fiber cables are spliced together to provide connectivity throughout the network. This requires careful planning to ensure that the fibers are spliced efficiently throughout the network and to maximize the use of the fiber. It also requires documentation and labeling to allow for future maintenance and troubleshooting of the network. After the fibers are spliced, they are tested to ensure that the fiber splices meet minimum requirements and to verify that the correct fibers have been spliced together. Example splice diagrams and test results are included in Appendix C.
Attachment D

19
6.2 Inside Plant
6.2.1 Electronics
Once the fiber network has been constructed, the operations and management of the system begins. At the aggregation sites, several electronics systems must be installed and provisioned. This includes the core data network, transport electronics, distribution electronics, voice service electronics, and potentially video electronics. The service provider typically conducts a competitive bid process for these systems and evaluates the proposals to determine which solutions best fit their network.
6.2.2 Provisioning
Once the electronics systems have been installed and tested, they must be configured to interoperate, and the appropriate circuits and services must be provisioned. As part of this installation process, the management systems for each of the electronics systems is installed. The service provider’s technicians also undergo training in the operations and troubleshooting of each of the systems.
6.3 Quality Assurance / Quality Control To speed time to market, save costs, and maximize construction quality many providers develop Quality Assurance (QA) and Quality Control (QC) procedures for the outside and inside plant construction. QA is the act of observing and providing feedback to correct potential issues during construction but prior to project final acceptance. The purpose of QA is to identify potential problems and allow them to be corrected early in the construction process. This may include issues such as:
Training deficiencies
Poor crew performance
Incorrect understanding of requirements
Inconsistency between subcontractors
Use of outdated specifications
Installation of incorrect material
QC is the final inspection of the construction product. An effective QA process should result in very few issues being identified during the QC inspections.
Both QA/QC are most often performed by strategically sampling the construction. Critical construction elements and items that are very difficult to correct are sampled at higher rates than less critical items. Additionally, the sampling is typically adjusted depending on the contractor crew performance.
Third-party firms are typically utilized by the provider to perform the QA/QC. The third-party firm tasks may include inspection of work to confirm conformance with the specifications, development of deficiency punch lists, analyzing trends, performing contractor training, and verifying correction of issues.
Attachment D
20
6.4 Turn-over Coordination Once the construction has been completed, the contractor provides a turn-over package to the provider. This package typically includes fiber test results, tabulation of all constructed units, and contract close-out paperwork.
It is common for the provider to utilize the third-party QA/QC firm to review this information and to also perform the as-built redlines of the construction maps. This includes compiling a geo accurate inventory of the constructed system and building databases and maps of the information required to maintain and locate the facilities. This results in every fiber strand being accounted for and traceable in the network.
6.5 Customer Location Construction Once the fiber routes have been constructed and the electronics systems have been installed and provisioned, the customer turn-up can begin. This involves constructing a drop to the customer, installing customer premises equipment, provisioning the customer’s service, testing the service, and educating the customer.
The installation requires coordination and scheduling with the customers. Providers may have several staff that are dedicated to maintaining installation schedules and coordinating the installation crews.
During the installation, installation crews perform grounding/bonding work and must adhere to NEC and local safety standards and codes. The installation crew must also interface or perform rework of the customer’s inside wiring.
Attachment D

21
7 Operations and Management
7.1 Operations Once the network has been constructed, the job is hardly done; from one perspective, the job of delivering broadband is just starting as of that point. There are several items that need to be considered and completed to ensure a successful operation of the network. The operations and maintenance of a rural network is more expensive on a per-subscriber basis than an urban network. Low subscriber density results in maintenance staff having to cover large service territories. Additionally, rural networks are more susceptible to environmental factors such as floods, grass fires, and ice storms that may take down miles of pole lines.
7.1.1 Staffing
A significant part of the operations and management planning is ensuring adequate staffing is allocated. Staffing levels need to be established based on the size of the service market and services offered. Positions include technicians experienced in maintaining the outside plant facilities, the central office, distribution electronics, and data network elements.
Staff should be qualified with the experience in operating and maintaining the network. In addition to subscriber turn-ups, the service provider must troubleshoot network issues and perform network maintenance and repair.
In addition to operating the network, positions will be required in customer service as well as marketing and sales to sell the services and in accounting for billing and financial accountability.
7.1.2 Regulatory Considerations
State and federal regulatory requirements are another area that is often overlooked during the planning stages of building a broadband network. Deploying a network capable of delivering voice, broadband and even video services comes with a long list of regulatory considerations that could have a strain on the operations from labor demand to the financials. The level of complexity in regulatory components varies depending on the services that are offered.
A few of the regulatory considerations to be addressed may consist of the following:
Obtaining Regulatory Authority and/or Eligible Telecommunications Carrier (ETC) status
Interconnection Agreements
Obtaining Numbering Resources and Local Number Portability
E911 Plans
Tariff Development and Filings – Both State and Interstate Tariffs
Obtaining FCC Registration Number and Completing FCC Regulatory Filings (e.g., Forms 477, 499, and 502; any ETC reporting duties)
CPNI Compliance
Red Flag Compliance
CALEA Compliance
Attachment D
22
Video – Programming and Retransmission Negotiations
In addition to the upfront startup regulatory considerations, there are regular regulatory filings that are required. These filings vary in recurrence with some being quarterly, semi-annually and annually.
7.2 Support Systems There are several support systems that a typical service provider deploys to aid in the operations and management of the network. Each of these systems adds costs and requires staff and training to utilize.
A mapping system is needed to maintain the maps of the placed facilities. These systems contain information such as cable route, cable size, fiber splicing information and structure placement types and locations. These mapping systems typically also incorporate GPS location information regarding the facilities.
System providers also deploy trouble ticket systems. These systems are utilized to log subscriber troubles, assign them to staff for troubleshooting, and for escalating the issues. Trouble ticket systems can also be utilized to categorize the types of issues that are occurring and aid in identifying issue trends.
Providers also utilize complex billing and provisioning systems. These systems track customer information, financial information, service information, and various report functions. These systems may also be tied to flow through provisioning capabilities that allow a provider’s customer representative to enable subscriber services through the network.
Attachment D

23
Appendices
Attachment D
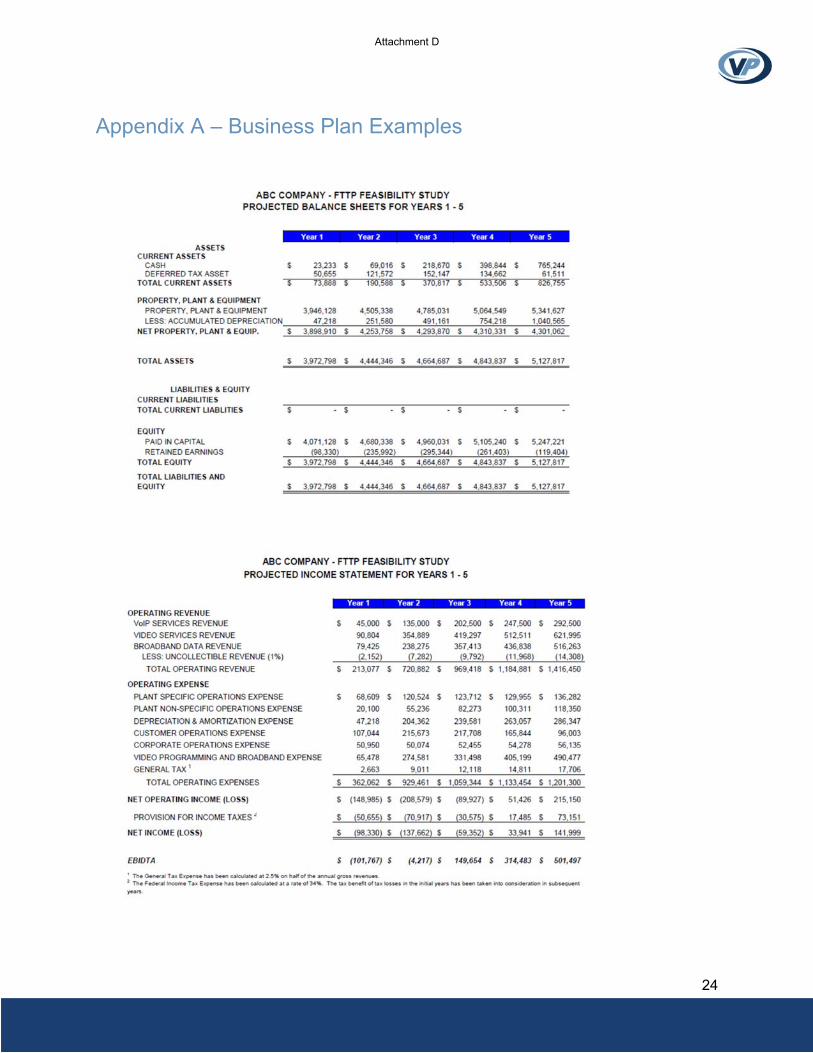
24
Appendix A – Business Plan Examples
Attachment D

25
Attachment D

26
Attachment D
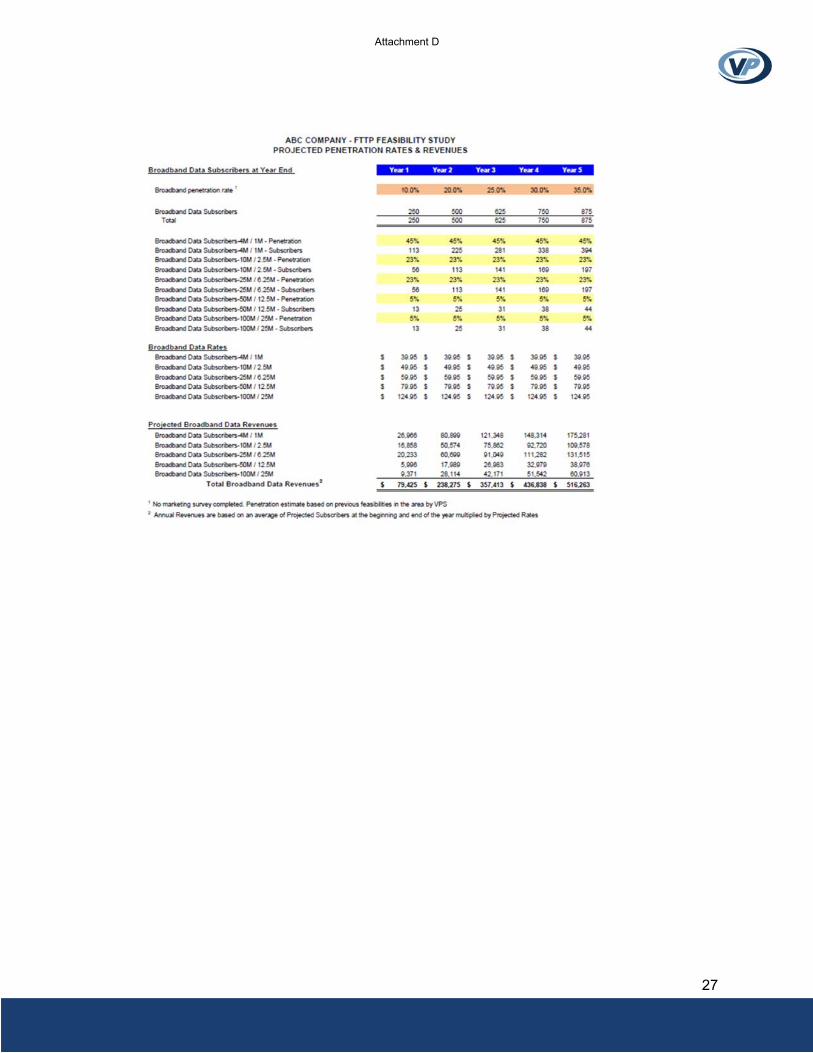
27
Attachment D
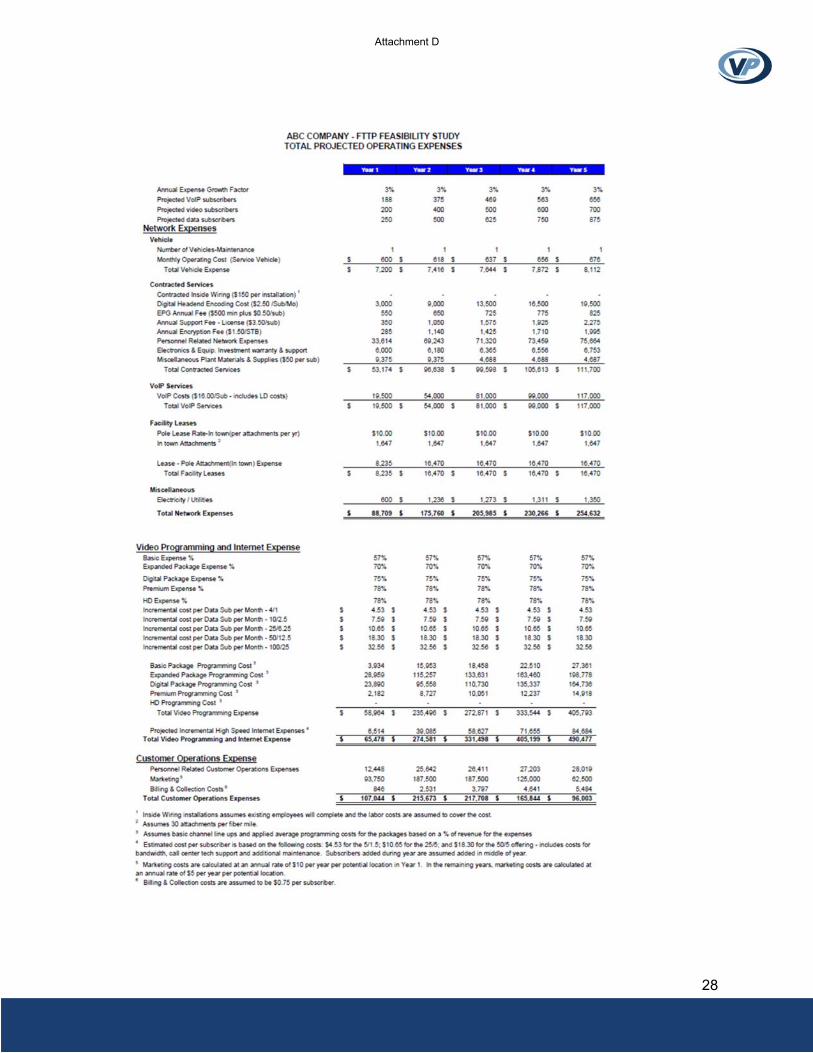
28
Attachment D

29
Appendix B – Design and Engineering Examples
Attachment D
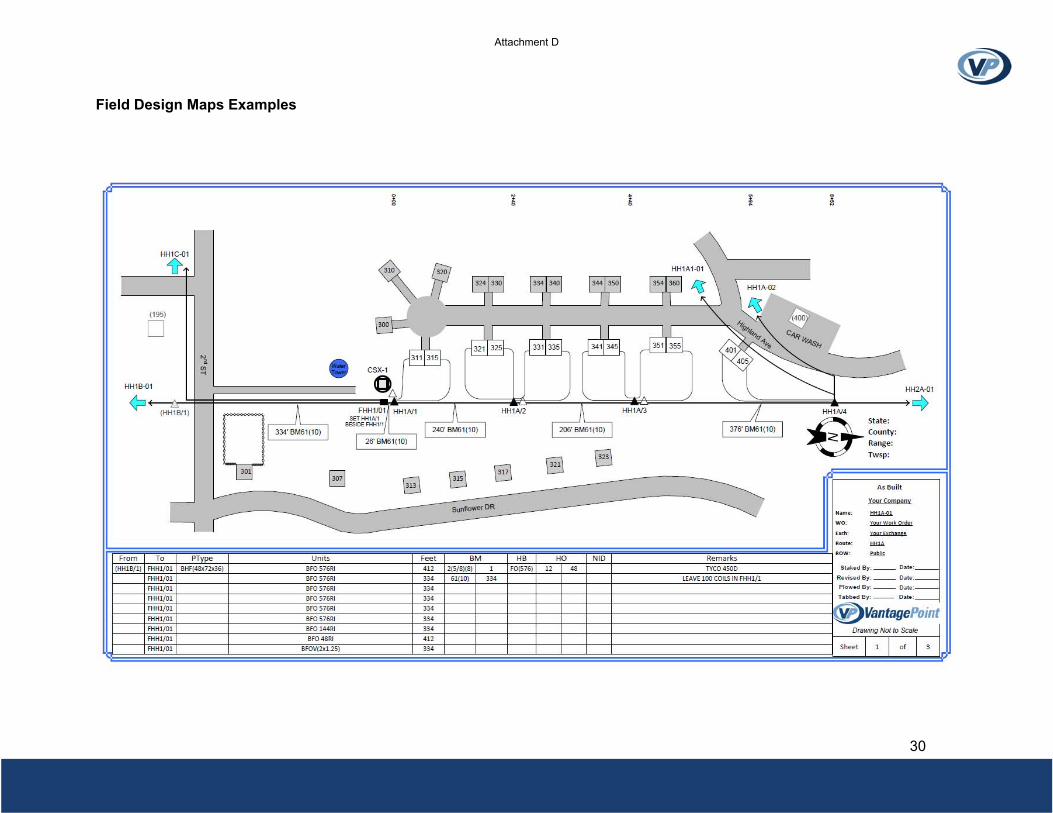
30
Field Design Maps Examples
Attachment D

31
Field Design Maps Examples - Continued
Attachment D

32
Field Design Maps Examples - Continued
Attachment D

33
Field Design Maps Examples - Continued
Attachment D
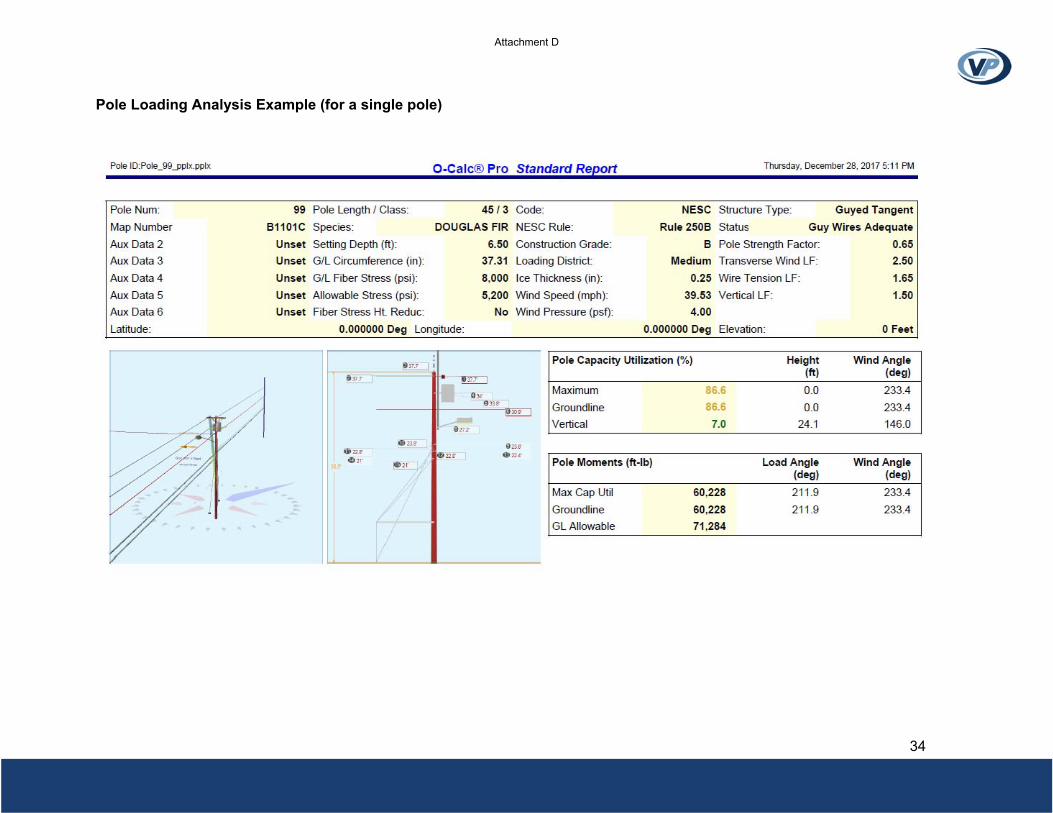
34
Pole Loading Analysis Example (for a single pole)
Attachment D
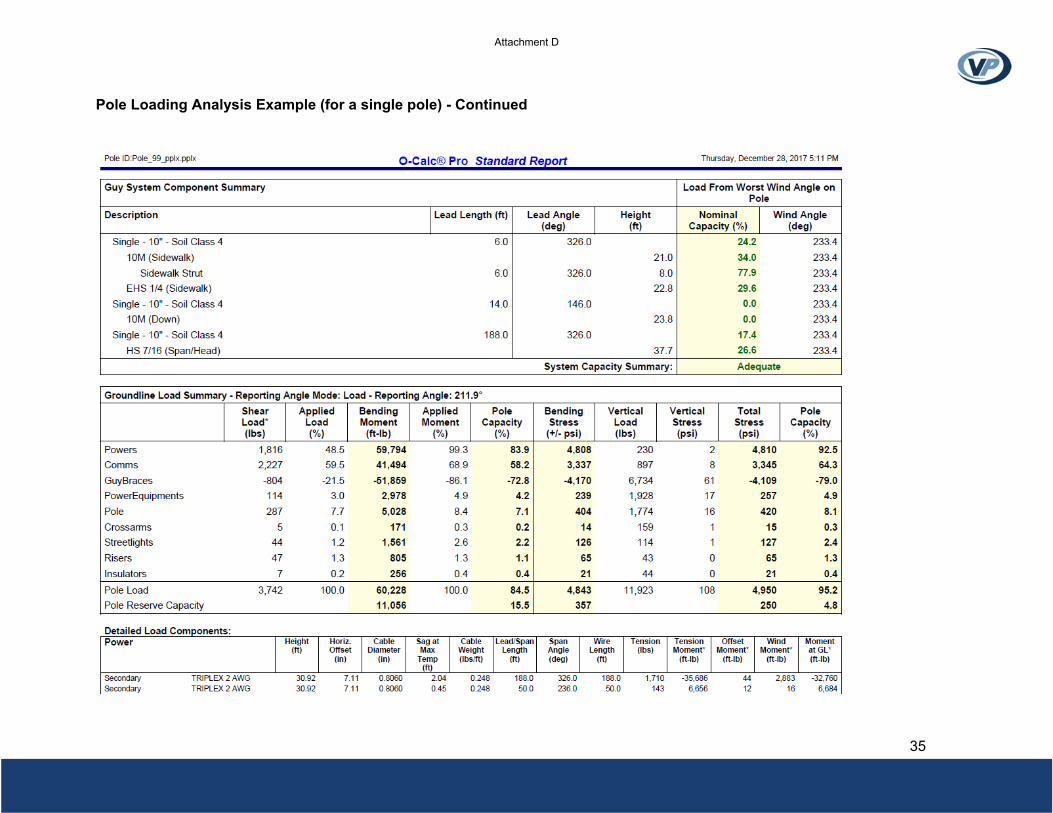
35
Pole Loading Analysis Example (for a single pole) - Continued
Attachment D

36
Pole Loading Analysis Example (for a single pole) - Continued
Attachment D

37
Pole Loading Analysis Example (for a single pole) - Continued
Attachment D

38
Appendix C - Construction Examples
Attachment D
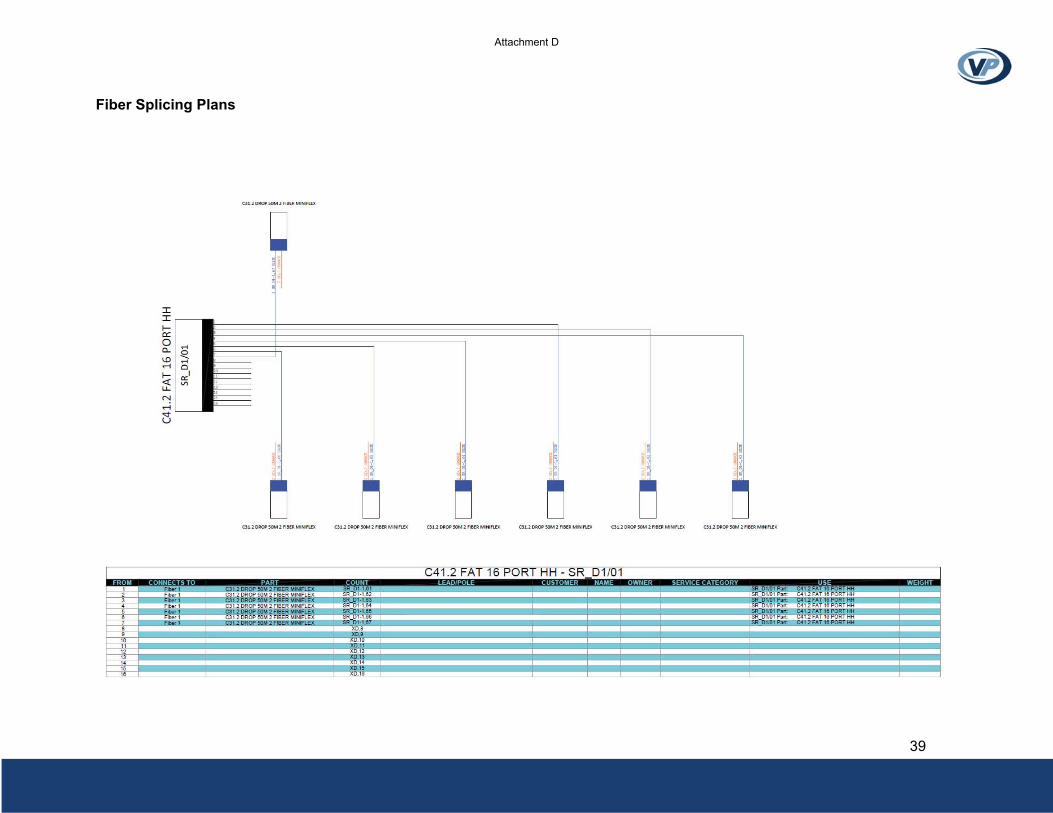
39
Fiber Splicing Plans
Attachment D
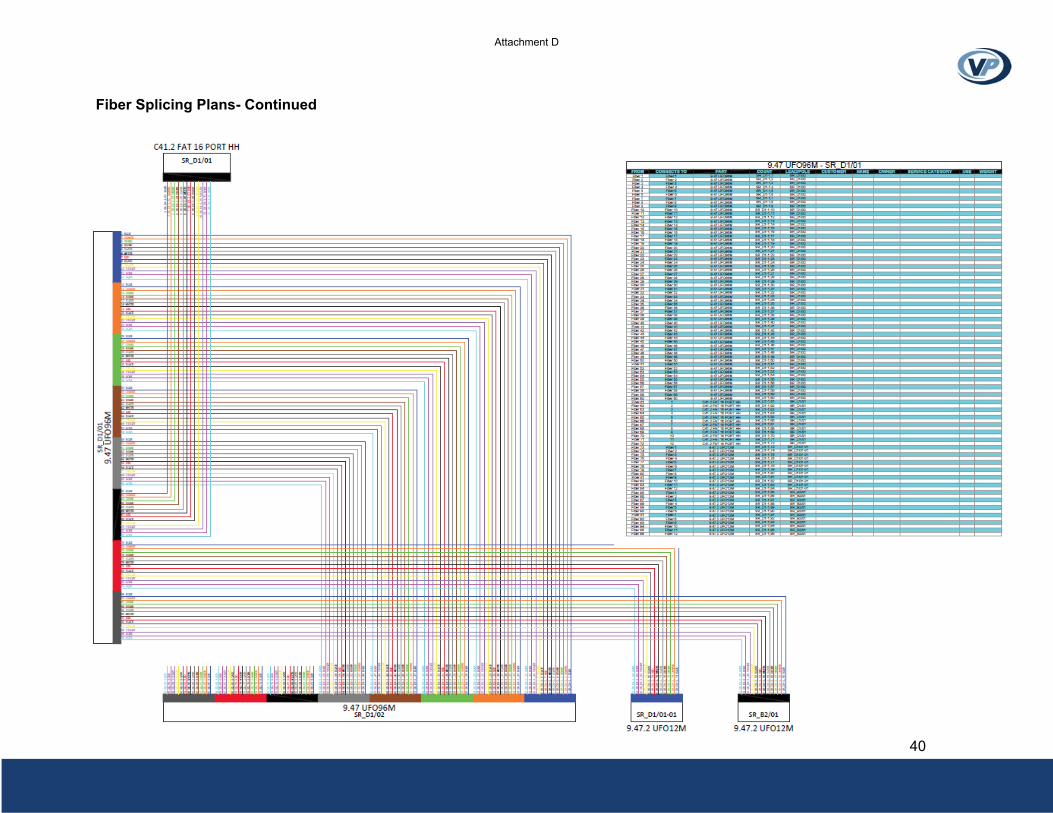
40
Fiber Splicing Plans- Continued
Attachment D

41
Fiber Testing Results Example
Attachment D
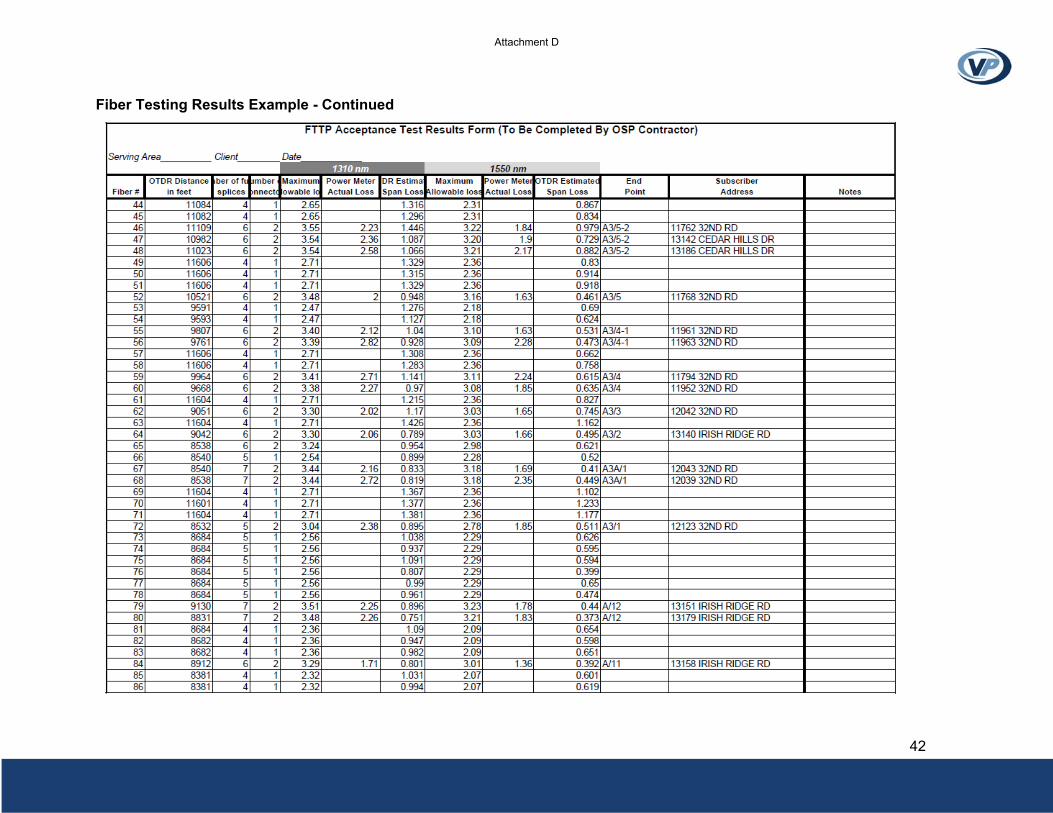
42
Fiber Testing Results Example - Continued
Attachment D

43
About the Authors
Larry Thompson is a licensed Professional Engineer and CEO of Vantage Point Solutions. Larry has a Physics degree from William Jewell College and Bachelor and Master degrees in Electrical Engineering from the University of Kansas. Larry has helped hundreds of telecommunication companies be successful in this rapidly changing technical and regulatory environment. He has designed many wireless and wireline networks as he has assisted his clients in their transition from legacy TDM networks to broadband IP networks.
Brian Enga is a licensed Professional Engineer and part of the Senior Engineering team at Vantage Point Solutions. Brian has Bachelor of Science degrees in Electrical Engineering and Engineering Physics from South Dakota State University. He has been working in the telecommunications industry for nearly 20 years. Brian has engineered a variety of broadband networks and has been a pioneer in deploying IP video networks.
Attachment D

DSLPentration Description
35% Fix capacity issues & DSA Replacements
44% Fix capacity issues & DSA Replacements
37% Fix capacity issues & DSA Replacements
Attachment E