h1 fy2018 consort medical interim results final · consort medical plc is a leading one-stop...
TRANSCRIPT
1
Consort Medical plc
5 December 2017
Interim results
Consort Medical delivers good growth in the first half
Outlook remains in line with its expectations
Consort Medical plc (LSE: CSRT) (“Consort”, “Consort Medical” or the “Group”), a leading one-stop
developer and manufacturer of drugs and premium drug delivery devices, today announces its interim
results for the six months ended 31 October 2017.
Financial Highlights
H1 FY2018
Reported
H1 FY2017
Reported
∆
Reported
∆
CER1
GBPm 6 months ended 31 Oct 2017 31 Oct 2016
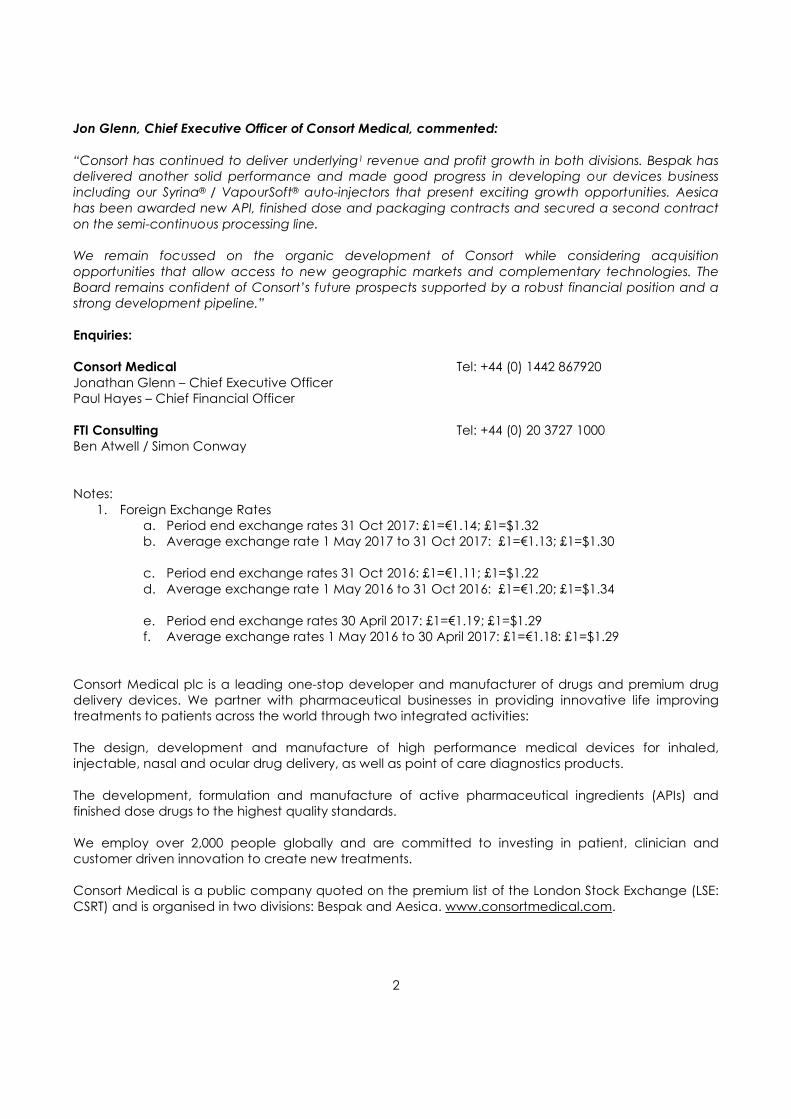
Revenue 153.7 144.9 6.1% 4.2%
EBIT2 20.3 18.9 7.3% 6.3%
PBT2 17.9 16.6 7.7% 6.4%
Adjusted Basic EPS2 29.3p 28.6p 2.6% 1.2%
Statutory Measures
Profit before tax (PBT)
Basic EPS
7.5
14.2p
10.1
20.1p
(25.9)%
(29.4)%
1 Underlying/CER – at constant exchange rates; H1 FY2017 actuals retranslated at average H1 FY2018 exchange rates. 2 Before special items of
£10.4m (H1 FY2017: £6.5m) that includes amortisation of acquired intangible assets, reorganisation and impairment costs.
• Consort has delivered a 6.1% increase in sales and 7.3% EBIT growth in the first half
• Bespak grew underlying1 revenue by 2.9% and EBIT1 by 2.1%
• Aesica grew underlying1 revenue by 5.0% and EBIT1 by 14.0% with a 60bps margin improvement
from this time last year
• Adjusted basic EPS grew 2.6% to 29.3p
• Generated good free cash-flow to reinvest in the Group for further growth
• Net debt at £97.1 million (30 April 2017: £92.6m) with good working capital management. Net
debt to EBITDA at 1.8x
• Interim Dividend increased 5.0% to 7.44p
Operational Highlights
• Good progress on the Syrina® / Vapoursoft® auto-injector development contract with our
leading global biopharmaceutical customer
• Continued good performance across our broad range of leading advance drug delivery
devices with our established customer relationships
• On track with Mylan in supporting their generic Advair programme
• Further awards of API, finished dose and packaging contracts in Aesica supplementing our
established long-term relationships with existing customers
• Secured a new customer on the semi-continuous processing line and technology installed in
our Queenborough site
2
Jon Glenn, Chief Executive Officer of Consort Medical, commented:
“Consort has continued to deliver underlying1 revenue and profit growth in both divisions. Bespak has
delivered another solid performance and made good progress in developing our devices business
including our Syrina® / VapourSoft® auto-injectors that present exciting growth opportunities. Aesica
has been awarded new API, finished dose and packaging contracts and secured a second contract
on the semi-continuous processing line.
We remain focussed on the organic development of Consort while considering acquisition
opportunities that allow access to new geographic markets and complementary technologies. The
Board remains confident of Consort’s future prospects supported by a robust financial position and a
strong development pipeline.”
Enquiries:
Consort Medical Tel: +44 (0) 1442 867920
Jonathan Glenn – Chief Executive Officer
Paul Hayes – Chief Financial Officer
FTI Consulting Tel: +44 (0) 20 3727 1000
Ben Atwell / Simon Conway
Notes:
1. Foreign Exchange Rates
a. Period end exchange rates 31 Oct 2017: £1=€1.14; £1=$1.32
b. Average exchange rate 1 May 2017 to 31 Oct 2017: £1=€1.13; £1=$1.30
c. Period end exchange rates 31 Oct 2016: £1=€1.11; £1=$1.22
d. Average exchange rate 1 May 2016 to 31 Oct 2016: £1=€1.20; £1=$1.34
e. Period end exchange rates 30 April 2017: £1=€1.19; £1=$1.29
f. Average exchange rates 1 May 2016 to 30 April 2017: £1=€1.18: £1=$1.29
Consort Medical plc is a leading one-stop developer and manufacturer of drugs and premium drug
delivery devices. We partner with pharmaceutical businesses in providing innovative life improving
treatments to patients across the world through two integrated activities:
The design, development and manufacture of high performance medical devices for inhaled,
injectable, nasal and ocular drug delivery, as well as point of care diagnostics products.
The development, formulation and manufacture of active pharmaceutical ingredients (APIs) and
finished dose drugs to the highest quality standards.
We employ over 2,000 people globally and are committed to investing in patient, clinician and
customer driven innovation to create new treatments.
Consort Medical is a public company quoted on the premium list of the London Stock Exchange (LSE:
CSRT) and is organised in two divisions: Bespak and Aesica. www.consortmedical.com.
3
Forward looking statements
This document may contain certain forward-looking statements with respect to Consort Medical’s financial condition, performance, position, strategy, results and plans based on management's current expectations or
beliefs as well as assumptions about future events. These forward-looking statements are not guarantees of future performance. Undue reliance should not be placed on forward-looking statements because, by their very nature,
they are subject to known and unknown risks and uncertainties and can be affected by other factors that could cause actual results, and Consort Medical’s plans and objectives, to differ materially from those expressed or
implied in the forward-looking statements. Consort Medical undertakes no obligation to update any of the forward-looking statements contained in this document or any other forward-looking statements it may make. Past
performance is not an indicator of future results and the results of Consort Medical in this document may not be indicative of, and are not an estimate, forecast or projection of, Consort Medical’s future results.
Alternative Performance Measures
In addition to statutory measures, a number of alternative performance measures are included in this announcement to provide a clear understanding of the Group’s performance. These measures assist investors in
gaining a balanced view of the Company’s performance and in the comparison of performance across the industry. The alternative performance measures used include EBIT (or operating profit), EBITDA, PBT and EPS
performance adjusted to eliminate special items that are costs relating to acquisitions or significant items not linked to the underlying performance of the business. Constant exchange rate measures eliminate the impact of
currency movements by comparing the current measure against the comparative restated at this period’s average exchange rate. Where we provide adjusted performance measures, they are compared to the equivalent measures in the prior period.
4
Consort Medical plc
Group Interim Results Review
Financial Performance
Consort delivered underlying1 growth in both businesses and a continued improvement in Group
margins in the first half of the financial year.
Revenue increased by 6.1% to £153.7m (H1 FY2017: £144.9m) with Bespak delivering growth of 2.9% to
£60.6m (H1 FY2017: £58.9m), and Aesica growing 8.2% to £93.1m (H1 FY2017: £86.0m). Aesica grew by
5.0% at constant exchange rates with the weakness of sterling against the Euro delivering a
translational increase of £2.8m on the prior period performance.
EBIT before special items increased by 7.3% to £20.3m (H1 FY2017: £18.9m). This included 2.1% growth
from Bespak to £12.5m (H1 FY2017: £12.2m). Bespak’s EBIT margin was maintained at a sector leading
20.5% (H1 FY2017: 20.7%). Aesica EBIT increased by 16.8% to £7.8m (H1 FY2017: £6.7m) with an increase
of 14.0% at constant exchange rates. The Aesica EBIT margin grew by 60bps compared to the same
period last year to 8.4% reflecting continuing improvements to operating performance.
Special items before taxation amounted to £10.4m in the period (H1 FY2017: £6.5m), comprising £6.1m
amortisation of acquired intangibles (H1 FY2017: £6.5m); a restructuring charge of £1.4m and a one-off
non-cash impairment of £2.9m for specific fixed assets. The restructuring charge includes streamlining
certain activities within the Aesica business to strengthen the business for the future and delivers an
attractive return. These restructuring plans are anticipated to incur a further one-off cash cost of
approximately £3.0m once completed. The £2.9m non-cash impairment charge relates to specific
equipment relating to a non-core activity.
Finance costs were broadly unchanged at £2.4m (H1 FY2017: £2.3m), with Earnings before tax and
special items increasing by 7.7% to £17.9m (H1 FY2017: £16.6m). This is an increase of 6.4% at constant
exchange rates. Adjusted basic EPS increased by 2.6% to 29.3p per share (H1 FY2017: 28.6p), an
increase of 1.2% at constant exchange rates. Basic EPS decreased by 29.4% to 14.2p per share (H1
FY2017: 20.1p).
Cash generated from operations increased by £7.6m to £17.7m (H1 FY2017: £10.1m). EBITDA before
special items grew £1.8m (7.5%) to £27.0m (H1 FY2017: £25.2m). Bespak EBITDA grew 2.7% to £15.6m,
with Aesica’s EBITDA growing by £1.5m to £11.5m. There has been a lower increase in working capital
during the period than normal seasonal trends with an £8.6m increase in the first half (H1 FY2017:
£14.8m increase). Capital expenditure increased £4.1m to £10.3m (H1 FY2017: £6.2m).
The Group balance sheet closed with a net debt position of £97.1m (FY2017: £92.6m), representing
gearing of 1.8x Net Debt: EBITDA (H1 FY2017: 1.9x). Interest cover was 18.8x (H1 FY2017: 15.8x). The
Group is in a strong financial position, with total committed facilities of £169.0m, of which £125.7m was
drawn at 31 October 2017.
The Board is declaring a 5.0% increase in the interim dividend per share to 7.44p (H1 FY2017: 7.09p).
Payment will be on 16 February 2018 to holders on the register on the record date of 19 January 2018.
The Company has a Dividend Reinvestment Plan that allows shareholders to reinvest dividends to
purchase additional shares in the Company. For shareholders to apply the proceeds of this and future
dividends to the plan, application forms must be received by the Company's Registrars by no later
than Friday 26 January 2018.
1 Underlying – at constant exchange rates; H1 FY2017 actuals retranslated at average H1 FY2018 exchange rates.
5
Delivering the Group’s strategy
Consort Medical is successfully executing its well-established strategy, which has four key elements:
1. Driving sustainable organic revenue growth
Consort is driving sales growth through leveraging its strong relationships with existing customers,
developing opportunities with new customers and broadening its product offering.
We have deep, long-term contractual relationships with many leading pharmaceutical companies in
both Bespak and Aesica, supplying customers with high quality products from our highly regulated
facilities. There is a broad range of existing production programmes where we work closely with
customers to support their growth strategies. We supplement this with development opportunities by
providing innovative solutions utilising our market-leading expertise.
We provide a summary of the more significant Bespak opportunities in our development pipeline
where we are working with certain customers on specific devices. In Aesica, there is also a significant
amount of activity on API manufacturing and finished dose development opportunities although we
do not disclose this commercially sensitive information.
2. Delivering margin improvement
Consort has a track-record of improving its underlying1 Group margins with the Aesica margin
increasing from 5.2% at acquisition to 8.4% during the period. Our strategy is to continue to deliver
further margin improvement through organic growth and a continued process of improving our
operational efficiency.
Whilst delivering margin improvement, we will continue to invest in our strong product innovation and
development capabilities, both important elements of our growth strategy.
3. Innovating and developing new devices and formulation technologies
Alongside our own product innovations, we partner with pharmaceutical businesses in providing
innovative life improving treatments and are committed to investing in patient, clinician and customer
driven innovation to create new treatments.
Since 2010, Consort has consistently invested in innovation and expanded from a predominantly
respiratory products business to leading positions in a number of growth markets. We have well
established development programmes in both divisions including new devices, APIs and finished dose
formulations. We are differentiated by our one-stop capability of being able to develop and
manufacture both a drug and its delivery device within a single group.
The Group has continued to broaden its capabilities including growing its medical device business by
adding highly innovative proprietary injectable delivery technologies to its well established respiratory
franchise.
Our injectables activities include an innovative gas powered auto-injector technology designed to
support the safe operation of single-use syringes capable of injecting higher viscosity liquids. There is a
growing demand for products serving this technically challenging area particularly with the growth of
large molecule biological drugs which are often very viscous. We are developing specific products
using our proprietary technology including a significant programme with a global biopharmaceutical
customer. The Group believes that its auto-injector business has the potential to be at least the size of
our respiratory franchise in the medium to long term.
6
4. Making selective acquisitions and investments
Consort generates strong free cash flow that supports investment in organic growth and has allowed
us to grow the dividend. The strategy is to supplement this with appropriate strategic investments.
Our non-organic growth strategy is to make selective acquisitions or investments in new geographical
markets and complementary technologies that have the potential to broaden our geographic
footprint and customer base. We will continue to review appropriate opportunities that present
attractive long-term shareholder value.
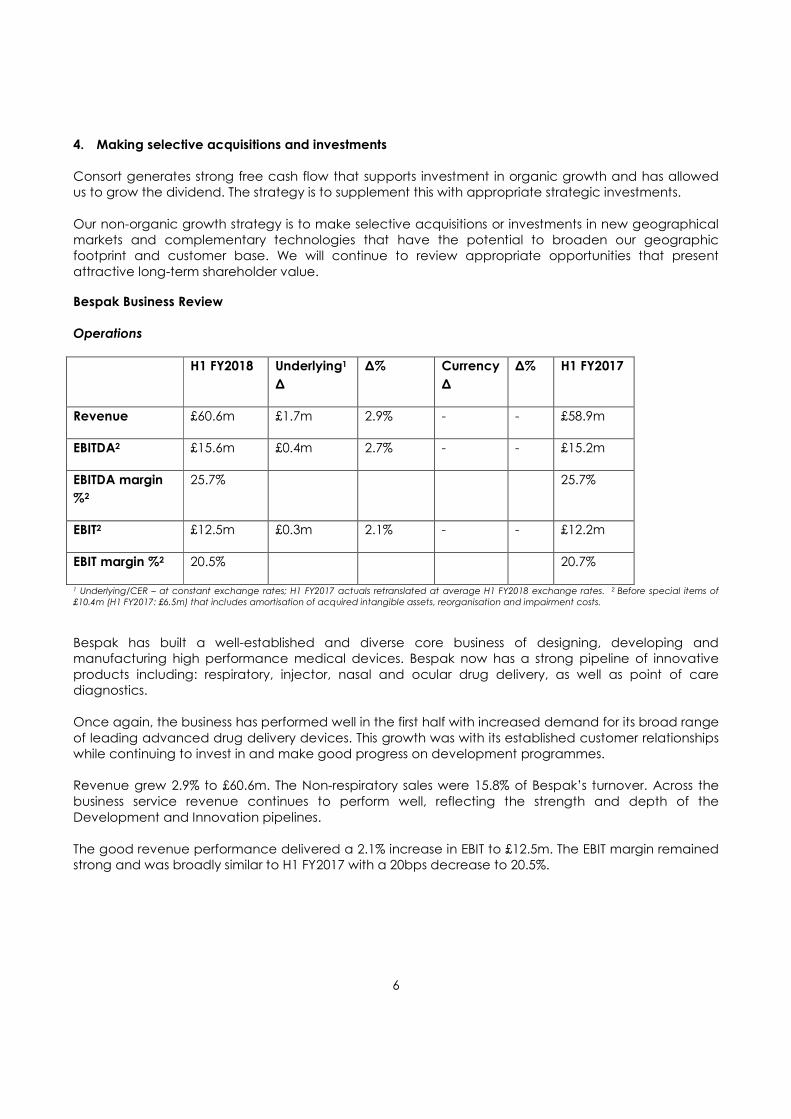
Bespak Business Review
Operations
H1 FY2018 Underlying1
∆
∆% Currency
∆
∆% H1 FY2017
Revenue £60.6m £1.7m 2.9% - - £58.9m
EBITDA2 £15.6m £0.4m 2.7% - - £15.2m
EBITDA margin
%2
25.7% 25.7%
EBIT2 £12.5m £0.3m 2.1% - - £12.2m
EBIT margin %2 20.5% 20.7%
1 Underlying/CER – at constant exchange rates; H1 FY2017 actuals retranslated at average H1 FY2018 exchange rates. 2 Before special items of
£10.4m (H1 FY2017: £6.5m) that includes amortisation of acquired intangible assets, reorganisation and impairment costs.
Bespak has built a well-established and diverse core business of designing, developing and
manufacturing high performance medical devices. Bespak now has a strong pipeline of innovative
products including: respiratory, injector, nasal and ocular drug delivery, as well as point of care
diagnostics.
Once again, the business has performed well in the first half with increased demand for its broad range
of leading advanced drug delivery devices. This growth was with its established customer relationships
while continuing to invest in and make good progress on development programmes.
Revenue grew 2.9% to £60.6m. The Non-respiratory sales were 15.8% of Bespak’s turnover. Across the
business service revenue continues to perform well, reflecting the strength and depth of the
Development and Innovation pipelines.
The good revenue performance delivered a 2.1% increase in EBIT to £12.5m. The EBIT margin remained
strong and was broadly similar to H1 FY2017 with a 20bps decrease to 20.5%.
7
Product Development
In line with our strategy, we have built a broad product development pipeline of underlying growth
opportunities to supplement our strong core business. Successful conversion of these opportunities is
providing progressive revenue and profit growth, in both contract manufacturing and products with
our own proprietary IP. This is across a range of therapeutic areas, including commercial drug
handling.
Our published development portfolio provides an update on the key development projects in the
business. For inclusion in the published portfolio, projects must have a reasonable expectation of
success, though timescales are difficult to predict, and are expected to produce peak annual sales of
at least £3m per annum.
Overall we have continued to make good progress with the development pipeline which now reflects
the progression of two successful development programmes that are complete and now form part of
our underlying manufacturing activities. These are the UCB auto-injector and Astra-Zeneca MDI valve /
actuator.
In terms of ongoing development programmes, we are making good progress and remain on
schedule with the Syrina® / Vapoursoft® auto-injector development contract with our leading global
biopharmaceutical customer. This programme alongside our other auto-injector activities remains an
important element of our sales growth strategy.
We also continue to work closely with Mylan in supporting their generic Advair programme. Mylan
have confirmed on their recent earnings call that no further clinical or device related studies are
required by the FDA and Mylan have resubmitted their ANDA filing with a target action date of mid-
June 2018.
We are now supplying our proprietary Easifill primeless valve to a new global for a regulatory approved
product due to be launched shortly. This is the same valve as the Easifill primeless valve (VAL310) and
replaces the initial customer who has decided not to launch a product using this technology.
The development of the Patchpump® infusion system for Treprostinel (INJ600) is no longer on our
development pipeline following SteadyMed Therapeutics Inc’s decision to award commercial
manufacture to a US manufacturer.
8
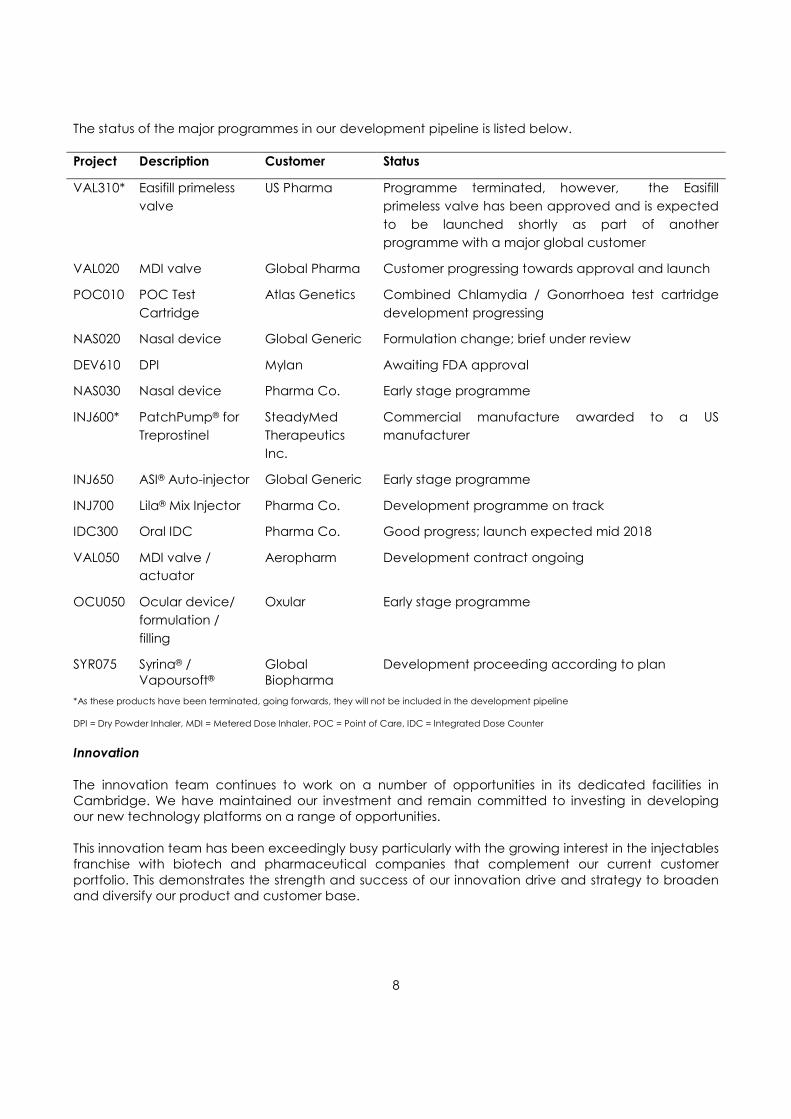
The status of the major programmes in our development pipeline is listed below.
Project Description Customer Status
VAL310* Easifill primeless
valve
US Pharma Programme terminated, however, the Easifill
primeless valve has been approved and is expected
to be launched shortly as part of another
programme with a major global customer
VAL020 MDI valve Global Pharma Customer progressing towards approval and launch
POC010 POC Test
Cartridge
Atlas Genetics Combined Chlamydia / Gonorrhoea test cartridge
development progressing
NAS020 Nasal device Global Generic Formulation change; brief under review
DEV610 DPI Mylan Awaiting FDA approval
NAS030 Nasal device Pharma Co. Early stage programme
INJ600* PatchPump® for
Treprostinel
SteadyMed
Therapeutics
Inc.
Commercial manufacture awarded to a US
manufacturer
INJ650 ASI® Auto-injector Global Generic Early stage programme
INJ700 Lila® Mix Injector Pharma Co. Development programme on track
IDC300 Oral IDC Pharma Co. Good progress; launch expected mid 2018
VAL050 MDI valve /
actuator
Aeropharm Development contract ongoing
OCU050 Ocular device/
formulation /
filling
Oxular Early stage programme
SYR075 Syrina® /
Vapoursoft® Global
Biopharma
Development proceeding according to plan
*As these products have been terminated, going forwards, they will not be included in the development pipeline
DPI = Dry Powder Inhaler, MDI = Metered Dose Inhaler, POC = Point of Care, IDC = Integrated Dose Counter
Innovation
The innovation team continues to work on a number of opportunities in its dedicated facilities in
Cambridge. We have maintained our investment and remain committed to investing in developing
our new technology platforms on a range of opportunities.
This innovation team has been exceedingly busy particularly with the growing interest in the injectables
franchise with biotech and pharmaceutical companies that complement our current customer
portfolio. This demonstrates the strength and success of our innovation drive and strategy to broaden
and diversify our product and customer base.
9
Syrina®, Lila® & Lapas® Update
Vapoursoft® powered Syrina® auto-injectors, Vapoursoft® powered Lapas® auto-injectors, and our Lila®
Mix and Duo technologies have continued to generate widespread interest as innovative and novel
drug delivery systems and devices, with several biotech and pharmaceutical companies initiating
feasibility and development programmes for their injectable drug portfolios.
The product range includes the Syrina® AR 2.25 auto-injector that is suitable for delivering volumes of up
to 2.0ml using a standard 2.25ml pre-filled syringe. The Syrina® AR 2.25 provides patients with a fully-
automatic two-step, compact device for the self-administration of viscous drug formulations. It is able
to deliver 2.0 ml of viscous drug solutions smoothly and safely in less than 15 seconds. Designed with a
hidden needle, Syrina® AR 2.25 offers automatic needle insertion and retraction, as well as drug
delivery with a single push-on-skin operation. Syrina® AR 2.25 has been tailored specifically for higher
viscosities while still enabling the safe use of glass syringes.
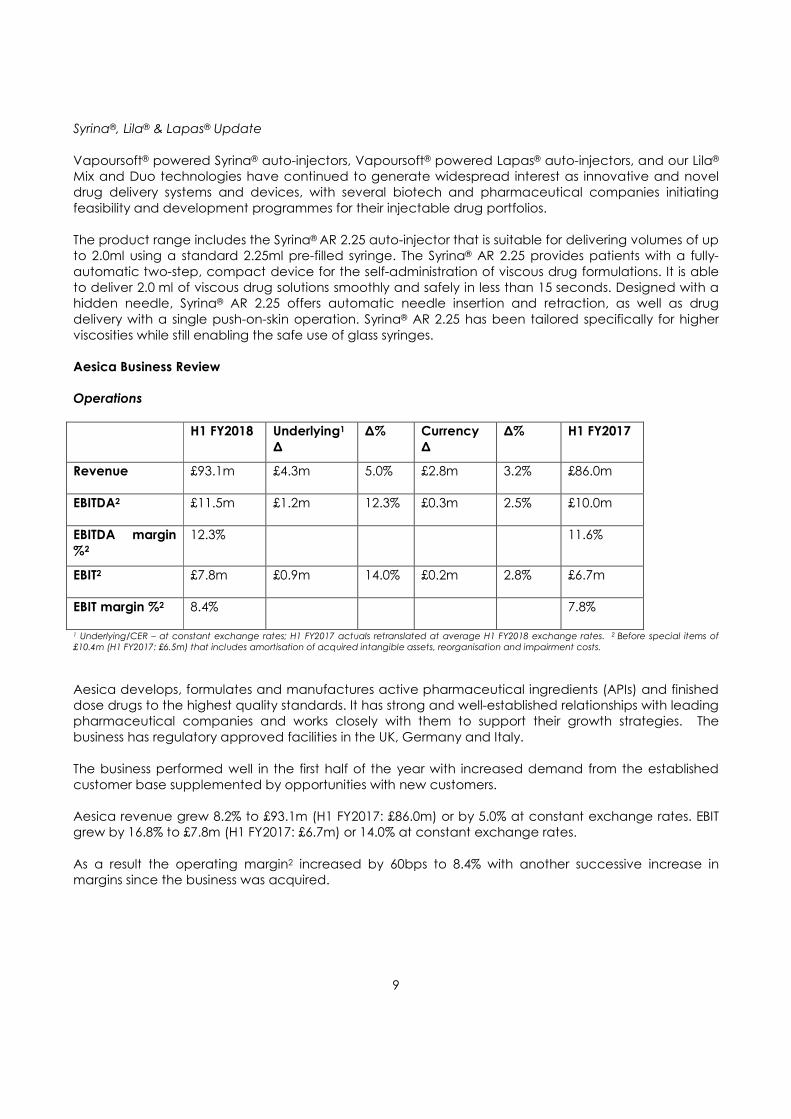
Aesica Business Review
Operations
H1 FY2018 Underlying1
∆
∆% Currency
∆
∆% H1 FY2017
Revenue £93.1m £4.3m 5.0% £2.8m 3.2% £86.0m
EBITDA2 £11.5m £1.2m 12.3% £0.3m 2.5% £10.0m
EBITDA margin
%2
12.3% 11.6%
EBIT2 £7.8m £0.9m 14.0% £0.2m 2.8% £6.7m
EBIT margin %2 8.4% 7.8%
1 Underlying/CER – at constant exchange rates; H1 FY2017 actuals retranslated at average H1 FY2018 exchange rates. 2 Before special items of
£10.4m (H1 FY2017: £6.5m) that includes amortisation of acquired intangible assets, reorganisation and impairment costs.
Aesica develops, formulates and manufactures active pharmaceutical ingredients (APIs) and finished
dose drugs to the highest quality standards. It has strong and well-established relationships with leading
pharmaceutical companies and works closely with them to support their growth strategies. The
business has regulatory approved facilities in the UK, Germany and Italy.
The business performed well in the first half of the year with increased demand from the established
customer base supplemented by opportunities with new customers.
Aesica revenue grew 8.2% to £93.1m (H1 FY2017: £86.0m) or by 5.0% at constant exchange rates. EBIT
grew by 16.8% to £7.8m (H1 FY2017: £6.7m) or 14.0% at constant exchange rates.
As a result the operating margin2 increased by 60bps to 8.4% with another successive increase in
margins since the business was acquired.
10
Business Development and Innovation
The further underlying growth in both sales and profits includes winning a number of new contracts. We
continue to focus on providing a high quality performance to our customers alongside our broad
range of capabilities that helps differentiate our offering in this market. Aesica has also maintained its
good regulatory compliance record following several routine compliance audits, and this expertise is
successfully being shared across the wider Group.
The business has identified a number of attractive business development opportunities with pharma
companies looking to source oral products and has seen further growth in demand for its liquid
formulation services at the Pianezza site, in Italy. There have also been new contract awards for our
finished dose business based in Monheim and Zwickau, Germany.
The Aesica commercial team is focused on a growing number of formulation development and
manufacturing opportunities. This includes making good progress on a significant new API opportunity.
We have also secured a new customer for our semi-continuous processing line and technology
installed at the Queenborough site and will commence supply in the second half of the year. We are
continuing to explore opportunities with further customers and support them with their development
work.
Aesica has continued to progress and invest in serialisation capabilities which allow the identification of
products at the individual pack level. Aesica is starting to benefit from being an early provider of this
technology to support customers in countries such as China and Latin America that have
implemented this technology to trace authentic drugs. Aesica is well advanced in developing the
service to support and take on customers for the next wave of countries adopting serialisation
including the EU.
Other Financial
Pensions
The IAS 19 pension valuation at 31 October 2017 showed a total deficit of £25.1m (30 April 2017:
£44.6m). The bulk of the decrease in the deficit arises from a decrease in the benefit obligation due to
changes in the discount rate, inflation and census data. Recovery contributions of £1.5m per annum
are being made to the Bespak scheme. The triennial actuarial valuation is being reviewed with an
effective date of 30 April 2017.
Tax
The effective tax rate on PBT before special items is 19.9% (H1 FY2017: 16.1%). The increase in the rate
from the prior period reflects the non-repetition of the benefit in the prior year where historic
development losses in the Medical House (ASI) Ltd. were recognised as a tax asset following the
approval and launch of UCB’s Cimzia® autoinjector. This is line with our expectations of an effective tax
rate of c.16% for the full year with the first half reflecting the anticipated higher mix of European profits
at higher effective tax rates in the first half of the year.
Principal risks and uncertainties
The principal risks and uncertainties deemed relevant for the remainder of the financial year are
considered in note 14 to the financial statements.
11
Outlook
Consort has continued to deliver underlying1 revenue and profit growth in both divisions. Bespak has
delivered another solid performance and made good progress in developing our devices business
including our Syrina® / VapourSoft® auto-injectors that present exciting growth opportunities. Aesica
has been awarded new API, finished dose and packaging contracts and secured a second contract
on the semi-continuous processing line.
We remain focussed on the organic development of Consort while considering acquisition
opportunities that allow access to new geographic markets and complementary technologies. The
Board remains confident of Consort’s future prospects supported by a robust financial position and a
strong development pipeline.
12
Statement of directors’ responsibilities
The directors confirm that these condensed interim financial statements have been prepared in
accordance with International Accounting Standard 34, ‘Interim Financial Reporting’, as adopted by
the European Union and that the interim management report includes a fair review of the information
required by DTR 4.2.7 and DTR 4.2.8, namely:
• an indication of important events that have occurred during the first six months and their
impact on the condensed set of financial statements, and a description of the principal risks
and uncertainties for the remaining six months of the financial year; and
• material related-party transactions in the first six months and any material changes in the
related-party transactions described in the last annual report.
The directors of Consort Medical plc are listed in the Consort Medical plc Annual Report for the year
ended 30 April 2017. A list of current directors is maintained on the Consort Medical plc website:
www.consortmedical.com.
By order of the Board
Paul Hayes
Chief Financial Officer
4 December 2017
Independent review report to Consort Medical plc
Introduction
We have been engaged by the company to review the condensed set of financial statements in the
half-yearly financial report for the six months ended 31 October 2017 which comprises the
consolidated Income Statement, consolidated Statement of Comprehensive Income, consolidated
Balance Sheet, consolidated Statement of Changes in Shareholders’ Equity, consolidated Cash Flow
Statement and the related explanatory notes. We have read the other information contained in the
half-yearly financial report and considered whether it contains any apparent misstatements or material
inconsistencies with the information in the condensed set of financial statements.
This report is made solely to the company in accordance with the terms of our engagement to assist
the company in meeting the requirements of the Disclosure and Transparency Rules (“the DTR”) of the
UK’s Financial Conduct Authority (“the UK FCA”). Our review has been undertaken so that we might
state to the company those matters we are required to state to it in this report and for no other
purpose. To the fullest extent permitted by law, we do not accept or assume responsibility to anyone
other than the company for our review work, for this report, or for the conclusions we have reached.

13
Directors’ responsibilities
The half-yearly financial report is the responsibility of, and has been approved by, the directors. The
directors are responsible for preparing the half-yearly financial report in accordance with the DTR of
the UK FCA.
The annual financial statements of the group are prepared in accordance with IFRSs as adopted by
the EU. The condensed set of financial statements included in this half-yearly financial report has been
prepared in accordance with IAS 34 Interim Financial Reporting as adopted by the EU.
Our responsibility
Our responsibility is to express to the company a conclusion on the condensed set of financial
statements in the half-yearly financial report based on our review.
Scope of review
We conducted our review in accordance with International Standard on Review Engagements (UK
and Ireland) 2410 Review of Interim Financial Information Performed by the Independent Auditor of the
Entity issued by the Auditing Practices Board for use in the UK. A review of interim financial information
consists of making enquiries, primarily of persons responsible for financial and accounting matters, and
applying analytical and other review procedures. A review is substantially less in scope than an audit
conducted in accordance with International Standards on Auditing (UK and Ireland) and
consequently does not enable us to obtain assurance that we would become aware of all significant
matters that might be identified in an audit. Accordingly, we do not express an audit opinion.
Conclusion
Based on our review, nothing has come to our attention that causes us to believe that the condensed
set of financial statements in the half-yearly financial report for the six months ended 31 October 2017
is not prepared, in all material respects, in accordance with IAS 34 as adopted by the EU and the DTR
of the UK FCA.
Lynton Richmond
for and on behalf of KPMG LLP
Chartered Accountants
15 Canada Square
London
E14 5GL
4 December 2017
14
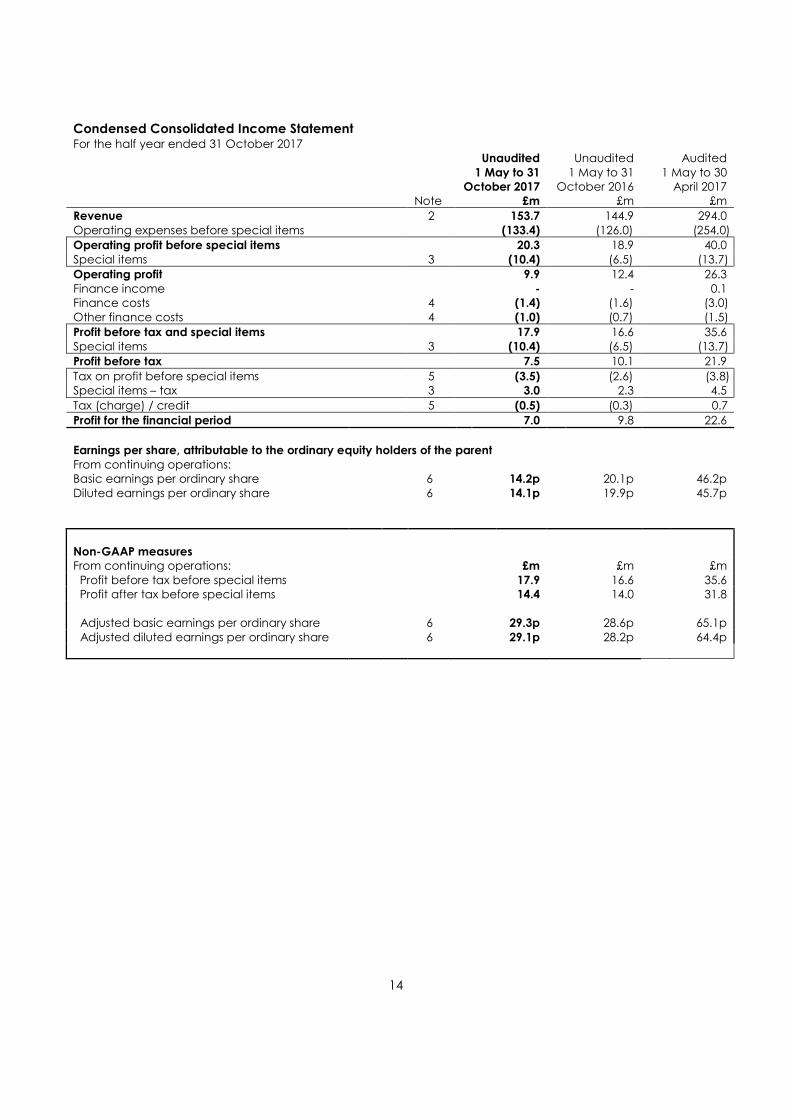
Condensed Consolidated Income Statement For the half year ended 31 October 2017
Unaudited
1 May to 31
October 2017
Unaudited
1 May to 31 October 2016
Audited
1 May to 30 April 2017
Note £m £m £m
Revenue 2 153.7 144.9 294.0
Operating expenses before special items (133.4) (126.0) (254.0)
Operating profit before special items 20.3 18.9 40.0
Special items 3 (10.4) (6.5) (13.7)
Operating profit 9.9 12.4 26.3
Finance income - - 0.1 Finance costs 4 (1.4) (1.6) (3.0)
Other finance costs 4 (1.0) (0.7) (1.5)
Profit before tax and special items 17.9 16.6 35.6
Special items 3 (10.4) (6.5) (13.7)
Profit before tax 7.5 10.1 21.9
Tax on profit before special items 5 (3.5) (2.6) (3.8) Special items – tax 3 3.0 2.3 4.5
Tax (charge) / credit 5 (0.5) (0.3) 0.7
Profit for the financial period 7.0 9.8 22.6
Earnings per share, attributable to the ordinary equity holders of the parent
From continuing operations: Basic earnings per ordinary share 6 14.2p 20.1p 46.2p
Diluted earnings per ordinary share 6 14.1p 19.9p 45.7p
Non-GAAP measures
From continuing operations: £m £m £m
Profit before tax before special items 17.9 16.6 35.6 Profit after tax before special items 14.4 14.0 31.8
Adjusted basic earnings per ordinary share 6 29.3p 28.6p 65.1p
Adjusted diluted earnings per ordinary share 6 29.1p 28.2p 64.4p
15
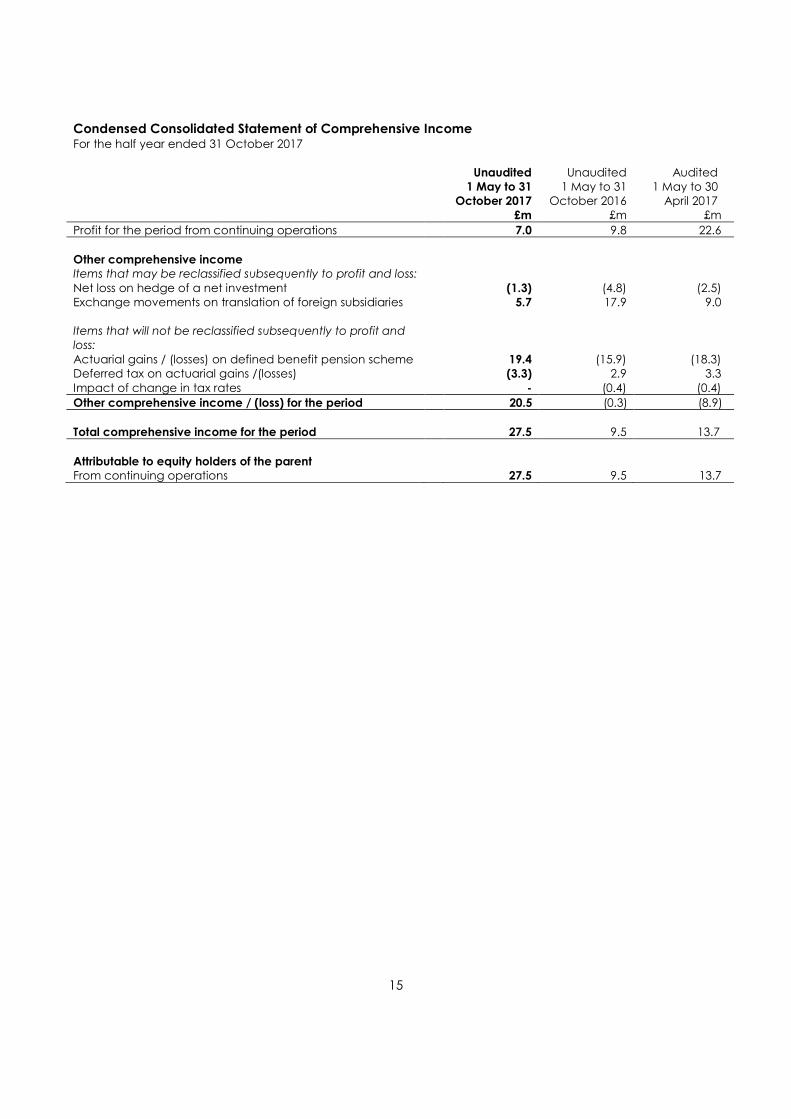
Condensed Consolidated Statement of Comprehensive Income For the half year ended 31 October 2017
Unaudited
1 May to 31
October 2017
Unaudited 1 May to 31
October 2016
Audited 1 May to 30 April 2017
£m £m £m
Profit for the period from continuing operations 7.0 9.8 22.6
Other comprehensive income Items that may be reclassified subsequently to profit and loss:
Net loss on hedge of a net investment (1.3) (4.8) (2.5) Exchange movements on translation of foreign subsidiaries 5.7 17.9 9.0
Items that will not be reclassified subsequently to profit and
loss:
Actuarial gains / (losses) on defined benefit pension scheme 19.4 (15.9) (18.3) Deferred tax on actuarial gains /(losses) (3.3) 2.9 3.3
Impact of change in tax rates - (0.4) (0.4)
Other comprehensive income / (loss) for the period 20.5 (0.3) (8.9)
Total comprehensive income for the period 27.5 9.5 13.7
Attributable to equity holders of the parent From continuing operations 27.5 9.5 13.7
16
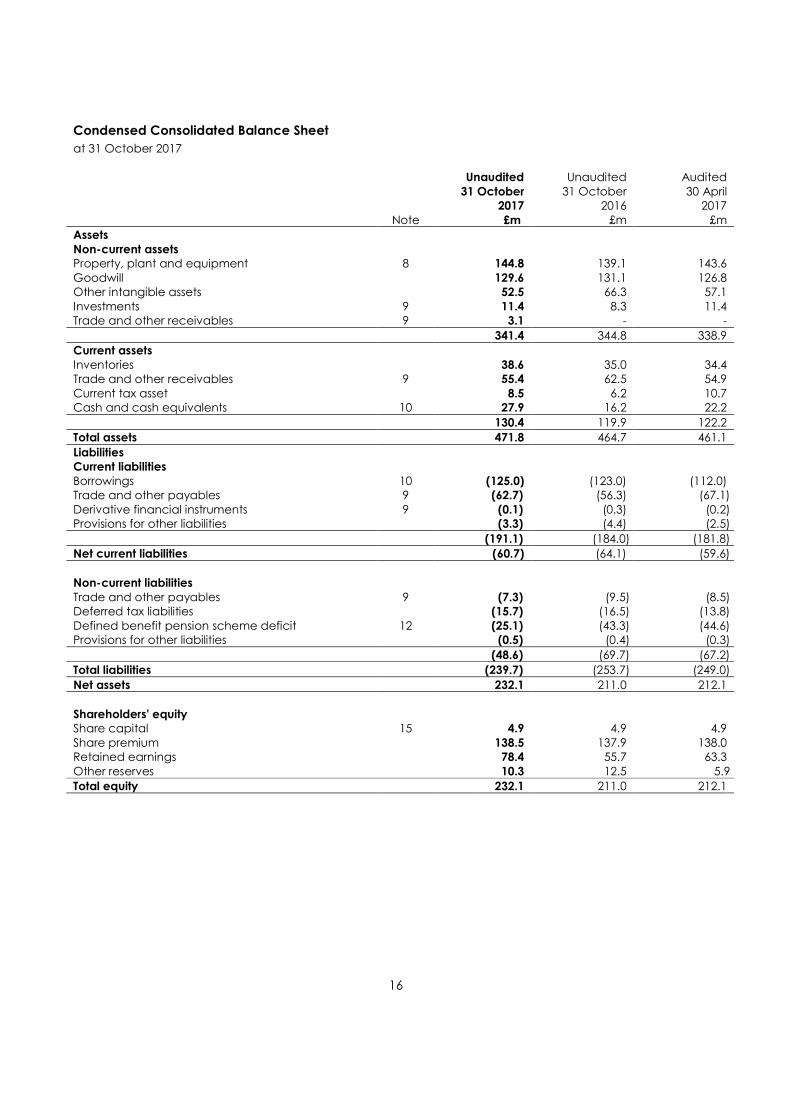
Condensed Consolidated Balance Sheet
at 31 October 2017
Unaudited
31 October
2017
Unaudited
31 October 2016
Audited
30 April 2017
Note £m £m £m
Assets
Non-current assets Property, plant and equipment 8 144.8 139.1 143.6
Goodwill 129.6 131.1 126.8 Other intangible assets 52.5 66.3 57.1
Investments 9 11.4 8.3 11.4 Trade and other receivables 9 3.1 - -
341.4 344.8 338.9
Current assets
Inventories 38.6 35.0 34.4 Trade and other receivables 9 55.4 62.5 54.9
Current tax asset 8.5 6.2 10.7 Cash and cash equivalents 10 27.9 16.2 22.2
130.4 119.9 122.2
Total assets 471.8 464.7 461.1
Liabilities Current liabilities
Borrowings 10 (125.0) (123.0) (112.0) Trade and other payables 9 (62.7) (56.3) (67.1)
Derivative financial instruments 9 (0.1) (0.3) (0.2) Provisions for other liabilities (3.3) (4.4) (2.5)
(191.1) (184.0) (181.8)
Net current liabilities (60.7) (64.1) (59.6)
Non-current liabilities
Trade and other payables 9 (7.3) (9.5) (8.5) Deferred tax liabilities (15.7) (16.5) (13.8)
Defined benefit pension scheme deficit 12 (25.1) (43.3) (44.6) Provisions for other liabilities (0.5) (0.4) (0.3)
(48.6) (69.7) (67.2)
Total liabilities (239.7) (253.7) (249.0)
Net assets 232.1 211.0 212.1
Shareholders' equity Share capital 15 4.9 4.9 4.9
Share premium 138.5 137.9 138.0 Retained earnings 78.4 55.7 63.3
Other reserves 10.3 12.5 5.9
Total equity 232.1 211.0 212.1
17
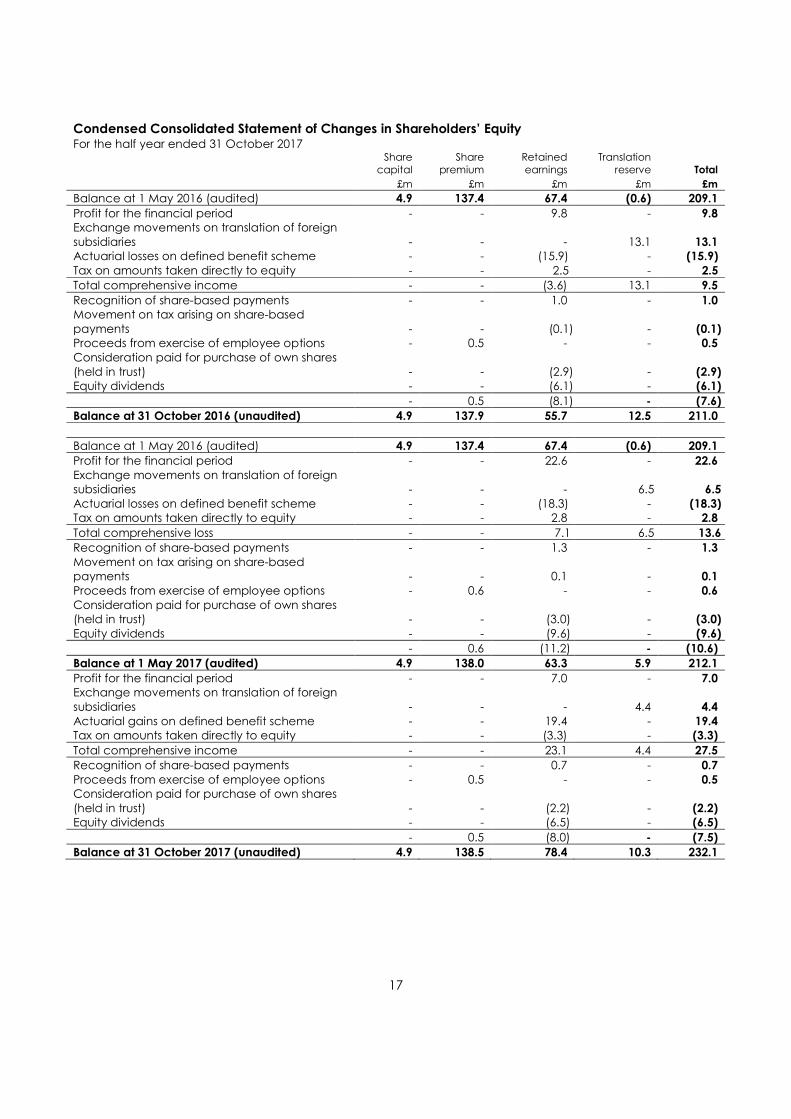
Condensed Consolidated Statement of Changes in Shareholders’ Equity
For the half year ended 31 October 2017
Share
capital Share
premium Retained earnings
Translation reserve Total
£m £m £m £m £m
Balance at 1 May 2016 (audited) 4.9 137.4 67.4 (0.6) 209.1
Profit for the financial period - - 9.8 - 9.8
Exchange movements on translation of foreign
subsidiaries - - - 13.1 13.1
Actuarial losses on defined benefit scheme - - (15.9) - (15.9)
Tax on amounts taken directly to equity - - 2.5 - 2.5
Total comprehensive income - - (3.6) 13.1 9.5
Recognition of share-based payments - - 1.0 - 1.0
Movement on tax arising on share-based
payments - - (0.1) - (0.1)
Proceeds from exercise of employee options - 0.5 - - 0.5
Consideration paid for purchase of own shares
(held in trust) - - (2.9) - (2.9)
Equity dividends - - (6.1) - (6.1)
- 0.5 (8.1) - (7.6)
Balance at 31 October 2016 (unaudited) 4.9 137.9 55.7 12.5 211.0
Balance at 1 May 2016 (audited) 4.9 137.4 67.4 (0.6) 209.1
Profit for the financial period - - 22.6 - 22.6
Exchange movements on translation of foreign subsidiaries - - - 6.5 6.5
Actuarial losses on defined benefit scheme - - (18.3) - (18.3)
Tax on amounts taken directly to equity - - 2.8 - 2.8
Total comprehensive loss - - 7.1 6.5 13.6
Recognition of share-based payments - - 1.3 - 1.3
Movement on tax arising on share-based payments - - 0.1 - 0.1
Proceeds from exercise of employee options - 0.6 - - 0.6
Consideration paid for purchase of own shares (held in trust) - - (3.0) - (3.0)
Equity dividends - - (9.6) - (9.6)
- 0.6 (11.2) - (10.6)
Balance at 1 May 2017 (audited) 4.9 138.0 63.3 5.9 212.1
Profit for the financial period - - 7.0 - 7.0
Exchange movements on translation of foreign
subsidiaries - - - 4.4 4.4
Actuarial gains on defined benefit scheme - - 19.4 - 19.4
Tax on amounts taken directly to equity - - (3.3) - (3.3)
Total comprehensive income - - 23.1 4.4 27.5
Recognition of share-based payments - - 0.7 - 0.7
Proceeds from exercise of employee options - 0.5 - - 0.5
Consideration paid for purchase of own shares
(held in trust) - - (2.2) - (2.2)
Equity dividends - - (6.5) - (6.5)
- 0.5 (8.0) - (7.5)
Balance at 31 October 2017 (unaudited) 4.9 138.5 78.4 10.3 232.1
18
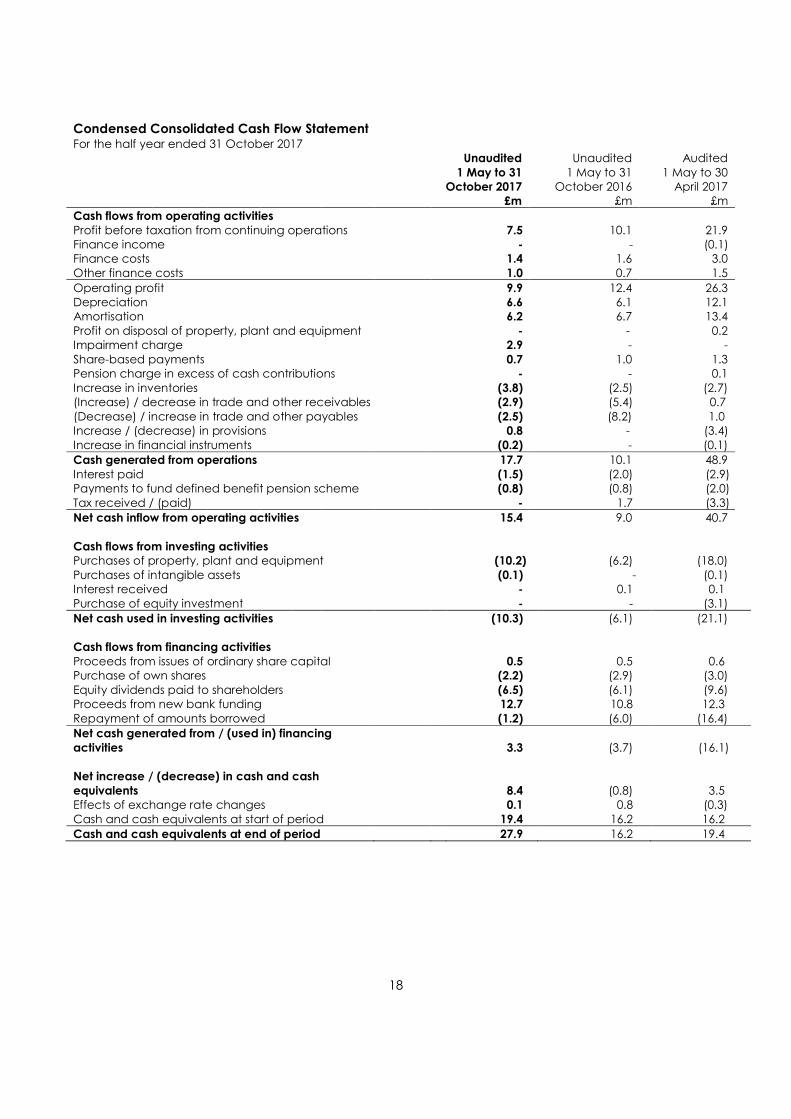
Condensed Consolidated Cash Flow Statement For the half year ended 31 October 2017
Unaudited
1 May to 31
October 2017
Unaudited
1 May to 31 October 2016
Audited
1 May to 30 April 2017
£m £m £m
Cash flows from operating activities
Profit before taxation from continuing operations 7.5 10.1 21.9 Finance income - - (0.1) Finance costs 1.4 1.6 3.0
Other finance costs 1.0 0.7 1.5
Operating profit 9.9 12.4 26.3 Depreciation 6.6 6.1 12.1 Amortisation 6.2 6.7 13.4
Profit on disposal of property, plant and equipment - - 0.2 Impairment charge 2.9 - -
Share-based payments 0.7 1.0 1.3 Pension charge in excess of cash contributions - - 0.1
Increase in inventories (3.8) (2.5) (2.7) (Increase) / decrease in trade and other receivables (2.9) (5.4) 0.7
(Decrease) / increase in trade and other payables (2.5) (8.2) 1.0 Increase / (decrease) in provisions 0.8 - (3.4)
Increase in financial instruments (0.2) - (0.1)
Cash generated from operations 17.7 10.1 48.9
Interest paid (1.5) (2.0) (2.9) Payments to fund defined benefit pension scheme (0.8) (0.8) (2.0)
Tax received / (paid) - 1.7 (3.3)
Net cash inflow from operating activities 15.4 9.0 40.7
Cash flows from investing activities Purchases of property, plant and equipment (10.2) (6.2) (18.0)
Purchases of intangible assets (0.1) - (0.1) Interest received - 0.1 0.1
Purchase of equity investment - - (3.1)
Net cash used in investing activities (10.3) (6.1) (21.1)
Cash flows from financing activities
Proceeds from issues of ordinary share capital 0.5 0.5 0.6 Purchase of own shares (2.2) (2.9) (3.0)
Equity dividends paid to shareholders (6.5) (6.1) (9.6) Proceeds from new bank funding 12.7 10.8 12.3
Repayment of amounts borrowed (1.2) (6.0) (16.4)
Net cash generated from / (used in) financing
activities 3.3 (3.7)
(16.1)
Net increase / (decrease) in cash and cash
equivalents 8.4 (0.8) 3.5 Effects of exchange rate changes 0.1 0.8 (0.3)
Cash and cash equivalents at start of period 19.4 16.2 16.2
Cash and cash equivalents at end of period 27.9 16.2 19.4
19
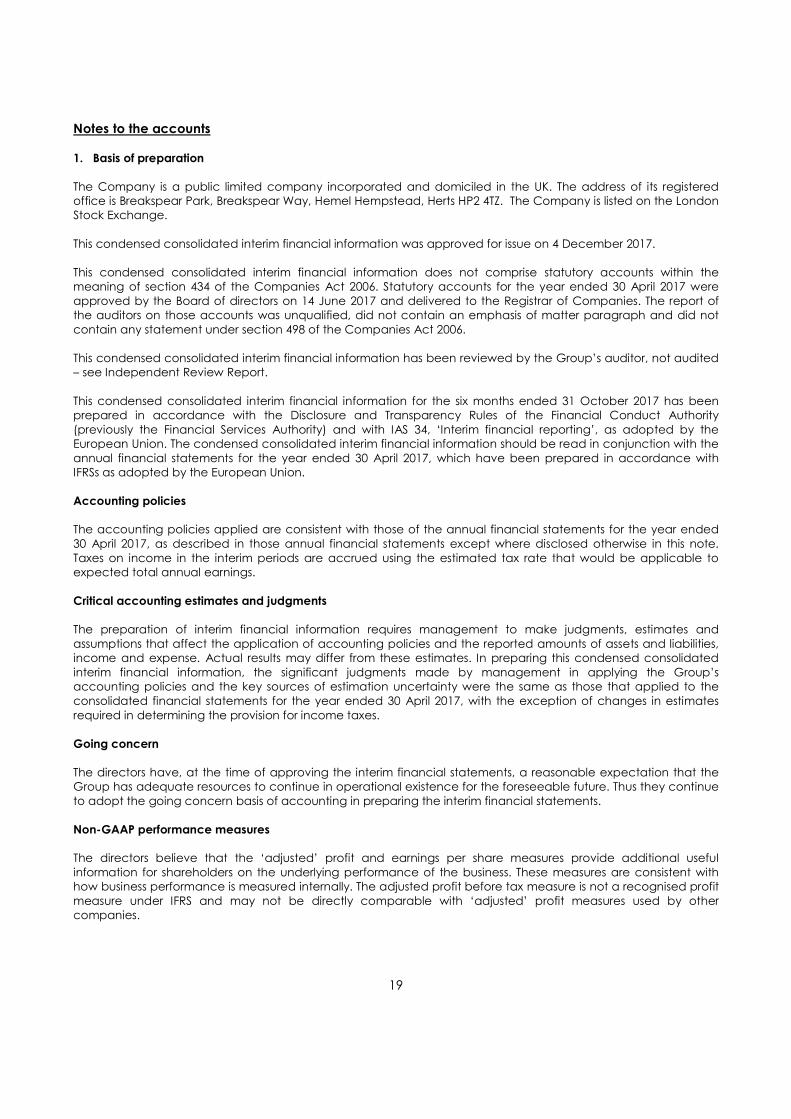
Notes to the accounts
1. Basis of preparation
The Company is a public limited company incorporated and domiciled in the UK. The address of its registered office is Breakspear Park, Breakspear Way, Hemel Hempstead, Herts HP2 4TZ. The Company is listed on the London Stock Exchange.
This condensed consolidated interim financial information was approved for issue on 4 December 2017.
This condensed consolidated interim financial information does not comprise statutory accounts within the meaning of section 434 of the Companies Act 2006. Statutory accounts for the year ended 30 April 2017 were
approved by the Board of directors on 14 June 2017 and delivered to the Registrar of Companies. The report of the auditors on those accounts was unqualified, did not contain an emphasis of matter paragraph and did not
contain any statement under section 498 of the Companies Act 2006.
This condensed consolidated interim financial information has been reviewed by the Group’s auditor, not audited – see Independent Review Report.
This condensed consolidated interim financial information for the six months ended 31 October 2017 has been prepared in accordance with the Disclosure and Transparency Rules of the Financial Conduct Authority
(previously the Financial Services Authority) and with IAS 34, ‘Interim financial reporting’, as adopted by the European Union. The condensed consolidated interim financial information should be read in conjunction with the
annual financial statements for the year ended 30 April 2017, which have been prepared in accordance with IFRSs as adopted by the European Union.
Accounting policies
The accounting policies applied are consistent with those of the annual financial statements for the year ended
30 April 2017, as described in those annual financial statements except where disclosed otherwise in this note.
Taxes on income in the interim periods are accrued using the estimated tax rate that would be applicable to expected total annual earnings.
Critical accounting estimates and judgments
The preparation of interim financial information requires management to make judgments, estimates and
assumptions that affect the application of accounting policies and the reported amounts of assets and liabilities, income and expense. Actual results may differ from these estimates. In preparing this condensed consolidated
interim financial information, the significant judgments made by management in applying the Group’s accounting policies and the key sources of estimation uncertainty were the same as those that applied to the
consolidated financial statements for the year ended 30 April 2017, with the exception of changes in estimates
required in determining the provision for income taxes.
Going concern
The directors have, at the time of approving the interim financial statements, a reasonable expectation that the Group has adequate resources to continue in operational existence for the foreseeable future. Thus they continue
to adopt the going concern basis of accounting in preparing the interim financial statements.
Non-GAAP performance measures
The directors believe that the ‘adjusted’ profit and earnings per share measures provide additional useful
information for shareholders on the underlying performance of the business. These measures are consistent with how business performance is measured internally. The adjusted profit before tax measure is not a recognised profit
measure under IFRS and may not be directly comparable with ‘adjusted’ profit measures used by other companies.

20
Notes to the accounts (continued) 1. Basis of preparation (continued)
Further details on the special items can be found in note 3. Alternative Performance Measures and the treatment of special items
In addition to statutory measures, a number of alternative performance measures are included in this Interim report to provide a clear understanding of the Group's performance. These measures assist investors in gaining a
balanced view of the Company's performance across the industry. The alternative performance measures used include EBIT (or operating profit), EBITDA, PBT and EPS performance adjusted to eliminate special items that are
costs relating to acquisitions or significant items which are not linked to the underlying performance of the business. Constant exchange rate measures eliminate the impact of currency movements by comparing the
current measure against the comparative restated at this year's average exchange rate. Where we provide adjusted performance measures, they are compared to the equivalent measures in the prior year.
The directors believe that the "adjusted" profit and earnings per share measures provide additional useful
information for shareholders on the underlying performance of the business. These measures are consistent with
how business performance is measured internally.
Further detail on the special items in the year can be found in note 3. The directors also refer to EBITDA (earnings before interest, tax, depreciation and amortisation) as a performance indicator. EBITDA also adds back any profit
or loss on disposal of property, plant and equipment.
Reconciliations of the significant APMs are included below:
Unaudited
1 May to 31
October 2017
Unaudited 1 May to 31
October 2016
Audited 1 May to 30
April 2017
£m £m £m
Operating profit (EBIT) before special items 20.3 18.9 40.0 Depreciation 6.6 6.1 12.1 Amortisation 6.2 6.7 13.4
Less: Amortisation of acquired intangibles (note 3) (6.1) (6.5) (13.0) Loss on disposal of property, plant and equipment - - 0.2
EBITDA before special items 27.0 25.2 52.7
EBIT before special items 20.3 18.9 40.0 Finance income - - 0.1
Finance costs (1.4) (1.6) (3.0) Other finance costs (1.0) (0.7) (1.5)
Profit before tax before special items (PBT) 17.9 16.6 35.6
At constant exchange rates (CER) – H1 FY2017 restated at the average rate (see above) in H1 FY2018:
Reported
2017 CER
2017
£m £m
Revenue 144.9 147.7
EBIT before special items 18.9 19.1
PBT before special items 16.6 16.8 Adjusted basic EPS (p) 28.6 29.0
21
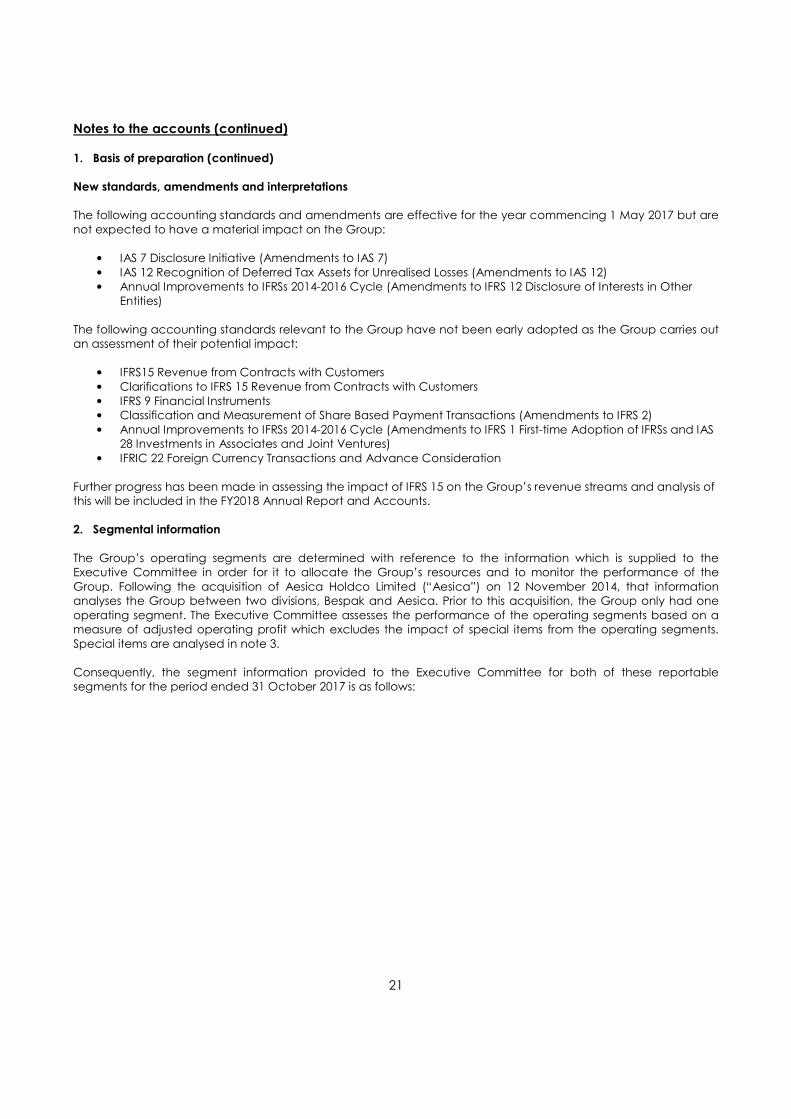
Notes to the accounts (continued) 1. Basis of preparation (continued)
New standards, amendments and interpretations
The following accounting standards and amendments are effective for the year commencing 1 May 2017 but are
not expected to have a material impact on the Group:
• IAS 7 Disclosure Initiative (Amendments to IAS 7)
• IAS 12 Recognition of Deferred Tax Assets for Unrealised Losses (Amendments to IAS 12) • Annual Improvements to IFRSs 2014-2016 Cycle (Amendments to IFRS 12 Disclosure of Interests in Other
Entities)
The following accounting standards relevant to the Group have not been early adopted as the Group carries out an assessment of their potential impact:
• IFRS15 Revenue from Contracts with Customers
• Clarifications to IFRS 15 Revenue from Contracts with Customers
• IFRS 9 Financial Instruments • Classification and Measurement of Share Based Payment Transactions (Amendments to IFRS 2)
• Annual Improvements to IFRSs 2014-2016 Cycle (Amendments to IFRS 1 First-time Adoption of IFRSs and IAS 28 Investments in Associates and Joint Ventures)
• IFRIC 22 Foreign Currency Transactions and Advance Consideration
Further progress has been made in assessing the impact of IFRS 15 on the Group’s revenue streams and analysis of this will be included in the FY2018 Annual Report and Accounts.
2. Segmental information
The Group’s operating segments are determined with reference to the information which is supplied to the Executive Committee in order for it to allocate the Group’s resources and to monitor the performance of the
Group. Following the acquisition of Aesica Holdco Limited (“Aesica”) on 12 November 2014, that information analyses the Group between two divisions, Bespak and Aesica. Prior to this acquisition, the Group only had one
operating segment. The Executive Committee assesses the performance of the operating segments based on a measure of adjusted operating profit which excludes the impact of special items from the operating segments.
Special items are analysed in note 3.
Consequently, the segment information provided to the Executive Committee for both of these reportable segments for the period ended 31 October 2017 is as follows:
22
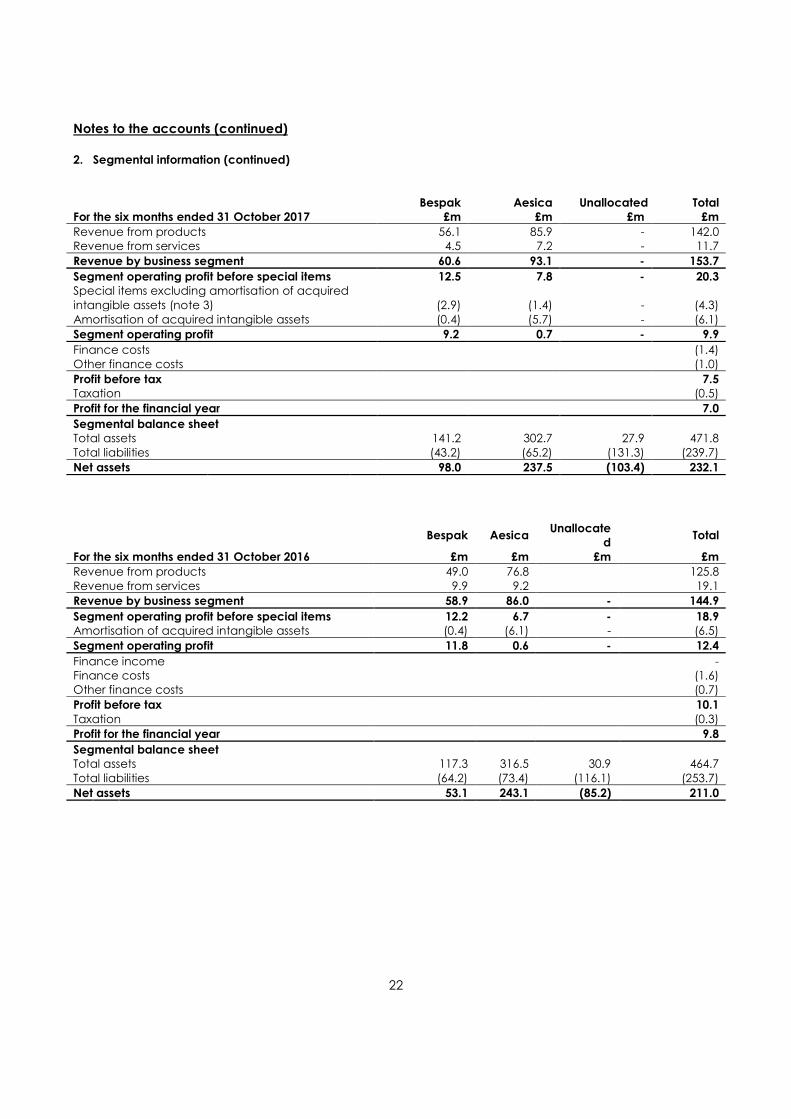
Notes to the accounts (continued)
2. Segmental information (continued)
Bespak Aesica Unallocated Total
For the six months ended 31 October 2017 £m £m £m £m
Revenue from products 56.1 85.9 - 142.0 Revenue from services 4.5 7.2 - 11.7
Revenue by business segment 60.6 93.1 - 153.7
Segment operating profit before special items 12.5 7.8 - 20.3
Special items excluding amortisation of acquired
intangible assets (note 3) (2.9) (1.4) - (4.3)
Amortisation of acquired intangible assets (0.4) (5.7) - (6.1)
Segment operating profit 9.2 0.7 - 9.9
Finance costs (1.4)
Other finance costs (1.0)
Profit before tax 7.5 Taxation (0.5)
Profit for the financial year 7.0
Segmental balance sheet
Total assets 141.2 302.7 27.9 471.8
Total liabilities (43.2) (65.2) (131.3) (239.7)
Net assets 98.0 237.5 (103.4) 232.1
Bespak Aesica Unallocate
d Total
For the six months ended 31 October 2016 £m £m £m £m
Revenue from products 49.0 76.8 125.8
Revenue from services 9.9 9.2 19.1
Revenue by business segment 58.9 86.0 - 144.9
Segment operating profit before special items 12.2 6.7 - 18.9
Amortisation of acquired intangible assets (0.4) (6.1) - (6.5)
Segment operating profit 11.8 0.6 - 12.4
Finance income - Finance costs (1.6) Other finance costs (0.7)
Profit before tax 10.1
Taxation (0.3)
Profit for the financial year 9.8
Segmental balance sheet
Total assets 117.3 316.5 30.9 464.7
Total liabilities (64.2) (73.4) (116.1) (253.7)
Net assets 53.1 243.1 (85.2) 211.0

23
Notes to the accounts (continued)
2. Segmental information (continued)
Bespak Aesica Unallocated Total
For the year ended 30 April 2017 £m £m £m £m
Revenue from products 105.3 155.4 - 260.7
Revenue from services 15.8 17.5 - 33.3
Total revenue 121.1 172.9 - 294.0
Segment operating profit before special items 26.1 13.9 - 40.0
Special items excluding amortisation of acquired
intangible assets (note 3) - - (0.7) (0.7) Amortisation of acquired intangible assets (0.8) (12.2) - (13.0)
Segment operating profit 25.3 1.7 (0.7) 26.3
Finance income 0.1
Finance costs (3.0) Other finance costs (1.5)
Profit before tax 21.9 Taxation 0.7
Profit for the financial year 22.6
Segmental balance sheet
Total assets 139.1 299.7 22.3 461.1 Total liabilities (63.5) (69.8) (115.7) (249.0)
Net assets 75.6 229.9 (93.4) 212.1
The Group’s operating locations are based in the United Kingdom and Europe, with the Group also making sales in
the USA and the rest of the world.
Revenue by destination from continuing
operations
Unaudited
1 May to 31
October 2017
Unaudited
1 May to 31 October 2016
Audited
1 May to 30 April 2017
£m £m £m
United Kingdom 13.3 19.8 24.9
United States of America 25.0 24.6 47.9 Europe 100.0 92.5 181.3
Rest of the world 15.4 8.0 39.9
Revenue from continuing operations 153.7 144.9 294.0
24
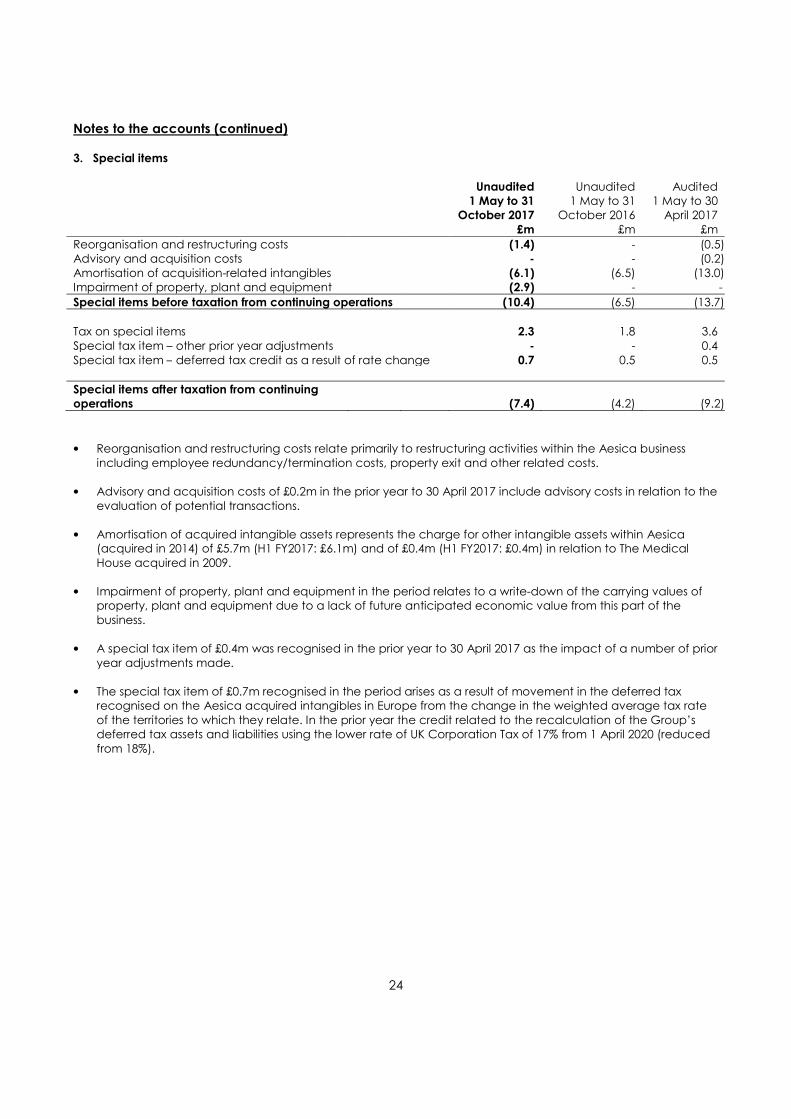
Notes to the accounts (continued) 3. Special items
Unaudited
1 May to 31
October 2017
Unaudited 1 May to 31
October 2016
Audited 1 May to 30 April 2017
£m £m £m
Reorganisation and restructuring costs (1.4) - (0.5)Advisory and acquisition costs - - (0.2)
Amortisation of acquisition-related intangibles (6.1) (6.5) (13.0)Impairment of property, plant and equipment (2.9) - -
Special items before taxation from continuing operations (10.4) (6.5) (13.7)
Tax on special items 2.3 1.8 3.6
Special tax item – other prior year adjustments - - 0.4
Special tax item – deferred tax credit as a result of rate change 0.7 0.5 0.5
Special items after taxation from continuing
operations (7.4) (4.2) (9.2)
• Reorganisation and restructuring costs relate primarily to restructuring activities within the Aesica business
including employee redundancy/termination costs, property exit and other related costs.
• Advisory and acquisition costs of £0.2m in the prior year to 30 April 2017 include advisory costs in relation to the
evaluation of potential transactions.
• Amortisation of acquired intangible assets represents the charge for other intangible assets within Aesica (acquired in 2014) of £5.7m (H1 FY2017: £6.1m) and of £0.4m (H1 FY2017: £0.4m) in relation to The Medical
House acquired in 2009.
• Impairment of property, plant and equipment in the period relates to a write-down of the carrying values of property, plant and equipment due to a lack of future anticipated economic value from this part of the
business.
• A special tax item of £0.4m was recognised in the prior year to 30 April 2017 as the impact of a number of prior
year adjustments made.
• The special tax item of £0.7m recognised in the period arises as a result of movement in the deferred tax recognised on the Aesica acquired intangibles in Europe from the change in the weighted average tax rate
of the territories to which they relate. In the prior year the credit related to the recalculation of the Group’s deferred tax assets and liabilities using the lower rate of UK Corporation Tax of 17% from 1 April 2020 (reduced
from 18%).
25
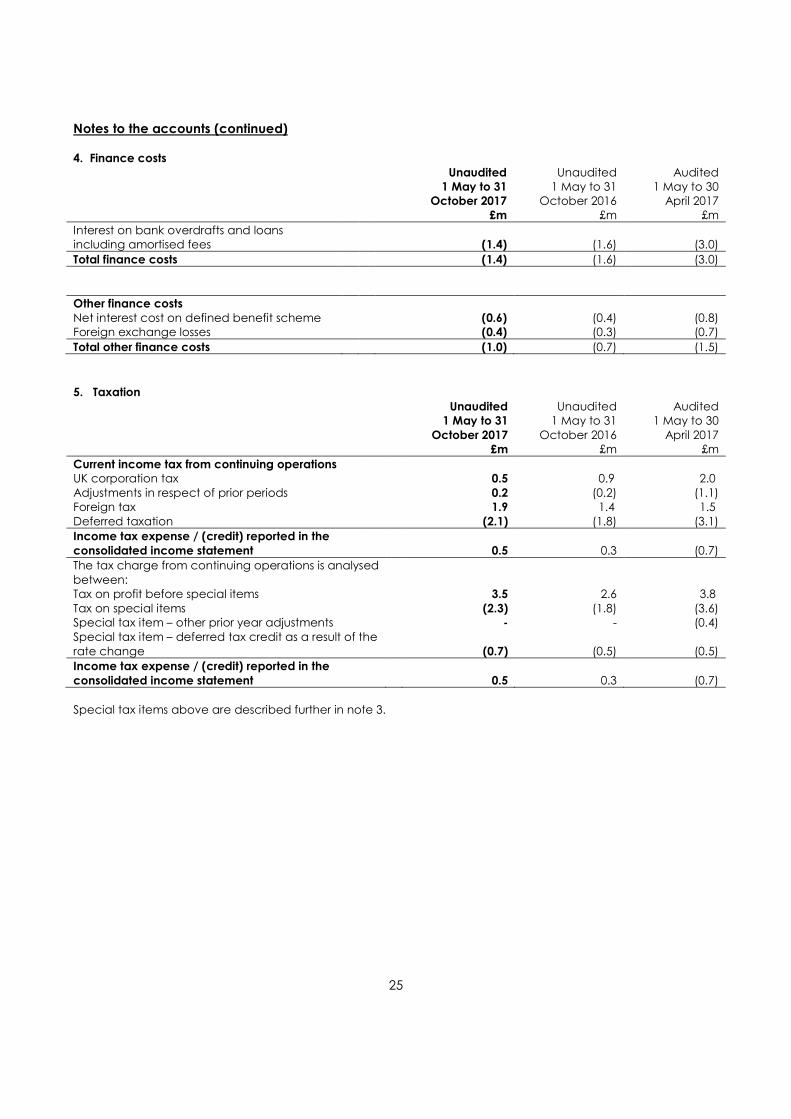
Notes to the accounts (continued) 4. Finance costs
Unaudited
1 May to 31
October 2017
Unaudited 1 May to 31
October 2016
Audited 1 May to 30
April 2017 £m £m £m
Interest on bank overdrafts and loans including amortised fees (1.4) (1.6) (3.0)
Total finance costs (1.4) (1.6) (3.0)
Other finance costs
Net interest cost on defined benefit scheme (0.6) (0.4) (0.8) Foreign exchange losses (0.4) (0.3) (0.7)
Total other finance costs (1.0) (0.7) (1.5)
5. Taxation
Unaudited
1 May to 31
October 2017
Unaudited 1 May to 31
October 2016
Audited 1 May to 30
April 2017 £m £m £m
Current income tax from continuing operations UK corporation tax 0.5 0.9 2.0
Adjustments in respect of prior periods 0.2 (0.2) (1.1) Foreign tax 1.9 1.4 1.5
Deferred taxation (2.1) (1.8) (3.1)
Income tax expense / (credit) reported in the
consolidated income statement 0.5 0.3 (0.7)
The tax charge from continuing operations is analysed
between:
Tax on profit before special items 3.5 2.6 3.8
Tax on special items (2.3) (1.8) (3.6) Special tax item – other prior year adjustments - - (0.4)
Special tax item – deferred tax credit as a result of the
rate change (0.7) (0.5) (0.5)
Income tax expense / (credit) reported in the
consolidated income statement 0.5 0.3 (0.7)
Special tax items above are described further in note 3.
26
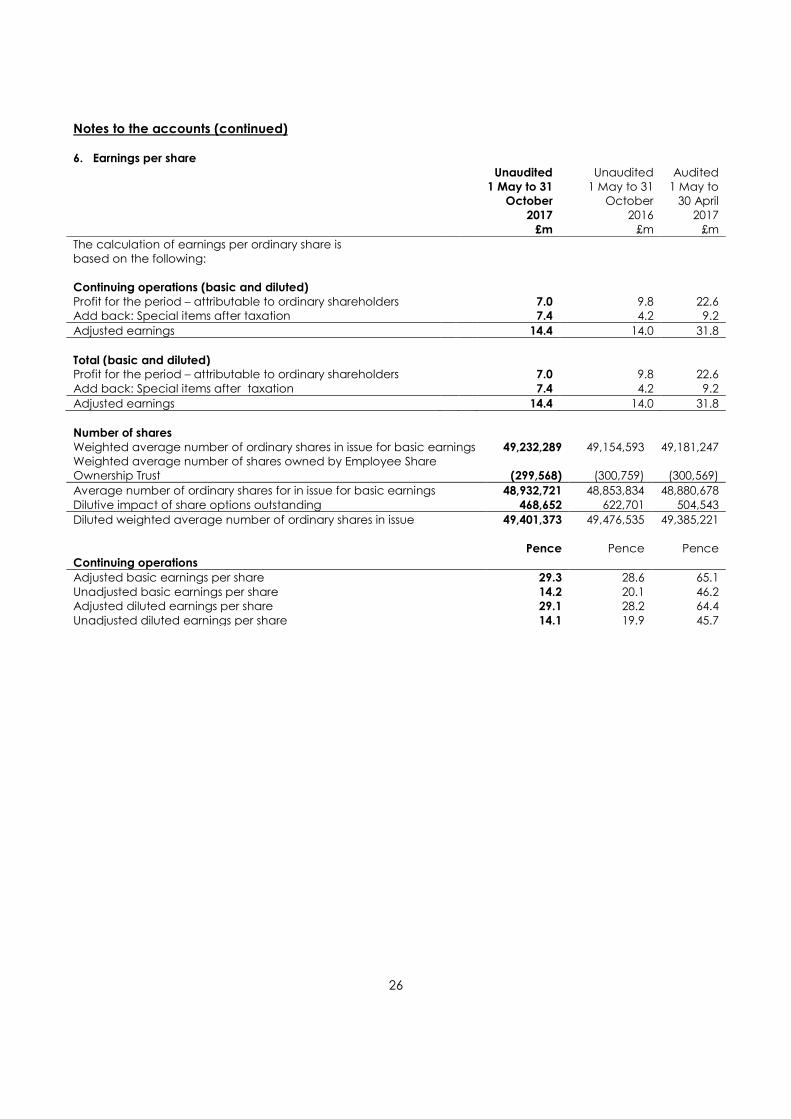
Notes to the accounts (continued) 6. Earnings per share
Unaudited
1 May to 31
October
2017
Unaudited 1 May to 31
October 2016
Audited 1 May to 30 April
2017
£m £m £m
The calculation of earnings per ordinary share is based on the following:
Continuing operations (basic and diluted)
Profit for the period – attributable to ordinary shareholders 7.0 9.8 22.6 Add back: Special items after taxation 7.4 4.2 9.2
Adjusted earnings 14.4 14.0 31.8
Total (basic and diluted) Profit for the period – attributable to ordinary shareholders 7.0 9.8 22.6
Add back: Special items after taxation 7.4 4.2 9.2
Adjusted earnings 14.4 14.0 31.8
Number of shares
Weighted average number of ordinary shares in issue for basic earnings 49,232,289 49,154,593 49,181,247 Weighted average number of shares owned by Employee Share Ownership Trust (299,568) (300,759) (300,569)
Average number of ordinary shares for in issue for basic earnings 48,932,721 48,853,834 48,880,678
Dilutive impact of share options outstanding 468,652 622,701 504,543
Diluted weighted average number of ordinary shares in issue 49,401,373 49,476,535 49,385,221
Pence Pence Pence
Continuing operations
Adjusted basic earnings per share 29.3 28.6 65.1
Unadjusted basic earnings per share 14.2 20.1 46.2 Adjusted diluted earnings per share 29.1 28.2 64.4
Unadjusted diluted earnings per share 14.1 19.9 45.7
27
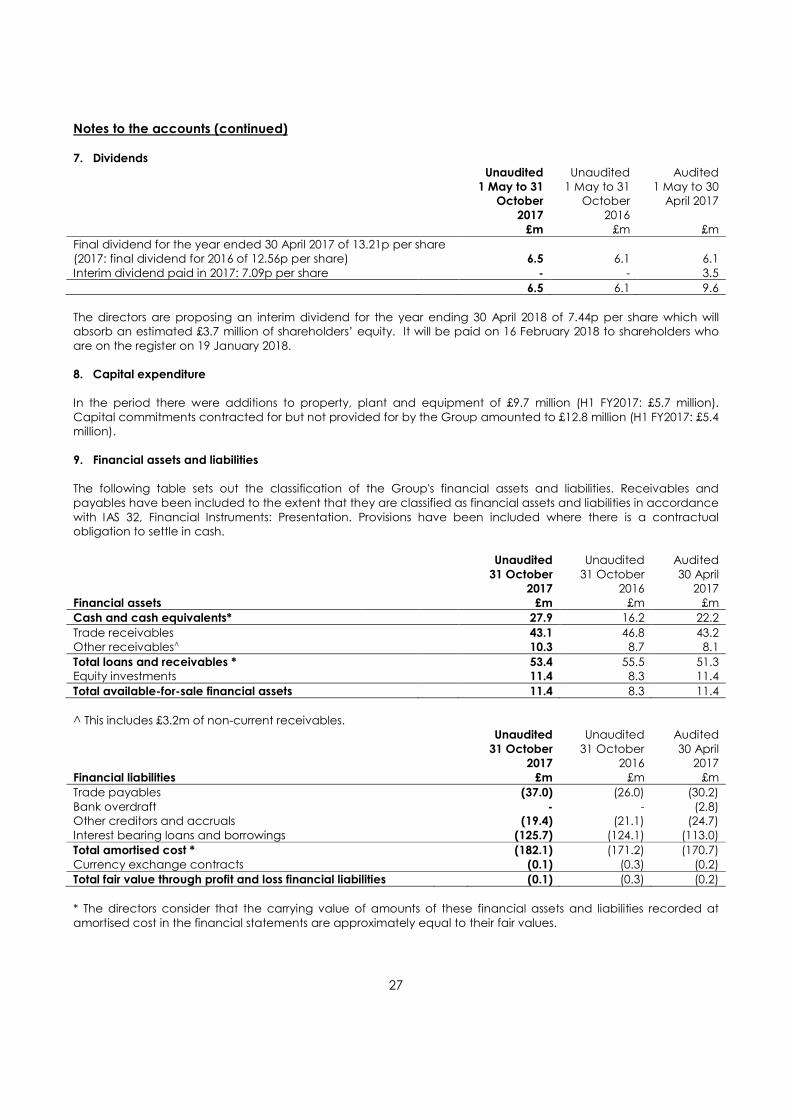
Notes to the accounts (continued) 7. Dividends
Unaudited
1 May to 31
October
2017
Unaudited 1 May to 31
October 2016
Audited 1 May to 30
April 2017
£m £m £m
Final dividend for the year ended 30 April 2017 of 13.21p per share (2017: final dividend for 2016 of 12.56p per share) 6.5 6.1 6.1
Interim dividend paid in 2017: 7.09p per share - - 3.5
6.5 6.1 9.6
The directors are proposing an interim dividend for the year ending 30 April 2018 of 7.44p per share which will absorb an estimated £3.7 million of shareholders’ equity. It will be paid on 16 February 2018 to shareholders who
are on the register on 19 January 2018.
8. Capital expenditure
In the period there were additions to property, plant and equipment of £9.7 million (H1 FY2017: £5.7 million).
Capital commitments contracted for but not provided for by the Group amounted to £12.8 million (H1 FY2017: £5.4 million).
9. Financial assets and liabilities
The following table sets out the classification of the Group's financial assets and liabilities. Receivables and
payables have been included to the extent that they are classified as financial assets and liabilities in accordance
with IAS 32, Financial Instruments: Presentation. Provisions have been included where there is a contractual obligation to settle in cash.
Unaudited
31 October
2017
Unaudited
31 October 2016
Audited
30 April 2017
Financial assets £m £m £m
Cash and cash equivalents* 27.9 16.2 22.2
Trade receivables 43.1 46.8 43.2 Other receivables^ 10.3 8.7 8.1
Total loans and receivables * 53.4 55.5 51.3 Equity investments 11.4 8.3 11.4
Total available-for-sale financial assets 11.4 8.3 11.4
^ This includes £3.2m of non-current receivables.
Unaudited
31 October
2017
Unaudited
31 October 2016
Audited
30 April 2017
Financial liabilities £m £m £m
Trade payables (37.0) (26.0) (30.2)
Bank overdraft - - (2.8) Other creditors and accruals (19.4) (21.1) (24.7)
Interest bearing loans and borrowings (125.7) (124.1) (113.0)
Total amortised cost * (182.1) (171.2) (170.7)
Currency exchange contracts (0.1) (0.3) (0.2)
Total fair value through profit and loss financial liabilities (0.1) (0.3) (0.2)
* The directors consider that the carrying value of amounts of these financial assets and liabilities recorded at
amortised cost in the financial statements are approximately equal to their fair values.

28
Notes to the accounts (continued)
9. Financial assets and liabilities (continued)
All financial liabilities have a contractual maturity date that is less than 12 months from the balance sheet date.
The equity investments in Atlas Genetics Limited and Oxular Limited are unquoted investments and therefore held at cost, less any provision for impairment as their fair value cannot be measured reliably in the absence of an
active market.
Interest bearing loans and borrowings includes a borrowing of £30.3m at 31 October 2017 (H1 FY2017: £37.4m) which has been designated as a hedge of the net investments in the two subsidiaries in Germany and Italy,
Aesica Pharmaceuticals GmbH and Aesica Pharmaceuticals Srl. This borrowing is being used to hedge the Group's exposure to the Euro exchange risk on these investments. Gains or losses on the retranslation of this borrowing are
transferred to OCI to offset any gains or losses on translation of the net investments in the subsidiaries.
Financial liabilities at fair value
Unaudited
31 October
2017
Unaudited
31 October 2016
Audited
30 April 2017
£m £m £m
Level 2:
Currency exchange contracts
(0.1) (0.3) (0.2)
10. Analysis of net debt
Unaudited
31 October
2017
Unaudited 31 October
2016
Audited 30 April
2017 £m £m £m
Current assets: Cash and cash equivalents 27.9 16.2 22.2
27.9 16.2 22.2
Current liabilities: Bank overdrafts - - (2.8)
- - (2.8)
Group borrowings: Interest-bearing loans and borrowings (125.7) (124.1) (113.0)
Unamortised facility fees 0.7 1.1 1.0
Net borrowings (125.0) (123.0) (112.0)
Net debt (97.1) (106.8) (92.6)
The Group has a £160m multicurrency revolving facility and a £65m ‘accordion’ facility by which further facilities
may be made available by Barclays, Lloyds, RBS and Santander under the current terms to support significant
investment or acquisition opportunities which may arise. The existing revolving credit facilities expire in September 2019. Whilst the multi-year revolving committed credit facility does not expire for just under two years, the debt
within this is disclosed as less than one year on the balance sheet, as it is drawn for one-month periods, and then redrawn as appropriate to minimise the amount of debt drawn relative to the Group’s needs to minimise the
interest payable. The undrawn facilities are unsecured. The bank loans and overdrafts are subject to cross-guarantees between Group undertakings. Interest on the multicurrency revolving credit facility is charged at
LIBOR plus a margin of between 1.20% and 2.15%, depending upon the ratio of net debt to EBITDA (earnings before interest, tax, depreciation and amortisation), and on UK overdrafts at either 1.75% above UK base rate or at
the prevailing rate per the revolving credit facility.
29
Notes to the accounts (continued)
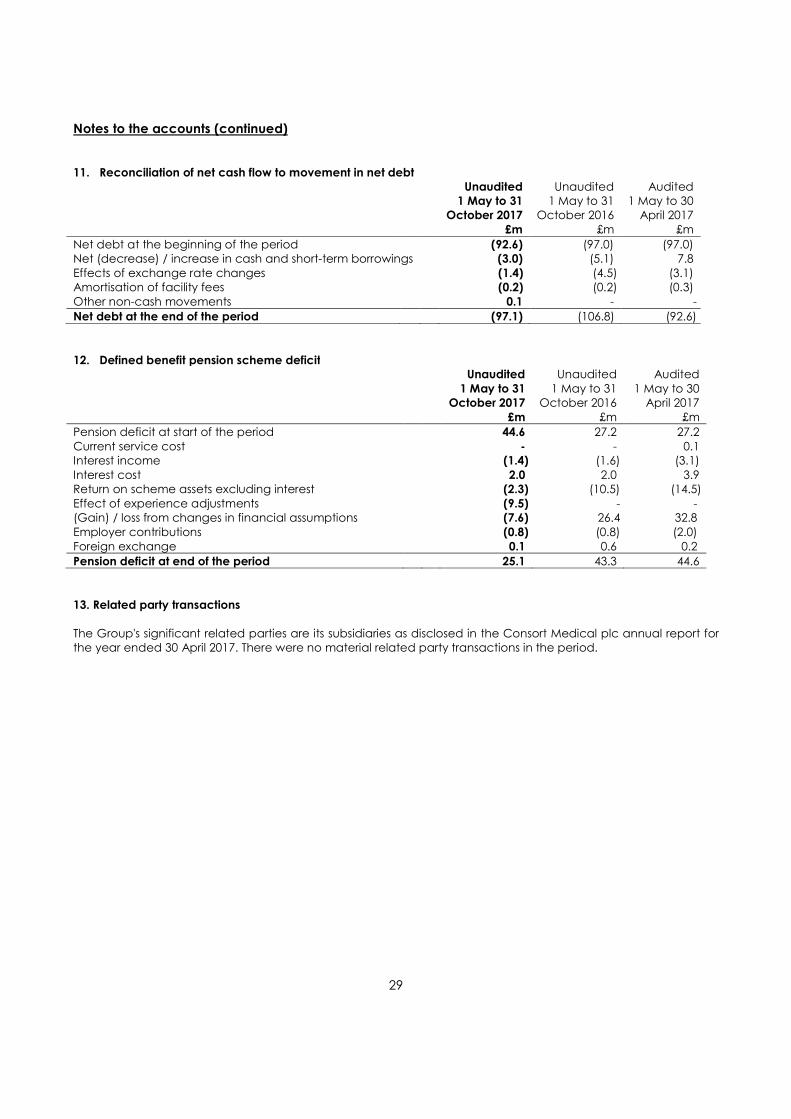
11. Reconciliation of net cash flow to movement in net debt Unaudited
1 May to 31
October 2017
Unaudited 1 May to 31
October 2016
Audited 1 May to 30
April 2017
£m £m £m
Net debt at the beginning of the period (92.6) (97.0) (97.0) Net (decrease) / increase in cash and short-term borrowings (3.0) (5.1) 7.8
Effects of exchange rate changes (1.4) (4.5) (3.1) Amortisation of facility fees (0.2) (0.2) (0.3)
Other non-cash movements 0.1 - -
Net debt at the end of the period (97.1) (106.8) (92.6)
12. Defined benefit pension scheme deficit
Unaudited
1 May to 31
October 2017
Unaudited
1 May to 31 October 2016
Audited
1 May to 30 April 2017
£m £m £m
Pension deficit at start of the period 44.6 27.2 27.2
Current service cost - - 0.1 Interest income (1.4) (1.6) (3.1)
Interest cost 2.0 2.0 3.9 Return on scheme assets excluding interest (2.3) (10.5) (14.5)
Effect of experience adjustments (9.5) - - (Gain) / loss from changes in financial assumptions (7.6) 26.4 32.8
Employer contributions (0.8) (0.8) (2.0)
Foreign exchange 0.1 0.6 0.2
Pension deficit at end of the period 25.1 43.3 44.6
13. Related party transactions
The Group's significant related parties are its subsidiaries as disclosed in the Consort Medical plc annual report for the year ended 30 April 2017. There were no material related party transactions in the period.
30
Notes to the accounts (continued)
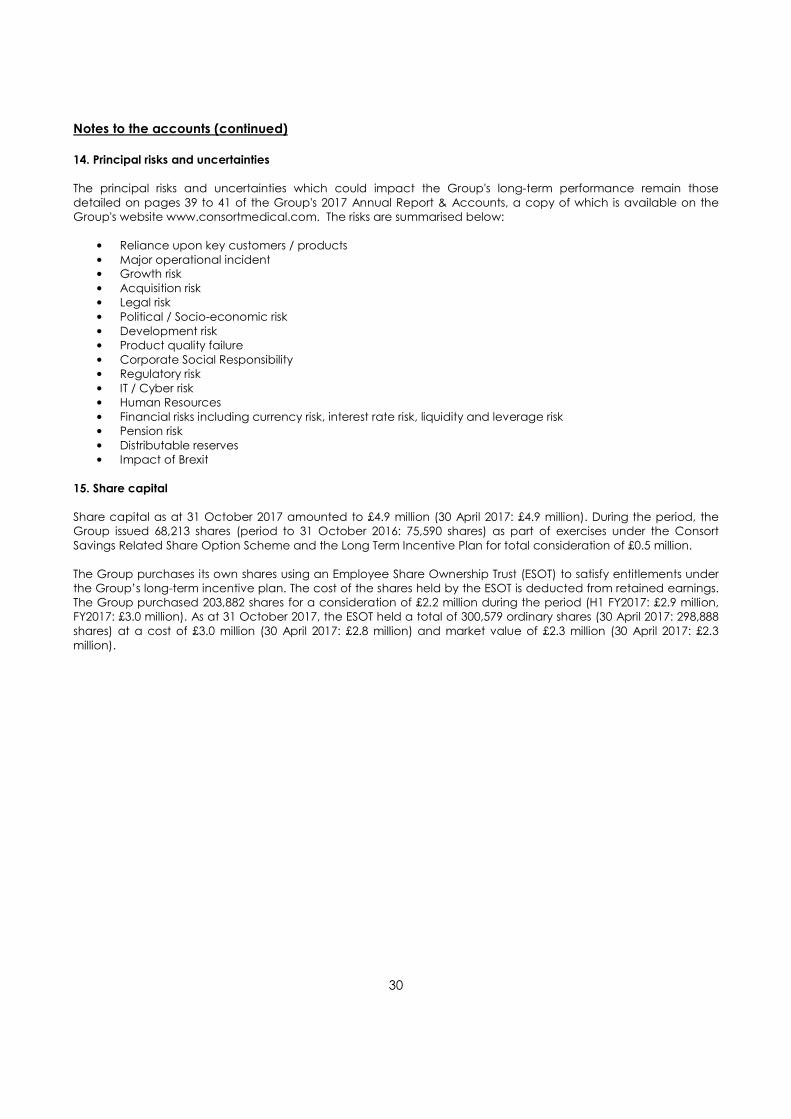
14. Principal risks and uncertainties
The principal risks and uncertainties which could impact the Group's long-term performance remain those
detailed on pages 39 to 41 of the Group's 2017 Annual Report & Accounts, a copy of which is available on the Group's website www.consortmedical.com. The risks are summarised below:
• Reliance upon key customers / products
• Major operational incident • Growth risk
• Acquisition risk • Legal risk
• Political / Socio-economic risk
• Development risk • Product quality failure
• Corporate Social Responsibility • Regulatory risk
• IT / Cyber risk • Human Resources
• Financial risks including currency risk, interest rate risk, liquidity and leverage risk • Pension risk
• Distributable reserves • Impact of Brexit
15. Share capital
Share capital as at 31 October 2017 amounted to £4.9 million (30 April 2017: £4.9 million). During the period, the Group issued 68,213 shares (period to 31 October 2016: 75,590 shares) as part of exercises under the Consort
Savings Related Share Option Scheme and the Long Term Incentive Plan for total consideration of £0.5 million.
The Group purchases its own shares using an Employee Share Ownership Trust (ESOT) to satisfy entitlements under the Group’s long-term incentive plan. The cost of the shares held by the ESOT is deducted from retained earnings. The Group purchased 203,882 shares for a consideration of £2.2 million during the period (H1 FY2017: £2.9 million, FY2017: £3.0 million). As at 31 October 2017, the ESOT held a total of 300,579 ordinary shares (30 April 2017: 298,888
shares) at a cost of £3.0 million (30 April 2017: £2.8 million) and market value of £2.3 million (30 April 2017: £2.3
million).