h1 2019 financial highlights · rapidly growing populations with increasing consumption of animal...
TRANSCRIPT
H1 2019 Financial Highlights
1
Louis Dreyfus Company B.V. October 2019

2
Disclaimer
This presentation is not intended to form the basis of a decision to purchase securities or any other investment decision and
does not constitute an offer, invitation or recommendation for the sale or purchase of securities. Neither the information
contained in this presentation nor any further information made available in connection with the subject matter contained
herein will form the basis of any contract.
This presentation does not purport to be comprehensive or to contain all the information that a prospective business partner,
lender or investor may need. The information contained herein is based on currently available information and sources, which
we believe to be reliable, but we do not represent it is accurate or complete. The recipient of this presentation must make its
own investigation and assessment of the ideas and concepts presented herein. No representation, warranty or undertaking,
express or implied, is or will be made or given and no responsibility or liability is or will be accepted by Louis Dreyfus
Company or by any of its directors, officers, employees, agents or advisers, in relation to the accuracy or completeness of
this presentation or any other written or oral information made available in connection with the ideas and concepts presented
herein. Any responsibility or liability for any such information is expressly disclaimed.
In providing this presentation, Louis Dreyfus Company undertakes no obligation to provide the recipient with access to any
additional information, or to update, or to correct any inaccuracies which may become apparent in, this presentation or any
other information made available in connection with the ideas and concepts presented herein.
This presentation contains statements that are, or may be deemed to be, “forward-looking statements”. All statements other
than statements of historical facts included in this presentation may constitute forward-looking statements. Such forward-
looking statements involve known and unknown risks, uncertainties and other factors which may cause actual results or
performance or achievements to differ materially from those expressed or implied by such forward-looking statements.
This presentation is private and confidential and is being made available to the recipient on the express understanding that it
will be kept confidential and that the recipient shall not copy, reproduce, distribute or pass to third parties this presentation in
whole or in part at any time. This presentation is the property of Louis Dreyfus Company, the recipient agrees that it will, on
request, promptly return this presentation and all other information supplied in connection with the ideas and concepts
presented herein, without retaining any copies.

Agenda
1 Business review
2 Financial track record

4
Louis Dreyfus Company at a glanceA leader in major agri-commodities traded
• Established in 1851
• Operating in more than 100 countries
• Focused predominantly on agricultural commodities
• Approx. 18,000 employees worldwide
• Predominantly selling to emerging markets, notably in Asia:
H1-19 emerging markets net sales: 69%
• Highly diversified portfolio of 9 platforms across 2 segments:
Value Chain platforms
Merchandizing platforms
• One of the most diversified portfolios in the agribusiness space,
combining:
Physical merchandizing
Risk management and
An “asset medium” growth strategy
• Comprehensive approach to risk management, mitigating,
anticipating and controlling risk across the value chain
• Prudent financial profile and strong focus on liquidity
A global, vertically integrated, commodity merchant
Sto
re a
nd
transpo
rt
Merchandize
Research
Customize
and distribute
Research
Process
and refine
Research
Originate
and produce
Research
Sto
re a
nd
transpo
rt
Sto
re a
nd
transpo
rt
Distinctive business model
29%
28%
14%
11%
9%
9%
Jun-19
Fixed assets:
US$4.1bn
24%
24%
14%
Europe & Black
Sea, 17%
MEA, 12%
3%6%
H1-19 Net
Sales:
US$17.5bn
Emerging markets net
sales: 69%
Global asset footprint supporting sales
Diversified portfolio Financial highlights*
H1-18 H1-19
406439
4.6x3.0x
H1-18 H1-19
NI CO1
(US$m)
EBITDA
CO1
(US$m)
Adjusted
net debt2
/ LTM
EBITDA
Adjusted
net
gearing3
South & West Latin America
South and South East Asia
North America
North Latin America
Europe Middle Est and Africa
0.74 0.70
Jun-18* Jun-19
90
73
H1-18 H1-19
GRAINS &
OILSEEDS
Value Chain platforms
Merchandizing platforms
COTTON COFFEE METALS
Sold
May 2018
DAIRY
Exit
mid-2019
SUGARRICE
(1) Net income continued operations; (2) Net debt net of Readily
Marketable Inventories (RMI); (3) Adjusted net debt on equity
(*) Figures as of June 2018 are non-restated from MtM discontinuation on Juice
and Dairy as discontinued operations
North Asia
FREIGHT GLOBAL
MARKETS
JUICE

5
Emergence of new consumer trends, especially in
Europe and North America
Merchandizing of wheat, corn, sorghum, barley, rye, oats and
ethanol; processing and refining of grains and by-productsGrains
Support platformSupport operating activityOcean transportation solutions to support LDC's worldwide
commodity activities, as well as for third partiesFreight
Demand drivers Product range Market position
Global Markets Support commodities merchandizing operationsForeign exchange and interest rate risk management support
for LDC’s worldwide commodity activitiesSupport platform
Primary processing and merchandizing of soybeans, soybean
meal and oil, seeds, palm oil, biodiesel, glycerin, lecithinOilseeds Growth in animal protein consumption, notably in Asia
Diversified portfolio combining:Merchandizing, risk management & an asset medium growth strategy
Growing challenger among dairy traders but critical
mass not attained within LDC portfolio
Merchandizing of milk powders, milk fats, whey and milk
concentrates, and other dairy ingredients
Leading position (by volume) Significant actor (by volume)
Value Chain Merchandizing
Legend:
N°3 processor worldwide, growing for Not From
Concentrate juices
Production and merchandizing of orange, lime, lemon and
apple juices, oils and by-productsJuice
Demand for traceable coffeeMerchandizing and blending of major Arabica and Robusta
varietiesCoffee
Increasing demand for natural fiber Merchandizing of upland saw ginned cotton, pima and extra
long stapleCotton
Sustained global demandMerchandizing of raw and white sugar and ethanol, refining of
raw sugarSugar
Demographic growth and urbanization, notably in Africa Merchandizing of brown and milled riceRice
Valu
e C
hain
Merc
han
diz
ing
Ring-
fenced
DairyExit
mid-2019

20% 21%
3.7 4.3
2018 2028
55%59%
2018 2028
7.6
8.3
2018 2028
4.54.8
2018 2028
15.8
39.3
2008 2018
6
Exposure to a strong and growing demand Rising international trade of agri-commodities: global drivers
Source: National Statistical Bureau of China, FAO stat., OECD
(*) Cereals (wheat, grains, rice, etc.), oilseeds and cotton
• Volatility of supply with crop risk (global warming, extreme weather
disruptions, crop diseases, …)
• Physical commodities have to be moved from origin to destination, in
an efficient manner, by merchants like LDC
Global trade growth driven by growing population
and geographical production imbalances
Population
(bn)
Urbanization
(%)
Main agri-commodities consumption
(bn MT) o/w international trade*
Drivers of global trade of agri-commodities
• Growing
population
leading to a
global increase
in food demand
• Urbanization: more people distanced from primary
producing areas reinforcing global imbalance between
producing and consuming countries
• International trade expected to represent 21% of total
consumption in 2028
• International trade expected to increase by 20%
between 2018 and 2028
• Growing population alongside with a
growing middle class in Asia with
higher income leading to a change in
consumption patterns
• Adoption of a more western lifestyle
with a diet richer in animal protein
• Increase in the consumption
of animal protein per capita
in Asia by c.1.1% in average
per year over 2018 – 2028
Animal protein consumption results in
even higher vegetable protein demand
Urban disposable
income in China
Consumption of animal proteins
in Asia (kg/capita per year)
Population
in Asia (bn)
RM
B ’0
00
pe
r ca
pita
Protein consumption growth in Asia
Feed conversion rate examples:
• 1kg of fish by [1-2]kg of vegetable protein
• 1kg of poultry by [2-3]kg of vegetable protein
• 1kg of pork by [3-4]kg of vegetable protein
• 1kg of beef by [6-7]kg of vegetable protein
Int’ trade
0.7 0.9
2018 2028
27 25
56
29 26
65
Meat Fish Dairy
2018
2028

7
Exposure to a strong and growing demand Focus on new trends
Food changing landscape
• Stronger expectations for healthiness and growing popularity of
alternative diets
• Meat and fish currently representing the core of protein consumption
delivery
• Strong drivers supporting the growth of alternative source of proteins
and “responsible consumption”:
Focus on responsible consumption with concerns on sustainability
issues (greenhouse gas emissions, land use, water quality) and
animal welfare
Consumers wanting to eat healthier and traceable products
Change in consumption patterns (broader diet), especially in
developing countries
Rapidly growing populations with increasing consumption of
animal proteins per capita
Gluten-free Non-GMO
Vegetable productsLow or no
sugar / fat
New customer’s concerns
New sources of proteins
Current protein production mainly based on meat will be inadequate to
meet future protein demand:
Meats
Substitutes• Meat equivalents based on plant:
sausages, burger, patties, etc.
• Plant-based alternative products: tofu, falafel, veggie burger, etc.
Alternatives• Insect protein available as a product and
as a protein ingredient
• Algae protein to be used as protein ingredient
• Etc.
Lab-grown
meat • Based on legumes using shear-cell technology or farmed from animal cells
8
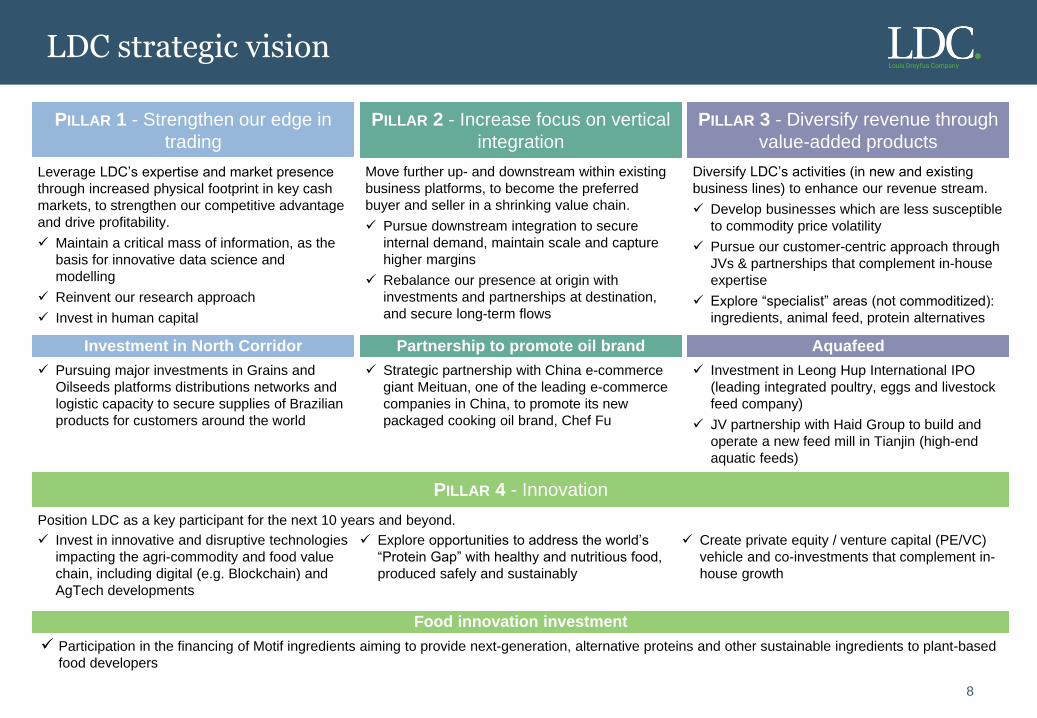
LDC strategic vision
PILLAR 4 - Innovation
Food innovation investment
Participation in the financing of Motif ingredients aiming to provide next-generation, alternative proteins and other sustainable ingredients to plant-based
food developers
Position LDC as a key participant for the next 10 years and beyond.
Invest in innovative and disruptive technologies
impacting the agri-commodity and food value
chain, including digital (e.g. Blockchain) and
AgTech developments
Explore opportunities to address the world’s
“Protein Gap” with healthy and nutritious food,
produced safely and sustainably
Create private equity / venture capital (PE/VC)
vehicle and co-investments that complement in-
house growth
PILLAR 1 - Strengthen our edge in
trading
Leverage LDC’s expertise and market presence
through increased physical footprint in key cash
markets, to strengthen our competitive advantage
and drive profitability.
Maintain a critical mass of information, as the
basis for innovative data science and
modelling
Reinvent our research approach
Invest in human capital
Investment in North Corridor
Diversify LDC’s activities (in new and existing
business lines) to enhance our revenue stream.
Develop businesses which are less susceptible
to commodity price volatility
Pursue our customer-centric approach through
JVs & partnerships that complement in-house
expertise
Explore “specialist” areas (not commoditized):
ingredients, animal feed, protein alternatives
Aquafeed
PILLAR 3 - Diversify revenue through
value-added products
Move further up- and downstream within existing
business platforms, to become the preferred
buyer and seller in a shrinking value chain.
Pursue downstream integration to secure
internal demand, maintain scale and capture
higher margins
Rebalance our presence at origin with
investments and partnerships at destination,
and secure long-term flows
PILLAR 2 - Increase focus on vertical
integration
Partnership to promote oil brand
Pursuing major investments in Grains and
Oilseeds platforms distributions networks and
logistic capacity to secure supplies of Brazilian
products for customers around the world
Strategic partnership with China e-commerce
giant Meituan, one of the leading e-commerce
companies in China, to promote its new
packaged cooking oil brand, Chef Fu
Investment in Leong Hup International IPO
(leading integrated poultry, eggs and livestock
feed company)
JV partnership with Haid Group to build and
operate a new feed mill in Tianjin (high-end
aquatic feeds)

9
Towards a safe and sustainable future
Source: LDC sustainability report
11 6 6 7 33 1
Completed In progress Amended Missed Newly set Removed
LDC sustainability performance against targets in 2018
Target(s)
Freight Publish 2018 emissions resulting from LDC freight activity
Palm Incorporate palm policy into all contracts
Trace 90-100% of palm supplied to LDC back to the mill
Juice Secure Rainforest Alliance certification for 14 more farms
Cotton Purchase 25% more Better Cotton year-on-year (using
2013 as a baseline)
Soybeans Launch FEFAC-approved certification scheme
Train all relevant LDC employees on LDC new soy policy
Business
Key achievements in 2018
No
Deforestation,
No Peat, No
Exploitation
commitment
5% reduction in
GHG
emissions and
energy
consumption
indexes by
2022
5% reduction in
water
consumption
by 2022
5% reduction in
solid waste
sent to landfill
by 2022
Establish a
new
framework for
all community
projects in
2019
Deforestation,
Conversion &
Biodiversity
Climate
change *
Water
scarcity *
Waste * Economic
development
Safety at
Work
Human
rights
Diversity Land rights Working in
Partnership
Reduce
frequency
gravity, and
severity of
accidents
each by 10%
YoY
LDC Global
policy: do not
employ any
person under
16
7 targets for
2019-2020
implementing
global changes
to ensure an
inclusive work
environment
Complete an
environmental
and social
impact
assessment
before building
asset
N/A
Key commitments
(*) Included in LDC sustainability linked facilities
Co
re v
alu
es
Su
sta
inab
ilit
y
Pilla
rs
CommunitiesPartners
People Environment

RiskManagement
Market Risk
Credit Risk
Trade Finance & Country
Risk
Physical RiskLiquidity &
FundingRisk
ForeignExchange
Risk
OperationalRisk
InternalAudit
Comprehensive Risk Management capabilities
10
The Risk department is a globally integrated, dedicated and
balanced structure
2
Risk procedures are clear, prudent and enforced on a daily basis3
In-house risk systems are a key competitive advantage4
Risk management is at the centre of the management structure1
LDC monitors daily profit and loss for each of its platforms, cash flow projections including stressed margin call simulation, as well as Value at Risk (VaR) levels,
against stop-loss limits. In addition, LDC monitors the evolution of P&L against its budget.
Average Value at Risk remained consistently below 1% of equity (US$4.6 billion as at 30 June 2019)
Ø 0.29
Daily 95% VaR [As a percentage of equity, Monthly average]
Constantly managing, controlling and monitoring risks to mitigate risks whilst optimizing the use of risk capital
Ø 0.28Ø 0.17
Holistic Approach to Risk Exposures Risk Management Principles
0.0%
0.2%
0.4%
0.6%
0.8%
1.0%
Ø 0.32
20182015 2016 2017
Ø 0.23
2014 2019
Ø 0.21

11
High governance standardsAlignment of interests of employees and management towards long-term value creation
Corporate Governance and Leadership
Note: Structure as of 31/12/2018
(*) LDC BV is the issuer of the Group’s Debt Capital Markets instruments (senior bonds)
• Semiannual disclosure of consolidated financial statements available on the www.ldc.com
website as well as on the Luxembourg Stock Exchange (www.bourse.lu)
• Semiannual global investors call following the publication of the financial statements
• Annual disclosure of Sustainability Report
Supervisory Board Committees
Audit Committee
Strategy Committee
Compensation, Nomination and
Governance Committee
Supervisory Board
LDCH B.V.
LDC Senior
Leadership Team
An experienced Senior Leadership Team
Long-standing private shareholding structure … … with high disclosure standards
• Ian McIntosh, Group CEO
• Andrea Maserati, Group COO
• Federico Cerisoli, Group CFO
• Patrick Treuer, Chief Strategy Officer
• Jessica Teo, Global Head of Human
Resources
• Joe Nicosia, Head Cotton Platform
• Murilo Parada, Head Juice Platform
and North Latin America Region
• André Roth, Co-Head, Grains &
Oilseeds Platform, and Chairman
North Latin America Region
• Anthony Tancredi, Co-Head, Grains
& Oilseeds Platform
• Miguel Catella, Head Global Markets
• Adrian Isman, Head North America
Region
• James Zhou, Head North Asia Region
LDC B.V.*
LDC employees
and management
LDCH B.V.
100%
Members of the
Louis-Dreyfus Family
LDC BrazilBrazil
LDC ArgentinaArgentina
LDC AsiaSingapore
LDC LLCUSA
LDC ChinaBeijing
LDC SuisseSwitzerland
Indirect Majority
Ownership approx. 95%
approx. 5%
economic interest
100%
Later referred to as the “Group”
LDCNH B.V.
100%
LDC JuiceNetherlands

Agenda
1 Business review
2 Financial track record

13
H1-19 financial snapshot (1/2)
(1) Gross margin plus share of profit/loss in investments in associates and JVs; (2) Return on Equity Group Share beginning-of-period, twelve months prior to period-end
(*) From continuing operations
• Net Sales decrease over H1-19 results from:
Volumes shipped down by 6.9% year-on-year following continuing global trade tensions further amplified by the
African swine fever and the induced fall in demand for soymeal from China
Partly offset by a higher average sales prices thanks to a more favorable product mix
H1-19 Net sales*
US$17.5bnH1-18: US$18.6bn
• EBITDA increased by 8% following the implementation of IFRS 16
• Excluding the impacts of the new IFRS 16 on lease expenses recognition, EBITDA remained comparable to the first
half of 2018 despite a decrease in volumes shipped and net sales
• G&A kept under control, thanks to an efficient cost monitoring
H1-19 EBITDA*
US$439mH1-18: US$406m
• Net income, Group Share continuing operations settled at US$73m for H1-19
• Finance costs decreased by 5% to US$134m. Excluding the impact of IFRS 16, finance costs decreased by 11%,
reflecting (i) lower average long-term debt and (ii) lower short-term debt level thanks to a lower level of working capital
usage partly compensated by the higher Libor rates year-on-year
• ROE2 of 6.5% compared to 5.2% (including Metals) in H1-18
H1-19 Net income, Group Share
continuing operations*
US$73mH1-18: US$90m
• Resilient SOR of US$495m (down by 5% when net sales declined by 6%), supported by improved profitability
on the Merchandizing platforms while the Value Chain platforms faced a more complex market environment:
• Value Chain Segment operating results stood at US$225m:
Oilseeds platform resilient results benefited from the good performance of its processing assets, especially its
biodiesel refining facilities in a difficult context notably marked by (i) trade tensions, (ii) African swine flu and (iii) a
biodiesel blenders credit not yet voted for volumes blended in 2018 and 2019 (vs. US$56m received in H1-18)
Freight and Global Markets supported the segment’s commercial platforms while Juice improved its results thanks
to active cost control in this traditionally low season
• Merchandizing segment improved results to US$270m over H1-19 (up 35.0% vs the year before) resulting from:
Improved Cotton results thanks to diversified origination capabilities, notably in Brazil, China, the US and Australia
Profitable Coffee origination in Asia and Africa and increased efficiencies and reduced assets’ costs
Market share gain in Sugar, especially on raw sugar in Africa, the Middle East and Asia
Rice’s increased results, improving unitary profitability while shipping similar quantities
H1-19 Segment Operating
Results (SOR)*1
US$495mH1-18: US$521m

14
H1-19 financial snapshot (2/2)
Liquidity
As of 30 June 2019
US$8,016m31 Dec. 2018: US$7,715m
• Available liquidity remained at very strong levels throughout the year
• Strong liquidity as of 30 June 2019, covering 1.6 times the short-term debt (consisting notably of US$2,856m of
undrawn committed bank lines)
• Increased long-term financing: average maturity of 3.4 years as of 30 June 2019, or 4.3 years considering the
US$0.4bn additional long-term financing and debt maturity extension since closing:
In July 2019, LDC Suisse signed a JPY34.3bn (i.e. c.US$318m) Samurai 3-year term loan with Japanese investors
in order to refinance a JPY12.5bn maturing in 2019
In August 2019, LDC LLC extended the 4 tranches of its Farm Credit System loan totaling US$855m by 4 years and
maturing now in 2025, 2026, 2027 and 2028 while adding a new tranche of US$100m maturing in 2024
• Diversified sources of funds: 44% of long-term debt comes from Debt Capital Markets
Working capital usage
As of 30 June 2019
US$6,042m31 Dec. 2018: US$6,509m
• Working capital usage (WCU) decreased to US$6.0bn as of 30 June 2019
• Decrease of 7% mainly driven by a combination of fewer carry opportunities, reflected in lower inventories held, and
the reduction in commodities prices
• Continued monitoring of WCU, which remained highly liquid: RMI represents 83.5% of inventories as of 30 June 2019
(65.7% of WCU) vs. 78.1% as of 31 December 2018 (59.3% of WCU). This increase reflects a slightly different mix of
platforms and commodities
H1-19 Capex
US$191mH1-18: US$131m
• Highly selective investment strategy, ensuring that a substantial portion of the Capex remains discretionary
to both serve strategic ambitions and preserve solid cash flows
• Capital expenditure was mainly directed towards greater vertical integration and diversification:
Investment in the IPOs of Luckin Coffee on the NASDAQ in the US, which also included an agreement to form a
joint venture roasting and ground coffee plant in China, demonstrating the potential for growth along the value
chain through regional partnerships
Cornerstone investment in a leading integrated poultry, eggs and livestock feed company, Leong Hup
International, on the Malaysian stock exchange, Bursa Malaysia
Start of the construction work on the new mill for high-end aquatic feeds in Tianjin, China, to be built and operated
by LDC and Guangdong HAID Group Co. Ltd. (HAID) through their joint venture Tianjin Rongchuan Feed Co. Ltd.
As a reminder, Metals was classified as asset held-for-sale
15
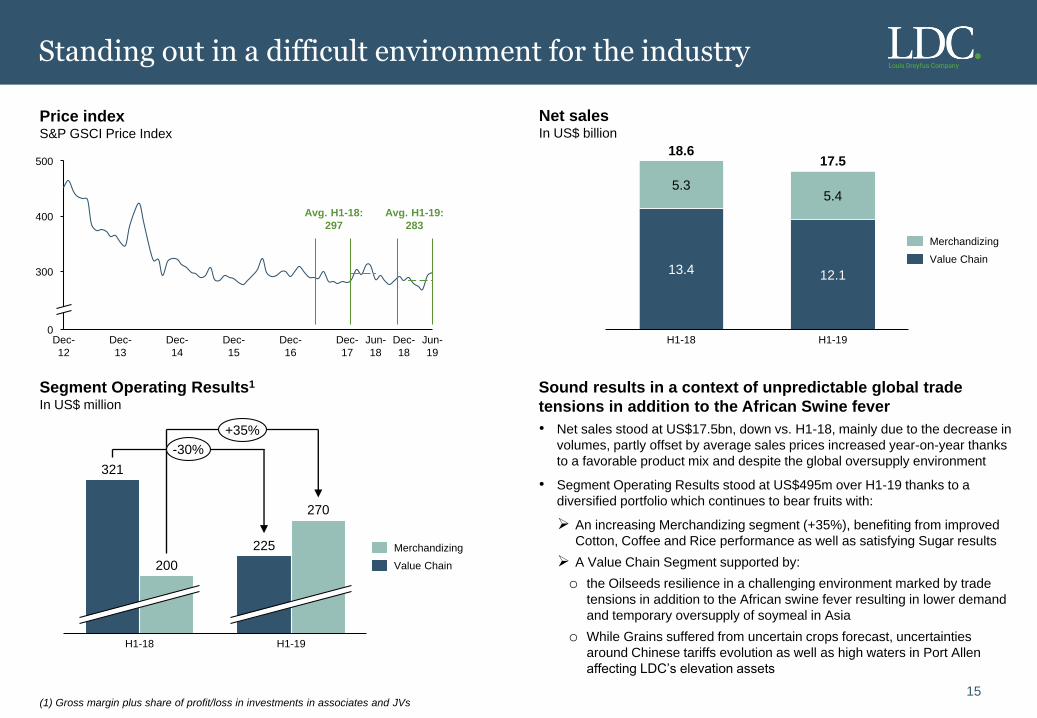
Standing out in a difficult environment for the industry
Price indexS&P GSCI Price Index
Segment Operating Results1
In US$ million
Net salesIn US$ billion
H1-18
13.4
5.3
18.6
12.1
H1-19
5.4
17.5
Sound results in a context of unpredictable global trade
tensions in addition to the African Swine fever
(1) Gross margin plus share of profit/loss in investments in associates and JVs
• Net sales stood at US$17.5bn, down vs. H1-18, mainly due to the decrease in
volumes, partly offset by average sales prices increased year-on-year thanks
to a favorable product mix and despite the global oversupply environment
• Segment Operating Results stood at US$495m over H1-19 thanks to a
diversified portfolio which continues to bear fruits with:
An increasing Merchandizing segment (+35%), benefiting from improved
Cotton, Coffee and Rice performance as well as satisfying Sugar results
A Value Chain Segment supported by:
o the Oilseeds resilience in a challenging environment marked by trade
tensions in addition to the African swine fever resulting in lower demand
and temporary oversupply of soymeal in Asia
o While Grains suffered from uncertain crops forecast, uncertainties
around Chinese tariffs evolution as well as high waters in Port Allen
affecting LDC’s elevation assets
H1-18
225
H1-19
321
200
270
-30%
+35%
0
300
400
500
Jun-
19
Dec-
17
Dec-
13
Dec-
12
Dec-
14
Dec-
15
Dec-
16
Jun-
18
Dec-
18
Avg. H1-19:
283
Avg. H1-18:
297
Merchandizing
Value Chain
Merchandizing
Value Chain

16
Resilient results
Condensed consolidated income statement
In US$ million H1-18 H1-19
Net sales 18,630 17,486
Cost of sales (18,109) (16,991)
Gross Margin 521 495
Commercial & administrative expenses (281) (283)
Finance costs, net (141) (134)
Other income 12 7
Income before tax 111 85
Tax (20) (12)
Net income – Continuing 91 73
Net income – Discontinued 38 (2)
Net income – Total 129 71
o/w non-controlling interests 1 -
Net income attributable to owners of the Company 128 71
• Gross Margin reached US$495m in a semester characterized by challenging
market conditions
• Commercial & administrative expenses contained to US$(283)m
• Net finance costs reached US$(134)m and included US$(9)m related to the
implementation of IFRS 16. Excluding the latter, net finance costs decreased by
11% mainly resulting from (i) lower average long-term debt, (ii) lower short-term
debt level thanks to a lower level of working capital usage partly offset by the
Libor increase
• Income before tax settled at US$85m for H1-19
• Income tax expense decreased to US$(12)m mainly resulting from the impact of
functional currency effects mainly driven by a more stable parity between the
Brazilian Real and the US Dollar in the first half of 2019
• Income tax paid increased in H1-19 following an one-off payment related to the
Argentinian tax reform enacted on December 2017
• Net Income discontinued operations for H1-19 amounted to US$(2)m and
consisted of the Dairy Platform vs. US$4m in H1-18. In H1-18 this line included
as well the US$34m contribution of the Metals Platform
In US$ million H1-18 H1-19
Income before tax (EBT) 111 85
Current taxes (30) (49)
Deferred taxes 10 37
Income tax expense (20) (12)
Income tax paid (26) (44)
Effective tax rate (Income tax expense/EBT) 18% 14%
“Cash” tax rate (Income tax paid/EBT) 23% 52%
Tax analysis
Income before taxIn US$ million
111
85
H1-18 H1-19
Net incomeIn US$ million
H1-18 H1-19
91
128
73 71
Continuing
operations
Total Net income
Group Share
Libor 1 month rate Short term financing*In US$ million
(*) Including current portion of long-term debt
4,826
Dec-17 Jun-18 Dec-18 Jun-19
3,818
6,055
4,934
+29%
-20%
Jan-18 Jul-18 Jan-19 Jul-19
Avg. H1-19:
2.47%
Avg. H1-18:
1.81%
Note:
In accordance with IFRS, results of Metals and Dairy Platforms are presented in
net income from discontinued operations
17
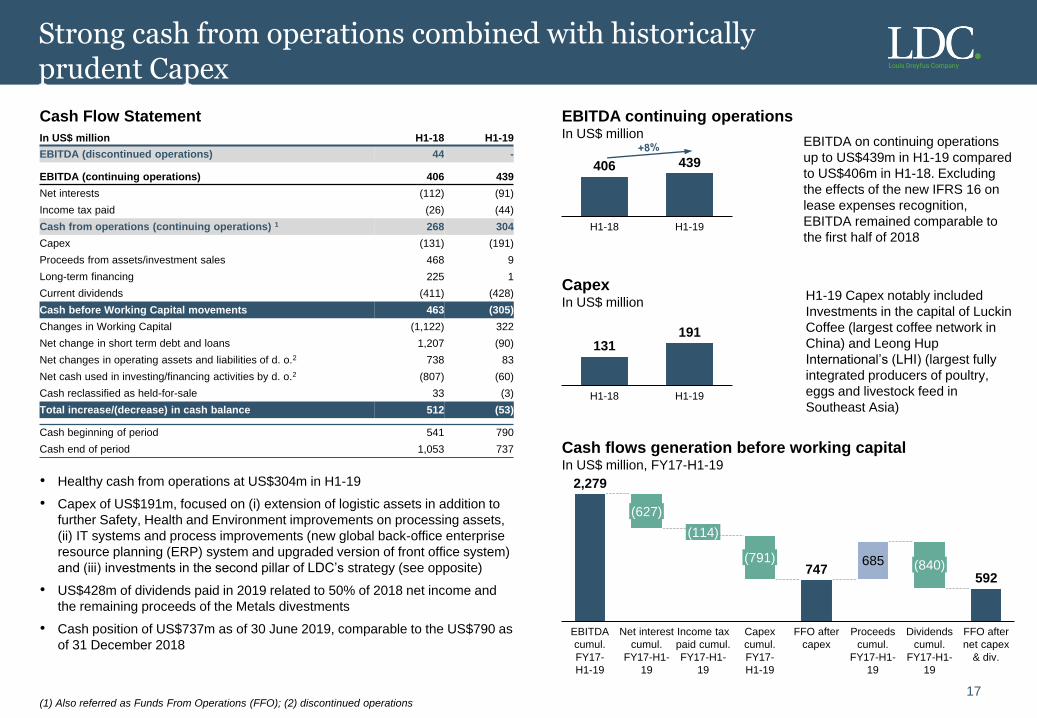
Strong cash from operations combined with historically prudent Capex
Cash Flow Statement
In US$ million H1-18 H1-19
EBITDA (discontinued operations) 44 -
EBITDA (continuing operations) 406 439
Net interests (112) (91)
Income tax paid (26) (44)
Cash from operations (continuing operations) 1 268 304
Capex (131) (191)
Proceeds from assets/investment sales 468 9
Long-term financing 225 1
Current dividends (411) (428)
Cash before Working Capital movements 463 (305)
Changes in Working Capital (1,122) 322
Net change in short term debt and loans 1,207 (90)
Net changes in operating assets and liabilities of d. o.2 738 83
Net cash used in investing/financing activities by d. o.2 (807) (60)
Cash reclassified as held-for-sale 33 (3)
Total increase/(decrease) in cash balance 512 (53)
Cash beginning of period 541 790
Cash end of period 1,053 737
EBITDA continuing operationsIn US$ million
CapexIn US$ million
131191
H1-18 H1-19
406 439
H1-18 H1-19
Cash flows generation before working capitalIn US$ million, FY17-H1-19
2,279
747592
685
Capex
cumul.
FY17-
H1-19
(627)
FFO after
capex
EBITDA
cumul.
FY17-
H1-19
(114)
Net interest
cumul.
FY17-H1-
19
Income tax
paid cumul.
FY17-H1-
19
(791)
Proceeds
cumul.
FY17-H1-
19
(840)
Dividends
cumul.
FY17-H1-
19
FFO after
net capex
& div.
H1-19 Capex notably included
Investments in the capital of Luckin
Coffee (largest coffee network in
China) and Leong Hup
International’s (LHI) (largest fully
integrated producers of poultry,
eggs and livestock feed in
Southeast Asia)
(1) Also referred as Funds From Operations (FFO); (2) discontinued operations
• Healthy cash from operations at US$304m in H1-19
• Capex of US$191m, focused on (i) extension of logistic assets in addition to
further Safety, Health and Environment improvements on processing assets,
(ii) IT systems and process improvements (new global back-office enterprise
resource planning (ERP) system and upgraded version of front office system)
and (iii) investments in the second pillar of LDC’s strategy (see opposite)
• US$428m of dividends paid in 2019 related to 50% of 2018 net income and
the remaining proceeds of the Metals divestments
• Cash position of US$737m as of 30 June 2019, comparable to the US$790 as
of 31 December 2018
EBITDA on continuing operations
up to US$439m in H1-19 compared
to US$406m in H1-18. Excluding
the effects of the new IFRS 16 on
lease expenses recognition,
EBITDA remained comparable to
the first half of 2018

18
Sound balance sheet structure
Condensed consolidated balance sheet
In US$ million Dec-18 Jun-19
PPE and Intangible assets 3,792 4,050
Investments in associates and joint ventures 197 203
Other investments, deposits and sundry 1,713 1,731
Others 196 209
Non-current assets 5,898 6,193
Inventories 4,940 4,754
Accounts receivable and other 6,532 7,633
Current financial assets 964 1,190
Current assets 12,436 13,577
Held-for-sale assets 43 38
Total assets 18,377 19,808
Attributable to owners of the company 4,974 4,619
Attributable to non-controlling interests 8 6
Equity 4,982 4,625
Long-term debt 2,777 3,242
Others 449 447
Non-current liabilities 3,226 3,689
Short-term debt * 5,136 5,023
Accounts payable and other 5,030 6,470
Current liabilities 10,166 11,493
Held-for-sale liabilities 3 1
Total equity and liabilities 18,337 19,808
A sound balance sheet structureIn US$ million, as of 30 June 2019
Key guidelines on LDC’s funding model:
• Short-term debt supports on-going business, financing the very
liquid part of working capital
• Long-term debt mainly provides support for long-term investments,
as well as less liquid working capital
• Debt is mostly unsecured
• Funding historically based on a regional model, provided significant
geographical diversification
(*) Including financial advances from related parties and current portion of the long-term debt
(1) Intangible assets + PPE + Investments in associates and joint ventures
(2) Include assets and liabilities held-for-sale
(3) Trade receivables net of payables and net derivatives with maturities below 3 months and
liquid margin deposits (based on RMI as % of inventories applied to margin deposits)
(4) Current financial assets - financial assets held for trading purpose & reverse repurchase
agreement loan (considered WCU)
(5) Short-term debt - repurchase agreement & securities short position (considered WCU)
As a reminder, Metals was classified as held-for-sale in 2017
4,964
3,242
4,625
Source of capital
Equity
LT Debt
ST Debt (5)
1,006
3,970
1,590
1,530
4,253
Less liquid WC
(incl. non-RMI
inventories)
Fixed assets
& Investments (1)
Liquid assets (3)482
Other non-current
assets (net) (2)
Use of Capital
RMI
Current Financial
assets (4)
US$494m

19
Highly liquid Working Capital Usage
Working Capital overviewIn US$ billion
Continuing monitoring of the Working Capital Usage (WCU)
• WCU settled at US$6.0bn as of 30 June 2019
• The US$0.5bn decrease mainly resulted from lower carry opportunities through physical
inventories and the reduction in commodities prices
Within the Value Chain Segment each platform reduced its working capital:
Juice Platform’s lower inventories in the traditionally off-seasonal period
Grains and Oilseeds platforms reduced their net derivatives positions
Merchandizing Segment lower working capital due to mixed trends among platforms:
Reduced inventories carried by the Cotton platform
Partially offset by the working capital increase in the Sugar platform
• Due to their very liquid nature, it is common industry practice to analyze certain
agricultural inventories as Readily Marketable Inventories (RMI):
RMI are readily convertible to cash because of widely available markets and
international pricing mechanisms
LDC considers that inventories with less than 3 months liquidity horizon should qualify
as RMI, without any discount
• 83.5% of inventories are RMI as of 30 June 2019, up from 78.1% in December 2018
• This increase reflects a slightly different mix of platforms and commodities
0.9
3.9
(59%)
5.0
(64%)
0.7
0.6
0.6
Jun-18*
0.40.4
1.1
0.8
Dec-18 Jun-19
4.0
(66%)
0.6
0.8
0.7
7.7
6.5
6.0
Margin deposits
RMI
Liquid assets**
Non-RMI inventories
Other non-inventory WC
(*) Jun-18 not restated from the Juice valuation method change (Note 1 of the AR H1-19)
(**) Trade receivables, trade payables and net derivatives under 3 months

20
Proven Adjusted Net Debt concept
Adjusted net debt A proven concept of Adjusted Net Debt
In US$ million Dec-18 Jun-19
(+) Long-term debt (non-current portion) 2,777 3,242
(+) Long-term debt (current portion) 230 80
(+) Short-term debt * 4,880 4,884
(=) Gross debt 7,887 8,206
(-) Readily Marketable inventories (RMI) 3,860 3,970
(-) Other current financial assets ** 81 269
(-) Cash and cash equivalents 790 737
(=) Adjusted net debt 3,156 3,230
Out of which leases liabilities n.a. 287
• As a common practice in the industry, gross financial debt is not only netted
against current financial assets, but also netted from Readily Marketable
Inventories (RMI), as these are perceived as quasi cash
This reflects the high liquid nature of our commodities inventories;
Furthermore, short-term debt and RMI are evolving in tandem as a large
part of our inventories is financed with short-term debt
• The concept of Adjusted Net Debt works particularly for LDC as trade
payables are more than covered by trade receivables:
LDC’s RMI would not have to be liquidated to repay trade payables but
can be entirely deducted from net financial debt
6.05.7
6.1
4.0
5.1 5.0
4.84.1
5.3 4.1 3.9 4.0
Jun-19Dec-18Dec-16Dec-14 Dec-15 Dec-17
Short-term debt (incl. long-term financing current portion) RMI
Short-term debt vs. RMIIn US$ billion
Trade payables are more than covered by trade receivablesIn US$ million
(*) Short-term debt + Financial advances from related parties – Repo
agreements – securities short position
(**) Financial advances to related parties + other financial assets at fair value
through P&L - financial assets held for trading purpose - reverse repurchase
agreement loan
5,315 4,771 5,260 4,141 4,514 5,367
(3,447) (3,186) (3,591) (3,439) (3,845) (5,156)
1,821 1,868 1,585 1,669 702 669
Dec-14 Dec-15 Dec-16 Dec-17 Dec-18 Jun-19
Trade and other receivables Accounts payable and accrued expenses

21
Prudent balance sheet profile and liquidity assessment
Derivatives maturity profilesAs of 30 June 2019
Derivatives
instruments are
highly liquid and
below 3 months
Derivatives are
prudently valued,
leading to a
net fair value
close to zero
Less than 1% of
derivatives are
Level 3
Derivatives fair value hierarchyAs of 30 June 2019
• Most of the derivatives are highly liquid and under 3 months
• Derivative assets are typically offset by derivative liabilities,
leading to a net fair value of derivatives close to zero
• Less than 1% of derivatives are fair valued according to a
Level 3 methodology
Net derivativesIn US$ million
1,325 1,444 1,224 9571,484 1,509
Dec-17
(1,270)(1,127) (1,024)
Dec-15Dec-14
(1,375)
Dec-16
(1,141)
Dec-18
(1,274)
Jun-19
174
Derivative assets
Derivative liabilities
343198
(151)(67)
235
• Certain components of LDC’ Working Capital other than RMI
are very liquid, notably:
Margin deposits: US$0.6bn as of 30 June 2019
• Conservatively, the Group does not deduct these liquid items
in its definition of Adjusted Net Debt
More than
US$0.6bn of
non-RMI Working
Capital is also
liquid but
conservatively
not deducted
from Net Debt
0.7
0.90.8
0.7
0.4
0.6
Jun-19Dec-18Dec-17Dec-14 Dec-16Dec-15
Margin depositsIn US$ billion
3 to 6 months
Over 6 months
Under 3 months
86%
6%8%
Derivative
assets:
US$1.5bn
88%
7%5%
Derivative
liabilities:
US$1.3bn
13%
86%
1%
Derivative
assets:
US$1.5bn
7%
93%
0%
Derivative
liabilities:
US$1.3bn
Level 2
Level 3
Level 1
22
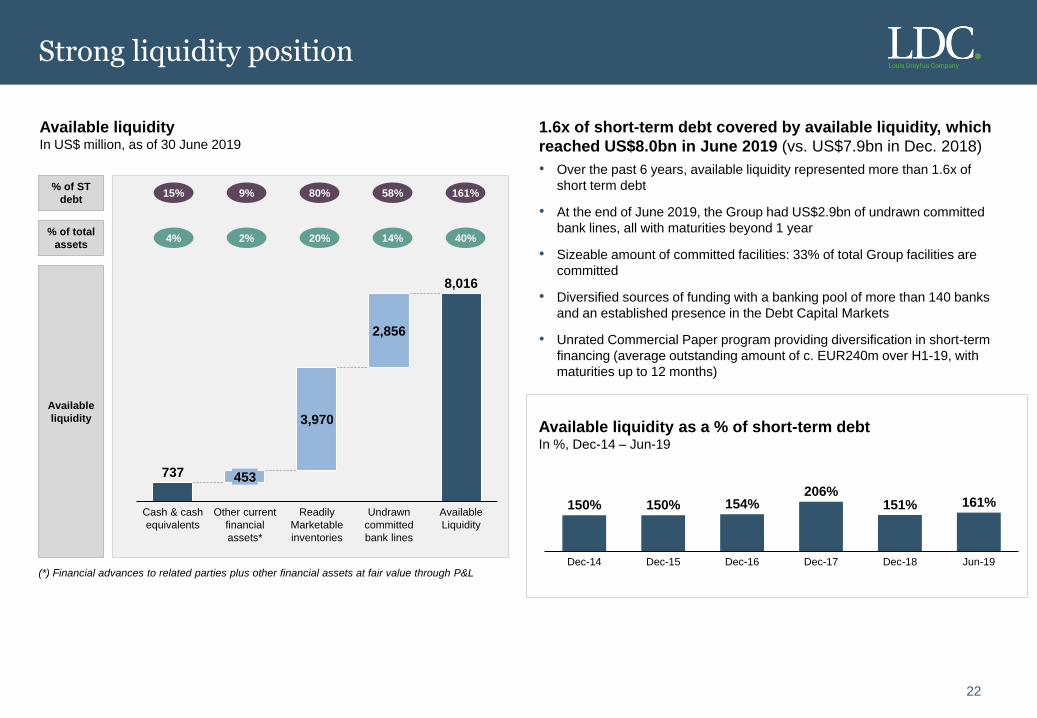
Strong liquidity position
Available liquidityIn US$ million, as of 30 June 2019
1.6x of short-term debt covered by available liquidity, which
reached US$8.0bn in June 2019 (vs. US$7.9bn in Dec. 2018)
• Over the past 6 years, available liquidity represented more than 1.6x of
short term debt
• At the end of June 2019, the Group had US$2.9bn of undrawn committed
bank lines, all with maturities beyond 1 year
• Sizeable amount of committed facilities: 33% of total Group facilities are
committed
• Diversified sources of funding with a banking pool of more than 140 banks
and an established presence in the Debt Capital Markets
• Unrated Commercial Paper program providing diversification in short-term
financing (average outstanding amount of c. EUR240m over H1-19, with
maturities up to 12 months)
737
8,016
3,970
2,856
Cash & cash
equivalents
Undrawn
committed
bank lines
Other current
financial
assets*
Readily
Marketable
inventories
453
Available
Liquidity
9% 80% 161%58%15%
2% 20% 40%14%4%
% of ST
debt
% of total
assets
(*) Financial advances to related parties plus other financial assets at fair value through P&L
Available
liquidityAvailable liquidity as a % of short-term debtIn %, Dec-14 – Jun-19
150% 150% 154%206%
151% 161%
Dec-17Dec-14 Dec-15 Dec-18Dec-16 Jun-19

Increasing long-term financing average maturity1
Dec-14 – Jun-19
23
Long term debt: diversified funding & increasing maturity profile
Long-term financing distribution by maturityIn US$ million, as of 30 June 2019
Increasing long-term debt portfolio
Average maturity1 stood at 3.4 years as of 30 June 2019, or 4.3 years with the US$0.4bn additional long-term financing issued by LDC
B.V. since the period end closing. Long-term debt stood at US$3.2bn as of 30 June 2019 (out of which US$0.2bn of lease liabilities)
Non-current long-term financing: US$3,016m
>1yr
<2yr
<3yr <4yr <5yr >5yr
Term loans from banksDebt Capital MarketsDrawn RCFs
June 2019 Pro Forma considering new long-term financing issued after
closing (see opposite)
3.44.1
3.43.9 3.9 3.7
4.3
Dec-14 Dec-15 Dec-16 Dec-17 Dec-18 Jun-19
New long-term financing issued since 30 June 2019 closing:
• In July 2019, LDC Suisse signed a JPY34.3bn Samurai 3-year term loan with
Japanese investors in order to refinance a JPY12.5bn maturing in 2019.
• In August 2019, LDC LLC extended the 4 tranches of its Farm Credit System loan
totaling US$855m by 4 years and maturing now in 2025, 2026, 2027 and 2028
while adding a new tranche of US$100m maturing in 2024.
Non-current long-term financing Pro Forma: US$3,434m
40 40
320
65
308376
281
56167
997
568 568
533
533
299299
215 215
285
285
823 823
1,138
883
607675
281
56
167
997
(1) On non-current portion of long-term financing
3-yr RCF, US$534m,
Aug-20
3-yr RCF, US$600m,
Aug-21
3-yr RCF, US$400m,
Dec-212-yr RCF, US$400m,
Dec-20
3-yr RCF, US$750m,
May-20
3-yr RCF, US$600m,
May-21
24
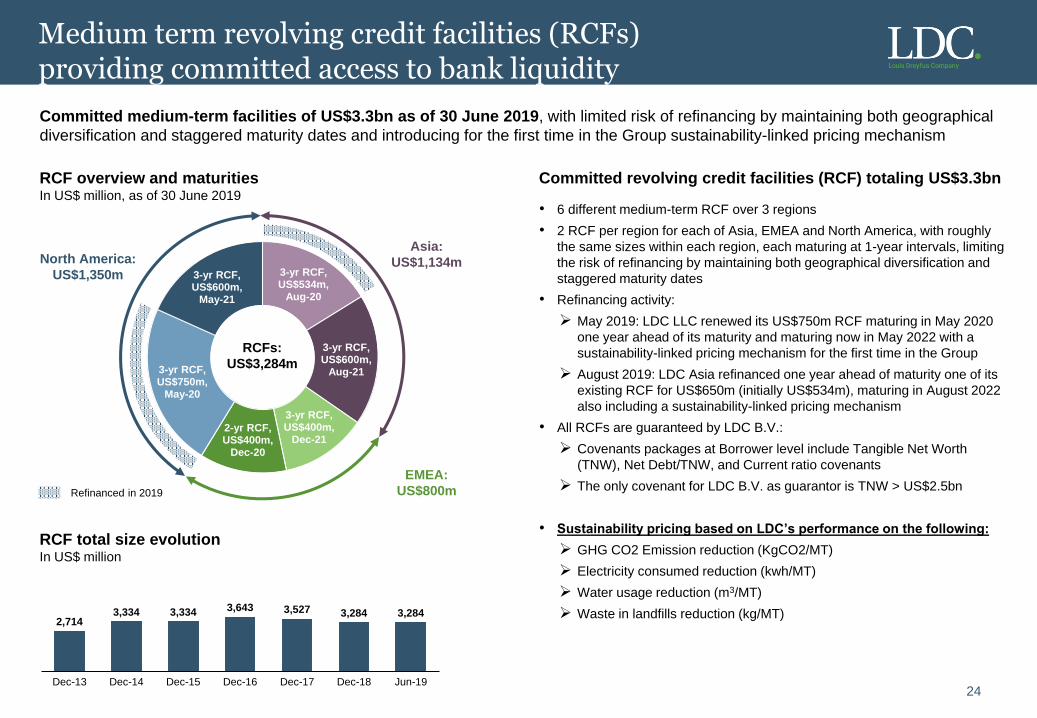
Medium term revolving credit facilities (RCFs) providing committed access to bank liquidity
Asia:
US$1,134m
EMEA:
US$800m
North America:
US$1,350m
Refinanced in 2019
RCFs:
US$3,284m
RCF overview and maturitiesIn US$ million, as of 30 June 2019
Committed revolving credit facilities (RCF) totaling US$3.3bn
• 6 different medium-term RCF over 3 regions
• 2 RCF per region for each of Asia, EMEA and North America, with roughly
the same sizes within each region, each maturing at 1-year intervals, limiting
the risk of refinancing by maintaining both geographical diversification and
staggered maturity dates
• Refinancing activity:
May 2019: LDC LLC renewed its US$750m RCF maturing in May 2020
one year ahead of its maturity and maturing now in May 2022 with a
sustainability-linked pricing mechanism for the first time in the Group
August 2019: LDC Asia refinanced one year ahead of maturity one of its
existing RCF for US$650m (initially US$534m), maturing in August 2022
also including a sustainability-linked pricing mechanism
• All RCFs are guaranteed by LDC B.V.:
Covenants packages at Borrower level include Tangible Net Worth
(TNW), Net Debt/TNW, and Current ratio covenants
The only covenant for LDC B.V. as guarantor is TNW > US$2.5bn
• Sustainability pricing based on LDC’s performance on the following:
GHG CO2 Emission reduction (KgCO2/MT)
Electricity consumed reduction (kwh/MT)
Water usage reduction (m3/MT)
Waste in landfills reduction (kg/MT)
Committed medium-term facilities of US$3.3bn as of 30 June 2019, with limited risk of refinancing by maintaining both geographical
diversification and staggered maturity dates and introducing for the first time in the Group sustainability-linked pricing mechanism
RCF total size evolutionIn US$ million
2,7143,334 3,334 3,643 3,527 3,284 3,284
Dec-13 Jun-19Dec-18Dec-14 Dec-17Dec-15 Dec-16

25
Closing remarks: LDC’s financial performance
(*) Metals impact unaudited; figures before December 2018 are non-restated from mark-to-market discontinuation on Juice and Dairy as discontinued operations
(1) Net debt net of Readily Marketable Inventories (RMI);
(2) Funds From Operations: EBITDA less Interests paid (net) and Income tax paid;
(3) Net debt net of RMI on total equity;
(4) Current financial assets plus RMI plus undrawn committed bank lines;
Strong balance sheet
metrics and ample
available liquidity
Adjusted net debt1/EBITDA* FFO2/Adjusted net debt1 *
Resilient profitability
and cash flow
metrics in a context
of unpredictable
market trends
affecting the agri-
commodity merchant
industry
Available Liquidity4 *
As a reminder, Metals was classified as discontinued ops. in 2017 & 2018
Net income Group Share* (US$m)EBITDA* (US$m)
Adjusted net gearing3 *
LDC including discontinued operationsLDC excluding discontinued operations
380
405 406 439
H1-16
439
H1-17 H1-18
440
H1-19
450135
13590 73
H1-16 H1-17
128
H1-18
71
H1-19
160
7.5 8.4
8.3 9.07.7 8.08.5
Jun-18Dec-17Dec-15 Jun-19Dec-16 Dec-18
9.3
18.6% 16.0%
20.5%17.1%
20.8%
13.2%
23.2% 23.6%
2015 2016 2017 H1-18LTM
2018 H1-19LTM
3.43.0
3.3
20182017
3.23.0
2015 2016 H1-19
LTM
H1-18
LTM
3.5
4.6
3.0
Jun-18
0.50
Jun-19
0.510.59
Dec-15 Dec-16 Dec-17 Dec-18
0.660.57
0.74
0.630.70
26
Thank you