h1 2017 interim results - thomascookgroup.com · germany ›interest costs ... consolidate finance...
TRANSCRIPT

H1 2017 Interim Results 18 May 2017

Agenda
Page 2
› Highlights - Peter Fankhauser | CEO
› Financial results
› Strategic progress
› Current trading and outlook

Strategic actions leading to improved performance
Page 3 1 HIGHLIGHTS
› Growing top line Revenue up 3% reflecting expanded Winter Sun programme
› Improved profit performance Seasonal underlying EBIT loss improved by £2 million; loss after tax better by £27 million
› Delivering on our customer promises Net Promoter Score up by 8 points
› More unique holidays Sales of holidays to higher margin own-brand hotels up 10%
› Good demand for the Summer On track to meet full year expectations

Agenda
Page 4
› Highlights
› Financial results - Michael Healy | Group CFO
› Strategic progress
› Current trading and outlook
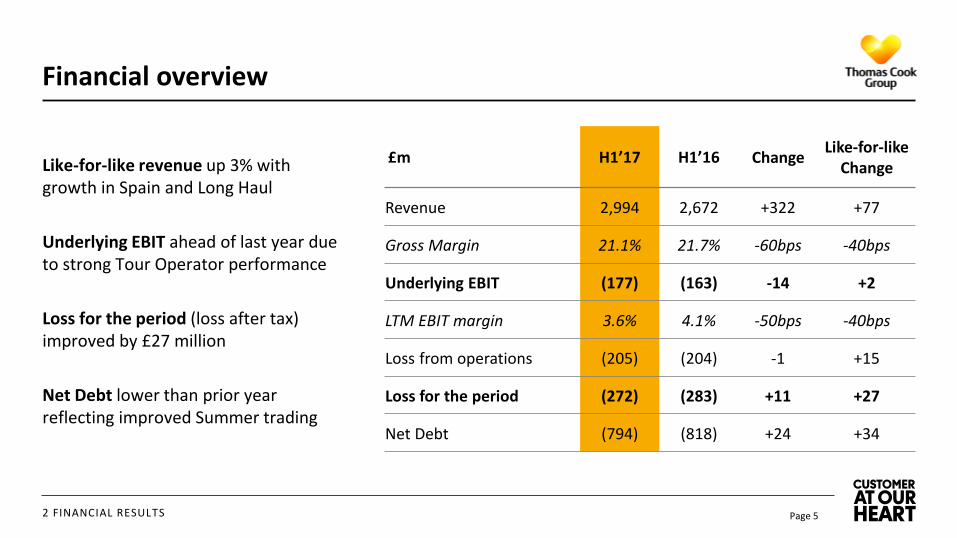
Financial overview
2 FINANCIAL RESULTS Page 5
£m H1’17 H1’16 Change Like-for-like
Change
Revenue 2,994 2,672 +322 +77
Gross Margin 21.1% 21.7% -60bps -40bps
Underlying EBIT (177) (163) -14 +2
LTM EBIT margin 3.6% 4.1% -50bps -40bps
Loss from operations (205) (204) -1 +15
Loss for the period (272) (283) +11 +27
Net Debt (794) (818) +24 +34
Like-for-like revenue up 3% with growth in Spain and Long Haul
Underlying EBIT ahead of last year due to strong Tour Operator performance
Loss for the period (loss after tax) improved by £27 million
Net Debt lower than prior year reflecting improved Summer trading

Group revenue bridge
Page 6 2 FINANCIAL RESULTS
Continued expansion of our Western Med and Long Haul programmes
65
56
326
2,917
Easter timing
(55)
Fuel
(26)
FX H1’16
2,672
H1’17 LfL Spain
18
Greece Long Haul
18
2,994
Other
(80)
Turkey
Like-for-like change +£77m (+3%)
H1’17
-41%
+5%
+36% +6%
+3%

Gross margin by business
Group gross margin slightly below last year, mainly due to weaker trading at Condor
Page 7
UK Continental Europe
Northern Europe
Condor Group
21.1% 21.5% 21.2% 23.3%
24.5%
27.9% 25.8% 26.4%
22.7% 23.1% 22.7% 21.2%
13.7% 14.2% 13.9%
2 FINANCIAL RESULTS
H1’15 LfL
H1’16 LfL
H1‘17 H1’15 LfL
H1’16 LfL
H1‘17 H1’15 LfL
H1’16 LfL
H1‘17
H1’15 LfL
H1’16 LfL
H1‘17 H1’15 LfL
H1’16 LfL
H1‘17
+40bp -20bp -60bp -120bp -40bp

Group EBIT bridge
Page 8 2 FINANCIAL RESULTS
New Operating Model continues to benefit the UK and Continental Europe
(19)
(10)
(6)
14
8
Continental Europe
UK
(179)
H1’16 LfL Easter timing FX H1’16
(163)
Like-for-like change +£2m
H1’17
(177)
Corporate
(1)
Condor Northern Europe
0
Includes net New Operating Model
Benefits of £15m

EBIT by business
Page 9 2 FINANCIAL RESULTS
(176)
324
(58)
(129)
(179)
(22)
42
(58)
(128)(177)
(41)
42
(50)
(114)
H1’15 LfL
H1’16 LfL
H1‘17
UK Continental
Europe Condor Group(i)
+£14m +£8m -£19m +£2m
Northern Europe
Same
H1’15 LfL
H1’16 LfL
H1‘17 H1’15 LfL
H1’16 LfL
H1‘17 H1’15 LfL
H1’16 LfL
H1‘17 H1’15 LfL
H1’16 LfL
H1‘17
(i) Group includes Corporate costs of £14m in H1’17 (H1’16 LfL: £13m; H1’15 LfL: £17m)
Challenging H1 for Condor but on track to meet full year improvement plans
4.9% 6.8% 10.2% 10.4% 3.0% -2.5% 4.0% 3.6% LTM EBIT Margin % 4.5% 4.9% 3.9% 7.3% 2.4% 1.9% 2.5%

Condor H1 performance
Page 10 2 FINANCIAL RESULTS
Profitability actions starting to improve performance
(8)
(18)
Yield Profitability actions
7 (41)
H1’17
Like-for-like change -£19m
FX FX
(1)
H1’16
(18)
H1’16 LfL
(22) (3)
Easter timing

(38) (13) (6)
Q4'16LfL
Q1'17LfL
Q2'17
Page 11
Improving trend for Condor profitability through implementation of improvement measures
Reroute capacity
Cost reduction initiatives
Fuel hedging benefit
More flexible planning
Improving trend of Condor’s performance
Condor year-on-year EBIT change (£m)
Targeting £35m of annualised profit improvement1 – full impact in FY18
Profit improvement measures
2 FINANCIAL RESULTS
1. Versus FY16 baseline

Group cash flow
2 FINANCIAL RESULTS Page 12
£m H1’17 H1’16 Change
EBITDA (66) (66) -
Working Capital (335) (407) +72
Tax (30) (6) -24
Pensions & Other (8) (6) -2
Operating Cashflow (439) (485) +46
Bond refinancing costs (10) - -10
Exceptional items (41) (35) -6
Capital Expenditure(i) (91) (84) -7
Net Interest Paid (67) (42) -25
Free Cash Flow (648) (646) -2
Co-op payment (32) (4) -28
Net Cash Flow (680) (650) -30
Improvement in operating cash flow of £46 million offset by bond refinancing costs and Co-op payment
› Working capital boosted by strong Summer bookings
› Higher tax due to timing of tax payments in Germany
› Interest costs higher due to timing of interest payments in relation to bond refinancing
› £32 million paid to Co-op in respect of UK retail joint venture
(i) Capex shown net of disposal proceeds (£1m in H1’17 and £1m in H1’16)

Net debt
Page 13 2 FINANCIAL RESULTS
Net Debt of £794 million represents a reduction of £34 million on a like-for-like basis
Operating Cashflow
Mar-16 LfL
£539m
£(155)m
£(32)m
Net Interest Paid
£(794)m
Like-for-like reduction £34m
Mar-17 Co-op payment
£(208)m
£(828)m
Bond refinancing
£(25)m
FX
£15m
Mar-16
£(818)m
Exceptionals Capex
£(110)m
Includes timing impact of £24m of interest paid in connection with
bond refinancing in December 2016 Includes £10m cash and £15m non-cash costs

Page 14
Financing review
› Target to reduce fixed-term debt by further £200 million Lower interest costs remains a key priority for Group
› Strengthened financial position New €750m 2022 bond extends debt maturities at a lower interest rate
› Improving credit outlook Outlook revised from ‘Stable’ to ‘Positive’ by Fitch and Standard & Poor’s
› Expect to declare dividend with full year results Policy targets distribution of 20% to 30% of reported net profit
2 FINANCIAL RESULTS

Agenda
Page 15
› Highlights
› Financial results
› Strategic progress - Peter Fankhauser | CEO
› Current trading and outlook

Our strategy for profitable growth – a recap
Page 16 3 STRATEGIC PROGRESS

Benefits from our strategic progress – 1
Page 17 3 STRATEGIC PROGRESS
CARE
CONTACT
More satisfied customers
› UK web sales up 15% and Germany up 35%
› Enriched online content for greater inspiration
› Growing direct distribution in Germany through more franchise retail and improved web distribution
More effective customer engagement
› Focus on service and quality drives up Group Net Promoter Score by 8 points
› 24-hour hotel promise extended to reach 80% of sun & beach customers in core hotels

Benefits from our strategic progress – 2
Page 18 3 STRATEGIC PROGRESS
HOLIDAYS
SERVICES
PARTNER- SHIPS
› Own-brand hotel sales up 10% for the Summer
› Moving towards fewer, better quality differentiated hotels
More focused, higher quality hotel offering
› Ancillary sales up 14%, reflecting more personalised offers
› New business unit to focus on holiday money
Added value from personalised services
› Webjet partnership in complementary hotels leading to efficiencies across the Group
› Thomas Cook China growing rapidly
Acceleration of strategic progress

Progress towards a more focused holiday offering
Page 19 3 STRATEGIC PROGRESS
Number of Customers
Number of Hotels Own-brand hotels (part of differentiated hotel offering)
Differentiated hotels
› Focus on added value to our customers
› Greater influence on hotel quality
› Leverage scale across Group
› Automated low-cost production
› Source electronically
› Expands choice for customer
Differentiated Hotels Complementary Hotels
1/3 of holiday customers
2/3 of holiday customers

Developing and growing own-brand hotels
Page 20
› Own-brand hotels are key to our holiday offering:
- Higher NPS than other hotels
- More control
- Higher returns
› Pipeline of 11 new hotels for Summer 17, and a further 11 by Summer 18
› Focus on quality and sharpening brands
3 STRATEGIC PROGRESS
Sunwing Sandy Bay, Cyprus Casa Cook, Kos
Sunprime Miramare, Rhodes SENTIDO Flora Garden, Antalya

Developing our airline business
Page 21 3 STRATEGIC PROGRESS
Opening new routes
› 15 new destinations added this year
› Long-haul growth – S17 bookings +9%
› Short-haul flexibility to match demand changes
Leveraging distribution Customer focus Cost control
› 50% of passengers from TC tour operator
› Growing direct-to-customer and 3rd party tour operator channels
› Entire fleet new or refurbished
› Significant reduction in 3-hour delays
› New in-flight entertainment
› Rigorous cost discipline to maintain competitive edge
› Improved reliability
› Increased productivity

Benefits from our strategic progress – 2
Page 22 3 STRATEGIC PROGRESS
HOLIDAYS
SERVICES
PARTNER- SHIPS
› Own-brand hotel sales up 10% for the Summer
› Moving towards fewer, better quality differentiated hotels
More focused, higher quality hotel offering
› Ancillary sales up 14%, reflecting more personalised offers
› New business unit to focus on holiday money
Added value from personalised services
› Webjet partnership in complementary hotels leading to efficiencies across the Group
› Thomas Cook China growing rapidly
Acceleration of strategic progress

Benefits from our strategic progress – 3
Page 23 3 STRATEGIC PROGRESS
OPERATIONAL EFFICIENCIES AND STREAMLINED ORGANISATION STRUCTURE
› Cost initiatives underway to align and integrate our tour operator processes
› Reducing duplication and sharing best practice in Continental Europe
› Further restructuring in France
› New shared service centre in Palma to consolidate finance support across Group
£60m of cost efficiencies targeted
through New Operating Model

Agenda
Page 24
› Highlights
› Financial results
› Strategic progress
› Current trading and outlook - Peter Fankhauser | CEO

Current trading – Summer bookings up 12%
Page 25
Based on cumulative bookings to 6th May 2017
Winter 2017/18
Summer 2017
• Very early in cycle with around 10% sold
• Bookings slightly higher than last year; average selling prices up 5%
• Strong trading with bookings up 12%, pricing broadly in line
• High demand for Greece and smaller European destinations
• Double-digit bookings growth for Continental and Northern Europe
• Condor bookings up 18%
• UK focus on quality and margin due to more competitive market to Spain
4 CURRENT TRADING AND OUTLOOK

Page 26
Summary and outlook
› Strategic progress is delivering results
› Putting the customer first
› Improving our holiday offering
› On track to deliver market expectations for the full year
4 CURRENT TRADING AND OUTLOOK

Page 27
Q&A

Financial calendar
› Q3 2017 Results - 27 July 2017
› Pre-close Trading Update – 26 September 2017
› 2017 Full Year Results – 22 November 2017
› Q1 2018 Results – 8 February 2018
› Pre-close Trading Update – 27 March 2018
› H1 2018 Interim Results – 17 May 2018
Page 28 APPENDIX

331
(127)(54)
488
24
343
(129)(50)
498
24
294
(128)(49)
469
2
8.6
1.41.6
3.52.1
8.4
1.31.6
3.52.0
8.1
1.41.63.3
1.8
Revenue & EBIT by quarter
Page 29 APPENDIX
Q4 40%
Q1 20%
H1 LTM(1)
Q3 23%
Revenue £bn
EBIT £m
Share of revenue
-£0.2bn -£0.2bn Same +£0.1bn
-£0.3bn
H1’16 LTM LfL
H1’17 LTM
H1’15 LTM LfL
Q2’16 LfL
Q2’17 Q2’15 LfL
Q1’16 LfL
Q1’17
Q1’15 LfL
Q4’15 LfL
Q4’16
Q4’14 LfL
Q3’15 LfL
Q3’16
Q3’14 LfL
-£22m -£29m +£1m +£1m
-£49m
(1) LTM refers to last twelve months
Q2 17%

Group income statement
Page 30
£m H1’17 H1’16 LfL H1’15 LfL H1’17 to H1’16
LfL Change
Revenue 2,994 2,917 2,993 +77
Gross Profit 633 627 635 +6
Overheads (810) (806) (811) -4
EBIT (177) (179) (176) +2
Separately Disclosed Items (EBIT) (28) (41) (47) +13
Loss from Operations (205) (220) (223) +15
Associated Undertakings - - 8 -
Net Finance costs (74) (73) (79) -1
Separately Disclosed Items (Finance Charges) (35) (7) (12) -28
Loss before Tax (314) (300) (306) -14
Tax 42 1 (11) +41
Loss for the period (272) (299) (317) +27
APPENDIX

Revenue by business
Page 31
H1’17 vs. H1’16
£m H1’17 H1’16 H1’16 LfL Headline variance
Like-for-like variance
UK & Ireland 707 700 664 +1% +6%
Continental Europe 1,206 1,036 1,201 +16% Flat
Northern Europe 617 536 583 +15% +6%
Condor 609 546 616 +12% -1%
Corporate (145) (146) (147) n/a n/a
Group Revenue 2,994 2,672 2,917 +12% +3%
APPENDIX

Gross margin by business
Page 32
H1’17 vs. H1’16
£m H1’17 H1’16 H1’16 LfL Headline variance
Like-for-like variance
UK & Ireland 23.1% 22.4% 22.7% +70bps +40bps
Continental Europe 13.7% 13.8% 13.9% -10bps -20bps
Northern Europe 25.8% 26.7% 26.4% -90bps -60bps
Condor 23.3% 24.2% 24.5% -90bps -120bps
Corporate n/a n/a n/a n/a n/a
Group Gross Margin 21.1% 21.7% 21.5% -60bps -40bps
APPENDIX

EBIT by business
Page 33
H1’17 vs. H1’16
£m H1’17 H1’16 H1’16 LfL Headline variance
Like-for-like variance
UK & Ireland (114) (124) (128) +8% +11%
Continental Europe (50) (48) (58) -4% +14%
Northern Europe 42 40 42 +5% Flat
Condor (41) (18) (22) -128% -86%
Corporate (14) (13) (13) n/a n/a
Group EBIT (177) (163) (179) -9% +1%
APPENDIX

Page 34
Supplementary information – Tour Operators
APPENDIX
H1’17 vs. H1’16
£m H1’17 H1’16 H1’16 LfL Headline variance
Like-for-like variance
Revenue 2,284 2,056 2,264 +228 +20
Gross Margin 15.0% 15.0% 14.9% Flat +10bps
Underlying EBIT (81) (93) (100) +12 +19
Underlying LTM EBIT margin (%) 4.0% 3.6% 3.5% +40bps +50bps
Average Selling Price (ASP) (£) 723 611 685 +112 +38

Page 35
Supplementary information - Airlines
APPENDIX
H1’17 vs. H1’16
£m H1’17 H1’16 H1’16 LfL Headline variance
Like-for-like variance
Revenue 1,202 1,098 1,163 +104 +39
Gross Margin 23.8% 24.3% 24.7% -50bps -90bps
Underlying EBIT (82) (57) (66) -25 -16
Underlying EBITDAR 67 64 75 +3 -8
Underlying LTM EBIT margin (%) 2.0% 4.5% 4.4% -250bps -240bps
Available Seat Kilometre (ASK) (‘m) 22,148 21,675 21,675 +473 +473
Seat Load Factor (SLF) (%) 88.6% 88.3% 88.3% +0.3% +0.3%
Long Haul Yields per seat (£) 307 291 324 +16 -17
Short Haul Yields per seat (£) 116 108 121 +8 -5

Separately disclosed items
Page 36
P&L (£m) H1’17 H1’16
New Operating Model implementation costs (18) (20)
Restructuring costs (9) (4)
Reassessment of provisions 32 4
Store closures (16) (13)
Other (17) (8)
EBIT related items (28) (41)
Finance related charges (35) (7)
Total (63) (48)
Of which:
- Cash(i) (57) (23)
- Non-Cash (6) (25)
(i) Items classified as ”Cash” represent both current year cash flows, and cash effects which are yet to be realised
Cash (£m) H1’17 H1’16
Cash related exceptionals (57) (23)
Of which will be paid in future years 22 -
Prior year cash exceptionals paid in financial year (13) (8)
Prior year EU261 (paid in financial year) (3) (4)
Total (51) (35)
APPENDIX

Underlying finance costs
Page 37 APPENDIX
Pro Forma P&L
£m Coupon H1’17 H1’16 2017 2018 2019 2020 2021 2022
Interest on bank facilities LIBOR
+3.50% 2 0 - - - - - -
Interest on 2017 £300m bond 7.75% 4 12 4 - - - - -
Interest on 2020 €525 bond (inc. IRS) 7.75% 6 14 7 - - - - -
Interest on 2021 €400m bond 6.75% 12 10 23 23 23 23 17 -
Interest on 2022 €750m bond 6.25% 13 - 33 40 40 40 40 30
Bank and bond interest and related charges 37 36 67 63 63 63 57 30
Commitment fees 3 4
Assumed at c.£70m (same level as 2016)
Letters of credit & bonding 9 8
Other interest costs 7 10
Interest & finance costs before aircraft financing
56 58
Interest income (2) (3)
Net interest & finance costs before aircraft financing
54 55
Aircraft financing 9 8
Fee amortisation and other non-cash 11 10
Net Interest Expense (excl.
exceptionals) 74 73 137 133 133 133 127 100
Assumes all bonds are paid on maturity

Net debt composition
Page 38 APPENDIX
Maturity profile – 31 March 2017
800
342
641
2017 2022 2018 2019 2021 2020
Bank facility
€400m senior notes
€750m senior notes
£m H1’17 H1’16 Variance
2017 GBP Bond Jun-17 - (299) +299
2020 Euro Bond Jun-20 - (415) +415
2021 Euro Bond Jun-21 (342) (316) -26
2022 Euro Bond Jun-22 (642) - -642
Commercial Paper Various (140) (134) -6
Revolving Credit Facility May-19 (50) - -50
Finance Leases Various (167) (183) +16
Aircraft related borrowings Various (47) (69) +22
Other external debt Various (33) (25) -8
Arrangement fees & other n/a 18 16 +2
Total Debt (1,403) (1,425) +22
Cash 609 607 +2
Net Debt (794) (818) +24
£m

Cash conversion
Page 39 APPENDIX
Cash conversion (£m) H1’17 LTM
H1’16 LTM
FY16
Underlying EBIT 294 321 308
Net interest (141) (135) (140)
Underlying PBT 153 186 168
Free cash flow 56 (51) 56
Cash conversion 36% n/m 33%
H1’17 LTM
FY16 H1’16 LTM
33% 36%
Not meaningful

Reconciliation of ‘like for like’ to underlying numbers
Page 40
“Underlying” refers to trading results after adjusting for separately disclosed items that are significant in understanding the on-going results. “Like for like” reflects the comparison in the underlying results after removing identifiable non-recurring items in the prior year.
Revenue Gross Margin EBIT
£m H1’17 £m
H1’16 £m
Change £m
H1’17 %
H1’16 %
Change %
H1’17 £m
H1’16 £m
Change £m
Underlying 2,994 £2,672 +322 21.1% 21.7% -60bps (177) (163) -14
Easter timing (55) +55 0.1% -10bps (10) +10
Impact of Currency Movements and other(i) 326 -326 (0.5)% +50bps (6) +6
Reduced fuel costs (26) +26 0.2% -20bps - -
Like-for-Like 2,994 2,917 +77 21.1% 21.5% -40bps (177) (179) +2
APPENDIX
(i) Other includes alignment of comparatives to reallocate per diem costs associated with airline crew from operating costs to cost of sales

Page 41
Capital expenditure
H1’16 H1’17
3
30
6 4
41 Hotels
IT
Airlines
Other
Store refits
£84m
5
31
7
45
3
£91m
APPENDIX

FX and fuel hedging (30 April 2017)
Page 42 APPENDIX
Winter
2016/17 Price Summer
2017 Price 2017 Price Winter
2017/18 Price Summer
2018 Price 2018 Price
EUR 99% 95% 96% 76% 41% 51%
USD 97% 94% 95% 84% 43% 62%
Jet Fuel(i) 95% $587 90% $485 92% $536 98% $519 51% $528 72% $521
Overall Fuel Rate(ii)
£466 £468
((iii) Spot rates as at 30 April 2017
FY17 overall fuel rate £466/Mt represents a projected saving of £30m versus FY16 (£505/Mt)
Transactional USD exposures against EUR, GBP and DKK have been hedged in line with Fuel hedges. A 1% variance in 2017 would have an annualised £0.7m impact
Transactional EUR exposures against GBP and SEK hedged in line with policies. A 1% variance in 2017 would have an annualised £0.4m impact
It is our policy not to hedge EUR and SEK profits and so FY16 profits will not be hedged. At current rates(iii), the impacts of fluctuations in those currencies can be summarised as:
Every 1% move in Euro has a £1.3m impact on EBIT
Every 1% SEK movement has a £0.6m impact on EBIT
(i) Jet Fuel Price [$/Mt] incorporates achieved hedge rates per season with market forward rates applied to unhedged portion.(ii) Based on estimated Jet Fuel costs & Intoplane costs, converted at $ blended hedged rates into functional CCY equivalents and then translated into GBP, either at blended rates for partially completed years or latest spot rates [£/Mt]