h1 2016 results hanover august 3, 2016 - continental usa...h1 2016 results – august 3, 2016 edmr...
TRANSCRIPT

http://www.continental-ir.com Wolfgang Schaefer – CFO
Ticker: CON
ADR-Ticker: CTTAY
Twitter: @Continental_IR
H1 2016 Results
Hanover – August 3, 2016

H1 2016 Results – August 3, 2016
EDMR – Equity and Debt Markets Relations 2
AGENDA
Corporation Highlights 1 3
Automotive Group 2 11
Rubber Group 3 13
Indebtedness and Cash Flow 4 16
Outlook 2016 5 19
Back-up and Fact Sheets 2014 – 2016 6 28

H1 2016 Results – August 3, 2016
EDMR – Equity and Debt Markets Relations
1) Corporation Highlights Most Important KPIs for H1 2016
3
1 Before amortization of intangibles from PPA, consolidation and special effects
2 Attributable to the shareholders of the parent
3 Trailing ROCE is calculated as reported EBIT for the last twelve months (LTM) divided by average operating assets for the LTM
› Sales up by 2% to €20 bn; organic sales growth at 4%; FX negative at €564 mn
› Adj. EBIT1 up by 7% to €2.4 bn; adj. EBIT1 margin at 12.1%
(PPA -€69 mn and special effects -€23 mn)
› NIAT2 up by 13% to €1.6 bn
› Free cash flow amounted to €959 mn including €82 mn cash outflow for acquisitions;
free cash flow before acquisitions amounted to €1,041 mn
› Gearing ratio down to 26%; equity ratio at 39%
› Value creation: trailing ROCE3 up by 90 bps to 21.2% YOY
Other topics:
› Renesas situation impacted organic sales growth in Automotive negatively by about 1%;
revenues will gradually recover in H2 2016
› Order intake in the Automotive Group up to more than €18 bn
› S&P rating upgrade to BBB+ outlook stable on May 11, 2016

H1 2016 Results – August 3, 2016
EDMR – Equity and Debt Markets Relations
1) Corporation Highlights Divisional Highlights in H1 2016
4
Auto
motive G
roup
Rubber
Gro
up
› Tires: Adj. EBIT1 margin increased by 180 bps to 22.8% benefitting from lower raw material costs totaling
€100 mn in H1 2016, solid price mix (-2%); volumes were up by 8% in H1 2016; FX impacted tire sales
negatively by 4% in H1 2016
› Tire markets: PC & LT tire replacement demand in Europe was up by 2%; NAFTA was up by 2%
› ContiTech: Adj. EBIT1 margin increased by 300 bps to 10.8% in H1 2016; organic sales up by 2%
in H1 2016
› Rubber Group: Organic sales up by 5% (Q2 16: 4%) and adj. EBIT1 margin up to 18.8% (Q2 16: 19.8%)
› Chassis & Safety: Adj. EBIT1 margin at 9.9% (Q2 16: 10.0%); organic sales up by 6% (Q2 16: 8%); ADAS
unit sales up by 45% in H1 2016; solid order intake in VED and ADAS
› Powertrain: Adj. EBIT1 margin at 5.2% (Q2 16: 6.4%); organic sales up by 2% (Q2 16: 4%); adj. EBIT1
margin before HEV at 8% in Q2 16
› Interior: Adj. EBIT1 margin at 8.8% (Q2 16: 9.1%); organic sales increased by 3% (Q2 16: 4%); muted
organic sales growth and margin decline explained by several ramp ups and the Renesas situation in Japan
› Automotive Group: Organic sales increased by 4% (Q2 16: 5%), worldwide car production up by 2%
(Q2 16: 2%); adj. EBIT1 margin down by 70 bps to 8.1% (Q2 16: 8.6%); R&D expense up by €158 mn (14%)
› Order intake in the Automotive Group increased to more than €18 bn
1 Before amortization of intangibles from PPA, consolidation and special effects

H1 2016 Results – August 3, 2016
EDMR – Equity and Debt Markets Relations
› Continental pledges initial investment of at least $1 million towards
the development and deployment of Intelligent Intersection
Systems
› Winner will be the country’s first city to fully integrate innovative
technologies into their transportation network
› As part of its commitment, Continental will provide advanced
sensing, vehicle-to-vehicle and vehicle-to-infrastructure (V2X)
communication technology
Continental is back to the agricultural tire sector as a
premium manufacturer. Intending to bring a
complete tire portfolio for agricultural tractors and
harvesting machines to the market. The range will
include radial and cross-ply tires in 150 sizes. SoP
is planned for 2017.
Control at your fingertips while your hands remain safely
on the steering wheel: A quick swipe with the thumb, a
light wave with the hand to accept an incoming call,
activate the required driving mode, or start your favorite
song.
The innovative electronic brake system integrates the brake
actuation, brake booster and control systems (ABS and ESC)
into a compact, weight-saving braking module that weighs up
to 4 kg less than a conventional system. It also fulfills
increased pressure dynamics requirements for new ADAS
functions.
Thanks to its wide field of view it not only detects other vehicles, but even
pedestrians for the first time. Ranging up to 170 meters and even in
adverse weather conditions. Automatic braking is initiated if necessary - this
sensor is now standard in the new VW Tiguan.
A recognition of Continental’s development contribution towards Toyota’s
active safety package “Toyota Safety Sense C”. It combines innovative
safety technologies Pre-Collision System (PCS), Lane Departure Alert
(LDA), and Auto High Beams (AHB) to help assist the driver.
1) Corporation Highlights Selected Press Clippings Released in H1 2016
€50mn invest into radial agricultural tire production
Go to press release
Long Range
Radar Senor
VW Tiguan runs AEB on Continental
radar sensor only
Go to press release
MK C1 Brake debuts in the new Alfa Romeo Giulia
Go to press release MK C1
Go to press release
Driver HMI: gesture-based controls
Go to press release
Turbochargers: RAAX™ technology to debut
in Audi A3
RAAX™ technology results in up to
3 percent greater efficiency in the
engine relevant operating range,
leading to reduced emissions. In
addition the turbo lag is minimized
which results in a significant
improvement in response.
RAAX™Turbine Wheel
Go to press release
Multi Function Mono
Camera with Lidar Continental wins Toyota’s T&D award for
ADAS technology, already installed in 10 Toyota models
Continental partners with U.S. Department of
Transportation for Smarter Cities Challenge
Go to press release
5

H1 2016 Results – August 3, 2016
EDMR – Equity and Debt Markets Relations
8,390 8,528 8,6708,918
9,569
10,030
9,61810,016
9,85110,191
1,010
1,2331,095
1,303
Q1/14 Q2/14 Q3/14 Q4/14 Q1/15 Q2/15 Q3/15 Q4/15 Q1/16 Q2/16 Q3/16 Q4/16
Sales (mn €) Adj. EBIT (mn €)
1) Corporation Highlights Sales and Adjusted EBIT1 by Quarter
6
FY Sales €34,506 mn
1 Before amortization of intangibles from PPA, consolidation and special effects
H1 Sales €20,042 mn
Adj. EBIT1 €2,398 mn
1
FY Sales €39,232 mn

H1 2016 Results – August 3, 2016
EDMR – Equity and Debt Markets Relations
5,1
29
5,1
76
5,1
62
5,4
42 5,9
12
5,9
96
5,6
61
6,0
05
6,0
11
6,1
58
505547
456528
Q1
/14
Q2
/14
Q3
/14
Q4
/14
Q1
/15
Q2
/15
Q3
/15
Q4
/15
Q1
/16
Q2
/16
Q3
/16
Q4
/16
Sales (mn €) Adj. EBIT (mn €)
3,2
71
3,3
62
3,5
18
3,4
87
3,6
69
4,0
45
3,9
68
4,0
22
3,8
52
4,0
45
538
733667
800
Q1
/14
Q2
/14
Q3
/14
Q4
/14
Q1
/15
Q2
/15
Q3
/15
Q4
/15
Q1
/16
Q2
/16
Q3
/16
Q4
/16
Sales (mn €) Adj. EBIT (mn €)
1) Corporation Highlights Automotive Group and Rubber Group by Quarter
7
1 Before amortization of intangibles from PPA, consolidation and special effects
1 1
Automotive Group Rubber Group

H1 2016 Results – August 3, 2016
EDMR – Equity and Debt Markets Relations
1.6%
4%
2%
GDP growthEurozone 2016
PC & LT prod.growth Europe
ContiTechorganic sales
growth
3%
3%
8%
Replacement tire volume
growth NAFTA
Replacement tire volume
growth Europe
CommercialVehicle Tires
volume growth
4%
2%
4%
PC & LT prod.growth EU/NAFTA
PC & LT prod. growth ww
AutomotiveGroup organic sales growth
2%
2%
8%
Replacement tire volume
growth NAFTA
Replacement tire volume
growth Europe
Passenger & Light Truck Tires volume growth
1) Corporation Highlights Growth Profile of the Corporation H1 2016
8
Co
nti
Mark
et
1 According to IMF (WEO Update July 2016)
1
Co
nti
Mark
et
Co
nti
Mark
et
Co
nti
Mark
et

H1 2016 Results – August 3, 2016
EDMR – Equity and Debt Markets Relations
16,6
25
16
,52
2
16
,53
6
16,7
27
17
,51
0
18
,19
8
18,9
10
19
,68
1
19
,76
7
19,9
83
20.6% 20.8%
19.3%20.0%
19.5%20.3%
21.6%20.9% 21.1% 21.2%
Q1 Q2 Q3 Q4 Q1 Q2 Q3 Q4 Q1 Q2 Q3 Q4
2014 2015 2016
trailing OA (mn €) trailing ROCE
1) Corporation Highlights Sustainable Value Creation
9
1 Trailing operating assets are calculated as assets for the last twelve months
2 Trailing ROCE is calculated as reported EBIT for the last twelve months divided by trailing operating assets
1 2

H1 2016 Results – August 3, 2016
EDMR – Equity and Debt Markets Relations
750 750500
750
354
2016 2017 2018 2019 2020 2021
1) Corporation Highlights Maturities for Syndicated Loan and Bonds1 (mn €)
10
1 All amounts shown are nominal values
2 Any utilization under the Revolving Credit Facility (RCF) has to be shown as short term debt acc. to IFRS although the RCF matures in 2021. It has a total volume of €3,000 mn
Syndicated loan Bonds
As at June 30, 2016
(mn €) FY 15 H1 16
Gross indebtedness 5,245 5,230
Cash 1,622 1,720
Net indebtedness 3,542 3,446
Available credit lines 3,612 3,545
Total liquidity 5,233 5,266
2

H1 2016 Results – August 3, 2016
EDMR – Equity and Debt Markets Relations
439
189
356
0
984
Chassis & Safety
Powertrain Interior cons. AutomotiveGroup
9.9%
5.2%
8.8%8.1%
Adj. EBIT margin (%)
4,448
3,655
4,123
57
12,169
Chassis & Safety
Powertrain Interior cons. AutomotiveGroup
2.2%
3.4% 3.8%
5.7%Organic sales growth (%)
Reported change in sales
› Chassis & Safety: 4.0%
› Powertrain: 0.2%
› Interior: 2.2%
› Automotive Group: 2.2%
11
2) Automotive Group Sales and Adj. EBIT1 by Division
Automotive Group Sales (mn €) H1 2016 Automotive Group Adj. EBIT1 (mn €) H1 2016
-
1
1 Before amortization of intangibles from PPA, consolidation and special effects
› Reported EBITDA: €1,465 mn (12.0% of sales)
› Reported EBIT: €942 mn (7.7% of sales)
› R&D: €1,259 mn (10.3% of sales)
› Capex: €497 mn (4.1% of sales)

H1 2016 Results – August 3, 2016
EDMR – Equity and Debt Markets Relations
5,996 5,661 6,005 6,011 6,158
Q2/15 Q3/15 Q4/15 Q1/16 Q2/16
547 528
9.1%8.6%
Q2/15 Q3/15 Q4/15 Q1/16 Q2/16
› Sales increased by €161 mn; organic sales growth in Q2 2016 at 5.1% negatively impacted by the
Renesas situation in Japan
› Adj. EBIT1 decreased by €19 mn mainly because of high R&D costs for new car programs
› Adj. EBIT1 margin at 8.6% (PY: 9.1%)
12
2) Automotive Group Q2 2016: Adj. EBIT1 Impacted by High R&D Expenses
Automotive Group Sales (mn €) Adj. EBIT1 (mn €) and Adj. EBIT1 Margin
+161 -19
1 Before amortization of intangibles from PPA, consolidation and special effects

H1 2016 Results – August 3, 2016
EDMR – Equity and Debt Markets Relations
286
1,180
0
1,467
ContiTech Tires cons. Rubber Group
10.8%
22.8% 18.8%
Adj. EBIT margin (%)
2,736
5,205
45
7,896
ContiTech Tires cons. Rubber Group
1.8%
6.2% 4.6%
Organic sales growth (%)
Reported change in sales
› ContiTech: 1.8%
› Tires: 2.8%
› Rubber Group: 2.4%
13
3) Rubber Group Sales and Adj. EBIT1 by Division
1 Before amortization of intangibles from PPA, consolidation and special effects
Rubber Group Sales (mn €) H1 2016 Rubber Group Adj. EBIT1 (mn €) H1 2016
-
1
› Reported EBITDA: €1,805 mn (22.9% of sales)
› Reported EBIT: €1,401 mn (17.7% of sales)
› R&D: €184 mn (2.3% of sales)
› Capex: €422 mn (5.3% of sales)

H1 2016 Results – August 3, 2016
EDMR – Equity and Debt Markets Relations
4,045 3,968 4,022 3,852 4,045
Q2/15 Q3/15 Q4/15 Q1/16 Q2/16
733800
18.1%19.8%
Q2/15 Q3/15 Q4/15 Q1/16 Q2/16
› Sales remained unchanged; strong volume growth in tires and the stabilization of the industry business
in ContiTech were not able to offset negative FX effects; mining business remains subdued
› Tire volumes increased by 8%; FX had a negative effect of ~4% on tire sales in Q2 2016 while price
mix stood at -2%
› Adj. EBIT1 increased by €67 mn supported by ~50 mn positive effect from lower raw material prices
14
3) Rubber Group Q2: Strong Volume Growth in Tires; Stabilization of Industry Business
Rubber Group Sales (mn €)
0 +67
Adj. EBIT1 (mn €) and Adj. EBIT1 Margin
1 Before amortization of intangibles from PPA, consolidation and special effects

H1 2016 Results – August 3, 2016
EDMR – Equity and Debt Markets Relations
121
141
145
155
86
100
105
108
0
100
200
300
400
500
600
Q1/1
1
Q2/1
1
Q3
/11
Q4
/11
Q1
/12
Q2/1
2
Q3/1
2
Q4/1
2
Q1/1
3
Q2/1
3
Q3
/13
Q4
/13
Q1/1
4
Q2/1
4
Q3/1
4
Q4/1
4
Q1/1
5
Q2
/15
Q3
/15
Q4/1
5
Q1/1
6
Q2/1
6
Q3/1
6E
Q4/1
6E
TSR 20 (U.S. cents/kg) Butadiene (U.S. cents/kg)
› Natural rubber price (TSR 20)
expected to average U.S. $1.40
in 2016 (down from prior forecast
of U.S. $1.50)
› Synthetic rubber price (butadiene
feedstock) forecasted to average
U.S. $1.00 in 2016 (up from prior
forecast of U.S. $0.90)
› Tailwind from lower raw material
cost to amount to about €150 mn
in 2016 (up €50 mn from prior
forecast)
15
3) Rubber Group Expected Raw Material Price Development in 2016
Raw Material Price Development1
2011 - 2016E (U.S. cents/kg)
1 1 1 1
1 Source: Bloomberg and Continental estimates for 2016
Average (Y)
TSR 20: 463
Butadiene: 297
Average (Y)
TSR 20: 326
Butadiene: 244
Average (Y)
TSR 20: 259
Butadiene: 148
Average (Y)
TSR 20: 181
Butadiene: 132
Average (Y)
TSR 20: 144
Butadiene: 90
Average (Y)
TSR 20: 140
Butadiene: 100

H1 2016 Results – August 3, 2016
EDMR – Equity and Debt Markets Relations
3,542
750
96082
622458
611
928
1,4273,446
Ne
t in
debte
dness
(FY
2015)
Div
ide
nd
20
15
Ca
pe
x
Acquis
itio
ns
Ch
an
ge
in
receiv
able
s
Change in
in
ve
nto
rie
s
Ch
an
ge
inp
aya
ble
s
De
pr.
an
dam
ort
ization
Oth
er C
F
Net
indebte
dness
(H1
20
16
)
16
4) Indebtedness and Cash Flow Net Indebtedness Bridge (mn €)
1 According to cash flow statement incl. intangible assets
2 Several smaller acquisitions in the Automotive and Rubber Group
€468 mn outflow from
change in working capital
27%
26%
1
Gearing
Ratio
2

H1 2016 Results – August 3, 2016
EDMR – Equity and Debt Markets Relations 17
4) Indebtedness and Cash Flow Cash Flow Overview
Cash Flow H1 2015 and H1 2016 (mn €)
1,7
14
-1,4
32
282
1,7
14
-83
2
88
21,9
82
-1,0
23
95
91,9
82
-941
1,0
41
Cash flow fromoperating activities
Cash flow used for investing activities
Free cashflow
2015 2015 before acquisitions 2016 2016 before acquisitions

H1 2016 Results – August 3, 2016
EDMR – Equity and Debt Markets Relations 18
4) Indebtedness and Cash Flow Net Indebtedness and Gearing Ratio
4,2
42
4,2
73
3,9
26
2,8
24
4,0
99
4,2
36
4,2
96
3,5
42
3,0
83
3,4
46
43% 42% 36%26%
34% 34% 34% 27% 23% 26%
Q1 H1 9M YE Q1 H1 9M YE Q1 H1 9M YE
2014 2015 2016
Net indebtedness (mn €) Gearing ratio

H1 2016 Results – August 3, 2016
EDMR – Equity and Debt Markets Relations
4.2
04
4.4
12
4.1
77
4.2
37
4.2
67
4.5
21
4.3
50
4.3
63
4.4
40
4.5
80
4.2
50
4.2
63
5% 4%
8%5%
1% 2%4% 3% 4%
1%
-2%-2%
Q1/1
4
Q2/1
4
Q3/1
4
Q4/1
4
Q1/1
5
Q2/1
5
Q3/1
5
Q4/1
5
Q1/1
6E
Q2/1
6E
Q3/1
6E
Q4/1
6E
NAFTA chg YOY
5.5
69
5.5
89
5.2
20
6.2
32
5.9
71
5.7
08
4.8
30
7.1
70
6.3
50
6.0
00
5.3
80
6.8
40
9%11%
6% 6% 7%
2%
-7%
15%
6% 5%
11%
-5%
Q1/1
4
Q2/1
4
Q3/1
4
Q4/1
4
Q1/1
5
Q2/1
5
Q3/1
5
Q4/1
5
Q1/1
6E
Q2/1
6E
Q3/1
6E
Q4/1
6E
China chg YOY
5.1
73
5.2
69
4.4
92
4.9
31
5.3
81
5.4
06
4.7
10
5.1
53
5.4
70
5.8
00
4.7
50
5.1
20
9%
4%
0% 1%
4%3%
5% 5%2%
7%
1%-1%
Q1/1
4
Q2/1
4
Q3/1
4
Q4/1
4
Q1/1
5
Q2/1
5
Q3/1
5
Q4/1
5
Q1/1
6E
Q2/1
6E
Q3/1
6E
Q4/1
6E
Europe chg YOY
19
5) Outlook 2016 PC & LT Production by Quarter
Source: IHS and own estimates, Europe excluding Kazakhstan and Uzbekistan
2014:
19.9
2015:
20.7
2016E:
21.1
Europe (mn units)
2014:
17.0
2015:
17.5
2016E:
17.5
NAFTA (mn units)
2014:
22.6
2015:
23.7
2016E:
24.6
China (mn units)

H1 2016 Results – August 3, 2016
EDMR – Equity and Debt Markets Relations
23.5 22.813.2
85.0
24.2 23.212.5
87.0
Europe NAFTA South America
Asia
2015E 2016E
324278
64
415
329283
61
436
Europe NAFTA South America
Asia
2015E 2016E
20.717.5
3.0
46.4
21.117.5
2.6
47.8
Europe NAFTA South America
Asia
2015E 2016E
590 574
104
1,607
626 505
88
1,655
Europe NAFTA South America
Asia
2015E 2016E
20
5) Outlook 2016 Market Outlook for Major Regions in 2016
Commercial Vehicle2 Prod. (k units)
CV Repl.4 Tire Market (mn units)
Source: IHS and own estimates
Source: LMC and own estimates
0%
Source: IHS and own estimates
PC and LT1 Production (mn units)
Source: LMC and own estimates
PC and LT Repl.3 Tire Market (mn units)
1 Passenger car and light truck <6t
2 Heavy vehicles >6t
3 Passenger car & light truck replacement
4 Commercial vehicle replacement (radial and biased)

H1 2016 Results – August 3, 2016
EDMR – Equity and Debt Markets Relations
5) Outlook 2016 Continental Corporation
21
Consolidated sales
adj. EBIT1
€39.2 bn
€4.5 bn
Automotive Group
adj. EBIT1
€23.6 bn
€2.1 bn
Rubber Group
adj. EBIT1
€15.7 bn
€2.5 bn
Raw material cost
impact
Relief of about
€250 mn
2015
Special effects -€116 mn
Net interest result
Tax rate
-€246 mn
28.2%
Capex
PPA
€2.2 bn
€138 mn
Free cash flow before
acquisitions €2.7 bn
To increase to ~€41 bn at constant FX rates
>11%
~€25 bn
>8.5%
>€16 bn
>17%
Raw materials to positively affect Rubber Group results in 2016 by about €150 mn
2016E
About -€100 mn
<-€250 mn
<30%
Capex at around 6% of sales
PPA amortization: ~€150 mn
At least €2 bn
1 Before amortization of intangibles from PPA, consolidation
(2015 in comparison to 2014) and special effects

H1 2016 Results – August 3, 2016
EDMR – Equity and Debt Markets Relations 22
Thank you!

H1 2016 Results – August 3, 2016
EDMR – Equity and Debt Markets Relations 23
Disclaimer
› This presentation has been prepared by Continental Aktiengesellschaft solely in connection with the release of the H1 2016 results on August 3, 2016, in Hanover. It has not been independently verified. It does not constitute an offer, invitation or recommendation to purchase or subscribe for any shares or other securities issued by Continental AG or any subsidiary and neither shall any part of it form the basis of, or be relied upon in connection with, any contract or commitment concerning the purchase or sale of such shares or other securities whatsoever.
› Neither Continental Aktiengesellschaft nor any of its affiliates, advisors or representatives shall have any liability whatsoever (in negligence or otherwise) for any loss that may arise from any use of this presentation or its contents or otherwise arising in connection with this presentation.
› This presentation includes assumptions, estimates, forecasts and other forward-looking statements, including statements about our beliefs and expectations regarding future developments as well as their effect on the results of Continental. These statements are based on plans, estimates and projections as they are currently available to the management of Continental. Therefore, these statements speak only as of the date they are made, and we undertake no obligation to update publicly any of them in light of new information or future events. Furthermore, although the management is of the opinion that these statements, and their underlying beliefs and expectations, are realistic as of the date they are made, no guarantee can be given that the expected developments and effects will actually occur. Many factors may cause the actual development to be materially different from the expectations expressed here. Such factors include, for example and without limitation, changes in general economic and business conditions, fluctuations in currency exchange rates or interest rates, the introduction of competing products, the lack of acceptance for new products or services and changes in business strategy.
› All statements with regard to markets or market position(s) of Continental or any of its competitors are estimates of Continental based on data available to Continental. Such data are neither comprehensive nor independently verified. Consequently, the data used are not adequate for and the statements based on such data are not meant to be an accurate or proper definition of regional and/or product markets or market shares of Continental and any of the participants in any market.
› Unless otherwise stated, all amounts are shown in millions of euro. Please note that differences may arise as a result of the use of rounded amounts and percentages.

H1 2016 Results – August 3, 2016
EDMR – Equity and Debt Markets Relations 24
Contact Equity and Debt Markets Relations
Vahrenwalder Str. 9
30165 Hanover
Germany
e-mail: [email protected]
www.continental-ir.com
Rolf Woller
Head of IR
Phone: +49 511 938 1068
e-mail: [email protected]
Ingrid Kampf
Assistant to the Head of IR
Roadshow and Conference Organization
Phone: +49 511 938 1163
Fax: +49 511 938 1080
e-mail: [email protected]
Michael Saemann
Analysts, Institutional Investors and Sustainability Investors
Phone: +49 511 938 1307
e-mail: [email protected]
Klaus Paesler
Analysts, Institutional Investors, ADR and Private Investors
Phone: +49 511 938 1316
e-mail: [email protected]
Sabine Reese
Sustainability, ASM, CMD Organization, IR Website,
Capital Market Disclosure Requirements
Phone: +49 511 938 1027
e-mail: [email protected]
Henry Schniewind
Analysts, Institutional Investors
Phone: +49 511 938 1062
e-mail: [email protected]
Marvin Kalberlah
Social Media
Phone: +49 511 938 14034
e-mail: [email protected]

H1 2016 Results – August 3, 2016
EDMR – Equity and Debt Markets Relations 25
Continental Financial Calendar
2017
Preliminary figures for fiscal 2016 January 2017
Annual Financial Press Conference March 2017
Annual Shareholders’ Meeting (incl. key data for Q1 2017) April 28, 2017
Q1 Financial Report May 2017
Half Year Financial Report August 2017
Nine Month Financial Report November 2017
2016
Preliminary figures for fiscal 2015 January 11, 2016
Annual Financial Press Conference March 3, 2016
Annual Shareholders’ Meeting (incl. key data for Q1 2016) April 29, 2016
Q1 Financial Report May 4, 2016
Half Year Financial Report August 3, 2016
Nine Month Financial Report November 10, 2016

H1 2016 Results – August 3, 2016
EDMR – Equity and Debt Markets Relations 26
Continental Share Data / ADR Data
Share Data
Type of share No-par value share
Bloomberg Ticker CON
Reuters Ticker CONG
German Security Identification Number (WKN) 543 900
ISIN Number DE0005439004
Shares outstanding as at June 30, 2016 200,005,983
ADR Data
Ratio (ordinary share: ADR) 1:5
Bloomberg Ticker CTTAY
Reuters Ticker CTTAY.PK
ISIN Number US2107712000
ADR Level Level 1
Exchange OTC
Sponsor Deutsche Bank Trust Company Americas

H1 2016 Results – August 3, 2016
EDMR – Equity and Debt Markets Relations 27
Continental Bond Data
Issuer Conti-Gummi Finance B.V.,
Netherlands1 Continental AG Continental AG Continental Rubber of
America, Corp.1
Issue Senior Notes Senior Notes Senior Notes Senior Notes
Principal amount €750 mn €750 mn €750 mn €500 mn
Offering price 99.595% 98.950% 99.228% 99.739%
Rating at issuance date
Ba1 (Moody’s4)
BB (S&P)
BBB (Fitch2)
Ba2 (Moody’s4)
BB (S&P)
BB (Fitch2)
Ba1 (Moody’s4)
BB (S&P)
BBB (Fitch2)
BBB (S&P)
BBB (Fitch)
Current corporation
and bond ratings3 BBB (Fitch), BBB+ (S&P), Baa1 (Moody’s4)
Coupon 2.5% p.a. 3.0% p.a. 3.125% p.a. 0.5% p.a.
Issue date September 19, 2013 July 16, 2013 September 9, 2013 November 19, 2015
Maturity March 20, 2017 July 16, 2018 September 9, 2020 February 19, 2019
Interest payment Annual
March 20
Semi annual
January 16/July 16
Annual
September 9
Annual
February 19, commencing
on February 20, 2017
WKN A1VC6B A1X24V A1X3B7 A1Z7C3
ISIN XS0972719412 XS0953199634 XS0969344083 DE000A1Z7C39
Denomination €1,000 with min. tradable
amount €1,000
€1,000 with min. tradable
amount €1,000
€1,000 with min. tradable
amount €1,000
€1,000 with min. tradable
amount €1,000
1 Guaranteed by Continental AG
2 Non-contracted rating at date of issuance
3 Fitch since July 15, 2013; S&P since May 11, 2016; Moodyʼs since June 30, 2015
4 Non-contracted rating since February 1, 2014

H1 2016 Results – August 3, 2016
EDMR – Equity and Debt Markets Relations
Back-up
28

H1 2016 Results – August 3, 2016
EDMR – Equity and Debt Markets Relations 29
6) Back-up Corporation Highlights H1 2016
› Sales
› EBITDA
› EBIT
› NIAT3
› EPS3
› Capex
› R&D
› Cash flow
› Net debt
Increase of 2.3% to €20,041.7 mn (PY: €19,598.6 mn); organic sales up 4.1%
Increase of 6.0% to €3,218.6 mn (PY: €3,036.5 mn)
Increase of 6.0% to €2,290.3 mn (PY: €2,161.2 mn);
Adj. EBIT1 increase to €2,398.0 mn (12.1% adj. EBIT1 margin);
PPA2 effect -€68.9 mn; total special effects -€22.6 mn
Increase of 13.1% to €1,638.8 mn (PY: €1,448.6 mn)
EPS of €8.19 (PY: €7.24)
EPS before PPA2 €8.44 (PY: €7.48 before PPA2)
Capex increased to €919.9 mn (PY: €815.8 mn); capex ratio 4.6% of sales; capex
to depreciation coverage 1.0x (1.1x ex PPA2)
Expenses for research and development increased by 13.2% to €1,442.9 mn
(PY: €1,274.3 mn); R&D ratio 7.2% of sales (PY: 6.5%)
Operating cash flow up by €268.1 mn to €1,981.9 mn; free cash flow €959.0 mn
Net indebtedness down by €95.7 mn to €3,446.2 mn vs. FY 2015;
Liquidity and undrawn credit lines amounted to €5,265.5 mn
1 Before amortization of intangibles from PPA, consolidation and special effects
2 Amortization of intangibles from PPA, tax rate of 28% applied for EPS calculation
3 Attributable to the shareholders of the parent

H1 2016 Results – August 3, 2016
EDMR – Equity and Debt Markets Relations 30
6) Back-up Overview of Volume Development
Units (YOY change) Q1/14 H1/14 9M/14 FY 14 Q1/15 H1/15 9M/15 FY 15 Q1/16 H1/16
Market data for PC and LT production
EU 9% 6% 4% 3% 4% 3% 4% 4% 2% 4%
NAFTA 5% 4% 5% 5% 1% 2% 3% 3% 4% 3%
EU and NAFTA combined 7% 5% 5% 4% 3% 3% 3% 3% 3% 4%
Worldwide 5% 4% 4% 3% 2% 1% 1% 1% 2% 2%
Continental
Electronic stability control (ESC) 14% 12% 11% 12% 16% 14% 11% 11% 2% 5%
Anti-lock brake system (ABS) -13% -11% -16% -19% -34% -31% -30% -24% -11% -5%
Boosters 8% 10% 6% 5% -1% -4% -8% -7% -3% -3%
Calipers 7% 2% 1% 0% -1% 0% -3% -2% -8% -9%
Advanced driver assistance systems (ADAS) 53% 50% 47% 47% 46% 53% 59% 58% 51% 45%
Engine electronic control units (ECUs) 7% 6% 6% 4% -1% -3% -5% -5% -2% 3%
Injectors -3% -3% -5% -5% -8% -8% -11% -11% -5% -5%
Transmissions 8% 8% 6% 6% 6% 2% 0% -1% -1% -1%
Turbochargers 64% 68% 71% 78% 59% 45% 50% 43% 23% 24%
Market data tires
PC and LT replacement tires Europe 6% 5% 4% 2% -1% 2% 0% 0% 2% 2%
PC and LT replacement tires NAFTA 7% 6% 5% 6% -6% 0% 1% 1% 5% 2%
Commercial vehicle tires OE Europe 1% -7% -4% -7% 0% 4% 5% 5% 6% 6%
Commercial vehicle tires OE NAFTA 6% 10% 12% 12% 21% 17% 12% 7% -12% -12%
Commercial vehicle replacement tires Europe 15% 6% 3% 1% -4% 2% -1% 0% 2% 5%
Commercial vehicle replacement tires NAFTA 9% 9% 9% 8% 3% 5% 3% 3% 4% 2%
Continental
PC and LT tires 9% 6% 5% 3% -1% 3% 2% 5% 9% 8%
Commercial vehicle tires 13% 8% 5% 3% -3% 0% 3% 5% 7% 8%
ContiTech organic sales growth 5% 2% 2% 1% 2% 4% 4% 4% 3% 2%

H1 2016 Results – August 3, 2016
EDMR – Equity and Debt Markets Relations 31
6) Back-up Key Historical Credit Metrics – IAS 19 (rev. 2011) applied6
1 Amounts shown may contain rounding differences 2 Adjusted EBITDA starting 2011 as defined in syndicated loan but IAS 19 (rev. 2011) not applied in 2012 3 Includes changes in inventories, trade accounts receivable, trade accounts payable and discounted notes 4 Includes dividends received, income from at-equity accounted and other investments, incl. impairment and reversal of impairment losses, gains / losses from the disposal of assets,
companies and business operations, other non-cash items as well as changes in employee benefits and other provisions and in other assets and liabilities 5 Adjusted EBITDA to net cash interest paid 6 Since 2012
(mn €)1
2011 2012 2013 2014 2015 LTM 2016
Statement of Cash Flows
Adjusted EBITDA2
4,247 4,822 5,094 5,318 6,094 6,269
Reported EBITDA 4,228 4,967 5,095 5,134 6,001 6,184
Net cash interest paid -662 -575 -534 -158 -174 -150
Tax paid -466 -684 -805 -775 -1,015 -991
Change in net working capital3
-556 564 -4 -207 -107 8
Other4
-256 -488 -30 175 210 133
Cash flow arising from operating activities 2,289 3,785 3,722 4,168 4,916 5,184
Cash flow arising from investing activities -1,798 -2,132 -1,904 -2,153 -3,472 -3,063
- thereof capex in PPE and intangibles -1,813 -2,081 -2,024 -2,110 -2,265 -2,375
Cash flow before financing activities 491 1,653 1,818 2,015 1,444 2,121
Statement of Financial Position
Cash and cash equivalents 1,541 2,397 2,045 3,244 1,622 1,720
Derivative instruments and interest-bearing investments 249 536 303 364 81 64
Total indebtedness 8,562 8,253 6,638 6,432 5,245 5,230
Net indebtedness 6,772 5,320 4,289 2,824 3,542 3,446
Credit Ratios
Net indebtedness / adjusted EBITDA2
1.6x 1.1x 0.8x 0.5x 0.6x 0.5x
Net cash interest paid coverage (ratio)5
6.4x 8.4x 9.5x 33.7x 35.1x 41.8x

H1 2016 Results – August 3, 2016
EDMR – Equity and Debt Markets Relations
794816
920
694
808859
102 67 69
2014 2015 2016
Capex (PPE), percentage of sales
Depreciation, w/o PPA
PPA
4.7%
4.2%4.6%
8.19 0.25 8.44
Reported EPS PPA after tax
per share
EPS ex
PPA
32
6) Back-up Capex, Depreciation and EPS Breakdown H1 2016
Capex, Depreciation and PPA1 (mn €) EPS ex PPA1,2 (€)
1 Amortization of intangibles from PPA
2 Assuming corporate tax rate of 28%
1
1
1
1,2
2

H1 2016 Results – August 3, 2016
EDMR – Equity and Debt Markets Relations
3,746.7
4,278.14,448.0
13.2% 13.8% 13.8%
9.9% 9.9%
2014 2015 2016
Sales (mn €) EBITDA margin Adj. EBIT margin› Sales increased by 5.7% before
consolidation and FX effects
› EBITDA increased by €24.1 mn to
€614.8 mn (+4.1%)
› Adj. EBIT1 increased by €14.6 mn to
€439.2 mn (adj. EBIT1 margin 9.9%)
› EBIT increased by €9.3 mn to
€433.5 mn (EBIT margin 9.7%)
› PPA effect in H1 2016: -€0.2 mn
› No special effects in H1 2016
33
6) Back-up Automotive Group Financials – Chassis & Safety
1 Before amortization of intangibles from PPA, consolidation and special effects. Refer to Fact Sheets for further details
Chassis & Safety H1 2016 1

H1 2016 Results – August 3, 2016
EDMR – Equity and Debt Markets Relations
3,177.5
3,646.3 3,655.0
8.9%9.9% 9.9%
5.5% 5.2%
2014 2015 2016
Sales (mn €) EBITDA margin Adj. EBIT margin
34
6) Back-up Automotive Group Financials – Powertrain
Powertrain H1 2016
1
1 Before amortization of intangibles from PPA, consolidation and special effects. Refer to Fact Sheets for further details
› Sales increased by 2.2% before
consolidation and FX effects
› EBITDA decreased by €0.1 mn to
€360.6 mn (unchanged)
› Adj. EBIT1 decreased by €12.7 mn to
€189.1 mn (adj. EBIT1 margin 5.2%)
› EBIT decreased by €22.4 mn to
€175.3 mn (EBIT margin 4.8%)
› PPA effect in H1 2016: -€5.5 mn
› Special effects in H1 2016: -€6.0 mn

H1 2016 Results – August 3, 2016
EDMR – Equity and Debt Markets Relations
3,433.0
4,032.2 4,122.8
13.6% 13.7%11.9%
10.6%8.8%
2014 2015 2016
Sales (mn €) EBITDA margin Adj. EBIT margin
› Sales increased by 3.4% before
consolidation and FX effects
› EBITDA decreased by €63.1 mn to
€489.6 mn (-11.4%)
› Adj. EBIT1 decreased by €70.3 mn to
€355.5 mn (adj. EBIT1 margin 8.8%)
› EBIT decreased by €92.0 mn to
€333.0 mn (EBIT margin 8.1%)
› PPA effect in H1 2016: -€18.0 mn
› Special effects in H1 2016: -€0.1 mn
35
6) Back-up Automotive Group Financials – Interior
Interior H1 2016
1
1 Before amortization of intangibles from PPA, consolidation and special effects. Refer to Fact Sheets for further details

H1 2016 Results – August 3, 2016
EDMR – Equity and Debt Markets Relations
4,724.2 5,064.2
5,205.4
24.1%26.0%
27.5%
21.0%22.8%
2014 2015 2016
Sales (mn €) EBITDA margin Adj. EBIT margin
› Sales increased by 6.2% before
consolidation and FX effects
› EBITDA increased by €117.2 mn to
€1,431.5 mn (+8.9%)
› Adj. EBIT1 increased by €118.1 mn to
1,180.4 mn (adj. EBIT1 margin 22.8%)
› EBIT increased by €117.3 mn to
€1,175.4 mn (EBIT margin 22.6%)
› PPA effect in H1 2016: -€3.8 mn
› No special effects in H1 2016
36
6) Back-up Rubber Group Financials – Tires
Tires H1 2016
1
1 Before amortization of intangibles from PPA, consolidation and special effects. Refer to Fact Sheets for further details

H1 2016 Results – August 3, 2016
EDMR – Equity and Debt Markets Relations
-25%
-20%
-15%
-10%
-5%
0%
5%
10%
15%
20%
Jan-1
1
May-1
1
Sep-1
1
Jan-1
2
May-1
2
Sep-1
2
Jan-1
3
May-1
3
Sep-1
3
Jan-1
4
May-1
4
Sep-1
4
Jan-1
5
May-1
5
Sep-1
5
Jan-1
6
May-1
6
PC & LT Tire Replacement (YOY chg. monthly)
Vehicle miles YOY chg. monthly (DOT)
37
6) Back-up Tires – Passenger and Light Truck Tire Demand
Replacement Tire Demand
for PC & LT Europe
Replacement Tire Demand
for PC & LT NAFTA
1 U.S. Department of Transportation
1
-25%
-20%
-15%
-10%
-5%
0%
5%
10%
15%
20%
Jan-1
1
May-1
1
Sep-1
1
Jan-1
2
May-1
2
Sep-1
2
Jan-1
3
May-1
3
Sep-1
3
Jan-1
4
May-1
4
Sep-1
4
Jan-1
5
May-1
5
Sep-1
5
Jan-1
6
May-1
6
PC & LT Tire Replacement (YOY chg. monthly)

H1 2016 Results – August 3, 2016
EDMR – Equity and Debt Markets Relations
-30%
-20%
-10%
0%
10%
20%
30%
Jan-1
1
May-1
1
Sep-1
1
Jan-1
2
May-1
2
Sep-1
2
Jan-1
3
May-1
3
Sep-1
3
Jan-1
4
May-1
4
Sep-1
4
Jan-1
5
May-1
5
Sep-1
5
Jan-1
6
May-1
6
Truck tire replacement (YOY chg. monthly)
km BAG monthly (adj.)
-30%
-20%
-10%
0%
10%
20%
30%
Jan-1
1
May-1
1
Sep-1
1
Jan-1
2
May-1
2
Sep-1
2
Jan-1
3
May-1
3
Sep-1
3
Jan-1
4
May-1
4
Sep-1
4
Jan-1
5
May-1
5
Sep-1
5
Jan-1
6
May-1
6
Truck tire replacement (YOY chg. monthly)
ATA monthly (adj.)
38
6) Back-up Tires – Commercial Vehicle Tire Demand
1 BAG = Bundesamt für Güterverkehr
2 ATA = American Trucking Association (miles traveled)
Replacement Tire Demand
for Truck Tires Europe
Replacement Tire Demand
for Truck Tires NAFTA
2 1

H1 2016 Results – August 3, 2016
EDMR – Equity and Debt Markets Relations
1,952.0
2,687.1 2,735.7
14.2%
11.1%
13.6%
7.8%
10.8%
2014 2015 2016
Sales (mn €) EBITDA margin Adj. EBIT margin
› Sales increased by 1.8% before
consolidation and FX effects
› EBITDA increased by €75.0 mn to
€373.3 mn (+25.1%)
› Adj. EBIT1 increased by €76.8 mn to
€286.1 mn (adj. EBIT1 margin 10.8%)
› EBIT increased by €88.2 mn to
€225.4 mn (EBIT margin 8.2%)
› PPA effect in H1 2016: -€41.4 mn
› Special effects in H1 2016: -€16.5 mn
39
6) Back-up Rubber Group Financials – ContiTech
ContiTech H1 2016
1
1 Before amortization of intangibles from PPA, consolidation and special effects. Refer to Fact Sheets for further details

H1 2016 Results – August 3, 2016
EDMR – Equity and Debt Markets Relations 40
Fact Sheets 2014 – Q2 2016
H1 2016 Results – August 3, 2016
EDMR – Equity and Debt Markets Relations 41
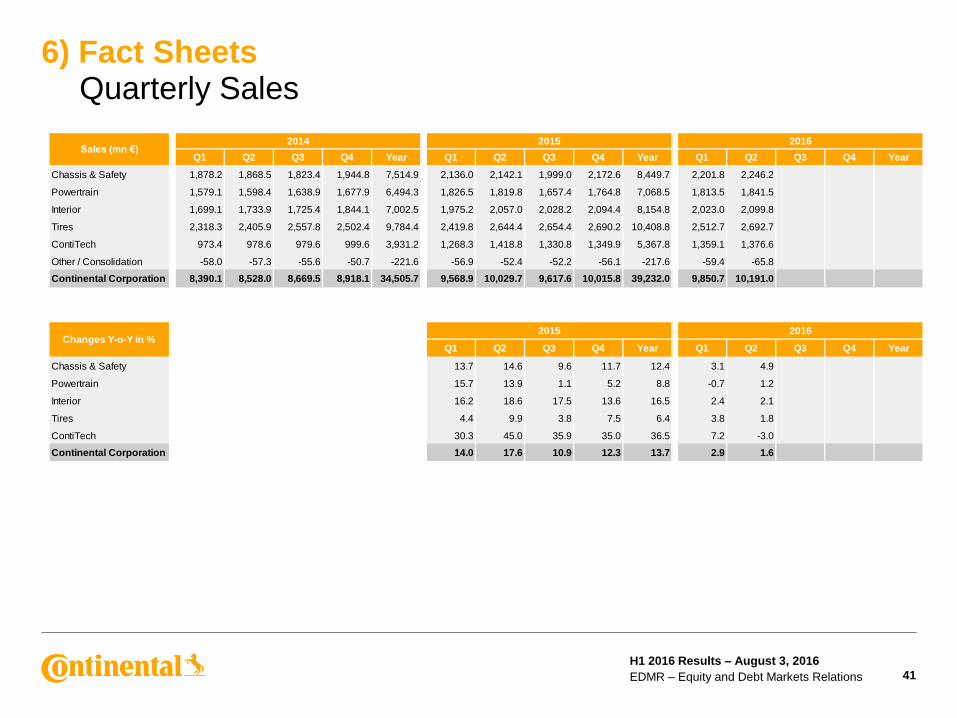
6) Fact Sheets Quarterly Sales
Q1 Q2 Q3 Q4 Year Q1 Q2 Q3 Q4 Year Q1 Q2 Q3 Q4 Year
Chassis & Safety 1,878.2 1,868.5 1,823.4 1,944.8 7,514.9 2,136.0 2,142.1 1,999.0 2,172.6 8,449.7 2,201.8 2,246.2
Powertrain 1,579.1 1,598.4 1,638.9 1,677.9 6,494.3 1,826.5 1,819.8 1,657.4 1,764.8 7,068.5 1,813.5 1,841.5
Interior 1,699.1 1,733.9 1,725.4 1,844.1 7,002.5 1,975.2 2,057.0 2,028.2 2,094.4 8,154.8 2,023.0 2,099.8
Tires 2,318.3 2,405.9 2,557.8 2,502.4 9,784.4 2,419.8 2,644.4 2,654.4 2,690.2 10,408.8 2,512.7 2,692.7
ContiTech 973.4 978.6 979.6 999.6 3,931.2 1,268.3 1,418.8 1,330.8 1,349.9 5,367.8 1,359.1 1,376.6
Other / Consolidation -58.0 -57.3 -55.6 -50.7 -221.6 -56.9 -52.4 -52.2 -56.1 -217.6 -59.4 -65.8
Continental Corporation 8,390.1 8,528.0 8,669.5 8,918.1 34,505.7 9,568.9 10,029.7 9,617.6 10,015.8 39,232.0 9,850.7 10,191.0
Q1 Q2 Q3 Q4 Year Q1 Q2 Q3 Q4 Year
Chassis & Safety 13.7 14.6 9.6 11.7 12.4 3.1 4.9
Powertrain 15.7 13.9 1.1 5.2 8.8 -0.7 1.2
Interior 16.2 18.6 17.5 13.6 16.5 2.4 2.1
Tires 4.4 9.9 3.8 7.5 6.4 3.8 1.8
ContiTech 30.3 45.0 35.9 35.0 36.5 7.2 -3.0
Continental Corporation 14.0 17.6 10.9 12.3 13.7 2.9 1.6
Changes Y-o-Y in %2015 2016
Sales (mn €)2014 2015 2016

H1 2016 Results – August 3, 2016
EDMR – Equity and Debt Markets Relations 42
6) Fact Sheets Quarterly EBITDA
Q1 Q2 Q3 Q4 Year Q1 Q2 Q3 Q4 Year Q1 Q2 Q3 Q4 Year
Chassis & Safety 254.0 242.0 262.0 260.1 1,018.1 297.3 293.4 268.3 301.3 1,160.3 302.8 312.0
Powertrain 157.0 125.3 -11.9 172.9 443.3 177.2 183.5 167.3 202.7 730.7 158.8 201.8
Interior 223.2 244.5 229.7 248.9 946.3 252.9 299.8 252.4 277.1 1,082.2 237.4 252.2
Tires 545.4 591.9 603.5 540.0 2,280.8 579.7 734.6 667.7 622.3 2,604.3 658.1 773.4
ContiTech 143.7 132.9 144.7 130.5 551.8 129.2 169.1 159.7 119.2 577.2 176.1 197.2
Other / Consolidation -27.5 -26.6 -24.7 -27.7 -106.5 -33.1 -47.1 -23.7 -49.4 -153.3 -27.7 -23.5
Continental Corporation 1,295.8 1,310.0 1,203.3 1,324.7 5,133.8 1,403.2 1,633.3 1,491.7 1,473.2 6,001.4 1,505.5 1,713.1
Q1 Q2 Q3 Q4 Year Q1 Q2 Q3 Q4 Year Q1 Q2 Q3 Q4 Year
Chassis & Safety 13.5 13.0 14.4 13.4 13.5 13.9 13.7 13.4 13.9 13.7 13.8 13.9
Powertrain 9.9 7.8 -0.7 10.3 6.8 9.7 10.1 10.1 11.5 10.3 8.8 11.0
Interior 13.1 14.1 13.3 13.5 13.5 12.8 14.6 12.4 13.2 13.3 11.7 12.0
Tires 23.5 24.6 23.6 21.6 23.3 24.0 27.8 25.2 23.1 25.0 26.2 28.7
ContiTech 14.8 13.6 14.8 13.1 14.0 10.2 11.9 12.0 8.8 10.8 13.0 14.3
Continental Corporation 15.4 15.4 13.9 14.9 14.9 14.7 16.3 15.5 14.7 15.3 15.3 16.8
Q1 Q2 Q3 Q4 Year Q1 Q2 Q3 Q4 Year
Chassis & Safety 17.0 21.2 2.4 15.8 14.0 1.8 6.3
Powertrain 12.9 46.4 1,505.9 17.2 64.8 -10.4 10.0
Interior 13.3 22.6 9.9 11.3 14.4 -6.1 -15.9
Tires 6.3 24.1 10.6 15.2 14.2 13.5 5.3
ContiTech -10.1 27.2 10.4 -8.7 4.6 36.3 16.6
Continental Corporation 8.3 24.7 24.0 11.2 16.9 7.3 4.9
EBITDA margin in %2014 2015 2016
Changes Y-o-Y in %2015 2016
EBITDA (mn €)2014 2015 2016

H1 2016 Results – August 3, 2016
EDMR – Equity and Debt Markets Relations 43
6) Fact Sheets Quarterly EBIT
Q1 Q2 Q3 Q4 Year Q1 Q2 Q3 Q4 Year Q1 Q2 Q3 Q4 Year
Chassis & Safety 172.3 159.3 179.5 169.1 680.2 214.9 209.3 181.5 208.6 814.3 213.2 220.3
Powertrain 64.5 32.9 -263.3 69.1 -96.8 96.7 101.0 81.3 116.6 395.6 66.5 108.8
Interior 137.8 154.7 144.8 168.6 605.9 190.9 234.1 178.7 200.8 804.5 160.1 172.9
Tires 440.7 482.4 486.8 419.5 1,829.4 454.0 604.1 536.5 490.6 2,085.2 530.0 645.4
ContiTech 115.5 104.3 115.1 98.4 433.3 54.9 82.3 80.6 -47.2 170.6 98.7 126.7
Other / Consolidation -27.6 -26.7 -25.1 -27.8 -107.2 -33.5 -47.5 -24.0 -49.6 -154.6 -27.8 -24.5
Continental Corporation 903.2 906.9 637.8 896.9 3,344.8 977.9 1,183.3 1,034.6 919.8 4,115.6 1,040.7 1,249.6
Q1 Q2 Q3 Q4 Year Q1 Q2 Q3 Q4 Year Q1 Q2 Q3 Q4 Year
Chassis & Safety 9.2 8.5 9.8 8.7 9.1 10.1 9.8 9.1 9.6 9.6 9.7 9.8
Powertrain 4.1 2.1 -16.1 4.1 -1.5 5.3 5.6 4.9 6.6 5.6 3.7 5.9
Interior 8.1 8.9 8.4 9.1 8.7 9.7 11.4 8.8 9.6 9.9 7.9 8.2
Tires 19.0 20.1 19.0 16.8 18.7 18.8 22.8 20.2 18.2 20.0 21.1 24.0
ContiTech 11.9 10.7 11.7 9.8 11.0 4.3 5.8 6.1 -3.5 3.2 7.3 9.2
Continental Corporation 10.8 10.6 7.4 10.1 9.7 10.2 11.8 10.8 9.2 10.5 10.6 12.3
Q1 Q2 Q3 Q4 Year Q1 Q2 Q3 Q4 Year
Chassis & Safety 24.7 31.4 1.1 23.4 19.7 -0.8 5.3
Powertrain 49.9 207.0 130.9 68.7 508.7 -31.2 7.7
Interior 38.5 51.3 23.4 19.1 32.8 -16.1 -26.1
Tires 3.0 25.2 10.2 16.9 14.0 16.7 6.8
ContiTech -52.5 -21.1 -30.0 -148.0 -60.6 79.8 53.9
Continental Corporation 8.3 30.5 62.2 2.6 23.0 6.4 5.6
EBIT margin in %2014 2015 2016
Changes Y-o-Y in %2015 2016
EBIT (mn €)2014 2015 2016

H1 2016 Results – August 3, 2016
EDMR – Equity and Debt Markets Relations 44
6) Fact Sheets Quarterly Adjusted EBIT1
1 Before amortization of intangibles from PPA, consolidation and special effects
Q1 Q2 Q3 Q4 Year Q1 Q2 Q3 Q4 Year
Chassis & Safety 215.2 209.4 215.7 223.5
Powertrain 98.8 103.0 72.6 116.5
Interior 191.3 234.5 168.0 187.5
Tires 455.6 606.7 533.0 647.4
ContiTech 82.8 126.5 133.5 152.6
Other / Consolidation -33.5 -47.5 -27.8 -24.5
Continental Corporation 1,010.2 1,232.6 1,095.0 1,303.0
Q1 Q2 Q3 Q4 Year Q1 Q2 Q3 Q4 Year
Chassis & Safety 10.1 9.8 9.8 10.0
Powertrain 5.4 5.7 4.0 6.4
Interior 9.7 11.4 8.5 9.1
Tires 18.8 22.9 21.3 24.1
ContiTech 6.5 8.9 10.5 11.1
Continental Corporation 10.6 12.3 11.3 12.9
Q1 Q2 Q3 Q4 Year
Chassis & Safety 0.2 6.7
Powertrain -26.5 13.1
Interior -12.2 -20.0
Tires 17.0 6.7
ContiTech 61.2 20.6
Continental Corporation 8.4 5.7
Adj. EBIT 1 margin in %
2015 2016
Changes Y-o-Y in %2016
Adj. EBIT 1 (mn €)
2015 2016

H1 2016 Results – August 3, 2016
EDMR – Equity and Debt Markets Relations 45
6) Fact Sheets Consolidated Statement of Income
2016 2015 2014 2016 2015 2014
1 - 6 1 - 6 1 - 6 Q2 Q2 Q2
Sales 20,041.7 19,598.6 16,918.1 10,191.0 10,029.7 8,528.0
Cost of sales -14,609.2 -14,501.2 -12,694.9 -7,359.6 -7,355.1 -6,400.5
Gross margin on sales 5,432.5 5,097.4 4,223.2 2,831.4 2,674.6 2,127.5
Research and development expenses -1,442.9 -1,274.3 -1,073.8 -726.8 -631.3 -529.7
Selling and logistics expenses -1,109.2 -1,074.7 -873.4 -561.2 -553.8 -442.5
Administrative expenses -498.1 -459.3 -381.2 -254.4 -244.8 -202.3
Other expenses and income -128.9 -156.1 -67.3 -59.9 -78.4 -20.3
Income from at-equity accounted investees 36.6 27.8 -17.7 20.2 16.6 -26.1
Other income from investments 0.3 0.4 0.3 0.3 0.4 0.3
Earnings before interest and tax 2,290.3 2,161.2 1,810.1 1,249.6 1,183.3 906.9
Interest income 49.6 49.3 46.3 24.8 21.5 19.7
Interest expense -98.2 -148.3 -186.8 -39.6 -64.8 -80.2
Net interest result -48.6 -99.0 -140.5 -14.8 -43.3 -60.5
Earnings before tax 2,241.7 2,062.2 1,669.6 1,234.8 1,140.0 846.4
Income tax expense -567.1 -571.2 -323.9 -311.3 -326.8 -108.3
Net income 1,674.6 1,491.0 1,345.7 923.5 813.2 738.1
Non-controlling interests -35.8 -42.4 -41.9 -18.6 -21.3 -22.6
Net income attributable to the shareholders of the parent 1,638.8 1,448.6 1,303.8 904.9 791.9 715.5
Basic earnings per share (in €) 8.19 7.24 6.52 4.52 3.96 3.58
Diluted earnings per share (in €) 8.19 7.24 6.52 4.52 3.96 3.58
Mill. EUR

H1 2016 Results – August 3, 2016
EDMR – Equity and Debt Markets Relations 46
6) Fact Sheets Consolidated Statement of Financial Position – Assets
Starting from the year under review, 2016, the structure of the equity and liabilities
side is presented in an adjusted form to increase transparency with regards to
employee benefits. All of the following figures from comparative periods are
accordingly adjusted.
in € millions June 30, 2016 Dec. 31, 2015 June 30, 2015
Goodwill 6,621.9 6,640.6 6,168.3
Other intangible assets 1,280.3 1,336.4 1,140.8
Property, plant and equipment 9,596.7 9,538.9 9,222.2
Investment property 15.6 16.0 17.4
Investments in at-equity accounted investees 371.8 345.8 312.0
Other investments 39.7 14.1 12.9
Deferred tax assets 1,952.6 1,669.7 1,640.1
Defined benefit assets 36.0 18.9 3.0
Long-term derivative instruments and interest-bearing investments 21.1 17.1 312.6
Long-term other financial assets 49.8 47.6 35.4
Long-term other assets 23.3 21.5 20.5
Non-current assets 20,008.8 19,666.6 18,885.2
Inventories 3,804.9 3,360.1 3,605.5
Trade accounts receivable 7,264.5 6,722.9 7,084.3
Short-term other financial assets 504.9 434.7 464.5
Short-term other assets 921.2 803.9 930.1
Income tax receivables 153.2 149.7 128.4
Short-term derivative instruments and interest-bearing investments 42.8 64.3 106.3
Cash and cash equivalents 1,720.1 1,621.5 2,349.7
Assets held for sale 9.5 12.0 51.3
Current assets 14,421.1 13,169.1 14,720.1
Total assets 34,429.9 32,835.7 33,605.3
H1 2016 Results – August 3, 2016
EDMR – Equity and Debt Markets Relations 47
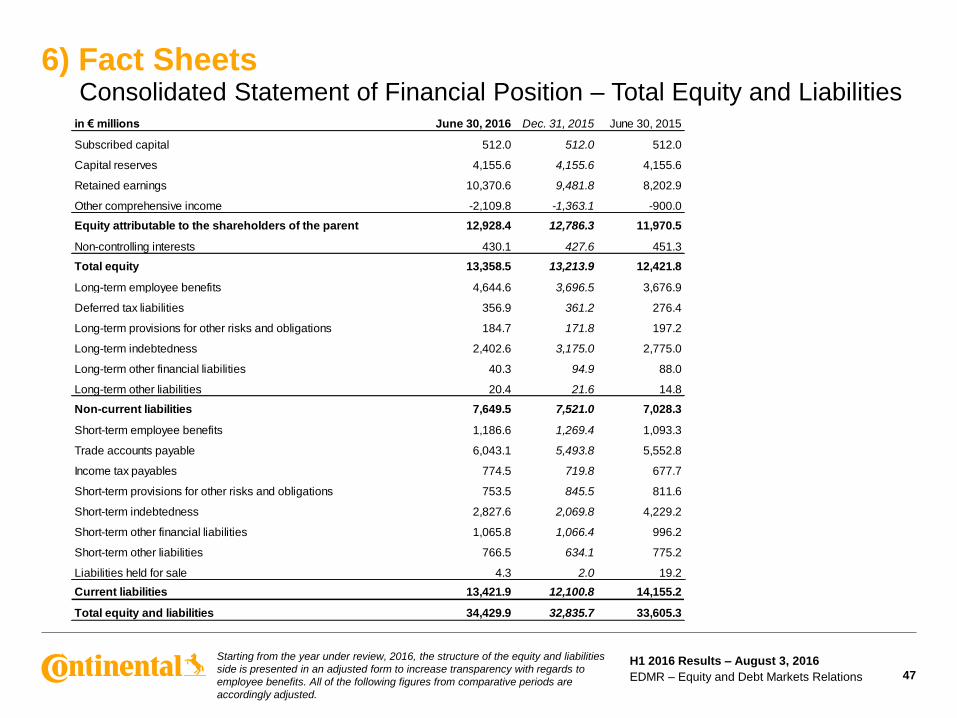
6) Fact Sheets Consolidated Statement of Financial Position – Total Equity and Liabilities
Starting from the year under review, 2016, the structure of the equity and liabilities
side is presented in an adjusted form to increase transparency with regards to
employee benefits. All of the following figures from comparative periods are
accordingly adjusted.
in € millions June 30, 2016 Dec. 31, 2015 June 30, 2015
Subscribed capital 512.0 512.0 512.0
Capital reserves 4,155.6 4,155.6 4,155.6
Retained earnings 10,370.6 9,481.8 8,202.9
Other comprehensive income -2,109.8 -1,363.1 -900.0
Equity attributable to the shareholders of the parent 12,928.4 12,786.3 11,970.5
Non-controlling interests 430.1 427.6 451.3
Total equity 13,358.5 13,213.9 12,421.8
Long-term employee benefits 4,644.6 3,696.5 3,676.9
Deferred tax liabilities 356.9 361.2 276.4
Long-term provisions for other risks and obligations 184.7 171.8 197.2
Long-term indebtedness 2,402.6 3,175.0 2,775.0
Long-term other financial liabilities 40.3 94.9 88.0
Long-term other liabilities 20.4 21.6 14.8
Non-current liabilities 7,649.5 7,521.0 7,028.3
Short-term employee benefits 1,186.6 1,269.4 1,093.3
Trade accounts payable 6,043.1 5,493.8 5,552.8
Income tax payables 774.5 719.8 677.7
Short-term provisions for other risks and obligations 753.5 845.5 811.6
Short-term indebtedness 2,827.6 2,069.8 4,229.2
Short-term other financial liabilities 1,065.8 1,066.4 996.2
Short-term other liabilities 766.5 634.1 775.2
Liabilities held for sale 4.3 2.0 19.2
Current liabilities 13,421.9 12,100.8 14,155.2
Total equity and liabilities 34,429.9 32,835.7 33,605.3

H1 2016 Results – August 3, 2016
EDMR – Equity and Debt Markets Relations
in € millions 2016 2015
Net income 1,674.6 1,491.0
Income tax expense 567.1 571.2
Net interest result 48.6 99.0
EBIT 2,290.3 2,161.2
Interest paid -63.1 -90.6
Interest received 12.1 16.1
Income tax paid -544.0 -568.4
Dividends received 18.6 27.8
Depreciation, amortization, impairment and reversal of impairment losses 928.3 875.3
Income from at-equity accounted and other investments, incl. impairment and reversal of impairment losses -36.9 -28.2
Gains/losses from the disposal of assets, companies and business operations -3.4 -12.1
Changes in
inventories -457.5 -263.0
trade accounts receivable -621.6 -713.8
trade accounts payable 611.3 394.0
employee benefits and other provisions -84.3 15.7
other assets and liabilities -67.9 -100.2
Cash flow arising from operating activities 1,981.9 1,713.8
Cash flow from the disposal of property, plant and equipment, and intangible assets 13.6 19.9
Capital expenditure on property, plant and equipment, and software -919.9 -815.8
Capital expenditure on intangible assets from development projects and miscellaneous -39.9 -34.0
Cash flow from the disposal of companies and business operations 5.1 -1.7
Acquisition of companies and business operations -81.8 -600.2
Cash flow arising from investing activities -1,022.9 -1,431.8
Cash flow before financing activities (free cash flow) 959.0 282.0
Change in indebtedness -22.9 -582.6
Successive purchases -22.4 -11.1
Dividends paid -750.0 -650.0
Dividends paid to and cash changes from equity transactions with non-controlling interests -26.7 -40.9
Cash and cash equivalents arising from first consolidationof subsidiaries 0.6 —
Cash flow arising from financing activities -821.4 -1,284.6
Change in cash and cash equivalents 137.6 -1,002.6
Cash and cash equivalents at the beginning of the reporting period 1,621.5 3,243.8
Effect of exchange rate changes on cash and cash equivalents -39.0 108.5
Cash and cash equivalents at the end of the reporting period 1,720.1 2,349.7
January 1 to June 30
48
6) Fact Sheets Consolidated Statement of Cash Flows
1The prior-year comparative figures have been adjusted in accordance
with the current structure
1

H1 2016 Results – August 3, 2016
EDMR – Equity and Debt Markets Relations 49
6) Fact Sheets H1 2016 Results Reported and Adjusted (mn €) – by Division
1 Before amortization of intangibles from PPA, changes in the scope of consolidation and special effects
1 Before amortization of intangibles from PPA, consolidation and special effects
2015 2016 2015 2016 2015 2016 2015 2016 2015 2016 2015 2016 2015 2016
Sales 4,278.1 4,448.0 3,646.3 3,655.0 4,032.2 4,122.8 5,064.2 5,205.4 2,687.1 2,735.7 -109.3 -125.2 19,598.6 20,041.7
2015 2016 2015 2016 2015 2016 2015 2016 2015 2016 2015 2016 2015 2016
EBIT 424.2 433.5 197.7 175.3 425.0 333.0 1,058.1 1,175.4 137.2 225.4 -81.0 -52.3 2,161.2 2,290.3in % of sales 9.9% 9.7% 5.4% 4.8% 10.5% 8.1% 20.9% 22.6% 5.1% 8.2% 11.0% 11.4%
Amortization of intangible assets from PPA 0.4 0.2 4.1 5.5 0.8 18.0 3.9 3.8 57.9 41.4 0.0 0.0 67.1 68.9
Total special effects 0.0 0.0 0.0 6.0 0.0 0.1 0.3 0.0 14.2 16.5 0.0 0.0 14.5 22.6
Total consolidation effects 0.0 5.5 0.0 2.3 0.0 4.4 0.0 1.2 0.0 2.8 0.0 0.0 0.0 16.2
Total consolidation & special effects 0.0 5.5 0.0 8.3 0.0 4.5 0.3 1.2 14.2 19.3 0.0 0.0 14.5 38.8
Adjusted operating result (adj. EBIT) 1
424.6 439.2 201.8 189.1 425.8 355.5 1,062.3 1,180.4 209.3 286.1 -81.0 -52.3 2,242.8 2,398.0in % of adjusted sales 9.9% 9.9% 5.5% 5.2% 10.6% 8.8% 21.0% 22.8% 7.8% 10.8% 11.4% 12.1%
Corporation
Chassis & Safety Powertrain Tires ContiTech Cons./Corr. Group
Interior
Interior
Chassis & Safety Powertrain Tires ContiTech Cons./Corr.

H1 2016 Results – August 3, 2016
EDMR – Equity and Debt Markets Relations 50
6) Fact Sheets H1 2016 Results Reported and Adjusted (mn €) – by Group
1 Before amortization of intangibles from PPA, consolidation and special effects
2015 2016 2015 2016 2015 2016 2015 2016
Sales 11,908.3 12,168.5 7,714.7 7,896.3 -24.4 -23.1 19,598.6 20,041.7
2015 2016 2015 2016 2015 2016 2015 2016
EBIT 1,046.9 941.8 1,195.3 1,400.8 -81.0 -52.3 2,161.2 2,290.3
in % of sales 8.8% 7.7% 15.5% 17.7% 11.0% 11.4%
Amortization of intangible assets from PPA 5.3 23.7 61.8 45.2 0.0 0.0 67.1 68.9
Total special effects 0.0 6.1 14.5 16.5 0.0 0.0 14.5 22.6
Total consolidation effects 0.0 12.2 0.0 4.0 0.0 0.0 0.0 16.2
Total consolidation & special effects 0.0 18.3 14.5 20.5 0.0 0.0 14.5 38.8
Adjusted operating result (adj. EBIT) 1 1,052.2 983.8 1,271.6 1,466.5 -81.0 -52.3 2,242.8 2,398.0
in % of adjusted sales 8.8% 8.1% 16.5% 18.8% 11.4% 12.1%
RubberAutomotive Corporation
Automotive Rubber Cons./Corr. Group
Cons./Corr.

H1 2016 Results – August 3, 2016
EDMR – Equity and Debt Markets Relations 51
6) Fact Sheets Shareholder Structure
Source: Based on publicly available data
Shareholder Structure
as at Dec. 31, 2010
Shareholder Structure
as at Dec. 31, 2011
Shareholder Structure
as at Dec. 31, 2012
Shareholder Structure
since Sept. 17, 2013
M.M.Warburg
& CO KGaA
16.48%
M.M.Warburg
& CO KGaA
5.19%
B. Metzler
seel. Sohn Co.
Holding AG
16.48%
B. Metzler
seel. Sohn Co.
Holding AG
5.19%
Schaeffler
Group
42.17%
Schaeffler
Group
49.90%
Schaeffler
Group
49.9%
Schaeffler
Group
46.0%
Free Float
39.72%
Free Float
50.1%
Free Float
54.0%
Free Float
24.87%

H1 2016 Results – August 3, 2016
EDMR – Equity and Debt Markets Relations 52
6) Fact Sheets Continental’s Credit Rating
1 Contracted rating since May 19, 2000 2 Non-contracted rating since February 1, 2014 3 Contracted rating since November 7, 2013
2000 2001 2002 2003 2004 2005 2006 2007 2008 2009 2010 2011 2012 2013 2014 2015 2016
BBB+ / Baa1
BBB / Baa2
BBB- / Baa3
BB+ / Ba1
BB / Ba2
BB- / Ba3
B+ / B1
B / B2
S&P, Fitch / Moody’s Standard & Poor’s1 Moody’s
2 Fitch
3
Before
Siemens
VDO
No
n-I
nv
estm
en
t
Gra
de
Inv
estm
en
t
Gra
de

H1 2016 Results – August 3, 2016
EDMR – Equity and Debt Markets Relations 53
References Useful Links
Continental Investor Relations website http://www.continental-ir.com
Annual and interim reports http://www.continental-
corporation.com/www/portal_com_en/themes/ir/financial_reports/
2015 Fact Book http://www.continental-
corporation.com/www/portal_com_en/themes/ir/financial_reports/
Investor Relations
events and presentations
http://www.continental-corporation.com/www/portal_com_en/themes/ir/events/
Sustainability at Continental
(presentation and fact sheet for
investors)
http://www.continental-ir.com
Corporate Social Responsibility http://www.continental-sustainability.com
Corporate Governance Principles http://www.continental-
corporation.com/www/portal_com_en/themes/ir/corporate_governance/
Continental share http://www.continental-corporation.com/www/portal_com_en/themes/ir/share/
Continental bonds and rating http://www.continental-corporation.com/www/portal_com_en/themes/ir/bonds/
Continental IR mobile website http://continental.ir-portal.de