h urrica ne andrew assessment - wplg · 2017-08-24 · of the hazards analysis is to determine the...
TRANSCRIPT

H URRICA NEANDREWASSESSMENT
Review of Hurricane Evacuation StudiesUtilization and Information Dissemination

HURRICANE ANDREW ASSESSMENT - FLORIDAReview of Hurricane Evacuation Studies Utilization
and Information Dissemination
Prepared for
U.S. Army Corps of EngineersSouth Atlantic Division
andFederal Emergency Management Agency
Region IV
Prepared by
Post, Buckley, Schuh & Jernigan, Inc.134 South Bronough StreetTallahassee, Florida 32301
January 1993

TABLE OF CONTENTS
TitleChapter Page
1
23
45
6
7
List of Tables/List of FiguresIntroductionHazards/Vulnerability DataBehavioral Analysis - Public Response in AndrewShelter IssuesTransportation/Clearance Time DataEvacuation Decision MakingPublic Information
ii1-12-13-14-15-16-17-1
APPENDICES
TitleAppendix
A
B
Meeting Attendees/Persons Providing InputIn Affected AreasNational Hurricane Center's Hurricane AndrewWarning Summary/TimetableHurricane Andrew Response QuestionnaireDirectional Traffic Counts During Hurricane Andrew
CD
i
LIST OF TABLES
TitleTable Page
1
23
4
Public Shelter Data Lower Southeast Florida CountiesPublic Shelter Data Other South Florida CountiesTransportation/Clearance Time Data - Lower SoutheastFlorida CountiesTransportation/Clearance Time Data - Other SouthFlorida CountiesEvacuation Decision Process - Lower SoutheastFlorida CountiesEvacuation Decision Process - Other South FloridaCounties
4-24-3
5-2
5-35
6-26
6-3
LIST OF FIGURES
Figure No. Title Page
1
2Profiles of High Water Marks vs. SLOSH ValuesFEMA/Miami Herald Storm Surge Graphic
2-32-4
ii

Chapter 1
Introduction
On Monday morning, August 24, 1992, Hurricane Andrew tore through the southern
peninsula of Florida. Andrew, the costliest and one of the strongest hurricanes of the
century, left behind these mind-numbing statistics for South Florida (as reported by the
Miami Herald):
* 20 billion dollars in total property damage* 160,000 people left homeless* 86,000 businesses destroyed or damaged* 28,000 homes destroyed
A small but ferocious Cape Verde hurricane, Andrew wrought a path of destruction
through the northwestern Bahamas, the southern tip of the Florida peninsula, and south
central Louisiana. An estimated three-quarter of a million people evacuated dwelling units
in South Florida alone. In Dade County, which took the brunt of the storm, 14 deaths
were directly caused by Andrew. Of these, very few were from drowning - a testament to
successful evacuations carried out by local emergency management officials throughout the
threatened areas.
Prior to Hurricane Andrew, comprehensive hurricane evacuation studies had beencompleted for the lower southeast Florida coast (Monroe, Dade, Broward and Palm Beach
counties). These studies and their associated work products were jointly funded by the
Federal Emergency Management Agency (FEMA), the U.S. Army Corps of Engineers, the
State of Florida Department of Community Affairs, and the National Weather Service.
The Jacksonville District of the Corps of Engineers served as project manager for both the
1983 base study and the 1991 study update for lower southeast Florida.
09-683.00B:\TLTHA\09683-01.RPr 1-

With these studies in hand and a severe storm making landfall, a perfect opportunity was
available to answer several key questions regarding these major FEMA/Corps planning
efforts:
Did local and state officials use the products produced in these major
studies?
Were study data regarding storm hazards, behavioral characteristics of the
threatened population, shelter information, evacuation times, and decision-
making accurate and reliable?
Which study products were most useful and which least useful - what
improvements could be made to current methodologies and products?
To answer these questions a study team comprised of William G. Massey
representing FEMA; Royce Tipton, Joe Gavin and Allan McDuffie representing the Corps
of Engineers; and Mike McDonald of the Florida Department of Community Affairs visited
with local and state officials throughout the directly impacted areas of south Florida.
Donald C. Lewis of Post, Buckley, Schuh & Jernigan, Inc. was retained to accompany the
study team and document all relevant findings. Many local and state officials provided
their observations. Local emergency management directors, law enforcement officers, and
Red Cross personnel were primarily involved in meetings held in each area that responded
to Hurricane Andrew. A separate meeting was held in Miami to discuss study product
usage with local media representatives. Evacuation data were also obtained from several
Southwest Florida and Treasure Coast regional counties to aid future FEMA/Corps of
Engineers regional study efforts. Appendix A lists those individuals who either attended
meetings or provided input through telephone conversations.
Discussion with local emergency management officials focused on study products and
their use relative to the evacuation decision process, evacuation/traffic control andclearance, sheltering, and public information. Discussions with state officials centered on
09-683.00B:\TLTHA\09683-01.RPT 1-2

the role the state played in the evacuation process, including the use (or non-use) of study
products in communicating with local officials. Media representatives in Miami were asked
to focus on study related materials that they possessed and that were broadcast to the
general public. They also addressed the types of materials and public information theycould have used that had not been developed or delivered to them to date.
In addition to the meetings held with state and local officials, Hazards Management
Group conducted and analyzed a residential behavioral sample survey for selected
communities in the directly affected south Florida areas. Telephone interviews were
conducted to compare actual evacuation response in Andrew to predicted evacuation
response developed in the original comprehensive hurricane evacuation study. The
behavioral analysis focused on the actual percent of the affected population that evacuated
during Andrew, when the evacuees left their residence, what sort of refuge evacuees used,
where the refuge was located, and the number of vehicles used by evacuating households.
This report documents the findings of the study team and is organized by general
category of hurricane evacuation study product. Those general categories that are
addressed include:
Hazards/Vulnerability DataBehavioral Characteristics of EvacueesShelter IssuesTransportation/Clearance Time DataEvacuation Decision-MakingPublic Information
Each chapter describes typical study components and products produced incomprehensive hurricane evacuation studies. The chapter then summarizes actual data
related to Andrew and compares it with study produced data for a relevant storm scenario.
Recommendations are then given for future study efforts relative to that study topic.
09-683.00B:\ATLHA\09683-O1.RPT 1-3

M;fq-lrf;p am, RI Twill,
01 044/Post Andrew/ac/93

last I i I � arlilluilfirMlilitT�lim
01044/Post Andrew/ac/93

INT lWWANQ R ililliffird I .Malim
44
i"O'A
I'
p: no1 i0 i
01 044/Post Andrew/ac/93

Chapter 2
Hazards/Vulnerability Data
In FEMA/Corps comprehensive hurricane evacuation studies, the primary objective
of the hazards analysis is to determine the probable worst-case effects for the various
intensities of hurricanes that could strike an area. Specifically, a hazards analysis quantifies
the expected hurricane-caused inundation that would require emergency evacuation of the
population. Historically, the hazards analysis also has assumed that mobile homes outside
the surge inundation area must be evacuated due to their vulnerablity to winds. The
National Weather Services' SLOSH (Sea, Lake, and Overland Surge from Hurricanes)
numerical storm surge prediction model was used as the basis of the hazards analysis for
studies completed in lower southeast Florida.
The vulnerability analysis uses the hazards analysis to identify the population
potentially at risk to coastal flooding caused by the hurricane storm surge. Storm tide
atlases are produced showing the inland extent of surge inundation for various hurricane
intensities.
Hazards and vulnerability issues related to Andrew that were discussed with local
and state officials included the following:
What technical data/mapping was used to choose the areas to evacuate?
Did the technical data provide a good depiction of the hazard area?
Inundation maps and evacuation zone maps developed from the SLOSH model
output were heavily utilized study products during Andrew. Specifically, local emergency
management directors decided whom to evacuate primarily on evacuation zone maps that
were developed from the inundation mapping. In Dade County, each successive level of
evacuation was clearly depicted on color coded public information handouts. Zip codes
were shown on the map to facilitate understanding by the general public. Broward County,
which had recently made major changes to its assumed Saffir-Simpson Category 4-5
09-683.00B:\TLTH-A\09683-GI.RFT 2-1

4-5 evacuation zones (based on the latest SLOSH mapping), used a similar public
information brochure.
Local emergency management directors had great confidence in the SLOSH model
and took its data very seriously. As it did in Bulls Bay S.C. for Hurricane Hugo, the
SLOSH model did an excellent job of predicting and then replicating the maximum surge
height that occurred in Dade County where Andrew made landfall. Figure 1 graphically
portrays a favorable comparison of profiles of observed high water marks versus SLOSH
calculated storm tide heights along the western shore of Biscayne Bay.
While the SLOSH model did well in regards to surge height, the actual extent of
flooding was less than expected and shown in the surge atlases. Figure 2 is a graphic that
the Miami Herald developed (based on FEMA surveys) that shows the extent of surge
flooding. Ironically the areas that were evacuated in Dade County for expected category
4 flooding, were devastated by the winds of Andrew - if the evacuation had not been
carried out in those areas, the loss of life would have been much greater.
Andrew was an unusually small and fast moving hurricane compared to worst case SLOSH
modeled storms upon which the surge atlases were developed. Atlases show a composite
of a number of tracks and foward speeds - Andrew was a single track with its own forward
speed component. While the atlases assumed a Saffir-Simpson category 4 hurricane would
drive water up from the south and around Cutler Ridge, Andrew had a very small eye and
had its radius of maximum winds driving water up against Cutler Ridge. Through the
Andrew experience, the National Hurricane Center learned that in south Dade County the
SLOSH model needs a variable to account for wall fences like the one around the Deering
Estate - apparently such walls and the debris that piles against them slows the advance of
the storm surge.
From a meteorological standpoint, Hurricane Andrew was somewhat unusual - its
rapid intensification and increase in forward speed created some interesting challenges for
D9-683.00B:\TLTHA\09683-01.RPT 2-2

---------------- = = = m - m
,20 I 06o KZ 05
15 -SLOSH /TIDE MODEL
04~
-10 0 i' ~~~APPRO XIMATE 4\\n
05 -EYE RADIUS Of 020LADA MAXIMUM WINDS OBSERVED -,
STORM TIDE - 01
15 10 05 C 05 10 15 20 25 30_ _ _ _ _ _ III00 :SOUTH!ALONG ! .! !NORTH ALONGSHORELINE DISTANCE (STWTE MILES) SHOREUNE
II 4,, E'fSA~tflMqflS6 .4 .A.. . 04 ..............
cJ.
Figure 1
COMPARISON OF PROFILES OF OBSERVED VERSUS SLOSH/NOS MODEL CALCULATEDSTORM TIDE HEIGHTS ALONG WESTERN SHORE OF BISCAYNE BAY FOR HURRICANE
ANDREW AUGUST 24, 1992. HEIGHTS IN FEET ABOVE NGVD- RATIONAL GEODETIC
VERTICAL DATUM - ZERO ELEVATION - I.e. MEAN SEA LEVEL OF 1929).
(NHC-preliminary)

& I, I'
42a
bou.
I J,., g1 ,§. . . i He - .
The ocean's furybIIIySTEPHEN K. DOIGHell Staf Write
-I.I I "ICbmwl6y~xs
-RIft.
i
Hrricane Andrew's storm surge pushedseawater as much as three miles inland inplaces along the South Dade coastline.
according to a recently-completed survey offlooding done for the Federal EmergencyManagement Agency.
The maximum depth of the storm tide, almost 17feet above normal sea level, was found near thedevastated corporate headquarters of Burger King,east of Old Cutler Road around Southwest 177thStreet.
That peak was directly in the path of Andrew'snorth eyewall, the most intense part of the storm.The flooding along there reached almost to SouthDixie Highway.
Elsewhere, the surge mostly stayed to the eastside of Old Cutler Road. But tales abound ofevacuees returning to their demolished homes tofind crabs and fish among the debris in theirswimming pools.
After the storm, Brian Jarvinen, the NationalHurricane Center's expert on storm flooding, knewwhere they'd find the maximum storm surge: dueeast of his own house in Perrine.
"Well, I sure knew we were in the radius ofmaximum winds," said Jarvinen, who lost part ofhis roof to the storm.
Jarvinen's computer model of storm flooding inSouth Florida (SLOSH - short for Sea, Lake andOverland Surge Hazard) uses data about thecoastline, the seafloor, and the path and power ofhundreds of potential storm tracks to predict thespread and depth of storm surge.
Andrew has given Jarvinen a wealth of real-lifedata to help him fine-tune the SLOSH program.After the storm, Jarvinen ran Andrew's track andvelocity through SLOSH to see how well themodel simulated the actual surge.
"It got most of the heights within plus or minus20 perrent," he said.But Jarvinen found that SLOSH needs a variable
to account for wall fences like the one around theold Deering Estate. He learned that such walls, andthe debris that piled against them, actually slowedthe advance of the storm surge.
I�L , [: I , "II
Hwu q.tt I -L i
1608
0. fL-
_ -1 .I. f-e, Day
mu mu a a EUs E'sII 9 "
6,1 IL-
IU. , -sNE!
I0
II INua".a.
1"IL .
-'I IMak f IUIN
-8.5 IL
0.3 IL
- 8,7 It~ BaM *o~ aP.
Path of AndrWs-thr &V*.W
....... ,"Z ~,2_L e1 I. . ..n . 7

both National Hurricane Center staff and local emergency management directors.
Fortunately, emergency management directors took prudent early actions and kept in
constant communication with the National Hurricane Center so that they still had time to
carry out appropriate evacuations for a more intense storm scenario. Ed Rapaport of the
National Hurricane Center in his preliminary forecast and warning critique of Andrew,
noted the following:
Andrew reached hurricane strength on the morning of 22 August, therebybecoming the first Atlantic hurricane to form from a tropical wave in nearly twoyears. An eye formed that morning.. just 36 hours later, Andrew reached theborderline between a category 4 and 5 hurricane and was at its peakintensity... central pressure had fallen 92 mb, down to 922 mb. Andrew initiallyweakened over the Florida Straits and pressure rose to 941 mb. However, thehurricane rapidly reintensified during the last few hours preceding landfall onFlorida. Radar, aircraft and satellite data showed a decreasing eye diameter andstrengthening eyewall convection... the estimated central pressure was 930 mb atlandfall near Homestead AFB at about 0905 UTC (505 AM EDT) 24 August.
The preliminary report went on to say that the 16.9 foot storm tide is a record
maximum for the southeast Florida peninsula. Even though Andrew was small and moved
rather fast, rainfall totals were in excess of seven inches in parts of southeast Florida.
Concerning the forecast error, the preliminary report stated:
On average, the NHC errors were about 30% smaller than the current 10 yearaverage. The most significant changes in Andrews' track were generally wellanticipated and the forecast tracks generally lie close to the best track. However,the rate of Andrew's westward acceleration over the southwestern Atlantic wasgreater than initially forecast. In addition, the NHC forecasted a rate ofstrengthening that was less than what occurred during Andrew's period of rapiddeepening.
Appendix B includes the best track positions and a watch and warning summary for
Hurricane Andrew.
09-683.00B:\TLTHiA\09683-01.RPT 2-5

RECOMMENDATIONS
Based on a review of the Hurricane Andrew experience and hazards/vulnerability
study products previously developed the following recommendations are provided:
- Acknowledge increased levels of vulnerability to winds relative to the Saffir-Simpson Category 4-5 scenario. The old assumption that just mobile homesoutside surge areas are vulnerable to winds may not be valid considering theaftermath of Andrew. Depending on construction practices/housing types, wemust increase our vulnerability statistics to recognize this for a given area.
- Rework some of the SLOSH model set up for southeast Florida to recognizeexisting barriers and impedance to storm surge inland flooding.
- Remap revised SLOSH output in an easier to use and more legible format.Surge atlases should be brought up to current State of Florida/FEMA/Corpsstandards which includes standardized shades of blue for water bodies versus theCategory 1 flood area. The Dade atlas must be simplified - too many stormcategories/tracks were depicted and color choices and quality were not up tocurrent atlas production standards. A good digitized base map of Dade Countywith accurate topological features/elevation data must be obtained and used forCADD production.
- Local officials must be reminded that one hurricane will not produce the inlandextent of flooding shown in the atlases. The point(s) of maximum effect will bea function of storm size and point of landfall.
- Future study updates for regions in the peninsula part of Florida should givefurther consideration to exiting or crossing storm tracks and what effects theymight have on a community.
B:\TLTHA\09683-01.RPT26 2-6

Chapter 3
Evacuation Behavior in Hurricane Andrewin Southeast Florida
(Prepared by Hazards Management Group)
Evacuation studies include assumptions about how the public will respond during
a hurricane evacuation, and two such reports were produced for the Jacksonville District
of the Corps for southeast Florida. Separate analyses were conducted for Monroe County
(Nelson, Crumley, Fritzsche, and Adcock, 1989) and Palm Beach, Broward, and Dade
Counties (Hazards Management Group, 1990). An earlier study was performed for the
entire region in 1983 (Post, Buckley, Schuh, and Jernigan, 1983). This report describes how
the public in southeast Florida actually responded during the hurricane Andrew evacuation
and how that behavior compared with the projections made in the 1989 and 1990
behavioral analyses used in preparing evacuation studies for the region. Descriptions of
public response in Andrew come primarily from a preliminary analysis of data collected in
a Florida State University study funded by the National Science Foundation (Baker, 1993).
The Florida State University study included a telephone sample survey of 900 residents of
Broward, Dade, and Monroe counties, plus 400 in southwest Florida not included in this
report. That data is supplemented in this report with 200 additional telephone interviews
in southeast Florida conducted by Hazards Management Group, Inc. with funding from
the U.S. Army Corps of Engineers.
The combined southeast Florida post-Andrew sample of 1100 was divided among
the risk areas used for evacuation operations in each of the three counties. The
breakdowns and aggregations used below reflect that stratification but also reflect the
necessity of combining subsamples in order to have groups of sufficient size to yield reliable
findings.
All samples are subject to error because they do not include the entire population.
They are estimates of the true population values, and larger samples will usually be closer
to the actual population values than smaller samples. Readers should keep in mind that
the figures reported as responses in Andrew are the best available estimates but remain
09-683.00B:\TLTHA\09683-01.RPr 3-1

estimates. In general, the figures reported will be within 5 to 10 percentage points of the
actual population values.
Evacuation Rates
Response in Andrew
Broward and Dade. The percentage of residents who evacuated (i.e., left their homes
to go someplace they believed would be safer) in Andrew varied by proximity to the
shoreline. In Broward county 69% left from the Category 1-2 surge zone, and in Dade
71% left from the Category 1 area. In the Broward Category 3 and Dade Category 2-3
zones 63% evacuated, and in Category 4-5 zones 46% left from Broward and 33% left
from Dade. In both counties 13% evacuated from inland areas beyond the Category 4-5
surge limits. Had Andrew's track been slightly farther north, a significant number of homes
that were not evacuated would have been flooded.
Monroe. Evacuation from the Florida Keys (Monroe County) decreased from north
to south and was lower than that from the Broward and Dade high-risk areas. In the
Upper Keys 62% left, compared to 45% in the Middle Keys, 40% in the Lower Keys north
of Key West, and 25% in Key West. If Andrew's track had been farther south, many
homes in the Keys that were not evacuated would also have been flooded.
Hypothetical Responses
The 1989 and 1990 southeast Florida behavioral studies conducted telephone
interviews with residents asking how they would respond to hurricane threats. Their
answers are referred to as hypothetical or intended responses.
Broward and Dade. In Broward and Dade counties, the sample was divided into
"beach" and "mainland" groups. The beach sample was the same as the Category 1-2
population in Broward and the Category 1 population in Dade, although the Category 1-2
area of Broward also included a mostly narrow strip of mainland bordering Biscayne Bay.
The mainland sample in the hypothetical survey was comparable to the Category 3
population in Broward county and to the Category 2-3 population in Dade.
09-683.00B:\TITHA\09683-OI.RPT 3-2

Only nine percent of the beach respondents of either county insisted they wouldn't
evacuate if ordered, implying an evacuation rate of 91%. On the mainland 11% of the
Broward and 15% of the Dade samples said they wouldn't leave if ordered, indicating
evacuation rates of 89% and 85% respectively.
Monroe. The Monroe county hypothetical response survey sample was divided into
three zones: Upper, Middle, and Lower Keys. In the Upper Keys 78% said they would
leave, versus 76% in the Middle Keys, and 56% in the Lower Keys.
Behavioral Projections
Broward and Dade. The behavioral analysis performed for Broward and Dade
counties by Hazards Management Group did not attempt to provide a single global
evacuation rate for the region, for an entire county, or even for a risk zone within a county.
The report contained a look-up table indicating the evacuation rate that would ensue in two
different storm scenarios, for three different risk zones, for mobile homes and for housing
other than mobile homes. An accompanying narrative gave guidelines for further refining
the values.
The report said that in a severe storm like Andrew if public officials ordered
evacuation in high and moderate risk areas and were successful in communicating to people
that they need to evacuate, 90% would leave from high-risk areas, 80% from moderate-risk
areas, and 30% from areas outside the zones told to evacuate for flooding. The report
specified the notice dissemination modes required to achieve those evacuation rates and
stated that actual rates would be at least 25 percentage points lower if the orders weren't
disseminated by officials going physically into the areas being told to evacuate.
Although only 70% evacuated from the high-risk areas of Broward and Dade in
Andrew, many residents (44% in Broward and 28% in Dade) said they didn't hear from
officials that they were supposed to leave. Of those who said they did hear officials say that
they were to evacuate, only slightly more than half believed the notice was mandatory.
09-683.00B:\TLTHA\09683-01.RPT 3-3

Overall, only 32% in Broward Category 1-2 and 42% in Dade Category 1 evacuation zones
believe they were ordered to evacuate.
Of those who indicated that officials told them to evacuate, 80% did, compared to
only 52% of those who said they weren't told to leave. Of those who understood that they
were ordered to leave, 87% did so, and of the respondents who said that officials actually
came into their neighborhood making announcements that they must evacuate, 89% left.
The look-up table in the behavioral analysis was extremely accurate for the high-risk area.
The evacuation rates from the Broward Category 3, Dade Category 2-3, and both
Category 4-5 zones were also anticipated, given the manner in which evacuation orders
were perceived by residents. In Dade and Broward counties combined, 80% of the
residents in these areas who believed officials had ordered them to leave complied.
Evacuation from the wind-only zone is more difficult to compare, because the
behavioral analysis didn't address it in the same detail as the surge-prone areas. The
behavioral analysis did not specifically state how far inland the "low-risk" area extended,
how evacuation would vary within the zone as a function of proximity to the coast, or how
response would be affected by variation in the success of evacuation from surge zones.
Taken at face-value, however, without the benefit of guidelines for further interpretation,
the look-up table overstated evacuation from the wind-only areas of Broward and Dade.
Not enough mobile homes were included in the Broward and Dade post-Andrew
study to permit a statistically reliable comparison with the behavioral analysis. Available
data as well as anecdotal evidence appear consistent with the look-up table, however. In
a number of the most devastated mobile home parks in south Dade county, some of the
residents did not leave and had to seek refuge in clubhouses on site.
Monroe. Strictly speaking, the behavioral analysis for Monroe county did not make
explicit projections of response: it simply reported the telephone survey hypothetical
responses. Because the purpose of the report was to provide behavioral assumptions for
09-683.00B:\TLTH-A\09683-OI.RPT34 3-4

evacuation planning, however, it is reasonable to assume the authors intended that the
survey results be used for planning.
The behavioral analysis overpredicted actual response in the Upper (78% predicted
vs. 62% actual), Middle (76% vs. 45%), and Lower Keys (56% vs. 29%). The survey
scenario yielding the predictions specified a Category 3 hurricane, with officials ordering
evacuation.
Evacuation Timing
Response in Andrew
Figure 1 depicts the cumulative evacuation rate from 5 PM Saturday, August 22,
when a hurricane Watch was first issued for southeast Florida, to 5 AM Monday, August
24, when landfall occurred. The curves indicate, of all eventual evacuees, the cumulative
percentage who had left at various times and dates.
Fig. 1. Evacuation Timing in Andrew
go _ _ Keys Evacuation: l ll _ TT3 P Sat Non-residentslna-1OP Sat Ocean Reef -. , . .
a) 6 A Sun Up-Mid Keys + 7_-I tQ 0 e1 1A Sun Lower Keys X -T
I;o1 Ii I |BT 1:0 0 I - -
40-
E Waxing Dade-Broward|II , -- I- I I;Evacuation: 8A Sun
10, X 1--i l l l l I I I
0 1 I rj-1 | i l l J1 v-w-w i--i--| --- l l-- E - l 11oP 7P 9P lip IA 3A BA 7A GA 11A iP 3P SP 7P 9P lip IA 3A 5A
BP BP lop 12A 2A 4A OA OA 10A 12P 2P 4P Sp OP lop 12A 2A 4A
Time of Day, Sat. - Mon., Aug. 22-24
-- | Dade-Broward Cati ER Upper Keys
Source: Baker, 1993
09-683.00B:\TLTHA\09683-O1.RPT -3-5

Broward and Dade. Ten percent of the evacuees from the Dade and Broward high-
risk areas said they had already left when the Watch was issued. Few others left during
Saturday evening and night, so that when a Warning was issued the following morning, less
than 15% of the eventual evacuees had left. At that time officials in both Broward and
Dade counties issued evacuation orders. The evacuation rate clearly began to increase
around 8 AM Sunday, and by 2 PM that afternoon slightly more than half the evacuees had
left. By 6 PM over 90% of the evacuees had left. Response curves for lower risk areas of
Broward and Dade were comparable but lagged slightly behind the curve for the highest
risk zones.
Monroe. The evacuation was phased in the Florida Keys. Saturday afternoon at 3
PM state and county parks were closed, at 4 PM officials began recommending that non-
residents leave, at 6 PM tourists were ordered out, at 10 PM that evening the Ocean Reef
development near the northern extent of the Upper Keys was told to evacuate, at 1 AM
RV parks and campgrounds were evacuated, and at 2 AM Sunday mobile home parks in
the Upper Keys were told to leave. At 6 AM Sunday morning an evacuation order was
issued for all of the Upper and Middle Keys, followed at 11 AM by an order for the Lower
Keys. Although most residents weren't told to leave until early Sunday morning, many
were aware of the other evacuation activities going on earlier and some were probably
influenced.
Twenty percent of the evacuees said they had already left when the hurricane Watch
was issued, and another 10% left by Sunday morning when the general evacuation order
was issued for the Upper Keys. The response curve began to increase sharply at that time,
and by 9 AM 50% of the evacuees had left. By 5 PM 90% of the evacuees had left, and
officials halted evacuation out of the Keys from the Upper Keys at 6 PM. Response curves
for the Middle and Lower Keys were similar but somewhat later.
Hypothetical Responses.
Broward and Dade. Residents were presented with a hypothetical threat scenario
in which a category 3 hurricane threatened, a Watch was in effect, and officials had not
B-\TLTHA\09683-Ot.RPT 3-3-6

advised any actions. Half the beach respondents and a third of the mainland respondents
said they would evacuate under those conditions (but were not asked whether they would
necessarily leave right away).
Monroe. The Monroe hypothetical response survey presented three category 3 storm
threat scenarios: a Watch 36 hours before possible landfall, with officials recommending
voluntary evacuation; a Warning 24 hours before possible landfall, with officials ordering
evacuation; and a Warning 12 hours before possible landfall, also with officials ordering
evacuation. When respondents indicated they would evacuate in one of the scenarios, they
then were asked how long it would take before they actually left.
The responses were combined to produce a logarithmically-shaped cumulative
response curve for the Upper Keys in which more than 20% of the evacuees left within one
hour of the Watch + recommendation scenario, 60% of the evacuees left after the watch
+ recommendation before the Warning + order, and 90% of the evacuees left prior to the
12-hour-before-landfall notice. Averaging over the three scenarios, 30% of the respondents
said they would leave immediately after the notice, 61% within three hours of the notice,
and 81% within six hours.
Behavioral Projections
Broward and Dade. The behavioral analysis report stated that the early response
indicated by the survey scenario was unrealistic, noting that relatively few evacuees (less
than 20%) leave before an evacuation notice is issued. The report stated that actual
response timing will depend upon the urgency of the evacuation and proposed three
different logistic ("S") curves for planning. One curve supposed early, very aggressive,
effective action by officials in which 10% of the evacuees left before the evacuation order
was issued and 90% of the evacuees would leave within six hours of the time the order was
issued, and reaching that point six hours before arrival of the storm (tropical storm winds).
Another curve supposed a late, urgent evacuation, stemming from an unanticipated change
in storm track or forward speed. It specified that 20% of the evacuees would have left
09-683.00B\T'LTHA\09683-O1.RPT 3-7

before the evacuation order was issued, and then within five hours a total of 90% of the
evacuees would have left, leaving just one hour before the arrival of the storm.
The Andrew evacuation was most like the "normal" scenario proposed in the
behavioral analysis report. The normal timing scenario presumed that warning time was
adequate for a relatively unhurried evacuation and that officials did not convey a sense of
urgency to leave right away. It specified that only 10% of the evacuees would have left
before an order, and the cumulative evacuation rate would climb almost linearly over the
next 10 hours when 90% of the evacuees would have left, three hours before arrival of
storm conditions.
In Andrew approximately 15% of the evacuees from high-risk areas in Broward and
Dade left before the order was issued (compared to 10% in the behavioral analysis).
Ninety percent of all evacuees had left within 10 hours of the order (compared to 10 hours
in the behavioral analysis). The 90% level was reached at 6 PM Sunday, which was at least
six hours before the arrival of tropical storm conditions (compared to three hours in the
behavioral analysis). Thus the normal response scenario in the behavioral analysis was very
close to the response in Andrew, except that the actual evacuation was concluded earlier.
Monroe. The Andrew evacuation in the Keys is not perfectly comparable to the
scenario sequence proposed in the behavioral analysis report because in Andrew residents
in general were not advised to evacuate when the Watch was issued. However, given the
other sort of evacuation activities which took place prior to the Watch, and given the
evacuation notices issued for parts of the Upper Keys before the general evacuation order,
one might argue that actions by officials at the time of the Watch provided cues which were
tantamount to recommending voluntary evacuation. If that is true, then the behavioral
analysis report specified that 70% of the evacuees would have left by the time the order
was issued (compared to 36% actual in Andrew), and by noon on Sunday almost 90%
would have left (compared to 70% actual in Andrew).
09-683.00B:\TLTTA\09683-01 .RPT 3-8

If the behavioral analysis report warning scenario is inappropriate for comparison
to the Andrew evacuation, another comparison can be made. The report indicated that
30% of evacuees would leave within one hour of an evacuation notice, 61% (cumulative)
within three hours, and 81% (cumulative) within six hours. The actual response was
significantly slower.
Use of Public Shelters
Types of refuge include the homes of friends and relatives, official public shelters,
hotels and motels, and a wide variety of other locations such as workplaces, churches, and
second homes. For emergency management and Red Cross officials the most critical are
public shelters, because it is those which must be provided for by government and the Red
Cross.
Response in Andrew
Broward and Dade. Overall only 6% of all evacuees said they went to Red Cross
public shelters, and there was little variation from place to place. In Broward county inland
of the Category 3 surge zone, 19% of the evacuees went to public shelters. However, the
total number of evacuees within the sample from that area of Broward was only 31 people,
meaning that the actual percentage of evacuees using public shelters actually could be more
than 10 percentage points higher or lower than the 19% figure. Non-whites (13%) were
more likely to use public shelters than whites (5%), and households with annual incomes
below $12,000 were more likely to use public shelters than those with higher incomes (24%
vs. 4.5%).
Monroe. Overall 8% of the evacuees in the Keys said they used public shelters.
Shelter use increased from north to south, ranging from 2% in the Upper Keys, to 7% in
the Middle Keys, to 16% in the Lower Keys (including Key West).
09-683.00B:\T'LTHA\09683-01.RPT 3-9

Hypothetical Responses.
Broward and Dade. Among residents in beach areas, 18% in Broward and 22% in
Dade said they would use public shelters. On the mainland, 21% in Broward and 36% in
Dade said they would go to public shelters. Actual shelter use was dramatically lower than
the hypothetical usage rates. In hypothetical surveys the households with annual incomes
from $10,000 to $25,000 had similar shelter use rates, and usage declined gradually as
income rose above $25,000. Non-whites were more likely to say they would use public
shelters than whites.
Monroe. In the Upper Keys 6% said they would use public shelters, compared to
12% in the Middle Keys, and 30% in the Lower Keys. The average was 15%.
Behavioral Projections.
Broward and Dade. The behavioral analysis report provided nine different shelter
use scenarios based on risk area and income and also discussed how other variables such
as shelter policies, actions by public officials, and race could further affect shelter use. The
report, despite lowering the projections below the hypothetical response levels, still
overestimated shelter use for most evacuees. It was accurate for high-income evacuees
from high-risk areas and for Broward county inland of the Category 3 surge limits. The
predicted inverse relationship between income and shelter use was true but weaker than
anticipated.
Monroe. Actual shelter use in Monroe county was consistently below the levels
stated in the behavioral analysis report: 1% actual vs. 6% anticipated in the Upper Keys,
7% vs. 12% in the Middle Keys, and 16% vs. 30% in the Lower Keys.
Evacuation Destinations
Response in Andrew
Broward and Dade. From the Broward Category 1-2 and Dade Category 1 zones 35% of
the evacuees went to destinations outside their own county. In the Broward 3 and 4-5 and
Dade 2-3 and 4-5 zones, 25% left their home county. There were too few evacuees
09-683.00B:\TLTHA\09683-01.RPT 313-10

surveyed outside the surge zones to calculate reliable estimates of destination locations.
The trend inland across the other zones suggests that the figure would be less than 25%.
Monroe. Reliance upon destinations outside Monroe county decreased from the
Upper Keys south. From the Upper Keys 77% of the evacuees went out of county, 47%
from the Middle Keys, and 29% from the Lower Keys. The overall figure was 48%.
Hypothetical Responses
Broward and Dade. Overall 35% of Broward and 41% of Dade respondents said
they intended to leave their county. The behavioral analysis document did not report
hypothetical survey results by risk area.
Monroe. Eighty-seven percent of intended evacuees from the Upper Keys said they
would leave Monroe county, compared to 77% from the Middle Keys and 61% from the
Lower Keys.
Behavioral Projections
The behavioral analysis report provided estimates for evacuees leaving their home
county under two scenarios for high, moderate, and low risk areas: a very strong storm,
with an early evacuation and a weak storm, with typical timing. Andrew, however, was a
very strong storm, with typical timing. The appropriate values for an evacuation like
Andrew's would be between the two scenarios in the report. Using these values, the
report would predict evacuees leaving their own county at 43% from high risk areas, and
28% from moderate risk areas. The actual figures in Andrew were 35% for high risk areas
and 25% for moderate risk areas. The behavioral analysis was close in both instances, but
overstated the rate for the high risk zone by eight percentage points and understated the
rate for the moderate risk zone by three percentage points.
Monroe. The behavioral analysis report used values of 87% the Upper Keys, 77%
for the Middle Keys, and 62% for the Lower Keys. Actual values were 77% in the Upper
Keys, 47% in the Middle Keys, and 29% in the Lower Keys. The values were close for the
09-683.00B:\TLTHA\09683-0I.RP'T 3-11

Upper Keys (10 percentage points too high), but significantly worse in the Lower Keys (30
and 33 percentage points too high).
Vehicle Use
Response in Andrew
The percentage of vehicles available to evacuees which are actually used in
evacuations is almost a constant, seldom being less than 65% or more than 75%. Response
in Andrew generally fell within that range, accounting for sampling error. In the Broward
Category 1-2 and Dade Category 1 zone 77% of the available vehicles were used, in the
rest of the Broward and Dade areas 69% were used, and in the Keys 67% were used.
Hypothetical Responses
In hypothetical response surveys interviewees in the beach areas of Broward and
Dade counties said they would use 71% of the vehicles available to them. Mainland
residents said they would use 65% of their available vehicles. In the Keys, survey
respondents said they would use 67% of their vehicles. As demonstrated in other studies,
hypothetical response values for vehicle use are good predictors of actual use.
Behavioral Projections
The behavioral assumptions for Broward and Dade high-risk areas indicated that
65% to 75% of the available vehicles would be used in an evacuation. Vehicle use in
Andrew was 77% in this area, slightly higher than the upper end of the projected range.
The behavioral analysis report stated that 60% to 70% of the vehicles available in the
mainland area would be used, and in Andrew the figure was 69%. In the Keys, the
behavioral analysis reported that 67% of the available vehicles would be used, and in
Andrew 65% were used.
Conclusions
Comparisons between actual response data in Andrew, hypothetical survey results,
and response projections provided in behavioral analysis reports prepared for southeast
Florida reaffirm two basic conclusions which have been evident for years: 1) hypothetical
09.683.00B:\TLTRA\09683-01.RPT -13-12

response data alone should not be used for deriving evacuation behavioral assumptions and
2) a variety of assumptions should be provided for a variety of threat and evacuation
scenarios, because public response will vary not only from one place to another in the same
storm but from storm to storm in the same place. To our knowledge the only locations
where behavioral analyses currently rely exclusively upon hypothetical response data are the
Florida Keys, the east-central regional planning area of Florida, all of Georgia, and all of
Texas. The approach now being used by planners in southwest Florida is unclear but
appears to be a set of values developed for Lee county and applied generically without
differentiation within the region.
The methodology used in preparing the behavioral analysis for Broward and Dade
counties (past response data in David in 1979 + general patterns of response in evacuations
elsewhere + hypothetical response surveys in Broward and Dade + adjustments indicated
by past comparisons between hypothetical and actual responses elsewhere + input from
local emergency management officials) yielded projections which in most instances were
very close to the responses observed in Andrew. The discrepancies, however, illustrate the
fact that there is still much to learn about public response in hurricanes in general and the
application of generalizations to specific locations. Opportunities to further that knowledge
should not be missed when evacuations occur.
09-683.00B:=TLTHA\09683-01 .RPT 3-13

Chapter 4
Shelter Issues
The primary objectives of shelter analyses prepared for FEMA/Corps comprehensive
hurricane evacuation studies are to list public shelter locations, assess their vulnerability
relative to storm surge flooding, and to estimate the number of people who would seek
local public shelter for a particular hurricane intensity or threat. Shelter location/capacity
data are obtained from local emergency management staff working in conjunction with the
American Red Cross, schoolboard or other local agencies. Comparisons are then made
with SLOSH data to assess flooding potential. Public shelter capacity is usually compared
to public shelter demand figures generated in the transportation analysis to determine
potential deficits or surpluses in sheltering. The behavioral analysis is important to this
process as assumptions for the transportation analysis (regarding the percent of evacuees
going to public shelter) come from the behavioral analysis or behavioral parameters
recommended by the local directors.
Shelter issues related to Andrew were discussed with local and state officials.
Discussions focused on the following topics:
When were shelters opened and when did evacuees arrive/stop arriving?
How many shelters were opened and how many people were sheltered?
Were any flooding, wind, or loss of power problems encountered with
shelters during the storm?
Table 1 summarizes the responses to each of these topics gathered in the lower
southeast Florida area counties. Table 2 is also provided showing public shelter statistics
gathered for other south Florida counties responding to Andrew. Most shelters opened
09-683.00B:\fT'THA\09683-01.RPT 4-1

m - - ------------ m m m m
TABLE 1
Lower Southeast Florida CountiesPublic Shelter Data
Number of Shelters Number of People Number of Time Flooding, Wind or
Location Opened Sheltered Shelters/Expected Public Opened/Duration Loss of PowerShelter Evacuees - Tech.
Data Report
Monroe County FlU in Dade, 2 900 at FlU No official county shelters -- (See Dade County)
refuge in Key West for this storm category.
Dade County 47 43,000 52 shelters/75,185 people. 8/23/92 10:00 AM Toilets did not work, waterHalf open until pressure problems, some
9/6/92 food/water supplies notadequate, inadequate RedCross staffing, loss ofpower, two shelters withmajor wind problems.
Broward County 39 26,440 23 shelters/62,070 people. 8/23/92 10:00 AM Some loss of power, one3 days shelter with roof problems.
Palm Beach County 24 6,000 50 shelters/27,400 people. 8/23/92 3:00 PM Loss of Power in south part23 hours of county.
09-683.00B3:\riLTI A\09683-01 .RI'

m m m m m m m m m m m m m m = = = = =
TABLE 2
Other South Florida CountiesPublic Shelter Data
Number of Shelters Number of People Time Flooding, Wind orLocation Opened Sheltered Opened/Duration Loss of Power
Collier County 9 3450 8/23/92 6:00 PM Loss of power at all shelters after 8:3020 hours a.m.
Lee County 8 2,900 8/23/92 7:00 PM --
20 hours
Charlotte County 4 350 8/23/92 5:00 pm None20 Hours
Sarasota County 4 <100 8/23/92 3:34 PM None24 Hours
Martin County 7 1,200 8/23/92 Noon None24 hours
09-683.00BATL TI IA\09683-01 RI'r

in Dade and Broward Counties were operational by Sunday morning at 10 a.m. Palm
Beach shelters were operational by Sunday at 3 p.m. No official public shelters were
opened in Monroe County although it has been reported that two refuges were opened in
Key West by Red Cross staff. Most shelters stayed open approximately 1 to 3 days except
in the heaviest hit areas of Dade County. Approximately 20 Dade shelters stayed open for
two to three weeks. Evacuees generally arrived as soon as shelters opened and continued
to arrive until about 9 p.m. Sunday evening. In Palm Beach and Broward Counties, local
emergency management officials were satisfied with Red Cross staffing of shelters. Some
shelters experienced loss of power and backup generators were used where available.
Broward County had one shelter with a roof problem - but officials were able to relocate
the evacuees to another shelter.
The public shelter situation was much less optimal in Dade County. Water pressure
problems at many shelters created situations where no toilets were working. Food and
water supplies at some shelters were not adequate - this was especially acute at a shelter
which was housing elderly evacuees from Miami Beach. Loss of power was experienced
throughout the county and two shelters had major wind problems. Concerns were also
expressed by the County that some shelters had inadequate or no Red Cross staff available
to operate the facility.
As can be seen in Table 1, the number of public shelter evacuees in the lower
southeast Florida counties during Andrew was significantly less than what was anticipated
through statistics generated in study products. Local officials had fairly reliable estimates
of the numbers of people in public shelters. However, estimates of the total number of
people evacuating dwelling units within each county are rough at best. Therefore it is hard
to confidently estimate the exact percent of total evacuees that went to local public shelters.
The media roughly estimates that approximately 750,000 people evacuated dwelling units
in lower southeast Florida. The Red Cross statistics indicate that about 72,000 evacuees
were in in-region public shelters. This would translate to about ten percent of the
evacuees going to local public shelters.
09-683.00B:\TLTH-A\09683-01.RPT 4-4

There are several important reasons why anticipated in-county shelter demand was
much higher than actual demand (some of which also applied to the Hurricane Hugo
situation in South Carolina in 1989):
1. Due to the publicity of the storm by the media, and the actions/preparation taken Saturday by both private citizens and localofficials, evacuees were able and certainly willing to leave thethreatened counties and go northbound out of the region.
2. The technical analyses used to develop the shelter demand figures inthe Technical Data Report were based on 100 percent participationrates (of people living in potential storm surge areas). Obviously,participation rates were considerably less than this particularly in theMiami Beach area. Although limited participation rates (not 100percent) were used in the Monroe County work, it is doubtful thatthe assumed 60 percent of the lower Keys people responded.
3. Compared to the number of shelter locations identified for eachcounty (in the Technical Data Report) a lesser number of shelterswere opened. This was not true in Broward County where manymore were opened.
4. Behavioral assumptions regarding percent going to pubic shelterwere higher than the percent of evacuees that acually went to publicshelters.
RECOMMENDATIONS
Based on the Andrew experience, it is recommended that future Corps/FEMA
hurricane study efforts incorporate/encourage the following:
1. With the State of Florida acting as a catalyst, local officials shouldbe encouraged to work out statewide mutual sheltering agreementswith inland host areas (such as Orlando). All states should addressinland sheltering requirements in their hurricane preparednessefforts.
2. Study managers should confirm with emergency management andshelter officials (e.g., Red Cross) whether all identified shelters canbe opened, staffed, powered, and supplied for hurricane scenariosinvolving a large number of evacuees.
09-683.00B:\TLTHA\09683-01.RPTr 4-5

3. New schools/universities and public buildings should be constructedwith provisions made for "safe" hurricane sheltering. The studyprocess should provide a technical basis for evaluating theimportance of major new public shelters.
4. Since Hurricane Hugo, FEMA/Corps studies have done an excellentjob of checking verified first floor elevations against potential surgeinundation figures. These efforts have helped to eliminate the useof shelters in potential storm surge areas. It now appears that afterAndrew, new efforts must be developed to look at potential windproblems.
09-683.00B:\TLTHA\09683-Ol.RPT 4-6

Chapter 5
Transportation/Clearance Time Data
In FEMA/Corps of Engineers comprehensive hurricane evacuation studies, the
primary objective of the transportation analysis is to determine the clearance times needed
to conduct a safe and timely evacuation for a range of hurricane threats. Information from
the vulnerability, shelter, and behavioral analyses are directly input as well as various
sources of permanent and seasonal population data. For the lower southeast Florida
studies, regional and county clearance times were developed for two or three storm
intensity groups (eg. Category 1-2, Category 3-5), several seasonal occupancy assumptions,
and three rates of mobilization on the part of the evacuating population. The number of
scenarios for a particular county was obviously dependent upon the inland extent of
flooding and population characteristics of that locality.
Transportation and clearance time issues related to Andrew and discussed by the
study team with local and state officials included the following:
Was the evacuation roadway network accurate - did evacuees use projected
routes?
Were any traffic control actions taken to speed up flow?
When was the evacuation essentially completed - how long did the evacuation
take?
Were any major problems encountered in this evacuation?
Table 3 summarizes the response to each of these topics gathered in the lower
southeast Florida area counties. Table 4 is also provided showing statistics gathered for
other south Florida counties responding to Andrew. Clearance times calculated for the
09-683.00B:\TLT'HA\09683-01.RP1T 5-1

---- rn-mn-----m mm M mm
TABLE 3Lower Southeast Florida Counties
Transportation/Clearance Time Data
Evacuation Roadway Specific Traffic Control Clearance Time Study CalculatedLocation Network Accurate Actions Experienced in Andrew Clearance Time Problems Encountered
Monroe County Yes Traffic split Sunday 6:00 AM 24 hours 27 hours w/Card No programmable signs.
to Card Sound Road Sound Road Plantation Key service
highway patrol aircraft used diversion station tie-up, Jewfishto spot bottlenecks and Creek bridge malfunctiondisabled vehicles, phased at 11:30 p.m. Saturday,
evacuation, closed state stop and go traffic atparks early. Tavernier Road
construction area, 3
stalled vehicles, traffictrying to get in left NBrane to avoid CardSound Road. Lifting oftolls on HEFT.
Dade County Yes Metrobus drivers used to 13 hours 15 hours Nonemove 8,000 elderly andspecial needs.
Broward County Yes Bridges locked down 3-1/2 17 hours 23-1/4 hours Signals shut down toohours after evacuation early; heavy backgroundorder, used buses to move traffic.5,000 people.
Palm Beach County Yes Tolls lifted on Turnpike at 7 hours 11 hours Major congestion onnoon. Florida Turnpike and 1-95
where number of lanesNB decreases; backupsat construction areas andtoll plazas.
09-683.00

- - m - m M = - - m m - -
TABLE 4Other South Florida Counties
Transportation/Clearance Time Data
Location Evacuation Roadway Specific Traffic Control Clearance Time Experienced Problems EncounteredNetwork Accurate Actions in Andrew
Collier County Yes Yes, at 1-75 on Ramps 14 hours SR 27, SR 29 and US 41northbound Under-utilized,congestion on 1-75 on ramps.
Lee County Yes 17 hours
Charlotte County Yes None 6 hours SR 27 under-utilized.l_ Mainly mobile home evac.
Sarasota County Yes None 16 hours None
Martin County Yes None 12 hours
09-683.00AUI\1L IA\09683-0 .RPT

latest FEMA/Corps study generally compared well with actual times experienced in
Hurricane Andrew. Monroe and Dade Counties' times were slightly less than calculated
times. This was directly due to less participation on the part of Dade and Monroe
residents than had been assumed in the modeling. Broward and Palm Beach Counties'
times deviated from calculated times by approximately four to six hours. The significantly
lower times in those counties suggest participation rates considerably below the 100 percent
assumed in the original calculations. The anticipated storm track as of Sunday afternoon
August 23rd may have greatly reduced Palm Beach County's participation rates and
clearance times. The times also suggest that many evacuees may have left the area well in
advance of the official evacuation order given early Sunday morning. Traffic counts
collected from the permanent count stations that were functioning prior to and during the
Andrew evacuation confirm this phenomenon.
Appendix D provides graphs of the northbound and southbound directional traffic
movements during the evacuation that could be analyzed from Florida Department of
Transportation permanent count stations. Previous Sundays before Sunday August 23rd
are shown on the graphs for comparison purposes. For those few stations where the
counters were functioning for earlier dates as well as through most of the evacuation, the
data is extremely interesting. The graphs show some evacuation taking place even before
6:00 a.m. on Sunday in Dade, Broward and Palm Beach Counties, but they show an
immediate more pronounced response as soon as the official evacuation order took effect.
Peak traffic flow occurred in the early to mid-afternoon period.
The graphs (as implied by the southbound traffic) confirm previous assumptions
made about how background traffic diminishes as the evacuation traffic continues over
time. Observations during the evacuation by Captain Grady Carrick and his staff at the
Florida Highway Patrol as well as local Sheriffs in each county coincide well with the traffic
count data that was available.
Table 3 provides special traffic control/transportation actions that each county
implemented for the evacuation. Most notably, Monroe County phased its evacuation by
09-683.00B:',TLTHA\09683-O1.RPTr 5-4

evacuating the tourists and day visitors people on Saturday afternoon and evening.
Voluntary evacuation of Monroe county permanent residents started Saturday as well.
When the official evacuation order (for permanent residents) was issued for early Sunday
morning, those remaining residents north of the Seven-Mile bridge began moving first.
Lower Keys residents were then asked to evacuate later in the day. Evacuation was cut off
in the early evening so that late leaving evacuees would not run the risk of being caught
in pre-landfall severe weather conditions. Due to the need to get traffic out more quickly
than the 18 mile stretch of U.S. 1 could handle, a portion of traffic was directed up to Card
Sound Road beginning Sunday at 6:00 a.m. Since the Ocean Reef residents had been
evacuated early on, there were little or no turning conflicts to deal with at CR 905 - Card
Sound Road intersection.
Dade and Broward counties relied on buses and their drivers to move many elderly
and special needs groups to shelter. Although some drivers did not show up for duty, those
drivers who did assist Miami Beach residents were considered to be real heroes by local
officials. Where appropriate, drawbridges were locked down to facilitate the evacuation.
Although most individuals and officials felt that the evacuation went well and that
traffic moved as expected, there were complaints of traffic tie-ups on the Florida Turnpike
at toll plazas that were still operating until 1:00 p.m. Sunday. Construction sites on 1-95
and the Turnpike created some congestion as well. A few individuals in Monroe County
wrote complaints about traffic stopping on U.S. 1 throughout the Keys. This may have
related to congestion caused by three stalled vehicles and road construction sites near
Tavernier. Despite the expected levels of congestion it appears that traffic control officers
did an exceptionally good job during the Andrew evacuation. It is also apparent that local
emergency management officials took seriously the clearance time data that had been
provided in study products.
RECOMMENDATIONS
Based on the Hurricane Andrew experience, it is recommended that the following
items be considered for future study efforts:
09-683.00B-\TLTHA\09683-01.RPTr 5-5

1. Enlarge the study area boundaries to include all regions in south Florida whosetraffic and sheltering needs will impact each other. Other states with multi-regional evacuation traffic impacts must have a plan to deal with these potentialproblems.
2. Restudy the lower southeast Florida area to include new land use distributionand increased participation percentages for residents in non-surge areas.
3. Encourage officials to lift the tolls on appropriate facilities as soon as ahurricane warning is posted for southeast Florida counties or any area servicedby toll roads.
4. Encourage the use of variable message signs that keep motorists informed oftraffic, storm, and sheltering information particularly as they approach in-landareas such as Orlando. Radio stations/EBS could broadcast currentinformation.
5. Encourage appropriate officials to have traffic counters operational on U.S. 1out of the Keys so that the flow of evacuation traffic out can be monitored andanalyzed. Other areas should also be counted to calibrate/validate evacuationdata.
6. Study the potential savings in clearance time by reverse laning certain local andregional highway facilities - likewise address opportunities and constraints thatrelate to implementing such measures.
7. Keep traffic signals functioning as long as possible so that law enforcementofficials are not consumed totally with traffic control. Signals should be set tofacilitate traffic flow as appropriate.
8. Use more cones to separate U.S. 1 and Card Sound Road diverted traffic in thenorth part of Monroe County to avoid last minute lane changes and mergingconflicts.
9. As appropriate, run more scenarios with smaller percentages of people going toin-county shelters.
10. Run additional scenarios with larger percent of non-surge evacuees evacuatingbased on potential behavioral trends related to Andrew and Hugo.
094683400B:\T'LTHA\09683-O1 .RP'T5- 5-6

Chapter 6
Evacuation Decision Making
Some of the most important products developed as a part of the FEMA/Corps of
Engineers hurricane evacuation studies and delivered to local and state officials have been
evacuation decision making tools. These tools are decision arc maps and tables as well as
computer software such as HURREVAC. These products graphically tie together real-time
storm characteristics with clearance time data. Their purpose is to give emergency
management directors a means of retrieving Technical Data Report information without
having to dig through a report during an emergency. Evacuation decision tools provide
guidance and assistance to decision makers as to when an evacuation should begin relative
to a specific hurricane, its associated wind field, forward speed, probabilities, forecast track,
and intensity.
Discussions initiated by the FEMA/Corps study team with local and state officials
regarding the evacuation decision process focused on the following questions:
When was the Emergency Operating Center fully activated and what
prompted this decision?
What study products/decision aides were used to decide when to evacuate
and who should evacuate?
When was the evacuation order or request made?
Table 5 summarizes the responses to each of these topics gathered in the lower
southeast Florida counties. Table 6 provides decision making information gathered for
other south Florida counties responding to Andrew.
As shown in the tables, most EOCs were fully activated Saturday evening or early
Sunday morning. Partial activations had occurred in most of the counties by Saturday
09-683.00B:\T'LT'HA\09683-O1 .RPT 6-1

m m minmM= =M =m m== mMllm
TABLE 5
Lower Southeast Florida CountiesEvacuation Decision Process
Location 'ime EOC Was Fully What Prompted Decision What Study Products Time of Evacuation How Well StudyActivated to Activate Decision Aids Were Used Order Products Work
in Deciding When and WhoShould Evacuate
Monroe County 2:00 AM 8122/92 Clearance tirnes/NIIC Decision Arcs - NWS ran 6:00 AM 8/23/92* WellData HURREVAC
Dade County 6:00 AM 8/23/92 NIIC Information Surge Maps, GDS, Decision 8:00 AM 8/23/92 Some ConcernsArcs, Zip Code AboutVulnerability IIURREVAC
and Surge Atlas
Broward County 6:()0 PM 8/22/92 Storm Inlormation HURREVAC Model, Surge 7:00 AM 8/23/92 WellMaps, Zone Map
Palm Beach County 10:00 AM 8/23/92 hurricane Warning GDS, I)raft Quads, 3:00 PM 8/23/92 Very WelliHURREVAC Model
*Permanent residents evacuation ordered.
09-683.00BA\ThTI A\09683-01 .RFI

m = -=- - -= -- m m m -=- - - - m
TABLE 6
Other South Florida CountiesEvacuation Decision Process
Iocation Time EOC Was Fully What Prompted Decision What Decision Aides Were Time of Evacuation How Well ExistingActivated to Activate Used in Deciding When and Order Products Work
Who Should Evacuate
Collier County 4:15 PM 8/22/92 Acceleration & Decision Arcs, GDS, SLOSH 8:0( a.m. 8/23/92 Very WellIntensification Atlas, NIIC Forecast recommended
Discussions 2:00 PM 8/23/92mandatory
Lee County 5:30 PM 8/22/92 Storm Information NI lC Forecasts, GDS, 3:0) I'M 8/23/92 WellREsponse Storm WorksheetSurge Maps VulnerabilityI)ata
Charlotte County 6:00 AM 8/23/92 Storm Information Surge Maps, Decision Arcs, 4:00 PM 8/23/92 WellNI IC Forecasts
Sarasota County 8:00 AM 8/23/92 Storm Inlormation Surge Maps, Decision Arcs, 2:30 I'M 8/23/92 WellSLOSI I Model
Martin County 6:00 PM 8/22/92 Acceleration & GDS, Decision Arcs 10:00 AM 8/23/92 WellIntensification
09-683.00BAM\MT\09683-01 .R1

afternoon August 22nd. Emergency management directors communicated with county
department heads on Saturday so that they would be ready to respond once the EOC
became fully operational and the evacuation initiated. Most emergency management
officials accelerated their early response actions based on discussions with National
Hurricane Center staff indicating that Andrew had increased its intensity and forward
speed.
Local officials seemed pleased with the way study products performed and found the
surge and evacuation zone mapping, decision arcs, and HURREVAC quite helpful. Many
communities relied upon GDS (a program developed by Hazards Management Group) and
found it also to work well. Dade County used GDS but not HURREVAC during Andrew.
Evacuation orders were released early Sunday morning and correspond with
hurricane warnings that were issued by the National Hurricane Center as well as time
requirements for carrying out a safe and orderly evacuation (as indicated by specific
clearance times that were incorporated into the decision making tools). Monroe County
set the order for six a.m. Sunday morning, having moved many of the tourists and
daytrippers as well as some permanent residents on Saturday afternoon and evening.
Florida Highway Patrolmen observed a steady stream of traffic leaving the Keys early
Sunday morning between midnight and 6 AM before the order was given. The use of Card
Sound Road for diverted U.S. Highway 1 traffic also allowed the county to wait until
Sunday morning to issue the order.
Broward and Dade Counties' evacuation orders were prompted by the National
Hurricane Center's warning. Because of its lower clearance time requirements, Palm Beach
County was able to wait later in the day on Sunday to issue the order.
RECOMMENDATIONS
Products being provided by FEMA/Corps hurricane studies regarding evacuation
decision making seem to be working well. Officials like the ability to show decision makers
a "computerized" data base that ties together Technical Data Report information. A
09-683.00B:\TL.THA\09683-O1.RPT6- 6-4

recommendation which was previously discussed in Chapter 2, is easier to read surge
mapping and zone maps at a larger more detailed scale. Excellent working relationships
between local emergency directors and NWS staff is important to good decision-making.
Local officials should be encouraged to continue to develop these relationships with NWS
staff.
09-683.00B:\TL.THA\09683-01.RPTr 6-5

Chapter 7
Public Information
Although not a major part of previous FEMA/Corps of Engineers hurricane
evacuation study efforts, public information is becoming recognized as an important final
element that must be addressed. Study products and data must ultimately be tailored to
a format that the media and general public can understand so that correct evacuation
decisions and preparations can be made at the household level. Andrew (like Hugo)
provided a glimpse of the current means of getting hurricane evacuation information into
the hands of the general public. Andrew also provided local and state officials with an
opportunity to assess additional needs regarding to public information.
Methods used in south Florida to inform the public in Andrew included the
following:
1. Public information brochures were developed and widely distributed early in theseason showing vulnerable areas, evacuation levels, and tips on hurricanepreparedness. Dade and Broward Counties are good examples of these. PalmBeach County printed its brochures in three languages - English, Spanish andCreole.
2. Press briefings with national and local media to insure that they (radio, TV,newspapers) disseminate consistent information to the public - Media weregiven packets of hurricane materials early in the season by some emergencyofficials.
3. Law enforcement officials drove through neighborhoods with sirens and p.a.systems to encourage people to evacuate - this technique was used in somebeach communities - some officials went door-to-door (e.g., Ocean ReefCommunity in Monroe County).
4. Some communities were able to provide evacuation information to the publicthrough printed information in the local phone book.
5. An important means was through radio and television - some communities usedcable TV overrides to alert the public of evacuation advisories.
6. The Weather Channel was praised by local emergency management staff for itsjob in public education and information.
09-683.00B:\TLT'HA\09683-01.RPT 7-7-1

7. Early in the season, meetings had been held with civic groups (e.g., MiamiBeach) at which local emergency directors made presentations on hurricanepreparedness including wind and flooding potential.
8. Mobile home park/managers were phoned to make sure they understood thethreat.
9. In southwest Florida at least one county made use of flash cards/coloring booksthat educated school children on hurricane preparedness.
10. During the Andrew situation, Bryan Norcross of Channel 4 TV, Miamibroadcast public information through the night to local residents. Channel 10enhanced their public information activity with signing for deaf viewers.
RECOMMENDATIONS
In discussions with media representatives in the Miami, Florida market and with all
of the local and state emergency officials, the following ideas and resources were identified
as needs in the area of public information.
- More camera ready/computerized mapping of surge areas, routes, and shelterlocations for media (must be able to update shelter information at least yearly).
- Computerized "billboard" only available to media via modem - emergencyofficials would provide notices and information through this.
- Need to address Emergency Broadcast System (EBS) operation - many officialsare unhappy with it contending that it is out of date and more geared fornuclear emergencies.
- Need more phone lines/staff for public to call into EOC's for information -Dade County expressed major concerns with this.
- Prepare newspaper supplement in advance that could be inserted a day beforeprojected hurricane landfall.
- Enhance phone book materials and inserts that can be used in a real time event.
- Produce canned videos for TV's to broadcast.
- Provide more local information (surge heights imposed on pictures of locallandmarks) to get public attention.
- Install uniform evacuation route signs.
09-683.00B:\TLTHA\09683-01.RPT 7-2

- Put up variable message signs giving inland shelter/EBS station information.
- Need more funding sources for printing and distributing county brochures.
- Press tends to go where the most action is - this resulted in little media coverageof Monroe County and left many wondering what was going on and whathappened there. Need to have an EOC facility in Monroe County that canbetter accommodate media interests.
09-683.00B:\TLTHA\09683-Ol.RPT 7-3

APPENDIX A
Meeting Attendees/Persons Providing Inputin Affected Areas
09-683.00B:\TLTHA\09683-01.RPT

Arnold, GaryBaker, MicheleBalfour, Robert A.Boyer, SteveCarrick, GradyCoats, LisaConley, EdwardDavis, MarvinEans, Andrew C.Elsroth, WaltEsper, Todd K.Feagan, GreggFloyd, BillGavin, JoeHahn, ChristyHale, KateHenderson, WinHenize, DennisKennedy, B.T.Kennington, JudiKerley, GeorgeKoneval, R.W.Lange, Sgt. MelLeonard, CherylLewis, DonLondon, J.G. "Joe"Mappes, LeonMartens, BrianMassey, BillMcDonald, MichaelMcDuffie, A.Meyer, CharlesMulhall, TomMurphy, FredNave, BobOgle, JimOwens, EarlPelham, BoPineau, KenPray, David F.Putnam, DonQuingly, William F.Reitman, SySallade, Wayne P.Sanchez, VirginiaSaniter, David
Collier County EMMetro Dade Emergency ManagementNational Weather Service (SW Fla.)WPLG-CH-10Florida Highway PatrolOcean Reef Public SafetyFEMA - JICFEMA - JICMonroe County Emergency Mgt.Lee Emergency ManagementDeSoto County Emergency ManagementSarasota County EMLee County Red CrossUS Army Corps of Engineers - Philadelphia PACongressman Porter GossMetro Dade Emergency ManagementFEMA PIONAT WEA Svc.Palm Beach EOC Emerg. Mgmt. DirectorHendry County Emergency ManagementMonroe County Emergency Comm.Charlotte County EMBroward County Sheriff's OfficeBroward EPDPBS&JMonroe County Fire MarshallCharlotte County Chapter - ARCOcean Reef Public SafetyFEMA - AtlantaFlorida - DCA/DEMU.S. Army Corps of Engineers - Wilmington, NCWIOD RadioMonroe Emergency Mgmt./Florida EOC MIS/SystemsPasco County Dis. Prep./FEPAFlorida DCA/Division of Emerg. Mgmt.WTVJDeSoto County RACES MARS - ARES ECAClewiston Emergency ManagementCollier County Emergency Mgt.Charlotte County Chapter - ARCCharlotte County Chapter - Red CrossSarasota County Emergency ManagementUS Army Corps of Engineers - AtlantaCharlotte County EMDade County CommunicationsLee County Emergency Management

Shermean, DickSmith, CharlesSt. Amand, ArtTipton, RoyceTrescott, DanVarcinas, Paul V.Vergara, HernandoWagner, William A., IIIWagner, BillyWatsow, JackWendling, ThomWerner, Robert D.Westall, RodWilson, John
Collier County Red CrossARC Highlands Co.Broward EPDUS Army Corps of Engineers - JacksonvilleSouthwest Fl. RPCOcean Reef Public SafetyMetro Dade Emergency ManagementMid Keys EM Deputy Fire MarshallMonroe County EMMonroe County Fire DepartmentSanibel PDDeSoto County RACES & ARES ECAFlorida DCA/Division of Emerg. Mgmt.Lee County Emergency Management

APPENDIX B
National Hurricane Center'sHurricane Andrew Warning Summary/Timetable
09-683.00B:\T.T'HA\09683-01.RPT

Watch and Warning Summary, Hurricane Andrew, August 1992
date/time (military/EDT)action
22/1100Hurricane Watch
Northwest Bahamas from Andros and Eleuthera IslandsNorthward through Grand Bahama and Great Abaco
Northwest Bahamas from Andros and Eleuthera IslandsNorthward through Grand Bahama and Great Abaco
22/1700Hurricane Warning
22/1700Hurricane Watch
23/0200Hurricane Warning
23/0800Hurricane WarningBay
23/0800Tropical Storm Warning
23/0800greaterHurricane Watch
Florida East Coast from Titusville Southward throughthe Florida Keys including Dry Tortugas
Central Bahamas including Cat Island, Great Exuma,San Salvador, and Long Island
Florida East Coast from Vero Beach Southward throughthe Florida Keys to the Dry Tortugas including Florida
Florida East Coast North of Vero Beach to Titusville
Florida West Coast South of Bayport including the
Tampa area to north of Flamingo
23/1400OkeechobeeHurricane Warning
23/1400Tropical Storm Warning
24/0500Hurricane Warning Discont.
24/0900Hurricane Warning Discont.
24/0900Hurricane Warning Discont.
Florida West Coast South of Venice and Lake
Florida West Coast North of Venice to Bayport
Bahamas except for Bimini and Grand Bahama
Remainder of the Bahamas
Florida Except for Lake Okeechobee and the West CoastSouth of Venice to Flamingo
09-683.00B:\TLTHA\09683-Ot.RPT

Watch and Warning Summary, Hurricane Andrew, August 1992
date/time (military/EDT)action
24/0900 Northern Gulf coast from Mobile, Alabama to SabineHurricane Watch Pass, Texas
24/1400 Remainder of FloridaHurricane Warning Discont.
24/1700 Northern Gulf Coast from Pascagoula, Mississippi toHurricane Warning Vermillion Bay, Louisiana
25/0500 Vermillion Bay, Louisiana to Port Arthur, TexasHurricane Warning
25/0500 West of Port Arthur through High Island, TexasHurricane Watch
25/1100 West of Port Arthus through the Bolivar Peninsula, TXHurricane Warning
25/1100 West of the Bolivar Peninsula to Freeport, TexasHurricane Watch
26/0300 East of Grand Isle, LouisianaHurricane Warning Discont.
26/0700 West of the Bolivar PeninsulaHurricane Watch Discont.
26/0700 West of Port Arthur, TexasHurricane Warning Discont.
26/0900 West of Cameron, LouisianaHurricane Warning Discont.
26/1300 Remainder of Gulf CoastHurricane Warning Discont.
09-683.00B:\T'LT'HA\09683-01.RPT

* -V., .
48-~~
357
I - . - L :-I - - i , - - - - ---
. I . . .
. V..':.. 'Ar .1. I- :.
rf: ". . .
*.. 0
ANDRE
-Hurricanew-- Tropical Storn
Tropical Depr.+ + ExtratropicalA A Subtropical StnA A Subtropical Dep
0 Position 3 12 UTCI Psn/Dats U 86 UTC
PPP "in. Pro%. (Mb)
I I L .- 7-..- 1 - 4 - 4 -.--_ . , _ *,
* ..2'
H.A;2 9 :'I..
I../1
I . i.- i v--- - - -- - i i t i.A_
26
25
4...
... !. . .
..t.
*I I * - - I -I - I I . I .
1)0 -. . 01% I.d - -
>.. .
. . . 0O
v iI I R, - I - - I --e-' 2" E! -W--Q . - la i i , i I20. i. �
'rI- I-SL')
. .
Jr .
as %0.'
.4...
jq .I-C,-4 1-4- -12--A - I - 1 - i , i -- i i !--- -- b:-- i , i - - !
._ -
. .
. .
. .' < .
. . . I
. . . k
. . . O .
Z-gm'-�C(
a -% 1.61,
. . 18
I . . . .. ... I
10 - - -- r--- I - - Ul --N. - I - ---- 4 1 # P.--+- - � -'r - %Iet I i II...T -
i - - - : 7
I. .
am I - I I F I - 1 f 1 � t I , 1 I' im't I - , I i I
5 98:9:8fS .Ble IEIEE
75LE0 E f78 65
1). � . . �
U�rlso 19
. al3555
Best track positions for Hurricane Andrew.

APPENDIX C
Hurricane Andrew Response Questionnaire
09-683.00B:\TLTHA\09683-01.RpTr

HURRICANE ANDREWRESPONSE QUESTIONNAIRE
To refresh your memory about dates and times, on Saturday August 22 hurricane Andrew began to look Like itcould hit south Florida. At 5 p.m. on Saturday evening the National Hurricane Center issued a HurricaneWatch for the east coast of Florida. At 8 a.m. the following morning -- i.e., Sunday morning -- theHurricane Center issued a Hurricane Warning. Landfall occurred early Monday morning, around 5 a.m.
1. Were you in the area (i.e., not out-of-town) when Andrew began to "reaten this area?
IF NO, ASK IF ANYONE ELSE IN THE HOUSEHOLD WAS PRESENT AND ASK TO SPEAK TO THEM. IF NO ONE IN THEHOUSEHOLD WAS PRESENT, TERMINATE THE INTERVIEW.
IF YES, BEGIN WITH QUESTION 2.
2. I'd like to ask you about when Andrew threatened this area -- that is, on Saturday August 22 orSunday the 23rd. Did you Leave your home to go someplace safer before the hurricane?
1 No (GO. TO Q. 3)5 Yes (GO TO Q. 4)7 Other(
Specify9 Don't Know
3. What made you decide not to go anyplace else?
CODE UP TO 3 RESPONSES ...THEN GO TO Q. 14.
01 Storm not severe/house adequate02 Officials said evacuation unnecessary03 Media said evacuation unnecessary04 Friend/relative said evacuation unnecessary05 Officials didn't say to evacuate06 Probabilities indicated low chance of hit07 Other information indicated storm wouldn't hit08 Had no transportation09 Had no place to go10 Wanted to protect property from looters11 Wanted to protect property form storm12 Left unnecessarily in past storms13 Job required staying14 Too dangerous to evacuate15 Other (
Specify)99 Don't Know
4. Did you go to a public shelter, a friend or relative's house, a hotel, or somewhere else?
1 Public Shelter (Red Cross)2 Church3 Friend/Relative4 Hotel/Motel5 Mobile home park clubhouse7 Other( )
Specify9 Don't Know
5. Where was that Located?
1 In same county as residence __)
Name of City5 Out of County __)
Name of City, County, State9 Don't Know

2
6. What convinced you to go someplace safer?
(CODE UP TO 3 RESPONSES.)
01 Advice or order by elected officials02 Advice from Weather Service03 Advice/order from police officer or fire fighter04 Advice from media05 Advice from friend or relative06 Concern about severity of storm07 Concern that storm might hit08 Heard probability (odds) of hit09 Other (_)
Specify99 Don't Know
7. When did you leave your home to go someplace safer?
a. Time: :
b. (1) AM(5) PM
Augustc. Date: Thu Fri Sat Sun Mon
20 21 22 23 24
8. How long did it take you to get to where you were going?
_. Hours (to nearest 1/2 hour)
Never reached original destination 99.9
9. Did you or anyone in your household require assistance in evacuating, and if so, by whom?
1 Yes, by agency3 Yes, by friend or relative within household5 Yes, by friend or relative outside household7 No9 Don't Know I
10. How many vehicles were available in your household which you could have used in evacuating?
Number of Vehicles IF "NONE" GO TO Q. 11,OTHERWISE GO TO Q 12.
11. Did your household leave with someone else in their vehicle, did you use public
transportation, or did you evacuate another way?
1 Other's vehicle5 Public Transportation7 Other( )
Specify9 Don't Know
GO TO 0. 14.
12. How many vehicles did your household take in evacuating?
| Number of Vehicles

3
13. When you evacuated, did you pull a trailer, boat, motor home, or camper?
1 Yes5 No7 Other( )
Specify
14. Did you hear anyone in an official position -- emergency management, police, etc. -- say that youshould evacuate to a safer place?
1 Yes IF YES, GO TO Q. 155 No IF NO, GO TO Q. 179 Don't Know IF DK, GO TO Q. 17
15. Did they say that you should evacuate or that you must evacuate?
1 Should5 Must9 Don't Know
16. Did police or other authorities come into your neighborhood going door-to-door or withloudspeakers, telling people to evacuate?
1 Yes5 No9 Don't Know
17. How well do you think the warning and evacuation process was handlcd in Anc.rew? (PROBE: What wasthe problem?)
(CODE UP TO 3 RESPONSES)
1 Good/OK2 Traffic a problem3 Transportation a problem4 Shelters a problem5 Shouldn't have been told to evacuate6 Should have been told to evacuate earlier7 Should have told more people to evacuate8 Other( )
Specify9 Don't Know
18. Would you do anything differently in the same situation again? (PROBE WHY?)
CODE UP TO 3 RESPONSES
1 Would evacuate2 Wouldn't evacuate3 Would leave earlier4 Would wait later to Leave5 Would go further away6 Wouldn't go as far away7 Would go to public shelter8 Wouldn't go to public shelter9 No10 Other ( )
Specify99 Don't Know

4
19. If the track of the storm had been different, do you think it could have caused flooding in yourhouse?
1 Yes5 No9 Don't Know
20. Before the storm, did you know whether you lived in a zone that would need to evacuate in a Category4 hurricane like Andrew?
1 Yes5 No9 Don't Know
21. Before the storm, had you ever seen a hurricane brochure with a map or List of areas that would needto evacuate?
1 Yes5 No9 Don't Know
22. Before the storm, had you made any plans about whether you would evacuate and where you would go ifa hurricane threatened?
1 Yes5 No9 Don't Know
23. How strong do you think the strongest sustained winds were that did the worst damage to houses inAndrew? (if needed: sustainded winds 30 feet above the ground).
1 Less than 100 MPH2 100 MPH to 124 MPH3 125 MPH to 149 MPH4 150 MPH to 174 MPH5 175 MPH to 199 MPH6 200 MPH or more9 Don't Know
24. Many houses in south Dade county were severely damaged or destroye.. . .c of the followingexplanations do you think accounts for most of the damage?
1 The houses were poorly built and didn't meet the building code.3 The houses met the building code, but the code wasn't adequate
to prevent severe damage in a storm as strong as Andrew.5 Don't Know
25. Do you believe that affordable housing can be built to withstand a storm Like Andrew without beingseverely damaged?
1 Yes5 No9 Don't Know

5
26. If Andrew's strongest winds had hit your home, do you believe there would have been enough damage tomake it dangerous to your safety if you had been in the home?
1 Yes5 No9 Don't Know
27. Should building codes in your community be stronger, even if it increased the cost of construction?
1 Yes5 No7 Depends how much increase in cost9 Don't Know
28. Should your community spend more on building inspectionthe cost of building permit fees?
and code enforcement, even if it increased
1 Yes5 No7 Depends how much increase in cost9 Don't Know
29. Should mobile homes be banned in your community because of their lack of safety in hurricanes?
1 Yes5 No9 Don't Know
30. If another strong hurricane threatened, and public safety officials ordered you to evacuate, what
would you do?
1 Evacuate within same county3 Evacuate outside county5 Wouldn't evacuate7 Other (
Specify9 Don't Know
31. If another hurricane threatened, and public officials said that people in your neighborhood should
not evacuate because your area won't flood and because the roads would be clogged with traffic if
people from your area tried to evacuate, what would you do?
1 Evacuate within same county3 Evacuate outside county5 Wouldn't evacuate7 Other( )
Specify9 Don't Know

6
32. Was anyone in your household seriously injured in the storm?
1 Yes5 No9 Don't Know
33. In dollars, about how much damage did your home experience?
0 Less than $1001 $100 to $9992 $1,000 to $4,9993 $5,000 to $9,9994 $10,000 to $24,9995 $25,000 to $49,9996 $50,000 or more7 Don't Know9 Refused to Answer
34. Could you live in your house after the storm?
1 Yes5 No9 Don't Know
35. Which of the following types of structures do you live in? Do you Live in a:
1 Detached single family home?2 Duplex, triplex, quadruple home?3 Multi-family building -- 4 stories or Less4 Multi-family building -- more than 4 stories5 Mobile home6 Some other type of structure7 Don't know9 Refused
36. How old were you on your last birthday?
37.
38.
I| _ Number of years I
How long have you lived in your present home?
I __Number of years
How long have you lived in south Florida?
| Number of years

7
39. How many people live in your household, including yourself?
_ Number of people
40. How many of these are children, 17 or younger?
41.
42.
I __Number of children
Do you have any pets?
1 Yes3 No9 Refused
How would you describe your racial group?
1 White3 Black5 Hispanic7 Other (9 Refused
43. Have you ever been in any other hurricanes?
1 Yes (Specify name, year, location
3 No9 Don't know
44. Which of the following ranges describes your household income for a year?
1 Less than $12,0002 $12,000 to $24,9993 $25,000 to $39,9994 S40,000 to $79,0005 Over $80,0009 Refused
APPENDIX D
Directional Traffic Counts During Hurricane Andrew
09-683.00B:\TLTHA\09683-01 .RPT

Station 178: Dade CountyUS-1, South of Granada Blvd, Miami
5000
4500
4000
3500aE
. 3000/0
2500/0
2000D0z
150
1000,
500-
01:00 2:00 3:00 4:00 5:00 6:00 7:00 8:00 9:00 10:0011:0012:0013:0014:0015:0016:0017:00
Time
-|- August 2 - August 9 EB August 23
Station 178: Dade CountyUS-1, South of Granada Blvd, Miami
5000
4500
4000
3500
. 30000
25000
.0
2000-0
1500-
1 000-
1:00 2:00 3:00 4:00 5:00 6:00 7:00 8:00 9:0010:0011:0012:0013:0014:0015:0016:0017:00Time
|-_ August 2 1 August 9 i- August23

Station 111: Dade CountySR 7/US 441, S of NW 46th St. in Miami
5000-
4500'
4000'
3500
3 3000
25000.0U 2000-0z
1500'
1000- , C
500
0~1:00 2:00 3:00 4:00 5:00 6:00 7:00 8:00 9:00 1o:00 11:00 12:00 13:00 14:00 15:00 16:00
Time
-- August 2 i August 9 August 16 EEB August 23
Station 111: Dade CountySR 7/US 441, S of NW 46th St. in Miami
5000-
4500-
4000-
3500
.23000-0
: 2500-.0.CIs 2000-0
1500-
1000-
500-
01:00 2:00 3:00 4:00 5:00 6:00 7:00 8:00 9:00 10:00 11:00 12:00 13:00 14:00 15:00 16:00
Time
-- August 2 -I-- August 9 August 16 EE3 August 23

Station 174: Palm Beach County1-95, SE of Congress Ave, WPB
5000
4500-
4000
3500 /r \E
3 3000->
2500-
1 20000
1500,
1000-
500
1:00 2:00 3:00 4:00 5:00 6:00 7:00 8:00 9:00 10:0011:0012:0013:0014:0015:0016:0017:0018:00Time
-|I- August 2 - August 9 -O-August 16 EF August23
Station 174: Palm Beach County1-95, SE of Congress Ave. WPB
5000
4500-
4000
3500
3000
2500-0
2000-0
1500-
1000-
500-
1:00 2:00 3:00 4:00 5:00 6:00 7:00 8:00 9:0010:0011:0012:0013:0014:0015:0016:0017:0018:00Time
-|- August 2 - August9 -OK-August 16 E3 August23
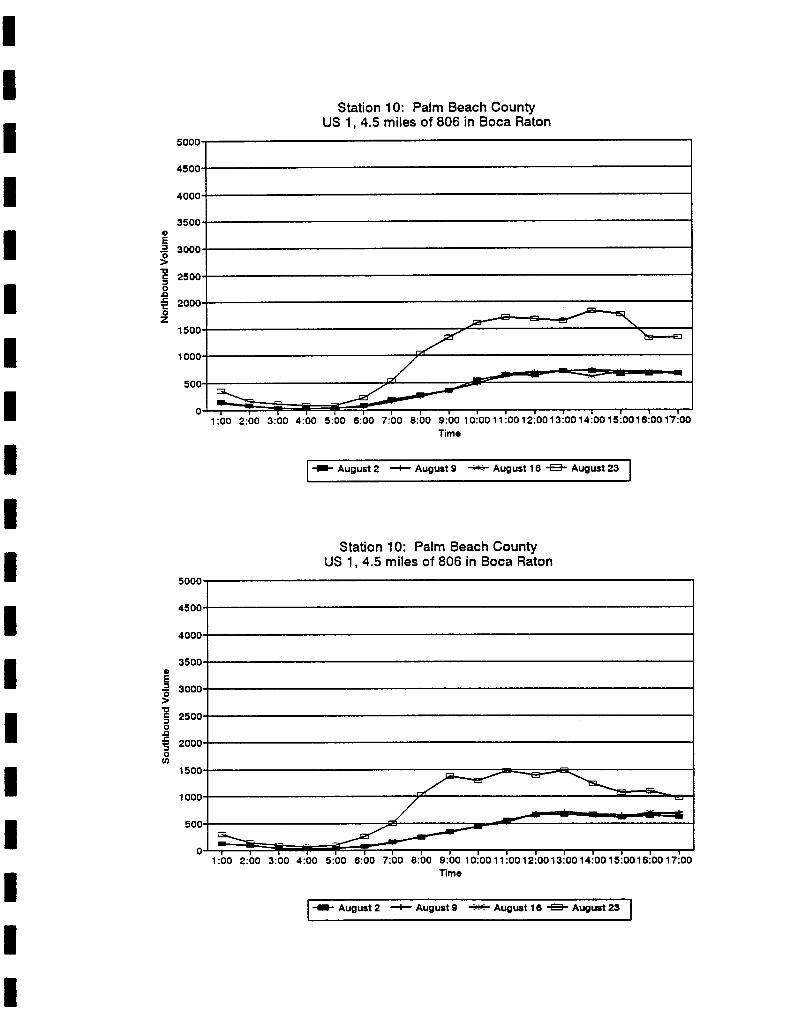
Station 10: Palm Beach CountyUS 1, 4.5 miles of 806 in Boca Raton
5000
4500-
4000-
3500E
. 3000
25000-o' 20000z
1500-
1000.
500
01:00 2:00 3:00 4:00 5:00 6:00 7:00 8:00 9:00 10:0011:0012:0013:0014:0015:0016:0017:00
Time
| _ August 2 1 August 9 -*- August 16 EF August23
Station 10: Palm Beach CountyUS 1, 4.5 miles of 806 in Boca Raton
5000-
4500-
4000-
3500-E
.2 3000-
~0to 250000.0
1500-
1000-
500
1:00 2:00 3:00 4:00 5:00 6:00 7:00 8:00 9:00 10:0011:0012:0013:0014:0015:0016:0017:00lime
I-_ August 2 a August 9 -WT-August 16 CB August23

Station 96: Dade CountySR 9, 0.4 miles SW of Biscayne Canal Br
gg.fnl
ARO 4-
AAnn^ J.
1500 I
= 3000a
C 25000.0
.1.
+
0z2000-
1500 -
1000--
~~nn- - /n I__
I I I I Iu
1:00 2:00 3:00 4:00 5:00 6:00 7:00 8:00 9:00 10:0011:0012:0013:0014:0015:0016:0017:00Time
-- August 2 -I August9 -- oAugust 16 EE- August23
Station 96: Dade CountySR 9, 0.4 miles SW of Biscayne Canal Br
rnnn.
A4nn *
4000
-afnne
0 3000-0
C 25000
S 2000-0CO
I SOD
i nnnA f
'Inn I
2 P0-- -- ��
^_ _no v v1:00 2:00 3:00 4:00 5:00 6:00 7:00 8:00 9:00 10:00 11:00 12:00 13:00 14:00 15:00 16:00
Time
-- August 2 -I- August 9 August 16 -1- August 23

0-0-00-olowd-
io-0.00040010
1ib
x
ol'o. C)ca cAut - tog W- -F ort II"-see I 't s,.et 4fos CoveOO& disas'Weao� - V,
�ve, qa�L *avp�-Toibabkl 0aIs

3 6668 14117345 2 IIIIIIIIIIIII