h t t p s: / / www. d i vi d e n d ma x. co m d i vi d e n ... · e a ch t o o l l e ve ra g e s o...
TRANSCRIPT

https://www.dividendmax.com
DividendMax Tutorial DividendMax is a suite of tools to help private investors select and track their investments. Each tool leverages our dataset of over 1000 companies with 600+ in the UK, 200+ in the US and 220+ in Europe.
A note about our projections For each share we produce dividend projections going forward 2 years. Our accuracy has proven to be extremely good, with 79% being exactly right or within a 10% variance. You can read more about how we make our projections here: https://www.dividendmax.com/about/dividend-projection-accuracy
Content is provided for information purposes only and does not constitute advice. Investing in shares involves capital risk, please contact your financial advisor for independent advice.

OptimizerMax The flagship product is a stock-selection tool. It highlights shares that are promising a good yield over the short to medium term. It does this by adding together upcoming dividends and calculating an annual yield. Yield is a calculation of the dividend payments over the latest share price. Large dividend payments and a low share price means a high yield. Due to the way many UK companies split their annual dividends into an interim and final payment, with the final often consisting about ⅔ of the total, we can use OptimizerMax to find some very good yields. This works especially well when a company is about to have a final dividend, followed by an interim in 6 months, and another final dividend 6 months after that. To start the default Duration is set to 3 Dividends. This orders the shares matching our filter with the biggest annualized yield over the next 3 dividends at the top:
OptimizerMax Filter Box (collapsed)
We annualize the yield rather than taking the total yield since some companies may pay quarterly (4 dividends per year) and some may pay annually (one per year). By annualizing the yield we get a fair comparison. At the time of writing Petrofac had the highest annualized yield over the next 3 dividends matching our default filter criteria:
Content is provided for information purposes only and does not constitute advice. Investing in shares involves capital risk, please contact your financial advisor for independent advice.

Individual OptimizerMax share view This shows that if you buy Petrofac before 21st September this year and hold it until 20th September next year, you will receive a total dividend yield of 16% based on the latest close price. Because this is greater than one year we annualize that total yield to 14% for easy comparison. Click SEE MORE to expand the Petrofac share view which reveals further details:
Expanded OptimizerMax Share view This expands the share to show a brief description of the company and the details of the 3 individual dividend projections. Also shown is some relevant company information:
1. The Market Cap is the market value of the company, calculated by multiplying the number of shares in issue by the latest share price.
2. The Cover is the number of times the dividend per share is covered by earnings per share. A cover of 1 means that the dividend is exactly covered by earnings. The higher the Cover the more able the company is to pay the dividend.
3. CADI is the Consecutive Annual Dividend Increases, this is the number of years historically that this company has been increasing its dividend on an annual basis. The most reliable dividend payers will continue to increase their payments year after year, even in a recession.
4. FDI is the Forecast Dividend Increase, this is the percentage we are expecting the annual dividend to increase by next year. If this is negative it means we are forecasting a cut.
Content is provided for information purposes only and does not constitute advice. Investing in shares involves capital risk, please contact your financial advisor for independent advice.

Content is provided for information purposes only and does not constitute advice. Investing in shares involves capital risk, please contact your financial advisor for independent advice.

Filters Different investors have different appetite for risk and our filters cater to this. Click the red button to expand the filter:
Expand Filter Button
This reveals all the filter options:
Expanded Filter view
By default the filter selects only larger companies (market cap over 1bn) with dividend cover of 2 or more, consecutive annual dividend increases of 2+ years and which are forecast to increase their dividend next year. The investor may be wary of companies with a very high yield, so the tool allows the user to mitigate risk by providing filters that help to identify safer dividends. By changing these values the resulting list of matching shares updates automatically. You can limit the results to a particular index (e.g. the FTSE 100) or a sector (e.g. Banks), as well as the Market Cap, Cover, CADI and FDI described above. The results of OptimizerMax are intended to identify potential investment opportunities which require further investigation. Investors must conduct their own research, and a company’s appearance in the list should in no way be considered a recommendation.
Content is provided for information purposes only and does not constitute advice. Investing in shares involves capital risk, please contact your financial advisor for independent advice.

How to use OptimizerMax in a trading strategy By identifying a high-yield such as Petrofac shown above, the investor is expecting an annualized return of 14% based on the price of £4.47. Should the share price move up by 14% within the year, the investor may choose to take the target return early by selling and realise that gain. In doing so they may forego dividend(s) but have received their 14% return earlier than expected. This is what we call the ‘option trade’ and it can be an effective trading strategy at a time when buy and hold is less lucrative than in the past. This is advantageous to many (but not all) investors because capital gains tax is lower than income tax. The preservation of capital is of great importance to all investors and this is more likely when a company is likely to increase their dividends over time. By using the FDI (Forecast Dividend Increase) filter the investor can select only companies which are expected to increase their dividend in the coming year.
Content is provided for information purposes only and does not constitute advice. Investing in shares involves capital risk, please contact your financial advisor for independent advice.

CountdownMax Some investors may be interested in “dividend capture”: That is, buying a share before it goes ex-dividend to pick up the individual dividend and selling afterwards when the share price has recovered from the ex-dividend effect. CountdownMax lists all upcoming declared and forecast dividends over the next 90 days with the gross return calculated. This return value is the amount of the individual dividend over the share price, expressed as a percentage. E.g., a share price of £1.00 and a dividend of £0.03 would have a yield of 3% from that single dividend. Be aware the share price will usually fall by the amount of the dividend on the ex-dividend date. A strategy of dividend capture can be very hit and miss and we would not advocate it. The filter allows you to select shares by sector, index and dividend status (declared or forecast).
Content is provided for information purposes only and does not constitute advice. Investing in shares involves capital risk, please contact your financial advisor for independent advice.

GeneratorMax In order to track your portfolio of shares we provide GeneratorMax. This keeps track of all dividend payments so you know how much capital gain plus income you have received, thereby giving you a complete view of your investment performance. Also using our forecast dividend data, GeneratorMax give you a view of future dividend payments 2 years ahead. This is useful for individuals managing their own SIPP (pension) as a tool for income planning. Some investors use GeneratorMax to find companies paying good yields at certain times. This strategy means you can evenly space dividend payments throughout the year. The yield per £1000 invested is provided for easy comparison.
New Portfolio
To get started click then enter a name and opening balance and click Create My Portfolio:
New Portfolio Form
Content is provided for information purposes only and does not constitute advice. Investing in shares involves capital risk, please contact your financial advisor for independent advice.

Add Transactions You are then taken to the New Transaction form where you can enter a purchase transaction.
New share purchase transaction form Here you can select a share you have purchased for the portfolio, enter the date and time, quantity, purchase price and an optional commission. If you have purchased a non-UK share, an automatic currency conversion is included too. Here I am entering a purchase of 10 Apple shares for $146.90 each, with a broker commission of $2.99.
Share purchase transaction for 10 Apple shares on May 1st
Content is provided for information purposes only and does not constitute advice. Investing in shares involves capital risk, please contact your financial advisor for independent advice.

Once I have entered the correct details I click Create Transaction and am taken to the transaction list for this portfolio.
Transaction List Here you will see the dividend payment on May 18th has been automatically created as well. Note: all values are converted to GBP for consistent totalling and easy comparison.
Portfolio transaction list including the dividend payment
By scrolling up you will see the portfolio performance:
Portfolio performance with 1 holding
Our Apple purchase of £1,137.70 is deducted from our cash balance, and the dividend of £4.83 is added to give a current balance of £1,867. With the dividend and capital gain of Apple we have yielded a total gain of 0.6%, based on the latest closing price and exchange rate data.
Portfolio Performance By clicking the Portfolio Performance tab you will see the breakdown:
Portfolio Performance tab showing individual holdings Here we can see the average price paid (in GBP), total outlay (including commission and stamp duty if any), dividends received and current market value. Based on the price paid and current market value we can see a capital gain of 0.19%. Adding in the dividends received shows our total gain of 0.62% Repeat the process of adding transactions so that your portfolio is complete.
Content is provided for information purposes only and does not constitute advice. Investing in shares involves capital risk, please contact your financial advisor for independent advice.
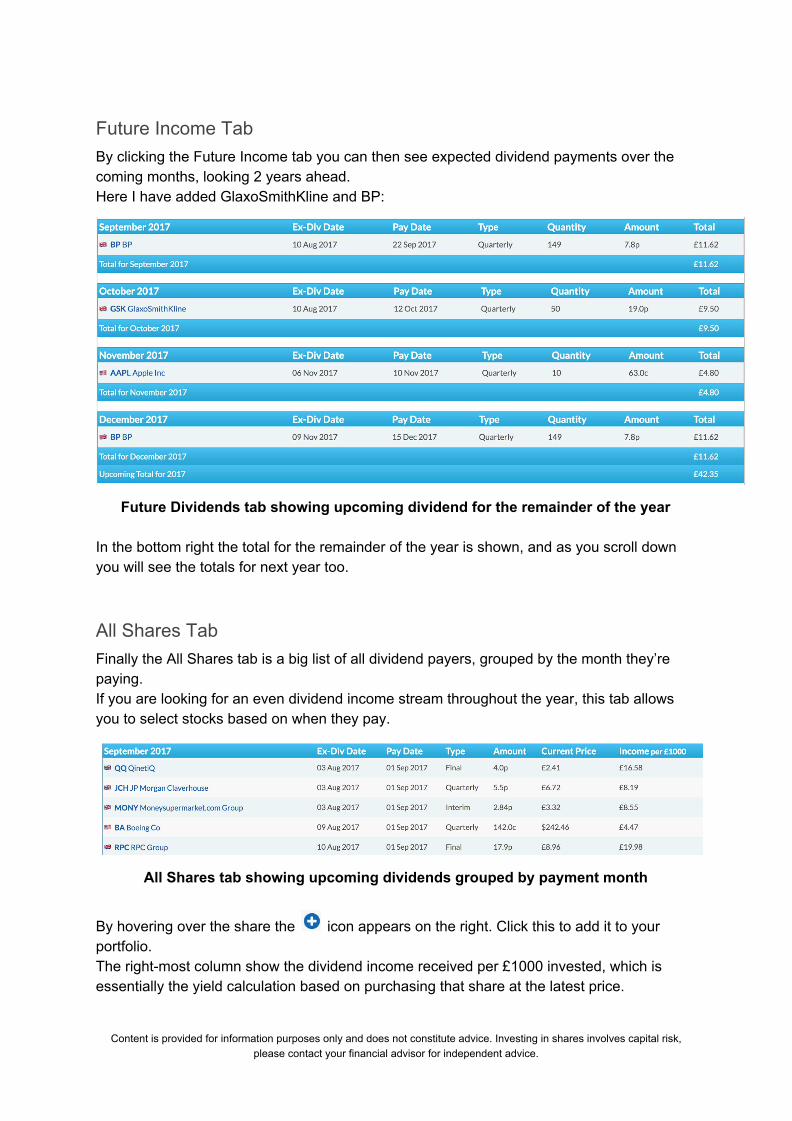
Future Income Tab By clicking the Future Income tab you can then see expected dividend payments over the coming months, looking 2 years ahead. Here I have added GlaxoSmithKline and BP:
Future Dividends tab showing upcoming dividend for the remainder of the year In the bottom right the total for the remainder of the year is shown, and as you scroll down you will see the totals for next year too.
All Shares Tab Finally the All Shares tab is a big list of all dividend payers, grouped by the month they’re paying. If you are looking for an even dividend income stream throughout the year, this tab allows you to select stocks based on when they pay.
All Shares tab showing upcoming dividends grouped by payment month
By hovering over the share the icon appears on the right. Click this to add it to your portfolio. The right-most column show the dividend income received per £1000 invested, which is essentially the yield calculation based on purchasing that share at the latest price.
Content is provided for information purposes only and does not constitute advice. Investing in shares involves capital risk, please contact your financial advisor for independent advice.
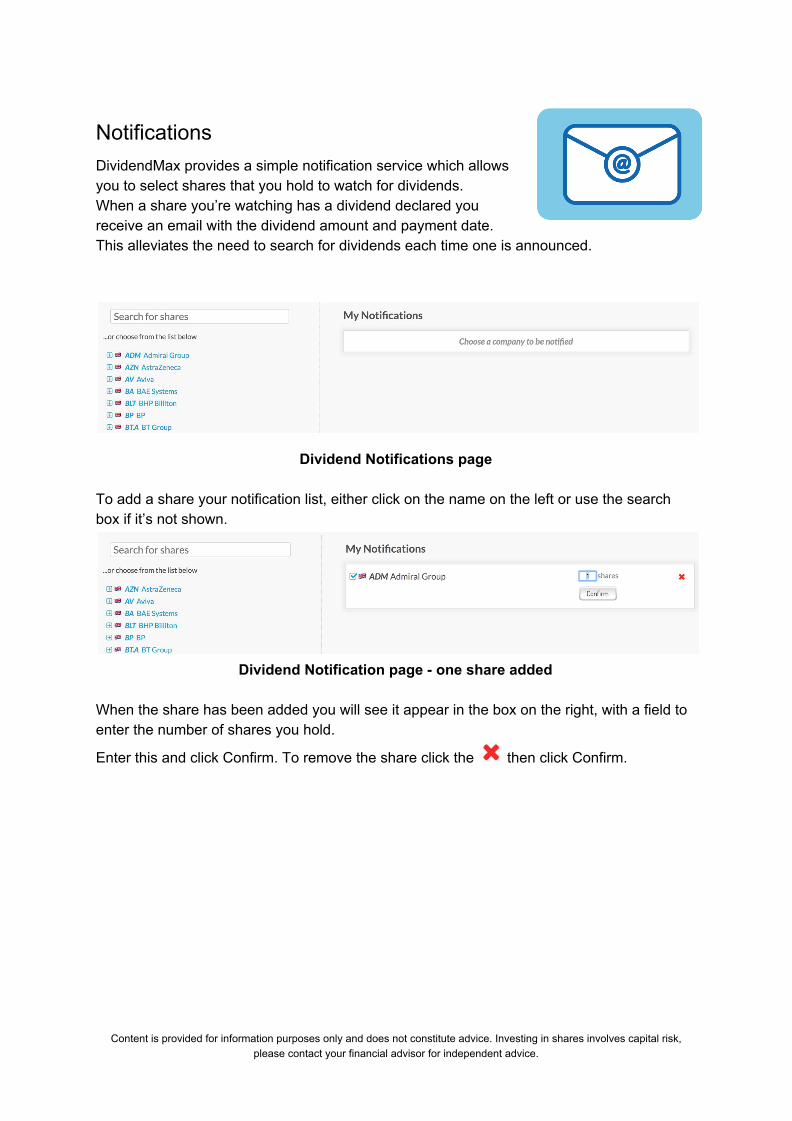
Notifications DividendMax provides a simple notification service which allows you to select shares that you hold to watch for dividends. When a share you’re watching has a dividend declared you receive an email with the dividend amount and payment date. This alleviates the need to search for dividends each time one is announced.
Dividend Notifications page
To add a share your notification list, either click on the name on the left or use the search box if it’s not shown.
Dividend Notification page - one share added
When the share has been added you will see it appear in the box on the right, with a field to enter the number of shares you hold.
Enter this and click Confirm. To remove the share click the then click Confirm.
Content is provided for information purposes only and does not constitute advice. Investing in shares involves capital risk, please contact your financial advisor for independent advice.

Portfolios
The Annual DividendMax Model Portfolio At the beginning of every year our chairman selects his suggested portfolio for the coming year. This is a passive portfolio based upon conditions as at 1st January. This includes a sector analysis and a table showing the weighting given to each share, with explanation of the selections.
The DividendMax Trading Portfolio Our chairman has been running the trading portfolio since 2011, leveraging the DividendMax tools. All of the transactions are recorded in GeneratorMax and available to subscribers to see the performance and follow the trades. The equities in the portfolio are selected based upon the Optimizer with further research and the use of market knowledge.
Content is provided for information purposes only and does not constitute advice. Investing in shares involves capital risk, please contact your financial advisor for independent advice.