gw3 trbo kpi software version 2.16chapter 2 using kpi this chapter provides instructions on...
TRANSCRIPT

GW3-TRBO® KPI
Software Version 2.16.15 Module Book
600-2.16.15-UU.1 4/8/2020

2 600-2.16.15-UU.1

3 600-2.16.15-UU.1
Trademarks
The following are trademarks of Motorola: MOTOTRBO™.
Any other brand or product names are trademarks or registered trademarks of their respective holders.
The Genesis Group Trademark Information
GW3-TRBO® is a registered trademark of GenCore Candeo, LTD., a subsidiary of Burks GenCore Co., Inc.
D.B.A. The Genesis Group and Phil Burks.
Copyright
Copyright © 2013-2020; Burks GenCore Co., Inc. D.B.A. The Genesis Group and Phil Burks. All rights are
reserved. No part of this publication or the associated program may be reproduced, transmitted, transcribed,
in whole or in part, in any form or by any means, whether it is mechanical, magnetic, optical, electronic,
manual or otherwise, without the prior written consent of Burks GenCore Co., Inc. D.B.A:
The Genesis Group and Phil Burks
5800 Eagles Nest Blvd
Tyler, Texas 75703.
Includes technology licensed from Motorola.
Disclaimer
The GW3-TRBO User’s Manual is printed in the U.S.A. Burks GenCore Co., Inc. D.B.A. The Genesis Group
and Phil Burks believe that the information included in this manual is correct; however, Burks GenCore Co.,
Inc. D.B.A. The Genesis Group and Phil Burks reserves the right to alter, revise and make periodic changes
to the manual and its contents. Burks GenCore Co., Inc. D.B.A. The Genesis Group does not assume
responsibility to notify any person of such revisions or changes. While we have taken strides to carefully
examine our software and documentation and believe that it is reliable, the Genesis Group and Phil Burks
assume no responsibility for the use of the manual, or GW3-TRBO software, nor for any patent infringements
or other rights of third parties who may use the manual or the GW3-TRBO software. Burks GenCore Co.,
Inc. D.B.A. The Genesis Group and Phil Burks make no representations or warranties with respect to the
contents or fitness for a particular purpose beyond the cost of the software paid by the end-user.
The software contains valuable trade secrets and proprietary information. Unauthorized use of the manual or
software can result in civil damages and criminal prosecution. As an end user, you agree to abide by and heed
these statements.
License
Title to the media on which the program is recorded and to the documentation in support of the product is
transferred to you, but title to the program, and all subsequent copies of the program, despite the form or
media in or on license is not a sale of the original or any subsequent copy. You assume responsibility for the
selection of the program to achieve your intended results, and for the installation, use, and results obtained
from the program.
Refer to the GW3-TRBO Manual Overview for your full license. All license information contained on pages
4-7 (Book 600-2.16.15-AA.1) are to be considered as contained herein.
Support
Customer satisfaction is our number one priority at Genesis. We are here to provide you with the best
software possible, and we want to know when you have any questions, concerns or problems with GW3-
TRBO so that we can make it a better product for everyone.
Refer to the Troubleshooting & Support section of the GW3-TRBO Manual Shell (Book 600-2.16.15-AA.1)
for complete support and contact information.
4 600-2.16.15-UU.1
Document History
Revision Description Author
2.10 Initial Release BUD
2.11 Revisions Before Release BUD/RS
2.12 Combined values with Historical JAW
2.12 Added area, bar and stepline graph type options JAW
2.13 Revisions Before Release ATG
2.14 Revisions Before Release REB
2.15 Revisions Before Release REB
2.16 Revisions Before Release JPS
5 600-2.16.15-UU.1
Table of Contents
Trademarks ........................................................................................................................................... 3 The Genesis Group Trademark Information ......................................................................................... 3 Copyright .............................................................................................................................................. 3 Disclaimer ............................................................................................................................................. 3 License .................................................................................................................................................. 3 Support .................................................................................................................................................. 3
DOCUMENT HISTORY ................................................................................................................................. 4
TABLE OF CONTENTS ............................................................................................................................. 5
ABOUT THIS MANUAL ............................................................................................................................ 7
GOALS ........................................................................................................................................................ 7 WHO SHOULD READ THIS MANUAL? ......................................................................................................... 7 HOW THIS MANUAL IS ORGANIZED ........................................................................................................... 7
CHAPTER 1 OVERVIEW ..................................................................................................................... 9
WHAT IS KPI? ............................................................................................................................................ 9 Terms .................................................................................................................................................... 9
CHAPTER 2 USING KPI ......................................................................................................................11
KEY PERFORMANCE INDICATORS ..............................................................................................................11 Calls .....................................................................................................................................................11 Busies ...................................................................................................................................................12 Connections .........................................................................................................................................12 Peak Usage ..........................................................................................................................................13
KPI CHARTS ..............................................................................................................................................13 Data Point Compression ......................................................................................................................13
Sum Compression ........................................................................................................................................... 14 Maximum Compression .................................................................................................................................. 14
Historical Value Data Points ...............................................................................................................14 OPTIONS WINDOW .....................................................................................................................................15
Data Source .........................................................................................................................................16 Query Options ......................................................................................................................................17
Window and Interval ....................................................................................................................................... 18 Date and Time ................................................................................................................................................. 19 Refresh Interval (Minutes) .............................................................................................................................. 19
Chart Options ......................................................................................................................................20 Hide Axis Values ............................................................................................................................................ 20 Chart Type ...................................................................................................................................................... 20
KPIs To Display ...................................................................................................................................21 RESOURCE TREE VIEW ..............................................................................................................................22 CHART GRID VIEW ....................................................................................................................................23
Chart Window ......................................................................................................................................24 STATUS VIEW ............................................................................................................................................25
Data Source .........................................................................................................................................25 Query Option .......................................................................................................................................25 Legend ..................................................................................................................................................25

6 600-2.16.15-UU.1

7 600-2.16.15-UU.1
About this Manual
Goals
This manual describes the function and role of the KPI module in the GW3-
TRBO solution and provides instructions on using the KPI graphical user
interface (GUI).
Who Should Read This Manual?
This manual is written with an expected audience of novice to mid-level
MOTOTRBO radio system users and novice to mid-level PC users.
How This Manual Is Organized
This manual is organized as follows:
• Overview: Describes the KPI module, the KPI GUI and the organization
of information within the KPI GUI.
• Using KPI: provides instructions on KPI and setting up the GUI to satisfy
your viewing needs.
This manual contains the following images, used to indicate that a segment of text
requires special attention:
Additional Information: Additional information is used to indicate
shortcuts or tips.
Warning: Warnings are used to indicate possible problem areas, such as
a risk of data loss or incorrect/unexpected functionality.

8 600-2.16.15-UU.1

9 600-2.16.15-UU.1
Chapter 1 Overview
This chapter describes the KPI module, the KPI GUI and the organization of
information within the KPI GUI.
This chapter contains the following sections:
• What is KPI?: Defines the function and role of the KPI module in the
GW3-TRBO solution.
What is KPI?
The KPI module displays real-time WACN, system, zone and site activity on
calls, busies, connections and peak usage on a 5-minute interval. The KPI GUI
displays the activities on a Window-Interval or Date-Time configuration.
KPI adjusts the periods to display 100 or fewer data points on each graph. If it adjusts the
periods, then the aggregated values will be computed based on their type and, as a result, the data
points on the graphs might not necessarily display 5 minute intervals.
Intervals between data points are curve-fit and may not represent the actual data. There is a
note on the chart grid indicating this.
Figure 1.1 – KPI GUI
Terms
KPIs: Key Performance Indicators.

10 600-2.16.15-UU.1

11 600-2.16.15-UU.1
Chapter 2 Using KPI
This chapter provides instructions on understanding KPI and setting up the GUI to fulfill
your viewing need.
This chapter contains the following sections:
• KPIs: Describes the different key performance indicators used in KPI.
• KPI Charts: Further explains how the KPI charts display data.
• Options Window: Describes how to configure KPI.
• Resource Tree: Describes how to use the Resource Tree.
• Chart Grid View: Describes how to use the chart grid view.
Key Performance Indicators
This section describes the different KPIs used in the KPI module. This
information is organized in the following areas:
• Calls: Describes the different KPIs under calls for the specified period.
• Busies: Describes the different KPIs under busies for the specified period.
• Connections: Describes the different KPIs under connections for the
specified period.
• Peak Usage: Describes the different KPIs under peak usage for the
specified period.
Calls
Key performance indicators under calls are organized in the areas below. Calls
are counted on each site where a channel is granted, regardless of the source site.
• Group Call Count*: The amount of talkgroup calls per interval.
o Historical Group Call Count: Average of all intervals for Group
Call Count.
• Group Call Time: The number of milliseconds used by talkgroups.
o Historical Group Call Time: Average of all intervals for Group
Call Time.
• Private Call Count*: The amount of private calls per interval
o Historical Private Call Count: Average of all intervals for Private
Call Count.
• Private Call Time: The number of milliseconds used by private calls.
o Historical Private Call Time: Average of all intervals for Private
Call Time.
• Data Group Call Count*: The amount of data group calls per interval.
o Historical Data Group Call Count: Average of all intervals for
Data Group Call Count.
• Data Group Call Time: The number of milliseconds used by data group
calls.
o Historical Data Group Call Time: Average of all intervals for
Data Group Call Time.

12 600-2.16.15-UU.1
• Data Private Call Count*: The amount of private data calls per interval.
o Historical Data Private Call Count: Average of all intervals for
Data Group Call Count.
• Data Private Call Time: The number of milliseconds used by private data
calls.
o Historical Data Private Call Time: Average of all intervals for
Data Private Call Time.
* These counts include calls that started in this interval as well as calls that
were active going into this interval. Calls can be counted across multiple
intervals.
Busies
Key performance indicators under busies are organized in the areas below.
• Busy Count*: The amount of busies per interval.
o Busy Historical Count: Average of all intervals for Busy Count.
• Busy Time: The number of milliseconds the channel was busy.
o Busy Historical Time: Average of all intervals for Busy Time.
* This count includes busies that started in this interval as well as busies
that were active going into this interval. Busies can be counted across
multiple intervals.
Connections
Key performance indicators under connections are organized in the areas below:
• Radio Count: At the end of each 5-minute interval a count of currently
affiliated radios is taken.
o Historical Radio Count: Average of all intervals for Radio Count.
• Group Count: At the end of each 5-minute interval a count of current
groups with at least one affiliated radio is taken. The affiliated group count
is the count of affiliated groups per site. Zone, System and WACN level
group counts will be sums of all affiliated groups for sites under that level.
o Historical Group Count: Average of all intervals for Group
Count.
• Radio Connections: The amount of radio connections.
o Historical Radio Connections Average of all intervals for Radio
Connections.

13 600-2.16.15-UU.1
Radio and Group counts are affected by the Radio ID Timeout Minutes option in Alias’
System settings. Radios are not considered affiliated if their connection has timed out.
Most radio-originated activity will renew a radio’s connection timeout. Group count is
affected because a group is only counted if it has an affiliated radio whose connection has
not timed out.
Because radio and group are recorded at the end of each KPI window, if KPI is tasked with back-
filling these values into intervals, the values will be 0. This is to prevent KPI from falsely presenting a
value that would likely be invalid.
Radio IDs 16776410 and 16776414 will be ignored and not displayed in this module as these are
XRCs and not actual radios.
When a radio is inhibited, it is considered disconnected until the inhibit is canceled or the radio issues
activity indicating that it is no longer inhibited. Affiliation and registration activity does not qualify.
Because IP Console Inhibits are partial radio inhibits, they are not counted as radio inhibits.
Peak Usage
Key performance indicators under peak usage are organized in the areas below.
When aggregated, the maximum of the data is used for each interval.
• Peak Channels: Peak number of channels used.
o Historical Peak Channels: Average of all intervals for Peak
Channels.
KPI Charts
Data Point Compression
KPI Module adjusts the periods in the KPI charts to display 100 or fewer data
points on each graph. If it adjusts the periods, then the aggregated values will be
adjusted based on their type and, as a result, the data points on the graphs might
not necessarily display 5-minute intervals. To ensure the more readable 5-minute
intervals when viewing more than a 6-hour time window, it is best to have the
window be increments of 8 hours, 20 minutes. Such as:
• 8 hours 20 minutes = 5-minute data points
• 16 hours, 40 minutes = 10-minute data points
• 25 hours (1 day and 1 hour) = 15-minute data points
• 33 hours, 20 minutes (1 day, 9 hours and 20 minutes) = 20-minute data
points
• 41 hours, 40 minutes (1 day, 17 hours and 40 minutes) = 25-minute data
points
• 50 hours (2 days and 2 hours) = 30-minute data points

14 600-2.16.15-UU.1
Sum Compression
When compression is used on values aggregated by a sum, each value is summed
to arrive at the compressed data point value.
Values aggregated by sum include:
• Group Call Count
• Group Call Time
• Private Call Count
• Private Call Time
• Data Group Call Count
• Data Group Call Time
• Data Private Call Count
• Data Private Call Time
• Radio Connections
• Busy Count
• Busy Time
Maximum Compression
When compression is used for values aggregated by a maximum, a maximum
evaluation is performed on each value to determine the compressed data point
value.
Values aggregated by a maximum include:
• Radio Count
• Group Count
• Peak Channels
Historical Value Data Points
In the KPI charts, historical values are shown as a gray line. Historical values are
only shown for data points when archive data exists for the date and time in the
data point. For example, if the current date and time is 3/24/2020 13:30 and you
choose to view KPIs for a 25 hour range of 3/24/2020 13:00 to 3/25/2020 14:00,
you will see historic values for the 3/24/2020 13:15 segment, but not for the
3/25/2020 13:15 segment. This is because the 3/25/2020 13:15 segment is in the
future and does not have corresponding archive data.
This also applies to data points consisting of more than one compressed data point
(explained above). KPI will only compress the data points that have
corresponding archive data.
Regardless of selected time range, historical values show the historical average
for all known intervals.

15 600-2.16.15-UU.1
Options Window
This section describes the different configurations settings use in KPI and the GUI
that allow users for modifying the configurations. A user can load up the Options
Window GUI by clicking on Options Window in the View menu. The Options
Window section is organized in the following areas:
• Data Source: Describes how to set up the KPI data source.
• Query Options: Describes how to set up querying the KPI data source for
fetching data.
• Chart Options: Describes the function of each of the chart options.
• KPIs To Display: Describes how to set up the different key performance
indicators to display.
Figure 2.1 – KPI Options Window
16 600-2.16.15-UU.1
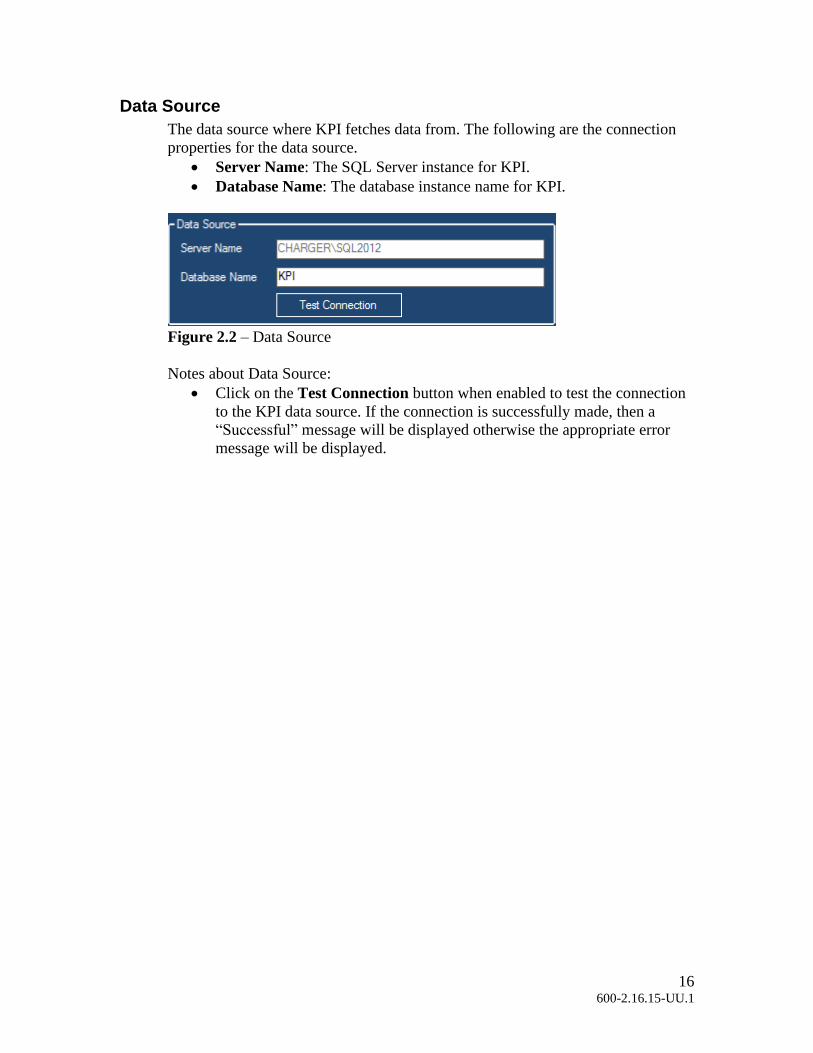
Data Source
The data source where KPI fetches data from. The following are the connection
properties for the data source.
• Server Name: The SQL Server instance for KPI.
• Database Name: The database instance name for KPI.
Figure 2.2 – Data Source
Notes about Data Source:
• Click on the Test Connection button when enabled to test the connection
to the KPI data source. If the connection is successfully made, then a
“Successful” message will be displayed otherwise the appropriate error
message will be displayed.

17 600-2.16.15-UU.1
Query Options
Query Options determines how and when data is fetched from the KPI data
source. Fetching data can be configured by using Window and Interval or Date
and Time. The default configuration is Window and Interval. While one
configuration is set the other cannot be modified. Query Options is organized in
the following areas:
• Window and Interval: Describes using window and interval
configuration to fetch data from the KPI data source.
• Date and Time: Describes using Date and Time configuration to fetch
data from the KPI data source.
• Refresh Interval (Minutes): Describes the interval used in fetching data.
Figure 2.3 – Query Options

18 600-2.16.15-UU.1
Window and Interval
This configuration uses a window to determine what data is queried from the data
source in intervals of five minutes (5 minutes). The window determines the time
frame (past) to account for when the KPI data source is fetching data. For
example, if the window is set to Two Hour, then query results would be based on
two hours before the time that the data source is queried.
Valid Window values:
• One Hour
• Two Hour (default)
• Six Hour
• Twelve Hour
• One Day
• One Week
19 600-2.16.15-UU.1
Date and Time
This Configuration uses a date and time range and a date and time portion method
to determine what data is queried from the KPI data source. Range determines the
time frame and Portion determines the individual date or time portion to include
in the query. A user can check/uncheck the Include checkbox to determine
whether that portion gets included or not in the query.
Range
• End must be greater than or equal to Begin
Portion
• Hour
o Included by default
o Valid values: 0 to 23
o Default
▪ Begin (0)
▪ End (23)
o End must be greater than or equal to Begin
• Minute
o Included by default
o Valid values: 0 to 59
o Default
▪ Begin (0)
▪ End (59)
o End must be greater than or equal to Begin
Refresh Interval (Minutes)
The Refresh Interval determines the minutes KPI takes in fetching data from the
data source. The valid range of values for Refresh Interval is from two to five
minutes and by default it is set to two minutes.
If the query option is set to Date and Time, the Refresh Interval is disabled because there is no new
data to continually retrieve.

20 600-2.16.15-UU.1
Chart Options
This section contains features that effect how the charts are displayed. These
features include:
Hide Axis Values
To maximize each chart’s display area, you can choose to remove the vertical axis
values from the charts. When this feature is enabled, the axis values are still
visible in the zoom window when you double-click on a chart.
Chart Type
The following chart options are available:
• Area
• Bar
• Line
• Stepline
The Chart Type option of Bar is only available when the Hide Axis Values option is checked.

21 600-2.16.15-UU.1
KPIs To Display
This determines which KPIs to enable for display in the KPI GUI. KPIs marked
as checked and bolded are the ones enabled for display. A user can simply
check/uncheck a parent key performance indicator node to enable/disable
correspondingly all the KPIs under it.
Figure 2.4 – KPIs To Display

22 600-2.16.15-UU.1
Resource Tree View
The Resource Tree displays all KPI resources from a WACN to a Site level. Each
node in the Resource Tree View contains a check box and checking/unchecking it
determines whether KPIs are shown/hidden correspondingly for that resource in
the chart grid view. A user can hide/show the Resource Tree View by selecting
Hide Resource Tree/Show Resource Tree from the View menu.
Figure 2.5 – Resource Tree View
To ensure that KPI’s performance is acceptable, the GUI limits the number of checked resources. This
limit is set in your license; to request an increase, contact support.

23 600-2.16.15-UU.1
Chart Grid View
The Chart Grid View displays the Resource alias and KPIs (charts) for each
enable resource on the Resource Tree View based on the user’s configuration
setting in the Options Window. Each column on the Chart Grid View (except
Resource) corresponds to the individual key performance indicator selected in the
KPIs To Display in the user’s Options Window. Charts in the Grid get refreshed
base on the Refresh Interval settings. Depending on the number of enabled
resources it might take a bit of time to refresh accordingly.
Figure 2.6 – Refresh display
The Refresh display at the top of the window shows when the data was fetched
from the database / when it was displayed. The Chart Grid View can be renewed
with the latest data by clicking the Refresh Charts button.
Figure 2.7 – Chart Grid View
• Column Reordering
o Columns in the Chart Grid View can be reordered by clicking and
dragging on the column header.
• Column Resizing:
o Columns in the Chart Grid View can be resized by dragging on the
column handle.
• Row Resizing:
o Rows in the Chart Grid View can be resized by dragging on the row
handle.

24 600-2.16.15-UU.1
Chart Window
Double-clicking on a chart displays the chart window. The chart window displays
the corresponding chart in a zoomed form to allow for easy readability.
Figure 2.8 – Chart Window

25 600-2.16.15-UU.1
Status View
The Status View displays current KPI user configuration. It is organized in the
following areas:
• Data Source: Displays the current KPI data source (Data Source: Server
Name->Database Name).
• Query Option: Displays the currently selected query option.
• Legend: Displays the default colors for the different key performance
indicators use as column header back color in the Chart Grid View.
Figure 2.9 – Status View
Data Source
The Data Source label in the status view displays the current KPI data source.
Red fore color indicates that the KPI data source is not being accessible due to an
error and it will display the error message below (double-clicking on the label will
load a message box displaying the entire error message):
Data Source: Server Name->Database Name (Double-click to display error).
Query Option
The Query Option label in the status view displays the currently selected Query
Option (Query Option: Five Minutes interval on a Two-Hour window).
Legend
The Legend displays the default colors for the different key performance
indicators (Calls, Busies, Connections and Peak Usage). The column header
background color and chart color on the Chart Grid View corresponds to the color
on Legend. Legend colors cannot currently be changed, and the following list
defines the ones being used in KPI.
• Green = Calls
• Red = Busies
• Blue = Connections
• Tan = Peak Usage
• Gray = Historical values