gutiÉrrez, javier - new spatial patterns of mobility within the metropolitan area - more complex...
DESCRIPTION
Padrões espaciais de mobilidadeTRANSCRIPT
Journal of Transport Geography 15 (2007) 18–30www.elsevier.com/locate/jtrangeo
New spatial patterns of mobility within the metropolitan areaof Madrid: Towards more complex and dispersed Xow networks
Javier Gutiérrez ¤, Juan Carlos García-Palomares
Universidad Complutense, Madrid, Spain
Abstract
Changing processes in metropolitan areas are producing more extended, discontinuous, dispersed and fragmented spaces. As a result,spatial patterns of mobility are changing too. By using data from daily mobility surveys, this paper analyses the processes of peripherisa-tion of mobility (more suburban trips), dispersion of Xows and increase of trip length and travel time in the metropolitan area of Madrid.© 2006 Published by Elsevier Ltd.
Keywords: Metropolitan change; Daily mobility; Spatial patterns of Xow networks; Trip length and travel time
1. Introduction
In recent decades, cities’ growth patterns have beenundergoing qualitative change. There has been massivesuburbanization and the emergence of a polycentric form(Anas et al., 1998, p. 1430). In fact, extensive populationsuburbanization and employment decentralization hasoccurred in virtually all metropolitan areas in the devel-oped world (Giuliano and Small, 1999, p. 199). Metropo-lises are internally restructured at the same time as theyexpand, to thus become increasingly decentralised, dis-persed and fragmented. These changes in urban structure(from monocentric to polycentric structures) have pro-duced intense changes in mobility patterns.
Certainly a growing complexity and dispersion in Xownetworks is to be observed within European and, above all,North American, metropolitan areas, related to the transi-tion from monocentric to polycentric metropolises. Inmonocentric metropolitan systems, transport was centredon a single central business district. The essential relation-ship between the suburbs and the core was one of depen-dency. In fact, many suburbs functioned as ‘bedroom’communities, whilst most economic activity was concen-
* Corresponding author.E-mail address: [email protected] (J. Gutiérrez).
0966-6923/$ - see front matter © 2006 Published by Elsevier Ltd.doi:10.1016/j.jtrangeo.2006.01.002
trated in the central city (Sutton, 1999, p. 32). Within such amonocentric structure, radial (fundamentally centripetal)Xows predominated, supported by a likewise radial trans-port system. This radial transport system produced amarked distance decay in the spatial distribution of accessi-bility, which was far higher in the central city than in thesuburbs and favoured the concentration of activities in thecore.
Later, monocentric metropolises were aVected by inten-sive decentralization processes. In most metropolises, thenumber of jobs is growing in the suburbs but decreasing inthe central city. This evolution is linked to processes such asglobalization, the impact of new technologies, post-For-dism, and social and cultural change. However, transporthere also plays a key role in two ways: on the one hand ithas brought about dis-economies in the core (congestion,acoustic contamination, atmospheric pollution), thus pro-moting decentralization; and on the other, decentralizationand dispersion of activities has been encouraged by a gener-alised use of private cars and better accessibility conditionscreated by the building of transport infrastructures in theperiphery, particularly roads and motorways,1 which have
1 Changes in accessibility patterns in the suburbs have been improvednot only by the building of new transport infrastructure but also byemployment decentralization.
J. Gutiérrez, J.C. García-Palomares / Journal of Transport Geography 15 (2007) 18–30 19
turned the suburbs into a more attractive space for inver-sion and the installation of new companies. The complexprocess of employment decentralization has resulted in anintricate employment landscape of oYce parks and R&Dclusters, as well as industrial parks and shopping centres,each of which responds to unique location requirementsand provides a unique mix of employment opportunities(Lowe, 1998, p. 234). This employment and Wrm decentral-ization leads to changes in accessibility patterns too, whichhave their own eVect on future development.
With a dispersed demand (low-density residential frag-ments) and a polycentric structure (the core and the sub-centres), patterns of intra-metropolitan transport Xows areno longer typically radial, with a high proportion of sub-urbs to core trips (from many origins to a single main desti-nation), to become more complex and diversiWed (frommany origins to many destinations). The employmentdecentralization has brought about an increase in centripe-tal radial trips (from the core to the suburbs), but above allin lateral (suburb to suburb) movements (Koening, 1993):more population and more activities on the periphery havegenerated an unprecedented increase in lateral mobility.The Xow networks are therefore more complex and dis-persed: the trips generated by each zone are attracted bymore and more zones, whilst the trips attracted by eachzone are generated by a growing number of zones. The Xownetworks resemble a starWsh-shaped structure less and lessand take on the form of a spider’s web with a multitude ofinterlaced movements.
Whilst transport researchers agree that decentralizationis generating more complex and dispersed intra-metropoli-tan network Xows, a controversial matter in the literature iswhether decentralization and formation of polycentricstructures are producing an increase or a reduction in com-muting distances and travel times. One group has embracedthe possibility of urban structural change and emphasisesthe role of the market in creating eYciency in commutingXows and travel times. A quite diVerent view is suggested bythose who note an array of urban problems which can betraced directly to problems of urban transport (Clark andKupers-Linde, 1994, p. 470).
According with the ‘co-location’ hypothesis, companieswould tend to relocate on the periphery, seeking proximityto their potential customers and at the same time workerswould attempt to live in places near their workplaces inwell-equipped areas (see for example, Cervero and Wu,1998). The most paradigmatic case would be that of theedge-cities, whose residents could carry out most of theiractivities with no need to go elsewhere. By using diVerentsources and diVerent study areas, certain authors haveshown that, in eVect, decentralization produces a reductionin the average length of trips (Gordon and Richardson,1991; Wachs et al., 1993), whilst others have proved just theopposite (Levinson and Kumar, 1994; Naess and Sandberg,1996).
Gordon and Richardson (1991), in a study on 82 NorthAmerican metropolitan areas showed that the higher the
degree of employment centralization, the greater the dis-tances travelled in trips to work. The employment decen-tralization would therefore bring about an increase in thenumber of suburb to suburb trips, shorter than thosefrom suburbs to central city, and therefore a reduction inthe average distances travelled. Nevertheless, and accord-ing to data from the United States Department of Trans-port, the average commuting distance has increased bynearly a fourth during the 1980s as a result of decentral-ization, although there has been only a modest increase incommuting time (Lowe, 1998, p. 234).2 The explanationfor this paradoxical situation would derive from the factthat there had been an increase in trips within suburbanareas, longer, but at higher speeds than those made withinurban areas. For their part, Cervero and Wu (1998) pointout that in the case of the San Francisco Bay Area, whilstit is true that trips attracted by the core are longer thanthose by the sub-centres, between 1980 and 1990 both thedistances covered and the travel times increased more intrips attracted by the sub-centres than in those by thecore.
There cannot be a simplistic interpretation of theseapparently contradictory data (eVects of employmentdecentralization), because the role played by the redistribu-tion of the population must be examined too. In thisrespect, one should bear in mind that although the employ-ment decentralization aVects particularly those municipali-ties closest to the central city (and therefore should producethe eVect of shortening trips made by the residents of thesemunicipalities), the population continues to spread towardsplaces ever further away, so that distances covered to thesub-centres or even to the city centre increase for thesepopulations. Counter to the ‘co-location’ theory, it shouldalso be argued that the choice of place of residence is onlypartly inXuenced by the location of workplace, for thereare other determining factors (price of housing, type ofhousing, urban environment, services, contact with nature,etc.). Likewise, for the companies, proximity to their cus-tomers and employees is just one more locating factoramongst other more relevant ones. Therefore, whilst thereis an increase in local trips in certain municipalities near tothe central city as a result of decentralization, there mayalso be an increase in trips from the more external anddemographically dynamic municipalities to the centre andto the sub-centres. DiVerent results may be derived fromthe interplay of two forces, employment decentralizationand extensive population suburbanization.3
2 For example, in Washington, the average commuting time has re-mained constant between 1968 and 1988, while distance (euclidian) has in-creased by between 13% (driver only) and as much as 31% (driver withmore than two passengers) (Levinson and Kumar, 1994).
3 On the other hand, it should be taken into account that the eVects ofdecentralization on trip length and travel time may be diVerent accordingto trip purposes. A response to the new situation (new opportunities in thesuburbs brought about decentralization) may be very easy in shoppingtrips but not in commuting trips.

20 J. Gutiérrez, J.C. García-Palomares / Journal of Transport Geography 15 (2007) 18–30
The aim of this paper is to analyse the evolution ofmobility in the metropolitan area of Madrid, focusingattention on the changes in the spatial patterns of the Xows.We intend to test whether the employment decentralizationand the outward spread of population are leading togreater dispersion and complexity in the Xow networks andto an increase in trips length and travel times. To this end,we shall carry out a comparative analysis of the data fromthe last two mobility surveys within the metropolitan areaof Madrid, carried out in 1988 and 1996.
This paper is structured in to six sections. After this briefintroduction, Section 2 describes the data and spatial units,Section 3 analyses the increase in the peripheral nature ofmobility (generations, attractions and Xows), Section 4 teststhe greater complexity and dispersion of Xow networks andSection 5 studies the changes in length and time of trips,followed by a conclusion.
2. Data and spatial units
Data from the CTRM (Consorcio Regional de Trans-portes de Madrid) mobility surveys 1988 and 1996 wereused. Both cover a wide sample. Thus, for example, the1996 mobility survey involves a sample of about 25,000households (90,000 inhabitants), so that it provides accu-rate data on household mobility within the metropolitanarea of Madrid. Both surveys follow basically the samemethodology, but some changes in the last survey makewalking trips data not comparable between 1988 and 1996.Because of this and in order to study the evolution of thespatial patterns of intra-metropolitan Xows 1988–1996, thispaper analyses only motorized trips (both public and pri-vate transport), which are the most relevant trips for ourresearch (focused on dispersion of network Xows andchanges in trip length and travel time). All motorized trips,both work and non-work trips, were considered.
According to the results of these mobility surveys, thetotal number of motorized trips within the metropolitanarea of Madrid during a typical work day increased from5,663,000 (1.27 trips per person/day) in 1988 to 6,324,000 in1996 (1.37). Work trips represent 36.0% of the total of themotorized trips in the study area (30.0% in 1988). The useof public transport still remains high (53.1% of the motor-ized trips in 1996), but it had decreased since 1988 (60.2%)(Gutiérrez and García-Palomares, 2005).
The metropolitan area of Madrid contains 59 municipal-ities, very diVerent in population and size. In fact, of theroughly 4.6 million inhabitants of the metropolitan area in1996, 2.8 million live in the central city (municipality ofMadrid) and 1.8 million in the suburbs (58 suburbanmunicipalities), so that suburban municipalities are notcomparable in size and population to Madrid. Because ofthis, we considered as spatial units the 21 oYcial districts ofthe municipality of Madrid, as well as the 58 suburbanmunicipalities (79 spatial units in total). The districts ofMadrid have more or less the same number of inhabitantsas the largest suburban municipalities.
These 79 spatial units were grouped in three rings: theWrst ring includes the 7 central districts of the municipalityof Madrid; the second covers the 14 peripheral districts ofthe municipality of Madrid; and the third one is spreadover the 58 suburban municipalities (Fig. 1). Two fringeswere distinguished within the third ring: the internal fringeincludes the suburban municipalities which were alreadyintegrated in the metropolitan area in the 1960s and 1970s(larger and closer to Madrid), and the external one coversthe rest of the suburban municipalities (smaller and moreperipheral).
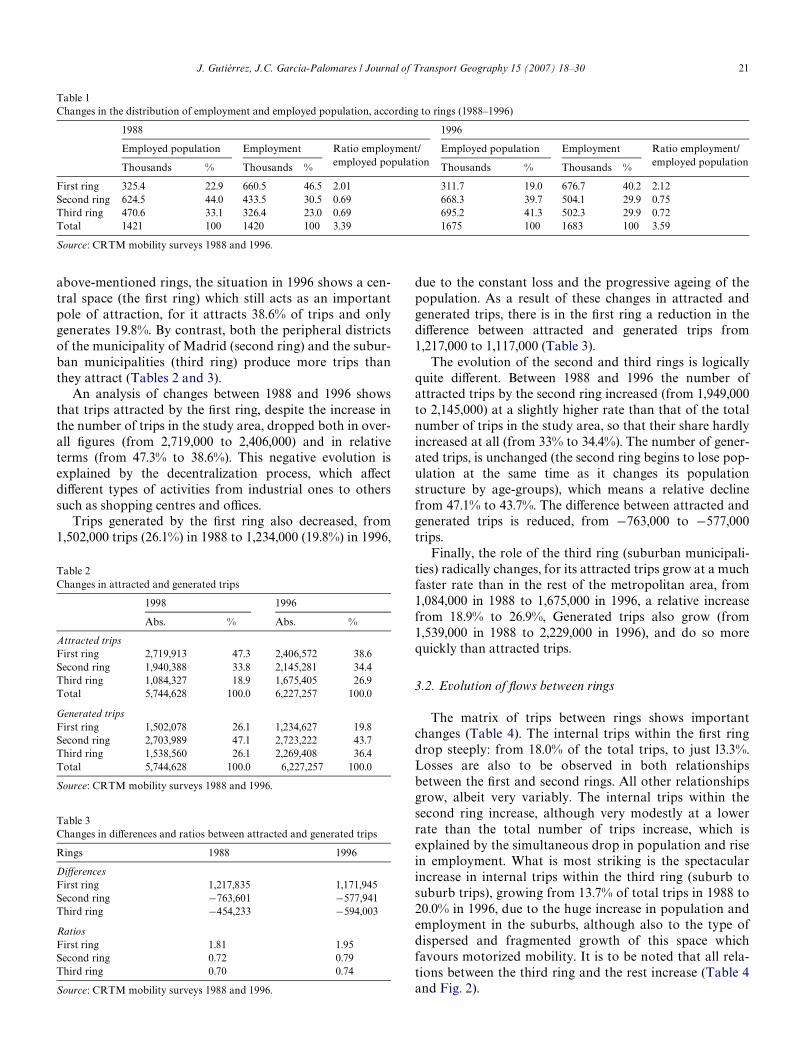
Distribution of employment and employed populationaccording to rings is very uneven (Table 1). In fact the Wrstring contains much more employment (40.2%) thanemployed population (19.0%). The opposite occurs in thethird ring, which contains more employed population(41.3%) than employment (29.9%). The 1988–1996 evolu-tion of employment and population according to rings isvery diVerent too. It involved an intense process of employ-ment decentralization and population suburbanizationtowards the third ring: it increased the employment from23.0% in 1988 to 29.9% in 1996 and the employed popula-tion from 33.1% to 41.3%.
3. More suburban trips
3.1. Evolution of generated and attracted trips
By analysing the data of generated and attracted tripsin the metropolitan area of Madrid according to the
Fig. 1. Spatial units (suburban municipalities and districts of the munici-pality of Madrid), grouped by rings.
J. Gutiérrez, J.C. García-Palomares / Journal of Transport Geography 15 (2007) 18–30 21
above-mentioned rings, the situation in 1996 shows a cen-tral space (the Wrst ring) which still acts as an importantpole of attraction, for it attracts 38.6% of trips and onlygenerates 19.8%. By contrast, both the peripheral districtsof the municipality of Madrid (second ring) and the subur-ban municipalities (third ring) produce more trips thanthey attract (Tables 2 and 3).
An analysis of changes between 1988 and 1996 showsthat trips attracted by the Wrst ring, despite the increase inthe number of trips in the study area, dropped both in over-all Wgures (from 2,719,000 to 2,406,000) and in relativeterms (from 47.3% to 38.6%). This negative evolution isexplained by the decentralization process, which aVectdiVerent types of activities from industrial ones to otherssuch as shopping centres and oYces.
Trips generated by the Wrst ring also decreased, from1,502,000 trips (26.1%) in 1988 to 1,234,000 (19.8%) in 1996,
Table 2Changes in attracted and generated trips
Source: CRTM mobility surveys 1988 and 1996.
1998 1996
Abs. % Abs. %
Attracted tripsFirst ring 2,719,913 47.3 2,406,572 38.6Second ring 1,940,388 33.8 2,145,281 34.4Third ring 1,084,327 18.9 1,675,405 26.9Total 5,744,628 100.0 6,227,257 100.0
Generated tripsFirst ring 1,502,078 26.1 1,234,627 19.8Second ring 2,703,989 47.1 2,723,222 43.7Third ring 1,538,560 26.1 2,269,408 36.4Total 5,744,628 100.0 6,227,257 100.0
Table 3Changes in diVerences and ratios between attracted and generated trips
Source: CRTM mobility surveys 1988 and 1996.
Rings 1988 1996
DiVerencesFirst ring 1,217,835 1,171,945Second ring ¡763,601 ¡577,941Third ring ¡454,233 ¡594,003
RatiosFirst ring 1.81 1.95Second ring 0.72 0.79Third ring 0.70 0.74
due to the constant loss and the progressive ageing of thepopulation. As a result of these changes in attracted andgenerated trips, there is in the Wrst ring a reduction in thediVerence between attracted and generated trips from1,217,000 to 1,117,000 (Table 3).
The evolution of the second and third rings is logicallyquite diVerent. Between 1988 and 1996 the number ofattracted trips by the second ring increased (from 1,949,000to 2,145,000) at a slightly higher rate than that of the totalnumber of trips in the study area, so that their share hardlyincreased at all (from 33% to 34.4%). The number of gener-ated trips, is unchanged (the second ring begins to lose pop-ulation at the same time as it changes its populationstructure by age-groups), which means a relative declinefrom 47.1% to 43.7%. The diVerence between attracted andgenerated trips is reduced, from ¡763,000 to ¡577,000trips.
Finally, the role of the third ring (suburban municipali-ties) radically changes, for its attracted trips grow at a muchfaster rate than in the rest of the metropolitan area, from1,084,000 in 1988 to 1,675,000 in 1996, a relative increasefrom 18.9% to 26.9%, Generated trips also grow (from1,539,000 in 1988 to 2,229,000 in 1996), and do so morequickly than attracted trips.
3.2. Evolution of Xows between rings
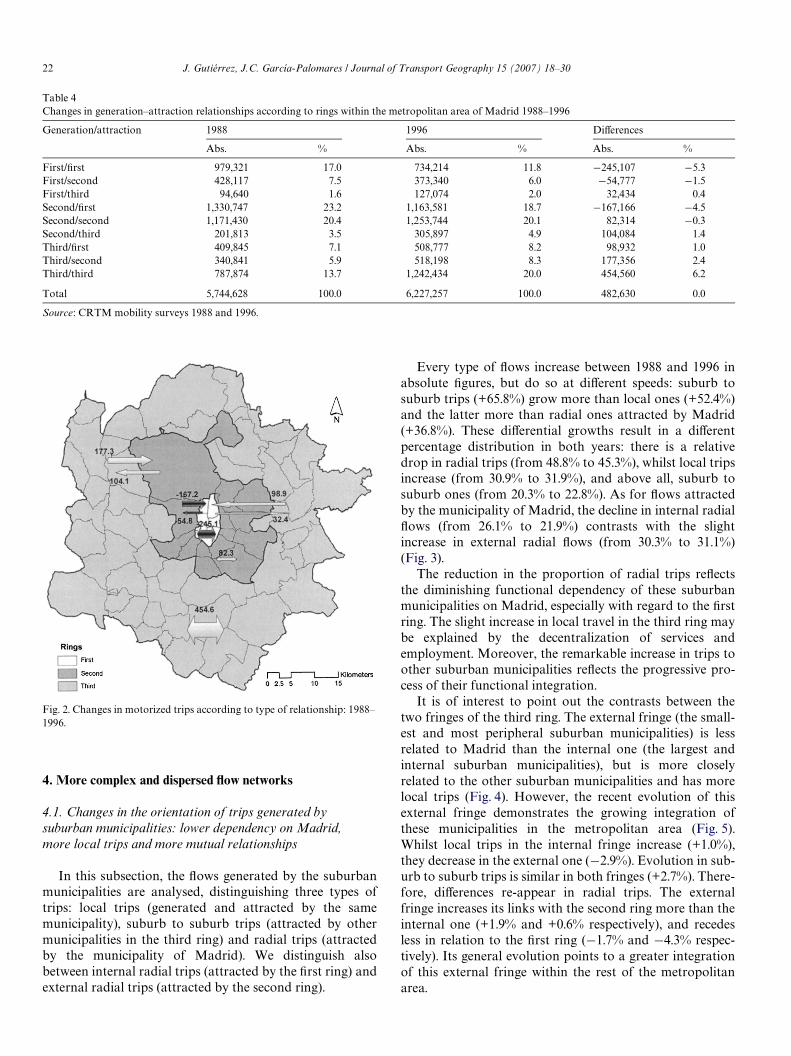
The matrix of trips between rings shows importantchanges (Table 4). The internal trips within the Wrst ringdrop steeply: from 18.0% of the total trips, to just l3.3%.Losses are also to be observed in both relationshipsbetween the Wrst and second rings. All other relationshipsgrow, albeit very variably. The internal trips within thesecond ring increase, although very modestly at a lowerrate than the total number of trips increase, which isexplained by the simultaneous drop in population and risein employment. What is most striking is the spectacularincrease in internal trips within the third ring (suburb tosuburb trips), growing from 13.7% of total trips in 1988 to20.0% in 1996, due to the huge increase in population andemployment in the suburbs, although also to the type ofdispersed and fragmented growth of this space whichfavours motorized mobility. It is to be noted that all rela-tions between the third ring and the rest increase (Table 4and Fig. 2).
Table 1Changes in the distribution of employment and employed population, according to rings (1988–1996)
Source: CRTM mobility surveys 1988 and 1996.
1988 1996
Employed population Employment Ratio employment/employed population
Employed population Employment Ratio employment/employed populationThousands % Thousands % Thousands % Thousands %
First ring 325.4 22.9 660.5 46.5 2.01 311.7 19.0 676.7 40.2 2.12Second ring 624.5 44.0 433.5 30.5 0.69 668.3 39.7 504.1 29.9 0.75Third ring 470.6 33.1 326.4 23.0 0.69 695.2 41.3 502.3 29.9 0.72Total 1421 100 1420 100 3.39 1675 100 1683 100 3.59
22 J. Gutiérrez, J.C. García-Palomares / Journal of Transport Geography 15 (2007) 18–30
4. More complex and dispersed Xow networks
4.1. Changes in the orientation of trips generated by suburban municipalities: lower dependency on Madrid,more local trips and more mutual relationships
In this subsection, the Xows generated by the suburbanmunicipalities are analysed, distinguishing three types oftrips: local trips (generated and attracted by the samemunicipality), suburb to suburb trips (attracted by othermunicipalities in the third ring) and radial trips (attractedby the municipality of Madrid). We distinguish alsobetween internal radial trips (attracted by the Wrst ring) andexternal radial trips (attracted by the second ring).
Fig. 2. Changes in motorized trips according to type of relationship: 1988–1996.
Every type of Xows increase between 1988 and 1996 inabsolute Wgures, but do so at diVerent speeds: suburb tosuburb trips (+65.8%) grow more than local ones (+52.4%)and the latter more than radial ones attracted by Madrid(+36.8%). These diVerential growths result in a diVerentpercentage distribution in both years: there is a relativedrop in radial trips (from 48.8% to 45.3%), whilst local tripsincrease (from 30.9% to 31.9%), and above all, suburb tosuburb ones (from 20.3% to 22.8%). As for Xows attractedby the municipality of Madrid, the decline in internal radialXows (from 26.1% to 21.9%) contrasts with the slightincrease in external radial Xows (from 30.3% to 31.1%)(Fig. 3).
The reduction in the proportion of radial trips reXectsthe diminishing functional dependency of these suburbanmunicipalities on Madrid, especially with regard to the Wrstring. The slight increase in local travel in the third ring maybe explained by the decentralization of services andemployment. Moreover, the remarkable increase in trips toother suburban municipalities reXects the progressive pro-cess of their functional integration.
It is of interest to point out the contrasts between thetwo fringes of the third ring. The external fringe (the small-est and most peripheral suburban municipalities) is lessrelated to Madrid than the internal one (the largest andinternal suburban municipalities), but is more closelyrelated to the other suburban municipalities and has morelocal trips (Fig. 4). However, the recent evolution of thisexternal fringe demonstrates the growing integration ofthese municipalities in the metropolitan area (Fig. 5).Whilst local trips in the internal fringe increase (+1.0%),they decrease in the external one (¡2.9%). Evolution in sub-urb to suburb trips is similar in both fringes (+2.7%). There-fore, diVerences re-appear in radial trips. The externalfringe increases its links with the second ring more than theinternal one (+1.9% and +0.6% respectively), and recedesless in relation to the Wrst ring (¡1.7% and ¡4.3% respec-tively). Its general evolution points to a greater integrationof this external fringe within the rest of the metropolitanarea.
Table 4Changes in generation–attraction relationships according to rings within the metropolitan area of Madrid 1988–1996
Source: CRTM mobility surveys 1988 and 1996.
Generation/attraction 1988 1996 DiVerences
Abs. % Abs. % Abs. %
First/Wrst 979,321 17.0 734,214 11.8 ¡245,107 ¡5.3First/second 428,117 7.5 373,340 6.0 ¡54,777 ¡1.5First/third 94,640 1.6 127,074 2.0 32,434 0.4Second/Wrst 1,330,747 23.2 1,163,581 18.7 ¡167,166 ¡4.5Second/second 1,171,430 20.4 1,253,744 20.1 82,314 ¡0.3Second/third 201,813 3.5 305,897 4.9 104,084 1.4Third/Wrst 409,845 7.1 508,777 8.2 98,932 1.0Third/second 340,841 5.9 518,198 8.3 177,356 2.4Third/third 787,874 13.7 1,242,434 20.0 454,560 6.2
Total 5,744,628 100.0 6,227,257 100.0 482,630 0.0

J. Gutiérrez, J.C. García-Palomares / Journal of Transport Geography 15 (2007) 18–30 23
4.2. Changes in the degree of trip concentration: more dispersed Xow networks
A characteristic of the Xow networks of well-developedmetropolitan systems is their increasing dispersion. Inmonocentric systems, the Xow network is highly polarisedin central districts and trips display a fundamentally cen-tripetal component. Yet as processes of decentralizationand formation of polycentric structures advance, Xows tendto diversify and disperse towards the new sub-centres.
Trips generated by a spatial unit are concentred whenmost of them are attracted by few spatial units; on the con-
trary, if these trips are attracted by numerous spatial units,we are talking of dispersion (Lowe, 1998). The same ideawas applied for the trips attracted by each spatial unit: theyare concentrated when most of them are generated by fewspatial units and dispersed when they are generated bynumerous spatial units.
The degree of concentration/dispersion of trips gener-ated and attracted by each spatial unit (suburban munici-palities and districts in the municipality of Madrid) ismeasured through the coeYcient of variation (a well-known statistical measure of dispersion). The spatial unitswith a highly polarised proWle of generated or attracted
Fig. 3. Changes in the orientation of trips generated by the municipalities in the third ring 1988–1996.
Fig. 4. Orientation of trips generated by suburban municipalities (third ring) in 1996.

24 J. Gutiérrez, J.C. García-Palomares / Journal of Transport Geography 15 (2007) 18–30
trips (most of the Xows generated or attracted are con-cenNStrated in one or a few spatial units) tend to give ahigh coeYcient of variation; on the contrary, those munici-palities or districts with highly dispersed proWles of gener-ated or attracted trips (those which relate to many diVerentunits) give low values in the coeYcient of variation (Fig. 6).
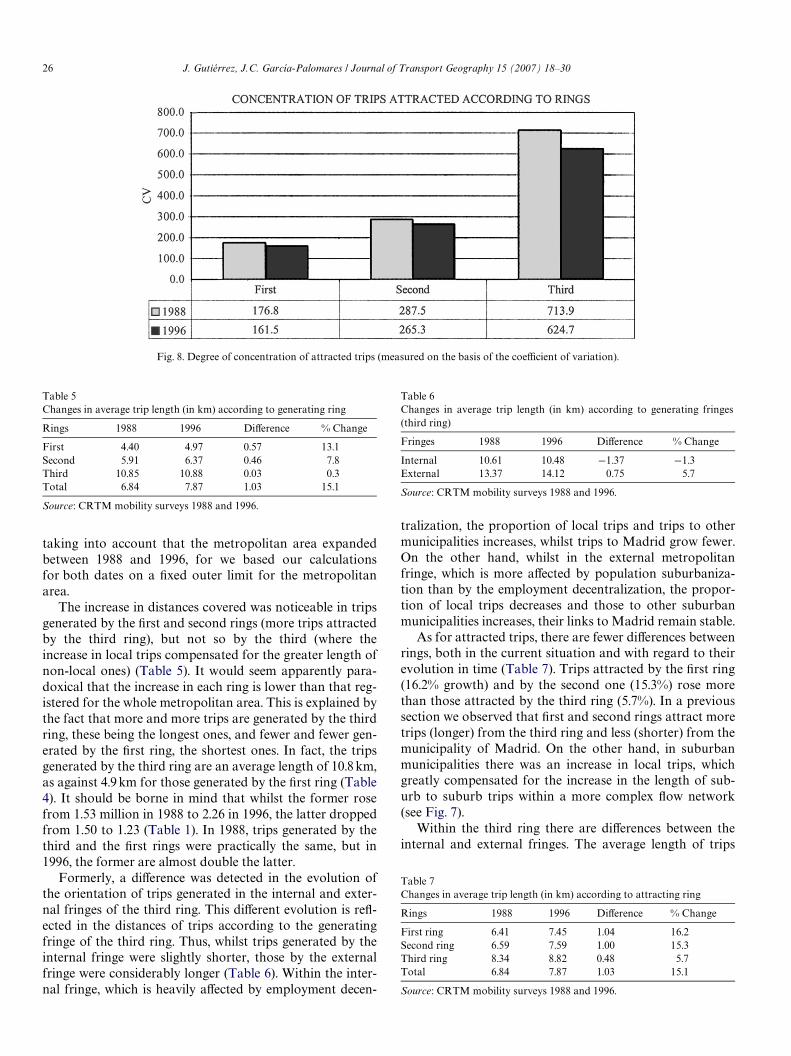
The results obtained, grouped by rings in order to facili-tate interpretation, show (both for generated and attractedtrips) that the more internal the ring, the more dispersed theXow networks are (Figs. 7 and 8). The districts of Madrid,which are physically connected by continuous built-up devel-opment, are closely inter-related, with each other and with anumber of suburban municipalities. Suburban municipalitieswhich are not physically connected are less inter-related.However, the most relevant aspect is that all rings show alower coeYcient of variation between 1988 and 1996, bothfor generated and attracted trips, and that the more externalthe ring, the greater the reduction. This means, that there is atrend for Xow networks to grow more and more complexand dispersed, particularly, in the third rings. The suburbanmunicipalities relate above all to the chief attracting districtsof Madrid and with certain neighbouring municipalities, butas the process of decentralization advances, their relation-ships with the districts of the second ring and particularlywith other municipalities in the third ring increase.
Suburban municipalities tend to have a higher degree ofconcentration in attracted trips than in generated ones,whilst in districts of the Wrst ring just the opposite occurs.This is explained by the fundamentally generating nature ofthe third ring and the attracting nature of the Wrst one.However, the most notable point here is the fact that thecoeYcient of variation in the third ring for attracted tripsdrops much more than that for generated trips (¡89 asagainst ¡33). This indicates a maturing of its attractingpatterns: not only does the number of trips attracted bysuburban municipalities increase, but also they are linkedwith more generating spatial units.
5. The increase in distances covered and travel times
5.1. Greater and greater distances
The building of monocentric metropolitan systemscaused a rise in the average length of trips. The process ofpopulation suburbanization, together with the tendency ofmost employments to remain in the central city, causedlonger and longer commuting.
Later, employment decentralization produced new sub-centres. It would be thought that the employment decen-tralization means that population and employments arecloser together, causing a reduction in the average distancecovered. In fact, the case of North American “edge cities” iscited where it is possible to live, work and carry out mostactivities with no need to go to the central city. However,the most highly evolved metropolises display more complexand dispersed Xow networks, which can increase the aver-age length of trips. This is a controversial matter and, as wehave seen, there is a debate in North American literature asto whether the decentralization in metropolitan areas isbringing about an increase or a reduction in the averagelength of trips.
Both tendencies are compatible and both seem to occurat the same time in the metropolitan are of Madrid, butoverall there is a signiWcant average increase in distancescovered.4 Employment decentralization has produced anincrease in local trips in the suburban municipalities, sothat certain trips are now shorter; but the increase of both
4 The surveys do not record the route of each trip. The distances betweenmunicipal or district centroids were estimated calculating the shortestroute through the road system. Once these distances were known, theweighted average distances were calculated taking as weight the number oftrips (in accordance with the data of the 1988 and 1996 surveys). For com-parative reasons, we kept to the same delimitation of the metropolitanarea for both dates.
Fig. 5. Changes in orientation of trips generated by suburban municipalities (third ring) according to fringes: 1988–1996.

J. Gutiérrez, J.C. García-Palomares / Journal of Transport Geography 15 (2007) 18–30 25
generated and attracted trips by the third ring and the com-plexity of the Xow network is causing an increase of the dis-tances covered, which has not been compensated by the
increase in local trips. Thus, between 1988 and 1996 theaverage distance trip rose from 6.8 to 7.8 km, which in rela-tive terms means a 15% increase (Table 5). This is without
Fig. 6. Flow networks with diVerent degrees of dispersion/concentration of trips. (A) Maximal dispersion of Xows: low coeYcient of variation. (B) Mediumdegree of dispersion of Xows: medium coeYcient of variation. (C) High degree of concentration of Xows: high coeYcient of variation.
Fig. 7. Degree of concentration of generated trips (measure on the basis of the coeYcient of variation).
26 J. Gutiérrez, J.C. García-Palomares / Journal of Transport Geography 15 (2007) 18–30
taking into account that the metropolitan area expandedbetween 1988 and 1996, for we based our calculationsfor both dates on a Wxed outer limit for the metropolitanarea.
The increase in distances covered was noticeable in tripsgenerated by the Wrst and second rings (more trips attractedby the third ring), but not so by the third (where theincrease in local trips compensated for the greater length ofnon-local ones) (Table 5). It would seem apparently para-doxical that the increase in each ring is lower than that reg-istered for the whole metropolitan area. This is explained bythe fact that more and more trips are generated by the thirdring, these being the longest ones, and fewer and fewer gen-erated by the Wrst ring, the shortest ones. In fact, the tripsgenerated by the third ring are an average length of 10.8 km,as against 4.9 km for those generated by the Wrst ring (Table4). It should be borne in mind that whilst the former rosefrom 1.53 million in 1988 to 2.26 in 1996, the latter droppedfrom 1.50 to 1.23 (Table 1). In 1988, trips generated by thethird and the Wrst rings were practically the same, but in1996, the former are almost double the latter.
Formerly, a diVerence was detected in the evolution ofthe orientation of trips generated in the internal and exter-nal fringes of the third ring. This diVerent evolution is reX-ected in the distances of trips according to the generatingfringe of the third ring. Thus, whilst trips generated by theinternal fringe were slightly shorter, those by the externalfringe were considerably longer (Table 6). Within the inter-nal fringe, which is heavily aVected by employment decen-
Table 5Changes in average trip length (in km) according to generating ring
Source: CRTM mobility surveys 1988 and 1996.
Rings 1988 1996 DiVerence % Change
First 4.40 4.97 0.57 13.1Second 5.91 6.37 0.46 7.8Third 10.85 10.88 0.03 0.3Total 6.84 7.87 1.03 15.1
tralization, the proportion of local trips and trips to othermunicipalities increases, whilst trips to Madrid grow fewer.On the other hand, whilst in the external metropolitanfringe, which is more aVected by population suburbaniza-tion than by the employment decentralization, the propor-tion of local trips decreases and those to other suburbanmunicipalities increases, their links to Madrid remain stable.
As for attracted trips, there are fewer diVerences betweenrings, both in the current situation and with regard to theirevolution in time (Table 7). Trips attracted by the Wrst ring(16.2% growth) and by the second one (15.3%) rose morethan those attracted by the third ring (5.7%). In a previoussection we observed that Wrst and second rings attract moretrips (longer) from the third ring and less (shorter) from themunicipality of Madrid. On the other hand, in suburbanmunicipalities there was an increase in local trips, whichgreatly compensated for the increase in the length of sub-urb to suburb trips within a more complex Xow network(see Fig. 7).
Within the third ring there are diVerences between theinternal and external fringes. The average length of trips
Table 6Changes in average trip length (in km) according to generating fringes(third ring)
Source: CRTM mobility surveys 1988 and 1996.
Fringes 1988 1996 DiVerence % Change
Internal 10.61 10.48 ¡1.37 ¡1.3External 13.37 14.12 0.75 5.7
Table 7Changes in average trip length (in km) according to attracting ring
Source: CRTM mobility surveys 1988 and 1996.
Rings 1988 1996 DiVerence % Change
First ring 6.41 7.45 1.04 16.2Second ring 6.59 7.59 1.00 15.3Third ring 8.34 8.82 0.48 5.7Total 6.84 7.87 1.03 15.1
Fig. 8. Degree of concentration of attracted trips (measured on the basis of the coeYcient of variation).

J. Gutiérrez, J.C. García-Palomares / Journal of Transport Geography 15 (2007) 18–30 27
attracted by the internal fringe of the third ring may beexplained by decentralization itself, which increases thenumber of local trips but also the number of trips generatedby other suburban municipalities. In contrast, the externalfringe of the third ring, which receives less employment andmore population, shortens the lengths of the trips itattracts, possibly through the proximity of employment toan increasing population within this fringe (Table 8).
5.2. The increase in travel times
In the United States metropolitan areas, whilst the dis-tances covered underwent a considerable increase, traveltime remained stable, even despite a generalised increase
Table 8Changes in average trip length (in km) according to attracting fringes(third ring)
Source: CRTM mobility surveys 1988 and 1996.
Fringes 1988 1996 DiVerence % Change
Internal 8.00 8.63 0.63 8.0External 11.03 10.19 ¡0.84 ¡7.6
in traYc congestion (Lowe, 1998, p. 234; Levinson, 1998,p. 11). The increase in distances was compensated by ahigher proportion of suburb to suburb trips, at higherspeeds.
The case of Madrid in the period from 1988 to 1996 hasbeen quite diVerent. Travel times rose even further (31.6%)than distances covered (15.1%), despite the fact that heretoo the biggest increases occurred in suburb to suburb trips.Average travel time rose from 31.6 to 41.6 min. Travel timesincreased in all links, to a great extent because of the gener-alised increase in congestion, as well as the growing disper-sion of the population.
The more external the generating ring and the moreinternal the attracting one, the longer the travel time in themetropolitan area of Madrid. And the greatest lengtheningof travel time was in trips generated by the third ring(which increased from 32 to 46 min), and in those attractedby the municipality of Madrid (from 32 to 44) (Figs. 9 and10). Thus, previously existing diVerences have likewiseincreased. This leads one to think that it is the centripetalradial movements which undergo the greatest timeincreases.
Fig. 9. Changes in travel times according to generating ring: 1988–1996.
Fig. 10. Changes in travel times according to attracting ring: 1988–1996.

28 J. Gutiérrez, J.C. García-Palomares / Journal of Transport Geography 15 (2007) 18–30
In eVect, breaking down the travel times according togenerating and attracting rings (Tables 9 and 10), showsthat it is the radial trips generated by the third ring andattracted by the Wrst one which take longest (more than onehour). Because of the increase in distances and the eVect ofcongestion on the radial routes, it is precisely these tripsthat display the highest increases, more than 20 min.
Finally, the evolution of travel times in both public andprivate transport allowed for the inclusion of new ele-ments for analysis. Comparison of travel times betweenmodes according to type of relationship is invariablyfavourable to private transport. On average, the use ofpublic transport instead of cars took 21.4 min, or 70.4%longer (Table 11). DiVerences also appear according torings. Within the Wrst ring, due to traYc congestion andpublic transport eYciency, public transport competeseYciently with cars and travel time diVerences are less(27.3%). In inward trips public transport is more competi-tive (59.7% more travel time in trips generated by the thirdring and attracted by the Wrst one) than in reverse ones(97.2% more in trips generated by the Wrst ring andattracted by the third one), for there is more traYc con-gestion in the former than in the latter. In trips generatedand attracted by the third ring the travel time diVerencesbetween modes are very high (123.6%), due to the disper-sion and fragmentation of the suburban space, wherepublic transport is ineYcient.
Table 9Average travel times (in min) according to type of link: 1988 and 1996
Source: CRTM mobility surveys 1988 and 1996.
First ring Second ring Third ring Total
1988First ring 23.4 33.8 51.6 26.7Second ring 31.7 29.3 44.7 32.3Third ring 46.6 46.0 20.0 32.1Total 32.2 31.5 26.2 31.6
1996First ring 28.7 37.1 56.2 34.3Second ring 42.3 36.8 57.2 41.4Third ring 70.2 64.2 28.7 46.1Total 44.0 43.5 36.0 41.6
Table 10Increase in average travel times (in min and %) according to type of link:1988–1996
Source: CRTM mobility surveys 1988 and 1996.
First ring Second ring Third ring Total
MinutesFirst ring 5.3 3.3 4.6 7.6Second ring 10.6 7.5 12.5 9.1Third ring 23.6 18.2 8.7 14.0Total 11.8 12.0 9.8 10.0
%First ring 22.9 9.9 9.0 28.5Second ring 33.3 25.5 27.8 28.2Third ring 50.5 39.5 43.6 43.6Total 36.6 38.1 37.4 31.6
However the most alarming aspect is that travel timediVerence between modes increased by 8 min during theperiod analysed (Table 12), rising from 13 min in 1988 to 21in 1996 for the overall total of trips. Whilst this diVerencefor inner trips in the Wrst ring was slightly reduced and inthe remaining internal links within the city of Madrid theincreases were moderate (about 3 or 4 min), there was anotable increase in travel time diVerences in all relation-ships within the third ring, being between 15 and 20 min.The growing population dispersion (new residential spaceswith medium and low densities and scant access to publictransport) and the building of new attracting areas on thesuburbs (of a fragmented nature, designed more for the carthan for access by public transport) explain these growingdiYculties in public transport to compete with the privatecar in the suburbs.
6. Conclusion
Metropolises are experiencing an unprecedented expan-sion and an intense inner restructuring. Formal and func-tional changes are creating metropolitan spaces of anincreasingly discontinuous, dispersed and fragmentednature that substantially aVects the patterns of mobility.The new metropolitan peripheries have a growing need fortransport of diVerent characteristics to those of the tradi-tional city: more and longer motorized trips, particularly by
Table 11Travel time diVerences between public and private transport according totype of relationship in 1996
Source: CRTM mobility survey 1996.
First ring Second ring Third ring Total
DiVerence (min)First ring 6.6 13.8 38.5 9.4Second ring 14.5 20.3 39.7 18.3Third ring 30.8 37.4 26.7 39.9Total 12.9 21.8 33.6 21.4
In %First ring 27.3 48.6 97.2 33.2Second ring 44.8 79.3 93.9 59.8Third ring 59.7 81.3 123.6 129.5Total 36.2 69.2 128.7 70.4
Table 12Changes in travel time diVerences between public and private transportaccording to type of relationship in the period 1988–1996
Source: CRTM mobility surveys 1988 and 1996.
First ring Second ring Third ring Total
Changes in minutesFirst ring ¡0.5 3.2 20.2 2.2Second ring 4.5 4.5 19.8 5.1Third ring 15.1 16.1 15.7 18.1Total 2.7 7.2 17.9 8.2
Changes in %First ring ¡7.1 30.7 110.7 30.2Second ring 44.8 28.9 99.8 38.7Third ring 95.6 76.0 143.7 90.1Total 26.2 49.0 114.0 61.6
J. Gutiérrez, J.C. García-Palomares / Journal of Transport Geography 15 (2007) 18–30 29
car, from low-density residential areas to multiple sub-cen-tres, building a complex and dispersed Xow network.Dependency on the central city is weakening at the sametime as suburb to suburb trips increase, thus forming Xownetworks that resemble a spider’s web that covers a poly-centric landscape.
The Madrid metropolitan area is not exempt from theseprocesses of change. Residential spaces extend over themore peripheral locations with decreasing densities andoften physically separate from one another. The decentral-ization of employment has generated a structure with newattracting spaces of diVerent types. In some cases, clustersof oYces, industrial parks and shopping centres make upnew peripheral sub-centres; but in other instances, they arescattered over the territory in a highly fragmented way.
There are many papers on the spatial transformations ofEuropean and North American metropolises, but only fewof them have underlined the role of transport within thesedynamics, and even fewer have focused on daily mobility.The aim of this paper was precisely to study the changes inthe mobility patterns recorded over the past few yearsrelated to the transformations in the metropolitan space.We have analysed three aspects of the new mobility pat-terns: changes in Xow networks structures (orientation anddispersion of Xows), distances and travel times.
As we have seen, the Xow networks of the metropolitanarea of Madrid have become more complex and dispersed.Bearing in mind the orientation of trips generated by thesuburbs, a considerable growth was observed in the pro-portion of local and suburb to suburb trips and a drop inthose towards the municipality of Madrid. Therefore,there is a reduction in functional dependency on the cen-tral city of Madrid and, above all, greater integrationamong suburban municipalities, trends that should berelated to employment decentralization and the buildingof the M-40, a new external orbital motorway (Gutiérrezand Gómez, 1999).
The eVects of employment decentralization and popula-tion suburbanization are very diVerent depending on typeof suburban fringe. In the internal fringe, more aVected bydecentralization, local trips have increased, whilst in theexternal one, more aVected by population suburbanization,local trips have decreased.
In order to measure the degree of polarisation/dispersionof trips generated and attracted by each spatial unit, weused the coeYcient of variation. The results obtained con-Wrm how the degree of concentration has dropped in allrings, especially in the third ring, which means that subur-ban municipalities have links with more spatial units, thatis, the Xow networks are becoming more complex and dis-persed.
As an eVect of decentralization, trips generated by theinternal fringe of the suburban ring are slightly shorter(more local trips), but trips generated by the Wrst and sec-ond rings are longer (more trips attracted by the suburbanring). On the other hand, as an eVect of population sub-urbanization, trips generated by the external fringe of the
suburban ring are longer (less local trips) and the trips gen-erated by the Wrst and second rings are longer too: moretrips (longer) are attracted by the suburban ring and fewer(shorter) by the municipality of Madrid.
As for trip time, this has increased far more than dis-tance (31% as against 15%). Growth of travel times wasparticularly high in radial links in which problems of traYccongestion have become especially severe. Travel timediVerences between public and private transport increasedparticularly in suburb to suburb trips, due to populationdispersion in the suburbs, fragmented decentralization andthe building of a new orbital motorway.
The evidence from Madrid shows that employmentdecentralization and population suburbanization have pro-duced complex eVects on the spatial patterns of daily mobil-ity. More local and suburb to suburb trips are observed inthe suburban ring due to employment decentralization. Thelength of the trips generated by this ring of suburbanmunicipalities does not increase. But many more trips gen-erated by the suburbs (longer than those generated by themunicipality of Madrid) produce a signiWcant averageincrease in distances covered in the metropolitan area as awhole. Travel times have increased in all relationships, par-ticularly in the trips generated by the suburban municipali-ties, due to the increasing congestion in this ring, wheremore and more trips are generated (and attracted). Finally,the Xow network displays a more dispersed and complexform, as a result of decentralization process.
Acknowledgement
Data and technical support from CRTM (ConsorcioRegional de Transportes de Madrid), Wnancial supportfrom Ministerio de Educación y Ciencia (TRA2005-06619/MODAL) and referees’ comments are gratefully acknowl-edged.
References
Anas, A., Arnott, R., Small, K., 1998. Urban spatial structure. Journal ofEconomic Literature 36 (3), 1426–1464.
Cervero, R., Wu, K.-L., 1998. Sub-centring and commuting: evidence fromthe San Francisco Bay area, 1980–90. Urban Studies 35 (7), 1059–1076.
Clark, W.A.V., Kupers-Linde, M., 1994. Commuting in restructuringurban regions. Urban Studies 31 (3), 465–484.
Giuliano, G., Small, K.A., 1999. The determinants of growth of employ-ment subcenters. Journal of Transport Geography 7 (3), 189–201.
Gordon, P., Richardson, H., 1991. The commuting paradox: evidence fromthe top twenty. Journal of the American Planning Association 57, 416–420.
Gutiérrez, J., Gómez, G., 1999. The impact of orbital motorways on intra-metropolitan accessibility: the case of the Madrid M-40. Journal ofTransport Geography 7 (1), 1–15.
Gutiérrez, J., García-Palomares, J.C., 2005. La movilidad en el área metro-politana de Madrid: el creciente uso del transporte privado. Anales deGeografía de la Universidad Complutense 25, 331–351.
Koening, J.G., 1993. El Nuevo esquema director de la región Île-de-France. In: Ministry of Public Works, Transport and Environment(Ed.), Movilidad y territorio en las grandes ciudades: el papel de la redviaria, Madrid, MOPTMA, pp. 99–122.

30 J. Gutiérrez, J.C. García-Palomares / Journal of Transport Geography 15 (2007) 18–30
Levinson, D., 1998. Accessibility and the journey to work. Journal ofTransport Geography 6 (1), 11–21.
Levinson, D., Kumar, A., 1994. The rational locator: why travel times haveremained stable. Journal of the American Planning Association 60,319–332.
Lowe, J.C., 1998. Patterns of spatial dispersion in metropolitan commut-ing. Urban Geography 19 (3), 232–253.
Naess, P., Sandberg, S., 1996. Workplace location, modal split and energyuse for commuting trips. Urban Studies 33, 557–580.
Sutton, C.J., 1999. Land use change along Denver’s I-225 beltway. Journalof Transport Geography 7 (1), 31–41.
Wachs, M., Taylor, B., Levine, N., Ong, P., 1993. The changing commute: acase study of the obs-housing relationships over time. Urban Studies30, 1711–1729.