gulf of alaska flatfish safe document - …. gulf of alaska shallow-water flatfish by benjamin j....
TRANSCRIPT

4. Gulf of Alaska Shallow-water Flatfish by
Benjamin J. Turnock, Teresa A’mar and Thomas K. Wilderbuer
November 19, 2009
Executive Summary
Summary of Major Changes
Changes in the input data The 2009 NMFS summer bottom-trawl survey biomass was used to estimate ABC and OFL for 2010 and 2011.
Changes in assessment methodology There were no changes to the assessment methods relative to the 2007 assessment.
Changes in assessment results Survey abundance estimates for the shallow-water complex were lower in 2009 compared to 2007 for northern rock sole, sand sole, starry flounder, butter sole, yellowfin sole and Alaska plaice. The 2009 survey abundance estimates were higher than the 2007 for southern rock sole and English sole.
The 2009 NMFS bottom-trawl survey biomass was used as current biomass for calculation of ABC for shallow-water flatfish species. The 2010 and 2011 ABC for shallow-water flatfish was 56,242 t, a decrease from 60,989 t in 2009, due to lower survey biomass for the total shallow-water complex in 2009 relative to 2007.
The recommended 2010 and 2011 shallow-water flatfish ABC and OFL levels are:
Year ABC OFL TAC 2008 and 2009 60,989 74,364 22,256
2010 56,242 67,768 2011 56,242 67,768
Response to SSC comments
SSC comments specific to the GOA flatfish assessment: Reassess natural mortality estimates for flatfish species.
This will be addressed in future assessments as more age data become available.

Introduction
The "flatfish" species complex previous to 1990 was managed as a group in the Gulf of Alaska and included the major flatfish species inhabiting the region with the exception of Pacific halibut (Hippoglossus stenolepis). The North Pacific Fishery Management Council divided the flatfish assemblage into four categories for management in 1990; "shallow flatfish" and "deep flatfish" (Table 4.1), flathead sole (Hippoglossoides elassodon) and arrowtooth flounder (Atheresthes stomias). This classification was made because of the significant difference in halibut bycatch rates in directed fisheries targeting on shallow-water and deep-water flatfish species. Arrowtooth flounder, because of its present high abundance and low commercial value, was separated from the group and managed under a separate acceptable biological catch (ABC). Flathead sole were likewise assigned a separate ABC since they overlap the depth distributions of the shallow-water and deep-water groups. In 1993 rex sole (Glyptocephalus zachirus) was split out of the deep-water management category because of concerns regarding the Pacific ocean perch bycatch in the rex sole target fishery.
The major species, which account for the majority of the current biomass for shallow-water flatfish are: northern rock sole (Lepidopsetta polyxystra), southern rock sole (Pleuronectes bilineata), butter sole (Pleuronectes isolepis), yellowfin sole (Pleuronectes asper), and starry flounder (Platichthys stellatus). For this assessment, biomass, fishing mortality rates, and ABC estimates are presented for each species and management category.
Beginning with the 1996 triennial trawl survey, rock sole was split into two species, a northern rock sole and a southern rock sole. Due to overlapping distributions, differential harvesting of the two species may occur, requiring separate management in the future.
This report describes flatfish catches taken from 1978 through October 3, 2009 and presents information on the status of flatfish stocks and their potential yield based on Gulf of Alaska demersal trawl survey data through 2009.
Catch history Since the passage of the MFMCA in 1977, the fishery for flatfish in the Gulf of Alaska has undergone changes. Until 1981 flatfish catch was primarily taken by foreign vessels targeting other species. With the cessation of foreign fishing in 1986, joint venture fishing began to account for the majority of the catch. In 1987, the gulf-wide flatfish catch increased with the joint venture fisheries accounting for nearly all of the increase. After 1988, only domestic fleets harvested flatfish.
Shallow-water flatfish catch has fluctuated over the last 30 years. Shallow-water flatfish catch was 5,455 t in 1978, catch declined to a low of 957 t in 1986 then increased to 9,715 t in 1993 (Table 4.2). Catches fluctuated between about 2,577 t and 9350 t from 1994 to 2003. Catches declined to 3,094 t in 2004 then increased to 9,708 t in 2008. Catch was 5,774 t through October 3, 2009. The flatfish fishery is likely to continue to be limited by the potential for high by-catches of Pacific halibut.
The North Pacific Fishery Management Council (NPFMC) Central Gulf management area has produced the majority of the flatfish catch from the Gulf of Alaska (Table 4.2). Since 1988 the majority of the harvest has occurred on the continental shelf and slope east of Kodiak Island. Although arrowtooth flounder comprised about half the catch, the fishery primarily targeted on rock, rex and Dover sole.
Flatfish catch is currently reported for deep-water flatfish, shallow-water flatfish, flathead sole and rex sole by management area. This assessment includes shallow-water flatfish only. The catch by species in each year was estimated by using the fraction of each species in their respective group from observer sampling in that year, multiplied by the total catch for the shallow-water group by gear type and management area (Table 4.3). Table 4.4 documents annual research catches (1977 – 1998, and 2009) from NMFS longline, trawl, and echo integration trawl surveys.

The shallow-water flatfish catch in 2009 through October 3, was about 9.5% of the ABC (60,989 t) and about 25.9% of the TAC (22,256 t). In 2008 (the most recent full year of data), total catch was 16% of the ABC and 43.6% of the TAC. The 2009 shallow-water flatfish fishery was open on January 20 to September 2 and opened again on October 1. Closures were due to the attainment of the halibut bycatch limit.
Estimates of retained and discarded catch (t) in the various trawl target fisheries, since 1991, by management assemblage, were calculated from discard rates observed from at-sea sampling and industry reported retained catch (Table 4.5). Retention of shallow water flatfish was between 71% and 88% from 1994 to 2000. Retention for shallow-water flatfish has been between 87% and 94% from 2001 to 2009.
Condition of stocks Survey Abundance The principal source of information for evaluating the condition of flatfish stocks in the Gulf of Alaska is the bottom trawl survey conducted from 1984 to 2009 (Table 4.6 and Figure 4.1). Flatfish biomass estimates from the 2001, 2003, 2005, 2007 and 2009 surveys by International North Pacific Fishery Council (INPFC) area are given in Tables 4.7a through 4.7e. Sampling for the 2001 survey was conducted in the western and central portions of the Gulf of Alaska only. 2001 survey biomass for the eastern Gulf of Alaska was approximated using the average of the 1999 to 2003 eastern Gulf of Alaska biomass estimates for all flatfish species (Table 4.8).
The apportionment of survey sampling stations on the shelf and slope followed the methods developed for the shelf portion of the 1984 survey (Brown 1986). There was no sampling deeper than 500 meters during 1990 to 1996, and 2001 because of limited vessel time. The 500- 1,000 m depths sampled in 1984 and 1987, 1999, 2007 and 2009 are generally outside the depth range of most shallow-water flatfish species. The 2003 and 2005 survey covered depths to 700 m.
Northern rock sole biomass increased from 61,081 t in 1999 to 102,303 t in 2007, then decreased to 95,846 t in 2009. Southern rock sole has a generally increasing trend in survey biomass through 2009. Southern rock sole survey biomass increased from 105,522 t in 1999 to 191,765 t in 2009. Yellowfin sole biomass has a declining trend from 54,738 t in 2003 to 33,414 t in 2009. Butter sole declined from 30,174 t in 2007 to 15,405 t in 2009. Starry flounder biomass increased from 10,907 t in 1990 to 73,039 t in 2007, however, biomass declined to 33,264 t in 2009. English sole has a generally increasing trend over time, increasing from 8,403 t in 1993 to 18,671 t in 2009. Alaska plaice has also increased in abundance from 3,639 t in 2001 to 12,179 t in 2007, however, decreased to 7,788 t in 2009. Sand sole survey biomass has been quite variable over time, most recently increasing from 357 t in 2001 to 3,168 t in 2007, then decreasing to 2,808 t in 2009.
Current Exploitable Biomass The best available estimate of current exploitable biomass is assumed to be the 2009 survey biomass estimate because the non-exploitable (< 30 cm) component of the survey biomass is small and the survey bottom trawl (90 x 105 ft. Noreastern trawl with roller gear) is only partially selected for non-exploitable sizes.
Experimental evidence suggests that flatfish biomass estimates derived from the Noreastern trawl used in the survey may underestimate true biomass because the escapement occurs under the net (e.g., Weinberg et al., 2003).

Biological parameters
Natural mortality, Age of recruitment, and Maximum Age Natural mortality rates for Gulf of Alaska flatfish species were estimated using the methods of Alverson and Carney (1975), Pauly (1980), and Hoenig (1983) in the 1988 assessment (Wilderbuer and Brown 1989). The estimates were different for each method and were not inconsistent with the value of 0.2, used in previous assessments (Wilderbuer and Brown 1989). A natural mortality value of 0.2 was used for all flatfish (Table 4.12).
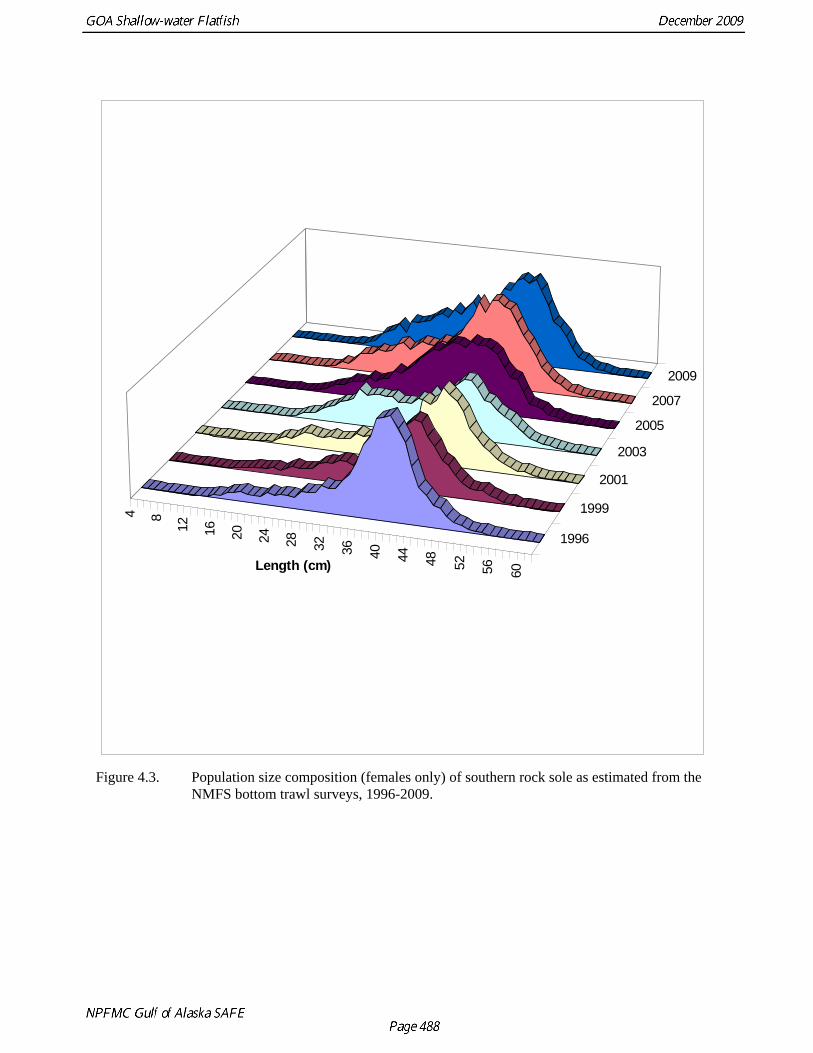
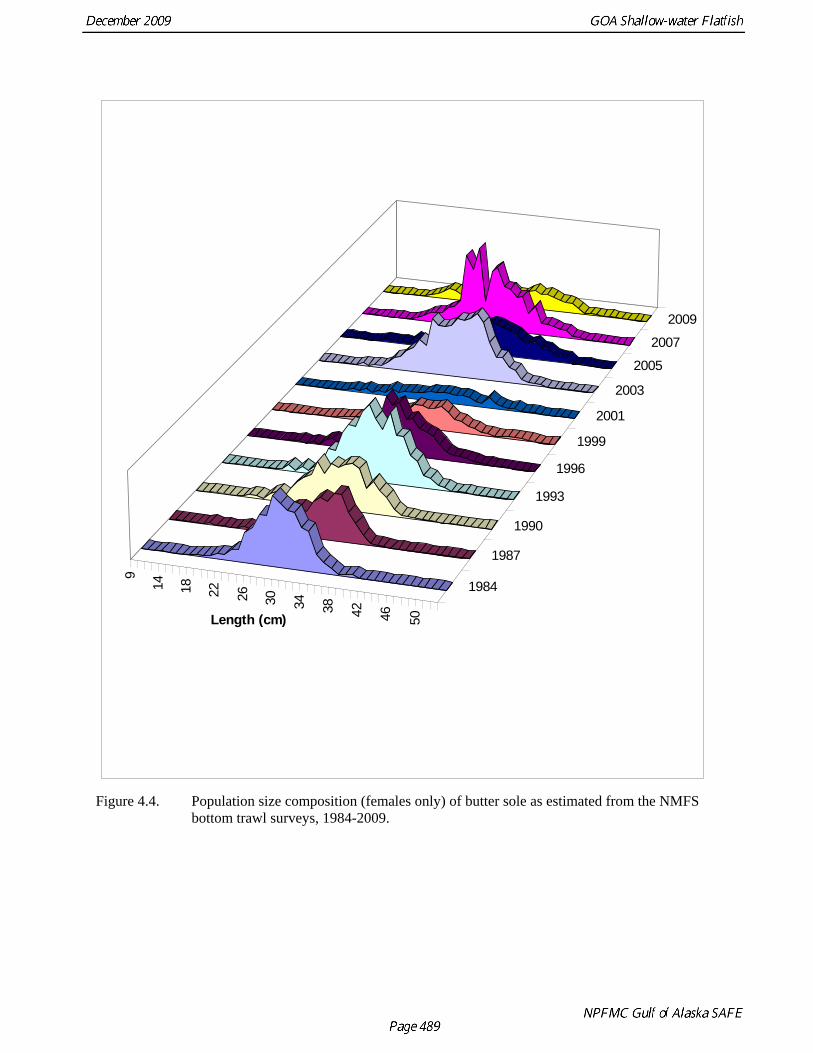
Length and Weight at Age Values for the parameters in the Von Bertalanffy age-length relationship were estimated from age structures collected during the trawl surveys (Table 4.13). Length composition data from the triennial surveys are shown in Figures 4.2 to 4.8. Aging of Gulf of Alaska flatfish species has been sporadic since the inception of the triennial surveys. Estimates of survey age compositions for flatfish are shown in Figure 4.9.
The parameters calculated for the length (cm) - weight (g) relationship: W = aLb (both sexes combined) are shown below:
Species a b Rock sole (northern and southern)
0.009984 3.0468
Yellowfin sole 0.006678 3.1793
Maturity at Age Maturity at age and size have been estimated only for northern and southern rock sole in the shallow-water complex. Northern rock sole females from the Kodiak Island area, Alaska, reached 50% maturity at 328 mm and an average age of 7 years. In contrast, southern rock sole females reached 50% maturity at 347 mm and an average age of 9 years (Stark and Somerton 2002). Northern rock sole females grew faster overall (K=0.24) than southern rock sole females (K=0.12) but reached a smaller maximum length (Linf=430 mm) than southern rock sole (Linf=520mm).
Ecosystem Considerations
Food habits Flatfish consume a variety of benthic organisms (Table 4.15; Livingston and Goiney 1983, Yang 1990). Fish prey make up a large part of the diet of rock sole adults and possibly sand sole (although the sample size was small for sand sole). Other flatfishes consume mostly polychaetes, crustaceans and mollusks.
Acceptable biological catch Northern and southern rock sole are in tier 4 of the ABC and overfishing (OFL) definitions, where FABC = F40% and FOFL = F35%. Northern and southern rock sole were estimated to be approximately fully selected in the survey at about 32 cm (age 7 and 8, respectively), by visual examination of size compositions from the fishery and applying the growth curve. Selectivities were applied as knife-edge for calculation of F40% and F35%. Southern rock sole F40% = 0.162, F35% =0.192, northern rock sole F40% = 0.204 , F35% = 0.245.
ABCs for all shallow-water flatfish species other than northern and southern rock sole were calculated using FABC= 0.75 M and FOFL = M (tier 5), since maturity information was not available. Natural

mortality was assumed to be 0.2 for butter sole, starry flounder, English sole, Alaska plaice, and sand sole. Recommended fishing mortality rates for ABCs are as follows:
Species FABC FOFL Southern rock sole 0.162 0.192 Northern rock sole 0.204 0.245 All other flatfish (except Greenland turbot and deep-sea sole) 0.15
0.2
The flatfish complex ABCs for the 2010 and 2011 fishing seasons were calculated using the catch equation, the FABC fishing mortality rate, and the 2009 survey biomass estimate for each species (Tables 4.16a and 4.16b). Overfishing values and yield are presented in Table 4.17.
The 2010 and 2011 ABC for shallow-water flatfish decreased to 56,242 t from 60,989 t in 2009 due to decreases in survey biomass.
Due to the overlapping distributions of flatfish species, especially in the shallow-water group, it may be difficult to target a species within an arbitrary management group without impacting other flatfish species in that group or other species which were "split-out" and managed separately. Given the present management strategy used by the North Pacific Fishery Management Council for Gulf of Alaska flatfish, some species may be subjected to higher fishing mortalities than that resulting from the recommended ABCs. The ongoing efforts by the observer program to improve species identification will help monitor these fisheries in the event that species compositions change.
Harvest Scenarios To Satisfy Requirements of NPFMC’S Amendment 56, NEPA, and MSFCMA
Under tiers 4 through 6 projections of harvest scenarios equivalent to tier 1 through 3 stocks is not possible. No projections were done for the shallow-water flatfish complex.
References Alverson, D., and M. Carney. 1975. A graphic review of the growth and decay of population cohorts.
Const. Int. Explor. Mer, 36(2): 133-143.
Brown, E. S. 1986. Preliminary results of the 1984 U.S.-Japan cooperative bottom trawl survey of the central and western Gulf of Alaska. In R.L. Major (editor), Condition of groundfish resources of the Gulf of Alaska as assessed in 1985, p. 259. U.S. Dep. Commer., NOAA Tech. Memo. NMFS F/NWC-106.
Deriso, R. B. 1980. Harvesting strategies and parameter estimation for an age-structured model. Can. J. Fish. Aquat. Sci. 37: 268-282.
Hoenig, J. 1983. Empirical use of longevity data to estimate mortality rates. Fish. Bull. 82: 898-903.
Livingston, P., and B. Goiney. 1983. Food habits literature of north pacific marine fishes: A review and selected bibliography. NOAA tech. Mem. NMFS F/NWC-54.
Murai, S., H. A. Gangmark, and R. R. French. 1981. All-nation removals of groundfish, Herring, and shrimp from the eastern Bering Sea and northeast Pacific Ocean, 1964-80. NWAFC report. 40 p.
Pauly, D. 1980. On the interrelationships between natural mortality, growth parameters, and mean environmental temperature in 175 fish stocks. J. Cons. Int. Explor. Mer, 39:175-192.

Stark, J.W. and D.A. Somerton. 2002. Maturation, spawning and growth of rock soles off Kodiak Island in the Gulf of Alaska. Journal of Fish Biology 61: 417-431.
Turnock, B.J., M. Wilkins, M. Saelens and R. Lauth. 1994. Status of west coast Dover sole in 1994. Status of the Pacific coast groundfish fishery through 1994 and recommended acceptable biological catches for 1995. Pacific Fishery Management Council, Portland, Oregon.
Weinberg, K. L., D. A. Somerton, and P. T. Munro. 2002. The effect of trawl speed on the footrope capture efficiency of a survey trawl. Fish. Res. 58:303-313.
Wilderbuer, T. K., and E. S. Brown. 1989. Flatfish. In T. K. Wilderbuer (editor), Condition of groundfish resources of the Gulf of Alaska as assessed in 1988. p. 199-218. U. S. Dep. Commer., NOAA Tech. Memo, NMFS F/NWC-165.
Yang, M. S. 1993. Food habits of the commercially important groundfishes in the Gulf of Alaska in 1990. U.S. Dept. Commer., NOAA Tech. Memo. NMFS-AFSC-22, 150 p.

Tables
Table 4.1. Flatfish constituents of the NPFMC Gulf of Alaska shallow-water management category. Common name Genus and Species
Northern rock sole Lepidopsetta polyxystra Southern rock sole Pleuronectes bilineata Yellowfin sole Pleuronectes asper Starry flounder Platichthys stellatus Butter sole Pleuronectes isolepis English sole Pleuronectes vetulus Alaska plaice Pleuronectes quadrituberculatus Sand sole Psettichthys melanostictus

Table 4.2. Composition of the 1978 to October 3, 2009 Gulf of Alaska shallow water flatfish catch. Catch by North Pacific Fishery Management Council regulatory area available from 1991 to present.
Area
Year Western Central Eastern Total ABC OFL TAC
1978 5,455
1979 5,625 1980 5,301 1981 5,890 1982 1,802 1983 4,146 1984 2,392 1985 1,020 1986 957 1987 3,561 1988 2,082 1989 6,160 1990 5,214 1991 2223 3074 1 5,298 1992 2470 6313 0 8,783 1993 424 9291 0 9,715 1994 189 3,742 12 3,943 1995 366 5,057 7 5,430 1996 443 8,876 31 9,350 1997 400 7,328 47 7,775 1998 270 3,204 91 3,565 1999 268 2,298 11 2,577 2000 560 6,319 49 6,928 2001 207 5,955 0 6,162 2002 223 5,970 2 6,195 2003 174 4,289 2 4,465 2004 135 2,958 1 3,094 2005 107 4,656 6 4,769 2006 239 7,401 1 7,641 2007 281 8512 0 8793 51,450 62,418 22,256 2008 761 8947 0 9708 60,989 74,364 22,256
2009 95 5678 1 5774 60,989 74,364 22,256
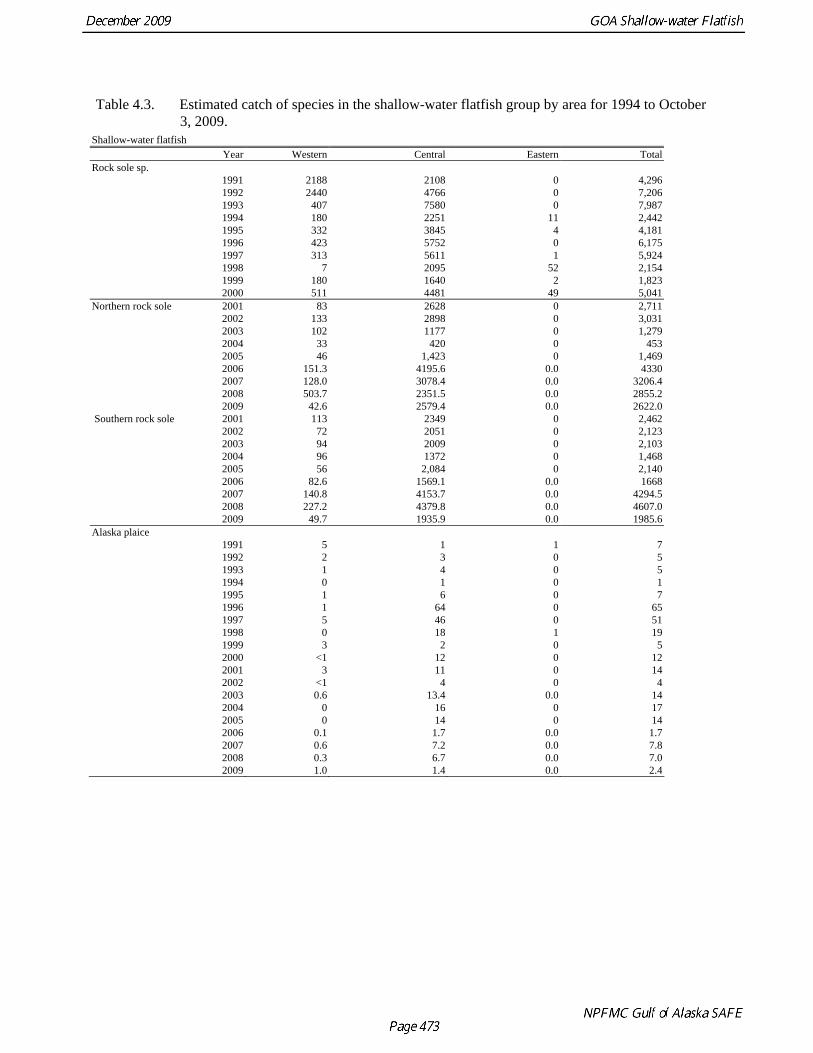
Table 4.3. Estimated catch of species in the shallow-water flatfish group by area for 1994 to October 3, 2009.
Shallow-water flatfish Year Western Central Eastern Total
Rock sole sp. 1991 2188 2108 0 4,2961992 2440 4766 0 7,2061993 407 7580 0 7,9871994 180 2251 11 2,4421995 332 3845 4 4,1811996 423 5752 0 6,1751997 313 5611 1 5,9241998 7 2095 52 2,1541999 180 1640 2 1,8232000 511 4481 49 5,041
Northern rock sole 2001 83 2628 0 2,7112002 133 2898 0 3,0312003 102 1177 0 1,2792004 33 420 0 4532005 46 1,423 0 1,4692006 151.3 4195.6 0.0 43302007 128.0 3078.4 0.0 3206.42008 503.7 2351.5 0.0 2855.22009 42.6 2579.4 0.0 2622.0
Southern rock sole 2001 113 2349 0 2,4622002 72 2051 0 2,1232003 94 2009 0 2,1032004 96 1372 0 1,4682005 56 2,084 0 2,1402006 82.6 1569.1 0.0 16682007 140.8 4153.7 0.0 4294.52008 227.2 4379.8 0.0 4607.02009 49.7 1935.9 0.0 1985.6
Alaska plaice 1991 5 1 1 71992 2 3 0 51993 1 4 0 51994 0 1 0 11995 1 6 0 71996 1 64 0 651997 5 46 0 511998 0 18 1 191999 3 2 0 52000 <1 12 0 122001 3 11 0 142002 <1 4 0 42003 0.6 13.4 0.0 142004 0 16 0 172005 0 14 0 142006 0.1 1.7 0.0 1.72007 0.6 7.2 0.0 7.82008 0.3 6.7 0.0 7.02009 1.0 1.4 0.0 2.4

Table 4.3. (continued) Estimated catch of species in the shallow-water flatfish group by area for 1994 to October 3, 2009.
Western Central Eastern TotalEnglish sole
1991 2 71 0 731992 1 47 0 481993 6 77 0 831994 4 42 0 461995 3 42 0 451996 5 82 29 1161997 16 70 45 1311998 122 35 1 1581999 1 14 0 152000 1 71 0 722001 <1 50 0 502002 2 20 0 222003 0.1 27.5 0.0 282004 2 35 0 362005 1 44 0 452006 2.9 29.2 1.0 33.12007 8.9 91.5 0.0 100.42008 28.0 111.2 0.0 139.22009 1.2 56.6 0.0 57.8
Western Central Eastern TotalButter sole
1991 8 562 0 5701992 15 1351 0 1,3661993 8 1429 0 1,4371994 0 1057 0 1,0571995 23 894 0 9171996 2 2351 0 2,3531997 15 979 0 9941998 39 488 15 5421999 0 420 9 4292000 <1 1263 0 1,2632001 3 702 0 7052002 <1 864 0 8642003 0.2 886 0.1 8872004 1 992 0 9932005 0 667 0 6672006 0.8 1211.5 0.0 1212.32007 0.3 847.8 0.0 848.12008 0.2 1923.0 0.0 1923.22009 0.0 989.4 0.0 989.4
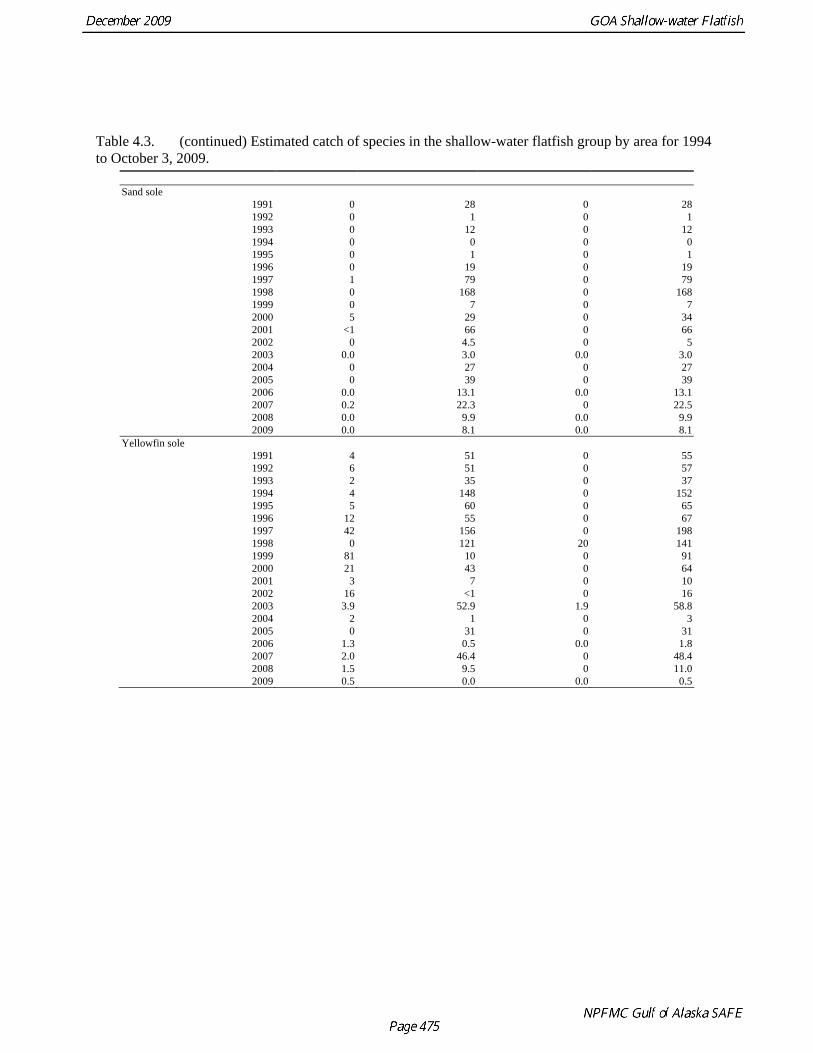
Table 4.3. (continued) Estimated catch of species in the shallow-water flatfish group by area for 1994 to October 3, 2009.
Sand sole
1991 0 28 0 281992 0 1 0 11993 0 12 0 121994 0 0 0 01995 0 1 0 11996 0 19 0 191997 1 79 0 791998 0 168 0 1681999 0 7 0 72000 5 29 0 342001 <1 66 0 662002 0 4.5 0 52003 0.0 3.0 0.0 3.02004 0 27 0 272005 0 39 0 392006 0.0 13.1 0.0 13.12007 0.2 22.3 0 22.52008 0.0 9.9 0.0 9.92009 0.0 8.1 0.0 8.1
Yellowfin sole 1991 4 51 0 551992 6 51 0 571993 2 35 0 371994 4 148 0 1521995 5 60 0 651996 12 55 0 671997 42 156 0 1981998 0 121 20 1411999 81 10 0 912000 21 43 0 642001 3 7 0 102002 16 <1 0 162003 3.9 52.9 1.9 58.82004 2 1 0 32005 0 31 0 312006 1.3 0.5 0.0 1.82007 2.0 46.4 0 48.42008 1.5 9.5 0 11.02009 0.5 0.0 0.0 0.5

Table 4.3. (continued) Estimated catch of species in the shallow-water flatfish group by area for 1994 to October 3, 2009.
Western Central Eastern Total Starry flounder
1991 16 253 0 2691992 6 94 0 1001993 0 154 0 1541994 1 91 0 921995 1 179 0 1801996 0 576 1 5771997 9 390 1 4011998 102 279 1 3821999 2 205 0 2072000 21 421 0 4422001 2 142 0 1442002 <1 128 2 1302003 0.0 154.6 0.0 154.62004 0 95 0 952005 0 217 0 2172006 0.1 380.2 0.0 380.32007 0.3 264.7 0.0 265.02008 0.1 155.4 0.0 155.52009 0.0 107.1 0.0 107.1
Table 4.4. Catch (t) from longline and trawl research cruises from 1977 to 2009. From 1999 to 2009 catches are from bottom trawl survey only.
Year Rock sole sp.
North Rock
South Rock
Yellowfin sole
Butter sole
Starry flounder
English sole
Sand sole
Alaska plaice
1977 4.26 1.17 0.22 0.12 0.04 0.00 0.011978 44.72 3.76 2.61 1.85 1.74 3.69 0.391979 0.96 0.00 0.06 0.00 0.02 0.00 0.001980 15.83 8.98 2.70 0.98 0.31 0.31 0.481981 30.84 10.91 5.05 1.86 0.53 0.24 0.751982 26.15 2.48 3.45 1.07 0.64 0.16 0.191983 3.32 1.67 0.30 0.02 0.02 0.00 0.031984 19.10 9.08 1.88 0.97 0.39 0.09 0.171985 3.22 0.05 0.23 0.02 0.14 0.00 0.031986 4.18 4.09 0.08 0.03 0.13 0.00 0.031987 24.56 6.85 1.43 1.52 0.87 0.00 0.531988 0.37 2.56 0.00 0.01 0.00 0.00 0.031989 1.12 1.78 0.07 0.13 0.00 0.00 0.251990 11.13 2.84 0.94 0.44 0.31 0.01 0.301991 0.00 0.00 0.00 0.00 0.00 0.00 0.001992 0.00 0.00 0.00 0.00 0.00 0.00 0.001993 16.53 7.26 2.17 3.19 0.59 0.04 0.261994 0.00 0.00 0.00 0.00 0.00 0.00 0.001995 0.00 0.00 0.00 0.00 0.00 0.00 0.001996 0.44 5.08 7.06 3.67 0.96 0.94 0.37 0.05 0.351997 0.00 0.00 0.00 0.00 0.00 0.00 0.00 0.001998 0.00 0.00 0.00 0.00 0.00 0.01 0.00 0.001999 3.60 5.78 2.83 0.75 2.69 0.72 0.01 0.522000 0.00 0.00 0.00 0.00 0.00 0.00 0.00 0.002001 3.72 7.48 4.23 0.50 2.74 0.19 0.03 0.242002 0.00 0.00 0.00 0.00 0.00 0.00 0.00 0.002003 6.73 9.76 5.20 1.57 3.06 0.74 0.07 0.722004 0.00 0.00 0.00 0.00 0.00 0.00 0.00 0.002005 6.62 9.64 4.02 1.55 1.65 0.68 0.21 0.552006 0.00 0.00 0.00 0.00 0.00 0.00 0.00 0.002007 7.95 12.10 3.61 1.49 3.93 0.52 0.22 0.882008 0.00 0.00 0.00 0.00 0.00 0.00 0.00 0.002009 7.92 13.78 2.68 1.23 1.91 1.05 0.22 0.65

Table 4.5. Percent (by weight) of catch for shallow-water flatfish that is retained for the Gulf of Alaska flatfish fisheries.
Year shallow-water flatfish 1994 73% 1995 71% 1996 86% 1997 81% 1998 83% 1999 77% 2000 88% 2001 91% 2002 91% 2003 90% 2004 87% 2005 93% 2006 92% 2007 94% 2008 93% 2009 88%
Table 4.6. Biomass estimates from the NMFS bottom-trawl surveys from 1984 to 2009. In 1984, 1987, 1999, 2007 and 2009 depths surveyed were to 1000 meters. In 1990, 1993 and 1996 depths were surveyed to 500 meters. In 2003 and 2005 the survey extended to 700 meters.
1984 1987 1990 1993 1996 1999 2001 2003 2005 2007 2009Rock sole
total 137,472 123,221 159,452 173,361 206,343 166,603 190,297 207,265 239,218 263,919 287,611
Northern rock sole
- - - - 78,845 61,081 64,240 79,998 91,525 102,303 95,846
Southern rock sole
- - - - 127,390 105,522 126,057 127,267 147,693 161,617 191,765
Yellowfin sole
91,341 56,135 61,290 81,329 47,789 48,309 55,303 54,738 48,823 41,824 33,414
Butter sole 22,504 19,273 17,307 29,809 20,916 14,188 9,812 31,148 26,226 30,174 15,405Starry
flounder 14,293 14,141 10,907 40,288 27,309 46,652 76,418 58,530 26,586 73,039 33,264
English sole
3,202 7,243 - 8,403 7,946 14,432 14,166 17,832 14,595 12,287 18,671
Sand sole 1,216 82 - 479 940 234 357 1,359 2,379 3,168 2,808Alaska plaice
1,912 4,830 - 2,583 4,870 8,680 3,639 5,078 7,939 12,179 7,788
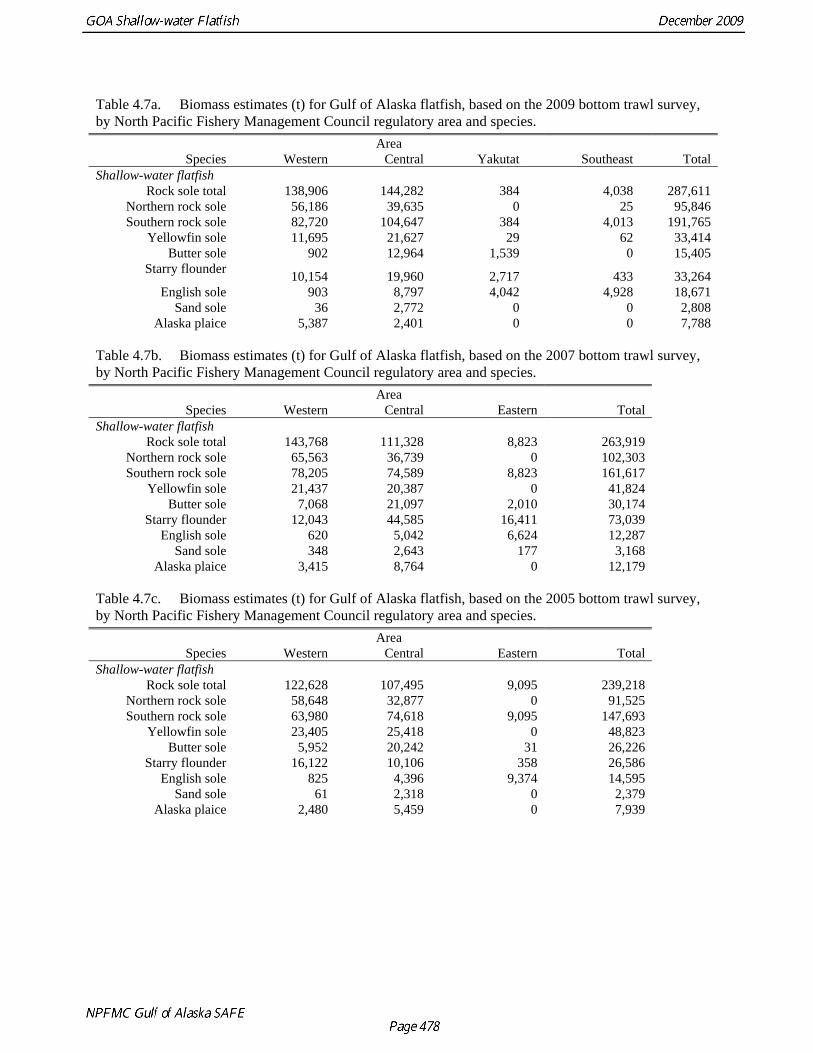
Table 4.7a. Biomass estimates (t) for Gulf of Alaska flatfish, based on the 2009 bottom trawl survey, by North Pacific Fishery Management Council regulatory area and species. Area
Species Western Central Yakutat Southeast Total Shallow-water flatfish
Rock sole total 138,906 144,282 384 4,038 287,611 Northern rock sole 56,186 39,635 0 25 95,846 Southern rock sole 82,720 104,647 384 4,013 191,765
Yellowfin sole 11,695 21,627 29 62 33,414 Butter sole 902 12,964 1,539 0 15,405
Starry flounder 10,154 19,960 2,717 433 33,264 English sole 903 8,797 4,042 4,928 18,671
Sand sole 36 2,772 0 0 2,808 Alaska plaice 5,387 2,401 0 0 7,788
Table 4.7b. Biomass estimates (t) for Gulf of Alaska flatfish, based on the 2007 bottom trawl survey, by North Pacific Fishery Management Council regulatory area and species. Area
Species Western Central Eastern Total Shallow-water flatfish
Rock sole total 143,768 111,328 8,823 263,919 Northern rock sole 65,563 36,739 0 102,303 Southern rock sole 78,205 74,589 8,823 161,617
Yellowfin sole 21,437 20,387 0 41,824 Butter sole 7,068 21,097 2,010 30,174
Starry flounder 12,043 44,585 16,411 73,039 English sole 620 5,042 6,624 12,287
Sand sole 348 2,643 177 3,168 Alaska plaice 3,415 8,764 0 12,179
Table 4.7c. Biomass estimates (t) for Gulf of Alaska flatfish, based on the 2005 bottom trawl survey, by North Pacific Fishery Management Council regulatory area and species. Area
Species Western Central Eastern Total Shallow-water flatfish
Rock sole total 122,628 107,495 9,095 239,218 Northern rock sole 58,648 32,877 0 91,525 Southern rock sole 63,980 74,618 9,095 147,693
Yellowfin sole 23,405 25,418 0 48,823 Butter sole 5,952 20,242 31 26,226
Starry flounder 16,122 10,106 358 26,586 English sole 825 4,396 9,374 14,595
Sand sole 61 2,318 0 2,379 Alaska plaice 2,480 5,459 0 7,939

Table 4.7d. Biomass estimates (t) for Gulf of Alaska flatfish, based on the 2003 bottom trawl survey, by North Pacific Fishery Management Council regulatory area and species. Area
Species Western Central Eastern Total
Shallow-water flatfish Rock sole total
Northern rock sole 43,127 36,871 0 79,998 Southern rock sole 55,116 65,251 6,900 127,267
Yellowfin sole 42,178 12,560 0 54,738 Butter sole 3,370 25,123 2,655 31,148
Starry flounder 5,355 49,793 3,382 58,530 English sole 334 5,363 12,135 17,832
Sand sole 0 1,331 28 1,359 Alaska plaice 2925.8 2152.2 0 5078

Table 4.7e. Biomass estimates (t) for Gulf of Alaska flatfish, based on the 2001 bottom trawl survey, by North Pacific Fishery Management Council regulatory area and species. Area
Species Western Central Eastern Total Shallow-water flatfish
Rock sole total 96,178 89,264 6,644 192,086 Northern rock sole 36,987 27,237 16 64,240 Southern rock sole 59,191 62,027 6,628 127,846
Yellowfin sole 49,586 5,612 43 55,241 Butter sole 3,338 5,578 1,965 10,881
Starry flounder 14,291 57,469 5,322 77,082 English sole 89 3,274 11,469 14,832
Sand sole 43 232 42 317 Alaska plaice 2,116 1,523 0 3,639
Table 4.8. Survey biomass in the Eastern Gulf of Alaska for 1993, 1996, 1999 and 2003. The biomass estimated for the Eastern Gulf in 2001 is the average of the 1999 and 2003 eastern gulf biomass.
Species 1993 1996 1999 2003 Average 1999 and 2003
Northern rock sole 0 31 0 16Southern rock sole 3,323 6,355 6,900 6,628Yellowfin sole 0 229 85 0 43Butter sole 2,906 104 1,274 2,655 1,965Starry flounder 5,193 1,518 7,262 3,382 5,322English sole 5,341 5,713 10,803 12,135 11,469Sand sole 8 183 56 28 42Alaska plaice 0 0 0 0 0
Table 4.9. Biomass estimates (t) for Gulf of Alaska flatfish, based on the 1999 bottom trawl survey, by North Pacific Fishery Management Council regulatory area and species.
Area Species Western Central Eastern Total
Shallow-water flatfish
Rock sole total 89,487 70,730 6386 166,603 Northern rock sole 44,731 16,319 31 61,081 Southern rock sole 44,756 54,411 6,355 105,522
Yellowfin sole 36,368 11,856 85 48,309 Butter sole 4,985 7,929 1,274 14,188
Starry flounder 10,627 28,763 7,262 46,652 English sole 563 3,066 10,803 14,432
Sand sole 61 117 56 234 Alaska plaice 5,647 3,033 0 8,680
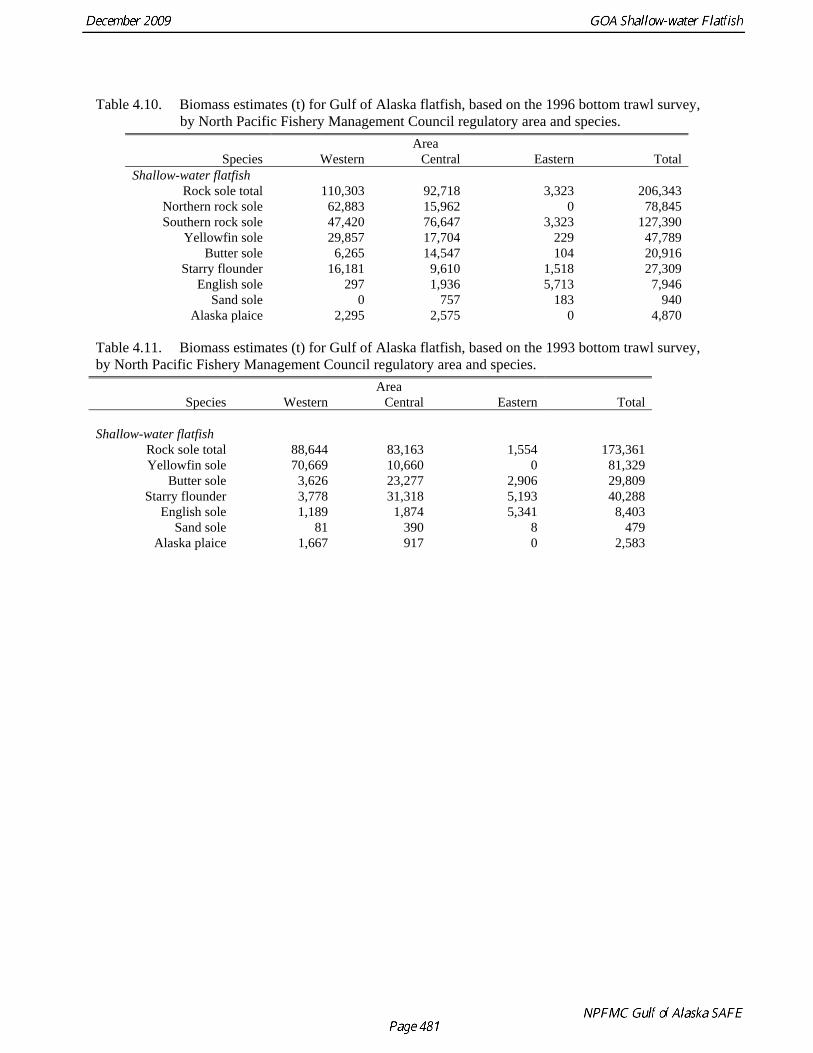
Table 4.10. Biomass estimates (t) for Gulf of Alaska flatfish, based on the 1996 bottom trawl survey, by North Pacific Fishery Management Council regulatory area and species.
Area Species Western Central Eastern Total
Shallow-water flatfish Rock sole total 110,303 92,718 3,323 206,343
Northern rock sole 62,883 15,962 0 78,845 Southern rock sole 47,420 76,647 3,323 127,390
Yellowfin sole 29,857 17,704 229 47,789 Butter sole 6,265 14,547 104 20,916
Starry flounder 16,181 9,610 1,518 27,309 English sole 297 1,936 5,713 7,946
Sand sole 0 757 183 940 Alaska plaice 2,295 2,575 0 4,870
Table 4.11. Biomass estimates (t) for Gulf of Alaska flatfish, based on the 1993 bottom trawl survey, by North Pacific Fishery Management Council regulatory area and species. Area
Species Western Central Eastern Total
Shallow-water flatfish Rock sole total 88,644 83,163 1,554 173,361 Yellowfin sole 70,669 10,660 0 81,329
Butter sole 3,626 23,277 2,906 29,809 Starry flounder 3,778 31,318 5,193 40,288
English sole 1,189 1,874 5,341 8,403 Sand sole 81 390 8 479
Alaska plaice 1,667 917 0 2,583

Table 4.12. Estimates of natural mortality, growth (von Bertalanffy k), and age of recruitment for the major Gulf of Alaska flatfish species in the shallow water complex.
Species Natural mortality Age at recruitment Northern rock sole 0.2 7 Southern rock sole 0.2 8
Yellowfin sole 0.2 9
Table 4.13. Von Bertalanffy parameter estimates for principal flatfish species in the Gulf of Alaska. Species Linf K t0Northern Rock sole(Stark and Somerton 2002) males 38.2 0.261 0.16females 42.9 0.236 0.387 Southern Rock sole(Stark and Somerton 2002) males 38.7 0.182 -0.962females 52 0.12 -0.715 Yellowfin sole 1987 survey males 32.8 0.19 -2.24females 38.2 0.14 -2.18combined 34 0.18 -1.82

Table 4.14. Maturity schedule (proportion females mature at age) for Gulf of Alaska northern and southern rock sole used for ABC calculations.
Age Northern Southern1 0.00 0.002 0.00 0.003 0.00 0.004 0.00 0.005 0.02 0.016 0.24 0.047 0.72 0.158 0.93 0.379 0.98 0.63
10 0.99 0.8211 1.00 0.9112 1.00 0.9613 1.00 0.9814 1.00 0.9915 1.00 0.9916 1.00 0.9917 1.00 1.0018 1.00 1.0019 1.00 1.0020 1.00 1.00
Table 4.15. Food habits of flatfish. Percent observed stomach contents in parentheses where available (Livingston and Goiney, 1983).
Fish species Observed stomach contents Rex sole Polychaetes, euphausiids, pandalus sp. Flathead sole various fishes(38%), mysids(36%), shrimp(15%), clams(6%), polychaetes(3%) rock sole-adults fish(40%) polychaetes(27%), clam siphons(10%) rock sole-juveniles fish(10%), polychaetes(45%), clam siphons(15%), gammarids(8%) yellowfin sole Polychaetes, shrimp, fish, tanner crab, clam siphons Dover sole Polychaetes(64%),crustaceans(11%),mollusks(18%), echinoderms(3%),
coelenterates(3%) English sole Polychaetes, ophiuroidea, ophiura sarsi, amphipoda, bivalves sand sole fish with a high frequency of arrowtooth flounder(only 4 stomachs out of 10 with food) starry flounder Echiuroidea(starfish), ophiuroidea(brittle star), fish, shrimp, crabs butter sole Polychaetes, ophiuroidea, crustacea, shrimp, tanner crab, fish

Table 4.16a. Acceptable biological catch (t) for 2010 and 2011 Gulf of Alaska flatfish, based on biomass estimates from the 2009 bottom trawl survey and FABC. Presented by North Pacific Fishery Management Council regulatory area. Split to Western, Central and Eastern management areas for the shallow water complex was estimated by applying the fraction of the 2009 survey biomass in each area.
AREA
Western Central West Yakutat East Yakutat/SE
Total
Shallow-water flatfish Northern Rock sole 9,429 6,652 0 4 16,085Southern Rock sole 11,243 14,223 52 545 26,064
Total Rock sole 20,672 20,875 52 550 42,149
Yellowfin sole 1,480 2,737 4 8 4,229Butter sole 114 1,641 195 0 1,950
Starry flounder 1,285 2,526 344 55 4,210English sole 114 1,113 512 624 2,363
Sand sole 5 351 0 0 355Alaska plaice 682 304 0 0 986
Total shallow-water 23,681 29,999 1,228 1,334 56,242
Table 4.16b. Percent of 2009 survey biomass by management area used in Table 4.16a to split ABC by management area.
Western Central West Yakutat
East Yakutat/SE Total
Shallow-water flatfish
Northern Rock sole 58.620 41.355 0.000 0.025 100Southern Rock sole 43.136 54.570 0.200 2.091 100
Total Rock sole 49.045 49.527 0.123 1.305 100
Yellowfin sole 34.996 64.720 0.095 0.189 100Butter sole 5.846 84.154 10.000 0.000 100
Starry flounder 30.523 60.000 8.171 1.306 100English sole 4.824 47.101 21.667 26.407 100
Sand sole 1.408 98.873 0.000 0.000 100Alaska plaice 69.168 30.832 0.000 0.000 100
Total shallow-
water 42.106 53.339 2.183 2.372 100
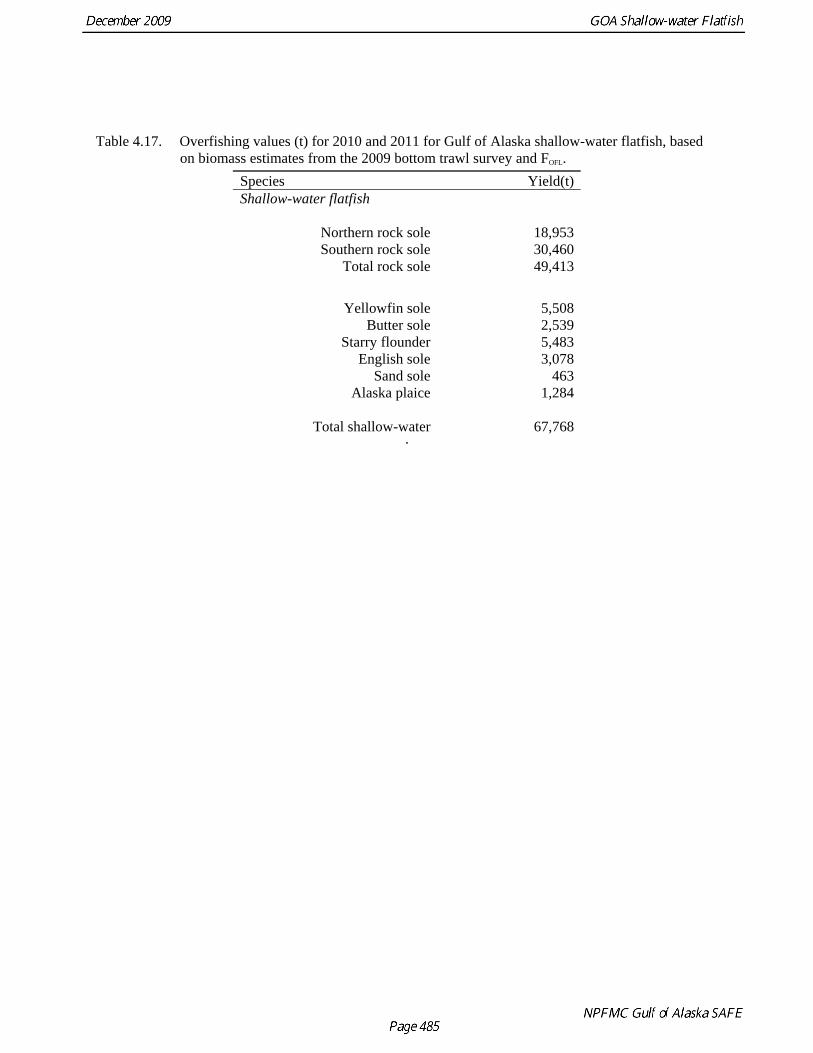
Table 4.17. Overfishing values (t) for 2010 and 2011 for Gulf of Alaska shallow-water flatfish, based on biomass estimates from the 2009 bottom trawl survey and FOFL.
Species Yield(t) Shallow-water flatfish
Northern rock sole 18,953 Southern rock sole 30,460
Total rock sole 49,413
Yellowfin sole 5,508
Butter sole 2,539 Starry flounder 5,483
English sole 3,078 Sand sole 463
Alaska plaice 1,284
Total shallow-water 67,768 .

Figures
0
50,000
100,000
150,000
200,000
250,000
300,000
350,000
1980 1985 1990 1995 2000 2005 2010
Rock soleNorthern rock soleSouthern rock sole
Yellowfin sole
0
20,000
40,000
60,000
80,000
100,000
1980 1985 1990 1995 2000 2005 2010
Butter sole
05,000
10,00015,00020,00025,00030,00035,000
1980 1985 1990 1995 2000 2005 2010
Starry flounder
0
20,000
40,000
60,000
80,000
100,000
1980 1985 1990 1995 2000 2005 2010
English sole
0
5,000
10,000
15,000
20,000
1980 1985 1990 1995 2000 2005 2010
Sand sole
0500
1,0001,5002,0002,5003,0003,500
1980 1985 1990 1995 2000 2005 2010
Alaska plaice
02,0004,0006,0008,000
10,00012,00014,000
1980 1985 1990 1995 2000 2005 2010
Figure 4.1. NMFS survey biomass estimates by shallow water flatfish species for 1984 to 2009.

9
13 17 21 25 29 33 37 41 45 49 53 57 61
1996
1999
2001
2003
2005
2007
2009
Length (cm)
Figure 4.2. Population size composition (females only) of northern rock sole as estimated from the
NMFS bottom trawl surveys, 1996-2009
4 8
12 16 20 24 28 32 36 40 44 48 52 56 60
1996
1999
2001
2003
2005
2007
2009
Length (cm)
Figure 4.3. Population size composition (females only) of southern rock sole as estimated from the
NMFS bottom trawl surveys, 1996-2009.
9
14 18 22 26 30 34 38 42 46 50
1984
1987
1990
1993
1996
1999
2001
2003
2005
2007
2009
Length (cm)
Figure 4.4. Population size composition (females only) of butter sole as estimated from the NMFS
bottom trawl surveys, 1984-2009.

7
21 25 29 33 37 41 45 49 53 57 61 65
1984
1987
1990
1993
1996
1999
2001
20032005
20072009
Length (cm)
Figure 4.5. Population size composition (females only) of Alaska plaice as estimated from the NMFS bottom trawl surveys, 1984-2009.

4
22 27 32 37 42 47 52 57 62 67 72
1984
1987
1990
1993
19961999
20012003
20052007
2009
Length (cm)
Figure 4.6. Population size composition (females only) of starry flounder as estimated from the NMFS bottom trawl surveys, 1984-2009.

4
18 22 26 30 34 38 42 46 50 54 58 62
1984
1987
1990
1993
1996
1999
2001
2003
20052007
2009
Length (cm)
Figure 4.7. Population size composition (females only) of English sole as estimated from the NMFS
bottom trawl surveys, 1984-2009.

8
12 16 20 24 28 32 36 40 44 48
1984
1987
1990
1993
1996
1999
2001
2003
2005
2007
2009
Length (cm)
Figure 4.8. Population size composition (females only) of yellowfin sole as estimated from the
NMFS bottom trawl surveys, 1984-2009.

1984 rock sole age composition
0
0.02
0.04
0.06
0.08
0.1
0.12
0.14
3 6 9 12 15 18 21Age
Prop
ortio
nYellowfin sole 1987 size
composition
00.020.040.060.08
0.10.120.14
4 6 8 10 12 14 16 18 20
Age
Prop
ortio
n
Figure 4.9. Shallow-water flatfish age compositions from NMFS surveys.