gujarat's developmental trajectory
TRANSCRIPT

2 |
Gujarat's Developmental Trajectory
A comparative HDI study of Ahmedabad
Junagadh and Surat

3 |
I. Abstract
The paper seeks to examine the correlation between economic and human development in
Gujarat. Despite witnessing massive rates of economic growth over decades, the parameters of
human development in Gujarat has been laggard. This disparity in development is reflected in
regional variations as well as in lack of access to basic facilities, particularly health and education
across the state. Based on primary data analysis of the State Human Development and the District
Human Development Reports, the paper conducts an empirical and comparative study of three
districts- Ahmedabad, Surat and Junagadh, and tries to discern the reason(s) for regional variations
and disparities. Through Amartya Sen's 'capability approach' to development', the study reaches the
conclusion that the growth trajectory in Gujarat needs to be more people-oriented and inclusive.
Keywords:
Human development; inclusive; capability approach; district human development report

4 |
INDEX
Abstract 2
Introduction 4
Conceptualizing Development 4
Gujarat's Growth trajectory vis-a vis India 7
Evaluating Gujarat's District Human Development 9
Conclusion 15
References 16

5 |
II. Introduction
Human and economic development is generally expected to develop simultaneously,
however, over the years, economists have established numerous inconsistencies to this trend. If we
look within India, Gujarat fits in this exception. It has been greatly unsuccessful to transform its
economic progress into equal human developmental progress despite being often viewed as an ideal
state in terms of economic development.
The objective of the paper is to understand the intra-state developmental gap in Gujarat's
growth trajectory through a comparative and empirical analysis of three districts, namely
Ahmedabad, Surat and Junagadh. The study is largely based on primary as well as secondary data
gathered from central/state government reports as well as UNDP's Human Development Report. In
order to attain the above research objective, the paper is organized into four parts. The first part
provides an evolutionary and conceptual analysis of the idea of development, ranging from the
narrow understanding of economic growth to the broader aspect of social development. In the second
part, the empirical connection between human development and economic growth in India,
particularly in the state of Gujarat is established by assessing various economic as well as social
indices. Based on the District Human Development Reports, the third section undertakes a
comparative study of the broad parameters of human development, particularly in the districts of
Ahmedabad, Surat and Junagadh. Towards the end, the paper draws an inference that Amartya Sen's
'capability approach' to development could be a useful starting point for making the Gujarat model of
development more inclusive and meaningful.
III. Conceptualizing Development: Shift from a growth dominated to a
Humane approach
There has been a growing recognition amongst scholars, academicians as well as policy-
makers about the positive co-relation between economic growth and human development. However,
over the years there exists two broad assumptions underpinning this connection. First, it is
commonly held that economic growth will invariably percolate down to the bottom and lead to
overall development of the people. Second, in case the first does not materialize on its own, it is
assumed that through policy intervention, the government will facilitate the requisite outcome(s). In
this regard, Hicks and Streeten (1979) made a critical observation when he stated that “highly
concentrated and unequal growth was observed in some countries for prolonged periods, so there

6 |
was no universal tendency for growth to spread. Nor did governments always show signs of
correcting gross inequalities.”1
Various theoretical and empirical studies have been carried out to examine this linkage
between economic growth and development. Such an emphasis on human well-being is not new.
Philosophers like Aristotle, Immanuel Kant, Karl Marx and others considered human welfare as
society's ultimate goal. In development studies, academic interest was primarily dominated by the
economic aspect whereas the non-economic dimension was either neglected or paid scant attention.
Classical theories of economics have largely looked at economic growth from the prism
of income and utility. For Adam Smith, three factors propelled economic growth − human capital,
technological progress and specialization of labour. Economists like Adam Smith did recognize the
importance of human capital, but it was understood as means towards the end of improved economic
growth. Economic indices like Gross Domestic Product (GDP), Gross National Product (GNP), per
capita income, etc were regarded as the measures for progress and development of a country. Such
economic indicators suffered from major limitations as they did not look into the non-economic
dimensions.
The need for a multi-dimensional and comprehensive measure of development has been
articulated for decades. However, policy intervention and academic interest concerning the arena of
human development started with the launch of the first Human Development Report in 1990. In the
1970's, Paul Streeten developed the 'Basic Needs Approach' which described food, health and
sanitation as basic needs that needed to be incorporated into economic planning and policy- making.
Amartya Sen and Mahbul-ul-Haq emerged as the most vocal critique of the dominant development
paradigm by focusing on enlargement of human choices as an essential component of development.
Indian economist Amartya Sen made a significant addition to the idea of human development
by advocating the 'Capability Approach.'2 The Capability Approach, first propounded in 1979,
contended that the living standard of people can be judged not by their incomes but capabilities to
lead a meaningful life. Sen (1989) further argued that development should be viewed in terms of
capability expansion and freedom rather than on a purely economic basis. Through such a
formulation of ideology about human development and welfare, Sen observes the focus shifts from
traditional quantifications of economic growth to freedom, where “capabilities are expressions of
freedoms themselves” (Sen, 2009).
1 Hicks, Norman, and Paul Streeten (1979), "Indicators of Development: The Search for a
Basic Needs Yardstick."World Development, Vol. 7, No.6, pp. 567-580.

7 |
According to Mahbul-ul-Haq, the link between economic growth and human development is
not definite and self-executing. Drawing from experiences from countries across the world, he
stressed the importance of investment in human capital (mainly health and education) and equitable
distribution of income and assets. He succinctly put it as "the real point of departure of human
development strategies is to approach every issue from the vantage point of people” (Haq1995). Both
Sen and Haq were the pioneers of the Human Development Report of the United Nation
Development Programme (UNDP).
By beginning with the statement "people are the real wealth of a nation”, the Human
Development Report, 1990 advanced the idea that “people are not just the means but more
importantly, the principal ends of development” (Gasper 2002). An important component of the
Human Development Report is the Human Development Index (HDI). The HDI, which was
developed in 1990 is used by UNDP to measure the quality of human life around the world. Human
development is defined as "enlarging freedoms so that all human beings can pursue choices that they
value. Such freedoms have two fundamental aspects—freedom of well-being, represented by
functional attributes and capabilities, and freedom of agency, represented by voice and autonomy"
(UNDP Human Development Report, 2016).
The Human Development Index (HDI) is a comprehensive evaluation of average fulfillment
in central features of human development: having a healthy life, basic level of education and income.
The HDI is the geometric mean of the establishment indices for the three dimensions and four
indicators, as mentioned below:
Components of HDI:
Long and Healthy Life: Life expectancy at birth
Knowledge: Mean years of education
Decent Standard of Living: Gross National Income per capital
2The Capability Approach was first articulated by the Indian economist and philosopher Amartya Sen in the
1980s and remains most closely associated with him. It has been employed extensively in the context of
human development as a broad alternative to narrowly economic metrics such as growth in GDP per capita.
Here ‘poverty’ is understood as deprivation in the capability to live a good life, and ‘development’ is
understood as capability expansion.
7 |
Secondary
58%
Tertiary
40%
Sectoral Share in the Indian economy (2015-16)
Primary
2%
Secondary
43%
Sectoral Share in the state
economy (2015-16)
Primary
18%
Tertiary 39%
2015-16 2014-15 2013-14 2012-13
4
2
0
India
Gujarat
12
10
8
6
Comparison of Gujarat's GDP vis-a-vis India
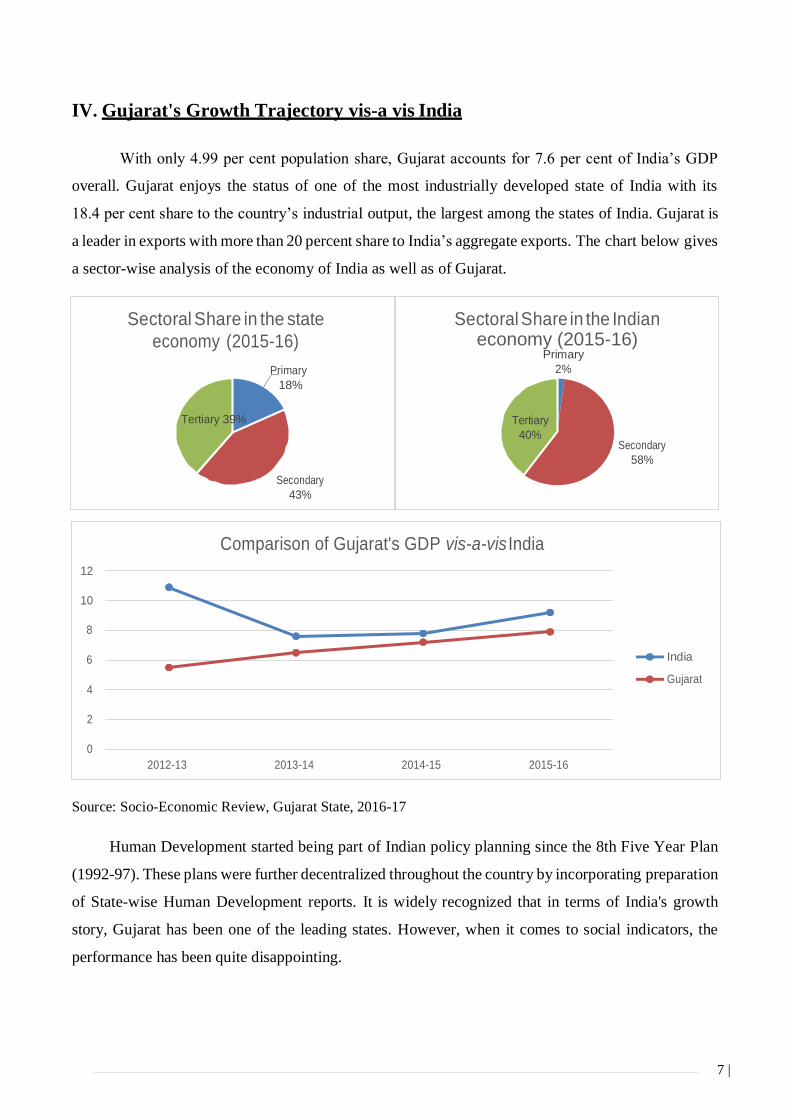
IV. Gujarat's Growth Trajectory vis-a vis India
With only 4.99 per cent population share, Gujarat accounts for 7.6 per cent of India’s GDP
overall. Gujarat enjoys the status of one of the most industrially developed state of India with its
18.4 per cent share to the country’s industrial output, the largest among the states of India. Gujarat is
a leader in exports with more than 20 percent share to India’s aggregate exports. The chart below gives
a sector-wise analysis of the economy of India as well as of Gujarat.
Source: Socio-Economic Review, Gujarat State, 2016-17
Human Development started being part of Indian policy planning since the 8th Five Year Plan
(1992-97). These plans were further decentralized throughout the country by incorporating preparation
of State-wise Human Development reports. It is widely recognized that in terms of India's growth
story, Gujarat has been one of the leading states. However, when it comes to social indicators, the
performance has been quite disappointing.

8 |
Year HDI Value
1990 0.428
1995 0.460
2000 0.494
2005 0.536
2010 0.580
2015 0.624
Source: UNDP India 2016
India’s HDI value for 2015 was 0.624 — which placed the country in the medium human
development category— placing it at 131 out of 188 countries and territories. It can be observed from
the above table that between 1990 and 2015, India’s HDI value increased from 0.428 to 0.624, an
increment of 45.7 percent. Gujarat with an HDI value of 0.616 stands at eleventh place in the
country. The highest HDI is Kerala’s, followed by Delhi-NCR, Himachal Pradesh and Goa. Further,
the Economic Survey (2016-17) enumerated that the social sector spending grew by 15 to 20 % in
Gujarat while the increase was more than 45 % in comparatively economically backward states like
Bihar (46%), Chhattisgarh (49%) and Jharkhand (53%).
Commenting upon Gujarat's growth model, Amartya Sen remarked that "Gujarat is behind,
particularly on the social side — lower educational pace, lower life expectancy, greater gender
inequality, a busted healthcare system that has not worked so well. What has been rather efficient in
business has not been so efficient on things that we are trying to concentrate in India to have a healthy
educated labour force." He however, conceded that Gujarat was invariably booming economically,

9 |
an interesting case for analyzing the correlation between economic and human development. The
most recent detailed UNDP data on State Human Development Report of Gujarat is 2004. The basic
Indicators used in that report includes health, income, education, gender empowerment. The most
challenging aspect of the study has been the unavailability of updated and reliable data on social
indicators. In order to attain human development, the state of Gujarat has adopted 'Taluka & Citizen
Centric approach'. However, the data on district-wise development reports are more recent. Based on
the data provided on District Human Development Reports of the three districts of Ahmedabad, Surat
and Junagadh, a comparative analysis of the broad parameters of social development, particularly
health and education has been done to contextualize Gujarat's development paradigm.
V. Evaluating Gujarat's District Human Development Report: Comparative
study of Ahmedabad, Surat and Junagadh
According to the 2011 census,
Gujarat comprises of 26 districts, sub-
divided into 225 talukas including
18225 villages and 348 towns. 7 new
districts were established in 2013,
increasing the total number of districts
to 33 and Talukas to 248. There exists
serious data inadequacy for micro-level
study of the districts.
The availability of primary data
on the human and social indicators
appears disaggregated and is perhaps
one of the key reasons for absence of
any proper empirical analysis of developmental dimension of growth. In this paper, the three districts
of Ahmedabad, Surat and Junagadh has been selected for study primarily due to availability of
district human development reports produced by Gujarat Social Infrastructure Development Society
(GSIDS) in partnership with the Gujarat government.
3 Sen Amartya, ’Gujarat model has weaknesses on social side', The Indian Express, 9 April 2014.

10 |
A. Demographic Profile
To comprehend the level of social and human development in these districts, it is necessary to
have a clear picture of the demographic composition of Ahmedabad, Surat and Junagadh vis- a-vis
Gujarat.
(Source: Census 2011)
From the above table and the chart, it can be clearly discerned that Ahmedabad is not only
the most economically robust district of Gujarat but is also the most populous and urban district. The
most urbanely populated district in Gujarat is Ahmedabad, followed by Surat and Rajkot districts.
Comparing its population statistics with the country, the district is 8th in India out of the 640
districts in the country (Census, 2011). On the contrary, Junagadh has encountered a real challenge
in accelerating its pace of urbanization. The paradoxical aspect of such low urbanization in the
district of Junagadh is that while the state of Gujarat is rapidly urbanizing, Junagadh district is still
laggard and backward. Moreover, the divide between levels of urbanization will enlarge presumably
over time. The fallout of faster urbanization in other districts would imply migration of educated
individuals to those districts/states. A major reason for lack of adequate urbanization is the consistent
undersupply of employment opportunities. Industrial development in the district has been rather
sluggish than that of other districts (District Human Development Report, 2017).
other important trend that can be inferred from the demographic composition of these 3
districts pertains to Sex Ratio. Although, the sex ratio in Ahmedabad has improved steadily from 892
Gujarat Ahmedabad Junagadh Surat
Decadal Growth Rate (2001-11) 19.3 22.31 12.05 42.91
Urban Population 42.6 84.04 33.04 79.74
Rural Population 57.4 15.96 66.96 20.06
Sex Ratio 91.9 90.4 94.5 78.7
0
10
20
30
40
50
60
70
80
90
100
in %
Comparison based on different demographic parameters

11 |
in 2001 to 904 in 2011, every district in the state (except Surat), has outperformed Ahmedabad
district in 2011 (District Human Development Report, 2016). This allude to a marked “daughter
deficit” in the demographic is perhaps a rooted culture of son preference (District Human
Development Report, 2016).
B. Education
Literacy, though considered the simplest of forms of educations, still remains one of the
foundational markers of educational attainment of a population. As defined by Census, literacy rate
is measured as the percentage of people aged 7 and above who have the ability to read and write.
According to the 2011 Census, Ahmedabad district has a literacy rate of 85.37%, which in
comparison with Gujarat and the national average of 79% and 74.04% is 7% and 11% higher
respectively. Among the 3 districts, Surat has witnessed the maximum growth in literacy rates since
2001. However, there are large variations in literacy rates among talukas of Surat district indicating
eminent regional imbalances within the district (District Human Development Report, 2016).
Literacy rate measures the basic level of accomplishment in the field of education. However,
it suffers from many limitations. Many significant issues such as quality of education, physical
infrastructure of schools, enrolment, dropout rates, etc are not captured by literacy rates. Elementary
education forms the cornerstone of any educational system.
Comparison of Literacy Rate (%)
Looking at the number of elementary schools − government and private − can be a useful
measure to understand the issue of accessibility. Till 2014-15, the number of government schools in
Ahmedabad stood at 1364, while for Junagadh it was 1363. There existed 1472 private schools in
Ahmedabad, while in Junagadh it was 758. Schooling accessibility has risen with enrolment statistics
in primary schools touching 100% in Ahmedabad. However, breaking from the trend, government
schools have decreased from 1501 in 2009-10 to about 1364 in 2014-15. (DHDR Ahmedabad, 2016).
There has been serious neglect of primary schools in Surat despite its paramount importance.
The District Human Development Report illustrates that the decrease in government schools
and the simultaneous rapid increment in private schools in Ahmedabad. The reasons quoted by
Ahmedabad district educational officials (Deputy Administrative officer and District Educational
Officer) to explain this trend:
• Parents consider government schools to be substandard quality when compared to private
schools.

12 |
Source: Census 2001 and 2011
• Ascent of the aspirational middle class with thriving income who wish to send
their children to private English medium schools.
• English as medium of instruction is a prime attraction for private schools. All
state government schools have Gujarati as the medium of instruction and
English is taught only as an individual subject (District Human Development
Report, 2016).
Gujarat Ahmedabad Junagadh Surat
2001 69.14 79.5 67.78 74.65
2011 78.03 85.37 75.8 85.53
0
10
20
30
40
50
60
70
80
90
Literacy Rate (%)
30
35
22
34
0
5
10
15
20
25
30
35
40
Gujarat Ahmedabad Junagadh Surat
Stu
den
ts-t
o-
Teac
her
Rat
io
State and the three cities
Comparison of Pupil-Teacher Ratio

13 |
The Pupil-teacher ratio is another effective leaning mechanism to understand the educational
system of a district. The pupil teacher ratio (2014-15) of the three districts vis-a- vis Gujarat are
represented in the chart above.
Apart from Junagarh, the pupil to teacher ratio seems to be in line with the state average of 30.
Total Enrolment Ratio i.e. the number of children receiving primary education in the age group of 6-11
years has been almost 100 per cent in the district of Surat.
Ensuring universal enrolment, controlling dropout rates, providing essential facilities and
improving quality standards of teachers — are all indicators of a strong educational system.
Recognizing this the state government has initiated series of actions to improve enrolment ratio, and
retention rate in primary schools. For the purpose of enhancing quality of education, the government
has initiated a programme called “Gunotsav” in which all government schools were asked to carry out
self-analysis on key parameters (Socio-Economic Review, 2017). All the schools in the districts were
covered under the Gunotsav campaign.
C. Health
The role of health in the well-being of an individual is well known. World Development Report
(1993) distinguishes four ways in which increased health levels conduces to economic growth:
• It decreases production losses caused by worker absenteeism and increases efficiency levels.
• It enables efficient usage of resources that had earlier been inaccessible because of lower health
levels of the workers.
• It improves children’s immunization thereby increasing the enrolment ratio of children in
school and more receptive to learn.
• It allows for different uses of resources that otherwise have to be spent on healthcare.
In India, public health comes under the jurisdiction of the state governments; however, some health-
related programs requiring higher and bigger investment outlay are funded by the central government.
Access to and the quality of health care services largely depends on hospitals, doctors and supporting
medical staff and other ancillary facilities. Various indicators are also used to measure health such as
crude birth rate (CBR), crude death rate the number of (CDR), Maternal Mortality Rate (MMR), Neo-
natal Mortality Rate (NMR), Infant Mortality Rate (IMR) etc.
In the rural areas, healthcare infrastructure has been established as a three-level structure. The
sub-centre is the outermost unit and the first point of contact between the primary healthcare system
and the public. Primary Health Centres (PHCs) remain the first point of contact between the rural
community and the Medical Officer. They are supported by a medical officer and by 14 supporting

14 |
paramedical and other staff (District Human Development Report, 2016).
Sub-
Centres
Primary
Health
Centres
Community
Health
Centres
Ahmedabad 238 43 12
Junagadh 237 38 10
Surat 337 50 14
Source: DHDR Ahmedabad (2016), Junagadh (2017), Surat (2016).
Surat with 14 Community Health Centres, 50 Primary Health Centres, and 337 sub-centres
covers a total of 729 villages performs better than the two districts. However, the health care
infrastructure is clearly urbanely biased in Surat. The most glaring feature of the above table is the
near equal level of healthcare infrastructure in Ahmedabad and Junagadh irrespective of the wide gap
in their economic growth.
On the basis of the micro-level analysis of the District Human Development Reports of the
three districts of Ahmedabad, Junagadh and Surat, the following broad inferences can be drawn:
• There is a stark rural-urban gap in the demography of these three districts. While Junagadh has
a rural population and economy, the districts of Ahmedabad and Surat are predominantly urban
in character.
• Existence of gender and regional disparities in education outcomes persists. Disaggregated data
on the literacy rate show considerable disparities based upon regional, gender, and caste
imbalances.
• While school infrastructure and overall enrolment ratio seem to be increasing, there are rising
concerns about the deterioration of quality of education affecting learning outcomes in
government-run schools.
• The three districts have shown immense variation in the nature and structure of primary
education. while the literacy rates in Ahmedabad and Gujarat has been above.
• There has been an increase in spending on health in the recent budget of the state government.
Ahmedabad, which is the engine of growth of the Gujarat state has quite unimpressive records
in the healthcare sector.

15 |
VI. Conclusion
The connection between the economic growth and human development has been well
established in academia over the years. However, the specific factors enabling this connection, as
also seen in the case of Indian state of Gujarat, has been less explored. There is a dire need of setting
priorities in policy-planning and execution. Moreover, the absence of an accessible and updated data
repository is the biggest stumbling block in identifying the exact status and challenges in meeting the
developmental needs of the people in these districts.
Amartya Sen's 'capability model' can be an important theoretical tool to re-orient Gujarat's
Model of economic development. There is a need to look beyond economic growth and evaluate
human well-being as the foundation of any meaningful and long-term planning strategy. Sen was of
the considered opinion that freedom constitutes the foundational value of human development. He
described human development as “the process of expanding the real freedoms that people enjoy”
(Sen, 1999).
Gujarat presents an example of a state with immense economic potential and this potential
can be recognized by enhancing human capabilities and expanding people participation at all levels.
The Human Development Report, 2016 itself recognizes that the principle of universalism is one
thing and converting it into its application is another. The idea of development has been introduced
in economic planning and policy, however, Gujarat's impressive growth record offers an apt time to
introspect and institutionalize such an expansive notion of development. The district of Ahmedabad is
representative of the growth-development paradox of the state. All the three districts under analysis
have witnessed improvement in social indicators but these improvements are not in keeping with the
economic growth of the state as a whole. In conclusion, the paper contends that Sen's capability
approach can be an effective mechanism to re-craft a development strategy in Gujarat which is more
inclusive, participatory and people-oriented. The consistent economic growth of Gujarat necessitates
an equivalent progress in human development for the growth to be sustainable and meaningful.

16 |
VII. References
1. Desmond, McNeill (2007) "Human Development’: The Power of the Idea", Journal of Human
Development, Vol.8, No.1, pp.5-22.
2. Devin K.Joshi and Kathleen McGrath (2015) "Political Ideology, Public Policy and Human
Development Index in India: Explaining the gap between Gujarat and Tamil Nadu", Journal of
Contemporary Asia, Vol 35, No 3 pp.465-489.
3. District Human Development Report, Surat (2016), Gujarat Social Infrastructure Development
Society (GSIDS), Gandhinagar.
4. District Human Development Report, Junagadh (2017) Gujarat Social Infrastructure
Development Society (GSIDS), Gandhinagar.
5. District Human Development Report, Ahmedabad (2016) Gujarat Social Infrastructure
Development Society (GSIDS), Gandhinagar.
6. Haq, Mahbub (1995), Reflections of Human Development, New York: Oxford University Press.
7. Hicks, Norman, and Paul Streeten (1979), "Indicators of Development: The Search for a Basic
Needs Yardstick."World Development, Vol. 7, No.6, pp. 567-580.
8. Hirway, Indira (2000), "Dynamics of Development in Gujarat", Economic and Political Weekly,
Vol. 35, pp.3106-3120.
9. Hirway, I., & Mahadevia, D. (2004), Gujarat Human Development Report, Mahatma Gandhi
Labour Research Institute, Ahmedabad.
10. Gasper, Des (2000). "Development as Freedom: Moving Economics beyond Commodities: The
Cautious Boldness of Amartya Sen”, Journal of International Development, Vol. 12, No.7,
pp.989-1001.
11. Gujarat model has weaknesses on social side (2014), The Indian Express, 9 April 2014
Available Online URL:http://indianexpress.com/article/india/india-others/gujarat-model-has-
weaknesses-on-social-side/
12. Ministry of Finance, Economic Survey (2016-17), Social Infrastructure, Employment and
Human Development, Chapter 10, pp.255-277.

17 |
13. Mukherjee, S. and Debashis Chakraborty (2010), "Is there any relationship between Economic
Growth and Human Development? Evidence from Indian States", MPPRA Paper No 22997.
Available Online URL:https://mpra.ub.uni-muenchen.de/22997/
14. Parwez, Sazzad (2016) "A Comparative Study of Gujarat and Kerala Developmental
Experiences", International Institute of Rural Management, Vol.12, No.2, pp.104-124.
15. Ranis, Gustav (2000) 'Economic Growth and Human Development', World Development,
Vol.28, No 22, pp. 197-219.
16. Sen, A.K., (1999), Development as Freedom, Oxford: Oxford University Press.
17. Sen, A.K. (1989), “Development as Capability Expansion”, Journal of Development Planning,
Vol.19, pp. 41– 58
18. Socio-Economic Review, Gujarat State (2017) Directorate of Economics and Statistics, General
Administration Department (Planning), Gandhinagar. Available Online :
URL:http://gujecostat.gujarat.gov.in/wp-content/uploads/2017/02/34%20-%20Socio-
Economic-Review-(English)-Part-I-III.pdf
19. UNDP Human Development Report 2016: Human Development for Everyone, UNDP, New
York Available Online:
URL:http://hdr.undp.org/sites/default/files/2016_human_development_report.pdf
20. UNDP India, Human Development Report (2016). Available Online:
URL:http://www.in.undp.org/content/india/en/home/library/hdr/human-development-
products/human-development-report-2016---human-development-for-everyone.html
21. World Development Report (1993), Investing in Health, New York: Oxford University Press.