gujarat technological university … gupta final thesis combined.pdf · a thesis submitted to...
TRANSCRIPT

Design, Development and Evaluation of Nanoformulation
for Brain Targeting and Bioavailability enhancement of
anti-viral drug
A Thesis submitted to Gujarat Technological University
for the Award of
Doctor of Philosophy
in
Pharmacy
by
Ms. Shweta H. Gupta
[Enrollment No. : 119997290052]
under supervision of
Dr. Rajesh K.S.
GUJARAT TECHNOLOGICAL UNIVERSITY
AHMEDABAD
June - 2017

ii
© Shweta H. Gupta

iii
DECLARATION
I declare that the thesis entitled “Design, Development and Evaluation of Nanoformulation
for Brain Targeting and Bioavailability enhancement of anti-viral drug” submitted by me
for the degree of Doctor of Philosophy is the record of research work carried out by me during
the period from July 2011 to July 2016 under the supervision of Dr. Rajesh K.S. and Dr.
Abdelwahab Omri and this has not formed the basis for the award of any degree, diploma,
associateship, fellowship, titles in this or any other University or other institution of higher
learning.
I further declare that the material obtained from other sources has been duly acknowledged in
the thesis. I shall be solely responsible for any plagiarism or other irregularities, if noticed in
the thesis.
Signature of the Research Scholar: …………………….………… Date: ….………………
Name of Research Scholar: Ms. Shweta H. Gupta
Place : Vadodara, Gujarat, India.

iv
CERTIFICATE
I certify that the work incorporated in the thesis “Design, Development and Evaluation of
Nanoformulation for Brain Targeting and Bioavailability enhancement of anti-viral drug”
submitted by Ms. Shweta Gupta was carried out by the candidate under my
supervision/guidance. To the best of my knowledge: (i) the candidate has not submitted the
same research work to any other institution for any degree/diploma, Associateship, Fellowship
or other similar titles (ii) the thesis submitted is a record of original research work done by the
Research Scholar during the period of study under my supervision, and (iii) the thesis
represents independent research work on the part of the Research Scholar.
Signature of Supervisor: ……………………………… Date: ………………
Name of Supervisor: ………………………………….
Place: ………………………………………….………

v
Originality Report Certificate
It is certified that PhD Thesis titled “Design, Development and Evaluation of
Nanoformulation for Brain Targeting and Bioavailability enhancement of anti-viral drug”
by Ms. Shweta Gupta has been examined by us. We undertake the following:
a. Thesis has significant new work / knowledge as compared already published or are
under consideration to be published elsewhere. No sentence, equation, diagram, table,
paragraph or section has been copied verbatim from previous work unless it is placed
under quotation marks and duly referenced.
b. The work presented is original and own work of the author (i.e. there is no plagiarism).
No ideas, processes, results or words of others have been presented as Author own
work.
c. There is no fabrication of data or results which have been compiled / analysed.
d. There is no falsification by manipulating research materials, equipment or processes, or
changing or omitting data or results such that the research is not accurately represented
in the research record.
e. The thesis has been checked using “turnitin” (copy of originality report attached) and
found within limits as per GTU Plagiarism Policy and instructions issued from time to
time (i.e. permitted similarity index <=25%).
Signature of the Research Scholar : …………………………… Date: ….………
Name of Research Scholar: …………………………………….
Place : ……………………………………………..……………
Signature of Supervisor: ……………………………… Date: ………………
Name of Supervisor: ………………………………………………….…………
Place: ……………………………………………………

vi

vii

viii
PhD THESIS Non-Exclusive License to
GUJARAT TECHNOLOGICAL UNIVERSITY
In consideration of being a PhD Research Scholar at GTU and in the interests of the facilitation
of research at GTU and elsewhere, I, Shweta H. Gupta (Enrollment No. : 119997290052)
hereby grant a non-exclusive, royalty free and perpetual license to GTU on the following terms:
a) GTU is permitted to archive, reproduce and distribute my thesis, in whole or in part, and/or
my abstract, in whole or in part ( referred to collectively as the “Work”) anywhere in the
world, for non-commercial purposes, in all forms of media;
b) GTU is permitted to authorize, sub-lease, sub-contract or procure any of the acts
mentioned in paragraph (a);
c) GTU is authorized to submit the Work at any National / International Library, under the
authority of their “Thesis Non-Exclusive License”;
d) The Universal Copyright Notice (©) shall appear on all copies made under the authority of
this license;
e) I undertake to submit my thesis, through my University, to any Library and Archives. Any
abstract submitted with the thesis will be considered to form part of the thesis.
f) I represent that my thesis is my original work, does not infringe any rights of others,
including privacy rights, and that I have the right to make the grant conferred by this
non-exclusive license.
g) If third party copyrighted material was included in my thesis for which, under the terms of
the Copyright Act, written permission from the copyright owners is required, I have
obtained such permission from the copyright owners to do the acts mentioned in paragraph
(a) above for the full term of copyright protection.
h) I retain copyright ownership and moral rights in my thesis, and may deal with the
copyright in my thesis, in any way consistent with rights granted by me to my University
in this non-exclusive license.
i) I further promise to inform any person to whom I may hereafter assign or license my
copyright in my thesis of the rights granted by me to my University in this non exclusive

ix
license.
j) I am aware of and agree to accept the conditions and regulations of PhD including all
policy matters related to authorship and plagiarism.
Signature of the Research Scholar:…………………….………
Name of Research Scholar:……………………………………
Date:…………………… Place: ……………………………
Signature of Supervisor:…………………………………………
Name of Supervisor:……………………………………………..
Date:…………………….. Place:
Seal:

x
Thesis Approval Form
The viva-voce of the PhD Thesis submitted by Ms. Shweta H. Gupta (Enrollment No.
119997290052) entitled “Design, Development and Evaluation of Nanoformulation for
Brain Targeting and Bioavailability enhancement of anti-viral drug” was conducted
on ………………………………........………… (day and date) at Gujarat Technological
University.
(Please tick any one of the following option)
The performance of the candidate was satisfactory. We recommend that he/she be awarded
the PhD degree.
Any further modifications in research work recommended by the panel after 3 months
from the date of first viva-voce upon request of the Supervisor or request of Independent
Research Scholar after which viva-voce can be re-conducted by the same panel again.
(briefly specify the modifications suggested by the panel)
The performance of the candidate was unsatisfactory. We recommend that he/she should not be
awarded the PhD degree.
(The panel must give justifications for rejecting the research work)
----------------------------------------------------- ----------------------------------------------
Name and Signature of Supervisor with Seal 1) (External Examiner 1) Name and Signature
---------------------------------------------------- ---------------------------------------------------
2) (External Examiner 2) Name and Signature 3) (External Examiner 3) Name and Signature
xi
ABSTRACT
HIV infections causing AIDS is one of the most life-threatening infections and is the sixth
leading cause of death. The non-nucleoside reverse transcriptase inhibitors, used for the
treatment of HIV infections are reported to have low bioavailability pertaining to high first pass
metabolism, high protein binding and enzymatic metabolism. They also show low permeability
across blood brain barrier. The central nervous system is reported to be the most important HIV
reservoir site. In the present study, solid lipid nanoparticles of efavirenz were prepared with the
objective to provide increased permeability and protection to drug by biocompatible lipidic
content and nano-scale size, and thus to develop formulation having potential for enhanced
bioavailability and brain targeting. Solid lipid nanoparticles (SLN) were prepared by high
pressure homogenization technique using a systematic approach of design of experiments and
evaluated for particle size, polydispersity index (PDI), zeta potential and entrapment efficiency.
Particles of average size 108.5 nm having PDI of 0.172 with 64.9% entrapment efficiency were
produced. Zeta potential was found to be -21.2 mV and the formulation was found stable.
Transmission electron microscopic evaluation and the histopathological studies respectively
indicated spherical shape and non-irritant nature of the formulated solid lipid nanoparticles. The
optimized SLN were incorporated in thermo-sensitive in-situ gelling system. The efavirenz
SLN based gel was evaluated for various parameters like gelation temperature, pH, viscosity,
transmittance, mucoadhesive strength, spreadability, in-vitro and ex-vivo release studies. The
release of drug was found to best fit in the Zero order release kinetics (R2 = 0.9873), indicating
concentration independent diffusion controlled release. The in-vivo pharmacokinetic studies
revealed increased concentration of the drug in brain, when administered through intranasal
route indicating its potential for an attempt towards complete eradication of HIV and cure of
HIV-infected patients.
Keywords: Efavirenz (EFV), SLN, High pressure homogenization, DoE, In-situ gel,
Nose-to-brain, Brain targeting

xii
ACKNOWLEDGEMENT
Thank you, God, for little things that often come our way-
the things we take for granted and don’t mention when we pray,
Thank You, God for the “miracles”, we are much too blind to see,
A hand reached out to help us, in the time of sudden need.
Thank u God for fulfilling my needs in a very special way!!!
I offer flowers of gratitude to the almighty God for the benediction and grace & for being the source of
strength throughout my life.
Every achievement is a result of committed activities that too when headed & guided by
worthy and knowledgeable persons. Clear paths or hazy roads I always remember the supports I got
from the people whose names I feel privileged to mention here. It is with a sense of pride and pleasure
that, I humbly look back to acknowledge, those who have been a source of encouragement in my entire
endeavour.
At the outset I feel that I may not have reached this stage without the blessings, love & care
of my well wishers, loving parents, beloved bhaiya, supportive husband and in-laws, didi-jiju & my
other relatives. I also acknowledge Gujarat Technological University for giving me the opportunity to
proceed with the research work and do the PhD.
With a deep sense of respect and gratitude, I would like to express my sincere thanks to my
esteemed guide, Dr. Rajesh K.S., Principal & Professor in Pharmaceutics, ISF college of Pharmacy,
Moga, Punjab for giving me the opportunity to work in the field of nanotechnology. Without his
perpetual encouragement, constructive guidance, advice and support throughout my journey of the
doctoral research, I would never have succeeded in accomplishing the work.
My sincere gratitude to my co-guide, Dr. Abdel Omri, Professor, Laurentia University, Canada
for showing his willingness to act as my international co-guide and providing his valuable insights,
prompt, timely and helpful guidance throughout as well as for the unmatched support rendered at the
time of publication of the articles too.
With great reverence, I take this opportunity to express my debt of gratitude to the DPC
(Doctoral Progress committee) members, Dr. A.N. Misra, Professor, Faculty of Pharmacy, M.S.
University of Baroda and Dr. N.P. Chotai, Professor, A.R. College of Pharmacy, Vallabh Vidyanagar for
their critical review, guidance and support for the work.

xiii
I wish to express my heartiest thanks to Dr. Devanshu Patel and other members of the Managing
trustee of Parul University, Dr. Abhay Dharamsi, Dean and Principal, Faculty of Pharmacy, Dr.
Sulekha Bhadra, Head of the Pharmaceutics Dept, Dr. Lalit Lata Jha, Mr. Javid Mansuri, Mrs.
Archana Navale, Mr. Anand Pithadia, Mr. Ashish Patel, Mr. Akhil Nagar, Dr. Gajanan Shinde, Mr.
Surjya Narayan Mandal, Dr. Falguni Tandel, Ms. Monica, Ms. Rashmita and all others at Parul
University for providing me the infrastructural and other direct or indirect support for the successful
completion of research work. It would be remiss on my part if I don’t acknowledge the help and support
of all my friends and colleagues for their wonderful company, unending inspirations, motivations,
constant encouragement, technical assistance throughout the research work.
I am also thankful to SICART (Sophisticated Instrumentation Centre for Applied Research and
Testing) , Insta Analytical Labs and Chandrakant’s histopathological laboratory for providing me the
technical and infrastructural support for carrying out the TEM analysis, HPLC method development &
validation and histopathological studies respectively.
I am immensely thankful to M/s Sun Pharma Ltd., Sikkim, India for providing the gift sample
of drug, Paradise Healthcare, Vadodara for providing the internal standard, Sigma Aldrich for the
excipients and PASM hospital for providing the plasma samples required for the study.
I would like to bid special thanks appreciation to Mr. Shobharam Jamre, Librarian, Mr. Primesh
Patel, Stores in-charge, Vasavabhai, Ms. Priyanka Patel, Mrs. Anandiben, Mr. Praveenbhai, Simon
kaka, Govindbhai and to all office and laboratory staff of the Faculty of Pharmacy, Parul University for
their kind co-operation and assistance during the journey to this stage.
I would also like to put in record my thanks to Honorable Vice Chancellor Prof. (Dr.) Navin
Sheth), Ex-Vice-Chancellor Dr. Akshai Aggarwal, I/C Registrar, Mr. J.C.Lilani, Research Coordinator,
Ms. Mona Chaurasiya, Mr. Dhaval Gohil and other Staff Members of Ph.D section for their
co-operative assistance and support.
.
I express my sincere thanks and apology to all those who have contributed to the success of
this work & helped me in whatsoever manner during this work & whose name I might have missed
inadvertently or those who are like countless stars in numerous galaxies.
Thanks to one & all…
Date : …. June, 2017
Place : Baroda Shweta Gupta

xiv
Dedicated to my Beloved
Family Members
& The Supreme God…

xv
Table of Contents
S.No. Contents P.No.
i Title Page……………………………………………………………….. i
ii Declaration……………………………………………………………... iii
iii Certificate………………………………………………………………. iv
iv Originality Report Certificate………………………………………….. v
v Non-Exclusive License Certificate…………………………………….. viii
vi Thesis Approval Certificate……………………………………………. x
vii Abstract………………………………………………………………… xi
viii
ix
Acknowledgement………………………………………………………
Dedication page………………………………………………………
xii
xiv
x Table of Contents……………………………………………………….. xv
xi List of Abbreviation……………………………………………………. xxii
xii List of Symbols………………………………………………………… xxv
xiii List of Figures………………………………………………………….. xxvi
xiv
xv
List of Tables……………………………………………………………
List of Appendices………………………………………………………
xxix
xxxii
Chapter 1 Introduction………………………………………………………….. 1-11
1.1 Definition of the problem…………………………………………….… 1
1.2 Aim of the research work………………………………………………. 2
1.3 Objectives and scope of work………………………………………….. 2
1.4 Rationale of the research work…………………………………………. 3
1.4.1 Selection of anti-viral drug…………………………………………….. 3
1.4.1.1 Challenges associated with the anti-viral drugs including
efavirenz……………………………………………………………….
3
1.4.2 The need for the present investigation…………………………………. 4
1.4.3 Selection of Nano-formulation………………………………………… 4
1.4.3.1 Solid Lipid Nanoparticles……………………………………… 5

xvi
1.4.4 Selection of Nasal route of drug delivery……………………………… 5
1.5 Hypothesis……………………………………………………………… 6
1.6 Proposed plan of work………………………………………………… 6
1.7 Outline of Thesis………………………………………………………. 7
1.8 References……………………………………………………………. 8
Chapter 2 Literature Review……………………………………………………. 12-54
2.1 Overview……………………………………………………………… 12
2.2 Virus……………………………………………………………………. 12
2.2.1 Structure of virus………………………………………………………. 12
2.2.2 Types of viruses………………………………………………………… 13
2.2.2.1 Retrovirus…………………………………………………… 14
2.2.2.2 Differences between virus and retroviruses………………… 15
2.2.3 Human Immunodeficiency Virus (HIV)………………………………. 16
2.2.3.1 Structure of HIV…………………………………………… 16
2.3 Viral Infections………………………………………………………… 17
2.3.1 Types of viral infections………………………………………………. 18
2.3.2 Acquired immune deficiency syndrome (AIDS)……………………… 19
2.3.2.1 Current therapies for AIDS …………………………………. 19
2.3.2.2 HAART: Combination therapy……………………………… 20
2.4 Central Nervous System (CNS)……………………………………….. 21
2.4.1 Brain…………………………………………………………………… 21
2.5 Brain Targeting…………………………………………………………. 23
2.5.1 Blood – brain barrier and Blood-cerebrospinal fluid barrier…………… 23
2.5.2 Transport routes across the blood-brain barrier………………………… 24
2.5.3 Approaches for transporting drugs across the blood brain barrier……..
2.5.3.1 Drug modification approach…………………………………..
2.5.3.2 Disruption of BBB…………………………………………….
2.5.3.3 Inhibition of transporters……………………………………..
2.5.3.4 Active targeting strategies……………………………………
25
25
26
26
27
xvii
2.5.3.5 Nanotechnology/ Development of novel drug delivery systems/
Nanoformulations / Nanocarriers
2.5.3.6 Alternate route of drug delivery/ Nose-to-brain delivery
27
27
2.6 Solid Lipd Nanoparticles……………………………………………… 28
2.6.1 Advantages of SLN…………………………………………………… 28
2.6.2 Solid Lipid Nanoparticles for Nose to Brain Delivery………………… 28
2.7 Gelling system………………………………………………………… 29
2.7.1 In-situ gels…………………………………………………………….. 29
2.7.1.1 In- situ gel formation based on physiological stimuli
(temperature and/or pH)……………………………………
30
a) Thermally triggered systems……………………………………… 30
b) pH triggered systems …………………………………………….. 31
2.7.1.2. In-situ gel formation based on chemical reactions……………. 31
2.8 Nose to brain drug delivery system…………………………………… 31
2.8.1 Anatomy and physiology of nasal cavity……………………………… 32
2.8.2 Olfactory region……………………………………………………….. 33
2.8.3 Trigeminal nerve………………………………………………………. 34
2.8.4 Mechanism and Pathways for nose to brain delivery…………………. 35
2.8.5 Advantages of nasal route of drug delivery…………………………… 35
2.8.6 Limitation of nasal route of drug delivery…………………………….. 36
2.8.7 Factors affecting nose-to-brain drug delivery…………………………. 36
2.9 Drug Profile – Efavirenz………………………………………………. 36
2.10 Excipient’s Profile…………………………………………………….. 39
2.10.1 Tripalmitin……………………………………………………………… 39
2.10.2 Poloxamers…………………………………………………………….. 40
2.10.2.1 Poloxamer 188………………………………………………. 41
2.10.2.2 Poloxamer 407……………………………………………… 43
2.10.3 Carbopol………………………………………………………….….... 44
2.11 References…………………………………………………………….. 47

xviii
Chapter 3 Materials & Methods……...………………………………………….. 55-82
3.1 Materials and Equipments……………………………………………… 55
3.2 Identification of Drug …………………………………………………. 58
3.2.1 Appearance…………………………………………………………….. 58
3.2.2 Solubility……………………………………………………………….. 58
3.2.3 Melting point…………………………………………………………… 58
3.2.4 Infrared Absorption……………………………………………………. 58
3.3 Analytical methods ……………………………………………………. 59
3.3.1 UV- Spectrophotometric estimation of Efavirenz……………………… 59
3.3.1.1 Calibration curve in methanol:water (50 %v/v) as solvent…... 59
3.3.1.2 Calibration curve in methanolic phosphate-buffered saline
(pH 6.4, 40%v/v)……………………………………………..
60
3.3.2 High Performance Liquid Chromatographic Method (HPLC method)
Development & Validation……………………………………………..
61
3.3.2.1 Analytical Method development……………………………… 62
3.3.2.2 Analytical method validation…………………………………. 62
3.4 Design of experiment…………………………………………………... 64
3.5 Preformulation studies…………………………………………………. 64
3.5.1 Selection of Lipid……………………………………………………… 65
3.5.2 Selection of Surfactant…………………………………………………. 65
3.5.3 Drug-Excipient Compatibility Study………………………………….. 66
3.6 Selection of formulation Technique……………………………………. 66
3.6.1 High Pressure Homogenization………………………….…………….. 66
3.6.2 Solvent Evaporation method………………………………….……….. 67
3.7 Optimization of Process Variables……………………………………… 68
3.8 Optimization of Formulation Variables………………………………... 69
3.9 Formulation and Optimization of In-situ Gel…………………………... 69
3.10 Evaluation of optimized formulation………………………………….. 69
3.10.1 Particle size, Polydispersity index (PDI) and Zeta potential………….. 69

xix
3.10.2 Entrapment efficiency…………………………………….…………… 70
3.10.3 Evaluation of SLN based in-situ gel…………………………………… 70
3.10.3.1 Gelation temperature / Sol–gel transition temperature……….. 70
3.10.3.2 Gelation time…………………………………………………. 70
3.10.3.3 pH……………………………………………………………. 71
3.10.3.4 Viscosity……………………………………………………… 71
3.10.3.5 Transmittance…………………………………………………. 71
3.10.3.6 Mucoadhesive strength………………………………………. 71
3.10.3.7 Spreadability…………………………………………………. 72
3.10.4 Transmission Electron Microscopic Evaluation……………………….. 72
3.10.5 Histopathological studies……………………………………………… 72
3.11 Drug Release Profile…………………………………………………… 73
3.11.1 In-vitro drug diffusion profile…………………………………………. 73
3.11.2 Ex-vivo drug release profile……………………………………………. 74
3.11.3 Kinetics of drug release………………………………………………… 74
3.11.3.1 Zero Order Release………………………………………….. 74
3.11.3.2 First Order Release Equation……………………………….. 75
3.11.3.3 Higuchi Square Root of Time Model……………………….. 75
3.11.3.4 Hixon-Crowell Cube Root Model…………………………… 75
3.11.3.5 Korsmeyer And Peppas Model……………………………… 75
3.12 In-vivo studies………………………………………………………….. 76
3.13 Stability Studies……………………………………………………….. 77
3.14 Data analysis………………………………………………………….. 77
3.15 References…………………………………………………………….. 77
Chapter 4 Results & Discussions………………………………………………… 83-150
4.1 Identification of Drug …………………………………………………. 83
4.2 Analytical Methods……………………………………………………. 85
4.2.1 UV- Spectrophotometric estimation of efavirenz………………………. 85
4.2.1.1 Calibration curve in methanol:water:: 50:50 %v/v as solvent….. 86

xx
4.2.1.2 Calibration curve in methanolic phosphate buffer saline (pH
6.4, 40 %v/v) …………………………………………………………..
87
4.2.2 HPLC Method Development & Validation……………………………. 88
4.2.2.1 Selection and optimization of chromatographic conditions……. 89
4.2.2.2 Analytical Method Validation………………………………… 97
4.3 Design of Experiment………………………………………………….. 110
4.4 Preformulation studies…………………………………………………. 110
4.4.1 Selection of lipid………………………………………………………. 110
4.4.2 Selection of Surfactant………………………………………………… 112
4.4.3 Drug-Excipient Compatibility Study………………………………….. 113
4.4.4 Selection of formulation Technique……………………………………. 115
4.5 Optimization of Process Variables……………………………………… 116
4.5.1 Experimental validation of design space………………………………. 122
4.6 Optimization of Formulation Variables………………………………… 122
4.6.1 Experimental validation of design space……………………………….. 128
4.7 Formulation and Optimization of In-situ Gel………………………….. 128
4.8 Evaluation of optimized formulation………………………………….. 132
4.8.1 Particle size, Polydispersity index (PDI), Zeta potential and
Entrapment efficiency………………………………………………….
132
4.8.2 Evaluation of SLN based in-situ gel…………………………………… 134
4.8.2.1 Gelation temperature / Sol–gel transition temperature……….. 134
4.8.2.2 Gelation time…………………………………………………. 134
4.8.2.3 pH…………………………………………………………….. 134
4.8.2.4 Viscosity………………………………………………………. 134
4.8.2.5 Transmittance…………………………………………………. 135
4.8.2.6 Mucoadhesive strength……………………………………….. 135
4.8.2.7 Spreadability………………………………………………….. 135
4.8.3 Transmission Electron Microscopy……………………………………. 135
4.8.4 Histopathological studies……………………………………………… 136
xxi
4.8.5 Drug Release Profile…………………………………………………… 137
4.8.5.1 In-vitro drug diffusion profile………………………………… 137
4.8.5.2 Ex-vivo drug release profile………………………………….. 138
4.8.5.3 Kinetics of drug release/ Pharmacokinetic modeling………… 139
4.8.6 In-vivo studies…………………………………………………………. 142
4.8.7 Stability Studies………………………………………………………. 143
4.9 References…………………………………………………………….. 144
Chapter 5 Summary & Conclusions…………………………………………….. 151-156
5.1 Summary of the work………………………………………………….. 151
5.2 Achievements with respect to the objectives………………………….. 153
5.3 Major contribution and practical implications of the work to society…. 153
5.4 Recommendation for future research………………………………….. 154
5.5 Conclusion……………………………………………………………… 155
5.6 References…………………………………………………………… 155
Bibliography
Appendices
157-168
169-171
Appendix A : Approval from CPCSEA & IAEC for pharmacokinetic
studies on animals
Appendix B : Certificate from PASM regarding ethical issues
Appendix B: Dose Calculation
List of Publications/Patent
169
170
171
172-173

xxii
List of Abbreviation
Abbreviations Full form
ABC ATP-binding cassette
AIDS Acquired Immuno-deficiency Syndrome
AMT Adsorptive-mediated transcytosis
ANOVA Analysis of Variance
ARR Amount remaining to release
BBB Blood Brain Barrier
BCRP Breast Cancer Resistance Protein
BCS Biopharmaceutical Classification System
BCSFB Brain Cerebro-Spinal Fluid Barrier
CCD Charge coupled device
CD4 Cluster of differentiation 4
CDC Centre for Disease Control and Prevention
CFR Code of Federal Regulations
CNS Central Nervous System
CP Cetyl Palmitate
CPCSEA Committee for the Purpose of Control and
Supervision of Experiments on Animals
CQA Critical Quality Attributes
CSF Cerebro-Spinal Fluid
Da Dalton
DLS Dynamic light scattering
DNA Deoxyribonucleic acid
DoE Design of Experiment
Ds Double-stranded
EFV Efavirenz
FDA Food and Drug Administration

xxiii
FT-IR Fourier Transform Infrared
GDS Glyceryl distearate
GIT Gastro- Intestinal Tract
GMS Glycerymonostearate
GPS Glyceryl palmitostearate
GRAS Generally Regarded As Safe
GRAS Generally regarded as safe
GTP Glyceryl tripalmitate (Tripalmitin)
HAART High Activity Antiretroviral Therapy
HAD HIV Associated Dementia
HED Human equivalent dose
HIV Human Immuno-deficiency Virus
HIVE HIV Encephalitis
HPH High pressure homogenization
HPLC High Performance Liquid Chromatography
IAEC Institutional Animal Ethics Committee
ICH International Council for Harmonisation
IUPAC International Union of Pure and Applied Chemistry
IV Intra-venous
LOD Limit of Detection
LOQ Limit of Quantification
MDR Mild Neurocognitive Disorder
MRP Multidrug Resistance-associated Proteins (MRP)
NMT Not more than
NNRTI
PAA
Non-nucleoside reverse transcriptase inhibitor
Polyacrylic Acid
PASM Parul Arogya Seva Mandal
PBS Phosphate-buffered Saline
PDI Poly dispersity index

xxiv
PDS Plain drug suspension
PEO Poly (ethylene oxide)
p-gp p-glycoprotein
PPO Poly (propylene oxide)
PS Particle size
QTPP Quality Target Product Profile
RH Relative humidity
RMT Receptor - mediated transcytosis
RNA Ribonucleic Acid
RPM Rotations per minute
RSD Relative standard deviation
RT Room Temperature
SD Standard deviation
SLN Solid Lipid Nanoparticles
Ss Single –stranded
TDF Tenofovir disoproxil fumarate
TEM Transmission electron microscopy
UV Ultra-violet

xxv
List of Symbols
Symbol Meaning
µg Microgram
gm
mg
Gram
Milligram
Ng Nanogram
Cm Centimeter
Nm Nanometer
F Mucoadhesive force (dynes / cm2)
λmax Maximum wavelength
G acceleration due to gravity (cm/s2)
°C Degree Celcius
0F Degree Fahrenheit
K Kelvin
mV Millivolts
R Linear correlation coefficient
T Time
% Percent
Q Amount of drug released
K0 Zero order release constant
K1 First order release constant
Kh Higuchi square root of time release constant
Q∞ Total drug released after infinite time
Λ Diffusion exponents that characterizes the
mechanism of drug release
Pka Degree of ionization
Psi Pounds per square inch

xxvi
List of Figures
Figure
Caption Page
2.1 Structure of virus 13
2.2 Anatomy of human immunodeficiency virus (HIV) 17
2.3 Anatomy of the brain 22
2.4 Transport route across blood-brain barrier 25
2.5 Olfactory region showing the olfactory epithelium, bulb and tract 34
2.6 Structure of Efavirenz 37
2.7 Structure of Poloxamer 41
2.8 Acrylic acid monomer unit in carbomer polymers 45
3.1 Formulation of solid lipid nanoparticles by high pressure
homogenization
67
3.2 Formulation of solid lipid nanoparticles by solvent evaporation
technique
68
3.3 Apparatus used for determining the mucoadhesive strength of gel 72
4.1 IR spectra (a) Observed spectra of EFV (b) Reported spectra of EFV 84
4.2 Structure of efavirenz (EFV) 84
4.3(a) Overlay spectra of EFV at different concentrations 86
4.3(b) Calibration curve for efavirenz in methanol and water (1:1) 87
4.4 Calibration curve for efavirenz in 40% methanolic phosphate buffer
saline pH 6.4
88
4.5 Spectra obtained for EFV and TDF for selection of wavelength 88
4.6 Trial 1 for HPLC method development 89
4.7 Trial 2 for HPLC method development 90
4.8 Trial 3 for HPLC method development 91
4.9 Trial 4 for HPLC method development 91
4.10 Trial 5 for HPLC method development 92

xxvii
4.11 Trial 6 for HPLC method development 92
4.12 Trial 7 for HPLC method development 93
4.13 Trial 8 for HPLC method development 94
4.14 Trial 9 for HPLC method development 95
4.15 Chromatogram of 20 ppm fumaric acid 95
4.16 Chromatogram of EFV and TDF in plasma samples 96
4.17 (a) Chromatogram for linearity study
(b) Calibration plot for linearity
99
99
4.18 Chromatogram for precision study 100
4.19 Chromatogram for specificity (Diluent, Placebo, Standard) 105
4.20 Solubility of Efavirenz in different lipids 111
4.21 IR spectra of drug and physical mixture of drug and excipients. 114
4.22 Contour plots, 3D surface plots and overlay plot for process variables
(a) Contour plot for particle size (b) 3D Surface plot of Particle Size
(c) Contour plot for PDI (d) 3D Surface plot of PDI (e) Overlay plot
for optimization
121
4.23 Contour plots and 3D surface plots for formulation variables (a)
Contour plot for particle size (b) 3D Surface plot of Particle Size (c)
Contour plot for PDI (d) 3D Surface plot of PDI (e) Contour plot
entrapment efficiency (f) 3D Surface plot of entrapment efficiency.
127
4.24 Overlay plot for optimization of formulation variables. 128
4.25 IR spectra of drug and physical mixture of drug and excipients. 130
4.26 Size distribution and zeta potential distribution of optimized
Efavirenz nanoparticles
133
4.27 Transmission Electron Microscopic image of Efavirenz nanoparticles
obtained using transmission electron microscope with CCD camera
(TEM Philips Tecnai 20, Holland).
136

xxviii
4.28 Histopathological conditions of nasal mucosa after treatment with (a)
Phosphate buffer saline - PBS pH 6.4 (b) SLN dispersion (c) SLN gel
(d) Isopropyl alcohol
136
4.29(a) In-vitro Drug Release Profile by dialysis-bag method 137
4.29(b)
4.30
In-vitro drug release profile by using Franz-diffusion cell
Ex-vivo drug release profile by using Franz-diffusion cell
138
138
4.31(a) Zero order release kinetics. 139
4.31(b) First order release kinetics. 140
4.31(c) Higuchi Model of release kinetics. 140
4.31(d) Hixon Crowel Model of release kinetics. 141
4.31(e) Korsemeyer and Pepppa’s Model of release kinetics 141

xxix
List of Tables
Table
Caption Page
2.1 Types of viruses with examples 14
2.2 Differences between virus and Retrovirus 15
2.3 Approved antiviral drugs for HIV infections 20
2.4 Drug Profile – Efavirenz 37
2.5 Description about Tripalmitin 39
2.6 Description about Poloxamer 188 41
2.7 Description about Poloxamer 407 43
2.8 Description about Carbopol 934 45
3.1 List of Materials used 55
3.2 List of Instruments used 57
3.3 Values of exponent λ and the corresponding release mechanism 76
4.1 Identification tests for EFV with the inferences 83
4.2 Major peaks observed and reported for EFV in IR spectra 85
4.3 Calibration data for EFV in methanol:water (50% v/v) 86
4.4 Calibration data for EFV in methanolic PBS (pH 6.4, 40% v/v). 87
4.5 Initial chromatographic conditions for trial batches 89
4.6 Gradient Program used for HPLC method development 94
4.7 Optimized Chromatographic conditions for HPLC method 96
4.8 (a) Sample Preparation for linearity studies 98
4.8 (b) Concentration, Area and Area ratio for linearity study 98
4.9 Area ratios and RSD calculation for Precision study (Repeatability) 101
4.10 Intraday Precision studies 101
4.11 Inter-day Precision studies 102
4.12 Summary of ANOVA analysis for precision study (intra-day) 102

xxx
4.13 Summary of ANOVA analysis for precision study (inter-day) 102
4.14 Data of recovery study for Accuracy Parameter 103
4.15 (a) Robustness data for change in flow rate 105
4.15 (b) Robustness data for change in wavelength 106
4.15 (c) Robustness data for change in pH of mobile phase 107
4.15 (d) Summary of robustness data for change in different parameters 108
4.16 Summary of validation Parameters 109
4.17 Selection of lipid based on solubility of drug in lipid 111
4.18 Selection of Surfactant on the basis of Particle size, PDI and
Entrapment Efficiency
112
4.19 Comparison of formulation techniques on the basis of Particle size,
PDI and Entrapment Efficiency
115
4.20 Optimization of stirring speed (rpm) and stirring on the basis of
Particle size and PDI
116
4.21 Optimization of temperature during stirring on the basis of Particle
size and PDI
117
4.22 Full factorial design with coded and actual values used for
optimization of process variables.
118
4.23 (a) Response Surface Quadratic Model for Particle size 119
4.23 (b) Response Surface Quadratic Model for PDI 119
4.24 Coded and Actual values of independent variables of formulation
optimization
123
4.25 Full factorial design with coded and actual values used for
optimization of formulation variables
123
4.26 (a) Response Surface Linear Model for Particle size 124
4.26 (b) Response Surface Linear Model for PDI 124
4.26 (c) Response Surface Quadratic Model for % Entrapment 125
4.27 Different trials for selection of gelling/ mucoadhesive agent 129
4.28 Optimization of ratio of poloxamer 188 and poloxamer 407 for 131

xxxi
gelling behaviour
4.29 Gelling behaviour of SLN dispersion containing thermoresponsive
polymers at different concentrations of Carbopol 934P
131
4.30 The regression coefficients obtained from model fitting 142
4.31 Stability study data for the formulation at initial, after 0.5, 1, 2, 3 and
6 months
143

xxxii
List of Appendices
Appendix A : Approval from CPCSEA & IAEC for pharmacokinetic studies on animals
Appendix B: Certificate from PASM regarding ethical issues
Appendix C : Dose Calculation

Chapter 1 Introduction
119997290052 / Gujarat Technological University Page 1
CHAPTER 1
Introduction
Poorly soluble drugs are highly prevalent in the pharmaceutical field leading to low
bioavailability. In drug discovery, the number of drug candidates having low solubility has
increased, and 70% of new drug candidates have shown poor aqueous solubility in recent
years [1]. These drugs pose a major challenge to the formulation scientists in order to
increase the bioavailability and develop a targeted drug delivery system [2]. Drug delivery to
brain is even more challenging due to the presence of blood brain barrier (BBB) and brain
cerebrospinal fluid barrier (BCSFB) [3, 4].
Viral infections are extremely widespread and are of various types like common cold,
influenza, rabies, measles, chickenpox, small pox, herpes, AIDS, mumps, measles, rubella,
viral hepatitis, viral meningitis, viral pneumonia, etc [5,6]. The most life - threatening
infection is of HIV causing AIDS. According to the World Health Organization,
approximately 35 million people worldwide are living with HIV/ AIDS including 3.2 million
children of less than 15 years age and an estimated 2.1 million individuals worldwide are
newly infected with HIV every year [7]. AIDS is the sixth leading cause of death among
people aged 25 - 44 in the United States [8].
1.1 Definition of the problem
From the literature review on the subject related to HIV/AIDS and their available therapies,
the challenges associated with the current therapies were identified, and from the review
emerged the research problem to be addressed.
Current therapies for HIV infections with antiretroviral drugs is effective in reducing plasma
viral levels, but are ineffective in eradicating the virus from other sites like CNS due to their
Chapter 1 Introduction
119997290052 / Gujarat Technological University Page 2
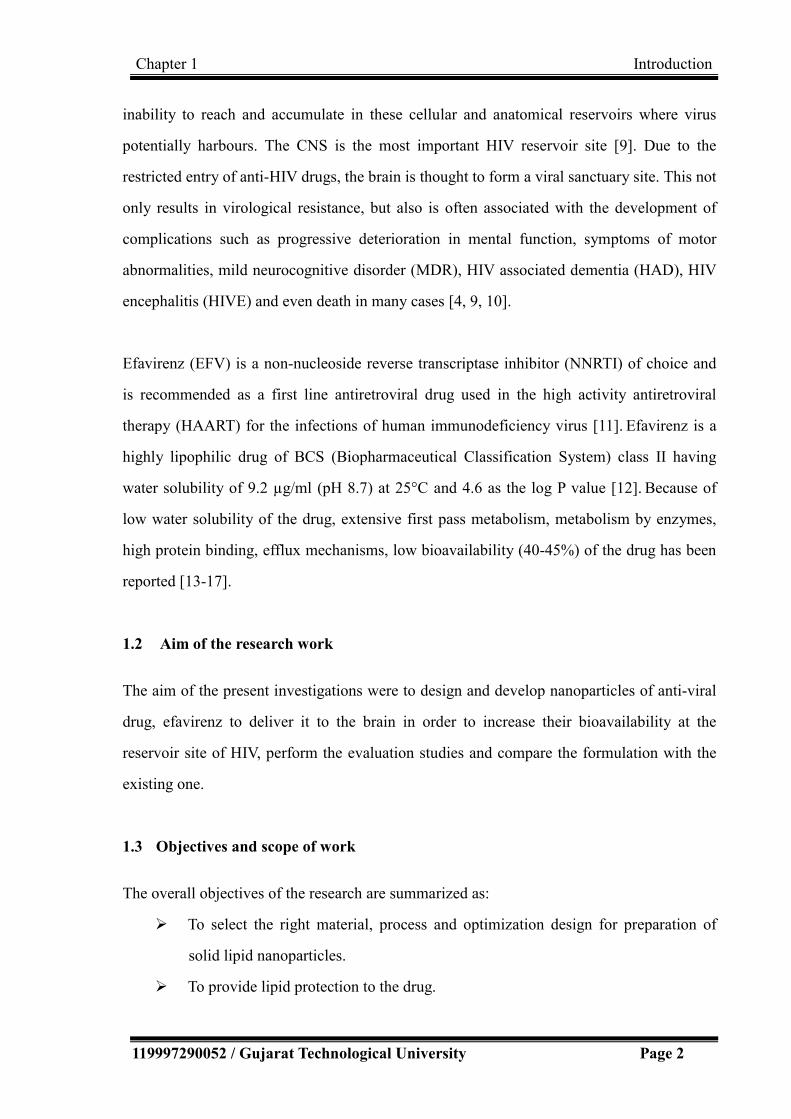
inability to reach and accumulate in these cellular and anatomical reservoirs where virus
potentially harbours. The CNS is the most important HIV reservoir site [9]. Due to the
restricted entry of anti-HIV drugs, the brain is thought to form a viral sanctuary site. This not
only results in virological resistance, but also is often associated with the development of
complications such as progressive deterioration in mental function, symptoms of motor
abnormalities, mild neurocognitive disorder (MDR), HIV associated dementia (HAD), HIV
encephalitis (HIVE) and even death in many cases [4, 9, 10].
Efavirenz (EFV) is a non-nucleoside reverse transcriptase inhibitor (NNRTI) of choice and
is recommended as a first line antiretroviral drug used in the high activity antiretroviral
therapy (HAART) for the infections of human immunodeficiency virus [11]. Efavirenz is a
highly lipophilic drug of BCS (Biopharmaceutical Classification System) class II having
water solubility of 9.2 µg/ml (pH 8.7) at 25°C and 4.6 as the log P value [12]. Because of
low water solubility of the drug, extensive first pass metabolism, metabolism by enzymes,
high protein binding, efflux mechanisms, low bioavailability (40-45%) of the drug has been
reported [13-17].
1.2 Aim of the research work
The aim of the present investigations were to design and develop nanoparticles of anti-viral
drug, efavirenz to deliver it to the brain in order to increase their bioavailability at the
reservoir site of HIV, perform the evaluation studies and compare the formulation with the
existing one.
1.3 Objectives and scope of work
The overall objectives of the research are summarized as:
To select the right material, process and optimization design for preparation of
solid lipid nanoparticles.
To provide lipid protection to the drug.

Chapter 1 Introduction
119997290052 / Gujarat Technological University Page 3
To avoid extensive first pass metabolism of the drug.
To select proper route of administration.
To target the drug to the brain.
To estimate the drug concentration in brain and plasma post-administration of
formulation and comparison with existing formulation.
Scope of the research work:
By developing the effective delivery system for the existing drug which can effectively
diffuse in cellular and tissue compartments where the virus harbors (reservoir site of HIV) is
a potential way in an attempt for completely cure the HIV-infected patients. After clinical
trials and fulfillment of other regulatory requirements, the developed formulation may prove
to be a boon to the society at large for the complete treatment of the highly-dreaded disease
of AIDS.
1.4 Rationale of the research work
1.4.1 Selection of anti-viral drug
1.4.1.1. Challenges associated with the anti-viral drugs including efavirenz:
Low Oral Bioavailability
The anti-viral drugs including efavirenz are reported to have low oral bioavailability
because of the following mentioned reasons [9, 18-20].
Extensive first pass metabolism
Low solubility
High protein binding
Powerful metabolizing enzymes
Low permeability across the blood-brain-barrier
Drug efflux due to multidrug resistant efflux proteins (MRP) such as
p-glycoprotein (p-gp) [21].

Chapter 1 Introduction
119997290052 / Gujarat Technological University Page 4
Variable bioavailability
The bioavailability is often reported to be variable (60–90%) depending on their site of
absorption [9, 20].
Long-term Drug Therapy
The therapy requires a long time of at least 5 years to eliminate the latent viral
reservoir completely [9].
Resistance due to genetic mutations
The therapy should remain uninterrupted to prevent the development of resistance
where compliance issues become problematic many a times [9, 22, 23].
1.4.2 The need for the present investigation:
The insufficient delivery of anti-viral agents to the CNS leads to low and sustained viral
replication within the CNS even during prolonged therapy which hinders the complete cure
of the infection leading to therapeutic failure of antiretroviral drug therapy [9, 10].
.
Thus, developing drugs or the effective drug delivery systems for the existing drugs that
can effectively diffuse in various cellular and tissue compartments where the virus harbors
and reach to CNS is a potential way to completely cure the HIV-infected patients.
Therefore, developing novel approaches that are targeted at enhancing the brain delivery of
anti-viral drugs are required.
1.4.3 Selection of Nano-formulation
Novel developments emerging in the field of polymer science, lipid formulations and
nanotechnology provide an option by which the obstacles of limited brain entry can be
surmounted [24]. Examples of drug delivery systems having potential for targeting the brain
include nano-formulations such as nanoparticles, polymeric micelles, liposomes, dendrimers,
etc [9, 24-26].

Chapter 1 Introduction
119997290052 / Gujarat Technological University Page 5
1.4.3.1 Solid Lipid Nanoparticles
Solid lipid nanoparticles (SLN) are colloidal dispersions or particulates in the size range of
100–500 nm composed of biocompatible lipid matrix that are physiologically well tolerated
when administered in-vivo [27]. The lipidic nanoparticles are promising nano-formulations
owing to their prevalence over other formulations in terms of toxicity, production feasibility
and scalability which are widely documented in the literature [24, 28, 29, 30]. SLN are
gaining increased attention during recent years because of various advantages over other
colloidal drug delivery systems.
Potential Advantages of SLN
Various potential advantages of solid lipid nanoparticles may be summarized as [24, 28, 31]
Biocompatibility of physiological lipids
Potential for increased permeability due to small size as well as lipid and
surfactant contents and hence, enhanced bioavailability
Increased protection and stability to the encapsulated drug in biological fluids as
compared to other colloidal systems, such as liposomes or micelles
Possibility for passive or ligand-mediated targeting, CNS delivery
High drug loading capacity
Suitable for different routes of administration (oral, parenteral, dermal, nasal,
ocular, etc.)
Possibility of controlled drug release
Less variability in release mechanisms and their kinetics
Ease of large scale production and sterilization
1.4.4 Selection of Nasal route of drug delivery
Intranasal delivery of anti-retroviral drugs has been proposed as a potential strategy to
overcome the poor penetration of the drugs into the brain and to target HIV that harbour in
the CNS [4,32].

Chapter 1 Introduction
119997290052 / Gujarat Technological University Page 6
Advantages of the nasal route of drug delivery
The potential advantages of nasal route of drug delivery may be summarized as [13, 33, 34,
35]
Non-invasiveness
By pass the BBB, direct transport to CNS
Avoidance of first pass metabolism and drug degradation
Improved bioavailability
Lower dose/ reduced side effects
Reduce blood borne exposure risks of HIV
Improved convenience and compliance
1.5 Hypothesis
It was hypothesized that the solid lipid nanoparticles of EFV would enhance the delivery of
EFV to brain and plasma because of
Better absorption due to the small size of the particles
Improved permeability of the drug due to lipid and surfactant content
Lipid protections of drug from enzymatic degradation
Targeted delivery of the drug to brain (reservoir site of HIV)
Reduced dose and reduced toxicity due to targeted delivery (direct nose to brain
delivery)
Avoidance of first-pass metabolism
Avoidance of enzymatic degradation of drug in gastro- intestinal tract (GIT)
Prevention from being effluxed out due to the presence of pluronics, thus
facilitating its CNS delivery [24, 36]
1.6 Proposed plan of work
In the present investigation, an attempt was made to design and formulate solid lipid
nanoparticles of the anti-viral drug, efavirenz to increase their bioavailability and

Chapter 1 Introduction
119997290052 / Gujarat Technological University Page 7
overcome the challenges associated with the drug. The nanoparticles of efavirenz were also
proposed to target the drug to brain and increase its bioavailability in brain when
administered through intranasal route. The work may be categorized as follows:
Literature review
Selection / Development of the analytical method(s) for analyzing EFV in the
formulation and for determining the drug release profile.
Preformulation studies including selection of various components, technique, etc.
Formulation, optimization & characterization of SLN of EFV.
Formulation, optimization and characterization of EFV loaded SLN in-situ gelling
system to increase the residence time.
In-vitro diffusion studies of the developed formulations.
Ex-vivo absorption studies on freshly excised goat nasal mucosa.
Histopathological studies
In-vivo studies for estimation of drug in brain and plasma on intranasal
administration of the developed formulation.
Stability studies as per ICH guidelines.
1.7 Outline of Thesis
The report on the present research work has been divided into major five chapters of the
thesis. The first chapter of introduction includes brief background, definition of the
problem, aim, objectives, rationale, hypothesis, proposed plan of work and significant
contributions by the present work. Chapter 2 presents literature review on various aspects
related with the work including the description about disease, disease causing virus,
available therapies, challenges associated with them, approaches to overcome them,
selected formulation, selected route of administration, targeted delivery to desired site and
brief profile of the components used in the final formulation. Chapter 3 deals with the
description of experimental work performed for the investigations including analytical
method development, validation, formulation development, optimization and their

Chapter 1 Introduction
119997290052 / Gujarat Technological University Page 8
evaluation; while chapter 4 includes results obtained with the experiments performed and
detailed discussions on them. Chapter 5 on summary and conclusions finally presents the
summary of the work and concludes the thesis.
1.8 References
1. Kawabata Y, Wada K, Nakatani M, Yamada S, Onoue S., (2011). Formulation design
for poorly water-soluble drugs based on biopharmaceutics classification system: Basic
approaches and practical applications. Int J Pharm; 420(1):1-10.
2. Kawakami K., (2012). Modification of physicochemical characteristics of active
pharmaceutical ingredients and application of supersaturatable dosage forms for
improving bioavailability of poorly absorbed drugs. Adv Drug Deliv Rev.
;64(6):480-495.
3. Wong HL, Wu XY, Bendayan R., (2012). Nanotechnological advances for the delivery
of CNS therapeutics. Adv Drug Deliv Rev. ;64(7):686-700.
4. Cundy KC, Lynch G, Lee WA., (1997). Bioavailability and metabolism of cidofovir
following topical administration to rabbits. Antiviral Research ;35(2):113-122.
5. List of Viral Diseases. [Online]. Available:
http://doctors-hospitals-medical-cape-town-south-africa.blaauwberg.net/details.php?id
=768. [Accessed 25 June 2016]
6. Infectitious viral diseases. [Online]. Available:
usa.gov/search?affiliate=ri.gov&query=viral&sitelimit=health.ri.gov [Accessed 12
November 2015]
7. Global HIV/AIDS Overview. [Online]. Available:
https://www.aids.gov/federal-resources/around-the-world/global-aids-overview/.
[Accessed 12 November, 2015]
8. WHO | HIV/AIDS. [Online]. Available: http://www.who.int/gho/hiv/en/. [Accessed 12
November, 2015.
9. Rao KS, Ghorpade A, Labhasetwar V., (2009). Targeting anti-HIV drugs to the CNS.
Chapter 1 Introduction
119997290052 / Gujarat Technological University Page 9
Expert Opin Drug Deliv.;6(8):771-784.
10. Hasegawa T, Kawaguchi T., (2002). Delivery of Anti-Viral Nucleoside Analogues to
the Central Nervous System. Curr Med Chem -Anti-Infective Agents;1(1):55-63.
11. Corbau R, Mori J, Phillips C, et al., (2010). Lersivirine, a nonnucleoside reverse
transcriptase inhibitor with activity against drug-resistant human immunodeficiency
virus type 1. Antimicrob Agents Chemother;54(10):4451-4463.
12. DrugBank: Efavirenz. [Online]. Available: http://www.drugbank.ca/drugs/DB00625.
[Accessed 12 November, 2015]
13. Mistry A, Stolnik S, Illum L., (2009). Nanoparticles for direct nose-to-brain delivery
of drugs;379:146-157.
14. Kaur IP, Bhandari R, Bhandari S, Kakkar V., (2008). Potential of solid lipid
nanoparticles in brain targeting. J Control Release;127(2):97-109.
15. Das NJ, Amiji MM, Bahia MF, Sarmento B., (2010). Nanotechnology-based systems
for the treatment and prevention of HIV/AIDS. Adv Drug Deliv Rev.;62(4-5):458-477.
16. Gupta U, Jain NK., (2010). Non-polymeric nano-carriers in HIV/AIDS drug delivery
and targeting. Adv Drug Deliv Rev.;62(4-5):478-490.
17. WHO. Safety of Efavirenz. 2010. [Online]. Available:
http://www.who.int/hiv/topics/treatment/efavirenz_safety_review.pdf. [Accessed 12
November, 2015]
18. Bocedi A, Notaril S NP., (2004). Binding of anti- HIV drugs to human serum albumin.
Drug Metab Dispos.:606-609.
19. Peroni RN, Di Gennaro SS, Hocht C, et al., (2011). Efavirenz is a substrate and in turn
modulates the expression of the efflux transporter ABCG2/BCRP in the
gastrointestinal tract of the rat. Biochem Pharmacol.;82(9):1227-1233.
20. Lembo D, Cavalli R., (2010). Nanoparticulate delivery systems for antiviral drugs.
Antivir Chem Chemother.;21(2):53-70.
21. Varatharajan L, A TS., (2009). The transport of anti-HIV drugs across blood–CNS
interfaces: Summary of current knowledge and recommendations for further research.
Antiviral Res.;82(2):A99-A109.

Chapter 1 Introduction
119997290052 / Gujarat Technological University Page 10
22. Soto-Ramirez LE, Rodriguez-Diaz R, Harris DR, Hazra R., (2010). HIV drug
resistance-associated mutations in antiretroviral na??ve HIV-1-infected Latin
American children. Adv Virol.;2010.
23. Rausch DM, Stover ES., (2001). Neuroscience research in AIDS. Prog
Neuro-Psychopharmacology Biol Psychiatry.;25(1):231-257.
24. Mallipeddi R, Rohan LC., (2010). Progress in antiretroviral drug delivery using
nanotechnology. Int J Nanomedicine. (1):533-547.
25. Date A., Destache CJ., (2013). A review of nanotechnological approaches for the
prophylaxis of HIV/AIDS. Biomaterials.;34(26):6202-6228.
26. Kreuter J., (2014). Drug delivery to the central nervous system by polymeric
nanoparticles: What do we know? Adv Drug Deliv Rev.;71:2-14.
27. Attama A, Momoh MA, (2012). Builders PF. Lipid Nanoparticulate Drug Delivery
Systems: A Revolution in Dosage Form Design and Development. Recent Adv Nov
Drug Carr Syst. 107-140.
28. Mehnert W, Mäder K., (2012). Solid lipid nanoparticles. Adv Drug Deliv
Rev. ;64:83-101.
29. Blasi P, Giovagnoli S, Schoubben A, Ricci M, Rossi C., (2007). Solid lipid
nanoparticles for targeted brain drug delivery. Adv Drug Deliv Rev.;59(6):454-477.
30. Füredi P, Kovács K, Ludányi K, Antal I, Klebovich I., (2016). Development and
characterization of voriconazole loaded nanoparticles for parenteral delivery. Int J
Pharm. ;510(1):159-163.
31. Blasi P, Giovagnoli S, Schoubben A, et al., (2011). Lipid nanoparticles for brain
targeting I. Formulation optimization. Int J Pharm.;419(1-2):287-295.
32. Nowacek AS, McMillan J, Miller R, Anderson A, Rabinow B, Gendelman HE., (2010).
Nanoformulated antiretroviral drug combinations extend drug release and
antiretroviral responses in HIV-1-infected macrophages: Implications for NeuroAIDS
therapeutics. J Neuroimmune Pharmacol.;5(4):592-601.
33. Galligioni V, Scagliarini A, Lorenzini L, et al. Nose-to-brain delivery of ribavirin
( RBV ) for the treatment of viral encephalitis. :4.

Chapter 1 Introduction
119997290052 / Gujarat Technological University Page 11
34. Singh AK SA and MN., (2012). Nasal cavity: A promising platform for drug delivery
and research approaches from nasal to brain targeting. J drug del ther.;2(3):22-33.
35. Karavasili C, Fatouros DG., (2016). Smart materials: In situ gel-forming systems for
nasal delivery. Drug Discov Today.; 21(1):157-166.
36. Lun H, Chattopadhyay N, Yu X, Bendayan R., (2010). Nanotechnology applications
for improved delivery of antiretroviral drugs to the brain. Adv Drug Deliv
Rev. ;62(4-5):503-517.

Chapter 2 Literature review
119997290052 / Gujarat Technological University Page 12
CHAPTER 2
Literature Review
2.1 Overview
This review mainly includes the review on the viruses including human
immuno-deficiency virus (HIV), viral infections, acquired immune-deficiency syndrome
(AIDS), anti-viral drugs, challenges associated with the therapy with anti-viral drugs,
approaches to overcome them, potential of nano-formulations specifically solid lipid
nanoparticles, in-situ gelling system, anatomy and physiology CNS and brain to
understand the brain targeting approaches, nasal route of drug delivery for brain targeting
and bioavailability enhancement. The chapter also includes the profile of drug and the
excipients used for the formulation.
2.2 Virus
Viruses are small infective agents characterized by a lack of independent metabolism and
the inability to replicate outside the living host cells. Viruses can infect all types of life
forms, from animals and plants to microorganisms [1].
2.2.1 Structure of virus
Viruses are small obligate intracellular parasites, which by definition contain either a RNA
or DNA genome surrounded by a protective protein coat (capsid). Capsid is composed with
identical units, which are called capsomeres. The capsid is symmetrical and varied from
simple helical form to highly complex structures. The coat plus the nucleic acid core is
termed nucleocapsid. Some viruses have, in addition, a lipoprotein envelop, which may
contain antigenic viral glycoproteins, as well as host phospholipids acquired when the
virus nucleocapsid buds through the nuclear membrane or plasma membrane of the host

Chapter 2 Literature review
119997290052 / Gujarat Technological University Page 13
cell. Certain viruses also contain enzymes that initiate their replication in host cell. The
whole infective particle is termed as virion. Genome may be double or single stranded
depending on the type of virus [2,3]. A schematic diagram of the components of a virus
particle (virion) is shown in Figure 2.1
FIGURE 2.1: Structure of virus
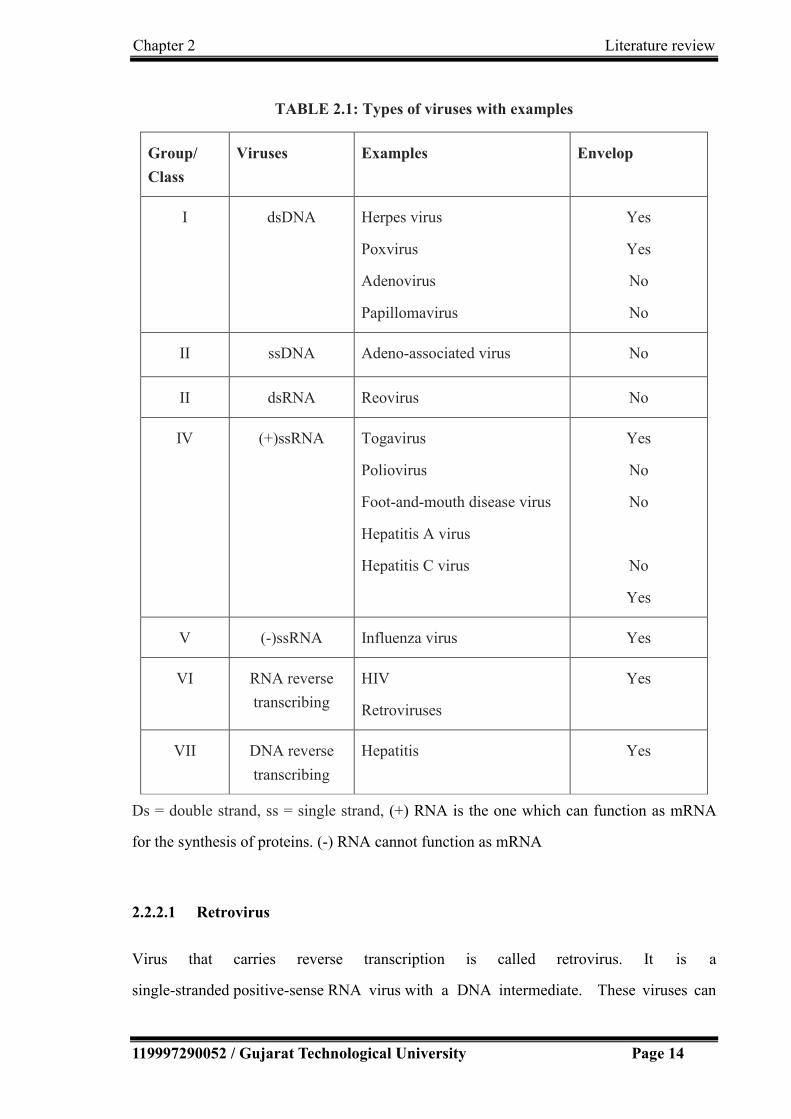
2.2.2 Types of viruses
The genetic material in all types of cells is double-stranded DNA, but some viruses use
RNA or single-stranded DNA to carry genetic information.
As per Baltimore classification system, there are seven groups based on genetic contents
and replication strategies of viruses[4]. The seven groups of viruses with examples are
summarized in Table 2.1.
Chapter 2 Literature review
119997290052 / Gujarat Technological University Page 14
TABLE 2.1: Types of viruses with examples
Group/
Class
Viruses Examples Envelop
I dsDNA Herpes virus
Poxvirus
Adenovirus
Papillomavirus
Yes
Yes
No
No
II ssDNA Adeno-associated virus No
II dsRNA Reovirus No
IV (+)ssRNA Togavirus
Poliovirus
Foot-and-mouth disease virus
Hepatitis A virus
Hepatitis C virus
Yes
No
No
No
Yes
V (-)ssRNA Influenza virus Yes
VI RNA reverse
transcribing
HIV
Retroviruses
Yes
VII DNA reverse
transcribing
Hepatitis Yes
Ds = double strand, ss = single strand, (+) RNA is the one which can function as mRNA
for the synthesis of proteins. (-) RNA cannot function as mRNA
2.2.2.1 Retrovirus
Virus that carries reverse transcription is called retrovirus. It is a
single-stranded positive-sense RNA virus with a DNA intermediate. These viruses can

Chapter 2 Literature review
119997290052 / Gujarat Technological University Page 15
convert their RNA into DNA copy. This process is catalyzed by reverse transcriptase
enzyme. Then this DNA is integrated covalently into the host genome using integrase
enzymes, which is coded by reverse transcriptase. They are integrated into the host genome
directly and the virus thereafter replicates as a part of host cell’s DNA. The reverse
transcription is much faster than the normal transcription process and it is not much accurate.
Retroviruses can cause HIV and number of cancers in animals [5-7].
2.2.2.2 Differences between virus and retroviruse
Differences between virus and retrovirus is described in Table 2.2 [2, 8].
TABLE 2.2: Differences between virus and Retrovirus
Virus Retrovirus
Includes a group of retrovirus A group of viruses with special
characteristics
Virus contains DNA or RNA as genetic
material
Retrovirus contains only RNA
If the virus has DNA, it inserts DNA into
the host cell, and it is integrated directly
into the host genome at the lytic phase.
Retrovirus has RNA as its genetic material
and needs to convert RNA to DNA before
inserted into the host genome
In most viruses, DNA is transcribed into
RNA, and then RNA is translated into
protein.
The RNA is reverse-transcribed into DNA,
which is integrated into the host cell's
genome (called provirus), and then
undergoes the usual transcription and
translational processes to express the genes
carried by the virus.
Viruses have transcription process Retroviruses have reverse transcription
process.
Mostly the second generation is similar to
first generation genetically since the virus
The second generation of the retrovirus
may be different from the first generation

Chapter 2 Literature review
119997290052 / Gujarat Technological University Page 16
has normal transcription process which is
accurate than the reverse transcription.
because of the inaccuracy of the revere
transcription process.
The treatments for infections caused by
normal virus are easier.
Because of the vast genetic change in
second generation of retroviruses,
treatments for diseases caused by them are
difficult.
2.2.3 Human Immunodeficiency Virus (HIV)
HIV is a member of the genus Lentivirus, (a subgroup of retrovirus) part of the
family Retroviridae that causes HIV infection and over time acquired immunodeficiency
syndrome (AIDS). There are two types of HIV: HIV-1 and HIV-2. HIV-1 is the virus that
was initially discovered and is more virulent, more infective, than HIV-2 and is the cause
of the majority of HIV infections globally. The HIV-2 is found less infective and has
relatively poor capacity for transmission compared to HIV-1. HIV-2 is largely confined
to west Africa [9].
2.2.3.1 Structure of HIV
HIV is different in structure from other retroviruses. The anatomy of HIV is shown in
Figure 2.2. It is roughly spherical with a diameter of about 120 nm, around 60 times
smaller than a red blood cell [10]. The viral core contains the viral capsule
protein p24 which surrounds two single strands of HIV RNA and the enzymes needed for
HIV replication, such as reverse transcriptase, protease, ribonuclease, and integrase; out of
the nine virus genes, there are three, namely gag, pol and env, which contain the information
needed to make structural proteins for new virus particles [3].
A matrix composed of the viral protein p17 surrounds the capsid ensuring the integrity of
the virion particle. This is, in turn, surrounded by the viral envelope, that is composed of
the lipid bilayer. Different proteins are embedded in the viral envelop, forming “spikes”
consisting of the outer glycoprotein (gp)120 and the transmembrane gp41 [11]. The lipid

Chapter 2 Literature review
119997290052 / Gujarat Technological University Page 17
membrane is borrowed from the host cell during the budding process (formation of new
particles). Gp120 is needed to attach the host cell and gp41 is critical for the cell fusion
process.
FIGURE 2.2: Anatomy of human immunodeficiency virus (HIV)
HIV infects mainly the CD4+ lymphocytes (T cells), but also to a lesser degree monocytes,
macrophages and dendritic cells (these cells are also CD4+cells). Once infected, the cell
turns into an HIV-replicating cell and loses its function in the human immune system [12].
2.3 Viral Infections
Viral infections are extremely widespread. Viruses can affect any part of the body or body
system, and can cause infections such common cold, influenza, rabies, measles,
chickenpox, small pox, herpes, AIDS, mumps, measles, rubella, viral hepatitis, viral
meningitis, viral pneumonia, etc. The most life - threatening infection is of HIV causing
AIDS [13, 14].
Chapter 2 Literature review
119997290052 / Gujarat Technological University Page 18
Viral infections come with a variety of symptoms ranging from mild to severe. Symptoms
may vary depending on what part of the body is affected, type of viruses, age, and overall
health of the affected person. The symptoms of viral infections can include fever, coughing,
sneezing, headache, diarrhoea, vomiting or general weakness to more severe symptoms
like personality changes, seizures, paralysis of the limbs, loss of sensation, sleepiness that
can progress into a coma or death [15].
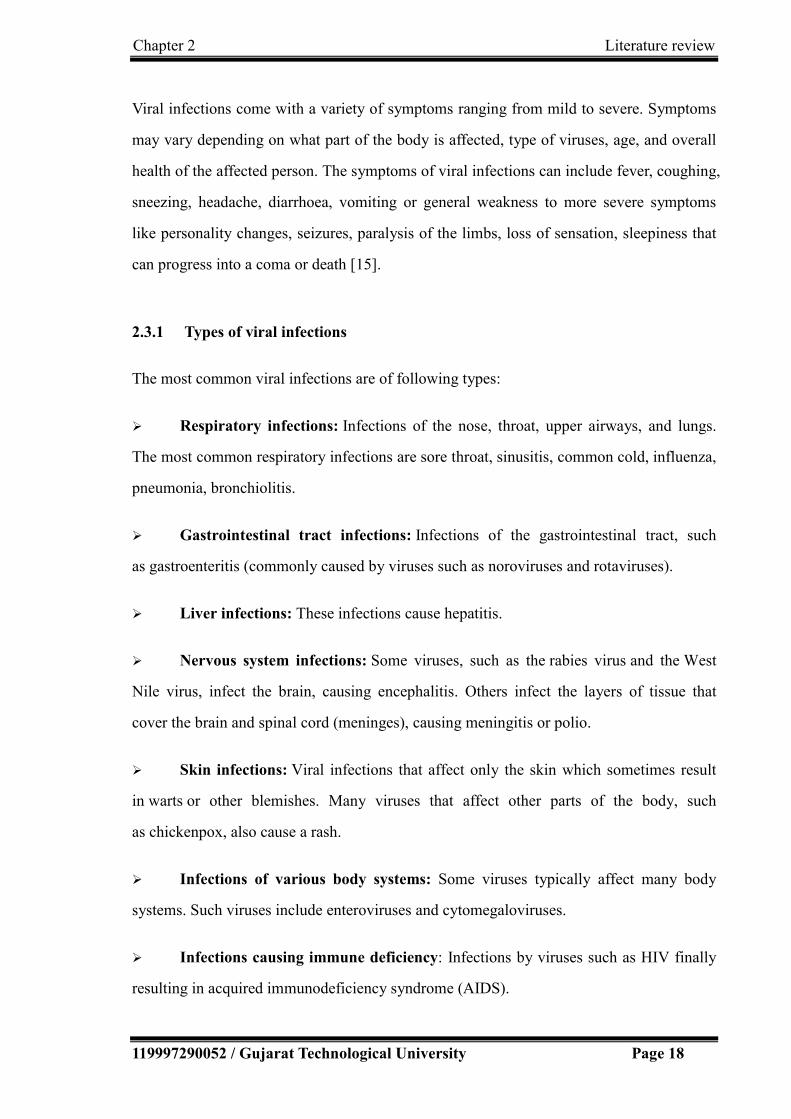
2.3.1 Types of viral infections
The most common viral infections are of following types:
Respiratory infections: Infections of the nose, throat, upper airways, and lungs.
The most common respiratory infections are sore throat, sinusitis, common cold, influenza,
pneumonia, bronchiolitis.
Gastrointestinal tract infections: Infections of the gastrointestinal tract, such
as gastroenteritis (commonly caused by viruses such as noroviruses and rotaviruses).
Liver infections: These infections cause hepatitis.
Nervous system infections: Some viruses, such as the rabies virus and the West
Nile virus, infect the brain, causing encephalitis. Others infect the layers of tissue that
cover the brain and spinal cord (meninges), causing meningitis or polio.
Skin infections: Viral infections that affect only the skin which sometimes result
in warts or other blemishes. Many viruses that affect other parts of the body, such
as chickenpox, also cause a rash.
Infections of various body systems: Some viruses typically affect many body
systems. Such viruses include enteroviruses and cytomegaloviruses.
Infections causing immune deficiency: Infections by viruses such as HIV finally
resulting in acquired immunodeficiency syndrome (AIDS).

Chapter 2 Literature review
119997290052 / Gujarat Technological University Page 19
2.3.2 Acquired immune deficiency syndrome (AIDS)
AIDS is a spectrum of conditions caused by infection with the human immunodeficiency
virus (HIV). Following initial infection, a person may not notice any major symptoms. As
the infection progresses, it interferes more with the immune system, increasing the risk of
common infections like tuberculosis, as well as other opportunistic infections,
and tumors that rarely affect people who have working immune systems [16]. HIV is
spread primarily by unprotected sex , contaminated blood transfusions, hypodermic
needles, and from mother to child during pregnancy, delivery, or breastfeeding [17].
According to the World Health Organization approximately 35 million people worldwide
are living with HIV/AIDS 35 including 3.2 million children of less than 15 years age and
an estimated 2.1 million individuals worldwide are newly infected with HIV every year
[18]. AIDS is the sixth leading cause of death among people aged 25 - 44 in the United
States [19].
2.3.2.1 Current therapies for AIDS
There are presently many antiretroviral drugs that have been approved by FDA (Food and
Drug Administration) for use in the treatment of human immunodeficiency virus (HIV).
Currently, many antiretrovirals are being evaluated for the prevention of HIV infections in
clinic. The approved antiviral drugs for HIV infections are summarized in Table 2.3 [2, 20,
21]. As shown, the majority of antiviral drugs are administered orally, although some are
delivered via parenteral (subcutaneous, intravenous and intravitreal) or topical routes. New
drug delivery systems and strategies are needed to facilitate a functional cure and/or enable
HIV eradication. Achieving efficacious drug concentrations in HIV reservoir sites using
targeting approaches and reducing cellular efflux and metabolism to prolong effective drug
concentrations in target cells remain significant drug delivery challenges [22].

Chapter 2 Literature review
119997290052 / Gujarat Technological University Page 20
TABLE 2.3: Approved antiviral drugs for HIV infections
Drug class and name
Route
Route of
administration
Drug class and name
Route
Route of
administration
Nucleoside reverse transcriptase inhibitors Protease inhibitors
Abacavir Oral Amprenavir Oral
Didanosine Oral Atazanavir Oral
Emtricitabine Oral Darunavir Oral
Lamivudine Oral Fosamprenavir (a
prodrug of
amprenavir)
Oral
Stavudine Oral Indinavir Oral
Zalcitabine Oral Lopinavir Oral
Zidovudine Oral Nelfinavir Oral
Nucleotide reverse transcriptase inhibitors Ritonavir Oral
Tenofovir disoproxil
fumarate
Oral Saquinavir Oral
Non-nucleoside reverse transcriptase
inhibitors
Tipranavir Oral
Delavirdine Oral Fusion/entry inhibitors
Efavirenz Oral Enfuvirtide (T-20) Subcutaneous
Etravirine Oral Maraviroc Oral
Nevirapine Oral Integrase inhibitors
Rilpivirine Oral Raltegravir Oral
Pharmacokinetic Enhancers Dolutegravir Oral
Cobicistat Oral Elvitegravir Oral
2.3.2.2 HAART: Combination therapy
HAART (Highly Active Anti-Retroviral Therapy) combines three or more drugs from at
least two different classes to suppress the replication process of the virus in at least two
different ways. Using this method the replication process is slowed down and the rate at
which drug resistance can develop is vastly reduced because HIV finds it more difficult to
overcome this combined attack.

Chapter 2 Literature review
119997290052 / Gujarat Technological University Page 21
These current therapies for HIV infections with antiretroviral drugs is effective in reducing
plasma viral levels, but are ineffective in eradicating the virus from other sites like CNS
due to their inability to reach and accumulate in these cellular and anatomical reservoirs
where virus potentially harbours. The CNS is reported to be the most important HIV
reservoir site [23, 24]. HIV is known to invade the central nervous system (CNS) early in
the course of the infection and primarily targets brain mononuclear macrophages,
perivascular macrophages and microglia [25]. Important brain structures such as microglia,
macrophages and possibly neurons, play a major role in viral persistence in the CNS [26].
Due to the restricted entry of anti-HIV drugs, the brain is thought to form a viral sanctuary
site. This not only results in virological resistance, but also is often associated with the
development of complications such as progressive deterioration in mental function,
symptoms of motor abnormalities, mild neurocognitive disorder (MDR), HIV associated
dementia (HAD), HIV encephalitis (HIVE) and even death in many cases [23, 26, 27].
2.4 CENTRAL NERVOUS SYSTEM (CNS)
The central nervous system (CNS) is the part of the nervous system consisting of
the brain and spinal cord. Retina and the optic nerve (2nd cranial nerve), as well as
the olfactory nerves (1st) and olfactory epithelium are considered as parts of the CNS,
synapsing directly on brain tissue without intermediate ganglia [28]. The olfactory
epithelium is the only central nervous tissue in direct contact with the environment, which
opens up for therapeutic treatments [29].
2.4.1 BRAIN
The brain makes up the largest portion of the central nervous system, and is often the main
structure referred to when speaking of the nervous system. The brain is the major
functional unit of the central nervous system and a highly protected organ from the
periphery by two major barriers, the blood–brain barrier (BBB) and the
blood–cerebrospinal fluid barrier (BCSFB). The anatomy of the brain is shown in Figure

Chapter 2 Literature review
119997290052 / Gujarat Technological University Page 22
2.3. The brain is located in the head, usually close to the primary sensory organs for
such senses as vision, hearing, balance, taste and smell. The brain is the most complex
organ in a vertebrate's body. In a typical human, the cerebral cortex (the largest part) is
estimated to contain 15–33 billion neurons [30], each connected by synapses to several
thousand neurons. These neurons communicate with one another by means of
long protoplasmic fibers called axons, which carry trains of signal pulses called action
potentials to distant parts of the brain or body targeting specific recipient cells. Microglia is
a type of glial cell located throughout the brain and spinal cord [31]. Microglia account for
10–15% of all cells found within the brain. As the resident macrophage cells, they act as
the first and main form of active immune defense in the central nervous system (CNS)
[32]. Microglia (and other glia including astrocytes) are distributed in large
non-overlapping regions throughout the CNS [33].
FIGURE 2.3: Anatomy of the brain

Chapter 2 Literature review
119997290052 / Gujarat Technological University Page 23
2.5 Brain Targeting
2.5.1 Blood –brain barrier and Blood-cerebrospinal fluid barrier
Blood–brain barrier (BBB) is a highly dynamic neuroprotective barrier, constituted by the
endothelial cells of the capillaries in the brain. The BBB presents the main obstacle for
entrance of large or hydrophilic molecules, microorganisms or the nanoparticles into the
brain [34]. The blood–cerebrospinal fluid barrier (BCSFB) is composed of choroid plexus
epithelial cells and also plays a role in the permeability of nutrients and xenobiotics. The
restricted and highly controlled access to the brain is present due to mainly following three
types of barriers [35, 36].
Physical barrier: BBB displays the largest surface area (approximately 20 m2) with
presence of relatively impermeable endothelial cells with tight junctions which prevent
paracellular transport, no fenestration exists in the endothelium and there is reduced rate of
pinocytosis from the luminal side. The barrier due to BCSFB exists due to a monolayer of
polarized epithelial cells surrounding the fenestrated capillaries that are joined together by
tight junctional proteins [36].
Transport/ Biological barrier: Expression and function of several receptors, ion
channels and influx/efflux transport protein which controls transcellular transport. In
particular, ATP-binding cassette (ABC) membrane-associated transporters such as
P-glycoprotein (P-gp), Multidrug Resistance-associated Proteins (MRPs) and Breast
Cancer Resistance Protein (BCRP, ABCG2) play a significant role in restricting the
permeability of several pharmacological agents including anti-cancer and anti-HIV agents.
The most extensively characterized transporter protein at the BBB is P-gp [36].
Metabolic barrier/ Chemical barrier: Metabolizing enzymes may prevent transcellular
transport. Complex drug interactions may also occur with these transport and enzyme
systems which ultimately may result in therapeutic failure and/or toxicity.

Chapter 2 Literature review
119997290052 / Gujarat Technological University Page 24
2.5.2 Transport routes across the blood-brain barrier:
Various transport routes by which solute molecules move across the BBB are as follows
(shown in Figure 2.4) [37].
Paracellular aqueous pathway - Small water-soluble molecules diffuse through this
pathway to a small extent.
Transcellular lipophilic pathway - Small lipid soluble molecules like alcohol, steroid
hormones, etc. penetrate transcellularly by dissolving in their lipid plasma membrane.
Transport proteins / Carrier-mediated transport – It involves binding of a solute such as
glucose or amino acids to a protein transporter on one side of the membrane resulting in a
conformational change of the protein and transport of the substance to the other side of the
membrane (from high to low concentration) or facilitated by energy provided by ATP for
movement against concentration gradient.
Efflux pumps - Responsible for extruding drugs from the brain.
Receptor - mediated transcytosis (RMT): It is highly specific transport mechanism for
uptake of macromolecules presented on the luminal side of the brain endothelia cells and
delivering them to the brain with the receptor recycled back to the luminal
membrane .RMT is an important transport pathway for endogenous peptides such as
insulin, insulin - like growth factor and transferrin.
Adsorptive transcytosis /Adsorptive-mediated transcytosis (AMT)/ Pinocytosis route
– This type of transport is triggered by an electrostatic interaction between a positively
charged substance, usually the charged moiety of a peptide, and the negatively charged
plasma membrane surface (i.e. heparin sulphate proteoglycans).
Cell mediated transcytosis : This is a considerably recently identified route of drug
transport across the BBB and is a well established mechanism for some pathogens such as
Cryptococcus neoformans and HIV entry into the brain, known as “ Trojan horse” model
[38]. This transport route relies on immune cells such as monocytes or macrophages to

Chapter 2 Literature review
119997290052 / Gujarat Technological University Page 25
cross the intact BBB. It can be used virtually for any type of molecules or materials as well
as particulate carrier systems [39].
FIGURE 2.4: Transport route across blood-brain
Varatharajan et. al. summarised the existing knowledge on the transport of anti-HIV drugs
across the blood–brain barrier and the choroid plexus. There are recommendations for
future research as well [40].
2.5.3 Approaches for transporting drugs across the blood-brain barrier:
There are various approaches proposed and/ or adopted for effective delivery of drugs to
the brain. Each of these strategies have some strengths and some limitations. These
strategies could involve [25, 26]
2.5.3.1 Drug modification approach
It involves coupling drugs to molecules that have the ability to penetrate the tight
vasculature or chemically modifying the functional groups of drugs to form “prodrugs”
with more favourable lipophilicity for improved BBB passage. These prodrugs can be
hydrolysed and release the parent drug on gaining access to endothelial cells [41]. Since
the prodrug is officially considered to be a distinct chemical entity, the method requires
substantially more drug purification steps, screening test and clinical studies, which usually
lead to increase of cost [42].

Chapter 2 Literature review
119997290052 / Gujarat Technological University Page 26
2.5.3.2 Disruption of BBB:
Hyper-osmotic opening of the BBB: A hypertonic solution of mannitol or urea can be
infused to shrink the capillary endothelial cells by inducing water efflux which
subsequently opens the tight junction network momentarily. As a result, the paracellular
flow can be considerably increased allowing more efficient BBB passage by drug
compounds. This strategy has been found to increase the BBB permeability to some extent.
However, it induced seizures in experimental animals as well as chronic neuropathological
changes making it to be a risky procedure, especially for long-term therapy [43].
By chemical agent : Cytotoxic agents (like alkylating agents - etoposide and cisplatin),
vasoactive agents (bradykinin, peptidase inhibitors, angiotensin II) may disrupt tight
junctions and create openings between the endothelial cells [44]. However, most of these
compounds are toxic, long-term use of this strategy for brain delivery of drugs is not
appropriate.
Low-frequency ultrasound / Thermal shock approach: BBB can be disrupted via
mechanisms such as by using low-frequency ultrasound (260 Hz) or thermal shock.
Presumably, the disruption by this method occurs due to interaction between ultrasonic
waves, microbubbles and the brain microvasculature [45]. However, there are several
concerns regarding the safety of this strategy [46]. More work is required to establish the
optimal conditions for extensive use of this method.
2.5.3.3 Inhibition of transporters:
A number of chemical entities have been developed in the past decade having capability of
blocking specific transporters. Multiple fold increase in the brain accumulation of drug is
reported to be observed in animals treated with P-gp blocker/ MRP inhibitor. These
blockers, unlikely to be CNS-specific, may lead to elevated risks of drug toxicity and
unpredictable drug-drug interactions.

Chapter 2 Literature review
119997290052 / Gujarat Technological University Page 27
2.5.3.4 Active targeting strategies:
Nano-formulations can cross the BBB via receptor-mediated transcytosis, but this process
is found to be inefficient. The delivery of the drugs to CNS is reported to be significantly
improved by modifying the systems with “targeting molecules” such as monoclonal
antibodies, cell- penetrating peptides and/or receptor substrates [47, 48]. Direct conjugates
or fusion proteins of drug and targeting ligand often have a drawback of loss of drug’s
activity especially when conjugated via a non-cleavable linker [35].
2.5.3.5 Nanotechnology/ Development of novel drug delivery systems/
Nanoformulations / Nanocarriers:
Various drugs are reported to be effectively delivered to the brain using drug nanocarriers
[49-54]. Different nanocarriers include nanoparticles, nanoemulsions, liposomes,
polymeric systems, micelles, dendrimer, niosomes nanogel, etc., which can further be
modified with targeting moieties as well [36, 52, 55]. Mallipeddi et al. provided a summary
of the application of various nanocarrier systems like polymeric, inorganic, solid lipid,
liposomes, polymeric micelles, dendrimers, cyclodextrins and cell based nanoformulations
to the delivery of anti-HIV drugs, specifically antiretrovirals [24].
2.5.3.6 Alternate route of drug delivery/ Nose-to-brain delivery: Various researchers
have successfully investigated direct delivery of various drugs from nose to brain [51, 56,
57]. Kumar et al. prepared intranasal nanoemulsion based brain targeting drug delivery
system of risperidone [58]. Patel et. al. prepared risperidone loaded solid lipid
nanoparticles and studied the possibility of brain targeting by nose-to-brain delivery [59].
Rao et al., 2009 summarized about targeting anti-HIV drugs to the CNS [26]. They have
also summarized the mechanisms of viral infection, neurodegeneration due to HIV
infection, antiretroviral therapies, their limitations and various approaches to overcome the
BBB to enhance CNS delivery of anti-HIV drugs. Seju et. al. prepared a nanoparticulate
drug delivery system of olanzapine using poly(lactic-co-glycolic acid) (PLGA) for direct
nose-to-brain delivery to provide brain targeting and sustained release [60].
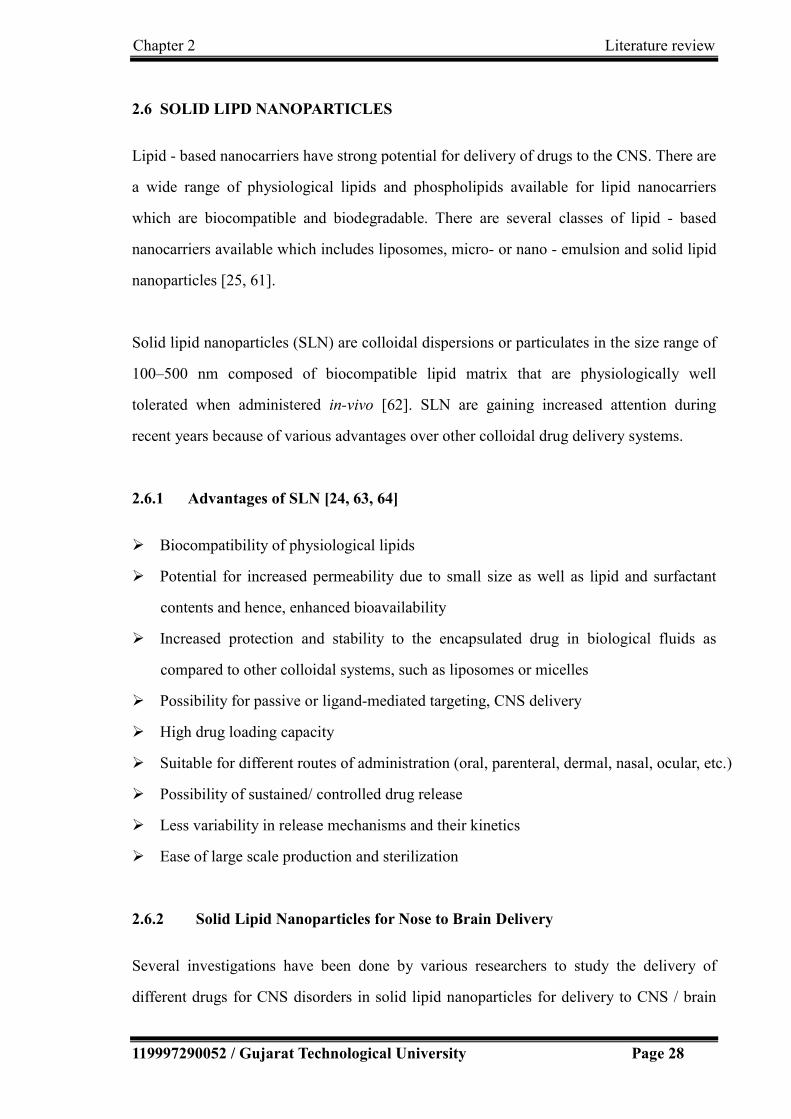
Chapter 2 Literature review
119997290052 / Gujarat Technological University Page 28
2.6 SOLID LIPD NANOPARTICLES
Lipid - based nanocarriers have strong potential for delivery of drugs to the CNS. There are
a wide range of physiological lipids and phospholipids available for lipid nanocarriers
which are biocompatible and biodegradable. There are several classes of lipid - based
nanocarriers available which includes liposomes, micro- or nano - emulsion and solid lipid
nanoparticles [25, 61].
Solid lipid nanoparticles (SLN) are colloidal dispersions or particulates in the size range of
100–500 nm composed of biocompatible lipid matrix that are physiologically well
tolerated when administered in-vivo [62]. SLN are gaining increased attention during
recent years because of various advantages over other colloidal drug delivery systems.
2.6.1 Advantages of SLN [24, 63, 64]
Biocompatibility of physiological lipids
Potential for increased permeability due to small size as well as lipid and surfactant
contents and hence, enhanced bioavailability
Increased protection and stability to the encapsulated drug in biological fluids as
compared to other colloidal systems, such as liposomes or micelles
Possibility for passive or ligand-mediated targeting, CNS delivery
High drug loading capacity
Suitable for different routes of administration (oral, parenteral, dermal, nasal, ocular, etc.)
Possibility of sustained/ controlled drug release
Less variability in release mechanisms and their kinetics
Ease of large scale production and sterilization
2.6.2 Solid Lipid Nanoparticles for Nose to Brain Delivery
Several investigations have been done by various researchers to study the delivery of
different drugs for CNS disorders in solid lipid nanoparticles for delivery to CNS / brain

Chapter 2 Literature review
119997290052 / Gujarat Technological University Page 29
and have evidenced the existence of a direct nose-to-brain delivery route for nanoparticles
administered to the nasal cavity [56, 57, 65, 66]. It has been observed that nano-sized drug
delivery systems can enhance nose-to-brain delivery of drugs compared to equivalent drug
solutions formulations. Protection of the drug from degradation and/or efflux back into the
nasal cavity may partly be the reason for this effect of nanoparticles [67]. However,
whether the drug from the nanoparticles is being released in the nasal cavity or the
nanoparticles carrying the drug are transported via the olfactory system or the trigeminal
nerves into the CNS where the drug is released is not certain.
2.7 Gelling system
A gel is a solid jelly – like material that can have properties ranging from soft and weak to
hard and tough. Gels may be defined as a substantially dilute three-dimensional cross-
linked system, which exhibits no flow when in the steady-state.
2.7.1 In-situ gels
In-situ forming gels are formulations, intended to be applied as solutions, sols, or
suspensions, which undergo gelation after administration due to the physicochemical
environment [68]. In other words, in-situ gels are polymeric solutions which can be
administrated as liquid, but upon exposure to the physiological environments, undergo a
phase transition to semisolid gel. The formation of gel may depend on factors like
temperature, pH change, presence of ions, etc. The formulations in the liquid state are easy
to be administered and on gelation after administration, increases the residence time and
the drug gets released in a sustained and controlled manner, and thus the in-situ gels
incorporate the benefits of both the state.
Mucoadhesion/ Bioadhesion indicate the attachment of a synthetic or biological
macromolecule to a biological tissue resulting in formation of bond with epithelial cell
and/or the mucus layer. Mucoadhesive in-situ gel formulations are reported to enhance the
permeation characteristics of the drug through nasal route by increasing the residence time

Chapter 2 Literature review
119997290052 / Gujarat Technological University Page 30
[69]. The in-situ gel forming polymeric formulations offer several advantages like
sustained and prolonged action in comparison to conventional drug delivery systems. Ravi
et. al. developed thermo-sensitive nasal in-situ gel using poloxamers and mucoadhesive
polymers and evaluated for sol-gel transition temperature, in-vitro and in-vivo release and
transit time. Pharmacokinetic study in rabbits showed significant improvement in
bioavailability of drug from intranasal gels than oral solution [70]. Different mechanisms
may be used for triggering the in-situ gel formation for drug delivery.
2.7.1.1 In- situ gel formation based on physiological stimuli (temperature and/or pH)
a) Thermally triggered systems
The application of various polymers / biomaterials whose transitions from sol to gel is
triggered by increase in temperature provides a most common and simple approach for
in-situ gel formation. For sol to gel transition, the ideal critical temperature range is
ambient and physiologic temperature, so that no external source of heat other than that of
body is required for triggering gelation. Temperature-sensitive hydrogels may be classified
as negatively thermo-sensitive, positively thermo-sensitive and thermally reversible gels.
Negative temperature-sensitive hydrogels have a lower critical solution temperature (LCST)
and contract upon heating above the LCST. Polymers having low critical solution
temperature (LCST) has the ability to transition between ambient and physiologic
temperature are thus frequently used for the purpose. A positive temperature sensitive
hydrogel has an upper critical solution temperature (UCST), such a hydrogel which
contracts upon cooling below the UCST. Polymer networks of poly(acrylic acid) (PAA)
and polyacrylamide (PAAm) or poly(acrylamide-co-butyl methacrylate) have positive
temperature dependence of swelling [71]. Different thermosensitive gelling agents include
poloxamers, cellulose derivatives, xyloglucan, etc. The most commonly used
thermo-reversible gels are those prepared from poloxamers [69, 72]. Other than
poloxamers, hydroxypropyl methylcellulose (HPMC) and the polyvinyl pyrrolidone (PVP)
are reported to have thermo-sensitive characteristics [73, 74].
Chapter 2 Literature review
119997290052 / Gujarat Technological University Page 31
(b) pH triggered systems:
The formation of gel may also be induced by physiological pH changes. All the
pH-sensitive polymers contain acidic or basic groups that either accept or release protons
in response to changes in environmental pH. Swelling of hydrogel increases as the external
pH increases in the case of weakly acidic (anionic) groups, but decreases if polymer
contains weakly basic (cationic) groups. The majority of anionic pH-sensitive polymers are
based on polyacrylic acid (carbomer) or its derivatives [69].
2.7.1.2. In-situ gel formation based on chemical reactions
In-situ gel formation may take place due to chemical reactions involving precipitation of
inorganic solids from supersaturated ionic solutions, enzymatic processes or photo-initiated
polymerization processes. For example, gellan gum is an anionic polysaccharide that
undergoes in-situ gelling in the presence of mono and divalent cations, including Na+ K+,
Ca2+ and Mg2+. Photo-polymerisation is reported to be used for in-situ gel formation of
biomaterials. Acrylate or similar polymerizable functional groups like the methacrylated
monomers photopolymerize quickly to form crosslinked networks, and the rate of
polymerization is readily controlled by the photo initiation conditions like incident light
intensity or initiator concentration [73].
2.8 Nose to brain drug delivery system
The direct anatomical connection between the nasal cavity and the brain/CNS opens a
pathway to deliver many drugs into the CNS by circumventing the BBB. It provides the
basis for the development of delivery systems for intranasal administration. In the past
decades, the use of the nasal cavity as a route for drug delivery and targeting the brain/
CNS is becoming the area of great interest. Various investigations have been frequently
done to study the delivery of drug to brain via intranasal administration [56, 57, 74-80].
Drugs have been shown to reach the CNS from the nasal cavity by direct transport across
the olfactory and trigeminal neural pathways [81]. It is the only site in the human body

Chapter 2 Literature review
119997290052 / Gujarat Technological University Page 32
where the nervous system is in direct contact with the surrounding environment [82].
Intranasal route of drug delivery is demonstrated to be a simple, non-invasive, convenient,
cost-effective, and a better option for direct transport of drug to target drugs to brain/CNS
owing to its ability to not only circumvent the BBB but also avoid the hepatic first-pass
effect.
2.8.1 Anatomy and physiology of nasal cavity
The external nose has a pyramidal shape, which may differ greatly depending on race. The
main functions of nose are olfaction, regulation of humidity & temp of inhaled air and
removal of microorganism or particulate matter from inhaled air. There are several types of
external noses in world population out of which mainly 3 types of nostrils are commonly
observed:
(i) Leptorrhine: long and narrow nostrils
(ii) Plalyrrhine : broad and flat nostrils
(iii) Mesorrhine : Intermediate nostrils
The external nasal anatomy can be classified into bony, cartilaginous, and soft tissue
components. The soft tissue component of the nose is composed of skin, fibro-adipose
tissue and muscles of facial expression, controlled by the facial nerve.
The nose is divided into two large irregular cavities formed by 14 bones connected to each
other by a tough fibrous membrane. The nasal passage is about 12-14 cm long and about 5
cm high. The total surface area of both nasal cavities is about 160 cm2 (96m2 if the nasal
epithelial microvilli are included), the total volume is about 15 ml. The surface area of the
olfactory region is 8 cm2 (0.3 m2 including microvilli). The volume which can be
administered per nostril is 15 µl [29].
Nasal cavity is divided into three regions:
1. Nasal vestibule
2. Olfactory region
3. Respiratory region

Chapter 2 Literature review
119997290052 / Gujarat Technological University Page 33
There are 6 arterial branches that serve the nasal cavity, making this region a very
attractive route for drug administration. Many of the side effects seen following intranasal
administration are caused by some of the 6 nerves that serve the nasal cavity. The 5th
cranial nerve (trigeminal nerve) is responsible for sensing pain and irritation following
nasal administration but the 7th cranial nerve (facial nerve) will respond to such irritation
by stimulating glands and cause facial expressions in the subject. The first cranial nerve
(olfactory nerve), however, is the target when direct absorption into the brain is the goal,
since this is the only site in our body where the central nervous system is directly
expressed on the mucosal surface. The nasal mucosa contains 7 cell types and 4 types of
glands. Four types of cells and 2 types of glands are located in the respiratory region but 6
cell types and 2 types of glands are found in the olfactory region.
2.8.2 Olfactory region:
The olfactory region is located at the upper portion of the nasal cavities, just below the
cribriform plate of the Ethmoid bone, which contains openings to allow the passage of
neuronal bundles from the olfactory epithelium to the CNS [29, 67]. The olfactory
epithelium predominantly contain three cell types - Olfactory neural cells, Sustentaculum
(supporting) cells, and basal cell as shown in Figure 2.5 [67]. The nerves serving the
olfactory region are called the first cranial nerves or the olfactory nerves. These are twenty
special nerves [83]. They are connected to the olfactory bulb, an oval greyish mass which
rests on the cribiform plate of the ethmoid bone. The olfactory nerves convey nerve
impulses arising from the bipolar olfactory neurons in the olfactory mucosa and through
the axons the impulse is brought to a synapse in the olfactory bulb.

Chapter 2 Literature review
119997290052 / Gujarat Technological University Page 34
FIGURE 2.5 : Olfactory region showing the olfactory epithelium, bulb and tract [79]
2.8.3 Trigeminal nerve
Another set of nerves emanating from the nasal cavity is the maxillary branch of the
trigeminal nerves, which are general sensory nerves. The trigeminal nerve is thought to be
the largest of the cranial nerves and has three major branches namely - ophthalmic nerve,
maxillary nerve and mandibular nerve having motor functions as well along with the
sensory functions. Neurones from the ophthalmic and maxillary branches of the trigeminal
nerve pass directly through the nasal mucosa and are thus important for nose-to-brain drug
delivery [85].
The region which is responsible for the direct delivery of drugs from the nose to the brain
is the olfactory region and the trigeminal nerve areas. Delivery from the nose to the central
nervous system occurs within minutes along both the olfactory and trigeminal nerves [81].

Chapter 2 Literature review
119997290052 / Gujarat Technological University Page 35
2.8.4 Mechanism and Pathways for nose to brain delivery:
The small nanoparticles penetrate intranasally through the mucosal membrane by
paracellular or transcellular route. The transcellular process is responsible for the transport
of lipophilic drugs that show a rate dependency on their lipophilicity [86]. The close
connection between the olfactory bulb and the cerebrospinal fluid (CSF) offers a potential
route for nasally delivered drugs to the CSF, provided the drug is able to cross the nasal
epithelium and the arachnoid membrane. Trigeminal pathways deliver a low molecular
weight drug from the nose to the brain [81]. Both small and large molecules can pass
rapidly from the nose into the brain along olfactory nerves and trigeminal nerve structures,
without primarily passing via the CSF [87]. The reports indicate good bioavailability
being achieved for molecules up to 1000 Da (without enhancers) and good availability
extended to at least 6000 Da with enhancers [88]. Singh et.al. summarised the anatomical,
histological and physiological overview of nose, nasal delivery, absorption enhancers,
advantages, barriers related to nasal drug delivery, physicochemical, biological and
formulation related factors affecting nasal drug delivery system. The research approaches
on brain targeting through nasal cavity has also been highlighted [89].
2.8.5 Advantages of nasal route of drug delivery
Non-invasiveness
By pass the BBB, direct transport to CNS
Avoidance of first pass metabolism and drug degradation
Enhanced systemic absorption of drugs due to rich vasculature in nasal mucosa.
Reduced enzymatic degradation of drugs.
Improved bioavailability
Lower dose/ reduced side effects
Reduce blood borne exposure risks
Improved convenience and compliance

Chapter 2 Literature review
119997290052 / Gujarat Technological University Page 36
2.8.6 Limitation of nasal route of drug delivery
Only low molecular weight lipophilic, unionized drugs are favourably absorbed
through this route of delivery
The drug therapy may be hampered during the nasal congestion due to the allergy or
infection
The possibility of toxicity at the olfactory area and the trigeminal nerve.
Drug residence time / Mucociliary clearance
2.8.7 Factors affecting nose-to-brain drug delivery
There are various factors which affect the permeation and delivery of drug from nose to
brain including the physicochemical properties of the drug, nasal environment and the
selected nasal drugs delivery system.
Physicochemical properties of the drug [90]
Solubility
Lipophilicity / (Hydrophilic-lipophilic balance) HLB
Relative molecular weight
Degree of ionization (pKa)
Nasal Environment
Blood Flow
Mucociliary Clearance
Nasal enzymes
Pathological conditions
Efflux transporter systems
Formulation related factors
Viscocity
pH
2.9 DRUG PROFILE – EFAVIRENZ
Efavirenz is a non-nucleoside reverse transcriptase inhibitor (NNRTI), having the structure
as shown in Figure 2.6 and is used as part of highly active antiretroviral therapy (HAART)

Chapter 2 Literature review
119997290052 / Gujarat Technological University Page 37
for the treatment of human immunodeficiency virus (HIV) type 1. Efavirenz is also used in
combination with other antiretroviral agents as part of an expanded post-exposure
prophylaxis regimen to prevent HIV transmission for those exposed to materials associated
with a high risk for HIV transmission. For HIV infection that has not previously been
treated, efavirenz and lamivudine in combination with zidovudine or tenofovir is the
preferred NNRTI-based regimen. The detailed drug profile is given in Table 2.4.
FIGURE 2.6: Structure of Efavirenz
TABLE 2.4: Drug Profile – Efavirenz [91]
Drug Efavirenz
Chemical Formula C14H9ClF3NO2
{(4S)-6-chloro-4-(cyclopropylethynyl)-1,4-dihydro-4-(triflouorometh
yl)-2H-3,1-benzoxazin-2-one.
Description NNRTI (Non – nucleoside reverse transcriptase inhibitor) used as
part of HAART for the treatment of a human HIV -1
Drug Category Antiviral agent (Non- nucleoside Reverse Transcriptase Inhibitor)
Indication in combination treatment of HIV infection (AIDS)
Pharmacodynamics Efavirenz (dideoxyinosine, ddI) is an oral non-nucleoside reverse
transcriptase inhibitor (NNRTI). It is a synthetic purine derivative

Chapter 2 Literature review
119997290052 / Gujarat Technological University Page 38
and, similar to zidovudine, zalcitabine, and stavudine. Efavirenz was
originally approved specifically for the treatment of HIV infections
in patients who failed therapy with zidovudine. Currently, the CDC
recommends Efavirenz also as a part of a three-drug regimen that
includes another nucleoside reverse transcriptase inhibitor (e.g.,
lamivudine, stavudine, and zidovudine) and a protease inhibitor or
efavirenz when treating HIV infection.
Mechanism of
action
Efavirenz inhibits the activity of viral RNA-directed DNA
polymerase (i.e., reverse transcriptase). Antiviral activity of efavirenz
is dependent on intracellular conversion to the active
triphosphorylated form. The rate of efavirenz phosphorylation varies,
depending on the cell type. It is believed that inhibition of reverse
transcriptase interferes with the generation of DNA copies of viral
RNA, which, in turn, are necessary for synthesis of new virions.
Intracellular enzymes subsequently eliminate the HIV particle that
previously had been uncoated, and left unprotected, during entry into
the host cell.
BCS class II
Average mol.
Weight
315.675
Melting point 139 - 141 0C
Water solubility 9.2 µg/mL (pH 8.7) at 25°C
Log P 4.6
pKa 10.2
Protein binding 99.5-99.75%
Absorption 40-45%
Half life 40-55 hrs
Dose 50-600 mg

Chapter 2 Literature review
119997290052 / Gujarat Technological University Page 39
Cmax 4.0±1.7 μg/ ml [92]
CSF:Plasma ratio 0.69% (range 0.26‐1.19%) [92]
Therapeutic range of
efavirenz
1000 – 4000ng / dose [93]
Marketed Products Efavir, Stocrin, Sustiva (600 mg tab, 200, 100, 50 mg cap), (Bristol-
Myers Sqibb, Ranbaxy Lab Ltd., Aspen Pharmacare, etc.)
2.10 EXCIPIENT’S PROFILE
2.10.1 TRIPALMITIN
Tripalmitin is a triglyceide derived from the fatty acid palmitic acid. A triglyceride is an
ester derived from glycerol and three fatty acids which are the main constituents of body
fat in humans and animals, as well as vegetable fat. The detailed profile about Triplamitin
is given in Table 2.5.
TABLE 2.5 : Description about Tripalmitin
Product name Tripalmitin
IUPAC Name 1,2,3-Propanetriyl trihexadecanoate
Appearance White powder
Chemical formula C3H5(OOC16H31)3 or C51H98O6
Synonyms Palmitin, Glycerol tripalmitate, Glycerin
tripalmitate, Glyceryl triplamitate, Palmitic
triglyceride, Tripalmitoyl glycerol,
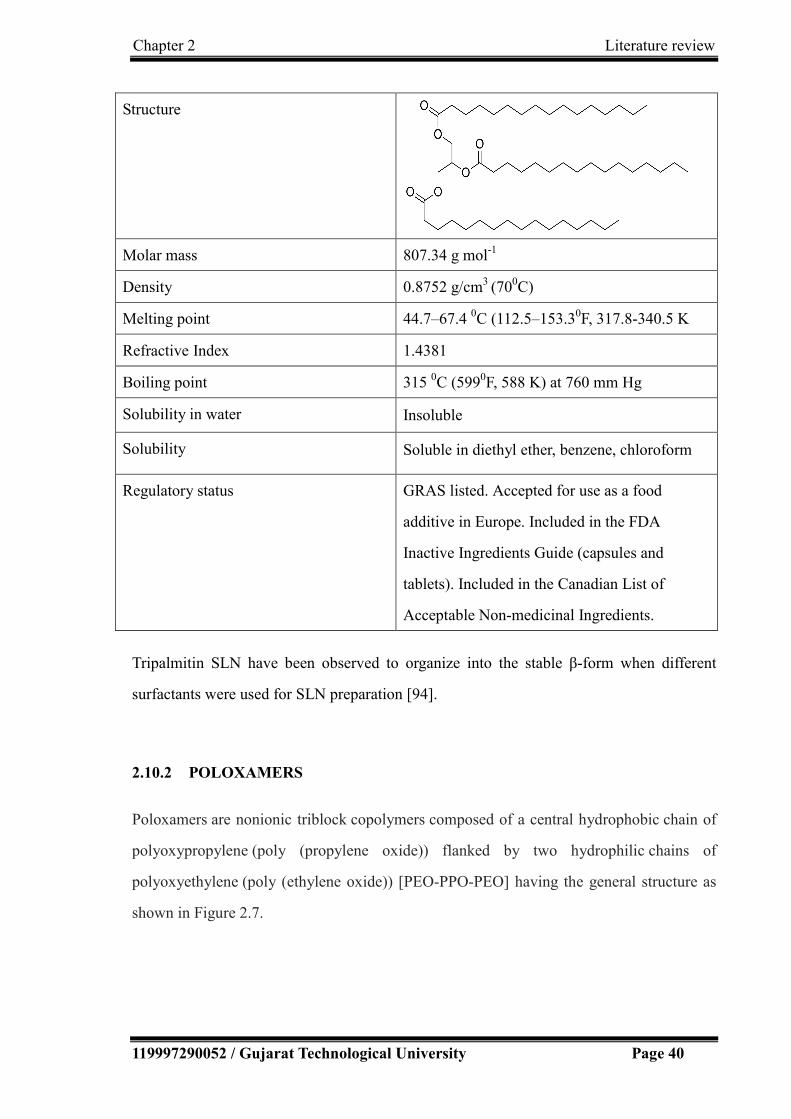
Chapter 2 Literature review
119997290052 / Gujarat Technological University Page 40
Structure
Molar mass 807.34 g mol-1
Density 0.8752 g/cm3 (700C)
Melting point 44.7–67.4 0C (112.5–153.30F, 317.8-340.5 K
Refractive Index 1.4381
Boiling point 315 0C (5990F, 588 K) at 760 mm Hg
Solubility in water Insoluble
Solubility Soluble in diethyl ether, benzene, chloroform
Regulatory status GRAS listed. Accepted for use as a food
additive in Europe. Included in the FDA
Inactive Ingredients Guide (capsules and
tablets). Included in the Canadian List of
Acceptable Non-medicinal Ingredients.
Tripalmitin SLN have been observed to organize into the stable β-form when different
surfactants were used for SLN preparation [94].
2.10.2 POLOXAMERS
Poloxamers are nonionic triblock copolymers composed of a central hydrophobic chain of
polyoxypropylene (poly (propylene oxide)) flanked by two hydrophilic chains of
polyoxyethylene (poly (ethylene oxide)) [PEO-PPO-PEO] having the general structure as
shown in Figure 2.7.

Chapter 2 Literature review
119997290052 / Gujarat Technological University Page 41
FIGURE 2.7: Structure of Poloxamer
Many different poloxamers exist depending on the lengths of the polymer blocks that have
slightly different properties. These copolymers are commonly named with the letter "P"
(for poloxamer) followed by three digits: the first two digits x 100 give the approximate
molecular mass of the polyoxypropylene core, and the last digit x 10 gives the percentage
polyoxyethylene content. The generic poloxamers are available with the trade name
Pluronic. The coding of these Pluronics starts with a letter to define its physical form at
room temperature (L = liquid, P = paste, F = flake (solid)) followed by two or three digits,
The first digit (two digits in a three-digit number) in the numerical designation, multiplied
by 300, indicates the approximate molecular weight of the hydrophobe; and the last digit x
10 gives the percentage polyoxyethylene content.
Pluronics are fluid at low temperature, but form thermo-reversible gel when the
temperature is increased as a consequence of disorder-order transition in micelle packing
which makes these polymers suitable for in-situ gelation [74].
2.10.2.1 Poloxamer 188
The detailed profile about poloxamer 188 is given in Table 2.6.
TABLE 2.6 : Description about Poloxamer 188
Product Name Poloxamer 188
Trade name Pluronic F68
Appearance White or almost white, waxy powder, microbeads, or
flakes

Chapter 2 Literature review
119997290052 / Gujarat Technological University Page 42
Chemical Formula HO(C2H4O)a(C3H6O)b(C2H4O)aH {a=80, b=27}
Molecular weight 7680 to 9510 g/mole
Synonyms Pluronic F68, Polyethylene-polypropylene glycol,
Polyoxyethylene-Polyoxypropylene block copolymer,
Poly(Ethylene oxide-co-Polypropylene oxide), Block,
Block Copolymer of Ethylene Oxide and Propylene
Oxide
Melting point 52-57ºC
HLB value 29
Flowability Free flowing
Solubility Freely soluble in ethanol and water
Functional Category Dispersing agent, emulsifying and co-emulsifying agent,
solubilizing agent, tablet lubricant, wetting agent
Stability and Storage
condition:
Poloxamers are stable materials. Aqueous solutions are
stable in the presence of acids, alkalis, and metal ions.
The bulk material should be stored in airtight containers
in a cool, dry place.
Incompatibility:
Depending on the relative concentrations, poloxamer 188
is incompatible with phenols and parabens
Safety Poloxamers are used in a variety of oral, parenteral, and
topical pharmaceutical formulations and are generally
regarded as nontoxic and nonirritant materials.
Poloxamers are reported to be nonirritating and
non-sensitizing when applied in 5% w/v and 10% w/v
concentration to the eyes, gums, and skin.
Regulatory Status: GRAS listed. Accepted for use as a food additive in
Europe. Included in the FDA Inactive Ingredients Guide
Included in the Canadian List of Acceptable
Non-medicinal Ingredients.
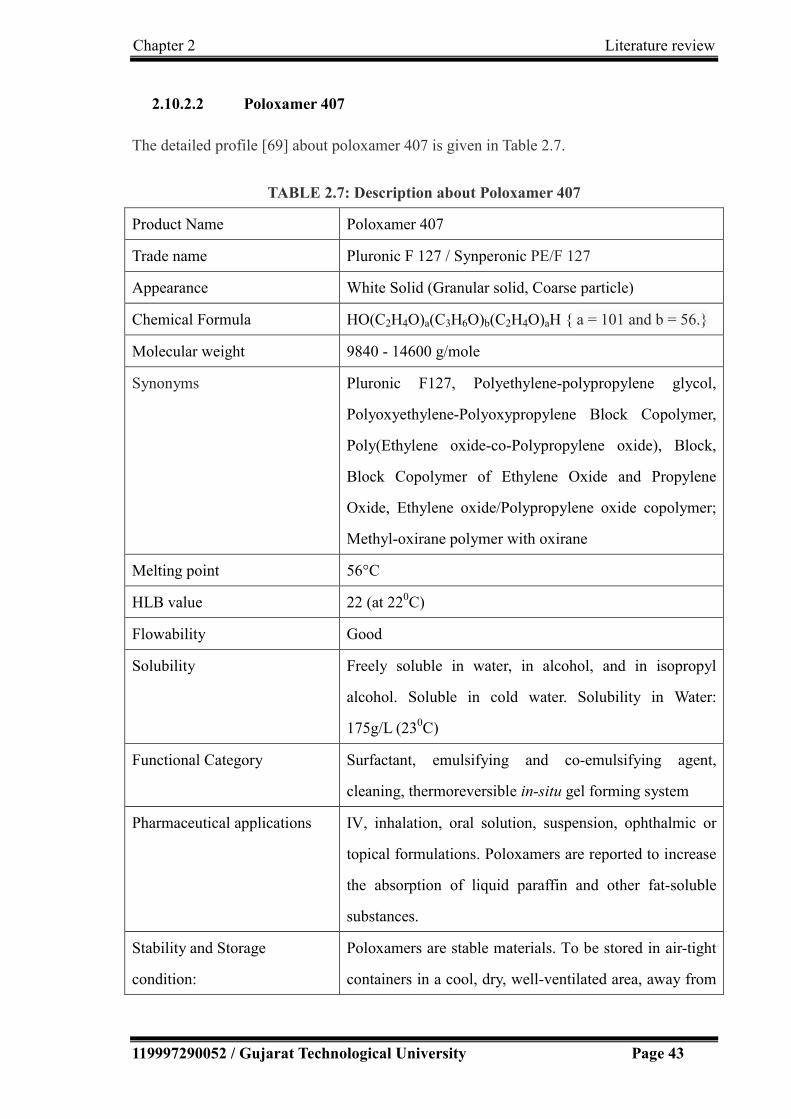
Chapter 2 Literature review
119997290052 / Gujarat Technological University Page 43
2.10.2.2 Poloxamer 407
The detailed profile [69] about poloxamer 407 is given in Table 2.7.
TABLE 2.7: Description about Poloxamer 407
Product Name Poloxamer 407
Trade name Pluronic F 127 / Synperonic PE/F 127
Appearance White Solid (Granular solid, Coarse particle)
Chemical Formula HO(C2H4O)a(C3H6O)b(C2H4O)aH { a = 101 and b = 56.}
Molecular weight 9840 - 14600 g/mole
Synonyms Pluronic F127, Polyethylene-polypropylene glycol,
Polyoxyethylene-Polyoxypropylene Block Copolymer,
Poly(Ethylene oxide-co-Polypropylene oxide), Block,
Block Copolymer of Ethylene Oxide and Propylene
Oxide, Ethylene oxide/Polypropylene oxide copolymer;
Methyl-oxirane polymer with oxirane
Melting point 56°C
HLB value 22 (at 220C)
Flowability Good
Solubility Freely soluble in water, in alcohol, and in isopropyl
alcohol. Soluble in cold water. Solubility in Water:
175g/L (230C)
Functional Category Surfactant, emulsifying and co-emulsifying agent,
cleaning, thermoreversible in-situ gel forming system
Pharmaceutical applications IV, inhalation, oral solution, suspension, ophthalmic or
topical formulations. Poloxamers are reported to increase
the absorption of liquid paraffin and other fat-soluble
substances.
Stability and Storage
condition:
Poloxamers are stable materials. To be stored in air-tight
containers in a cool, dry, well-ventilated area, away from

Chapter 2 Literature review
119997290052 / Gujarat Technological University Page 44
heat.
Incompatibility:
Poloxamers have been reported to be incompatible with
hydroxybenzoates and phenols.
Safety Poloxamers are used in a variety of oral, parenteral, and
topical pharmaceutical formulations and are generally
regarded as non-toxic and non-irritant materials.
Poloxamers to be nonirritating and nonsensitizing when
applied in 5% w/v and 10% w/v concentration to the
eyes, gums, and skin.
Regulatory Status: GRAS listed. Accepted for use as a food additive in
Europe. Included in the FDA Inactive Ingredients Guide.
Included in the Canadian List of Acceptable
Non-medicinal Ingredients.
2.10.3 CARBOPOL
Carbomers are cross-linked poly (acrylic acid) of high molecular weight, commercially
available as Carbopol®. The acrylic acid monomer unit in carbomer polymers is shown in
Figure 2.8. Different carbomer codes (910, 934, 940, 941 and 934P) are an indication of
molecular weight and the specific components of the polymer.
Carbopol® 934 is a synthetic polymer composed of 62% of carboxyl groups with a high
molecular weight formed by repeating units of acrylic acid, cross-linked with either allyl
ether of sucrose or allyl ethers of pentaerythritol. In an aqueous solution at neutral pH, it
acts is an anionic polymer, i.e. they aquire a negative charge by losing protons from their
side chains. This makes the carbomers polyelectrolytes with the ability to absorb and retain
water and swell to many times their original volume. They are extremely efficient rheology
modifier capable of providing high viscosity and form sparkling clear water or
hydroalcoholic gels and creams. Carbopol offers the advantage of exhibiting excellent

Chapter 2 Literature review
119997290052 / Gujarat Technological University Page 45
mucoadhesive properties when compared with other polymers (e.g. cellulose derivatives
and polyvinyl alcohol) [95].
FIGURE 2.8: Acrylic acid monomer unit in carbomer polymers
The detailed profile about carbopol 934P is given in Table 2.8.
TABLE 2.8: Description about Carbopol 934
Product Name Carbomer
Trade name Carbopol 934
Description A high molecular weight polymer of acrylic acid
cross-linked with allyl ethers of sucrose.
Appearance white coloured, fluffy, hygroscopic powder
Synonyms Acritamer, acrylic acid polymer, Carbopol, carboxy
polymethylene, polyacrylic acid, PAA
carboxyvinyl polymer, Pemulen, Ultrez.
Melting point 260°C
Density 1.76–2.08 g/cm3
Viscocity 30,500-39,400cp (0.5% aqueous dispersion at neutral pH)
Solubility Soluble in water, in ethanol (95%) and glycerin
Functional Category Bioadhesive, emulsifying agent, release-modifying agent,
suspending agent, tablet binder, viscosity-increasing
agent.
Stability and Storage Carbomers are stable, hygroscopic materials that may be

Chapter 2 Literature review
119997290052 / Gujarat Technological University Page 46
condition:
heated at temperatures below 104°C for up to 2 hours
without affecting their thickening efficiency. Exposure to
excessive temperatures may result in discoloration and
reduced stability. Carbomer powder should be stored in
an airtight, corrosion-resistant container in a cool, dry
place. The use of glass, plastic, or resin-lined containers
is recommended for the storage of formulations
containing carbomer.
Incompatibility:
Carbomers are discolored by resorcinol and are
incompatible with phenol, cationic polymers, strong
acids, and high levels of electrolytes. Certain
antimicrobial adjuvants should also be avoided or used at
low level.
Safety No evidence of hypersensitivity reactions in humans has
been reported when used topically.
Pharmaceutical Applications Mainly used in liquid or semisolid pharmaceutical
formulations as suspending, viscosity-enhancing agents
or emulsifying agents. Formulations include creams, gels,
and ointments for use in topical ophthalmic, rectal
preparations. Also used as dry or wet binders and as a
rate controlling excipient. Carbomer resins have also
been investigated in the preparation of sustained release
matrix beads.
Carbomers are also used in cosmetics.
Use Concentration (%):
Emulsifying agent 0.1–0.5
Gelling agent 0.5–2.0
Suspending agent 0.5–1.0
Tablet binder 5.0–10.0

Chapter 2 Literature review
119997290052 / Gujarat Technological University Page 47
Regulatory Acceptance Included in the FDA Inactive Ingredients Guide (oral
suspensions, tablets; ophthalmic, rectal, and topical
preparations transdermal preparations, vaginal
suppositories).
2.11 References
1. Michael J Pelczar, ECS Chan NRK. Microbiology., (1993). 5th ed. Tata Mc Graw Hill
Publishing company Ltd.,New Delhi.
2. H.P. Rang, M.M.Dale, J.M. Ritter PKM. Pharmacology. In: Pharmacology. 5th ed.
Churchill Livingstone; 2003:654-665.
3. Gelderblom HR. (1996). Structure and Classification of Viruses. In: Baron S, Medical
Microbiology. 4th ed. Galveston (TX): University of Texas Medical Branch at
Galveston.
4. Hynes M. Baltimore Classification of Viruses. Mol Biol Webb. 2015:1.
5. Retroviruses. [Online]. Available:http://retrovirology.biomedcentral.com/ [Accessed
12 November, 2015]
6. Thakur DS, Behera CK, Patidar A, Kumar P, Kumar P, Lal C., (2010). Anti-HIV
agents: A step towards future. Int J Pharm Sci Rev Res.;3(2):10-18.
7. Gupta U, Jain NK., (2010). Non-polymeric nano-carriers in HIV/AIDS drug delivery
and targeting. Adv Drug Deliv Rev.;62(4-5):478-490.
8. Virus vs Retrovirus. [Online]. Available:
http://www.differencebetween.com/difference-between-retrovirus-and-vs-virus/.
[Accessed 25 June 2016]
9. Gupta U, Jain NK., (2010). Non-polymeric nano-carriers in HIV/AIDS drug delivery
and targeting. Adv Drug Deliv Rev.;62(4-5):478-490.
10. Fisher, Bruce; Harvey, Richard P.; Champe PC. (2007). In: Lippincott’s Illustrated
Reviews: Microbiology (Lippincott’s Illustrated Reviews Series):3.
11. Chan DC, Fass D, Berger JM, Kim PS. , (1997) Core structure of gp41 from the HIV

Chapter 2 Literature review
119997290052 / Gujarat Technological University Page 48
envelope glycoprotein. Cell.;89(2):263-273.
12. Foxall RB, Soares RS, Albuquerque AS, Cortesao CS, Victorino RMM, Sousa AE.,
(2008). Increased frequency of CD25dimCD4+ T-cells in HIV-2 infection, a naturally
occurring attenuated form of HIV-1. Clin Immunol.;127(2):158-167.
13. List of Viral Diseases. [Online]. Available:
http://doctors-hospitals-medical-cape-town-south-africa.blaauwberg.net/details.php
?id=768. [Accessed 25 June 2016]
14. Top 10 Deadliest Diseases in the world. [Online]. Available:
https://www.microhealthllc.com/top-10-deadliest-diseases-in-the-world/ [Accessed 25
June 2016]
15. Overview of viral infections. [Online]. Available:
http://www.merckmanuals.com/home/infections/viral-infections/overview-of-viral-inf
ections. [Accessed 25 June 2016]
16. Alexander Krämer, Mirjam Kretzschmar KK., (2010). Modern Infectious Disease
Epidemiology Concepts, Methods, Mathematical Models, and Public Health. New
York: Springer.
17. William N. Rom SBM., (2007). Environmental and Occupational Medicine. 4th ed.
Lippincott Williams & Wilkins.
18. Global HIV/AIDS Overview.
https://www.aids.gov/federal-resources/around-the-world/global-aids-overview/.
Accessed November 12, 2015.
19. WHO | HIV/AIDS. [Online]. Available: http://www.who.int/gho/hiv/en/. [Accessed
November 12, 2015]
20. Lembo D, Cavalli R., (2010). Nanoparticulate delivery systems for antiviral drugs.
Antivir Chem Chemother.;21(2):53-70.
21. FDA. FDA approved -HIV-Medicines. 2016. [Online]. Available:
https://aidsinfo.nih.gov/education-materials/fact-sheets/21/58/fda-approved-hiv-medici
nes.[Accessed November 11, 2016].
22. Nelson AG, Zhang X, Ganapathi U, et al., (2015). Drug delivery strategies and systems
for HIV/AIDS pre-exposure prophylaxis and treatment. J Control

Chapter 2 Literature review
119997290052 / Gujarat Technological University Page 49
Release.;219(2015):669-680.
23. Hasegawa T, Kawaguchi T., (2002). Delivery of Anti-Viral Nucleoside Analogues to
the Central Nervous System. Curr Med Chem -Anti-Infective Agents;1(1):55-63. 23.
24. Mallipeddi R, Rohan LC., (2010). Progress in antiretroviral drug delivery using
nanotechnology. Int J Nanomedicine.;5(1):533-547.
25. Lun H, Chattopadhyay N, Yu X, Bendayan R., (2010). Nanotechnology applications
for improved delivery of antiretroviral drugs to the brain. Adv Drug Deliv
Rev. ;62(4-5):503-517.
26. Rao KS, Ghorpade A, Labhasetwar V.,(2009). Targeting anti-HIV drugs to the CNS.
Expert Opin Drug Deliv.;6(8):771-784.
27. Cundy KC, Lynch G, Lee WA. Antiviral Research. 1997;35(2):113-122.
doi:10.1016/j.antiviral.2009.11.004.
28. Dale Purves, George J Augustine, David Fitzpatrick, Lawrence C Katz,
Anthony-Samuel LaMantia, James O McNamara and SMW, (2001). Neuroscience.
2nd ed. Sunderland (MA): Sinauer Associates.
29. Gizurarson S (2012). Anatomical and histological factors affecting intranasal drug and
vaccine delivery. Curr Drug Deliv. 2012;9(6):566-582.
30. Pelvig DP, Pakkenberg H, Stark AK, Pakkenberg B. (2008). Neocortical glial cell
numbers in human brains. Neurobiol Aging.;29(11):1754-1762.
31. Ginhoux F, Lim S, Hoeffel G, Low D, Huber T. (2013). Origin and differentiation of
microglia. Front Cell Neurosci.;7(April):45.
32. Filiano AJ, Gadani SP, Kipnis J., (2014). Interactions of innate and adaptive immunity
in brain development and function. Brain Res. 2015;1617:18-27.
33. GW K. The First Line of Defense in Brain Pathologies. (1995). Drug Res
(Stuttg) ;45(1):357–360.
34. Krol S., (2012). Challenges in drug delivery to the brain: Nature is against us. J
Control Release. 2012;164(2):145-155.
35. Gaillard PJ, Visser CC, Appeldoorn CCM, Rip J., (2012). Enhanced brain drug
delivery: Safely crossing the blood-brain barrier. Drug Discov Today
Technol.;9(2):e155-e160.

Chapter 2 Literature review
119997290052 / Gujarat Technological University Page 50
36. Wong HL, Wu XY, Bendayan R. (2012). Nanotechnological advances for the delivery
of CNS therapeutics. Adv Drug Deliv Rev.;64(7):686-700.
37. Chen Y, Liu L., (2012). Modern methods for delivery of drugs across the blood-brain
barrier. Adv Drug Deliv Rev.;64(7):640-665.
38. Rausch DM, Stover ES., (2011). Neuroscience research in AIDS. Prog
Neuro-Psychopharmacology Biol Psychiatry. 2001;25(1):231-257.
39. Park K. (2008). Trojan monocytes for improved drug delivery to the brain. J Control
Release. ;132(2):75.
40. Varatharajan L, A TS., (2009). The transport of anti-HIV drugs across blood–CNS
interfaces: Summary of current knowledge and recommendations for further research.
Antiviral Res.;82(2):A99-A109.
41. Sozio P, Cerasa LS, Laserra S, et al., (2013). Memantine-sulfur containing antioxidant
conjugates as potential prodrugs to improve the treatment of Alzheimer’s disease. Eur
J Pharm Sci.;49(2):187-198.
42. Perioli L, Ambrogi V, Bernardini C, et al., (2004). Potential prodrugs of non-steroidal
anti-inflammatory agents for targeted drug delivery to the CNS. Eur J Med
Chem. ;39(8):715-727.
43. Ikeda M, Bhattacharjee AK, Kondoh T, Nagashima T, Tamaki N (2002),. Synergistic
effect of cold mannitol and Na(+)/Ca(2+) exchange blocker on blood-brain barrier
opening. Biochem Biophys Res Commun.;291(3):669-674.
44. Qin LJ, Gu YT, Zhang H, Xue YX. (2009). Bradykinin-induced blood-tumor barrier
opening is mediated by tumor necrosis factor-α. Neurosci Lett. 2009;450(2):172-175.
45. Hynynen K (2007). Focused ultrasound for blood – brain disruption and delivery of
therapeutic molecules into the brain.:27-35.
46. Vykhodtseva N, McDannold N, Hynynen K., (2008). Progress and problems in the
application of focused ultrasound for blood-brain barrier disruption.
Ultrasonics;48(4):279-296.
47. Liu L, Guo K, Lu J, et al., (2008). Biologically active core/shell nanoparticles
self-assembled from cholesterol-terminated PEG-TAT for drug delivery across the
blood-brain barrier. Biomaterials;29(10):1509-1517.

Chapter 2 Literature review
119997290052 / Gujarat Technological University Page 51
48. Pang Z, Lu W, Gao H, et al., (2008). Preparation and brain delivery property of
biodegradable polymersomes conjugated with OX26. J Control Release.
2008;128(2):120-127.
49. Rohit B, Pal KI., (2013). A Method to Prepare Solid Lipid Nanoparticles with
Improved Entrapment Efficiency of Hydrophilic Drugs. Curr Nanosci.;9(2):211-220.
50. Delivery AD., (2009). Nanotechnology for Antiretroviral Drug Delivery. J Am Chem
Soc.:21-23.
51. Bhanushali RS, Gatne MM, Gaikwad R V, Bajaj AN, Morde MA., (2015).
Nanoemulsion based Intranasal Delivery of Antimigraine Drugs for Nose to Brain
Targeting;71(6):707-709.
52. Mishra V, Kesharwani P., (2016). Dendrimer technologies for brain tumor. Drug
Discov Today.;21(5):766-778.
53. Ingallina C, Rinaldi F, Bogni A, et al., (2016). Niosomal approach to brain delivery:
Development, characterization and in vitro toxicological studies. Int J
Pharm. ;511(2):969-982.
54. Kozlovskaya L, Stepensky D., (2013). Quantitative analysis of the brain-targeted
delivery of drugs and model compounds using nano-delivery systems. J Control
Release;171(1):17-23.
55. Van der Meel R, Vehmeijer LJC, Kok RJ, Storm G, van Gaal EVB., (2013).
Ligand-targeted particulate nanomedicines undergoing clinical evaluation: Current
status. Adv Drug Deliv Rev.;65(10):1284-1298.
56. Serralheiro A, Alves G, Fortuna A, Falcao A. (2015). Direct nose-to-brain delivery of
lamotrigine following intranasal administration to mice. Int J
Pharm. ;490(1-2):39-46.
57. Woensel M Van, Wauthoz N, Rosière R, et al., (2013). Formulations for Intranasal
Delivery of Pharmacological Agents to Combat Brain Disease: A New Opportunity to
Tackle GBM:1020-1048.
58. Kumar M, Misra A, Babbar AK, Mishra AK, Mishra P, Pathak K., (2008) Intranasal
nanoemulsion based brain targeting drug delivery system of risperidone. Int J
Pharm.;358(1-2):285-291.
Chapter 2 Literature review
119997290052 / Gujarat Technological University Page 52
59. Patel S, Chavhan S, Soni H, , Babbar AK, Mathur R MA and SK., (2011). Brain
targeting of risperidone-loaded solid lipid nanoparticles by intranasal route. J Drug
Target.;19(6):468–474.
60. Seju U, Kumar A, Sawant KK., (2011). Development and evaluation of
olanzapine-loaded PLGA nanoparticles for nose-to-brain delivery: In vitro and in vivo
studies. Acta Biomater.;7(12):4169-4176.
61. Kaur IP, Bhandari R, Bhandari S, Kakkar V., (2008). Potential of solid lipid
nanoparticles in brain targeting. J Control Release.;127(2):97-109.
62. Attama A , Momoh MA, Builders PF. Lipid Nanoparticulate Drug Delivery Systems: A
Revolution in Dosage Form Design and Development (2012). Recent Adv Nov Drug
Carr Syst. 2012:107-140.
63. Mehnert W, Mäder K., (2012). Solid lipid nanoparticles. Adv Drug Deliv Rev.
2012;64:83-101.
64. Blasi P, Giovagnoli S, Schoubben A, et al., (2011). Lipid nanoparticles for brain
targeting I. Formulation optimization. Int J Pharm.;419(1-2):287-295.
65. Yasir M, Sara UVS., (2014). Solid lipid nanoparticles for nose to brain delivery of
haloperidol: in vitro drug release and pharmacokinetics evaluation. Acta
Pharmaceutica Sinica B;4(6):454-463.63.
66. Sharma N, Mishra N., (2014). Importance of Lipid Nanoparticles in the Treatment of
Epilepsy: a Focus on Nasal Delivery. J Pharm Sci Innov.;3(3):199-207.
67. Mistry A, Stolnik S, Illum L., (2009). Nanoparticles for direct nose-to-brain delivery
of drugs;379:146-157.
68. Edition S. Ophthalmic Drug Delivery Systems. Clin Res. 966:80-87.
69. Abbas Z., (2012). Mucoadhesive in situ gels as nasal drug delivery systems : an
overview. ;7(3):168-180.
70. Ravi PR, Aditya N, Patil S, Cherian L., (2013). Nasal in-situ gels for delivery of
rasagiline mesylate: improvement in bioavailability and brain localization. Drug
Deliv. ;7544:1-8.
71. Qiu Y, Park K., (2001). Environment-sensitive hydrogels for drug
delivery. ;53:321-339.

Chapter 2 Literature review
119997290052 / Gujarat Technological University Page 53
72. Dumortier G, Grossiord JL, Agnely F, Chaumeil , (2006). Expert Review A Review of
Poloxamer 407 Pharmaceutical and Pharmacological Characteristics.;23(12):11095.
73. Arbelaez-Camargo D, Suñé-Negre JM, Roig-Carreras M, et al., (2016). Preformulation
and characterization of a lidocaine hydrochloride and dexamethasone sodium
phosphate thermo-reversible and bioadhesive long-acting gel for intraperitoneal
administration. Int J Pharm.;498(1-2):142-152.
74. Morsi N, Ghorab D, Refai H, Teba H., (2016). Ketoroloac tromethamine loaded
nanodispersion incorporated into thermosensitive in situ gel for prolonged ocular
delivery. Int J Pharm.;506(1-2):57-67.
75. Burkoth AK, Anseth KS. A review of photocrosslinked polyanhydrides: in situ forming
degradable networks. Biomaterials. 2000;21(23):2395-2404.
76. Lochhead JJ, Thorne RG., (2012). Intranasal delivery of biologics to the central
nervous system. Adv Drug Deliv Rev.;64(7):614-628.
77. Eskandari S, Varshosaz J, Minaiyan M, Tabbakhian M., (2011). Brain delivery of
valproic acid via intranasal administration of nanostructured lipid carriers: in vivo
pharmacodynamic studies using rat electroshock model. Int J
Nanomedicine. ;6:363-371.
78. Lochhead JJ, Thorne RG., (2012). Intranasal delivery of biologics to the central
nervous system. Adv Drug Deliv Rev.;64(7):614-628.
79. Sood S, Jain K, Gowthamarajan K., (2014). Optimization of curcumin nanoemulsion
for intranasal delivery using design of experiment and its toxicity assessment. Colloids
Surfaces B Biointerfaces;113:330-337.
80. Patel T, Zhou J, Piepmeier JM, Saltzman WM (2012). Polymeric nanoparticles for
drug delivery to the central nervous system. Adv Drug Deliv Rev. 2012;64(7):701-705.
81. Johnson NJ, Hanson LR, Iliff JJ, Ph D, Androulakis IP., (2011). Trigeminal pathways
deliver a low molecular weight drug from the nose to the brain and orofacilal
structures;7(3):228-237.
82. Jogani V V, Shah PJ, Mishra P, Mishra AK, Misra AR., (2007). Nose-to-brain delivery
of tacrine:1199-1205.
83. G.J. T. (1998) Principles of Human Anatomy. 8th ed. Mento Park: Benjamin/cummings

Chapter 2 Literature review
119997290052 / Gujarat Technological University Page 54
Science Publishing.
84. Adams G.L. , Boies L.R. HPA.(1989). Fundamentals of Otolaryngology, A Textbook of
Ear, Nose and Throat Diseases. Philadelphia.
85. Sharma S, Lohan S, Murthy RSR., (2012). Potential of Chitosan for nose to brain drug
delivery, Int. J. Pharm. Sci. Rev. Res.;16(1):47-55.
86. Kumar TP, Sirisha B, Raju PN, Reddy GN., (2013). Nasal Drug Delivery : A Potential
Route for Brain Targetting. pharma Innov. 2013;2(1):77-85.
87. Djupesland PG, Mahmoud RA, Messina JC. (2013). Accessing the brain: the nose may
know the way. J Cereb Blood Flow Metab.;33(5):793-794.
88. Ding J, Na L, Mao S., (2012). Chitosan and its derivatives as the carrier for intranasal
drug delivery;7(October):349-361.
89. Singh AK SA and MN (2012). Nasal cavity: A promising platform for drug delivery
and research approaches from nasal to brain targeting. J drug del ther.;2(3):22-33.
90. Zaki NM, Awad GAS, Mortada ND, Abd ElHady SS.(2006) Rapid-onset intranasal
delivery of metoclopramide hydrochloride. Part I. Influence of formulation variables
on drug absorption in anesthetized rats. Int J Pharm. 2006;327(1-2):89-96.
91. DrugBank: Efavirenz. [Online]. Available: http://www.drugbank.ca/drugs/DB00625.
[Accessed November 12, 2015].
92. HIV Drug Interactions., (2011). Efavirenz PK Factsheet. [Online]. Available:
http://www.hiv-druginteractions.org/.[Accessed November 12, 2015].
93. Marzolini C, Telenti A, Decosterd L a, Greub G, Biollaz J, Buclin T., (2001). Efavirenz
plasma levels can predict treatment failure and central nervous system side effects in
HIV-1-infected patients. Aids.:71-75.
94. Blasi P, Giovagnoli S, Schoubben A, Ricci M, Rossi C., (2007). Solid Lipid
Nanoparticles For Targeted Brain Drug Delivery. Adv Drug Deliv Rev.;59(6):454-477.
95. McGinity JW, Harris MR, Patel K et. al., (1986). Handbook of Pharmaceutical
Excipients. American Pharmaceutical Association. Washington-DC, USA; 1986.
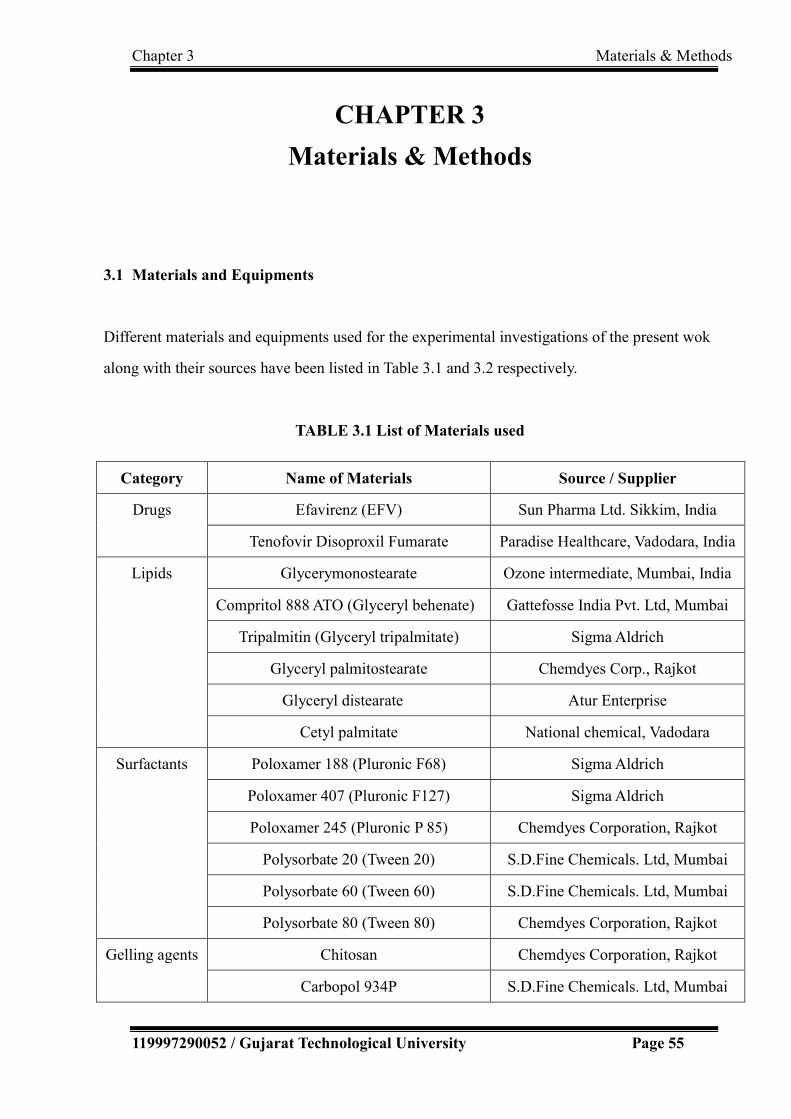
Chapter 3 Materials & Methods
119997290052 / Gujarat Technological University Page 55
CHAPTER 3
Materials & Methods
3.1 Materials and Equipments
Different materials and equipments used for the experimental investigations of the present wok
along with their sources have been listed in Table 3.1 and 3.2 respectively.
TABLE 3.1 List of Materials used
Category Name of Materials Source / Supplier
Drugs Efavirenz (EFV) Sun Pharma Ltd. Sikkim, India
Tenofovir Disoproxil Fumarate Paradise Healthcare, Vadodara, India
Lipids Glycerymonostearate Ozone intermediate, Mumbai, India
Compritol 888 ATO (Glyceryl behenate) Gattefosse India Pvt. Ltd, Mumbai
Tripalmitin (Glyceryl tripalmitate) Sigma Aldrich
Glyceryl palmitostearate Chemdyes Corp., Rajkot
Glyceryl distearate Atur Enterprise
Cetyl palmitate National chemical, Vadodara
Surfactants Poloxamer 188 (Pluronic F68) Sigma Aldrich
Poloxamer 407 (Pluronic F127) Sigma Aldrich
Poloxamer 245 (Pluronic P 85) Chemdyes Corporation, Rajkot
Polysorbate 20 (Tween 20) S.D.Fine Chemicals. Ltd, Mumbai
Polysorbate 60 (Tween 60) S.D.Fine Chemicals. Ltd, Mumbai
Polysorbate 80 (Tween 80) Chemdyes Corporation, Rajkot
Gelling agents Chitosan Chemdyes Corporation, Rajkot
Carbopol 934P S.D.Fine Chemicals. Ltd, Mumbai

Chapter 3 Materials & Methods
119997290052 / Gujarat Technological University Page 56
Thermo-sensit
ive polymers
Poloxamer 188 (Pluronic F68) Sigma Aldrich
Poloxamer 407 (Pluronic F127) Sigma Aldrich
Solvents Methanol S.D. Fine Chemicals Ltd., Mumbai
Acetonitrile S.D. Fine Chemicals Ltd., Mumbai
Isopropyl Alcohol S.D. Fine Chemicals Ltd., Mumbai
Other
chemical
Reagents
Potassium bromide Merck Millipore
Disodium hydrogen phosphate Allied Chemical Corporation,
Baroda
Potassium dihydrogen phosphate Allied Chemical Corporation,
Baroda
Sodium Chloride Fischer scientific , Mumbai
Sodium hydroxide Fischer scientific , Mumbai
Orthophosphoric acid Fischer scientific , Mumbai
Dialysis
Membrane
110 (LA 395) Himedia
Nasal mucosa Freshly excised goat Slaughter house
Blood/ plasma - PASM Hospital, Vadodara, Gujarat

Chapter 3 Materials & Methods
119997290052 / Gujarat Technological University Page 57
TABLE 3.2 List of Instruments used
Instruments Model Manufacturer
Digital weighing balance CWS103C
RB-1201
Scaletec Mechatronics Pvt. Ltd., Vadodara
Raptec (Reputed Micro systems, Ahmedabad)
Melting Point Apparatus VMP-D Veego Inst. corp., Mumbai
FTIR Spectrophotometer Alpha -1 Bruker Optics, Germany
UV-spectrophotometer UV-1800 Shimadzu corporation, Japan
HPLC 2695 Waters (Allience)
Freeze Centrifuge BL-35 R BioLab, Israel
Vortex mixer Spinix Spinix Corporation, Danville CA, USA
Water bath Digital Shaker NOVA Inst. Pvt. Ltd., Ahmedabad
Particle size analyzer Nanoseries
Nano-ZS
Malvern instrument, UK
High Speed Homogenizer Silent Crusher M Heidolph, Germany
High Pressure Homogenizer Panda Plus / GEA
Niro Soavi
Inkarp Instruments Pvt. Ltd., Hyderabad,
India
Magnetic Stirrer DBK Remi Equipments, Mumbai, India
Sonicator CV334, Sonico
Vibra Cell
Sonics Incorporation, USA
Bath Sonicator Fast Clean
ultrasonic cleaner, Skymen Cleaning Equipment Shwnzhen
Co.Ltd./ Lelesil Innovative system
Hot Plate - Sunbim, Mumbai, India
pH meter LI 615 Elico India, Hyderabad
Brookfield Viscometer DV-I Prime Brookfield Pvt. Ltd, USA
Franz diffusion cell - D. K. Scientific Laboratories, Ahemedabad
TEM Tecnai 20 Philips, Holland
Inverted Microscope (NIKION TS -100) Nikon corporation, Japan
Stability chamber Humidity controlled
chamber
Thermolab Pvt. Ltd., India

Chapter 3 Materials & Methods
119997290052 / Gujarat Technological University Page 58
3.2. Identification of Drug
Identification of the procured drug is one of the important preliminary tests to be performed
for verification and ensuring the purity of the drug sample prior to formulation development.
Identification test is also included as a compendial test to provide an aid in verifying the
identity of articles as they are purpoted [1]. Identification of drug sample in the present
investigations was based on its appearance, solubility, melting point and was confirmed by
fourier-transform infrared (FT-IR) spectroscopic determination of various functional groups
present in the powder drug sample.
3.2.1 Appearance: The procured drug sample was visually observed for its color and was
compared with the reported appearance of the drug.
3.2.2 Solubility: Quantitative solubility tests are performed as a test for purity [1].
Solubility of drug was determined in water and methanol. 10 mg sample was taken in a
clean dry test tube and solvent was added gradually in aliquots of 0.1 ml with continuous
shaking until it dissolved completely [2]. Amount of solvent required for solubilization of
the drug powder was recorded and the solubility was compared with the reported values.
3.2.3 Melting point: Melting point is one of the identification test method for organic
substances. Hence, it was determined for the sample by capillary method using melting point
apparatus (VMP-D, Veego). Small amount of the sample was filled in a capillary tube
(closed at one end) and placed in the melting point apparatus. The temperature at which the
substance started to convert into liquid and the temperature at which the solid completely
disappeared was recorded.
3.2.4 Infrared Absorption: Fourier Transform Infrared (FT-IR) is an important
complementary tool for the solid-state characterization of pharmaceutical solids [3].
Identification of drug was done by infrared spectroscopy technique using Alpha Bruker
FTIR spectrophotometer. The sample was prepared by disc method. The drug was triturated

Chapter 3 Materials & Methods
119997290052 / Gujarat Technological University Page 59
with potassium bromide (about 5 mg sample with 100 mg dry potassium bromide) in a
mortar-pestle to produce fine and uniform mixture. The pellets were prepared by
compressing the powder at 20 psi for 10 min using potassium bromide press. Prepared
sample disc was placed in the sample compartment. Sample was scanned at transmission
mode in the region of 4000-400 cm-1. The IR spectrum obtained was compared with
standard spectrum of pure drug.
3.3 Analytical methods
Analytical methods for the estimation of drug content were needed at various stages of the
investigations in the present work, such as at preformulation, optimization and evaluation
stages. At preformulation and optimization stages, it was required to determine the
entrapment efficiency of the formulation for selection of material and optimization of their
concentrations. The analytical methods were needed for the in-vitro and ex-vivo drug release
studies and evaluation of samples of stability testing. Analytical method was also required
for estimation of drug in plasma and brain post-administration of the formulations. Hence,
suitable analytical methods were required to be selected or developed for the accurate,
precise and convenient analysis of the drug.
3.3.1 UV- Spectrophotometric estimation of Efavirenz
UV spectrophotometric methods have been reported for the estimation of efavirenz in
formulations [4, 5]. Calibration curves were plotted in methanol:water (50% v/v) and in
methanolic phosphate-buffered saline (PBS) (pH 6.4, 40%v/v) as solvents using UV-1800
spectrophotometer (Shimadzu) at 247 nm.
3.3.1.1 Calibration curve in methanol:water (50 %v/v) as solvent :
The calibration curve of the drug in methanol:water (50 %v/v) as solvent was useful to
determine the entrapment efficiency and for analysing the stability samples.

Chapter 3 Materials & Methods
119997290052 / Gujarat Technological University Page 60
Preparation of stock solutions: 100 mg accurately weighed quantity of EFV was
transferred to 100 ml volumetric flask. It was dissolved and the volume was made up to the
mark with methanol:water (50 %v/v) to get the final concentration of the stock-1 solution as
1000 µg/ml of drug. 1 ml of the stock-1 solution was further diluted to 10 ml with the same
solvent to obtain stock-2 solution (100µg/ml).
Preparation of samples for the calibration plot: Appropriate aliquots of the stock-2
solution of EFV (0.3, 0.6, 0.9, 1.2, 1.5, 1.8 ml) were accurately pipetted out into 10ml
volumetric flasks and were made up to the mark with the solvent to get the final
concentration of the drug in the range 3 – 18 µg/ml. The drug-free solvent was used as
blank. Scanning was performed in the range 200-400 nm to determine the λmax. The
absorbance of all the prepared solutions was obtained at λmax. The procedure was repeated in
triplicate and the observations were recorded. Mean value of the absorbance (n=3) were
plotted graphically against concentration to obtain the calibration curve.
3.3.1.2 Calibration curve in methanolic phosphate-buffered saline (pH 6.4, 40%v/v):
The calibration curve was also plotted in methanolic phosphate-buffered saline (pH 6.4,
40%v/v) and regression equation was determined for the release studies of drug from the
formulations. The pH was selected based on the nasal mucosal pH (5.5-6.5) and methanol
being added to maintain the sink condition [6, 7].
Preparation of Phosphate-buffered saline pH 6.4 [8]: 1.79 g of disodium hydrogen
phosphate, 1.36 g of potassium dihydrogen phosphate and 7.02 g of sodium chloride was
dissolved in sufficient water to produce 1000 ml.
Preparation of stock solutions: 100 mg accurately weighed quantity of EFV was
transferred to 100 ml volumetric flask. It was dissolved and the volume was made up to the
mark with methanolic PBS (pH 6.4, 40%v/v) to get the final concentration of the stock-1
solution as 1000 µg/ml of EFV. 1 ml of the stock-1 solution was further diluted to 10 ml
with the same solvent system to obtain stock-2 solution (100µg/ml).

Chapter 3 Materials & Methods
119997290052 / Gujarat Technological University Page 61
Preparation of samples for the calibration plot: Appropriate aliquots of the stock-2
solution of EFV (0.3, 0.6, 0.9, 1.2, 1.5, 1.8 ml) were accurately pipetted out into 10ml
volumetric flasks and were made up to the mark with the solvent to get the final
concentration of the drug in the range 3 – 18 µg/ml. The drug-free methanolic PBS (pH 6.4,
40%v/v) was used as blank. Scanning was performed in the range 200-400 nm to determine
the λmax. The absorbance of all the prepared solutions was obtained at λmax. The procedure
was repeated in triplicate and the observations were recorded. Mean value of the absorbance
(n=3) were plotted graphically against concentration to obtain the calibration curve.
3.3.2 High Performance Liquid Chromatographic Method (HPLC method)
Development & Validation
High performance liquid chromatographic method was developed and validated using HPLC
with UV Detector - Waters (Allience) for the estimation of EFV in plasma and brain samples
for the pharmacokinetic / biodistribution studies. Tenofovir disoproxil fumarate (TDF) was
used as the internal standard.
Preparation of standard solution : Stock solution of EFV (0.5 mg/ml) and TDF (1 mg/ml)
were prepared by dissolving 50 mg EFV and 100 mg of TDF respectively in 100 ml diluent
(Methanol:Water, 50 %v/v). Further dilution of 5 ml of stock solution to 100 ml with diluent
was done to produce 25 ppm EFV solution and 50 ppm TDF solution for trial batches. The
working standards of EFV in concentrations ranging from 1–300 µg/ml were prepared by
spiking appropriate amount of the standard solution in drug-free plasma.
Sample Preparation in plasma: The normal pooled plasma sample from 20 people was
obtained from Parul Arogya Seva Mandal (PASM) hospital. The plasma sample of 250µl
was transferred to tubes in which 100µL of TDF (internal standard) and 50µL of Efavirenz
were added, followed by 1 ml of ethyl acetate. The samples were vortexed for 1 min. The
samples were then centrifuged using freeze centrifuge (BL – 135 R) at 10000 RPM (40C)
and organic phase was evaporated via nitrogen purging. The solid residue was reconstituted
with 100µL of mobile phase and was injected into the HPLC column [9-11].
Chapter 3 Materials & Methods
119997290052 / Gujarat Technological University Page 62
3.3.2.1 Analytical Method development
Standard solution of EFV (25 ppm) and TDF (50 ppm) were scanned in the range of
200-400 nm for determination of detection wavelength in HPLC. Various trials were taken
by varying the column, mobile phase, pH of mobile phase, flow rate, etc. at λmax to optimize
the analytical method to give good peaks with suitable retention time [12, 13].
3.3.2.2 Analytical method validation
The developed analytical method was validated for various parameters like linearity,
precision, accuracy, specificity, robustness as per ICH guidelines and data obtained were
statistically analyzed [14, 15].
A. Linearity and Range
The linearity was established in the range of 1 to 300 µg/ml concentrations (1, 5, 10, 20, 25,
50, 100, 200, 300 µg/ml) of EFV. The concentration of TDF (internal standard) was 50µg/ml.
All the experiments were replicated thrice. The linear regression analysis of the area ratios
(analyte/ internal standard) vs. concentration curve was determined. The linearity was
verified using estimates of correlation coefficient.
B. Precision
The precision (repeatability) of the analytical method was determined by assaying six
samples at 100% test concentration and estimating standard deviation (SD) and % relative
standard deviation (RSD). The intra-day and inter-day precisions were also determined by
analyzing three samples at three different times of the same day and on three consecutive
days respectively and determining SD & % RSD and analyzing the data statistically using
ANOVA.
C. Accuracy
Accuracy was assessed at three concentration levels. Six replicates were analyzed at 100%

Chapter 3 Materials & Methods
119997290052 / Gujarat Technological University Page 63
concentration level and three replicates each at 50% and 150% concentrations. Assessment
of accuracy was accomplished by evaluating the percent recovery of the analyte.
D. Limit of Detection (LOD) and Limit of Quantification (LOQ)
LOD : Signals for known low concentration (six replicates of 0.01 µg/ml) of analyte was
compared with blank sample. Signal to noise ratio was found and compared with acceptable
value (2:1) [14].
LOQ: Determination of the signal to noise ratio was performed by comparing measured
signals from samples with known low concentrations (six replicates of 0.05 µg/ml) of
analyte with those of blank samples and was compared with typically accepted signal-to
–noise ratio of 10:1[14].
E. Specificity
Specificity is the ability to assess unequivocally the analyte in the presence of components
which may be expected to be present. The specificity was assessed by analyzing the analyte
in the presence of placebo. The results were based on three replicate analyses.
F. Robustness
The robustness of the analytical procedure was measured from its capacity to remain
unaffected by small, but deliberate variations in method parameters - flow rate (+ 0.2),
wavelength (+ 2), pH of mobile phase (+ 0.2) which provided an indication of its reliability
during normal usage.
G. Stability of analytical solution:
Stability of the analytical solution was tested at 2, 4, 6, 12, 18, 24 hours and after 10 days in
plasma and compared with chromatograms of freshly prepared sample. Experiments were
replicated three times.
Chapter 3 Materials & Methods
119997290052 / Gujarat Technological University Page 64
H. System suitability test
For system suitability six replicates of drug samples were run at 25 µg/ ml and 50µg/ml
concentration of EFV and TDF respectively. Repeatability with respect to peak height and
peak area in six replicates, peaks symmetry (tailing factor), resolution between the peaks of
drugs, theoretical plates of the column (column efficiency) and retention time were
determined.
I. Statistical analysis :
The data obtained were statistically evaluated with the help of Microsoft Excel. Linearity
was assessed by determination of standard deviation, correlation coefficient and linear
regression equation. While accuracy of the developed analytical method was assessed by %
recovery method, standard deviation (SD) and relative standard deviation (% RSD) were
determined for confirming the precision, robustness, etc. Intraday and interday precision was
statistically analyzed using ANOVA from Analysis Toolpak of Microsoft Excel.
Signal-to-noise ratios were determined for LOD and LOQ.
3.4 Design of experiment
Product should be designed to meet patients’ needs and the intended product performance.
Pharmaceutical development should include defining of quality target product profile
(QTPP), identifying and determining potential critical quality attributes (CQAs), selecting
an appropriate manufacturing process, defining a control strategy, identifying, through e.g.,
prior knowledge, experimentation, and risk assessment, the material attributes and process
parameters that can have an effect on product CQAs. The systematic approach could
facilitate product development and continual improvement and innovation throughout the
product lifecycle [16-18]. In the present work, various preformulation investigations were
performed like identification of drug, selection of different materials, compatibility studies,
etc. followed by formulation and optimization of various parameters by factorial design to
achieve minimize particle size and maximum encapsulation efficiency of the drug in SLN

Chapter 3 Materials & Methods
119997290052 / Gujarat Technological University Page 65
[19, 20]. As per the literature review, the entrapment efficiency is mainly influenced by the
formulation ingredients, their concentrations and the technique used for its formulation,
hence was considered as one of the response parameter for optimization of formulation
variables [21-23]. The SLN were further incorporated in the in-situ gel system and
investigated for various performance parameters.
3.5 Preformulation studies
The major components for the solid lipid nanoparticulate system include the drug, lipid and
surfactant. After the identification of the drug, various materials were screened as
components for the proposed system. These selections were based on the solubility of the
drug and their ability to produce small sized particles. The selections were also based on the
safety profile and approval status of the components.
3.5.1 Selection of Lipid
Different lipids were screened on the basis of solubility studies. The solubility of the drug
was determined in different lipids. Amount of drug dissolved in known amount of each lipid
at a temperature 50C above the melting point of the respective lipid was determined using
digital shaker water bath (NOVA Inst Pvt. Ltd., Ahmedabad, India) and the lipid showing
maximum solubility for the drug was proposed to have maximum drug loading capacity and
was selected for further investigations [24-26].
3.5.2 Selection of Surfactant
With the selected lipid, nanoparticles were prepared using different surfactants and were
evaluated with respect to the particle size, PDI and entrapment efficiency. The particle size
and PDI was determined using Malvern Zetasizer Nanoseries Nano-ZS, UK. Selection of the
surfactant was made based on minimum particle size and PDI with maximum entrapment
efficiency [27].

Chapter 3 Materials & Methods
119997290052 / Gujarat Technological University Page 66
3.5.3 Drug-Excipient Compatibility Study
IR spectra of pure drug, and the physical mixtures of drug and selected excipients stored at
25 ± 2 OC, 60% ± 5% relative humidity for a period of 7 days were recorded using FT-IR
spectrophotometer (Bruker Alpha-one, Bruker Optik, Germany) in the range of 4000–400
cm-1 and compared for any significant change [28, 29].
3.6 Selection of formulation Technique
Various techniques for SLN formulation are high shear homogenization and ultrasound, high
pressure homogenization, solvent emulsification and evaporation technique, microemulsion
based SLN preparation technique, etc [26, 30-34]. The selection of the technique was made
based on the evaluation of particle size, PDI and entrapment efficiency of the nanoparticles
obtained with the trial batches using the commonly used and reported to be reliable and
powerful techniques.
3.6.1 High Pressure Homogenization
There are two general homogenization techniques (hot homogenization and cold
homogenization) which can be used for the production of SLN [30]. In the present study, hot
homogenization technique was investigated. The drug was incorporated into the melted lipid.
The drug loaded lipidic phase was dispersed in a hot aqueous surfactant solution under
continuous stirring to form a coarse o/w emulsion. It was then homogenized at the
temperature above the melting point of the lipid using high pressure homogenizer (Panda
Plus / GEA Niro Soavi, Parma, Italy) to form o/w nanoemulsion which was cooled to room
temperature for solidification and formation of solid lipid nanoparticles [27, 34].

Chapter 3 Materials & Methods
119997290052 / Gujarat Technological University Page 67
FIGURE 3.1: Formulation of solid lipid nanoparticles by high pressure
homogenization
3.6.2 Solvent Evaporation method
The lipophilic drug was dissolved in a water-immiscible organic solvent and was emulsified
in an aqueous phase containing the surfactant under continuous stirring on a magnetic stirrer.
The organic solvent was evaporated and nanoparticulate dispersion was formed by
precipitation of the lipid in the aqueous medium [19, 30, 31].

Chapter 3 Materials & Methods
119997290052 / Gujarat Technological University Page 68
FIGURE 3.2: Formulation of solid lipid nanoparticles by solvent evaporation
technique
3.7 Optimization of Process Variables
On the basis of literature survey and a few trial batches, various critical process variables
which may have significant effect on the critical quality attributes were identified for each
step involved in the formulation and were subjected to optimization. Preliminary
optimization of stirring time, RPM and temperature were done by conducting the
experiments at three levels of each process variables involved during stirring of the hot
aqueous surfactant solution while addition of the drug incorporated lipidic phase for the
formation of coarse emulsion. Critical process variables involved during the high pressure
homogenization was optimized using 32 factorial design with Design Expert 9.0.3.1 software
(Stat-Ease, Inc., USA). The pressure and number of cycles were selected as independent
variables and the response on particle size and PDI were investigated. Sonication time and
amplitude were optimized for the sonication of the nanoparticulate dispersion after
homogenization [7, 20].
Chapter 3 Materials & Methods
119997290052 / Gujarat Technological University Page 69
3.8 Optimization of Formulation Variables
32 factorial design was employed for optimization of formulation variables and Design
Expert 9.0.3.1 software was used for statistical analysis by ANOVA, generating model
equations and constructing contour plots and 3D surface plots for each response. Amount of
drug with respect to lipid and concentration of surfactant were investigated as independent
variables at three levels and the critical quality attributes selected were particle size, PDI and
entrapment efficiency as responses [18, 35].
3.9 Formulation and Optimization of In-situ Gel
Chitosan and carbopol 934 P were screened as gelling and/or mucoadhesive agents based on
literature review. Out of these two, one was selected based on their gelling properties with
SLN dispersion [36]. Poloxamer 188 and poloxamer 407 were selected as thermosensitive
polymers based on literature [37, 38]. The compatibility of the drug and all the excipients in
the final formulation including the gelling, mucoadhesive and thermosensitive polymers
were again evaluated using FTIR-spectroscopy. Ratio of poloxamer 188 and poloxamer 407
were optimized based on their gelling behaviour at different temperatures. The concentration
of carbopol 934P was optimized based on gelling behaviour observed visually in the
presence of selected thermo-sensitive polymers particularly at the nasal temperature (340C)
[39, 40].
3.10 Evaluation of optimized formulation
3.10.1 Particle size, Polydispersity index (PDI) and Zeta potential
The average particle size, PDI and zeta potential of the solid lipid nanoparticles were
determined using Zetasizer Nanoseries Nano-ZS, Malvern Instruments, Malvern, UK.
In-built dynamic light scattering, DLS, and Laser Doppler Electrophoresis were used for the
determinations of particle size and for zeta potential. The samples were put in ‘folded
capillary cells’ and results obtained for size, PDI and zeta-potential were recorded.

Chapter 3 Materials & Methods
119997290052 / Gujarat Technological University Page 70
3.10.2 Entrapment efficiency
Entrapment efficiency was determined by determining the amount of free drug
spectrophotometrically at 247 nm in the supernatant after centrifugation of the known
amount of nanoparticulate dispersion at 10000 RPM using freeze centrifuge (BL – 135 R)
for 15 minutes. The entrapment efficiency was calculated using (4.1) [41, 42]
Entrapment efficiency
Amount of entrapped drug
= --------------------------------- X 100
Amount of total drug
Weight of drug added in the formulation – Weight of free drug
= --------------------------------------------------------------------------- X 100
Weight of drug added in the formulation
= [(WT – WF)/WT] X 100………………………………….Equation 3.1
3.10.3 Evaluation of SLN based in-situ gel
The formulated SLN based gel was evaluated for gelation temperature, gelation time, pH,
viscosity, transmittance, mucoadhesive strength and spreadability.
3.10.3.1 Gelation temperature / Sol–gel transition temperature (Tsol-gel): Sol-gel
transitions play a critical role in establishing effectiveness of the formulations. 2 ml sample
was taken in a glass vial and was placed on a magnetic stirrer (15 rpm) with heating
arrangement. The temperature was gradually increased at the rate of 10C/min. The
temperature at which the rotation of the magnetic bead was stopped was recorded as the
gelation temperature [39].
3.10.3.2 Gelation time: The time required for gelation was also investigated for
determining the lag time. 2 ml sample was taken in a glass vial and was placed on a
magnetic stirrer (15 rpm) at the temperature of gelation and the time required for gelation
was recorded [38, 43].

Chapter 3 Materials & Methods
119997290052 / Gujarat Technological University Page 71
3.10.3.3 pH: pH of the nasal formulations are also important for avoiding the irritation to
the nasal mucosa. Hence, the pH of the formulation was determined using pH meter (Li 615,
Elico India, Hyderabad) and was compared with the reported pH in nasal cavity.
3.10.3.4 Viscosity: Viscosity is also one of the parameter to be evaluated for the in-situ
gels. The viscosity of the formulations should be such that it remains convenient during their
administration by the patient. Viscosity of the formulation was determined at 250C (ambient
temperature) and 340C (nasal temperature) using brookfield viscometer (DV-I Prime).
3.10.3.5 Transmittance: The EFV nanoparticles loaded in-situ gel was diluted with
distilled water (10 times dilution) and the resulting dispersion was observed visually for any
turbidity. Thereafter, its % transmittance was measured at 650 nm using UV
spectrophotometer (UV-1800, Shimadzu) against distilled water as the blank.
3.10.3.6 Mucoadhesive strength:
The mucoadhesive force was determined using modified two-pan balance method [37]. As
per the literature review, in spite of numerous studies concerning the in-vitro and in-vivo
performance of mucoadhesive drug delivery systems, surprisingly, there has not been any
standard technique designed for mucoadhesive measurement or any analytical method that
can be employed to qualify mucoadhesive strength. In-vitro tests including two-pan balance
method are the most common and convenient methods to assess the mucoadhesive
properties of formulations [43, 44]. In this method, one side of the balance was provided
with blocks at the top for balancing and the other side had a receptacle for water as shown in
Figure 3.3. 20 µl gel test sample was applied on the perfectly horizontal surface and was just
touched with the cellophane membrane (1 cm2) sticked at the horizontal end opposite to that
of water receptacle. Gradually water was added drop by drop till the cellophane membrane
got detatched from the gel. Weight in grams of water required to separate the two surfaces
was measured and mucoadhesive force was calculated using (3.2)
F = w x g …………………..……..Equation 3.2
Where F is the mucoadhesion force (dynes / cm2),
w is the minimum weight required to break the bond (grams),
g is the acceleration due to gravity (cm/s2).

Chapter 3 Materials & Methods
119997290052 / Gujarat Technological University Page 72
FIGURE 3.3: Apparatus used for determining the mucoadhesive strength of gel
3.10.3.7 Spreadability: Spreadability of the gel was determined by taking 0.5 g gel
between two cellophane membranes and placing 100 g weight on it for 1 minute. The
diameter of the area in which the gel got spread was measured.
3.10.4 Transmission Electron Microscopic Evaluation
The surface morphology of the optimized SLN was investigated using transmission electron
microscope [7, 46]. Briefly, it was carried out by operating at an acceleration voltage of 200
kV. A drop of SLN dispersion was placed on grid. Approximately 2 min after sample
deposition (1-2 µl), the grid was tapped with filter paper to remove surface water and air
dried. The image was taken using transmission electron microscope with CCD camera
(TEM Philips Tecnai 20, Holland).
3.10.5 Histopathological studies
Histological studies were carried out using isolated goat nasal mucosa. Freshly isolated goat
nasal mucosa was sectioned in four pieces. One piece was treated with PBS pH 6.4 (as
negative control), the other with a mucociliary toxicity agent - isopropyl alcohol (as positive
control) and the other two with the SLN formulations (SLN dispersion and SLN gel) [6].
After 24 hours, all the samples were washed properly with distilled water, fixed, processed

Chapter 3 Materials & Methods
119997290052 / Gujarat Technological University Page 73
for dehydration, embedded into paraffin wax and stained with hematoxylin and eosin. DPX
was used as mounting medium and microtoming was performed using microtome (model
0126, yorco, India). The histopathological examinations for determination of
damage/irritation due to the formulation were performed using inverted microscope
(NIKION TS -100) [37, 47].
3.11 Drug Release Profile
3.11.1 In-vitro drug diffusion profile
In-vitro drug diffusion profile of the SLN dispersion and EFV loaded SLN gel were obtained
by dialysis-bag/dialysis-sac method [7, 24, 48] as well as by using Franz-diffusion cell [18,
36, 48].
For dialysis bag method, SLN dispersion and plain drug suspension were filled in activated
dialysis membrane bags (Dialysis membrane 110 (LA 395), Himedia, cut off 12000 Da) and
suspended in glass beakers containing 50 ml methanolic phosphate buffer saline (pH 6.4,
40%v/v) [6, 7]. The beakers were placed on magnetic stirrers and stirred with magnetic
beads and were covered with paraffin film to prevent any evaporative loss during the
experimental run [46]. Aliquots were withdrawn from the receptor compartments at periodic
time intervals for 24 hours, replaced with equivalent amounts of fresh diffusion medium.
The aliquots were analyzed spectrophotometrically at 247 nm. All the experiments were
performed in triplicate.
For in-vitro release studies using Franz diffusion cell, the activated dialysis membrane
(Dialysis membrane 110 (LA 395), Himedia, cut off 12000 Da) were mounted on a Franz
diffusion cells with methanolic phosphate buffer saline (pH 6.4, 40%v/v) filled in receptor
compartments. The cells were placed on magnetic stirrers and EFV formulations (0.5 ml)
were placed in the donor compartments. Aliquots were withdrawn from the receptor
compartments at periodic time intervals for 24 hours, replaced with equivalent amounts of
Chapter 3 Materials & Methods
119997290052 / Gujarat Technological University Page 74
fresh diffusion medium. The aliquots were analyzed spectrophotometrically at 247 nm. All
the experiments were performed in triplicate.
3.11.2 Ex-vivo drug release profile
The ex-vivo release studies were performed with freshly isolated goat nasal mucosa procured
from slaughter house using Franz diffusion cells [18, 39]. The nasal membrane was removed
carefully and made free from adhered tissues. The excised nasal membrane was mounted on
Franz diffusion cells with methanolic phosphate buffer saline (pH 6.4, 40%v/v) filled in
receptor compartments. The cells were placed under mild agitation on magnetic stirrers and
temperature was maintained at 34 ± 0.5 0C.EFV formulations (0.5 ml) were placed in the
donor compartments. Aliquots were withdrawn from the receptor compartments at periodic
time intervals for 24 hours, replaced with equivalent amounts of fresh diffusion medium.
The aliquots were analyzed spectrophotometrically at 247 nm. All the experiments were
performed in triplicate.
3.11.3 Kinetics of drug release
In order to examine the release mechanism of EFV from the prepared SLN dispersion and the
EFV loaded SLN gel, the results of the ex-vivo release study were examined according to
following equations [49-53].
3.11.3.1 Zero Order Release
Q = K0t
Where, Q = Amount of drug release at time t,
K0 =Zero order release constant,
t = Time.
Regression coefficient (R2) value obtained from the plot of amount of drug released
(Q) versus time (t), nearer to 1 indicates zero order release signifying the release to be
concentration-independent.
Chapter 3 Materials & Methods
119997290052 / Gujarat Technological University Page 75
3.11.3.2 First Order Release Equation
ln (100-Q) = lnQ0-K1t
Where, Q = Amount of drug release at time t,
K1= First order release constant
The regression coefficient (R2) value obtained from the log % ARR (Amount
Remaining to Release) versus time, nearer to 1 indicates first order release signifying
the release to be concentration-dependent.
3.11.3.3 Higuchi Square Root of Time Model
Q= Kht1/2
Where, Q= Amount of drug release at time t,
Kh= Higuchi square root of time release constant
The regression co-efficient of percentage drug release versus square root of time
nearer to 1 indicates Higuchi’s drug release model indicating Fickian diffusional
release.
3.11.3.4 Hixon-Crowell Cube Root Model
3√ Q0 - 3√ Qt = KHC.t
Where, Q0 = initial concentration of drug present
Qt = amount of drug release at time t
R2 values nearer to 1 for the plot of amount of drug released versus cube root time
indicate Hixon – Crowell model.
3.11.3.5 Korsmeyer And Peppas Model
Qt / Q∞ = K x t λ
Log (Qt/Q∞) = Log K + Λ Log t
Where,
Q∞ = Total drug released after infinite time.
Qt/Q ∞ = Fractional drug released at time t

Chapter 3 Materials & Methods
119997290052 / Gujarat Technological University Page 76
K = Kinetic constant incorporating structural and geometrical
characteristic of the drug/polymer system (devices).
Λ = Diffusion exponents that characterizes the mechanism of drug release
t = Time
A plot of log (Qt/ Q∞) versus log t gives straight line of gradient λ and an intercept of log K.
Values of exponent Λ and the corresponding release mechanism are given in Table 3.3.
TABLE 3.3 Values of exponent Λ and the corresponding release mechanism
Exponent λ Release
Mechanism Thin film Cylinder Sphere
0.5 0.45 0.43 Fickian diffusion
0.5 < Λ < 1.0 0.45 < Λ <0.89 0.43< Λ <0.85 Anamolous transport
1.0 0.89 0.85 Zero-order
3.12 In-vivo studies
In-vivo studies were performed on adult Wistar albino rats. A protocol for animal studies was
approved by Institutional Animal Ethics Committee (IAEC) and Committee for the Purpose
of Control and Supervision of Experiments on Animals (CPCSEA) [Protocol no. PIPH 04/15
CPCSEA921/PO/Ere/S/05/CPCSEA]. Animals were housed in polypropylene rat cages. Rice
husk was used as the bedding material. Laboratory rat pellet feed and pure drinking water was
supplied ad libitum. The rats were divided into two groups. Group I (test group) consisting of
6 animals were administered with the developed SLN formulation (equivalent to 0.06mg
efavirenz) intranasally. The second group (standard) consisting of 6 animals were given the
marketed formulation - EFAVIR - efavirenz capsules IP orally. (powder equivalent to 25 mg
Efavirenz from capsule dispersed in 1 ml water). The dose was calculated based on human
equivalent dose (HED) as per guideline by FDA [54].
The plasma samples from each animal were collected and the animals were sacrificed by an
overdose of pentobarbital sodium at 24 hour. The brains were isolated, weighed, homogenized
in PBS pH 6.4 at 5000 rpm using Silent crusher M homogenizer (Heidolph, Germany),

Chapter 3 Materials & Methods
119997290052 / Gujarat Technological University Page 77
centrifuged and the supernatant were collected for determination of drug concentration [55].
The amount of drug in plasma and the brain homogenate were determined by the method
developed and validated for estimation of efavirenz in plasma using HPLC. Tenofovir
disoprxil fumarate was used as internal standard. Brain:Plasma ratio, bioavailable fraction and
relative bioavailability were calculated using the formula
Brain: plasma = Conc. of drug in brain/Conc. of drug in plasma
Bioavailable fraction
= Bioavailable dose/ Administered dose
Relative bioavailability
=Systemic availability of drug/systemic availability of an oral standard of same drug
3.13 Stability Studies
The stability of the formulation were assessed under different storage conditions as per
ICH guidelines, namely, 5 + 3 and 25 ± 2 ◦C/60 ± 5% RH [41, 56, 57]. The samples were
evaluated at 0, 0.5, 1, 2, 3, 6 and 12 months for physical appearance, average particle size,
PDI and zeta potential and drug content. All the studies were conducted in triplicate.
3.14 Data analysis
The data obtained were analysed statistically using t-test and ANOVA. The data obtained for
the optimization of process and formulation variables were statistically analysed by analysis
of variance (ANOVA) with in-built software design of Design Expert 9.0.3.1 software
(Stat-Ease, Inc., USA). It was used to determine the significance and the magnitude of the
effects of different variables and their interactions. Probability values less than 0.0500
were considered as statistically significant.
3.15 References:
1. The United States Pharamcopoeial convention, (2011), Standards A. General Notices
and Requirements. USP 34; 6.
2. The National Toxicology Program (NTP) Interagency Center for the Evaluation of,
Chapter 3 Materials & Methods
119997290052 / Gujarat Technological University Page 78
Alternative Toxicological Methods (NICEATM). Test Method Protocol for Solubility
Determination Phase III. 2003:1-10.
3. Dole MN, Patel PA, Sawant SD, Shedpure PS., (2011) Advance applications of fourier
transform infrared spectroscopy. Int J Pharm Sci Rev Res.;7(2):159-166.
4. Kumar YA, Rao NR., (2010). Development of Rapid UV Spectrophotometric Method
for the Estimation of Efavirenz in Formulations. E-Journal Chem. ;7(3):856-860.
5. Kadam AA, Babu CJG, Permal RV, Channabasavaraj K, Mani TT., (2012) Development
and Validation of Method for the Quantitative Estimation of Efavirenz in Bulk and
Phrmaceutical Dosage Form. Am J PharmTech Res.;2(1):324-330.
6. Seju U, Kumar A, Sawant KK., (2011). Development and evaluation of
olanzapine-loaded PLGA nanoparticles for nose-to-brain delivery: In vitro and in vivo
studies. Acta Biomater.;7(12):4169-4176.
7. Sharma D, Maheshwari D, Philip G, et al., (2014) Formulation and optimization of
polymeric nanoparticles for intranasal delivery of Lorazepam using box-behnken design:
in vitro and in vivo evaluation. Biomed Res Int.;2014:156010.
8. Government of India, Ministry of Health and Family Welfare. Indian Pharmacopoeia.
The Indian Pharmacopoeia commission; 1996:A-147.
9. Ramachandran G, Kumar. KH, Swaminathan S, Venkatesan P, Kumaraswami V,
Greenblatt DJ., (2006). Simple and rapid liquid chromatography method for
determination of efavirenz in plasma. J Chromatogr B Anal Technol Biomed Life Sci.
2006;835(2):131-135.
10. Kamble RN, Mehta P., (2015). Development of simple HPLC method to estimate the
blood plasma concentration of Efavirenz in rat after oral administration, Innovare
Academic Sciences, Int. J Pharm & Pharm. Sci.;7(7):7-10.
11. Lakshmi Sailaja, Kishore Kumar K, Ravi Kumar DVR, Mohan Kumar C, Yugandhar
NM, Srinubabu G., (2007). Development and Validation of a Liquid Chromatographic
Method for Determination of Efavirenz in Human Plasma.
Chromatographia.;65(5-6):359-361.
12. Velpandian T, Mathur R, Agarwal NK, Arora B, Kumar L, Gupta SK., (2004).
Development and validation of a simple liquid chromatographic method with ultraviolet

Chapter 3 Materials & Methods
119997290052 / Gujarat Technological University Page 79
detection for the determination of imatinib in biological samples. J Chromatogr B Anal
Technol Biomed Life Sci.;804(2):431-434.
13. Vikram Singh A, Nath LK, Pani NR., (2011). Development and validation of analytical
method for the estimation of lamivudine in rabbit plasma. J Pharm Anal. ;1(4):251-257.
14. ICH. ICH Topic Q2 (R1) Validation of Analytical Procedures : Text and Methodology.
Int Conf Harmon. 2005;1994(November 1996):17.
15. Ramaswamy A, Arul Gnana Dhas AS., (2014). Development and validation of
analytical method for quantitation of Emtricitabine, Tenofovir, Efavirenz based on
HPLC. Arab J Chem., 1-7.
16. Nagar M, Panwar KS, Chopra VS, Bala I, Trivedi P., (2010). Quality by design: A
systematic approach to pharmaceutical development. Der Pharm Lett.;2(2):111-130.
17. Journals H, Article R, Parameters P, Kakodkar SSS, Gajare P., (2015). Pharmaceutical
Quality-by-Design ( QbD ): Basic Principles;(1):1-19.
18. Sood S, Jain K, Gowthamarajan K., (2014). Optimization of curcumin nanoemulsion for
intranasal delivery using design of experiment and its toxicity assessment. Colloids
Surfaces B Biointerfaces;113:330-337.
19. Curic A, Keller B-L, Reul R, Moschwitzer J, Fricker G., (2015). Development and
lyophilization of itraconazole loaded poly(butylcyanoacrylate) nanospheres as a drug
delivery system. Eur J Pharm Sci.;78:121-131.
20. Pawar YB, Purohit H, Valicherla GR, et al., (2012). Novel lipid based oral formulation
of curcumin: Development and optimization by design of experiments approach. Int J
Pharm.;436(1-2):617-623.
21. Severino P, Santana MH a, Souto EB., (2012). Optimizing SLN and NLC by 2 2 full
factorial design: Effect of homogenization technique. Mater Sci Eng
C. ;32(6):1375-1379.
22. Rohit B, Pal KI., (2013). A Method to Prepare Solid Lipid Nanoparticles with Improved
Entrapment Efficiency of Hydrophilic Drugs. Curr Nanosci. ;9(2):211-220.
23. Peter Christoper G V., Vijaya Raghavan C, Siddharth K, Siva Selva Kumar M, Hari
Prasad R., (2014). Formulation and optimization of coated PLGA - Zidovudine
nanoparticles using factorial design and in vitro in vivo evaluations to determine brain

Chapter 3 Materials & Methods
119997290052 / Gujarat Technological University Page 80
targeting efficiency. Saudi Pharm J.;22(2):133-140.
24. Gupta S, Chavhan S, Sawant KK., (2011). Self-nanoemulsifying drug delivery system
for adefovir dipivoxil: Design, characterization, in vitro and ex vivo evaluation.
Colloids Surfaces A Physicochem Eng Asp.;392(1):145-155.
25. Blasi P, Giovagnoli S, Schoubben A, Ricci M, Rossi C., (2007). Solid lipid
nanoparticles for targeted brain drug delivery. Adv Drug Deliv Rev.;59(6):454-477.
26. Silva C, Gonzalez-Mira E, Garcia ML, et al., (2011). Preparation, characterization and
biocompatibility studies on risperidone-loaded solid lipid nanoparticles (SLN): High
pressure homogenization versus ultrasound. Colloids Surfaces B
Biointerfaces.;86(1):158-165.
27. Shegokar R, Singh KK, Müller RH., (2011). Production & stability of stavudine solid
lipid nanoparticles - From lab to industrial scale. Int J Pharm. ;416(2):461-470.
28. Pani NR, Nath LK, Acharya S, Bhuniya B., (2011). Application of DSC, IST, and FTIR
study in the compatibility testing of nateglinide with different pharmaceutical excipients.
J Therm Anal Calorim.;108(1):219-226.
29. Bozdaǧ-Pehlivan S, Subaşi B, Vural I, Ünlü N, Çapan Y., (2011). Evaluation of
drug-excipient interaction in the formulation of celecoxib tablets. Acta Pol Pharm -
Drug Res. ;68(3):423-433.
30. Mehnert W, Mäder K., (2012). Solid lipid nanoparticles. Adv Drug Deliv
Rev. ;64:83-101.
31. Park JH, Ban SJ, Ahmed T, et al., (2015). Development of DH-I-180-3 loaded lipid
nanoparticle for photodynamic therapy. Int J Pharm. 2015;491(1-2):393-401.
32. Omwoyo WN, Melariri P, Gathirwa JW, et al., (2016). Development, characterization
and antimalarial efficacy of dihydroartemisinin loaded solid lipid nanoparticles.
Nanomedicine Nanotechnology, Biol Med.;12(3):801-809.
33. Jeannot V, Mazzaferro S, Lavaud J, et al., (2016). Targeting CD44 receptor-positive
lung tumors using polysaccharide-based nanocarriers: Influence of nanoparticle size and
administration route. Nanomedicine Nanotechnology, Biol Med. ;12(4):921-932.
34. Blasi P, Schoubben A, Traina G, et al., (2013). Lipid nanoparticles for brain targeting III.
Long-term stability and in vivo toxicity. Int J Pharm.;454(1):316-323.

Chapter 3 Materials & Methods
119997290052 / Gujarat Technological University Page 81
35. Blasi P, Giovagnoli S, Schoubben A, et al., (2011). Lipid nanoparticles for brain
targeting I. Formulation optimization. Int J Pharm. ;419(1-2):287-295.
36. Das Neves J, Sarmento B., (2014). Mucosal delivery of biopharmaceuticals: Biology,
challenges and strategies. Mucosal Deliv Biopharm Biol Challenges Strateg.
9781461495:1-601.
37. Naik A, Nair H., (2014). Formulation and Evaluation of Thermosensitive Biogels for
Nose to Brain Delivery of Doxepin. Biomed Res. Int.;2014.1-10.
38. Lun H, Chattopadhyay N, Yu X, Bendayan R., (2010). Nanotechnology applications for
improved delivery of antiretroviral drugs to the brain. Adv Drug Deliv
Rev. ;62(4-5):503-517.
39. Ravi PR, Aditya N, Patil S, Cherian L., (2013). Nasal in-situ gels for delivery of
rasagiline mesylate: improvement in bioavailability and brain localization. Drug Deliv.
2013;7544:1-8.
40. Kumar A, Garg T, Sarma GS, Rath G, Goyal AK., (2015). Optimization of
combinational intranasal drug delivery system for the management of migraine by using
statistical design. Eur J Pharm Sci.;70:140-151.
41. Yasir M, Sara UVS., (2014). Solid lipid nanoparticles for nose to brain delivery of
haloperidol: in vitro drug release and pharmacokinetics evaluation. Acta Pharmaceutica
Sinica B;4(6):454-463.
42. Morsi NM, Ghorab DM, Badie HA., (2012). Bioadhesive Brain Targeted Nasal
Delivery of an Ant ischemic Drug.;3(5):1067-1076.
43. Das Neves J, Amiji MM, Bahia MF, Sarmento B.,(2010). Nanotechnology-based
systems for the treatment and prevention of HIV/AIDS. Adv Drug Deliv
Rev.;62(4-5):458-477.
44. Morsi N, Ghorab D, Refai H, Teba H., (2016). Ketoroloac tromethamine loaded
nanodispersion incorporated into thermosensitive in situ gel for prolonged ocular
delivery. Int J Pharm.;506(1-2):57-67.
45. Arbelaez-Camargo D, Suñé-Negre JM, Roig-Carreras M, et al., (2016). Preformulation
and characterization of a lidocaine hydrochloride and dexamethasone sodium phosphate
thermo-reversible and bioadhesive long-acting gel for intraperitoneal administration. Int

Chapter 3 Materials & Methods
119997290052 / Gujarat Technological University Page 82
J Pharm.;498(1-2):142-152.
46. Avachat AM, Parpani SS., (2015). Formulation and development of bicontinuous
nanostructured liquid crystalline particles of efavirenz. Colloids Surfaces B
Biointerfaces.;126:87-97.
47. Pathak R, Prasad R, Misra M., (2014). Role of mucoadhesive polymers in enhancing
delivery of nimodipine microemulsion to brain via intranasal route. Acta Pharm Sin
B.;4(2):151-160.
48. Gupta S, Chavhan S, Sawant KK., (2011). Self-nanoemulsifying drug delivery system
for adefovir dipivoxil: Design, characterization, in vitro and ex vivo evaluation.
Colloids Surfaces A Physicochem Eng Asp.;392(1):145-155.
49. Venkateswarlu V, Manjunath K., (2004). Preparation, characterization and in vitro
release kinetics of clozapine solid lipid nanoparticles. J Control Release.;95(3):627-638.
50. Singhvi G, Singh M., (2011). In-vitro drug release characterization models. Int. J Pharm.
Studies and Res.;2 (1):77-84.
51. Hilip, LR, Peppas A., (1987). Fickian and anomalous release from swellable devices. J
Control Release.;5:37-42.
52. Macheras, P., Liadis A., (2006). Modelling in Biopharmaceutics, Pharmacokinetics and
Pharmacodynamics: Homogeneous and Heterogeneous Approaches. Series:
Interdisciplinary Applied Mathematics. Springer, New York.
53. Ren S, Park MJ, Sah H, Lee BJ., (2008). Effect of pharmaceutical excipients on aqueous
stability of rabeprazole sodium. Int J Pharm.;350(1-2):197-204.
54. FDA. Guidance for Industry Starting Dose in Initial Clinical Trials Guidance for
Industry Estimating the Maximum Safe. FDA. 2005;(July):27.
55. Kumar S, Randhawa JK., (2013). High melting lipid based approach for drug delivery:
Solid lipid nanoparticles. Mater Sci Eng C. ;33(4):1842-1852.
56. Guidance for Industry Q1A(R2) Stability Testing of New Drug Substances and
Products. U.S. Department of Health and Human Services, Food and Drug
Administration, Center for Drug Evaluation and Research (CDER) Center for Biologics
Evaluation and Research (CBER); (2003); (November):1–22.
57. SADC. Registration of Medicines Stability. SADC Guidel Stab Test. 2004;(March):1-44.

Chapter 4 Results & Discussions
119997290052 / Gujarat Technological University Page 83
CHAPTER 4
Results & Discussions 4.1 Identification of Drug
Identification of the procured drug sample and ensuring its purity is a prerequisite before
proceeding with the formulation development. The identification tests and the inferences for
the drug sample based on its appearance, solubility and melting point determination are
summarized in Table 4.1.
TABLE 4.1: Identification tests for EFV with the inferences
Parameters Observations Reported [1] Inferences
Appearance White powder White to almost white
powder
Complies
Solubility Practically insoluble in water
(10 mg insoluble in >100 ml)
Freely soluble in methanol
(10 mg in < 1 ml)
Practically insoluble in
water
Freely soluble in methanol
Complies
Complies
Melting
point
139-1420C 138 – 142 0C Complies
Compliance of the observations with respect to the reported specifications verifies the
sample to be of the drug efavirenz. Various functional groups present in the powder drug
sample was determined by fourier-transform infrared (FT-IR) spectroscopic and compared
with the standard spectra of EFV for confirmation [2]. The observed and reported IR spectra
of EFV are shown in Figure 4.1.

Chapter 4 Results & Discussions
119997290052 / Gujarat Technological University Page 84
(a)
(b)
FIGURE 4.1: IR spectra (a) Observed spectra of EFV (b) Reported spectra of EFV
The major IR peaks observed and reported for EFV molecule (shown in Figure 4.2) is
summarized in Table 4.2 [3].
FIGURE 4.2: Structure of efavirenz (EFV)

Chapter 4 Results & Discussions
119997290052 / Gujarat Technological University Page 85
TABLE 4.2: Major peaks observed and reported for EFV in IR spectra:
Observed (cm-1) Reported (cm-1) Inferences [3]
3319.64 3500-3100 N-H stretching
2249.39 2250-2100 C= C (Alkyne)
1750.06 1750-1730 C=O of ester
1602.59 1680-1630 C=O of amide
1498.33 1350-1000 C-N
1036.16 1300-1000 C-O
From the observations of Table 4.1, Table 4.2 and Figure 4.1, it was verified and concluded
that the procured sample was of efavirenz and the sample was used for all further
investigations.
4.2 Analytical Methods
Simple, rapid and reliable analytical methods for the estimation of drug content were
required to determine the entrapment efficiency of the formulation, which in turn was
needed for selection of right material, optimization of their concentrations, characterization
of the optimized formulation and for stability testing. The analytical methods were also
needed for the in-vitro and ex-vivo drug release studies and for estimation of drug in plasma
and brain post-administration of the formulations.
4.2.1 UV- Spectrophotometric estimation of efavirenz
Simple, sensitive, accurate, precise and rapid ultraviolet (UV) spectrophotometric methods
have been reported to be developed and validated for the estimation of efavirenz in pure
form, its formulations and stability samples [4, 5]. Hence, calibration curves were obtained
using methanol:water (50% v/v) and methanolic phosphate buffer saline (PBS) (pH 6.4,
40%v/v) as solvents respectively for determining the entrapment efficiency and in-vitro drug
release studies.

Chapter 4 Results & Discussions
119997290052 / Gujarat Technological University Page 86
4.2.1.1 Calibration curve in methanol:water:: 50:50 %v/v as solvent :
Calibration curves were plotted in methanol:water (50% v/v) at 247 nm in the concentration
range of 3-18 µg/ml of efavirenz using UV- spectrophotometer (UV-1800, Shimadzu) for
determining the entrapment efficiency and for analysing the stability samples. The data
obtained for calibration curve is shown in Table 4.3 and the overlay spectra of EFV at
different concentrations and the calibration curve is shown in Figure 4.3 respectively.
TABLE 4.3: Calibration data for EFV in methanol:water (50% v/v)
S.No. Concentration (µg/ml) Mean Absorbance* + S.D.
1 3 0.152 + 0.009
2 6 0.309 + 0.008
3 9 0.461 + 0.009
4 12 0.634 + 0.007
5 15 0.785 + 0.005
6 18 0.951 + 0.013
(*Mean of n=3 determinations)
FIGURE 4.3(a): Overlay spectra of EFV at different concentrations

Chapter 4 Results & Discussions
119997290052 / Gujarat Technological University Page 87
FIGURE 4.3 (b): Calibration curve for efavirenz in methanol and water (1:1)
The calibration curve was found to be linear in the concentration range of 3 – 18 µg/ml with
correlation coefficient (R2) value of 0.999.
4.2.1.2 Calibration curve in methanolic phosphate buffer saline (pH 6.4, 40%v/v):
The calibration curve for efavirenz in methanolic phosphate buffer saline (pH 6.4, 40% v/v)
is shown in Figure 4.4 and the data is given in Table 4.4. The pH was selected based on the
nasal mucosal pH (5.5-6.5) and methanol being added to maintain the sink condition.
Efavirenz has limited solubility in buffer but is soluble in methanol, hence methanol was
added in PBS pH 6.4 to maintain the perfect sink conditions [6, 7].
TABLE 4.4 Calibration data for EFV in methanolic PBS (pH 6.4, 40% v/v).
S.No. Concentration (µg/ml) Mean Absorbance* + S.D.
1 3 0.179 + 0.002
2 6 0.382 + 0.004
3 9 0.576 + 0.003
4 12 0.758 + 0.006
5 15 0.967 + 0.005
6 18 1.136 + 0.008
(*=Mean of 3 determinations)
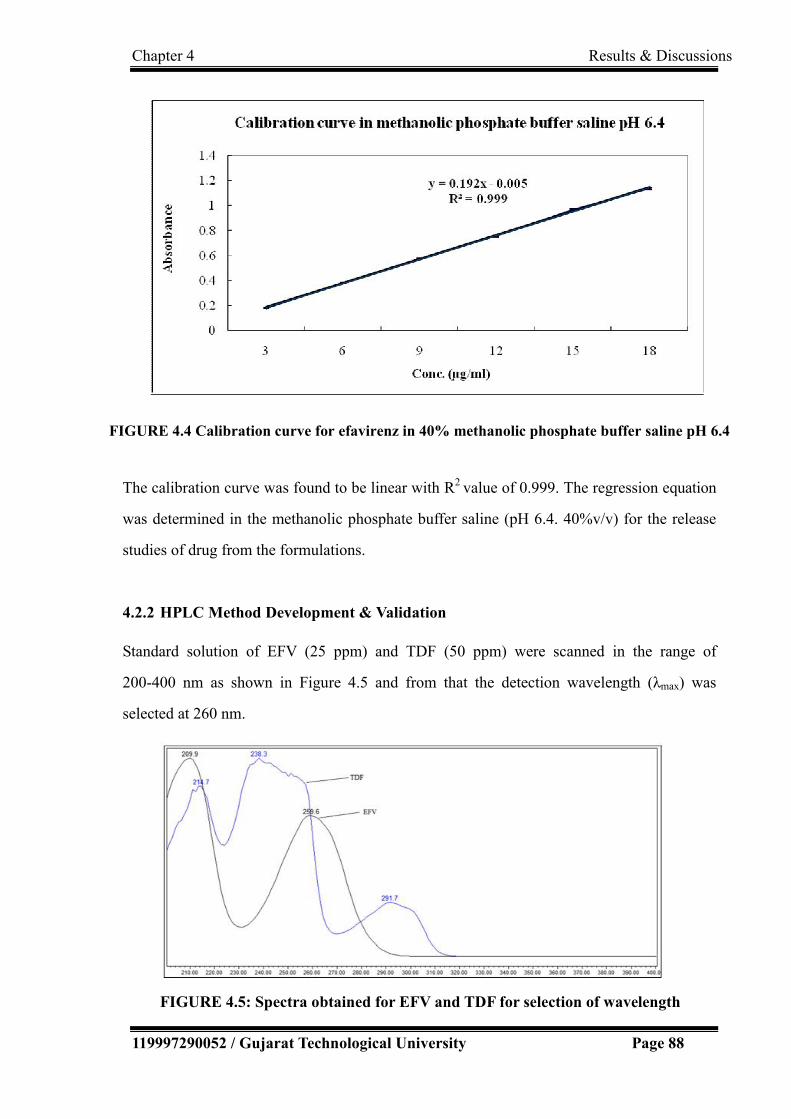
Chapter 4 Results & Discussions
119997290052 / Gujarat Technological University Page 88
FIGURE 4.4 Calibration curve for efavirenz in 40% methanolic phosphate buffer saline pH 6.4
The calibration curve was found to be linear with R2 value of 0.999. The regression equation
was determined in the methanolic phosphate buffer saline (pH 6.4. 40%v/v) for the release
studies of drug from the formulations.
4.2.2 HPLC Method Development & Validation
Standard solution of EFV (25 ppm) and TDF (50 ppm) were scanned in the range of
200-400 nm as shown in Figure 4.5 and from that the detection wavelength (λmax) was
selected at 260 nm.
FIGURE 4.5: Spectra obtained for EFV and TDF for selection of wavelength

Chapter 4 Results & Discussions
119997290052 / Gujarat Technological University Page 89
Several trials were taken with various columns, mobile phase, pH of the mobile phase to
select the chromatographic conditions giving good peak characteristics. The initial
chromatographic conditions were as given in Table 4.5.
TABLE 4.5 Initial chromatographic conditions for trial batches
Column Inertsil ODS, 150X4.6mm, 5.0µm
Mobile Phase Mobile phase-A : 0.1% Orthophosphoric acid
in water, Mobile phase B : Acetonitrile (30:70)
Flow rate 1.0 ml/min
Detection wavelength 260 nm
Column Temperature 300C
Sample cooler temperature 5 0C
Injection volume 5µl
Run Time 9 minutes
4.2.2.1 Selection and optimization of chromatographic conditions
Several trials were taken for EFV sample first, followed by addition of TDF sample as
internal standard and plasma.
Trial 1: Starting with the chromatographic conditions mentioned in Table 4.5, the
chromatogram obtained with 25 ppm EFV sample is as shown in Figure 4.6.
FIGURE 4.6: Trial 1 for HPLC method development

Chapter 4 Results & Discussions
119997290052 / Gujarat Technological University Page 90
It can be observed from Figure 4.6 that the peak characteristics of EFV were not acceptable
showing tailing in the peak.
Trial 2: With same sample of 25 ppm solution of EFV, trials were taken with change of
column. Waters symmetry shield C18, 150 x 4.6mm, 5.0µm column was used with other
other chromatographic conditions as mentioned in Table 4.5. The chromatogram obtained is
shown in Figure 4.7.
FIGURE 4.7: Trial 2 for HPLC method development
It was observed that the base of the peak was not found good, hence there was need to take
more trials to improve peak shape.
Trial 3: To improve the peak shape, mobile phase was changed from acidic to little basic to
check improvement in peak shape. Hence, 10 mM ammonium acetate was used instead of
0.1% orthophosphoric acid as mobile phase. The chromatogram obtained with 10mM
ammonium acetate buffer and acetonitrile (30:70) as mobile phase and Waters symmetry
shield C18, 150 x 4.6mm, 5.0µm column is shown in Figure 4.8.
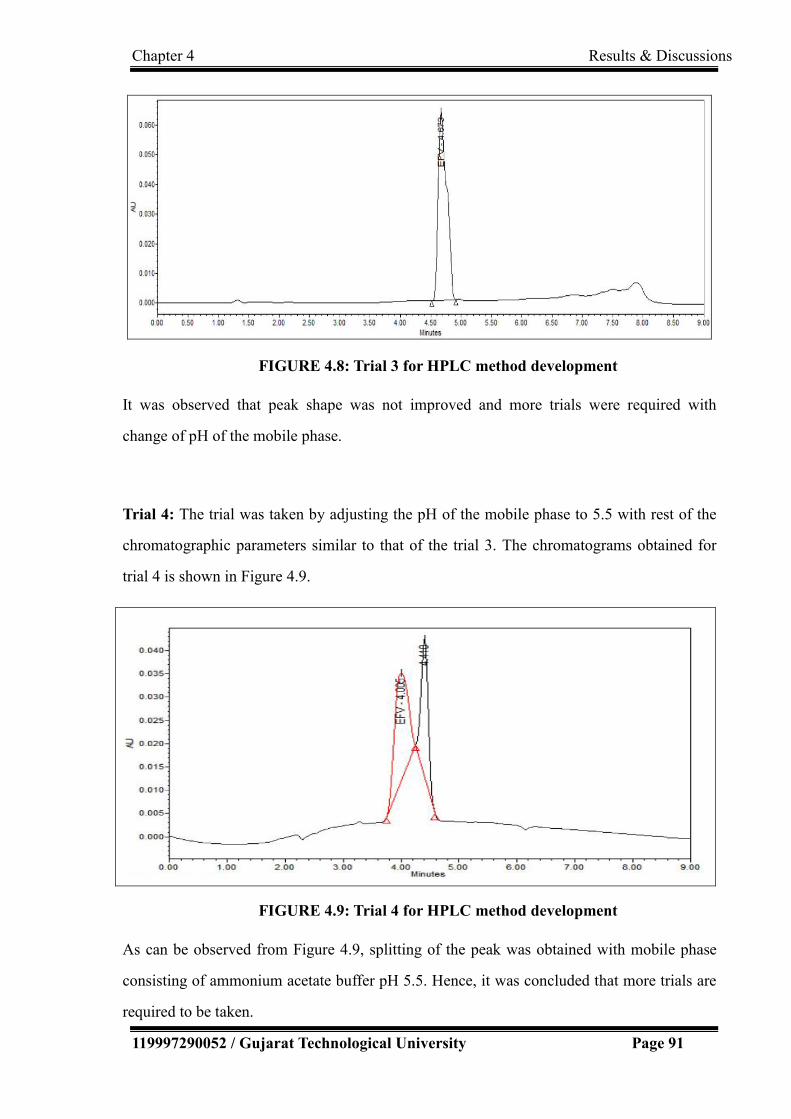
Chapter 4 Results & Discussions
119997290052 / Gujarat Technological University Page 91
FIGURE 4.8: Trial 3 for HPLC method development
It was observed that peak shape was not improved and more trials were required with
change of pH of the mobile phase.
Trial 4: The trial was taken by adjusting the pH of the mobile phase to 5.5 with rest of the
chromatographic parameters similar to that of the trial 3. The chromatograms obtained for
trial 4 is shown in Figure 4.9.
FIGURE 4.9: Trial 4 for HPLC method development
As can be observed from Figure 4.9, splitting of the peak was obtained with mobile phase
consisting of ammonium acetate buffer pH 5.5. Hence, it was concluded that more trials are
required to be taken.

Chapter 4 Results & Discussions
119997290052 / Gujarat Technological University Page 92
Trial 5: In this trial, the effect was checked by changing the buffer in mobile phase from
acetate to phosphate buffer with acidic pH. Thus, the chromatogram obtained with 10 mM
phosphate buffer pH 2.5 and Acetonitrile (30:70) is as shown in Figure 4.10.
FIGURE 4.10: Trial 5 for HPLC method development
It was observed from Figure 4.10 that the shape of efavirenz peak was good and
symmetrical, but it eluted near void volume, next trial to be taken with mobile phase pH
changed from highly acidic to less acidic.
Trial 6: In order to increase the retention time, this trial was taken with increased pH of the
mobile phase. Thus, mobile phase for this trial was phosphate buffer pH 3.5 and acetonitrile
and remaining all parameter were same as that for trial 5. The chromatogram obtained was
as shown in Figure 4.11.
FIGURE 4.11: Trial 6 for HPLC method development

Chapter 4 Results & Discussions
119997290052 / Gujarat Technological University Page 93
The shape and symmetry of the chromatographic peak for EFV obtained in this trial was
observed to be good, hence the similar chromatographic conditions were used for further
analytical method developmental investigations.
Trial 7: To check peak shape of internal standard in above chromatographic condition, 50
ppm of TDF was prepared and injected. The chromatogram obtained with the sample
consisting of 25 ppm EFV and 50 ppm TDF prepared using methanol:water (50%v/v) as
diluents is shown in Figure 4.12.
FIGURE 4.12: Trial 7 for HPLC method development
In the chromatogram obtained with trial 7, it can be observed that the peak shape for both
the drug (EFV) and internal standard (TDF) were found good, but resolution between
both the peaks was not appropriate, hence more trials for good separation between both
the peaks were needed.
Trial 8: In order to improve resolution between the peaks of EFV and TDF, HPLC column
was changed with smaller sorbent particle size (3.5 µm). The chromatogram obtained with
the mixed sample of EFV and TDF using Waters X-Terra Shield, RP18 50 x 4.6 mm, 3.5 µm
column is shown in Figure 4.13.

Chapter 4 Results & Discussions
119997290052 / Gujarat Technological University Page 94
FIGURE 4.13: Trial 8 for HPLC method development
The peak shapes were found to be good, but peak of TDF eluted near to void volume, hence
next trials were taken with gradient chromatographic program.
Trial 9:
In this trial, the gradient chromatographic program was used as shown in Table 4.6. Flow
rate was also changed from 1.0 to 1.5 ml/min and mixture of the standard EFV and TDF was
injected. The chromatogram obtained is shown if Figure 4.14.
TABLE 4.6: Gradient Program used for HPLC method development
Time
(Minutes)
Mobile phase-A (%v/v)
(Phosphate buffer pH 3.5)
Mobile phase-B (%v/v)
(Acetonitrile)
0 95 5
1 95 5
5 20 80
6 20 80
6.1 95 5
8 95 5

Chapter 4 Results & Discussions
119997290052 / Gujarat Technological University Page 95
FIGURE 4.14: Trial 9 for HPLC method development
It can be observed from Figure 4.14 that peak characteristics including its shape, symmetry,
resolution, etc. were found to be good. An extra peak eluted at about 1.5 minutes was also
observed. It was assumed to be the peak of fumarate. In order to confirm this, 20 ppm
fumaric acid was injected with the same chromatographic conditions. The peak observed
with fumaric acid is shown in Figure 4.15.
FIGURE 4.15: Chromatogram of 20 ppm fumaric acid
The peak observed at about 1.5 minutes in Figure 4.15, confirms that the extra peak
observed in trial 9 was due to fumarate. Hence, the chromatographic conditions were
further tested for plasma samples. The chromatogram obtained with the sample in plasma
is shown in Figure 4.16.

Chapter 4 Results & Discussions
119997290052 / Gujarat Technological University Page 96
FIGURE 4.16: Chromatogram of EFV and TDF in plasma samples
From the Figure 4.16, it was concluded that no significant interference was observed with
the presence of plasma. Thus, the chromatographic conditions summarized in Table 4.7 can
be used for estimation of EFV from plasma after the validation of the developed method.
TABLE 4.7: Optimized Chromatographic conditions for HPLC method
Equipment HPLC with UV Detector - Waters (Alliance)
Mobile phase Mobile phase-A : Phosphate buffer pH 3.5 ,
Mobile phase B : Acetonitrile
Column Waters X-Terra Shield, RP18 50 x 4.6 mm, 3.5 µm
Column temperature Ambient
Sample cooler 5°C
Injection volume 5 µL
Flow rate 1.5 mL/min
Wavelength 260 nm
Diluent Water:Methanol (50 %v/v)
It was observed that with the optimized chromatographic parameters shown in Table 4.7, the
retention time was significantly reduced to 5.949 min in comparison to reported retention
times in literature [8-10]. This can reduce the run time and the cost of analysis of samples. All
the reagents used are also commonly available. While the composition of mobile phase was
similar consisting of phosphate buffer and acetonitrile as in various other reported methods [8,

Chapter 4 Results & Discussions
119997290052 / Gujarat Technological University Page 97
11], the retention time of EFV was observed to be drastically reduced in comparison to the
reported values (from 13.2 min to 5.951 min) [8]. This may be due to the use of column of
different dimension 50 x 4.6 mm, 3.5 μm instead of 250 × 4.6 mm, 5 μm. With the use of the
analytical column 150 x 4.6 mm, 3 μm, the retention time of 6.9 min [11] and with 75 x 4.6
mm, 3.5 μm, retention time of 6.45 min have been reported [10]. While the pH of the mobile
phase reported are higher than 3.5 [8, 11], peak was observed to be split at higher pH in the
present investigation. Better results were obtained at a pH of 3.5. Most of the investigations
reported in literature have used flow rate of 1 ml/min [8, 11] or less [10, 12], in the present
investigation TDF peak was observed to be very close to the void volume at flow rate of 1
ml/min. Proper retention time for EFV and TDF were observed with flow rate of 1.5 ml/min.
Higher flow rate would have also contributed for lowering the retention time of EFV. The
lower retention time can help to reduce the time required for analysis. With the use of the
gradient elution method, improved resolution, increased detection, shorter analysis time and
increased efficiency was observed.
4.2.2.2 Analytical Method Validation
Various parameters such as linearity and range, precision, accuracy, sensitivity (limit of
detection, limit of quantification), specificity, robustness/ruggedness, stability, were evaluated
for validating the developed analytical method as per ICH guidelines [13].
A. Linearity and Range
The linearity of an analytical procedure is its ability (within a given range) to obtain test
results which are directly proportional to the concentration (amount) of analyte in the sample.
Calibration curve was constructed by plotting the peak area ratios (analyte/internal standard)
v/s concentration. The overlay chromatogram obtained for linearity study is shown in Figure
4.17(a) and the calibration plot with regression equation and correlation coefficient was
determined as shown in Figure 4.17(b). The calibration plot revealed linearity in the
concentration range of 1-300 µg/ml with the correlation coefficient of 0.999. Tables 4.8(a) and
4.8(b) indicate the sample preparation and area ratios obtained for linearity study respectively.

Chapter 4 Results & Discussions
119997290052 / Gujarat Technological University Page 98
TABLE 4.8(a): Sample Preparation for linearity studies:
Sample Stock solution Dilution Conc.
(µg/ml) Wt taken
(mg)
Total
Volume
(ml)
Volume of
stock
solution
taken (ml)
Final
Volume
(ml)
TDF 100.51 100 5.0 100 50.255
EFV 50.17 100 0.2 100 1.003
EFV 50.17 100 1.0 100 5.017
EFV 50.17 100 2.0 100 10.034
EFV 50.17 100 4.0 100 20.068
EFV 50.17 100 5.0 100 25.085
EFV 50.17 100 10.0 100 50.170
EFV 50.17 100 20.0 100 100.340
EFV 50.17 100 40.0 100 200.680
EFV 50.17 100 60.0 100 301.020
TABLE 4.8(b): Concentration, Area and Area ratio for linearity study:
S.No.
Concentration (µg/ml) Area Area Ratio
(Analyte/IS)
Efavirenz
(Analyte)
Tenofovir
(IS)
Efavirenz
(Analyte)
Tenofovir
(IS)
1 1.003 50.255 1030189 7804463 0.132
2 5.017 50.255 1225301 7804463 0.157
3 10.034 50.255 1462147 7804463 0.187
4 20.068 50.255 2901725 7804463 0.372
5 25.085 50.255 3602156 7804463 0.462
6 50.170 50.255 7404312 7804463 0.949
7 100.340 50.255 14708624 7804463 1.885
8 200.680 50.255 29417248 7804463 3.769
9 301.020 50.255 43225872 7804463 5.539

Chapter 4 Results & Discussions
119997290052 / Gujarat Technological University Page 99
(a)
0
1
2
3
4
5
6
0 50 100 150 200 250 300 350
y = 0.0183x+0.0403 R^2 = 0.9996
Concentration (µg/ml)
Rat
io o
f A
rea
(b)
FIGURE 4.17: (a) Chromatogram for linearity study (b) Calibration plot for linearity
As per the extensive literature review, most of the methods were reported to give linear
relation in the concentration range upto 10 µg/ml [10, 11, 14, 15]. Only a few had reported
linearity at higher concentration of 0.1- 100 µg/ml [9]. In one of the reported methods for
simultaneous estimation of Emtricitabine, Tenofovir and Efavirenz, the linearity was
investigated in the concentration range of 200-280 µg/ml [16]. The present investigation
assures the linearity in a wider range of 1-300 µg/ml required for the intended application of
the procedure.

Chapter 4 Results & Discussions
119997290052 / Gujarat Technological University Page 100
B. Precision
The precision of an analytical procedure expresses the closeness of agreement (degree of
scatter) between a series of measurements obtained from multiple sampling of the same
homogeneous sample under the prescribed conditions. The precision (repeatability) of the
analytical method was determined by assaying six samples at 100% test concentration. The
chromatograms obtained for the precision study is shown in Figure 4.18. RSD was
determined to be 0.497 (NMT 2.0%) as shown in Table 4.9.
The intra-day and inter-day precisions were also assessed by analyzing three samples at three
different times of the same day and on three consecutive days respectively and RSD were
found to be less than 1.0 % as shown in Table 4.10 and 4.11 respectively which is within the
normal acceptable range (NMT 2.0%). RSD of upto 8.6% have been reported in the literature
for precision of the analytical methods for estimation of EFV [11, 15]. Although many authors
have not analyzed the data statistically with ANOVA [5, 9-11, 14], a few have [12, 15]. In the
present investigations, no significant differences were observed for results obtained for
intra-day and inter-day data when statistically analyzed with ANOVA (p>0.05) as shown in
Table 4.12 and Table 4.13.
FIGURE 4.18: Chromatogram for precision study

Chapter 4 Results & Discussions
119997290052 / Gujarat Technological University Page 101
TABLE: 4.9 Area ratios and RSD calculation for Precision study (Repeatability):
Sample
Stock solution Dilution Conc.
(µg/ml)
Wt taken
(mg)
Total
Volume (ml)
Volume of
stock
solution
taken (ml)
Final
Volume (ml)
Efavirenz 50.17 100 5.0 100 25.085
Tenofovir 100.51 100 5.0 100 50.255
S.No.
Concentration (µg/ml) Area Area Ratio
(Analyte/IS)
Efavirenz Tenofovir
(IS)
Efavirenz Tenofovir
(IS)
1 25.085 50.255 3594121 7816671 0.460
2 25.085 50.255 3614721 7804413 0.463
3 25.085 50.255 3600781 7863229 0.458
4 25.085 50.255 3612480 7821009 0.462
5 25.085 50.255 3607115 7831118 0.461
6 25.085 50.255 3586470 7844471 0.457
Mean 3602615 7830152 0.460
S.D. 10957 21109 0.002
% RSD 0.304 0.270 0.497
TABLE: 4.10 Intraday Precision studies:
Drug Conc.
(µg/ml)
Area Average
SD
%RSD
at 10 am at 1 pm at 4 pm
EFV 25.085 3594121 3612480 3624812 3610471 15444 0.428
25.085 3614721 3607115 3628599 3616812 10894 0.301
25.085 3600781 3586470 3617955 3601735 15764 0.438
TDF 50.255 7816671 7821009 7810063 7815914 5512 0.071
50.255 7804413 7831118 7866541 7834024 31166 0.398
50.255 7863229 7844471 7852116 7853272 9432 0.120

Chapter 4 Results & Discussions
119997290052 / Gujarat Technological University Page 102
TABLE: 4.11 Inter-day Precision studies:
Drug Conc.
(µg/ml)
Area Average
SD
%RSD
on Day 1 on Day 2 on Day 3
EFV 25.085 3598121 3612151 3620012 3610095 11089 0.307
25.085 3612721 3614561 3610124 3612469 2229 0.062
25.085 3600781 3616589 3616479 3611283 9095 0.252
TDF 50.255 7816671 7820041 7832017 7822910 8065 0.103
50.255 7804413 7862535 7814250 7827066 31108 0.397
50.255 7863229 7821451 7825599 7836760 23017 0.294
TABLE: 4.12 Summary of ANOVA analysis for precision study (intra-day)
Groups Count Sum
(Analyte/IS)
Average Variance
I (at 10:00 am) 3 1.385817084 0.461939028 4.6643E-06
II (at 01:00 pm) 3 1.38504671 0.461682237 1.75399E-06
III (at 04:00 pm) 3 1.375885473 0.458628491 3.54619E-06
Source of
Variation
Sum of
Squares
Degree of
Freedom
Mean of
Squares F P-value F critical
Between
Groups 2.0351E-05 2 1.01755E-05 3.063522248 0.121112463 5.143253
Within
Groups 1.9929E-05 6 3.3215E-06
Total 4.028E-05 8
TABLE: 4.13 Summary of ANOVA analysis for precision study (inter-day)
Groups Count Sum
(Analyte/IS)
Average Variance
I (Day 1) 3 1.381147701 0.460382567 6.20602E-06
II (Day 2) 3 1.384022629 0.461340876 2.03014E-06
III (Day 3) 3 1.386333712 0.462111237 1.19046E-08
Source of
Variation
Sum of
Squares
Degree of
Freedom
Mean of
Squares F P-value
F
critical
Between
Groups 4.5001E-06 2 2.25006E-06
0.81839427
0.484977346
5.143253
Within
Groups 1.6496E-05 6 2.74936E-06
Total 2.0996E-05 8

Chapter 4 Results & Discussions
119997290052 / Gujarat Technological University Page 103
C. Accuracy
The accuracy of an analytical procedure expresses the closeness of agreement between the
value which is accepted either as a conventional true value or an accepted reference value and
the value found. The accuracy of the developed HPLC method was determined by recovery
study. Six replicates were analyzed at 100% concentration level and three replicates each at
50% and 150% concentrations. Assessment of accuracy was accomplished by evaluating the
percent recovery of the analyte as shown in Table 4.14.
TABLE 4.14: Data of recovery study for Accuracy Parameter
Sample details Area of
EFV
Area of
TDF
Ratio Amount
found
(µg/ml)
Amount
added
(µg/ml)
%
Recovery
Recovery
at 50%
level
Set-1 1852461 7812521 0.237 12.617 0.987 100.6
Set-2 1843251 7832151 0.235 12.519 0.979 99.8
Set-3 1838369 7842611 0.234 12.467 0.982 99.4
Recovery
at 100%
level
Set-1 3624812 7810063 0.464 25.229 2.014 100.6
Set-2 3648599 7896541 0.462 25.114 2.005 100.1
Set-3 3617955 7852116 0.461 25.042 1.999 99.8
Set-4 3602488 7821562 0.461 25.032 1.998 99.8
Set-5 3624851 7862140 0.461 25.058 2.000 99.9
Set-6 3638412 7831411 0.465 25.255 2.016 100.7
Recovery
at 150%
level
Set-1 5391453 7821663 0.689 37.739 3.010 100.3
Set-2 5422757 7812320 0.694 38.007 3.032 101.0
Set-3 5451369 7892113 0.691 37.819 3.017 100.5
It can be observed that the percent recovery determined falls in the range of 99 to 101%. As
per the literature review, % recovery achieved with several of the reported methods are
between 97-103% [8, 11] or even wider range [14, 15].

Chapter 4 Results & Discussions
119997290052 / Gujarat Technological University Page 104
D. Limit of Detection (LOD) and Limit of Quantification (LOQ)
The detection limit of an individual analytical procedure is the lowest amount of analyte in a
sample which can be detected but not necessarily quantitated as an exact value. The
quantitation limit of an individual analytical procedure is the lowest amount of analyte in a
sample which can be quantitatively determined with suitable precision and accuracy. Out of
the various methods described, LOD and LOQ were determined based on signal-to-noise ratio.
A signal-to-noise ratio between 3 or 2:1 is generally considered acceptable for estimating the
detection limit and a typical signal-to-noise ratio for LOQ is 10:1 [13].
Signal for known low concentration (six replicates of 0.01 µg/ml each) of analyte was
compared with blank sample for the LOD. Average signal to noise ratio was found to be 4:1
which was in accordance with the acceptance criteria indicating the detection at concentration
of even as low as 0.01 µg/ml concentration also with reliability.
Average signal-to-noise ratio of more than 10:1 were obtained with known low concentrations
(six replicates of 0.05 µg/ml solution) of analyte which indicated that even 0.05 µg/ml of
efavirenz may also be reliably quantified.
The reported therapeutic range of efavirenz is 1 – 4 µg/ml [17]. Hence the developed method
has the potential to estimate even the minimum concentration of drug in effective therapeutic
range.
The results obtained are similar with the reported LOD and LOQ determined by dispersive
liquid-liquid micro-extraction coupled to high performance liquid chromatography (DLLME)
with 0.01 and 0.1 µg/ml [9, 11], 0.02 and 0.05 µg/ml [14], as LOD and LOQ respectively.
E. Specificity
The peak areas of compounds co-eluting with one of the analytes should be less than 20% of
the peak areas of the analyte at LOQ. For compounds co-eluting with the internal standard the
peak area should be less than 5% of the internal standard area [18].

Chapter 4 Results & Discussions
119997290052 / Gujarat Technological University Page 105
Specificity of the developed method was checked by recording chromatogram of placebo and
comparing with chromatogram of EFV and TDF. No interference was observed at the
retention time of EFV and TDF in placebo and diluent as shown in Figure 4.19 indicating the
specificity of the analytical method.
FIGURE 4.19: Chromatogram for specificity (Diluent, Placebo, Standard)
F. Robustness
The robustness of an analytical procedure is a measure of its capacity to remain unaffected by
small, but deliberate variations in method parameters and provides an indication of its
reliability during normal usage. The robustness of the method was studied by changing the
flow rate (±0.2 ml/min), wavelength (±2 nm) and pH of mobile phase (±0.2). Robustness of
the developed method was determined in terms of % RSD as shown in Table 4.15.
TABLE 4.15 (a) : Robustness data for change in flow rate
Drug Param-
eters
Flow rate
(ml/min)
Injection
1
Injection
2
Injection
3
Injection
4
Injection
5
Injection
6 Mean
%
RSD
EFV
RT
1.3 6.103 6.105 6.1 6.102 6.101 6.101 6.102 0.029
1.5 5.94 5.941 5.941 5.94 5.941 5.942 5.941 0.013
1.7 5.831 5.832 5.831 5.831 5.832 5.831 5.831 0.009
Area
1.3 3644512 3642412 3669819 3672156 3652207 3695711 3662802 0.557
1.5 3594121 3614721 3600781 3612480 3607115 3586470 3602614 0.304
1.7 3542146 3551482 3540087 3556214 3549860 3556810 3549433 0.197

Chapter 4 Results & Discussions
119997290052 / Gujarat Technological University Page 106
Tailing
factor
1.3 1 1 1 1 1 1 1.000 0.000
1.5 1 1 1 1 1 1 1.000 0.000
1.7 1 1 1 1 1 1 1.000 0.000
Thear
otical
plates
1.3 11304 11921 11015 11465 11756 11685 11524 2.874
1.5 12381 12014 13009 12571 12712 12880 12594 2.863
1.7 14207 14220 14358 14097 15117 14586 14430 2.604
TDF
RT
1.3 4.521 4.52 4.521 4.523 4.521 4.52 4.521 0.022
1.5 4.355 4.356 4.356 4.355 4.357 4.355 4.356 0.017
1.7 4.123 4.128 4.122 4.121 4.125 4.125 4.124 0.056
Area
1.3 7862141 7865211 7841208 7871190 7883971 7893601 7869553 0.212
1.5 7816671 7804413 7863229 7821009 7831118 7844471 7830151 0.246
1.7 7779148 7782547 7782197 7780128 7780224 7793221 7782910 0.061
Tailing
factor
1.3 1 1 1 1 1 1 1.000 0.000
1.5 1 1 1 1 1 1 1.000 0.000
1.7 1 1 1 1 1 1 1.000 0.000
Theo
plates
1.3 24364 24008 24971 24851 24739 24013 24491 1.581
1.5 26752 26001 27021 27339 26987 26017 26686 1.905
1.7 27658 27966 27845 27921 27332 28014 27789 0.842
Resolution
1.3 5.1 5.7 5.9 5.4 5.5 5.1 5.5 5.376
1.5 5.3 5.1 5 5.1 5.1 5.6 5.2 3.846
1.7 5.6 5.7 5.5 5.9 5.8 5.8 5.7 2.351
TABLE 4.15 (b) : Robustness data for change in wavelength
Drug Param-
eters
Wavelen
gth (nm)
Injection
1
Injection
2
Injection
3
Injection
4
Injection
5
Injection
6 Mean
%
RSD
EFV
RT
258 5.940 5.941 5.941 5.94 5.941 5.942 5.941 0.012
260 5.940 5.941 5.941 5.94 5.941 5.942 5.941 0.012
262 5.940 5.941 5.941 5.94 5.941 5.942 5.941 0.012
Area
258 3593951 3614251 3601245 3612701 3608012 3586801 3602826 0.276
260 3594121 3614721 3600781 3612480 3607115 3586470 3602614 0.278
262 3594981 3614411 3600497 3613001 3607820 3586101 3602801 0.280
Tailing
factor
258 1 1 1 1 1 1 1.000 0.000
260 1 1 1 1 1 1 1.000 0.000
262 1 1 1 1 1 1 1.000 0.000
Theor
etical
plates
258 12220 12178 12800 12621 12797 12725 12556 2.072
260 12381 12014 13009 12571 12712 12880 12594 2.614
262 12370 12103 12891 12709 12624 12768 12577 2.109

Chapter 4 Results & Discussions
119997290052 / Gujarat Technological University Page 107
TDF
RT
258 4.355 4.356 4.356 4.355 4.357 4.355 4.356 0.017
260 4.355 4.356 4.356 4.355 4.357 4.355 4.356 0.017
262 4.355 4.356 4.356 4.355 4.357 4.355 4.356 0.017
Area
258 7816210 7805214 7863524 7821280 7831331 7844921 7830413 0.246
260 7816671 7804413 7863229 7821009 7831118 7844471 7830151 0.246
262 7816241 7804124 7864517 7821987 7831127 7844678 7830445 0.252
Tailing
factor
258 1 1 1 1 1 1 1.000 0.000
260 1 1 1 1 1 1 1.000 0.000
262 1 1 1 1 1 1 1.000 0.000
Theo
plates
258 26801 26120 26987 27211 27108 26330 26759 1.504
260 26752 26001 27021 27339 26987 26017 26686 1.905
262 26802 26281 27178 27271 26721 26208 26743 1.505
Resolution
258 5.3 5.1 5 5.1 5.1 5.6 5.200 3.846
260 5.3 5.1 5 5.1 5.1 5.6 5.200 3.846
262 5.3 5.1 5 5.1 5.1 5.6 5.200 3.846
TABLE 4.15 (c) : Robustness data for change in pH of mobile phase
Drug Param
eters pH
Injection
1
Injection
2
Injection
3
Injection
4
Injection
5
Injection
6 Mean
%
RSD
EFV
RT
3.3 5.830 5.830 5.830 5.828 5.829 5.828 5.829 0.015
3.5 5.940 5.941 5.941 5.940 5.941 5.942 5.941 0.012
3.7 6.112 6.110 6.112 6.114 6.112 6.112 6.112 0.019
Area
3.3 3544874 3562199 3584152 3555841 3561422 3499658 3551357 0.730
3.5 3594121 3614721 3600781 3612480 3607115 3586470 3602614 0.278
3.7 3599641 3597821 3600485 3610308 3661421 3658741 3621402 0.763
Tailing
factor
3.3 1.0 1.0 1.0 1.0 1.0 1.0 1.000 0.000
3.5 1.0 1.0 1.0 1.0 1.0 1.0 1.000 0.000
3.7 1.0 1.0 1.0 1.0 1.0 1.0 1.000 0.000
Theor
etical
plates
3.3 14311 14368 14285 14268 14336 14451 14336 0.423
3.5 12381 12014 13009 12571 12712 12880 12594 2.614
3.7 11278 11721 11458 11774 11498 11338 11511 1.588
TDF
RT
3.3 4.112 4.112 4.115 4.113 4.11 4.112 4.112 0.036
3.5 4.355 4.356 4.356 4.355 4.357 4.355 4.356 0.017
3.7 4.449 4.448 4.451 4.452 4.446 4.448 4.449 0.045
Area
3.3 7789211 7821146 7792351 7701236 7782971 7782399 7778219 0.473
3.5 7816671 7804413 7863229 7821009 7831118 7844471 7830151 0.246
3.7 7854742 7860045 7851468 7841136 7859941 7884263 7858599 0.167

Chapter 4 Results & Discussions
119997290052 / Gujarat Technological University Page 108
Tailing
factor
3.3 1 1 1 1 1 1 1.000 0.000
3.5 1 1 1 1 1 1 1.000 0.000
3.7 1 1 1 1 1 1 1.000 0.000
Theo
plates
3.3 27568 27450 27005 26894 26993 26473 27063 1.341
3.5 26752 26001 27021 27339 26987 26017 26686 1.905
3.7 24200 24682 24791 24931 24013 24228 24474 1.396
Resolution
3.3 5.5 5.5 5.5 5.8 5.4 5.6 5.550 2.267
3.5 5.3 5.1 5.0 5.1 5.1 5.6 5.200 3.846
3.7 5.3 5.3 5.4 5.7 5.1 5.6 5.400 3.704
No significant changes in the chromatographic parameters were observed when changing the
optimized experimental conditions (flow rate, wavelength, pH of mobile phase). Robustness of
the developed method was determined in terms of % RSD as shown in Table 4.15(a), 4.15(b) and
4.15(c) which are summarized in Table 4.15(d). The RSD in all the investigations were found to
be less than 5. Robustness with respect to change in flow rate, wavelength and pH has not been
investigated in various reported results [10, 15, 18]. RSD values of up to 7.5 has been reported
[9].
TABLE 4.15 (d): Summary of robustness data for change in different parameters
Parameters RSD
EFV TDF
Change in flow rate
(±0.2 ml/min)
Retention time 2.288 4.602
Area 1.573 0.554
Tailing factor 0 0
Resolution 4.604 4.604
Change in
wavelength
(±2 nm)
Retention time 2.391 4.042
Area 1.009 0.521
Tailing factor 0 0
Resolution 3.262 3.262
Change in pH of
mobile phase
(±0.2)
Retention time 2.391 4.042
Area 1.009 0.521
Tailing factor 0 0
Resolution 3.262 3.262

Chapter 4 Results & Discussions
119997290052 / Gujarat Technological University Page 109
G. Stability of analytical solution:
Stability of the analytical solution was tested at 2, 4, 6, 12, 18, 24 hours and after 10 days, and
compared with chromatograms of freshly prepared sample. No significant change (p > 0.05)
was observed indicating the stability of the analytical solution for 10 days, the time being
based on the expected duration of analysis. Stability of the samples up to 6 hours at room
temperature has been reported in other similar investigations [10]. The stability of efavirenz in
human plasma when stored at −20 0C has been reported for upto 30 days [14].
TABLE 4.16: Summary of validation Parameters
S.No. Parameters Results
1 Linearity range 1-300 µg/ml
2 Correlation coefficient 0.999
3 LOD 0.01 µg/ml
4 LOQ 0.05 µg/ml
5 Retention time 5.941 + 0.013 min
Thus it can be concluded that a simple and sensitive reversed-phase HPLC gradient method
has been developed and validated for the estimation of EFV in plasma using UV detector. The
summary of the validation parameters has been presented in Table 4.16. A good resolution
was obtained between EFV and TDF as internal standard with retention time 5.941 minutes
and 4.356 min respectively. There were no interference peaks observed around the retention
time of EFV and TDF. The method was found to be linear (R2= 0.999) within the analytical
range of 1-300 µg/ml. The results obtained proved that the method was accurate and
reproducible and the drug was stable in plasma. Therefore, the developed chromatographic
method can be used for estimation of EFV in plasma with good resolution to evaluate the
pharmacokinetic parameters of EFV.

Chapter 4 Results & Discussions
119997290052 / Gujarat Technological University Page 110
4.3 Design of Experiment
Literature survey was done to identify and determine the QTPP, CQAs, manufacturing
procedures for SLN, various process and formulation attributes having effect on product
CQAs. For the intended solid lipid nanoparticulate drug delivery system, almost all routes of
administration – oral, parenteral, dermal, ocular, nasal, etc. have been reported for topical,
systemic or central nervous system actions. For better absorption of the drug, minimum
average size of the nanoparticles is desired. Hence, minimum particle size is one of the most
important CQA along with minimum PDI (monodispersity), maximum entrapment
efficiency, minimum zeta potential of ± 20 mV for stability [19] and no residual solvent for
avoiding toxicity and ensuring safety. A CQA is a physical, chemical, biological, or
microbiological property or characteristic that should be within an appropriate limit, range,
or distribution to ensure the desired product quality [20, 21]. In the present investigation,
different preliminary experiments were carried out for selection of suitable
excipients/materials which may directly and/or indirectly influence critical quality attributes.
The compatibility of the drug-excipient was checked before the optimization of various
process and formulation variables. With the selected excipients, various critical process
variables identified through literature were optimized sequentially as per the steps involved
in the formulation. Finally, the formulation variables were optimized using 32 factorial
design and design expert software for analyzing the data statistically and graphically using
response surface plots [22-26].
4.4 Preformulation studies
The major components for the solid lipid nanoparticulate system include the drug, lipid and
surfactant. After the identification of the drug, various materials were screened as components
for the proposed system. These selections were based on the solubility of the drug and their
ability to produce small sized particles. The selections were also based on the safety profile
and approval status of the components.
4.4.1 Selection of lipid
Improved permeability of the drug is reported due to lipid content in SLN [27]. SLN contain

Chapter 4 Results & Discussions
119997290052 / Gujarat Technological University Page 111
lipids which remain solid at room temperature and body temperature. The lipids are pure
triglycerides (tristearin, tripalmitin, trimyristin, etc.), long chain alcohols (cetyl alcohol),
waxes (bees wax, cetyl palmitate) and sterols (cholesterol) [28]. The selection of the lipid
was primarily based on the solubility of the drug in lipid since higher the solvent capacity,
higher will be the drug loading potential [29, 30]. The solubility of the drug was determined
in six different lipids - Glycerymonostearate, Glyceryl behenate (Compritol 888 ATO),
Glyceryl tripalmitate (Tripalmitin), Glyceryl palmitostearate, Glyceryl distearate and Cetyl
palmitate. The results obtained are as shown in Table 4.17 and Figure 4.20.
TABLE 4.17: Selection of lipid based on solubility of drug in lipid
Lipids Melting Point
(0C)
Solubility of drug in lipid
(mg / g)
Glycerymonostearate 58-59 40-60
Compritol 888 ATO
(Glyceryl behenate) 70-71 40-60
Tripalmitin
(Glyceryl tripalmitate) 66-68 110-130
Glyceryl palmitostearate 53-57 60-80
Glyceryl distearate 65-77 20 -40
Cetyl palmitate 43-57 60-80
FIGURE 4.20: Solubility of Efavirenz in different lipids [GMS: Glycerymonostearate,
Comp: Compritol 888 ATO (Glyceryl behenate), GTP: Glyceryl tripalmitate(Tripalmitin),
GPS : Glyceryl palmitostearate, GDS: Glyceryl distearate, CP: Cetyl Palmitate]

Chapter 4 Results & Discussions
119997290052 / Gujarat Technological University Page 112
Glyceryl tripalmitate (tripalmitin) showed maximum drug solubilizing capacity of 120 + 10
mg drug / gram of lipid while glyceryl palmitostearate and cetyl palmitate showed next
highest solubilizing capacity of 70 + 10 mg drug / gram of lipid. Thus, the solubility of drug
in glyceryl tripalmitate was found to be significantly higher than other lipids (p < 0.05).
Medium and long chain fatty acids are also reported to have good solvent capacity in
comparison to short chain fatty acids. Moreover, triglycerides have many advantages as the
foundation of lipid-based delivery systems. They are commonly ingested in food, fully
digested and absorbed, and therefore do not present any safety issues [30]. Tripalmitin also
has GRAS status as per 21 CFR § 186.1555 and hence was selected for further
investigations. Glyceryl tripalmitate is also reported to be used for SLN preparation during
various investigations [31-34].
4.4.2 Selection of Surfactant
SLN are the colloidal system of nanoparticles made up of solid lipid as matrix medium
which is stabilized in aqueous media by surfactants [28]. Solubilization of endothelial cell
membrane lipids and membrane fluidization due to surfactant effect leads to improved
permeability [27]. For the selection of surfactant, nanoparticles were prepared with six
different surfactants using tripalmitin as lipid and were evaluated for particle size, PDI and
entrapment efficiency. The results obtained are as shown in Table 4.18.
TABLE 4.18: Selection of Surfactant on the basis of Particle size, PDI and
Entrapment Efficiency
S.
No.
Lipid Surfactant
(1% w/w)
Particle
size*
(nm)
PDI* Entrapment
Efficiency*
(%)
1 Tripalmitin Poloxamer 188
(Pluronic F68)
566.4+7.4# 0.494+0.2 23.93+0.31
2 Tripalmitin Poloxamer 407
(Pluronic F127)
891.1+8.1 0.363+0.3 16.50+0.51

Chapter 4 Results & Discussions
119997290052 / Gujarat Technological University Page 113
3 Tripalmitin Poloxamer 245
(Pluronic P 85)
628.3+9.3 0.488+0.3 18.31+0.57
4 Tripalmitin Polysorbate 20 697.4+9.7 0.511+0.4 17.33+0.49
5 Tripalmitin Polysorbate 60 620.5+8.9 0.500+0.3 20.14+0.63
6 Tripalmitin Polysorbate 80 601.3+8.5 0.499+0.3 21.23+0.90
{PDI: Polydispersity Index, *Data expressed as mean ± SD (n = 3), # indicates statistical
significance (p < 0.05)}
Poloxamer 188 (Pluronic F68) was found to give minimum particle size and PDI with
maximum entrapment efficiency. The difference in particle size was found to be statistically
significant in comparison to others (p < 0.05) while the differences observed in PDI and
entrapment efficiency were statistically non-significant. Poloxamers are nonionic triblock
copolymers composed of a central hydrophobic chain of polyoxypropylene (poly (propylene
oxide)) flanked by two hydrophillic chains of polyoxyethylene (poly(ethylene oxide)).
Poloxamers are also reported to sterically stabilize the nanoparticles and reduce the
adsorption plasma proteins or opsonins on the surface of nanoparticles by providing
hydrophilic property to the surface of nanoparticles, thus can prevent the clearance of drug
containing SLN from circulation [28]. In general, bulky and non-ionic surfactants are
reported to be less toxic than single-chain and ionic surfactants [30]. Hence, Poloxamer 188,
also having GRAS status [35] was selected for further investigations for the formulation.
4.4.3 Drug-Excipient Compatibility Study
IR spectra of pure drug efavirenz, and the physical mixtures of efavirenz, tripalmitin and
poloxamer 188 are shown in Figure 4.21.

Chapter 4 Results & Discussions
119997290052 / Gujarat Technological University Page 114
(a)
(b)
FIGURE 4.21: IR spectra of drug and physical mixture of drug and excipients. (a) IR
spectrum of drug (Efavirenz) (b) IR spectrum of drug (Efavirenz) + Lipid (Tripalmitin)
+ Surfactant (Poloxamer 188)
It was observed from Figure 4.21, that all major peaks of the drug were obtained in the IR
spectra as shown in Table 4.2 and no significant change was observed in the IR spectra of
drug-excipients mixture (Figure 4.21(b)) indicating the compatibility of the drug with the
selected excipients [36].

Chapter 4 Results & Discussions
119997290052 / Gujarat Technological University Page 115
4.4.4 Selection of formulation Technique
SLN formulations were prepared by different techniques (as trials) and were compared with
respect to particle size, PDI and entrapment efficiency. The results obtained are as shown in
Table 4.19.
TABLE 4.19: Comparison of formulation techniques on the basis of Particle size, PDI
and Entrapment Efficiency
S. No. Batch
No.
Technique Particle
size*
(nm)
PDI* Entrapment
efficiency*
(%)
1 SFT01 Solvent
evaporation
479.7
+
13.4
0.373
+
0.113
42.24
+
2.3
2 SFT02 High
Pressure
Homogenization
376.3#
+
9.5
0.380
+
0.101
64.76#
+
1.9
{PDI: Polydispersity Index, *Data expressed as mean ± SD (n = 3), #indicates statistical
significance (p<0.01)}
It was observed that lower particle size with higher entrapment efficiency was obtained by
high pressure homogenization. The difference in particle size and entrapment efficiency
obtained with two techniques were found statistically significant (p<0.01) while the
difference in PDI was statistically insignificant. The results were found to be in accordance
with the findings reported in the literature [37, 38]. There are no chances of residual organic
solvent since the high pressure homogenization technique avoids the use of organic solvent.
The use of organic solvents presents a major toxicological disadvantage with solvent
evaporation technique [39, 40]. Another advantage of the high pressure homogenization
technique is its scale up feasibility as it easily allows a laboratory, pilot or large scale
production [41]. Hence, further investigations were carried out with high pressure
homogenization technique.

Chapter 4 Results & Discussions
119997290052 / Gujarat Technological University Page 116
4.5 Optimization of Process Variables
Various critical process variables which may have significant effect on the critical quality
attributes were identified for each steps involved in the formulation i.e. stirring, high
pressure homogenization and sonication. Preliminary optimization of stirring time and RPM
of high speed homogenizer (Heidolph silent crusher) were carried out by conducting the
experiments at three different RPM (5,000 to 10,000) for three time durations (10 to 20
minutes) at room temperature. From the results obtained in terms of particle size and PDI (as
shown in Table 4.20), it was observed that as the homogenization time and/or
homogenization speed increased, the particle size decreased which may be attributed to
increased force of deforming droplets at higher speed leading to smaller particles [42]. The
observation was in accordance to reported results [6]. It was also observed that with the
increase in homogenization time PDI also increased which may be due to formation of foam
and more aggregation in the formulation. Best results were obtained by stirring at 10,000
RPM for 15 minutes. Hence further investigations were done with homogenization/ stirring
speed of 10000 RPM for 15 min.
TABLE 4.20: Optimization of stirring speed (rpm) and stirring on the basis of Particle
size and PDI
S. No. Batch No. Stirring
time
(min)
Stirring speed
(rpm)
Particle size
(nm)
PDI
1 OST01 10 5000 904.3 + 10.0 0.556 + 0.221
2 OST02 7500 752.3 + 8.3 0.433 + 0.201
3 OST03 10000 354.3 + 7.2 0.384 + 0. 187
4 OST04 15 5000 886.6 + 9.4 0.506 + 0.203
5 OST05 7500 677.0 + 7.8 0.454 + 0.189
6 OST06 10000 345.6 + 5.4# 0.380 + 0.175
7 OST07 20 5000 847.6 + 6.9 0.431 + 0.116
8 OST08 7500 501.3 + 5.8 0.549 + 0.108
9 OST09 10000 308.0 + 5.2 0.624 + 0.019
{PDI: Polydispersity Index *Data expressed as mean ± SD (n = 3), # indicates statistical
significance (p<0.01)}

Chapter 4 Results & Discussions
119997290052 / Gujarat Technological University Page 117
To study the effect of temperature on the performance attributes, particle size and PDI were
determined for the investigations carried out at three different temperatures (60-800C). Best
results were obtained at 700C as observed from Table 4.21. It may be because the lipid
would have remained at melted condition at this temperature as well as the temperature is
much below the melting point of the drug, hence drug degradation due to temperature
remains negligible. In general, higher temperatures result in lower particle sizes due to the
decreased viscosity of the inner phase [43].
TABLE 4.21: Optimization of temperature during stirring on the basis of Particle size
and PDI
S.
No.
Batch No. Stirring
time
min)
Stirring
speed
(rpm)
Temp
( 0C)
Particle size
(nm)
PDI
1 OT01
15
10000
60 466.7 + 5.1 0.503 + 0.123
2 OT02 70 290.2 + 5.0# 0.242 +0.111
3 OT03 80 371.9 + 4.9 0.565 + 0.112
{PDI: Polydispersity Index, *Data expressed as mean ± SD (n = 3), #indicates statistical
significance (p<0.01)}
Critical process variables involved during the high pressure homogenization were pressure
and number of cycles. These were optimized using 32 factorial design with Design Expert
9.0.3.1 software (Stat-Ease, Inc., USA). Thirteen runs were carried out with pressure (500 to
900 bars) and number of cycles (3 to 7) as independent variables at three levels and particle
size and PDI as dependent variables. Full factorial design used for optimization of process
variables is shown in Table 4.22.

Chapter 4 Results & Discussions
119997290052 / Gujarat Technological University Page 118
TABLE 4.22: Full factorial design with coded and actual values used for optimization
of process variables. (Independent variable : Pressure and Number of cycles;
Dependent Variable: Particle size and Polydispersity index- PDI )
S.
No.
Batch
No.
Coded Values Actual Values Particle size
(nm)
PDI
Pressure
(bar)
No. of
Cycles
Pressure
(bar)
No. of
Cycles
1 OPC01 -1 -1 500 3 501.0 0.469
2 OPC02 0 -1 700 3 403.1 0.440
3 OPC03 1 -1 900 3 309.8 0.412
4 OPC04 -1 0 500 5 457.7 0.386
5 OPC05 0 0 700 5 376.3 0.380
6 OPC06 1 0 900 5 246.1 0.259
7 OPC07 -1 1 500 7 379.9 0.326
8 OPC08 0 1 700 7 352.7 0.359
9 OPC09 1 1 900 7 235.6 0.261
10 OPC10 0 0 700 5 390.2 0.253
11 OPC11 0 0 700 5 405.5 0.301
12 OPC12 0 0 700 5 389.9 0.286
13 OPC13 0 0 700 5 399.3 0.298
ANOVA was applied to determine the significance and the magnitude of the effects of the
variables and their interactions. ANOVA for Response Surface Quadratic model for
Response 1 (Particle size) and Response 2 (PDI) are shown in Table 4.23(a) and 4.23(b)
respectively.
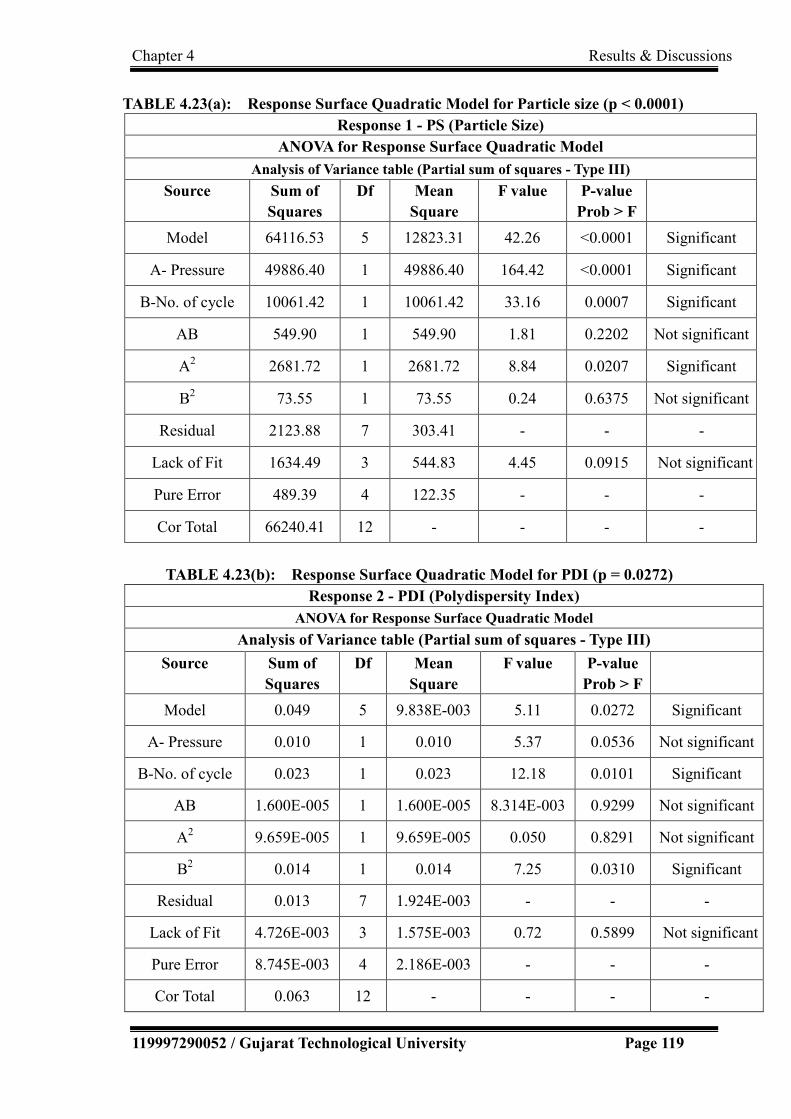
Chapter 4 Results & Discussions
119997290052 / Gujarat Technological University Page 119
TABLE 4.23(a): Response Surface Quadratic Model for Particle size (p < 0.0001)
Response 1 - PS (Particle Size)
ANOVA for Response Surface Quadratic Model
Analysis of Variance table (Partial sum of squares - Type III)
Source Sum of
Squares
Df Mean
Square
F value P-value
Prob > F
Model 64116.53 5 12823.31 42.26 <0.0001 Significant
A- Pressure 49886.40 1 49886.40 164.42 <0.0001 Significant
B-No. of cycle 10061.42 1 10061.42 33.16 0.0007 Significant
AB 549.90 1 549.90 1.81 0.2202 Not significant
A2 2681.72 1 2681.72 8.84 0.0207 Significant
B2 73.55 1 73.55 0.24 0.6375 Not significant
Residual 2123.88 7 303.41 - - -
Lack of Fit 1634.49 3 544.83 4.45 0.0915 Not significant
Pure Error 489.39 4 122.35 - - -
Cor Total 66240.41 12 - - - -
TABLE 4.23(b): Response Surface Quadratic Model for PDI (p = 0.0272)
Response 2 - PDI (Polydispersity Index)
ANOVA for Response Surface Quadratic Model
Analysis of Variance table (Partial sum of squares - Type III)
Source Sum of
Squares
Df Mean
Square
F value P-value
Prob > F
Model 0.049 5 9.838E-003 5.11 0.0272 Significant
A- Pressure 0.010 1 0.010 5.37 0.0536 Not significant
B-No. of cycle 0.023 1 0.023 12.18 0.0101 Significant
AB 1.600E-005 1 1.600E-005 8.314E-003 0.9299 Not significant
A2 9.659E-005 1 9.659E-005 0.050 0.8291 Not significant
B2 0.014 1 0.014 7.25 0.0310 Significant
Residual 0.013 7 1.924E-003 - - -
Lack of Fit 4.726E-003 3 1.575E-003 0.72 0.5899 Not significant
Pure Error 8.745E-003 4 2.186E-003 - - -
Cor Total 0.063 12 - - - -

Chapter 4 Results & Discussions
119997290052 / Gujarat Technological University Page 120
As observed from Table 4.23 (a), for Response 1 (PS), the Model F-value of 42.26 implies
the model is significant. There is only a 0.01% chance that a "Model F-Value" could occur
due to noise. Values of "Prob > F" less than 0.0500 indicated model terms are significant. In
this case, A (Pressure), B (Number of cycles) and A2 are significant model terms. Values
greater than 0.1000 indicate the model terms AB and B2 are not significant.
Full model equation for Particle Size in terms of coded factors was obtained as
PS = +389.62 - 91.18*A - 40.95*B +11.73*AB -31.16 *A2-5.16*B2
Final reduced polynomial equation for Particle Size in terms of coded factors was obtained
as
PS = +388.14 - 91.18*A - 40.95* B - 33.13*A2
As shown in Table 4.22(b), ANOVA results confirmed the adequacy of the quadratic model
(Model Prob > F is less than 0.05) for PDI. The individual effect of number of cycles (B)
was found to be significant (P value <0.05) and of pressure (A) was marginally significant (P
value = 0.0536).
Full model equation for PDI in terms of coded factors was found to be
PDI = +0.31 - 0.042*A - 0.063*B - 2.000E-003*AB - 5.914E-003* A2 + 0.071*B2
Final reduced polynomial equation for PDI in terms of coded factors
PDI = +0.31 -0.042*A -0.063* B + 0.069*B2
The regression model obtained was used to generate the contour plots, 3D Surface plots and
the overlay plot for particle size and as shown in Figure 4.22 for analyzing interactions of
the independent factors. It was observed from Figure 4.22(b) and 4.22(d) that as the pressure
and/or number of cycles were increased, the particle size and PDI were found to reduce. The
results were found to be in accordance to the findings of Furedi.et. al. [44], whereas it was in
contrast to the investigations for production of SLN with cetyl palmitate as the solid lipid
where particle size and PDI was observed to be increased with increase in pressure [45].

Chapter 4 Results & Discussions
119997290052 / Gujarat Technological University Page 121
(a) (b)
(c) (d)
(e)
FIGURE 4.22: Contour plots, 3D surface plots and overlay plot for process variables (a)
Contour plot for particle size (b) 3D Surface plot of Particle Size (c) Contour plot for
PDI (d) 3D Surface plot of PDI (e) Overlay plot for optimization

Chapter 4 Results & Discussions
119997290052 / Gujarat Technological University Page 122
4.5.1 Experimental validation of design space
(For process variables during high pressure homogenization)
The multidimensional combination and interaction of input variables and process parameters
that have been demonstrated to provide assurance of quality is termed as the design space
[24]. Design space could be determined from the common region of successful operating
ranges for the two responses and is depicted with the yellow region in the overlay plot
[Figure 4.22(e)]. Experimental validation of DoE trials was undertaken by preparation and
characterization of nanoparticles at the check point batch suggested by software. The
observed values (Particle size 259.7 nm and PDI 0.220) were in close agreement with the
predicted values (Particle size 267.274 nm and PDI 0.263276) and established the reliability
of the optimization procedure. For further reduction in particle size, the effect of sonication
was also investigated and sonication time and amplitude were optimized. The experiments
were carried out at three amplitudes for three time durations (data not shown). No significant
effect was observed with change in amplitude. Particle size was found to reduce with
increase in sonication time but PDI was increased with increased time. Homogenization
followed by ultrasonication is reported to be suitable method to produce SLN of 60–380 nm
size ranges [46].
4.6 Optimization of Formulation Variables
For the optimization of the formulation variables, %Drug w.r.t. lipid (Drug : Lipid) and
concentration of emulsifier were selected as independent variables, each at three levels.
Particle size, PDI and drug entrapment were selected as dependent variables (responses).
The coded and actual values of the three levels independent variables are shown in Table
4.24. The effect of these independent variables on dependable variables was studied using
32 factorial design and Design Expert 9.0.3.1 software (Stat-Ease, Inc., USA). A total of 11
experiments were designed by the software with 2 centre points. Experiments were run in
random order to increase the predictability of the model. . Full factorial design used for
optimization of formulation variables is shown in Table 4.25.

Chapter 4 Results & Discussions
119997290052 / Gujarat Technological University Page 123
TABLE 4.24: Coded and Actual values of independent variables of formulation
optimization
Independent variables
Levels (Three)
Low (-1)
Medium (0) High (+1)
% Drug w.r.t Lipid
(Drug: Lipid)
4%
(1:25)
7%
(1:14)
10%
(1:10)
Concentration of emulsifier
0.5%
1.0%
1.5%
TABLE 4.25: Full factorial design with coded and actual values used for optimization
of formulation variables (Independent variable: Amount of drug with respect to lipid
and concentration of surfactant; Dependent Variable: Particle size, Polydispersity
index-PDI and entrapment efficiency - EE)
S.
No.
Batch
No.
Coded Values Actual Values Particle
size
(nm)
PDI EE
(%) Amt of
drug
w.r.t
lipid
(%)
Conc.
of
surfactant
(%)
Amt
of drug
wrt
lipid
(%)
Conc.
of
surfactant
(%)
1 ODS01 -1 -1 4 0.5 259.3 0.250 54.4
2 ODS02 0 -1 7 0.5 246.1 0.247 62.0
3 ODS03 1 -1 10 0.5 194.9 0.306 68.5
4 ODS04 -1 0 4 1.0 175.8 0.172 51.2
5 ODS05 0 0 7 1.0 126.3 0.187 60.5
6 ODS06 1 0 10 1.0 106.3 0.18 66.3
7 ODS07 -1 1 4 1.5 197.4 0.187 34.5
8 ODS08 0 1 7 1.5 191.8 0.214 50.8
9 ODS09 1 1 10 1.5 159.6 0.218 67.2
10 ODS10 0 0 7 1.0 124.5 0.204 62.0
11 ODS11 0 0 7 1.0 137.9 0.197 61.5

Chapter 4 Results & Discussions
119997290052 / Gujarat Technological University Page 124
ANOVA was also applied to determine the significance and the magnitude of the effects of
the formulation variables and their interactions. ANOVA for Response 1 (Particle size),
Response 2 (PDI) and Response 3 (% Entrapment) are shown in Table 4.26.
TABLE 4.26(a): Response Surface Linear Model for Particle size (p < 0.0001)
Response 1 - PS (Particle Size)
ANOVA for Response Surface Linear Model
Analysis of Variance table (Partial sum of squares - Type III)
Source Sum of
Squares
df Mean
Square
F value P-value
Prob > F
Model 19114.42 2 9557.21 73.31 <0.0001 significant
A-A 4913.48 1 4913.48 37.69 0.0003 significant
B-B 14200.94 1 14200.94 108.93 <0.0001 significant
Residual 1042.95 8 130.37 - - -
Lack of Fit 1024.26 6 170.71 18.27 0.0528 Not significant
Pure Error 18.69 2 9.34 - - -
Cor Total 20157.37 10 - - - -
TABLE 4.26(b): Response Surface Linear Model for PDI (p = 0.0007)
Response 2- PDI (Poly Dispersity Index)
ANOVA for Response Surface Linear Model
Analysis of Variance table (Partial sum of squares - Type III)
Source Sum of
Squares
df Mean
Square
F
value
P-value
Prob > F
Model 0.013 2 6.560E-003 20.94 0.0007 Significant
A-Amt. of drug 1.504E-003 1 1.504E-003 4.80 0.0598 Non significant
B-Conc. of surf. 0.012 1 0.012 37.08 0.0003 Significant
Residual 2.506E-003 8 3.133E-004 - - -
Lack of Fit 2.360E-003 6 3.933E-004 5.39 0.1648 Not significant
Pure Error 1.460E-004 2 7.300E-005 - - -
Cor Total 0.016 10 - - - -

Chapter 4 Results & Discussions
119997290052 / Gujarat Technological University Page 125
TABLE 4.26(c): Response Surface Quadratic Model for % Entrapment (p = 0.0007)
Response 3 - EE (Entrapment Efficiency)
ANOVA for Response Surface Quadratic Model
Analysis of Variance table (Partial sum of squares - Type III)
Source Sum of
Squares
df Mean
Square
F value P-value
Prob > F
Model 949.81 5 189.96 34.80 0.0007 Significant
A- Amt. of drug 638.60 1 638.60 115.32 0.0001 Significant
B-Conc. of surf. 174.96 1 174.96 31.59 0.0025 Significant
AB 86.49 1 86.49 15.62 0.0108 Significant
A2 4.65 1 4.65 0.84 0.4014 Significant
B2 34.78 1 34.78 6.28 0.0541 Not significant
Residual 27.69 5 5.54 - - -
Lack of Fit 26.52 3 8.84 15.16 0.0625 Not significant
Pure Error 1.17 2 0.58 - - -
Cor Total 977.50 10 - - - -
As observed from Table 4.19, the Model F-value of 73.31 for Response 1 (PS), 20.94 for
Response 2 (PDI) and 34.80 for Response 3 (EE) implies the models are significant. Linear
models were obtained for Particle size and PDI, while quadratic model showed the best fit for
entrapment efficiency. There is only a 0.01% chance that a "Model F-Value" for Response 1
and 0.07% for Response 2 and 3 could occur due to noise. P-values less than 0.0500 indicate
model terms are significant.
Polynomial equation for Particle size in terms of coded Factors
PS = +186.35 - 28.62*A - 48.65*B
Final equation for PDI in terms of coded Factors
PDI = +0.21 + 0.016* A -0.044* B

Chapter 4 Results & Discussions
119997290052 / Gujarat Technological University Page 126
Polynomial equation for EE in terms of coded factors
EE = +60.84 + 10.32* A - 5.40* B +4.65* AB -1.36* A2 - 3.71* B2
The contour plots and 3D Surface plots for particle size, PDI and % entrapment are shown in
Figure 4.23. It can be observed that particle size was found to reduce with increase in drug:
lipid ratio and increase of concentration of surfactant. The results were found in agreement
with the reported observations [42]. The reason may be that with increased drug: lipid ratio
(decreased lipid content), less surface area of the lipid with high surface tension would have
been exposed which could be easily reduced with less surfactant amount. The excess
surfactant may be utilized for further reducing the surface tension due to creation of increased
surface area due to reduction of particle size. PDI was also observed to reduce with
increase in surfactant concentration. This may be because high concentrations of the
surfactant would have reduced the surface tension and facilitated the particle partition during
homogenization. The increase of the surface area during HPH occurs very rapidly due to
reduction in size. The process of a primary coverage of the new surfaces competes with the
agglomeration of uncovered lipid surfaces [27, 42].

Chapter 4 Results & Discussions
119997290052 / Gujarat Technological University Page 127
(a) (b)
(c) (d)
(e) (f) FIGURE 4.23: Contour plots and 3D surface plots for formulation variables (a) Contour plot for particle
size (b) 3D Surface plot of Particle Size (c) Contour plot for PDI (d) 3D Surface plot of PDI (e) Contour
plot entrapment efficiency (f) 3D Surface plot of entrapment efficiency.
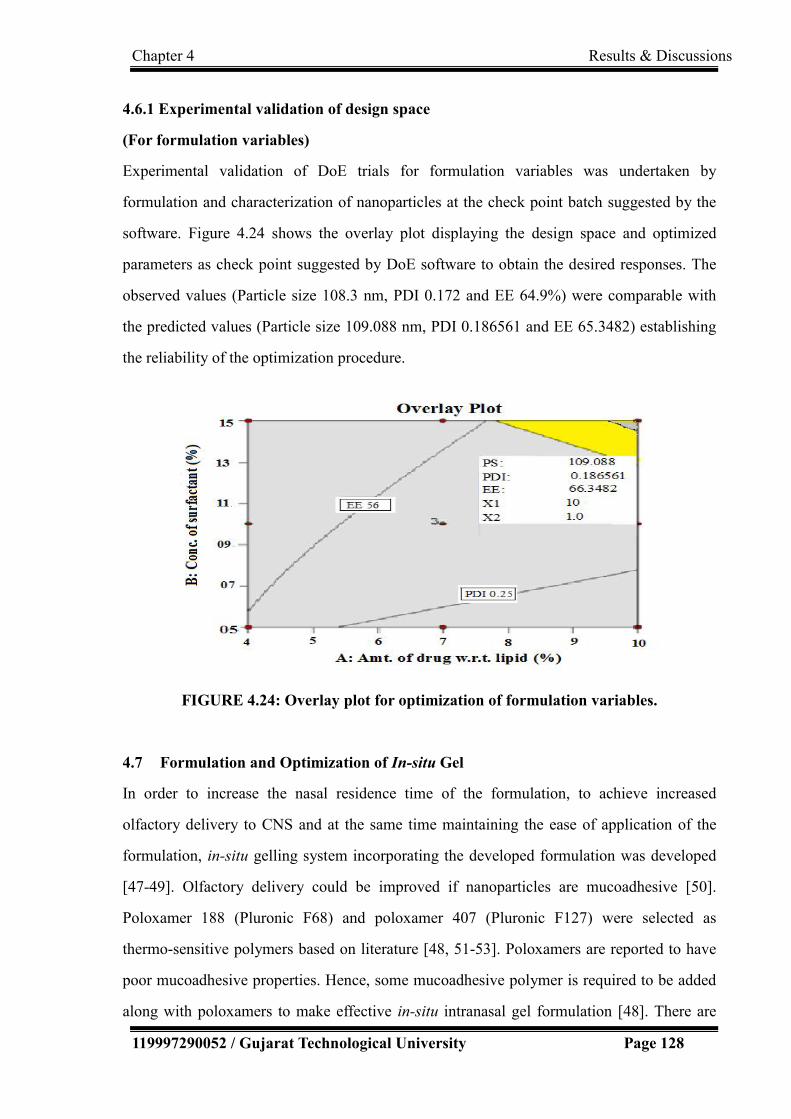
Chapter 4 Results & Discussions
119997290052 / Gujarat Technological University Page 128
4.6.1 Experimental validation of design space
(For formulation variables)
Experimental validation of DoE trials for formulation variables was undertaken by
formulation and characterization of nanoparticles at the check point batch suggested by the
software. Figure 4.24 shows the overlay plot displaying the design space and optimized
parameters as check point suggested by DoE software to obtain the desired responses. The
observed values (Particle size 108.3 nm, PDI 0.172 and EE 64.9%) were comparable with
the predicted values (Particle size 109.088 nm, PDI 0.186561 and EE 65.3482) establishing
the reliability of the optimization procedure.
FIGURE 4.24: Overlay plot for optimization of formulation variables.
4.7 Formulation and Optimization of In-situ Gel
In order to increase the nasal residence time of the formulation, to achieve increased
olfactory delivery to CNS and at the same time maintaining the ease of application of the
formulation, in-situ gelling system incorporating the developed formulation was developed
[47-49]. Olfactory delivery could be improved if nanoparticles are mucoadhesive [50].
Poloxamer 188 (Pluronic F68) and poloxamer 407 (Pluronic F127) were selected as
thermo-sensitive polymers based on literature [48, 51-53]. Poloxamers are reported to have
poor mucoadhesive properties. Hence, some mucoadhesive polymer is required to be added
along with poloxamers to make effective in-situ intranasal gel formulation [48]. There are

Chapter 4 Results & Discussions
119997290052 / Gujarat Technological University Page 129
various agents used for gelling and for mucoadhesive properties like chitosan, lectin,
carbopol, etc. Chitosan is one of the naturally occurring biodegradable, biocompatible
polysaccharide which is widely investigated and reported to significantly improve the CNS
delivery of drug through intranasal route [50, 54, 55]. In the present investigations, different
gelling and mucoadhesive agents were screened based on their gelling properties with SLN
dispersion. Various trials conducted are shown in Table 4.27. Since proper gel formulation
was not achieved with chitosan at nasal pH of 6.4 even on heating, carbopol 934P was
selected as gelling/ mucoadhesive agent. No significant incompatibility was observed
between drug and the selected excipients as observed with IR spectra of pure drug efavirenz,
and the physical mixtures of efavirenz, tripalmitin, poloxamer 188, poloxamer 407 and
carbopol 934P (shown in Figure 4.25).
TABLE 4.27 Different trials for selection of gelling/ mucoadhesive agent
S.
No.
Trials Observations
1 100 mg chitosan + 10 ml water Magnetic stirring Insoluble
2 100 mg chitosan + 10 ml water –heat--Mag. stirring No proper gel
3 100 mg chitosan+10ml warm water(400C) Mag. stirring Hydrated, lump
formation
4 100 mg chitosan + Buffer pH 6.4 Magnetic stirring Insoluble
5 100mg chitosan+BufferpH6.4–heat--Magnetic stirring Insoluble
6 (100 mg chitosan+ 5 ml water) + (150 mg Pluronic F68 + 5
ml water) Magnetic stirring
Insoluble
7 (100 mg chitosan + 5 ml water) + (150 mg Pluronic F68 + 5
ml water) –heat--Magnetic stirring
No proper gel
8 50 mg chitosan + 5 ml SLN dispersion Mag. stirring No proper gel
9 100 mg chitosan + 10 ml 0.1 M HCl Mag. stirring Soluble/gelling
10 Acidic aqueous solution of chitosan + Buffer pH 6.4 Soluble
/ slight gelling
11 Carbopol 934P + water Mag. Stirring Gel formation
12 Carbopol 934P + SLN dispersion Mag. stirring Gel formation

Chapter 4 Results & Discussions
119997290052 / Gujarat Technological University Page 130
(a)
(b)
FIGURE 4.25: IR spectra of drug and physical mixture of drug and excipients. (a) IR
spectrum of drug (Efavirenz) (b) IR spectrum of physical mixture of drug and
excipients (Efavirenz + Tripalmitin + Poloxamer 188 + Poloxamer 407 + Carbopol
934P)
Ratio of poloxamer 188 and poloxamer 407 were optimized (1:2) based on their gelling
behaviour at different temperatures as shown in Table 4.28. The concentration of carbopol
934P selected as gelling/ mucoadhesive was optimized to be 0.4% w/v in the presence of
selected thermosensitive polymers as observed from Table 4.29.

Chapter 4 Results & Discussions
119997290052 / Gujarat Technological University Page 131
TABLE 4.28: Optimization of ratio of poloxamer 188 and poloxamer 407 for gelling
behaviour (- : Absence of gelling behaviour, + : slight gelling, ++ : Moderate gelling,
+++: Considerable gelling)
S.No.
Pluronic F68:
Pluronic F407
Gelling behavior at
300C 320C 340C 360C 380C 400C
1 1:1 - - + + + ++
2 1:2 - + + + ++ +++
3 2:1 - - + + + ++
TABLE 4.29: Gelling behaviour of SLN dispersion containing thermoresponsive
polymers at different concentrations of Carbopol 934P
S. No. Conc. of Carpool
934 P (%w/v)
Temp (0C) Gelling behavior
1 0.1 RT(290C) to 400C + Slight
2 0.2 RT(290C) to 400C ++ Moderate
3 0.3 RT(290C) to 400C +++ Considerable
4 0.4 RT(290C) to 400C ++++ Acceptable
5 0.5 RT(290C) to 400C +++++ High
Hence, the optimized formulation variables are as follows
Amount of drug w.r.t lipid : 10% w/w (Drug: lipid =1:10 )
Conc. of surfactant: 1.0% w/v
Gelling agent:
Pluronic F68 : 1% w/v (Thermo-sensitive polymer)
Pluronic F127: 2%w/v (Thermo-sensitive polymer)
Carbopol 934P: 0.4% w/v (Mucoadhesive)

Chapter 4 Results & Discussions
119997290052 / Gujarat Technological University Page 132
4.8 Evaluation of optimized formulation
4.8.1 Particle size, Polydispersity index (PDI), Zeta potential and Entrapment
efficiency:
The average particle size, PDI, zeta potential and entrapment efficiency of the solid lipid
nanoparticles, determined using Malvern Zetasizer Nanoseries Nano-ZS was found to be
108.3 nm, 0.172, -21.2 mV and 64.9% respectively as shown in Figure 4.26. Most SLN
dispersions produced by high pressure homogenization (HPH) are characterized by an
average particle size below 500 nm and low microparticle content. The attainable particle
size is especially dependent on the composition and concentration of lipid and emulsifier
[42]. As per reported observations, optimum size (224.8–266.3 nm) was achieved for
Clozapine loaded SLN with different lipids including tripalmitin and 1% poloxamer
concentration [31], 241 nm for dihydroartemisinin loaded solid lipid nanoparticles when
formulated by single-emulsion solvent evaporation technique [56]. Particles of 200 nm were
obtained with polyhydroxy surfactants [42], nanoparticles in the range of 180 – 190 nm were
achieved with cetyl palmitate as lipid and are reported to be suitable for targeting to brain
[57, 58], size of upto 140 nm was achieved for cetyl palmitate SLN when the formulation of
lipid nanoparticles were optimized with the aid of a computer generated experimental design
[57]. In general, Z-average size of 20-500 nm are reported depending on the drug, lipid,
surfactants and the formulation technique used [31, 48].
Average particle size of less than 110 nm indicated the suitability of the formulation for
administration through various routes with the potential of increased permeability and thus
enhanced bioavailability of the poorly soluble drug efavirenz. Low PDI value (< 0.2)
indicated the narrow distribution of size (monodispersity) and stability of the formulation
was indicated by the zeta potential value (-21.2 mV).

Chapter 4 Results & Discussions
119997290052 / Gujarat Technological University Page 133
FIGURE 4.26: Size distribution and zeta potential distribution of optimized Efavirenz
nanoparticles

Chapter 4 Results & Discussions
119997290052 / Gujarat Technological University Page 134
Zeta potential is an important physicochemical parameter that influences the stability of
nanosuspensions. Extremely positive or negative zeta potential values cause larger repulsive
forces, whereas repulsion between particles with similar electric charge prevents aggregation
of the particles and thus ensures easy redispersion. In the case of a combined electrostatic
and steric stabilization achieved by large molecule weight stabilizers, a minimum zeta
potential of ± 20 mV is desirable [59].
4.8.2 Evaluation of SLN based in-situ gel
4.8.2.1 Gelation temperature / Sol–gel transition temperature (Tsol-gel):
The gelation temperature determined with 2 ml of the sample taken in a glass vial and
placed on a magnetic stirrer with heating arrangement was found to be 340C. The mean nasal
mucosal temperature ranges from 30.2±1.70C to 34.4± 1.1 0C. Most of the thermo-reversible
gels prepared and reported so far have gelation temperature ranging from 32 to 34 0C [60].
4.8.2.2 Gelation time:
The time required for complete gelation at 340C was found to be less than 1 minute. The
gelation within a minute at nasal mucosal temperature ensures the prevention of flow of the
formulation when administered and increase the residence time [51].
4.8.2.3 pH:
The pH of the formulation was determined to be 6.0 which indicated non-irritancy of the
formulation owing to the pH similar to that of nasal mucosal secretions. The pH of the nasal
mucosal secretions ranges from 5.5 to 6.5 in adults and 5.0 to 6.7 in children [61].
4.8.2.4 Viscosity:
Viscosity of the formulation is important since higher the viscosity of the formulation (after
in-situ gelling on administration at nasal temperature), greater will be the contact time which
increases the time for absorption. At the same time, highly viscous formulations may
interfere with the normal functions like mucociliary clearance, etc [62]. Viscosity of the
formulation was determined to be 19,000 cps at 250C (ambient temperature) and 24,500 cps
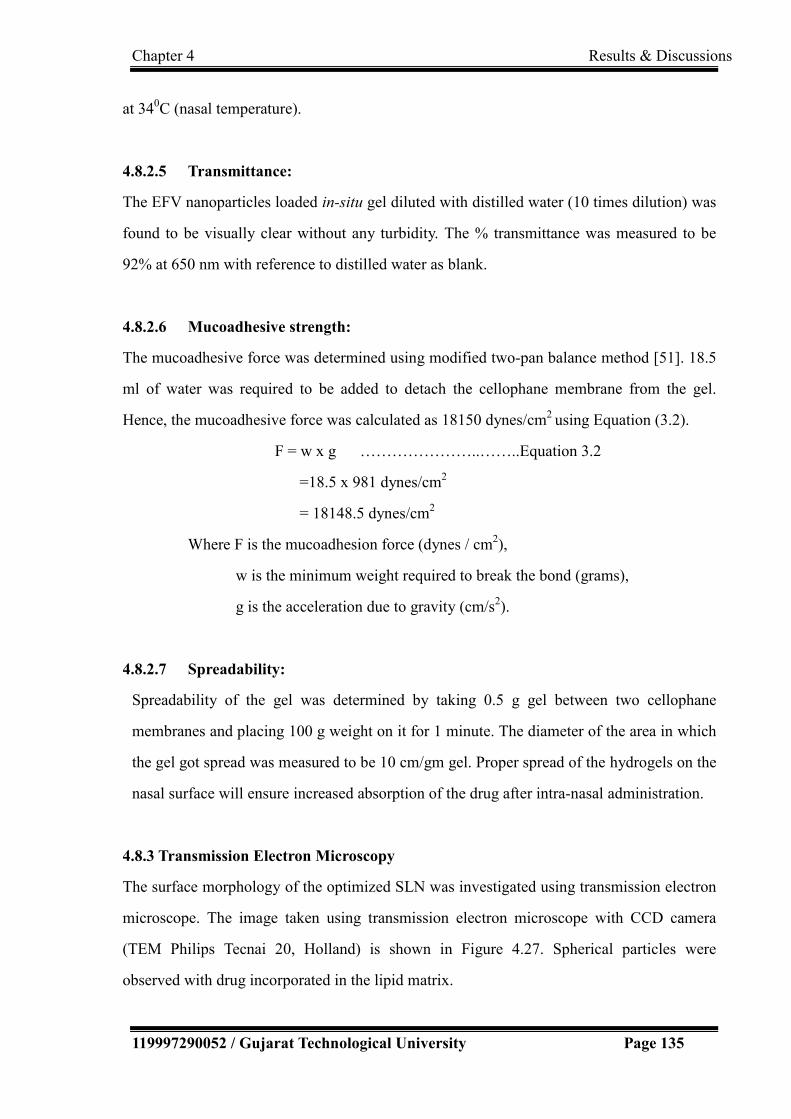
Chapter 4 Results & Discussions
119997290052 / Gujarat Technological University Page 135
at 340C (nasal temperature).
4.8.2.5 Transmittance:
The EFV nanoparticles loaded in-situ gel diluted with distilled water (10 times dilution) was
found to be visually clear without any turbidity. The % transmittance was measured to be
92% at 650 nm with reference to distilled water as blank.
4.8.2.6 Mucoadhesive strength:
The mucoadhesive force was determined using modified two-pan balance method [51]. 18.5
ml of water was required to be added to detach the cellophane membrane from the gel.
Hence, the mucoadhesive force was calculated as 18150 dynes/cm2 using Equation (3.2).
F = w x g …………………..……..Equation 3.2
=18.5 x 981 dynes/cm2
= 18148.5 dynes/cm2
Where F is the mucoadhesion force (dynes / cm2),
w is the minimum weight required to break the bond (grams),
g is the acceleration due to gravity (cm/s2).
4.8.2.7 Spreadability:
Spreadability of the gel was determined by taking 0.5 g gel between two cellophane
membranes and placing 100 g weight on it for 1 minute. The diameter of the area in which
the gel got spread was measured to be 10 cm/gm gel. Proper spread of the hydrogels on the
nasal surface will ensure increased absorption of the drug after intra-nasal administration.
4.8.3 Transmission Electron Microscopy
The surface morphology of the optimized SLN was investigated using transmission electron
microscope. The image taken using transmission electron microscope with CCD camera
(TEM Philips Tecnai 20, Holland) is shown in Figure 4.27. Spherical particles were
observed with drug incorporated in the lipid matrix.

Chapter 4 Results & Discussions
119997290052 / Gujarat Technological University Page 136
FIGURE 4.27: Transmission Electron Microscopic image of Efavirenz nanoparticles
obtained using transmission electron microscope with CCD camera (TEM Philips
Tecnai 20, Holland).
4.8.4 Histopathological studies
Histopathological condition of nasal mucosa after treatment with PBS pH 6.4 (negative
control), isopropyl alcohol (positive control) and developed formulations are shown in
Figure 4.28.
(a) (b) (c) (d)
FIGURE 4.28: Histopathological conditions of nasal mucosa after treatment with (a)
Phosphate buffer saline - PBS pH 6.4 (b) SLN dispersion (c) SLN gel (d) Isopropyl
alcohol

Chapter 4 Results & Discussions
119997290052 / Gujarat Technological University Page 137
No significant damage /harmful effects on the microscopic structure of the nasal mucosa
treated with SLN formulation was observed in comparison to that of sample treated with
isopropyl alcohol indicating the safety of the SLN formulations for nasal adminstration. This
was in accordance with the results obtained by Seju et al. [6]. Mucosa treated with isopropyl
alcohol showed heavy loss of epithelial cells
4.8.5 Drug Release Profile
4.8.5.1 In-vitro drug diffusion profile
In-vitro drug diffusion profiles of the SLN dispersion and EFV loaded SLN gel along with
the release profile of plain drug suspension (PDS) for comparison obtained by
dialysis-bag/dialysis-sac method and by using Franz diffusion cell method are shown in
Figure 4.29(a) and Figure 4.29(b) respectively.
FIGURE 4.29(a): In-vitro Drug Release Profile by dialysis-bag method (Different
letters indicate statistically significant difference relative to plain drug suspension; a
indicate p < 0.01 and b indicate p < 0.05)
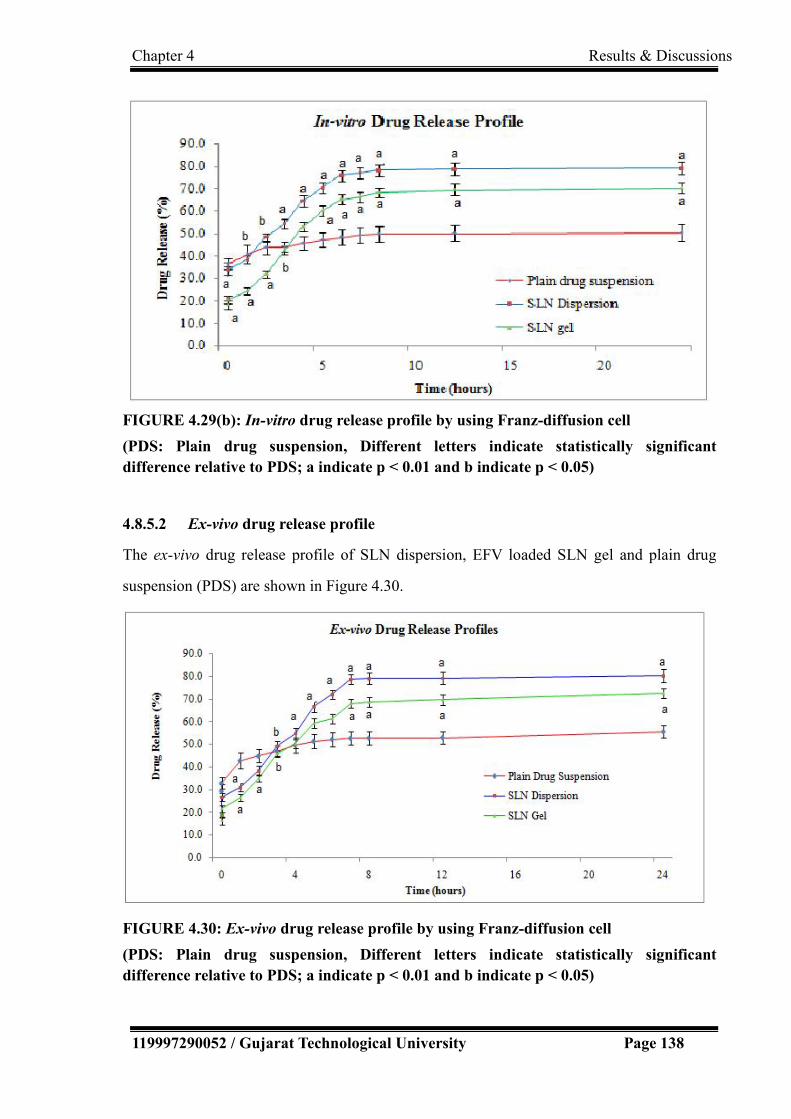
Chapter 4 Results & Discussions
119997290052 / Gujarat Technological University Page 138
FIGURE 4.29(b): In-vitro drug release profile by using Franz-diffusion cell
(PDS: Plain drug suspension, Different letters indicate statistically significant
difference relative to PDS; a indicate p < 0.01 and b indicate p < 0.05)
4.8.5.2 Ex-vivo drug release profile
The ex-vivo drug release profile of SLN dispersion, EFV loaded SLN gel and plain drug
suspension (PDS) are shown in Figure 4.30.
FIGURE 4.30: Ex-vivo drug release profile by using Franz-diffusion cell
(PDS: Plain drug suspension, Different letters indicate statistically significant
difference relative to PDS; a indicate p < 0.01 and b indicate p < 0.05)

Chapter 4 Results & Discussions
119997290052 / Gujarat Technological University Page 139
The release of drug from the SLN dispersion was found to be more consistent in comparison
to the release from plain drug suspension. It showed initial burst release followed by a
prolonged release in accordance with investigations by other researchers [63]. More than
80% drug release was observed in 24 hours with SLN formulations with considerable
amount of release achieved within 8 hours in comparison to the drug release of less than
65% in 24 hours with plain drug suspension. The small size of nanoparticles and the presence
of surfactant in the developed formulation may have improved the permeability, wetting,
solubilization and the dissolution of the soluble surfactants to form pores in the matrix may
have played the role for consistent and enhanced release of the drug from nanoparticulate
formulations. Similar results are also observed and reported that nano-sized drug delivery
systems can enhance nose-to-brain delivery of drugs compared to equivalent drug solutions
formulations [7, 48, 64]. Protection of the drug from degradation and/or efflux back into the
nasal cavity may partly be the reason for this effect of nanoparticles [65].
4.8.5.3 Kinetics of drug release/ Pharmacokinetic modeling
In order to examine the release mechanism of EFV from the prepared SLN dispersion and the
EFV loaded SLN gel, the results of the ex-vivo release studies were examined according to
various equations for pharmacokinetic modeling. Figures 4.31(a), 4.31(b), 4.31(c), 4.31(d)
and 4.31(e) depicts graphs for various mathematical model fitting.
Zero order release:
0.0
10.0
20.0
30.0
40.0
50.0
60.0
70.0
80.0
90.0
1 2 3 4 5 6 7 8 9 10
Zero Order Kinetics
Time (hours)
Am
ou
nt
of
Dru
g R
elea
sed
(%
)
Plain Drug Suspension
SLN Dispersion
SLN Gel
FIGURE 4.31(a): Zero order release kinetics.

Chapter 4 Results & Discussions
119997290052 / Gujarat Technological University Page 140
First order release:
FIGURE 4.31(b): First order release kinetics.
Higuchi Model:
FIGURE 4.31(c): Higuchi Model of release kinetics.

Chapter 4 Results & Discussions
119997290052 / Gujarat Technological University Page 141
Hixon-crowell cube root model:
FIGURE 4.31(d): Hixon Crowel Model of release kinetics.
Korsemeyer and peppas model:
FIGURE 4.31(e): Korsemeyer and Pepppa’s Model of release kinetics

Chapter 4 Results & Discussions
119997290052 / Gujarat Technological University Page 142
The ex-vivo release studies data was fitted in to various mathematical models to
determine the best-fit model as shown in Table 4.30.
TABLE 4.30 The regression coefficients obtained from model fitting
MODEL
Linear Regression Coefficient (R2)
Plain Drug
Suspension
SLN Dispersion SLN in Gel
Zero-order 0.8402 0.9852 0.9873
First-order 0.8529 0.9624 0.9789
Higuchi 0.8137 0.9462 0.9497
Hixon-Crowel 0.7768 0.9161 0.9085
Korsmeyer and
Peppas
0.7576
Λ = 0.0211
0.8911
Λ =0.0567
0.8791
Λ =0.0580
The release of dug from SLN incoporated formulations best fits in the Zero order release
kinetics (R2 = 0.9936), indicating concentration independent diffusion controlled release
[66].
4.8.6 In-vivo studies
The concentration of the drug in plasma and brain were determined after intranasal
administration of the developed solid lipid nanoparticulate formulation (equivalent to 0.06
mg efavirenz) and were compared with the concentration of the drug achieved in plasma and
brain with the oral administration of the marketed formulation (25 mg powder from capsule
dispersed in 1 ml water). The ratio of drug concentration in brain to plasma of 15.61% was
achieved with the developed formulation in comparison to 0.104% observed with the oral
standard indicating the 150 times more brain targeting efficiency of the formulation through
intranasal route which may be because of direct nose to brain delivery achieved through
integrated olfactory and trigeminal route. The drastic reduction in brain to plasma drug
concentration with oral route may be due to first-pass effect, drug degradation in GIT and
presence of BBB. The bioavailable fraction of the drug was calculated to be 0.2454 with the

Chapter 4 Results & Discussions
119997290052 / Gujarat Technological University Page 143
developed formulation while it was found to be 0.0035 with the standard. Relative
bioavailabilty was determined to be 70.11 with the developed formulation indicating 70
times better absorption potential of the efavirenz loaded SLN dispersion in comparison to
the orally administered drug powder. This may be attributable to systemic absorption of some
amount of drug when administered intranasally. This may be higher in comparison to the
orally administered drug due to avoidance of first pass metabolism, degradation of drug in
GIT, etc. The results were found to be in accordance with the similar investigations with
different drugs for brain targeting [48].
4.8.7 Stability Studies
The stability of the formulation was assessed under different storage conditions as per ICH
guidelines and the results obtained are as shown in Table 4.31.
TABLE 4.31: Stability study data for the formulation at initial, after 0.5, 1, 2, 3, 6 and
12 months {*Data expressed as mean ± SD (n = 3)}
Temp
(0C)/
RH
(%)
Time
(months) Appearance
Particle size*
(nm) PDI*
Zeta
Potential*
(mV)
Drug
content
(mg/ml)
5°C ±
3°C
0
Transparent
with slight
bluish
108.5 + 2.1 0.172 + 0.003 -21.2 + 1.9
0.25
0.5 No significant
Change 109.2 + 1.9 0.175 + 0.007 -21.1 + 2.0
0.25
1 No significant
Change 109.9 + 2.0 0.181 + 0.009 -20.9 + 1.5
0.25
2 No significant
Change 110.3 + 1.8 0.186 + 0.009 -20.8 + 1.2
0.25
3 No significant
Change 110.5 + 2.3 0.190 + 0.011 -19.7 + 2.0
0.25
6 No significant
Change 112.3 + 2.8 0.195 + 0.015 -18.5 + 1.8
0.25
12 No significant
change 116.2 + 2.2 0.201 + 0.015 -18.9 + 1.7
0.25

Chapter 4 Results & Discussions
119997290052 / Gujarat Technological University Page 144
25°C ±
2°C/60%
RH ± 5%
RH
0
Transparent
with slight
bluish
108.5 + 2.1 0.172 + 0.003 -21.2 + 1.9
0.25
0.5 No significant
Change 106.5 + 3.2 0.169 + 0.004 -20.0 + 1.8
0.25
1 No significant
Change 109.5 + 3.5 0.180 + 0.008 -19.9 + 2.0
0.25
2 No significant
Change 111.4 + 3.7 0.197 + 0.009 -18.2 +2.2
0.25
3 No significant
Change 112.9 + 2.9 0.205 + 0.013 -17.5 + 1.7
0.25
6 No significant
Change 118.3 + 2.7 0.209 + 0.016 -17.0 + 1.5
0.25
12 No significant
change 125.5 + 2.7 0.305 + 0.016 -16.7+ 0.01
0.24
The developed formulations were found to be stable for 12 months at 5±3◦C and 25 ± 2◦C/60
± 5% RH. No change in the physical appearance of the formulation was observed during the
stability studies. No significant change in the Z-average size, PDI and zeta potential were
observed during the stability studies when analysed using student’s t-test. Thus it can be
concluded that efavirenz SLN were stable at long term stability conditions (5±3◦C) as well
as accelerated conditions (25 ± 2◦C/60 ± 5% RH) for 12 months [64, 67, 68].
4.9 References:
1. World Health Organization, (2005). International pharmacopoeia monograph on
efavirenz.2005:5-8.
2. USP Medicines Compendium, Monograph. Efavirenz Final Authorized Version 2.0.
[Online]. Available: https://mc.usp.org/monographs/efavirenz-2-0. [Accessed 16
November, 2016]
3. Robert M. Silverstein, Francis X. Webster, David J. Kiemle DLB., (2014).
Spectrometric Identification of Organic Compounds. 8th ed. Wiley Publisher.
4. Kumar YA, Rao NR., (2010). Development of Rapid UV Spectrophotometric Method
for the Estimation of Efavirenz in Formulations. E-Journal Chem.;7(3):856-860.
5. Kadam AA, Babu CJG, Permal RV, Channabasavaraj K, Mani TT., (2012).

Chapter 4 Results & Discussions
119997290052 / Gujarat Technological University Page 145
Development and Validation of Method for the Quantitative Estimation of
Efavirenz in Bulk and Phrmaceutical Dosage Form. Am J PharmTech
Res.;2(1):324-330.
6. Seju U, Kumar A, Sawant KK., (2011). Development and evaluation of
olanzapine-loaded PLGA nanoparticles for nose-to-brain delivery: In vitro and in
vivo studies. Acta Biomater.;7(12):4169-4176.
7. Sharma D, Maheshwari D, Philip G, et al., (2014). Formulation and optimization of
polymeric nanoparticles for intranasal delivery of Lorazepam using box-behnken
design: in vitro and in vivo evaluation. Biomed Res Int. 2014;2014:156010.
8. Kamble RN, Mehta P., (2015). Development of simple HPLC method to estimate the
blood plasma concentration of Efavirenz in rat after oral administration, Innovare
Academic Sciences, Int. J Pharm & Pharm. Sci.;7(7):7-10.
9. Heydari R, Rashidipour M, Naleini N., (2014). Determination of efavirenz in plasma
by dispersive liquid-liquid microextraction coupled to high-performance liquid
chromatography. Curr Anal Chem.10(2):280-287.
10. Lakshmi Sailaja , Kishore Kumar K, Ravi Kumar DVR, Mohan Kumar C, Yugandhar
NM, Srinubabu G., (2007). Development and Validation of a Liquid
Chromatographic Method for Determination of Efavirenz in Human Plasma.
Chromatographia.;65(5-6):359-361.
11. Saras-Nacenta M, López-Púa Y, Lípez-Cortés LF, Mallolas J, Gatell JM, Carné X.,
(2001). Determination of efavirenz in human plasma by high-performance liquid
chromatography with ultraviolet detection. J Chromatogr B Biomed Sci
Appl.;763(1-2):53-59.
12. Langmann P, Schirmer D, Väth T, Zilly M, Klinker H, (2001). High-performance
liquid chromatographic method for the determination of HIV-1 non-nucleoside
reverse transcriptase inhibitor efavirenz in plasma of patients during highly active
antiretroviral therapy. J Chromatogr B Biomed Sci Appl.;755:151-156.
13. ICH. ICH Topic Q2 (R1) Validation of Analytical Procedures : Text and Methodology.
Int Conf Harmon. 2005;1994(November 1996):17.

Chapter 4 Results & Discussions
119997290052 / Gujarat Technological University Page 146
14. Ramachandran G, Kumar a. KH, Swaminathan S, Venkatesan P, Kumaraswami V,
Greenblatt DJ., (2006). Simple and rapid liquid chromatography method for
determination of efavirenz in plasma. J Chromatogr B Anal Technol Biomed Life
Sci. ;835(2):131-135.
15. Veldkamp I, van Heeswijk RP, Meenhorst PL, et al., (1999). Quantitative
determination of efavirenz (DMP 266), a novel non-nucleoside reverse
transcriptase inhibitor, in human plasma using isocratic reversed-phase
high-performance liquid chromatography with ultraviolet detection. J Chromatogr
B Biomed Sci Appl. ;734(1):55-61.
16. Ramaswamy A, Arul Gnana Dhas AS., (2014). Development and validation of
analytical method for quantitation of Emtricitabine, Tenofovir, Efavirenz based on
HPLC. Arab J Chem. 2014.
17. WHO. Safety of Efavirenz. 2010. [Online]. Available:
http://www.who.int/hiv/topics/treatment/efavirenz_safety_review.pdf. [Accessed 12
November, 2015]
18. Kappelhoff BS, Rosing H, Huitema AD., Beijnen JH., (2003). Simple and rapid
method for the simultaneous determination of the non-nucleoside reverse
transcriptase inhibitors efavirenz and nevirapine in human plasma using liquid
chromatography. J Chromatogr B.;792(2):353-362.
19. Honary S, Zahir F., (2013). Effect of zeta potential on the properties of nano-drug
delivery systems - A review (Part 1). Trop J Pharm Res.;12(2):255-264.
20. ICH Expert Working Group. Pharmaceutical Development Q8. ICH Harmon Tripart
Guidel. 2009;8(August):1-28.
21. Fisher SRA, JMP® 8 Design of Experiments Guide, Second Edition. Cary, NC: SAS
Institute Inc. ,1965.
22. Journals H, Article R, Parameters P, Kakodkar SSS, Gajare P. Pharmaceutical
Quality-by-Design ( QbD ): Basic Principles. 2015;(1):1-19.
23. Pawar YB, Purohit H, Valicherla GR, et al., (2012). Novel lipid based oral formulation
of curcumin: Development and optimization by design of experiments approach.
Int J Pharm.;436(1-2):617-623.
Chapter 4 Results & Discussions
119997290052 / Gujarat Technological University Page 147
24. Sood S, Jain K, Gowthamarajan K., (2014). Optimization of curcumin nanoemulsion
for intranasal delivery using design of experiment and its toxicity assessment.
Colloids Surfaces B Biointerfaces.;113:330-337.
25. Xu X, Al-Ghabeish M, Rahman Z, et al., (2015). Formulation and process factors
influencing product quality and in vitro performance of ophthalmic ointments. Int J
Pharm.;493(1-2):412-425.
26. Ćurić A, Keller B-L, Reul R, Möschwitzer J, Fricker G., (2015). Development and
lyophilization of itraconazole loaded poly(butylcyanoacrylate) nanospheres as a drug
delivery system. Eur J Pharm Sci.;78:121-131.
27. Kaur IP, Bhandari R, Bhandari S, Kakkar V., (2008). Potential of solid lipid
nanoparticles in brain targeting. J Control Release.;127(2):97-109.
28. Kumar S, Randhawa JK., (2013). High melting lipid based approach for drug delivery:
Solid lipid nanoparticles. Mater Sci Eng C.;33(4):1842-1852.
29. Gupta S, Chavhan S, Sawant KK., (2011). Self-nanoemulsifying drug delivery system
for adefovir dipivoxil: Design, characterization, in vitro and ex vivo evaluation.
Colloids Surfaces A Physicochem Eng Asp.;392(1):145-155.
30. Pouton CW, Porter CJH., (2008). Formulation of lipid-based delivery systems for oral
administration: Materials, methods and strategies. Adv Drug Deliv
Rev. ;60(6):625-637.
31. Venkateswarlu V, Manjunath K., (2004). Preparation, characterization and in vitro
release kinetics of clozapine solid lipid nanoparticles. J Control
Release.;95(3):627-638.
32. Kuo Y, Su F., (2007). Transport of stavudine , delavirdine , and saquinavir across the
blood – brain barrier by polybutylcyanoacrylate , and solid lipid
nanoparticles.;340:143-152.
33. Attama A, Momoh MA, Builders PF., (2012). Lipid Nanoparticulate Drug Delivery
Systems: A Revolution in Dosage Form Design and Development. Recent Adv Nov
Drug Carr Syst. 2012:107-140.
34. Blasi P, Giovagnoli S, Schoubben A, Ricci M, Rossi C., (2007). Solid lipid
nanoparticles for targeted brain drug delivery. Adv Drug Deliv Rev.;59(6):454-477.

Chapter 4 Results & Discussions
119997290052 / Gujarat Technological University Page 148
35. Chemical Products Corporation. (2012). GRAS Notice 000433: Generally Regarded
as Safe (GRAS) determination notification for Poloxamer Fatty Acid Formulations;
Poloxamer fatty acid esters: 1-36.
36. Corbau R, Mori J, Phillips C, et al., (2010). Lersivirine, a nonnucleoside reverse
transcriptase inhibitor with activity against drug-resistant human immunodeficiency
virus type 1. Antimicrob Agents Chemother.;54(10):4451-4463.
37. Mehnert W, Mäder K., (2012). Solid lipid nanoparticles. Adv Drug Deliv Rev.
2012;64:83-101.
38. Park JH, Ban SJ, Ahmed T, et al., (2015). Development of DH-I-180-3 loaded lipid
nanoparticle for photodynamic therapy. Int J Pharm. 2015;491(1-2):393-401.
39. Michael D. Triplett II BS., (2004). Enabling Solid Lipid Nanoparticle Drug Delivery
Technology. Doctor of Philosophy dissertation. The Ohio State University.
40. Mallipeddi R, Rohan LC., (2010). Progress in antiretroviral drug delivery using
nanotechnology. Int J Nanomedicine.;5(1):533-547.
41. Shegokar R, Singh KK, Müller RH., (2011). Production & stability of stavudine solid
lipid nanoparticles - From lab to industrial scale. Int J Pharm.;416(2):461-470.
42. Kovacevic A, Savic S, Vuleta G, Müller RH, Keck CM., (2011). Polyhydroxy
surfactants for the formulation of lipid nanoparticles (SLN and NLC): Effects on
size, physical stability and particle matrix structure. Int J Pharm.;406(1-2):163-172.
43. Gupta U, Jain NK., (2010). Non-polymeric nano-carriers in HIV/AIDS drug delivery
and targeting. Adv Drug Deliv Rev. ;62(4-5):478-490.
44. Füredi P, Kovács K, Ludányi K, Antal I, Klebovich I., (2016). Development and
characterization of voriconazole loaded nanoparticles for parenteral delivery. Int J
Pharm.;510(1):159-163.
45. Das Neves J, Amiji MM, Bahia MF, Sarmento B., (2010). Nanotechnology-based
systems for the treatment and prevention of HIV/AIDS. Adv Drug Deliv
Rev. ;62(4-5):458-477.
46. Severino P, Santana MH a, Souto EB., (2012). Optimizing SLN and NLC by 2 2 full
factorial design: Effect of homogenization technique. Mater Sci Eng

Chapter 4 Results & Discussions
119997290052 / Gujarat Technological University Page 149
C.;32(6):1375-1379.
47. Abdel Mouez M, Zaki NM, Mansour S, Geneidi AS., (2014). Bioavailability
enhancement of verapamil HCl via intranasal chitosan microspheres. Eur J Pharm
Sci.;51(1):59-66.
48. Ravi PR, Aditya N, Patil S, Cherian L., (2013). Nasal in-situ gels for delivery of
rasagiline mesylate: improvement in bioavailability and brain localization. Drug
Deliv. ;7544:1-8.
49. Zaki NM, Awad GAS, Mortada ND, Abd ElHady SS., (2006). Rapid-onset intranasal
delivery of metoclopramide hydrochloride. Part I. Influence of formulation
variables on drug absorption in anesthetized rats. Int J Pharm.;327(1-2):89-96.
50. Wong HL, Wu XY, Bendayan R., (2012). Nanotechnological advances for the delivery
of CNS therapeutics. Adv Drug Deliv Rev.;64(7):686-700.
51. Naik A, Nair H., (2014). Formulation and Evaluation of Thermosensitive Biogels for
Nose to Brain Delivery of Doxepin. 2014:1-10.
52. Lun H, Chattopadhyay N, Yu X, Bendayan R., (2010). Nanotechnology applications
for improved delivery of antiretroviral drugs to the brain. Adv Drug Deliv
Rev. ;62(4-5):503-517.
53. Date A a., Shibata A, Goede M, et al., (2012). Development and evaluation of a
thermosensitive vaginal gel containing raltegravir+efavirenz loaded nanoparticles
for HIV prophylaxis. Antiviral Res. 2;96(3):430-436.
54. Wang X, Chi N, Tang X., (2008). Preparation of estradiol chitosan nanoparticles for
improving nasal absorption and brain targeting. Eur J Pharm
Biopharm.;70(3):735-740.
55. Ding J, Na L, Mao S., (2012). Chitosan and its derivatives as the carrier for intranasal
drug delivery.;7(October):349-361.
56. Omwoyo WN, Melariri P, Gathirwa JW, et al., (2016). Development, characterization
and antimalarial efficacy of dihydroartemisinin loaded solid lipid nanoparticles.
Nanomedicine Nanotechnology, Biol Med.;12(3):801-809.
57. Blasi P, Giovagnoli S, Schoubben A, et al., (2011). Lipid nanoparticles for brain

Chapter 4 Results & Discussions
119997290052 / Gujarat Technological University Page 150
targeting I. Formulation optimization. Int J Pharm.;419(1-2):287-295.
58. Xia H, Gao X, Gu G, et al., (2011). Low molecular weight protamine-functionalized
nanoparticles for drug delivery to the brain after intranasal administration.
Biomaterials.;32(36):9888-9898.
59. Honary S, Zahir F., (2013). Effect of Zeta Potential on the Properties of Nano-Drug
Delivery Systems - A Review (Part 2). Trop J Pharm Res.;12(2):265-273.
60. Kumar A, Garg T, Sarma GS, Rath G, Goyal AK., (2015). Optimization of
combinational intranasal drug delivery system for the management of migraine by
using statistical design. Eur J Pharm Sci.;70:140-151.
61. Abbas Z., (2012). Mucoadhesive in situ gels as nasal drug delivery systems : an
overview.;7(3):168-180.
62. Kumar TP, Sirisha B, Raju PN, Reddy GN., (2013). Nasal Drug Delivery : A Potential
Route for Brain Targetting. pharma Innov.;2(1):77-85.
63. Pathak R, Prasad R, Misra M., (2014). Role of mucoadhesive polymers in enhancing
delivery of nimodipine microemulsion to brain via intranasal route. Acta Pharm Sin
B. ;4(2):151-160.
64. Yasir M, Sara UVS., (2014). Solid lipid nanoparticles for nose to brain delivery of
haloperidol: in vitro drug release and pharmacokinetics evaluation. Acta
Pharmaceutica Sinica B;4(6):454-463.63.
65. Chiappetta DA, Hocht C, Taira C, Sosnik A., (2011). Oral pharmacokinetics of the
anti-HIV efavirenz encapsulated within polymeric micelles.
Biomaterials.;32(9):2379-2387.
66. Singhvi G, Singh M., (2011). In-vitro drug release characterization models. Int. J
Pharm. Studies and Res.;2 (1):77-84.
67. Guidance for Industry Q1A(R2) Stability Testing of New Drug Substances and
Products. U.S. Department of Health and Human Services, Food and Drug
Administration, Center for Drug Evaluation and Research (CDER) Center for
Biologics Evaluation and Research (CBER); 2003;(November):1–22.
68. SADC. Registration of Medicines Stability. SADC Guidel Stab Test.
2004;(March):1-44.

Chapter 5 Summary and Conclusions
119997290052 / Gujarat Technological University Page 151
CHAPTER 5
Summary & Conclusions
5.1 Summary of the work
Infections with Human immune-deficiency virus (HIV) leading to Acquired
immune-deficiency syndrome is one of the leading cause of death in the world [1, 2].
Current therapies for HIV infections with antiretroviral drugs is effective in reducing
plasma viral levels, but are ineffective in eradicating the virus from sites like CNS which
becomes a viral sanctuary site due to the inability of the drugs to reach to these sites. The
CNS is the most important HIV reservoir site [3]. This not only results in virological
resistance, but also is often associated with the development of various complications such
as progressive deterioration in mental function, symptoms of motor abnormalities, mild
neurocognitive disorder (MDR), HIV associated dementia (HAD), HIV encephalitis (HIVE)
and even death in many cases. Efavirenz (EFV) is a non-nucleoside reverse transcriptase
inhibitor (NNRTI) of choice and is recommended as a first line antiretroviral drug used in
the high activity antiretroviral therapy (HAART) for the HIV infections [3-5]. EFV has low
bioavailability (40-45%) [6] which is reported to be due to low water solubility of the drug,
extensive first pass metabolism, metabolism by enzymes, high protein binding, efflux
mechanisms, etc [7-9].
Thus, the main aim of the present investigations were to design and develop nanoparticles
of EFV with the objectives of providing increased permeability and protection to drug with
biocompatible lipid content, avoid first-pass metabolism and efflux-mechanisms, and select
the route of administration to deliver EFV to brain/CNS in order to increase the
bioavailability of EFV at the reservoir site of HIV. Suitable analytical methods were
selected/developed and validated for determining the entrapment efficiency, in-vitro,
ex-vivo drug release profiles and for estimation of EFV in brain and plasma respectively.

Chapter 5 Summary and Conclusions
119997290052 / Gujarat Technological University Page 152
Various preliminary experiments were performed for selection of suitable excipients and
formulation technique. Various lipids and surfactants were screened primarily on the basis
of solubility of the drug in lipid and particle size, PDI, entrapment efficiency achieved with
different surfactants in trial batches. The selections were also based on safety profile and
approval status of the excipients. The compatibility of the excipients with the drug was
assured with FT-IR spectroscopy. Solid lipid nanoparticles were prepared by high pressure
homogenization technique using a systematic approach of design of experiments. After the
preliminary optimization of stirring time, RPM and temperature, critical process variables
involved during the high pressure homogenization (pressure and number of cycles) and
formulation variables (amount of drug with respect to lipid and concentration of surfactant)
were optimized using 32 factorial design with particle size, PDI and entrapment efficiency
as responses using Design Expert 9.0.3.1 software (Stat-Ease, Inc., USA). The data were
statistically analysed by ANOVA, model equations were generated and contour plots as
well as 3D surface plots were constructed for each response. Optimized SLN was
evaluated for particle size, polydispersity index, zeta potential and entrapment efficiency.
Particles of average size 108.5 nm having PDI of 0.172 were obtained. Entrapment
efficiency of 64.9% and zeta potential was found to be -21.2 mV. The formulated solid
lipid nanoparticles of EFV were also evaluated for surface morphology using transmission
electron microscope and were found to be spherical in shape and non-irritant/harmless with
histopathological studies. The optimized SLN were then incorporated in in-situ gelling
system. Different gelling and mucoadhesive agents were screened based on their gelling
properties with SLN dispersion. Poloxamer 188 and poloxamer 407 were selected as
thermo-sensitive polymers based on literature [10, 11]. Ratio of poloxamer 188 and
poloxamer 407 were optimized (1:2) based on their gelling behaviour at different
temperatures. Carbopol 934 P was selected and its concentration was optimized to be 0.4%
w/v in the presence of selected thermosensitive polymers. The EFV loaded SLN based gel
was evaluated for various parameters like gelation temperature, time, pH, viscosity,
transmittance, mucoadhesive strength, spreadability, in-vitro and ex-vivo release studies.
The release of dug was found to best fit in the Zero order release kinetics (R2 = 0.9873),

Chapter 5 Summary and Conclusions
119997290052 / Gujarat Technological University Page 153
indicating concentration independent diffusion controlled release. The in-vivo
pharmacokinetic studies performed on adult Wistar albino rats by administering the
formulation through intranasal route in test group (6 animals) and the marketed
formulation (powder from capsules) to the standard group (6 animals). The concentration
of EFV in brain and plasma were estimated by the developed and validated HPLC method.
The ratio of drug concentration in brain to plasma of 15.61% was achieved with the
developed formulation in comparison to 0.104% observed with the oral standard indicating
the 150 times more brain targeting efficiency of the formulation through intranasal route.
Relative bioavailability was determined to be 70.11 with the developed formulation
indicating 70 times better absorption potential of the EFV loaded SLN dispersion in
comparison to the orally administered drug powder. The formulations were found to be
stable for 12 months at 5±3◦C and 25 ± 2◦C/60 ± 5% RH as per ICH guidelines. The results
revealed increased concentration of the drug in brain, when administered through
intranasal route indicating its potential for an attempt towards complete eradication of HIV
and cure of HIV-infected patients.
5.2 Achievements with respect to the objectives
Different lipids, surfactants, process, gelling agent, etc. were screened and statistically
analyzed for proper selection. By selection of intranasal route of delivery, the first pass
metabolism and enzymatic degradation of the drug in GIT was avoided. By the use of
poloxamer reported to reduce efflux mechanism, the drug was successfully targeted and
released in the brain and thus it could be concluded that the developed formulation has the
potential to reach to the latent viral reservoir site for an attempt for complete cure of HIV
infections. The analytical method was successfully developed and validated for the
estimation of efavirenz in brain and plasma.
5.3 Major contribution and practical implications of the work to society
AIDS is one of the leading causes of death in the world. More than 35 million people

Chapter 5 Summary and Conclusions
119997290052 / Gujarat Technological University Page 154
worldwide are living with HIV/AIDS and an estimated 2.1 million individuals worldwide
are newly infected with HIV every year as per the statistics obtained from World Health
Organization [1, 2]. The society may be likely to witness even further increase in such
numbers of people suffering with this fatal disease because of expanding populations and
better diagnostics.
Extensive literature review was done to identify the challenges associated with the
complete cure of AIDS and approaches which can resolve them. Although multitude
researchers have worked on development of solid lipid nanoparticles (SLN) for various
drugs, the idea of the development of SLN of anti-HIV drug by systematic approach of
design of experiment for optimization of various parameters and to target the drug to brain
(reservoir site of HIV) through intranasal route (to avoid various drawbacks associated
with oral route) for an attempt towards complete eradication of HIV from its reservoir site
was probably yet not investigated by any other researcher. Moreover, the formulations
reduces the dose and dosing frequency and are convenient to be administered, it potentially
may render the treatment more cost-effective and acceptable to patients. The formulation
technique utilized has feasibility for scale-up on industrial scale. Hence, after clinical trials
and fulfillment of other regulatory requirements, the developed formulation has good scope
for commercialization and may prove to be a boon to the society at large for the complete
treatment and eradication of the highly-dreaded disease of AIDS.
5.4 Recommendation for future research
The present investigations on antiretroviral drug delivery system intended to be
administered through intranasal route for direct nose to brain delivery involves the use of
single antiretroviral agent. It has been reported that use of combination of drugs can lead to
more efficacious treatments and reduction of resistance. Hence, further studies with
development and evaluation of nanoformulations of combination of drugs should be
conducted. The nanoformulation approach for intranasal delivery opens new therapeutic
strategies for attacking human immune-deficiency virus and other diseases for improving

Chapter 5 Summary and Conclusions
119997290052 / Gujarat Technological University Page 155
treatment success rates. Future research may also involve the identification of exact site of
CNS where HIV potentially makes the reservoir and suitable model should be developed to
estimate the reach of drug to that particular site and their effectiveness.
5.5 Conclusion
With the present investigations, it may be concluded that solid lipid nanoparticles of a
poorly soluble drug efavirenz were successfully developed and optimized using the
systematic approach of design of experiments (DoE) by high pressure homogenization
technique. Thermosensitive in-situ gel was prepared with the optimized SLN dispersion.
The intranasal administration of the formulation showed 150 times more brain targeting
efficiency and 70 times better absorption potential of the drug from efavirenz loaded SLN
formulation in comparison to the orally administered marketed formulation (capsule). Thus,
it may be concluded that the developed formulation has better potential to target brain
where the HIV viruses are reported to harbor even with low dose of efavirenz, rendering
the treatment more cost-effective as well and acceptable to patients because of convenience
of application of in-situ gelling formulation. Hence, the developed formulation, after
necessary investigations of clinical trials, has the promising potential for an attempt to
completely eradicate HIV reservoir and cure AIDS.
5.6 References
1. WHO | HIV/AIDS. [Online]. Available: http://www.who.int/gho/hiv/en/. [Accessed 12
November, 2015.
2. Global HIV/AIDS Overview. [Online]. Available :
https://www.aids.gov/federal-resources/around-the-world/global-aids-overview/.
[Accessed 12 November, 2015]
3. Rao KS, Ghorpade A, Labhasetwar V., (2009). Targeting anti-HIV drugs to the CNS.
Expert Opin Drug Deliv.;6(8):771-784.

Chapter 5 Summary and Conclusions
119997290052 / Gujarat Technological University Page 156
4. Cundy KC, Lynch G, Lee WA.. (1997). Antiviral Research. 1997;35(2):113-122.
5. Hasegawa T, Kawaguchi T., (2002). Delivery of Anti-Viral Nucleoside Analogues to
the Central Nervous System. Curr Med Chem -Anti-Infective Agents.;1(1):55-63.
6. Corbau R, Mori J, Phillips C, et al., (2010). Lersivirine, a nonnucleoside reverse
transcriptase inhibitor with activity against drug-resistant human immunodeficiency
virus type 1. Antimicrob Agents Chemother.;54(10):4451-4463.
7. Mistry A, Stolnik S, Illum L., (2009). Nanoparticles for direct nose-to-brain delivery
of drugs;379:146-157.
8. Kaur IP, Bhandari R, Bhandari S, Kakkar V., (2008). Potential of solid lipid
nanoparticles in brain targeting. J Control Release.;127(2):97-109.
9. Gupta U, Jain NK., (2010). Non-polymeric nano-carriers in HIV/AIDS drug delivery
and targeting. Adv Drug Deliv Rev. ;62(4-5):478-490.
10. Naik A, Nair H., (2014). Formulation and Evaluation of Thermosensitive Biogels for
Nose to Brain Delivery of Doxepin. Biomed Res. Int.;2014.1-10.
11. Wong HL, Wu XY, Bendayan R., (2012). Nanotechnological advances for the delivery
of CNS therapeutics. Adv Drug Deliv Rev.;64(7):686-700.

Bibliography
119997290052 / Gujarat Technological University Page 157
Bibliography
Abbas Z., (2012). Mucoadhesive in situ gels as nasal drug delivery systems : an
overview.;7(3):168-180.
Abdel Mouez M, Zaki NM, Mansour S, Geneidi AS., (2014). Bioavailability enhancement of
verapamil HCl via intranasal chitosan microspheres. Eur J Pharm Sci.;51(1):59-66.
Adams G.L. , Boies L.R. HPA.(1989). Fundamentals of Otolaryngology, A Textbook of Ear,
Nose and Throat Diseases. Philadelphia.
Alexander Krämer, Mirjam Kretzschmar KK., (2010). Modern Infectious Disease
Epidemiology Concepts, Methods, Mathematical Models, and Public Health. New York:
Springer.
Arbelaez-Camargo D, Suñé-Negre JM, Roig-Carreras M, et al., (2016). Preformulation and
characterization of a lidocaine hydrochloride and dexamethasone sodium phosphate
thermo-reversible and bioadhesive long-acting gel for intraperitoneal administration. Int J
Pharm.;498(1-2):142-152.
Attama A, Momoh MA, Builders PF. Lipid Nanoparticulate Drug Delivery Systems: A
Revolution in Dosage Form Design and Development (2012). Recent Adv Nov Drug Carr
Syst. 2012:107-140.
Avachat AM, Parpani SS., (2015). Formulation and development of bicontinuous
nanostructured liquid crystalline particles of efavirenz. Colloids Surfaces B
Biointerfaces.;126:87-97.
Bhanushali RS, Gatne MM, Gaikwad R V, Bajaj AN, Morde MA., (2015). Nanoemulsion
based Intranasal Delivery of Antimigraine Drugs for Nose to Brain
Targeting;71(6):707-709.
Blasi P, Giovagnoli S, Schoubben A, et al., (2011). Lipid nanoparticles for brain targeting I.
Formulation optimization. Int J Pharm. ;419(1-2):287-295.
Blasi P, Giovagnoli S, Schoubben A, Ricci M, Rossi C., (2007). Solid lipid nanoparticles for
targeted brain drug delivery. Adv Drug Deliv Rev.;59(6):454-477.
Blasi P, Schoubben A, Traina G, et al., (2013). Lipid nanoparticles for brain targeting III.
Long-term stability and in vivo toxicity. Int J Pharm.;454(1):316-323.
Bocedi A, Notaril S NP., (2004). Binding of anti- HIV drugs to human serum albumin. Drug
Metab Dispos.:606-609.
Bozdaǧ-Pehlivan S, Subaşi B, Vural I, Ünlü N, Çapan Y., (2011). Evaluation of
drug-excipient interaction in the formulation of celecoxib tablets. Acta Pol Pharm - Drug
Res. ;68(3):423-433.
Burkoth AK, Anseth KS. A review of photocrosslinked polyanhydrides: in situ forming

Bibliography
119997290052 / Gujarat Technological University Page 158
degradable networks. Biomaterials. 2000;21(23):2395-2404.
Chan DC, Fass D, Berger JM, Kim PS. , (1997) Core structure of gp41 from the HIV
envelope glycoprotein. Cell.;89(2):263-273.
Chemical Products Corporation. (2012). GRAS Notice 000433: Generally Regarded as Safe
(GRAS) determination notification for Poloxamer Fatty Acid Formulations; Poloxamer
fatty acid esters: 1-36.
Chen Y, Liu L., (2012). Modern methods for delivery of drugs across the blood-brain barrier.
Adv Drug Deliv Rev.;64(7):640-665.
Chiappetta DA, Hocht C, Taira C, Sosnik A., (2011). Oral pharmacokinetics of the anti-HIV
efavirenz encapsulated within polymeric micelles. Biomaterials.;32(9):2379-2387.
Corbau R, Mori J, Phillips C, et al., (2010). Lersivirine, a nonnucleoside reverse transcriptase
inhibitor with activity against drug-resistant human immunodeficiency virus type 1.
Antimicrob Agents Chemother.;54(10):4451-4463.
Cundy KC, Lynch G, Lee WA., (1997). Bioavailability and metabolism of cidofovir
following topical administration to rabbits. Antiviral Research ;35(2):113-122.
Curic A, Keller B-L, Reul R, Moschwitzer J, Fricker G., (2015). Development and
lyophilization of itraconazole loaded poly(butylcyanoacrylate) nanospheres as a drug
delivery system. Eur J Pharm Sci.;78:121-131.
Dale Purves, George J Augustine, David Fitzpatrick, Lawrence C Katz, Anthony-Samuel
LaMantia, James O McNamara and SMW, (2001). Neuroscience. 2nd ed. Sunderland
(MA): Sinauer Associates.
Das Neves J, Amiji MM, Bahia MF, Sarmento B., (2010). Nanotechnology-based systems for
the treatment and prevention of HIV/AIDS. Adv Drug Deliv Rev. ;62(4-5):458-477.
Das Neves J, Sarmento B., (2014). Mucosal delivery of biopharmaceuticals: Biology,
challenges and strategies. Mucosal Deliv Biopharm Biol Challenges Strateg.
9781461495:1-601.
Date A a., Shibata A, Goede M, et al., (2012). Development and evaluation of a
thermosensitive vaginal gel containing raltegravir+efavirenz loaded nanoparticles for HIV
prophylaxis. Antiviral Res. 2;96(3):430-436.
Date A., Destache CJ., (2013). A review of nanotechnological approaches for the prophylaxis
of HIV/AIDS. Biomaterials.;34(26):6202-6228.
Delivery AD., (2009). Nanotechnology for Antiretroviral Drug Delivery. J Am Chem
Soc.:21-23.
Ding J, Na L, Mao S., (2012). Chitosan and its derivatives as the carrier for intranasal drug
delivery.;7(October):349-361.
Djupesland PG, Mahmoud RA, Messina JC. (2013). Accessing the brain: the nose may know
the way. J Cereb Blood Flow Metab.;33(5):793-794.
Bibliography
119997290052 / Gujarat Technological University Page 159
Dole MN, Patel PA, Sawant SD, Shedpure PS., (2011) Advance applications of fourier
transform infrared spectroscopy. Int J Pharm Sci Rev Res.;7(2):159-166.
Drug Bank: Efavirenz. [Online]. Available: http://www.drugbank.ca/drugs/DB00625.
[Accessed 12 November, 2015]
Dumortier G, Grossiord JL, Agnely F, Chaumeil , (2006). Expert Review A Review of
Poloxamer 407 Pharmaceutical and Pharmacological Characteristics. 2006;23(12):11095..
Edition S. Ophthalmic Drug Delivery Systems. Clin Res. 966:80-87.
Eskandari S, Varshosaz J, Minaiyan M, Tabbakhian M., (2011). Brain delivery of valproic
acid via intranasal administration of nanostructured lipid carriers: in vivo
pharmacodynamic studies using rat electroshock model. Int J Nanomedicine. ;6:363-371.
FDA. FDA approved -HIV-Medicines. 2016. [Online]. Available:
https://aidsinfo.nih.gov/education-materials/fact-sheets/21/58/fda-approved-hiv-medicines
.[Accessed November 11, 2016].
FDA. Guidance for Industry Starting Dose in Initial Clinical Trials Guidance for Industry
Estimating the Maximum Safe. FDA. 2005;(July):27.
Filiano AJ, Gadani SP, Kipnis J., (2014). Interactions of innate and adaptive immunity in
brain development and function. Brain Res. 2015;1617:18-27.
Fisher SRA, JMP® 8 Design of Experiments Guide, Second Edition. Cary, NC: SAS Institute
Inc. ,1965.
Fisher, Bruce; Harvey, Richard P.; Champe PC. (2007). In: Lippincott’s Illustrated Reviews:
Microbiology (Lippincott’s Illustrated Reviews Series):3.
Foxall RB, Soares RS, Albuquerque AS, Cortesao CS, Victorino RMM, Sousa AE., (2008).
Increased frequency of CD25dimCD4+ T-cells in HIV-2 infection, a naturally occurring
attenuated form of HIV-1. Clin Immunol.;127(2):158-167.
Füredi P, Kovács K, Ludányi K, Antal I, Klebovich I., (2016). Development and
characterization of voriconazole loaded nanoparticles for parenteral delivery. Int J
Pharm. ;510(1):159-163.
G.J. T. (1998) Principles of Human Anatomy. 8th ed. Mento Park: Benjamin/cummings
Science Publishing.
Gaillard PJ, Visser CC, Appeldoorn CCM, Rip J., (2012). Enhanced brain drug delivery:
Safely crossing the blood-brain barrier. Drug Discov Today Technol.;9(2):e155-e160.
Galligioni V, Scagliarini A, Lorenzini L, et al. Nose-to-brain delivery of ribavirin ( RBV ) for
the treatment of viral encephalitis. :4.
Gelderblom HR. (1996). Structure and Classification of Viruses. In: Baron S, Medical
Microbiology. 4th ed. Galveston (TX): University of Texas Medical Branch at Galveston.
Ginhoux F, Lim S, Hoeffel G, Low D, Huber T. (2013). Origin and differentiation of
microglia. Front Cell Neurosci.;7(April):45.

Bibliography
119997290052 / Gujarat Technological University Page 160
Gizurarson S (2012). Anatomical and histological factors affecting intranasal drug and
vaccine delivery. Curr Drug Deliv. 2012;9(6):566-582.
Global HIV/AIDS Overview. [Online]. Available :
Global HIV/AIDS Overview.
https://www.aids.gov/federal-resources/around-the-world/global-aids-overview/. Accessed
November 12, 2015.
Government of India, Ministry of Health and Family Welfare. Indian Pharmacopoeia. The
Indian Pharmacopoeia commission; 1996:A-147.
Guidance for Industry Q1A(R2) Stability Testing of New Drug Substances and Products.
U.S. Department of Health and Human Services, Food and Drug Administration, Center for
Drug Evaluation and Research (CDER) Center for Biologics Evaluation and Research
(CBER); 2003;(November):1–22.
Gupta S, Chavhan S, Sawant KK., (2011). Self-nanoemulsifying drug delivery system for
adefovir dipivoxil: Design, characterization, in vitro and ex vivo evaluation. Colloids
Surfaces A Physicochem Eng Asp.;392(1):145-155.
Gupta U, Jain NK., (2010). Non-polymeric nano-carriers in HIV/AIDS drug delivery and
targeting. Adv Drug Deliv Rev. ;62(4-5):478-490.
GW K. The First Line of Defense in Brain Pathologies. (1995). Drug Res
(Stuttg);45(1):357–360.
H.P. Rang, M.M.Dale, J.M. Ritter PKM. Pharmacology. In: Pharmacology. 5th ed. Churchill
Livingstone; 2003:654-665.
Hasegawa T, Kawaguchi T., (2002). Delivery of Anti-Viral Nucleoside Analogues to the
Central Nervous System. Curr Med Chem -Anti-Infective Agents.;1(1):55-63.
Heydari R, Rashidipour M, Naleini N., (2014). Determination of efavirenz in plasma by
dispersive liquid-liquid microextraction coupled to high-performance liquid
chromatography. Curr Anal Chem.10(2):280-287.
Hilip, LR, Peppas A., (1987). Fickian and anomalous release from swellable devices. J
Control Release.;5:37-42.
HIV Drug Interactions., (2011). Efavirenz PK Factsheet. [Online]. Available:
http://www.hiv-druginteractions.org/.[Accessed November 12, 2015].
Honary S, Zahir F., (2013). Effect of zeta potential on the properties of nano-drug delivery
systems - A review (Part 1). Trop J Pharm Res.;12(2):255-264.
http://doctors-hospitals-medical-cape-town-south-africa.blaauwberg.net/details.php?id=768.
[Accessed 25 June 2016]
https://www.aids.gov/federal-resources/around-the-world/global-aids-overview/. [Accessed
12 November, 2015]
Hynes M. Baltimore Classification of Viruses. Mol Biol Webb. 2015:1.

Bibliography
119997290052 / Gujarat Technological University Page 161
Hynynen K (2007). Focused ultrasound for blood – brain disruption and delivery of
therapeutic molecules into the brain.:27-35.
ICH Expert Working Group. Pharmaceutical Development Q8. ICH Harmon Tripart Guidel.
2009;8(August):1-28.
ICH. ICH Topic Q2 (R1) Validation of Analytical Procedures : Text and Methodology. Int
Conf Harmon. 2005;1994(November 1996):17.
Ikeda M, Bhattacharjee AK, Kondoh T, Nagashima T, Tamaki N (2002),. Synergistic effect
of cold mannitol and Na(+)/Ca(2+) exchange blocker on blood-brain barrier opening.
Biochem Biophys Res Commun.;291(3):669-674.
Infectitious viral diseases. [Online]. Available:
usa.gov/search?affiliate=ri.gov&query=viral&sitelimit=health.ri.gov [Accessed 12
November 2015]
Ingallina C, Rinaldi F, Bogni A, et al., (2016). Niosomal approach to brain delivery:
Development, characterization and in vitro toxicological studies. Int J
Pharm. ;511(2):969-982.
Jeannot V, Mazzaferro S, Lavaud J, et al., (2016). Targeting CD44 receptor-positive lung
tumors using polysaccharide-based nanocarriers: Influence of nanoparticle size and
administration route. Nanomedicine Nanotechnology, Biol Med. ;12(4):921-932.
Jogani V V, Shah PJ, Mishra P, Mishra AK, Misra AR., (2007). Nose-to-brain delivery of
tacrine:1199-1205.
Johnson NJ, Hanson LR, Iliff JJ, Ph D, Androulakis IP., (2011). Trigeminal pathways deliver
a low molecular weight drug from the nose to the brain and orofacilal
structures;7(3):228-237.
Journals H, Article R, Parameters P, Kakodkar SSS, Gajare P. Pharmaceutical
Quality-by-Design ( QbD ): Basic Principles. 2015;(1):1-19.
Journals H, Article R, Parameters P, Kakodkar SSS, Gajare P., (2015). Pharmaceutical
Quality-by-Design ( QbD ): Basic Principles;(1):1-19.
Kadam AA, Babu CJG, Permal RV, Channabasavaraj K, Mani TT., (2012) Development and
Validation of Method for the Quantitative Estimation of Efavirenz in Bulk and
Phrmaceutical Dosage Form. Am J PharmTech Res.;2(1):324-330.
Kamble RN, Mehta P., (2015). Development of simple HPLC method to estimate the blood
plasma concentration of Efavirenz in rat after oral administration, Innovare Academic
Sciences, Int. J Pharm & Pharm. Sci.;7(7):7-10.
Kappelhoff BS, Rosing H, Huitema AD., Beijnen JH., (2003). Simple and rapid method for
the simultaneous determination of the non-nucleoside reverse transcriptase inhibitors
efavirenz and nevirapine in human plasma using liquid chromatography. J Chromatogr
B.;792(2):353-362.

Bibliography
119997290052 / Gujarat Technological University Page 162
Karavasili C, Fatouros DG., (2016). Smart materials: In situ gel-forming systems for nasal
delivery. Drug Discov Today.; 21(1):157-166.
Kaur IP, Bhandari R, Bhandari S, Kakkar V., (2008). Potential of solid lipid nanoparticles in
brain targeting. J Control Release.;127(2):97-109.
Kawabata Y, Wada K, Nakatani M, Yamada S, Onoue S., (2011). Formulation design for
poorly water-soluble drugs based on biopharmaceutics classification system: Basic
approaches and practical applications. Int J Pharm; 420(1):1-10.
Kawakami K., (2012). Modification of physicochemical characteristics of active
pharmaceutical ingredients and application of supersaturatable dosage forms for improving
bioavailability of poorly absorbed drugs. Adv Drug Deliv Rev. ;64(6):480-495.
Kovacevic A, Savic S, Vuleta G, Müller RH, Keck CM., (2011). Polyhydroxy surfactants for
the formulation of lipid nanoparticles (SLN and NLC): Effects on size, physical stability
and particle matrix structure. Int J Pharm.;406(1-2):163-172.
Kozlovskaya L, Stepensky D., (2013). Quantitative analysis of the brain-targeted delivery of
drugs and model compounds using nano-delivery systems. J Control Release;171(1):17-23.
Kreuter J., (2014). Drug delivery to the central nervous system by polymeric nanoparticles:
What do we know? Adv Drug Deliv Rev.;71:2-14.
Krol S., (2012). Challenges in drug delivery to the brain: Nature is against us. J Control
Release. 2012;164(2):145-155.
Kumar A, Garg T, Sarma GS, Rath G, Goyal AK., (2015). Optimization of combinational
intranasal drug delivery system for the management of migraine by using statistical design.
Eur J Pharm Sci.;70:140-151.
Kumar M, Misra A, Babbar AK, Mishra AK, Mishra P, Pathak K., (2008) Intranasal
nanoemulsion based brain targeting drug delivery system of risperidone. Int J
Pharm.;358(1-2):285-291.
Kumar S, Randhawa JK., (2013). High melting lipid based approach for drug delivery: Solid
lipid nanoparticles. Mater Sci Eng C. ;33(4):1842-1852.
Kumar TP, Sirisha B, Raju PN, Reddy GN., (2013). Nasal Drug Delivery : A Potential Route
for Brain Targetting. pharma Innov. 2013;2(1):77-85.
Kumar YA, Rao NR., (2010). Development of Rapid UV Spectrophotometric Method for the
Estimation of Efavirenz in Formulations. E-Journal Chem. ;7(3):856-860.
Kuo Y, Su F., (2007). Transport of stavudine , delavirdine , and saquinavir across the blood –
brain barrier by polybutylcyanoacrylate , and solid lipid nanoparticles.;340:143-152.
Lakshmi Sailaja , Kishore Kumar K, Ravi Kumar DVR, Mohan Kumar C, Yugandhar NM,
Srinubabu G., (2007). Development and Validation of a Liquid Chromatographic Method
for Determination of Efavirenz in Human Plasma. Chromatographia.;65(5-6):359-361.
Bibliography
119997290052 / Gujarat Technological University Page 163
Langmann P, Schirmer D, Väth T, Zilly M, Klinker H, (2001). High-performance liquid
chromatographic method for the determination of HIV-1 non-nucleoside reverse
transcriptase inhibitor efavirenz in plasma of patients during highly active antiretroviral
therapy. J Chromatogr B Biomed Sci Appl.;755:151-156.
Lembo D, Cavalli R., (2010). Nanoparticulate delivery systems for antiviral drugs. Antivir
Chem Chemother.;21(2):53-70.
Liu L, Guo K, Lu J, et al., (2008). Biologically active core/shell nanoparticles self-assembled
from cholesterol-terminated PEG-TAT for drug delivery across the blood-brain barrier.
Biomaterials;29(10):1509-1517.
Lochhead JJ, Thorne RG., (2012). Intranasal delivery of biologics to the central nervous
system. Adv Drug Deliv Rev.;64(7):614-628.
Lun H, Chattopadhyay N, Yu X, Bendayan R., (2010). Nanotechnology applications for
improved delivery of antiretroviral drugs to the brain. Adv Drug Deliv Rev.
;62(4-5):503-517.
Macheras, P., Liadis A., (2006). Modelling in Biopharmaceutics, Pharmacokinetics and
Pharmacodynamics: Homogeneous and Heterogeneous Approaches. Series:
Interdisciplinary Applied Mathematics. Springer, New York.
Mallipeddi R, Rohan LC., (2010). Progress in antiretroviral drug delivery using
nanotechnology. Int J Nanomedicine. (1):533-547.
Marzolini C, Telenti A, Decosterd L a, Greub G, Biollaz J, Buclin T., (2001). Efavirenz
plasma levels can predict treatment failure and central nervous system side effects in
HIV-1-infected patients. Aids.:71-75.
McGinity JW, Harris MR, Patel K et. al., (1986). Handbook of Pharmaceutical Excipients.
American Pharmaceutical Association. Washington-DC, USA; 1986.
Mehnert W, Mäder K., (2012). Solid lipid nanoparticles. Adv Drug Deliv Rev. ;64:83-101.
Michael D. Triplett II BS., (2004). Enabling Solid Lipid Nanoparticle Drug Delivery
Technology. Doctor of Philosophy dissertation. The Ohio State University.
Michael J Pelczar, ECS Chan NRK. Microbiology., (1993). 5th ed. Tata Mc Graw Hill
Publishing company Ltd.,New Delhi.
Mishra V, Kesharwani P., (2016). Dendrimer technologies for brain tumor. Drug Discov
Today.;21(5):766-778.
Mistry A, Stolnik S, Illum L., (2009). Nanoparticles for direct nose-to-brain delivery of
drugs;379:146-157.
Morsi NM, Ghorab DM, Badie HA., (2012). Bioadhesive Brain Targeted Nasal Delivery of an
Ant ischemic Drug.;3(5):1067-1076.
Morsi N, Ghorab D, Refai H, Teba H., (2016). Ketoroloac tromethamine loaded
nanodispersion incorporated into thermosensitive in situ gel for prolonged ocular delivery.
Bibliography
119997290052 / Gujarat Technological University Page 164
Int J Pharm.;506(1-2):57-67.
Nagar M, Panwar KS, Chopra VS, Bala I, Trivedi P., (2010). Quality by design: A systematic
approach to pharmaceutical development. Der Pharm Lett.;2(2):111-130.
Naik A, Nair H., (2014). Formulation and Evaluation of Thermosensitive Biogels for Nose to
Brain Delivery of Doxepin. 2014:1-10.
Nelson AG, Zhang X, Ganapathi U, et al., (2015). Drug delivery strategies and systems for
HIV/AIDS pre-exposure prophylaxis and treatment. J Control
Release.;219(2015):669-680.
Nowacek AS, McMillan J, Miller R, Anderson A, Rabinow B, Gendelman HE., (2010).
Nanoformulated antiretroviral drug combinations extend drug release and antiretroviral
responses in HIV-1-infected macrophages: Implications for NeuroAIDS therapeutics. J
Neuroimmune Pharmacol.;5(4):592-601.
Omwoyo WN, Melariri P, Gathirwa JW, et al., (2016). Development, characterization and
antimalarial efficacy of dihydroartemisinin loaded solid lipid nanoparticles. Nanomedicine
Nanotechnology, Biol Med.;12(3):801-809.
Overview of viral infections. [Online]. Available:
http://www.merckmanuals.com/home/infections/viral-infections/overview-of-viral-infecti
ons. [Accessed 25 June 2016]
Pang Z, Lu W, Gao H, et al., (2008). Preparation and brain delivery property of biodegradable
polymersomes conjugated with OX26. J Control Release. 2008;128(2):120-127.
Pani NR, Nath LK, Acharya S, Bhuniya B., (2011). Application of DSC, IST, and FTIR study
in the compatibility testing of nateglinide with different pharmaceutical excipients. J Therm
Anal Calorim.;108(1):219-226.
Park JH, Ban SJ, Ahmed T, et al., (2015). Development of DH-I-180-3 loaded lipid
nanoparticle for photodynamic therapy. Int J Pharm. 2015;491(1-2):393-401.
Park K. (2008). Trojan monocytes for improved drug delivery to the brain. J Control Release.
;132(2):75.
Patel S, Chavhan S, Soni H, , Babbar AK, Mathur R MA and SK., (2011). Brain targeting of
risperidone-loaded solid lipid nanoparticles by intranasal route. J Drug
Target.;19(6):468–474.
Patel T, Zhou J, Piepmeier JM, Saltzman WM (2012). Polymeric nanoparticles for drug
delivery to the central nervous system. Adv Drug Deliv Rev. 2012;64(7):701-705.
Pathak R, Prasad R, Misra M., (2014). Role of mucoadhesive polymers in enhancing delivery
of nimodipine microemulsion to brain via intranasal route. Acta Pharm Sin B.
;4(2):151-160.
Pawar YB, Purohit H, Valicherla GR, et al., (2012). Novel lipid based oral formulation of
curcumin: Development and optimization by design of experiments approach. Int J

Bibliography
119997290052 / Gujarat Technological University Page 165
Pharm.;436(1-2):617-623.
Pelvig DP, Pakkenberg H, Stark AK, Pakkenberg B. (2008). Neocortical glial cell numbers in
human brains. Neurobiol Aging.;29(11):1754-1762.
Perioli L, Ambrogi V, Bernardini C, et al., (2004). Potential prodrugs of non-steroidal
anti-inflammatory agents for targeted drug delivery to the CNS. Eur J Med Chem.
;39(8):715-727.
Peroni RN, Di Gennaro SS, Hocht C, et al., (2011). Efavirenz is a substrate and in turn
modulates the expression of the efflux transporter ABCG2/BCRP in the gastrointestinal
tract of the rat. Biochem Pharmacol.;82(9):1227-1233.
Peter Christoper G V., Vijaya Raghavan C, Siddharth K, Siva Selva Kumar M, Hari Prasad R.,
(2014). Formulation and optimization of coated PLGA - Zidovudine nanoparticles using
factorial design and in vitro in vivo evaluations to determine brain targeting efficiency.
Saudi Pharm J.;22(2):133-140.
Pouton CW, Porter CJH., (2008). Formulation of lipid-based delivery systems for oral
administration: Materials, methods and strategies. Adv Drug Deliv Rev. ;60(6):625-637.
Qin LJ, Gu YT, Zhang H, Xue YX. (2009). Bradykinin-induced blood-tumor barrier opening
is mediated by tumor necrosis factor-α. Neurosci Lett. 2009;450(2):172-175.
Qiu Y, Park K., (2001). Environment-sensitive hydrogels for drug delivery. ;53:321-339.
Ramachandran G, Kumar a. KH, Swaminathan S, Venkatesan P, Kumaraswami V,
Greenblatt DJ., (2006). Simple and rapid liquid chromatography method for determination
of efavirenz in plasma. J Chromatogr B Anal Technol Biomed Life Sci. ;835(2):131-135.
Ramaswamy A, Arul Gnana Dhas AS., (2014). Development and validation of analytical
method for quantitation of Emtricitabine, Tenofovir, Efavirenz based on HPLC. Arab J
Chem. 2014.
Ramaswamy A, Arul Gnana Dhas AS., (2014). Development and validation of analytical
method for quantitation of Emtricitabine, Tenofovir, Efavirenz based on HPLC. Arab J
Chem., 1-7.
Rao KS, Ghorpade A, Labhasetwar V., (2009). Targeting anti-HIV drugs to the CNS. Expert
Opin Drug Deliv.;6(8):771-784.
Rausch DM, Stover ES., (2001). Neuroscience research in AIDS. Prog
Neuro-Psychopharmacology Biol Psychiatry.;25(1):231-257.
Ravi PR, Aditya N, Patil S, Cherian L., (2013). Nasal in-situ gels for delivery of rasagiline
mesylate: improvement in bioavailability and brain localization. Drug Deliv. ;7544:1-8.
Ren S, Park MJ, Sah H, Lee BJ., (2008). Effect of pharmaceutical excipients on aqueous
stability of rabeprazole sodium. Int J Pharm.;350(1-2):197-204.
Retroviruses. [Online]. Available:http://retrovirology.biomedcentral.com/ [Accessed 12
November, 2015]

Bibliography
119997290052 / Gujarat Technological University Page 166
Robert M. Silverstein, Francis X. Webster, David J. Kiemle DLB., (2014). Spectrometric
Identification of Organic Compounds. 8th ed. Wiley Publisher.
Rohit B, Pal KI., (2013). A Method to Prepare Solid Lipid Nanoparticles with Improved
Entrapment Efficiency of Hydrophilic Drugs. Curr Nanosci.;9(2):211-220.
SADC. Registration of Medicines Stability. SADC Guidel Stab Test. 2004;(March):1-44.
Saras-Nacenta M, López-Púa Y, Lípez-Cortés LF, Mallolas J, Gatell JM, Carné X., (2001).
Determination of efavirenz in human plasma by high-performance liquid chromatography
with ultraviolet detection. J Chromatogr B Biomed Sci Appl.;763(1-2):53-59.
Seju U, Kumar A, Sawant KK., (2011). Development and evaluation of olanzapine-loaded
PLGA nanoparticles for nose-to-brain delivery: In vitro and in vivo studies. Acta
Biomater.;7(12):4169-4176.
Serralheiro A, Alves G, Fortuna A, Falcao A. (2015). Direct nose-to-brain delivery of
lamotrigine following intranasal administration to mice. Int J Pharm. ;490(1-2):39-46.
Severino P, Santana MH a, Souto EB., (2012). Optimizing SLN and NLC by 2 2 full factorial
design: Effect of homogenization technique. Mater Sci Eng C.;32(6):1375-1379.
Sharma D, Maheshwari D, Philip G, et al., (2014) Formulation and optimization of polymeric
nanoparticles for intranasal delivery of Lorazepam using box-behnken design: in vitro and
in vivo evaluation. Biomed Res Int.;2014:156010.
Sharma N, Mishra N., (2014). Importance of Lipid Nanoparticles in the Treatment of
Epilepsy: a Focus on Nasal Delivery. J Pharm Sci Innov.;3(3):199-207.
Sharma S, Lohan S, Murthy RSR., (2012). Potential of Chitosan for nose to brain drug
delivery, Int. J. Pharm. Sci. Rev. Res.;16(1):47-55.
Shegokar R, Singh KK, Müller RH., (2011). Production & stability of stavudine solid lipid
nanoparticles - From lab to industrial scale. Int J Pharm. ;416(2):461-470.
Silva C, Gonzalez-Mira E, Garcia ML, et al., (2011). Preparation, characterization and
biocompatibility studies on risperidone-loaded solid lipid nanoparticles (SLN): High
pressure homogenization versus ultrasound. Colloids Surfaces B
Biointerfaces.;86(1):158-165.
Singh AK SA and MN (2012). Nasal cavity: A promising platform for drug delivery and
research approaches from nasal to brain targeting. J drug del ther.;2(3):22-33.
Singhvi G, Singh M., (2011). In-vitro drug release characterization models. Int. J Pharm.
Studies and Res.;2 (1):77-84.
Sood S, Jain K, Gowthamarajan K., (2014). Optimization of curcumin nanoemulsion for
intranasal delivery using design of experiment and its toxicity assessment. Colloids
Surfaces B Biointerfaces.;113:330-337.
Soto-Ramirez LE, Rodriguez-Diaz R, Harris DR, Hazra R., (2010). HIV drug
resistance-associated mutations in antiretroviral na??ve HIV-1-infected Latin American

Bibliography
119997290052 / Gujarat Technological University Page 167
children. Adv Virol.;2010.
Sozio P, Cerasa LS, Laserra S, et al., (2013). Memantine-sulfur containing antioxidant
conjugates as potential prodrugs to improve the treatment of Alzheimer’s disease. Eur J
Pharm Sci.;49(2):187-198.
Thakur DS, Behera CK, Patidar A, Kumar P, Kumar P, Lal C., (2010). Anti-HIV agents: A
step towards future. Int J Pharm Sci Rev Res.;3(2):10-18.
The National Toxicology Program (NTP) Interagency Center for the Evaluation of,
Alternative Toxicological Methods (NICEATM). Test Method Protocol for Solubility
Determination Phase III. 2003:1-10.
The United States Pharamcopoeial convention, (2011), Standards A. General Notices and
Requirements. USP 34; 6.
Top 10 Deadliest Diseases in the world. [Online]. Available:
https://www.microhealthllc.com/top-10-deadliest-diseases-in-the-world/ [Accessed 25
June 2016]
USP Medicines Compendium, Monograph. Efavirenz Final Authorized Version 2.0.
[Online]. Available: https://mc.usp.org/monographs/efavirenz-2-0. [Accessed 16
November, 2016]
Van der Meel R, Vehmeijer LJC, Kok RJ, Storm G, van Gaal EVB., (2013). Ligand-targeted
particulate nanomedicines undergoing clinical evaluation: Current status. Adv Drug Deliv
Rev.;65(10):1284-1298.
Varatharajan L, A TS., (2009). The transport of anti-HIV drugs across blood–CNS interfaces:
Summary of current knowledge and recommendations for further research. Antiviral
Res.;82(2):A99-A109.
Varatharajan L, A TS., (2009). The transport of anti-HIV drugs across blood–CNS interfaces:
Summary of current knowledge and recommendations for further research. Antiviral
Res.;82(2):A99-A109.
Veldkamp I, van Heeswijk RP, Meenhorst PL, et al., (1999). Quantitative determination of
efavirenz (DMP 266), a novel non-nucleoside reverse transcriptase inhibitor, in human
plasma using isocratic reversed-phase high-performance liquid chromatography with
ultraviolet detection. J Chromatogr B Biomed Sci Appl. ;734(1):55-61.
Venkateswarlu V, Manjunath K., (2004). Preparation, characterization and in vitro release
kinetics of clozapine solid lipid nanoparticles. J Control Release.;95(3):627-638.
Vikram Singh A, Nath LK, Pani NR., (2011). Development and validation of analytical
method for the estimation of lamivudine in rabbit plasma. J Pharm Anal. ;1(4):251-257.
Virus vs Retrovirus. [Online]. Available:
http://www.differencebetween.com/difference-between-retrovirus-and-vs-virus/.
[Accessed 25 June 2016]

Bibliography
119997290052 / Gujarat Technological University Page 168
Vykhodtseva N, McDannold N, Hynynen K., (2008). Progress and problems in the
application of focused ultrasound for blood-brain barrier disruption.
Ultrasonics;48(4):279-296.
Wang X, Chi N, Tang X., (2008). Preparation of estradiol chitosan nanoparticles for
improving nasal absorption and brain targeting. Eur J Pharm Biopharm.;70(3):735-740.
WHO | HIV/AIDS. [Online]. Available: http://www.who.int/gho/hiv/en/. [Accessed 12
November, 2015.
WHO. Safety of Efavirenz. 2010. [Online]. Available:
http://www.who.int/hiv/topics/treatment/efavirenz_safety_review.pdf. [Accessed 12
November, 2015]
William N. Rom SBM., (2007). Environmental and Occupational Medicine. 4th ed.
Lippincott Williams & Wilkins.
Woensel M Van, Wauthoz N, Rosière R, et al., (2013). Formulations for Intranasal Delivery
of Pharmacological Agents to Combat Brain Disease: A New Opportunity to Tackle
GBM:1020-1048.
Wong HL, Wu XY, Bendayan R. (2012). Nanotechnological advances for the delivery of
CNS therapeutics. Adv Drug Deliv Rev.;64(7):686-700.
World Health Organization, (2005). International pharmacopoeia monograph on
efavirenz.2005:5-8.
Xia H, Gao X, Gu G, et al., (2011). Low molecular weight protamine-functionalized
nanoparticles for drug delivery to the brain after intranasal administration.
Biomaterials.;32(36):9888-9898.
Xu X, Al-Ghabeish M, Rahman Z, et al., (2015). Formulation and process factors influencing
product quality and in vitro performance of ophthalmic ointments. Int J
Pharm.;493(1-2):412-425.
Yasir M, Sara UVS., (2014). Solid lipid nanoparticles for nose to brain delivery of
haloperidol: in vitro drug release and pharmacokinetics evaluation. Acta Pharmaceutica
Sinica B;4(6):454-463.
Zaki NM, Awad GAS, Mortada ND, Abd ElHady SS.(2006) Rapid-onset intranasal delivery
of metoclopramide hydrochloride. Part I. Influence of formulation variables on drug
absorption in anesthetized rats. Int J Pharm. 2006; 327(1-2):89-96.

Appendices
119997290052 / Gujarat Technological University Page 169
Appendix A
Approval from CPCSEA & IAEC for pharmacokinetic studies on animals

Appendices
119997290052 / Gujarat Technological University Page 170
Appendix B
Certificate from PASM regarding ethical issues

Appendices
119997290052 / Gujarat Technological University Page 171
Appendix C
Dose Calculation
The dose of drug to be administered to the rats for in-vivo studies was calculated
based on human equivalent dose (HED) as per guideline by FDA.
Human Dose of EFV : 600 mg
Average adult weight : 60 kg
Hence,
HED = 600 mg / 60 Kg
=10 mg/Kg
As per FDA guidelines for dose calculation,
HED ( mg / Kg) = Animal dose ( mg / Kg) X 0.16 (for rats)
Animal dose ( mg / Kg) = HED ( mg / Kg) / 0.16
= 10/0.16 mg / Kg
= 62.5 mg / Kg
=0.0625 mg/gram
Weight of rat: 400 gram
Oral Rat dose = 0.0625 X 400 = 25 mg
Nanoparticulate dose :
Amount of drug in 100 ml = 25 mg
0.25 ml formulation was taken
Hence, Amount of drug administered intranasally
= 0.25 X 25/100
= 0.0625 mg
List of Publications
119997290052 / Gujarat Technological University Page 172
List of Publications/ Patent
Publications from the present research work :
Gupta S, Kesarla R, Chotai N, Misra, AN, Omri AW, (2017). Systematic approach
for the Formulation and Optimization of Solid Lipid Nanoparticles of efavirenz by
high pressure homogenization using Design of Experiment (DOE) for brain targeting
and enhanced bioavailability, Biomed Research International, Volume 2017 (2017),
Article ID 5984014, 18 pages, https://doi.org/10.1155/2017/5984014. (JCR Impact
factor: 2.134, No. of citation:01)
Gupta S, Kesarla R, Chotai N, Omri A, (2017). Development and validation of
reversed phase HPLC gradient method for the estimation of efavirenz in plasma.
PLoS ONE 12(5): e0174777. https://doi.org/10.1371/journal.pone.0174777 (JCR
Impact factor: 3.057)
Other publications:
Gupta, S. et al., 2011. “Self-nanoemulsifying drug delivery system for Adefovir
Dipivoxil: Design, characterization, in-vitro and ex-vivo evaluation”. Colloids and
Surfaces A: Physicochemical and Engineering Aspects, 392(1)5,145-155. [JCR
Impact Factor: 2.760, No. of citations: 80].
Gupta, S. and Rajesh KS. 2013. “Ophthalmic drug delivery systems with emphasis
on in-situ hydrogels”. Pharmagene- A genesis journal, 1(2), 79-86.
Gupta, S. et al., 2013. “Formulation strategies to improve the bioavailability of
poorly absorbed drugs with special emphasis on self emulsifying systems”. ISRN
Pharmaceutics, Article ID 848043, Volume 2013, Hindawi Publishing Corporation.
[No. of citations: 44]
Gupta, S. et al., 2016. “Formulation, optimization and evaluation of colon targeted
delivery system for Isradipine”. World Journal of Pharmacy and Pharmaceutical
Sciences, 5 (5), 632-649. [SJIF Impact Factor 6.041]

List of Publications
119997290052 / Gujarat Technological University Page 173
Papers presented
Gupta, S. et al., 2009. “Controlled release bilayered buccoadhesive tablets of
Losartan Potassium: Formulation & Characterization”. Presented in IPC 2009,
Ahmedabad, Gujarat, India.
Gupta, S. et al. 2013. “Formulation of Mentholated Hydrogel and its optimization
using box-behnken design for treatment of burns and wounds”. Presented in AICTE
sponsored seminar on “Quality by Design for Better Method Development and
Validation” organized by Parul Institute of Pharmacy & Research and Parul
Institute of Pharmacy on 18th-19th October, 2013.
Gupta, S. et al. 2014. “Topical gel containing solid lipid nanoparticles (SLN) with
improved efficacy and patient compliance.” Presented in VIC-VCCI-Expo 2014.
Patent filed
Title: Topical Gel containing solid lipid nanoparticles
Patent Application No.: 3658/MUM/2014
Application date: 19/11/2014
Publication date : 20/05/2016
Journal No. - 21/2016
Link :http://ipindiaonline.gov.in/patentsearch/PublishedSearch/publishApplicationNu
mber.aspx?application_number=to+3fHvLM2HBmJoF1uzwGA==