guided tutorial: using gsea as an analytical tool for
TRANSCRIPT
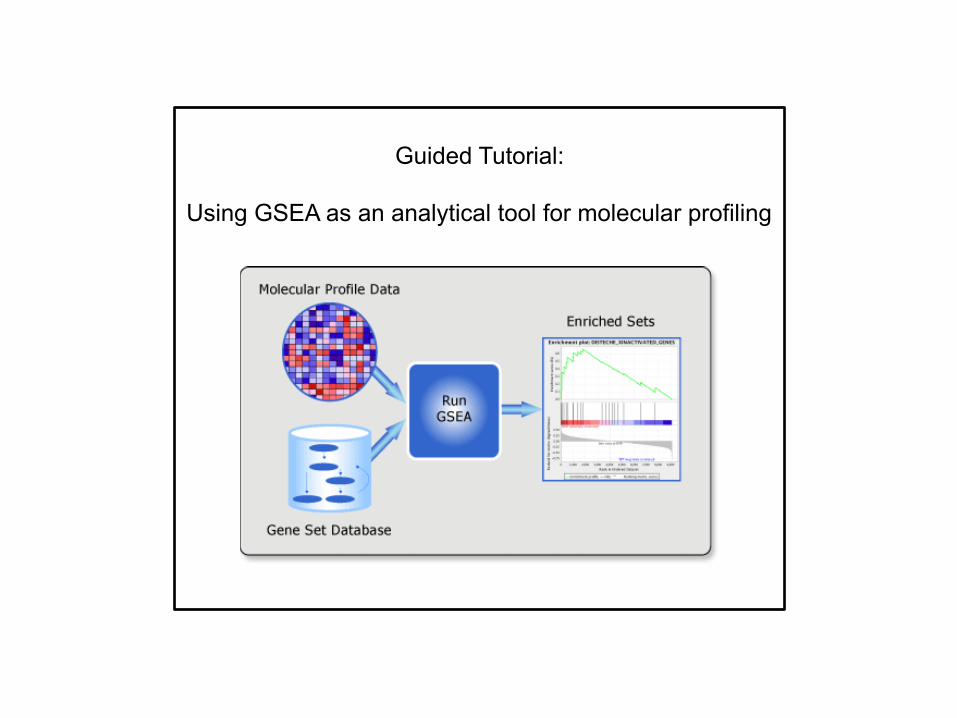
Guided Tutorial:
Using GSEA as an analytical tool for molecular profiling

Getting Started: Create a GSEA workstation that works for you
Desktop/Laptop running Mac OS X, Windows, or Linux:
Java 6 or 7 (Desktop GUI or command line)
R
GenePa4ern (Web, Desktop, or Server)
When would you use GSEA? What do you need to get started?
Basic workstaIon with Java Expression files converted to .gct (GenePaNern) Phenotype labels (any text editor) Gene Sets (public repository or custom sets)
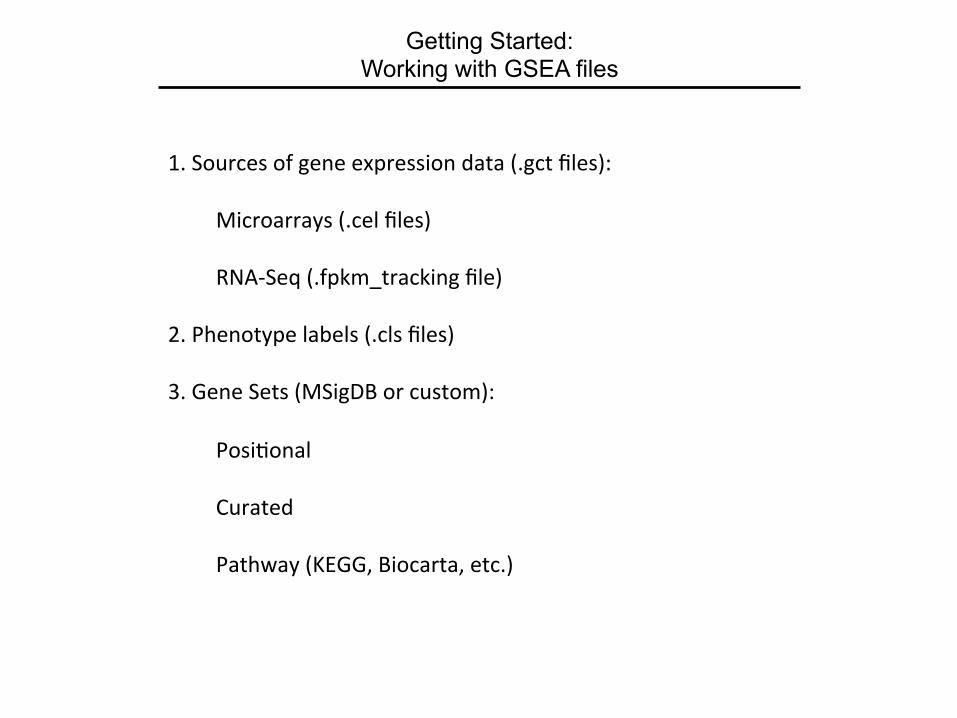
Getting Started: Working with GSEA files
1. Sources of gene expression data (.gct files):
Microarrays (.cel files)
RNA-‐Seq (.fpkm_tracking file) 2. Phenotype labels (.cls files) 3. Gene Sets (MSigDB or custom):
PosiIonal
Curated
Pathway (KEGG, Biocarta, etc.)

Getting Started: GCT file column structure
#1.2 23230 2 gene_short_name DescripIon Untreated_FPKM CisplaIn_FPKM Mcm4 chr16:15623989-‐15637493 16.5908 33.9435 Mcm5 chr8:77633426-‐77652338 5.97553 16.5161 Mcm6 chr1:130228167-‐130256233 12.7255 28.2007 Mcm7 chr5:138605816-‐138613090 25.7281 49.4802
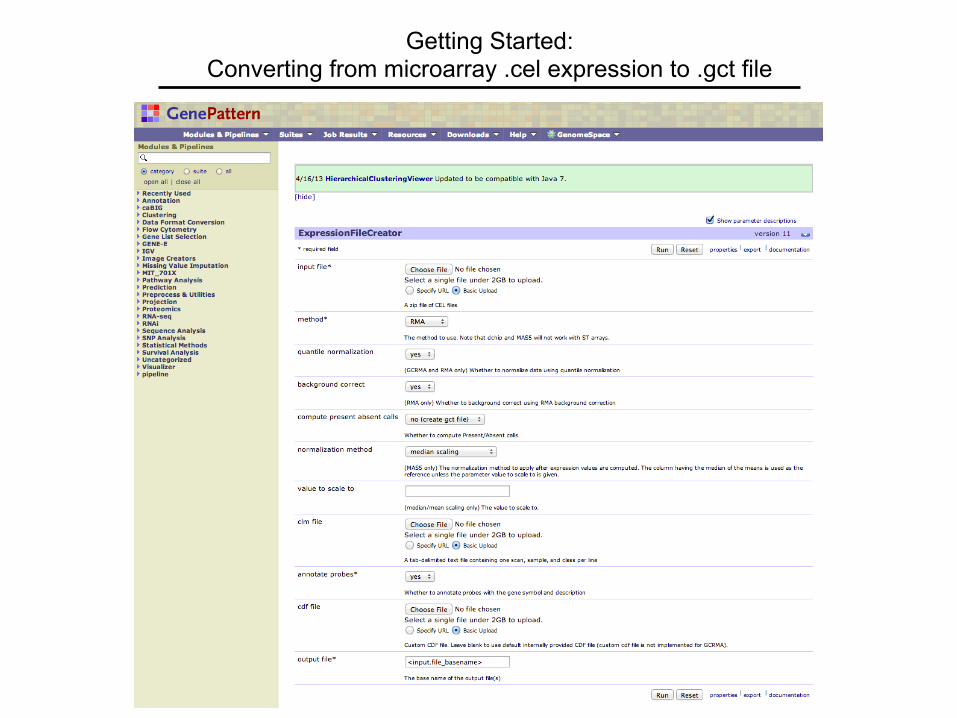
Getting Started: Converting from microarray .cel expression to .gct file
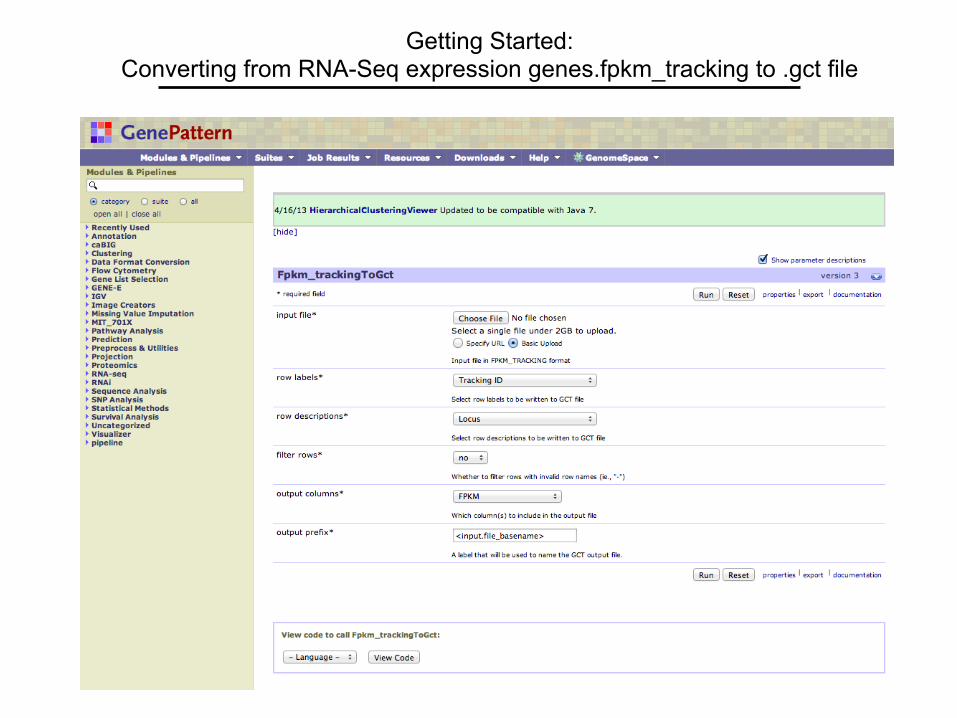
Getting Started: Converting from RNA-Seq expression genes.fpkm_tracking to .gct file
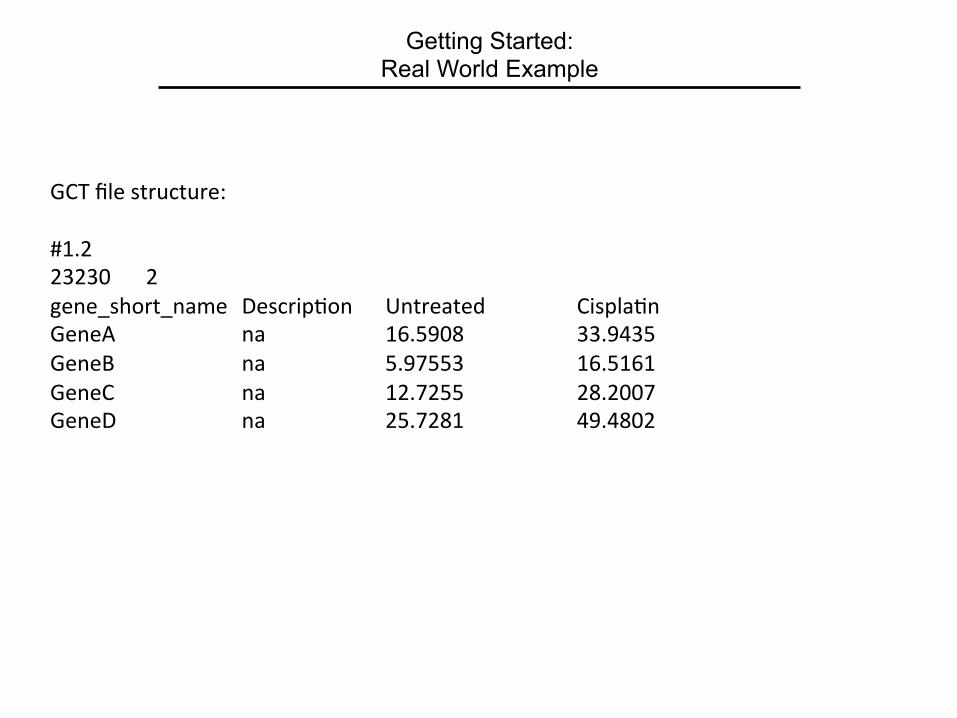
Getting Started: Real World Example
GCT file structure: #1.2 23230 2 gene_short_name DescripIon Untreated CisplaIn GeneA na 16.5908 33.9435 GeneB na 5.97553 16.5161 GeneC na 12.7255 28.2007 GeneD na 25.7281 49.4802
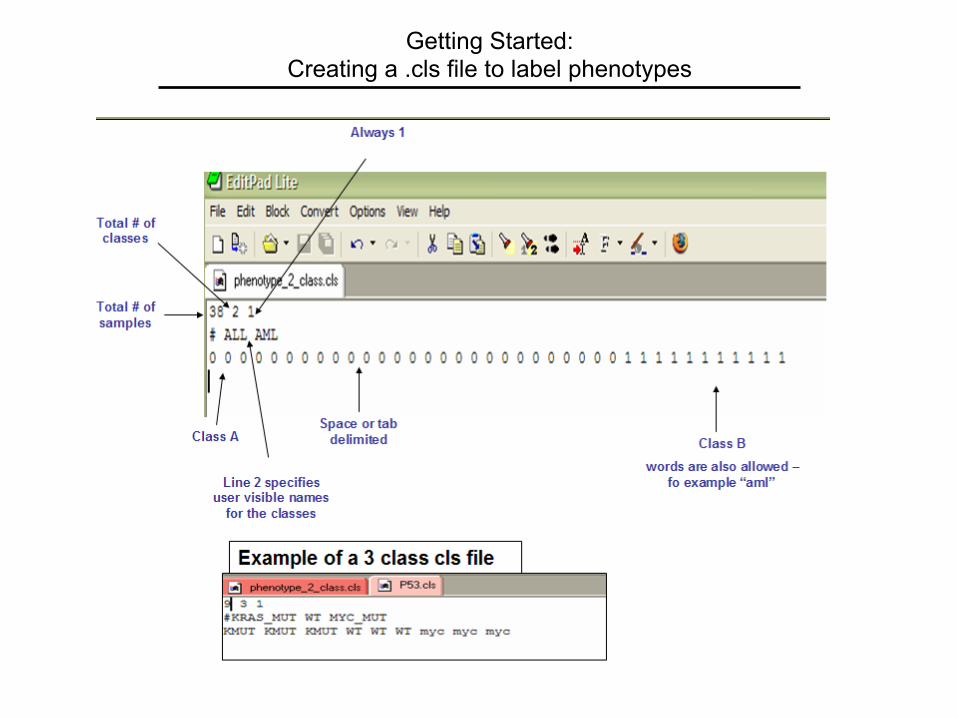
Getting Started: Creating a .cls file to label phenotypes
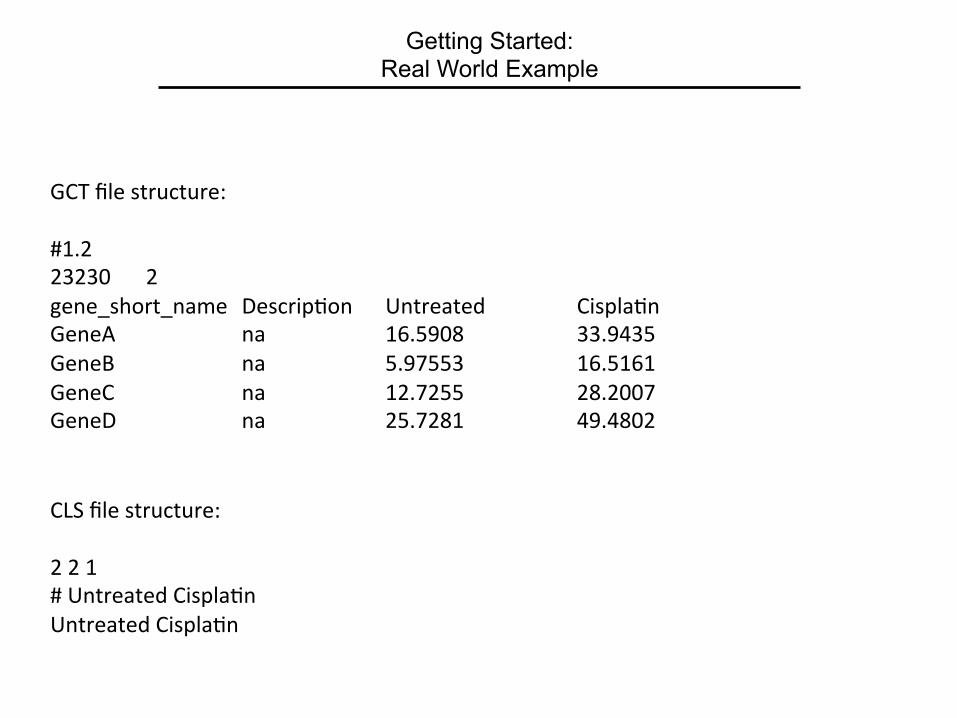
Getting Started: Real World Example
CLS file structure: 2 2 1 # Untreated CisplaIn Untreated CisplaIn
GCT file structure: #1.2 23230 2 gene_short_name DescripIon Untreated CisplaIn GeneA na 16.5908 33.9435 GeneB na 5.97553 16.5161 GeneC na 12.7255 28.2007 GeneD na 25.7281 49.4802
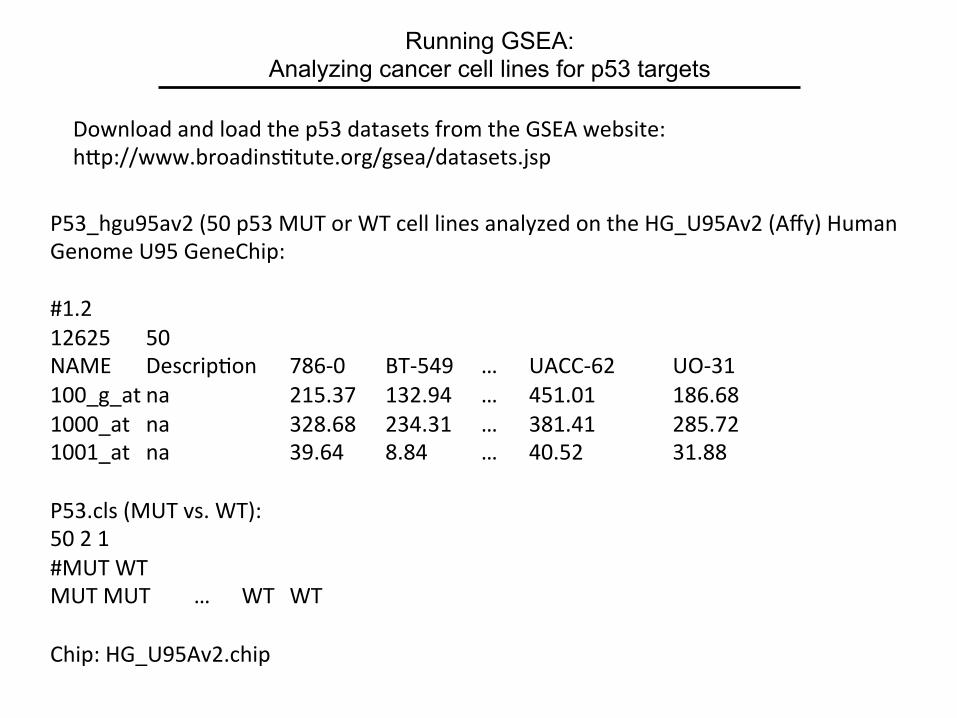
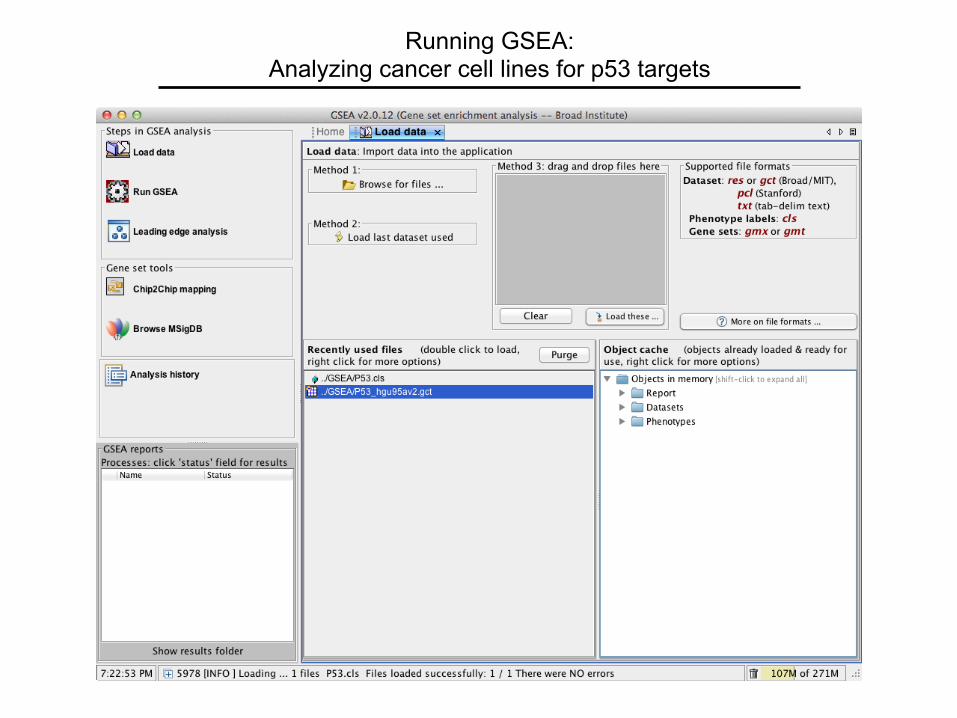
Running GSEA: Analyzing cancer cell lines for p53 targets
P53_hgu95av2 (50 p53 MUT or WT cell lines analyzed on the HG_U95Av2 (Affy) Human Genome U95 GeneChip: #1.2 12625 50 NAME DescripIon 786-‐0 BT-‐549 … UACC-‐62 UO-‐31 100_g_at na 215.37 132.94 … 451.01 186.68 1000_at na 328.68 234.31 … 381.41 285.72 1001_at na 39.64 8.84 … 40.52 31.88 P53.cls (MUT vs. WT): 50 2 1 #MUT WT MUT MUT … WT WT Chip: HG_U95Av2.chip
Download and load the p53 datasets from the GSEA website: hNp://www.broadinsItute.org/gsea/datasets.jsp
Running GSEA: Analyzing cancer cell lines for p53 targets
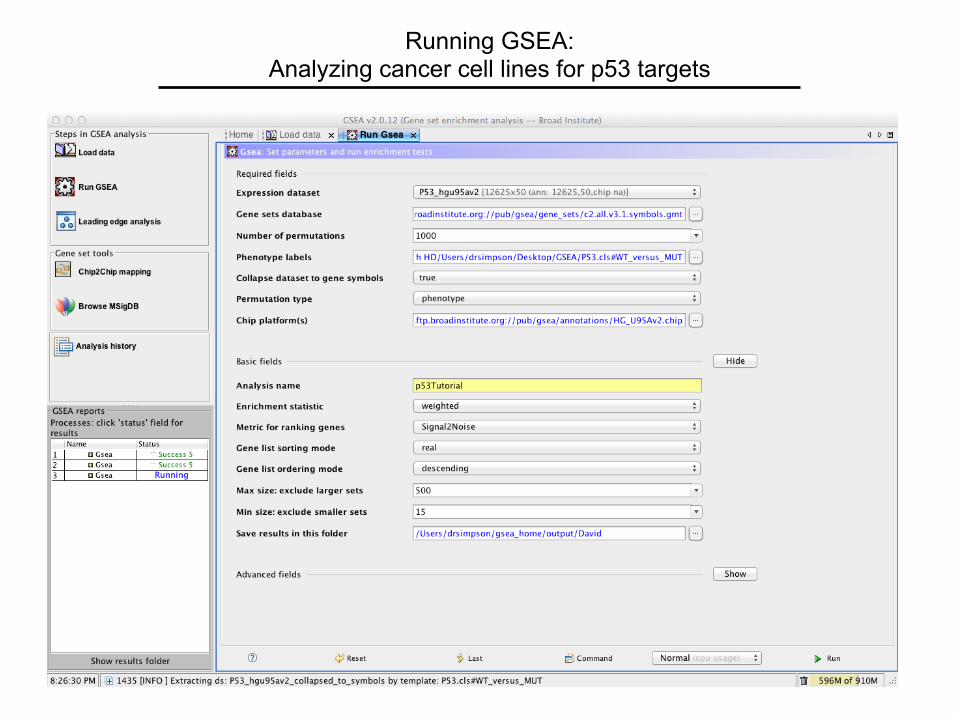
Running GSEA: Analyzing cancer cell lines for p53 targets
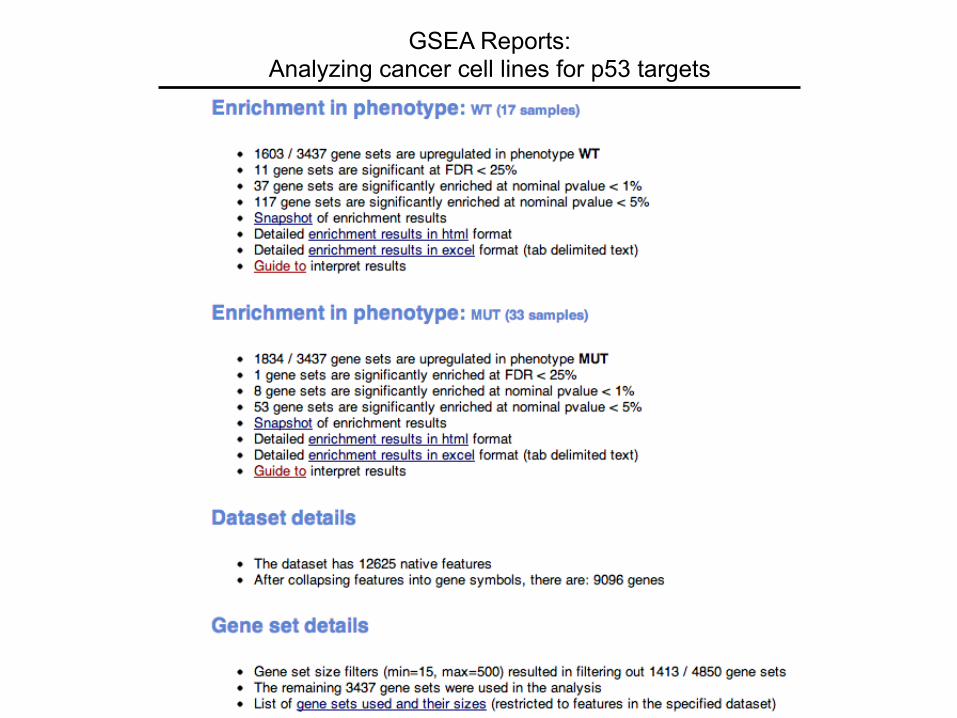
GSEA Reports: Analyzing cancer cell lines for p53 targets

GSEA Reports: Analyzing cancer cell lines for p53 targets
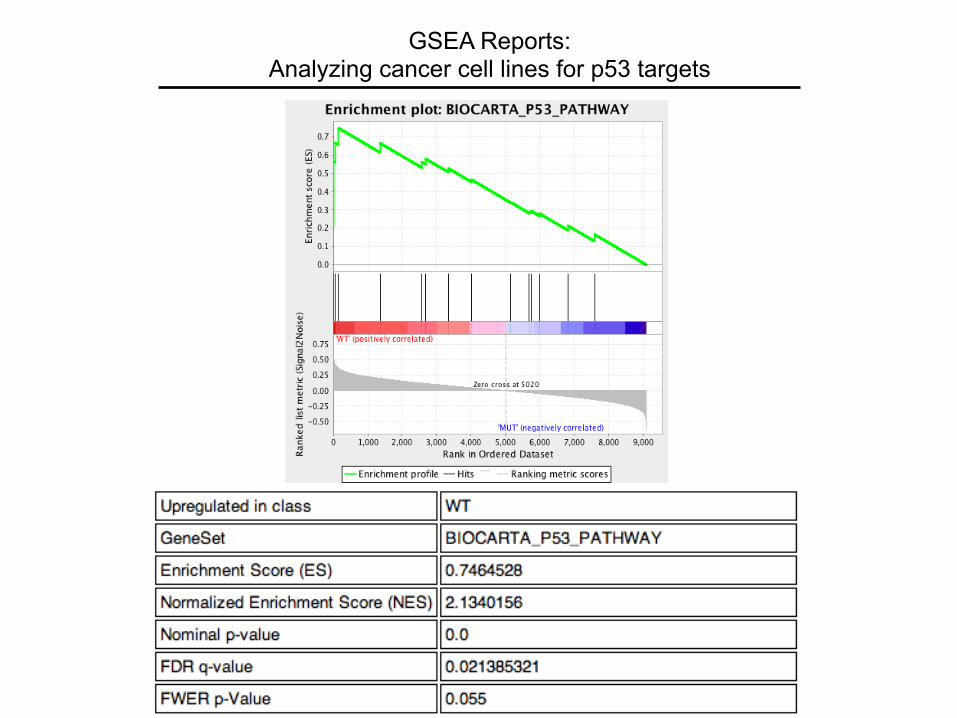
GSEA Reports: Analyzing cancer cell lines for p53 targets

Leading Edge Analysis: Analyzing cancer cell lines for p53 targets
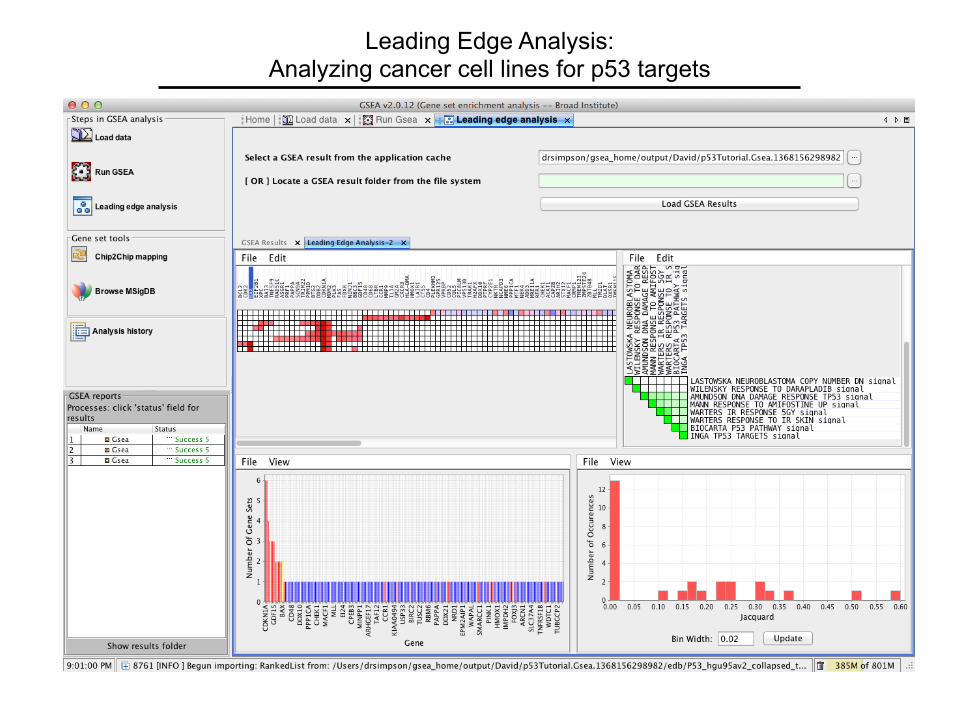
Leading Edge Analysis: Analyzing cancer cell lines for p53 targets
Leading Edge Analysis: Analyzing cancer cell lines for p53 targets

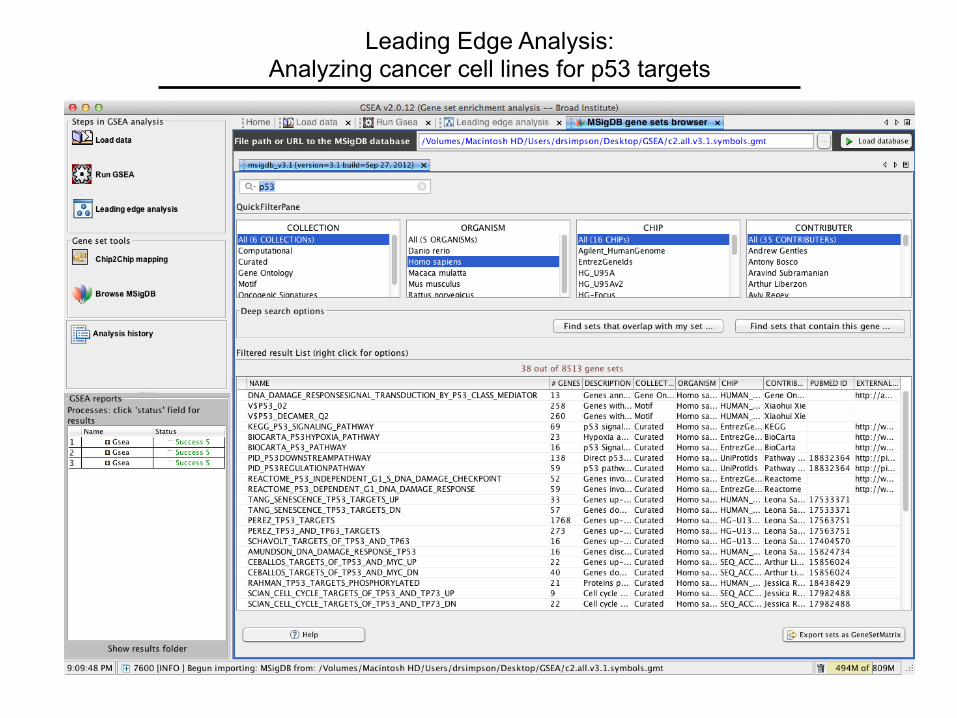
Browsing MSigDB: Analyzing cancer cell lines for p53 targets
References
GSEA: hNp://www.broadinsItute.org/gsea/ GenepaNern: hNp://www.broadinsItute.org/cancer/sojware/genepaNern/

ARACNE demo
Xi Zhao, PhDCancer Center for Systems Biology, Stanford University
• ARACNE theory recap
• Java GUI
• Command line tool
Friday, May 10, 13
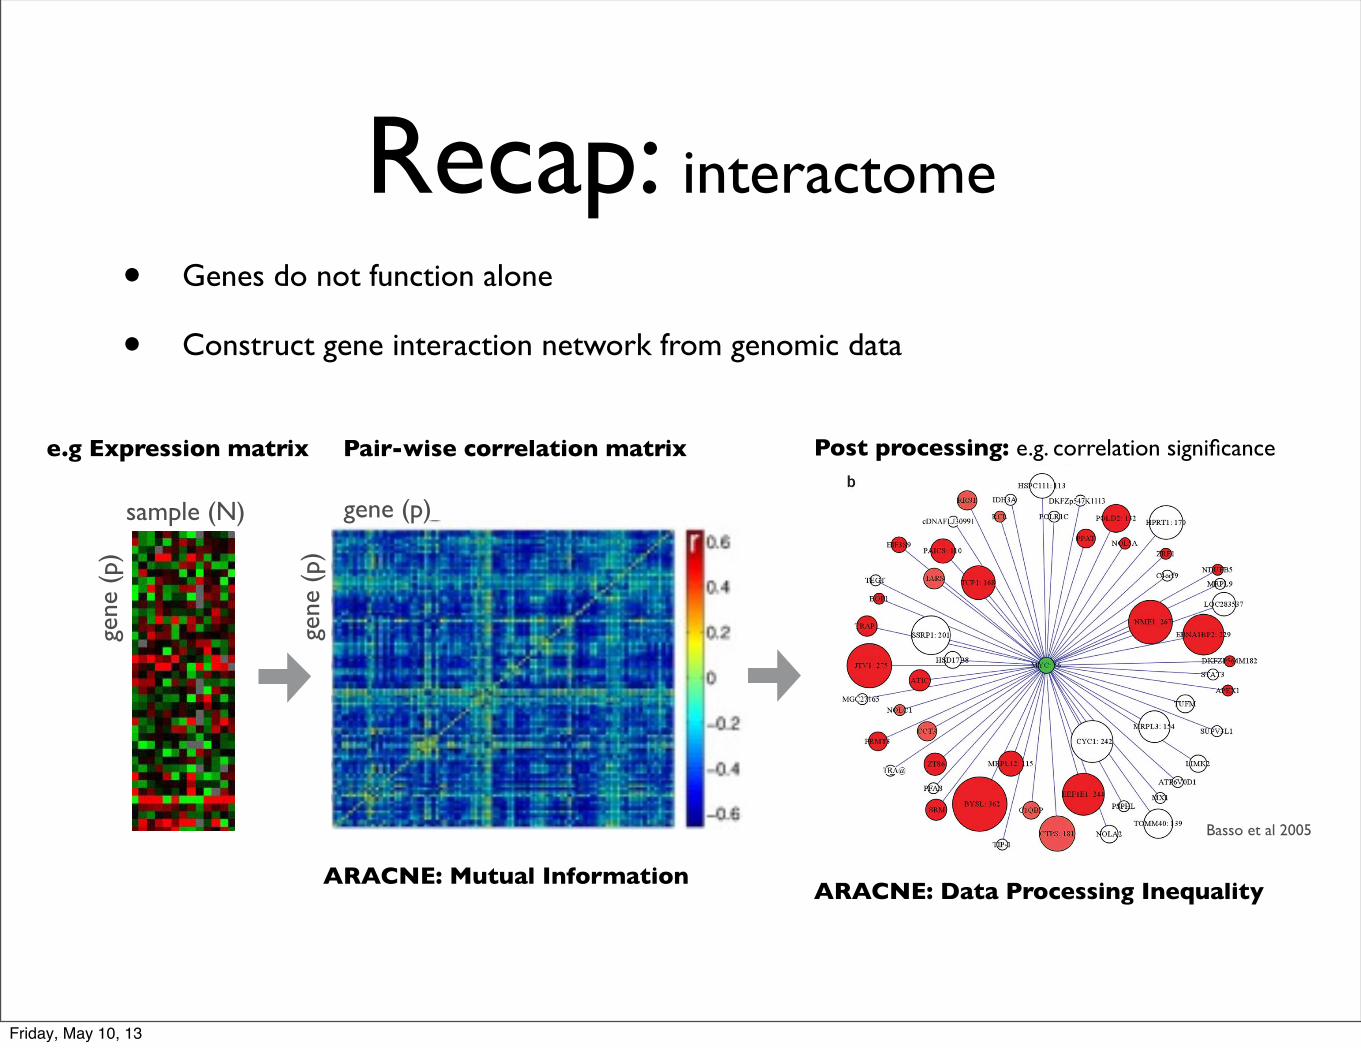
Recap: interactome
• Genes do not function alone
• Construct gene interaction network from genomic data
Elements of Statistical Learning (2nd Ed.) c©Hastie, Tibshirani & Friedman 2009 Chap 1
SID42354SID31984SID301902SIDW128368SID375990SID360097SIDW325120ESTsChr.10SIDW365099SID377133SID381508SIDW308182SID380265SIDW321925ESTsChr.15SIDW362471SIDW417270SIDW298052SID381079SIDW428642TUPLE1TUP1ERLUMENSIDW416621SID43609ESTsSID52979SIDW357197SIDW366311ESTsSMALLNUCSIDW486740ESTsSID297905SID485148SID284853ESTsChr.15SID200394SIDW322806ESTsChr.2SIDW257915SID46536SIDW488221ESTsChr.5SID280066SIDW376394ESTsChr.15SIDW321854WASWiskottHYPOTHETICSIDW376776SIDW205716SID239012SIDW203464HLACLASSISIDW510534SIDW279664SIDW201620SID297117SID377419SID114241ESTsCh31SIDW376928SIDW310141SIDW298203PTPRCSID289414SID127504ESTsChr.3SID305167SID488017SIDW296310ESTsChr.6SID47116MITOCHONDRChrSIDW376586HomosapiensSIDW487261SIDW470459SID167117SIDW31489SID375812DNAPOLYMESID377451ESTsChr.1MYBPROTOSID471915ESTsSIDW469884HumanmRNASIDW377402ESTsSID207172RASGTPASESID325394H.sapiensmRNGNALSID73161SIDW380102SIDW299104
BREAST
RENAL
MELANOMA
MELANOMA
MCF7D-repro
COLON
COLON
K562B-repro
COLON
NSCLC
LEUKEMIA
RENAL
MELANOMA
BREAST
CNS
CNS
RENAL
MCF7A-repro
NSCLC
K562A-repro
COLON
CNS
NSCLC
NSCLC
LEUKEMIA
CNS
OVARIAN
BREAST
LEUKEMIA
MELANOMA
MELANOMA
OVARIAN
OVARIAN
NSCLC
RENAL
BREAST
MELANOMA
OVARIAN
OVARIAN
NSCLC
RENAL
BREAST
MELANOMA
LEUKEMIA
COLON
BREAST
LEUKEMIA
COLON
CNS
MELANOMA
NSCLC
PROSTATE
NSCLC
RENAL
RENAL
NSCLC
RENAL
LEUKEMIA
OVARIAN
PROSTATE
COLON
BREAST
RENAL
UNKNOWN
FIGURE 1.3. DNA microarray data: expression ma-
sample (N)
gene
(p)
e.g Expression matrix
gene
(p)
gene (p)
Pair-wise correlation matrix
ARACNE: Mutual Information
Basso et al 2005
ARACNE: Data Processing Inequality
Post processing: e.g. correlation significance
Friday, May 10, 13
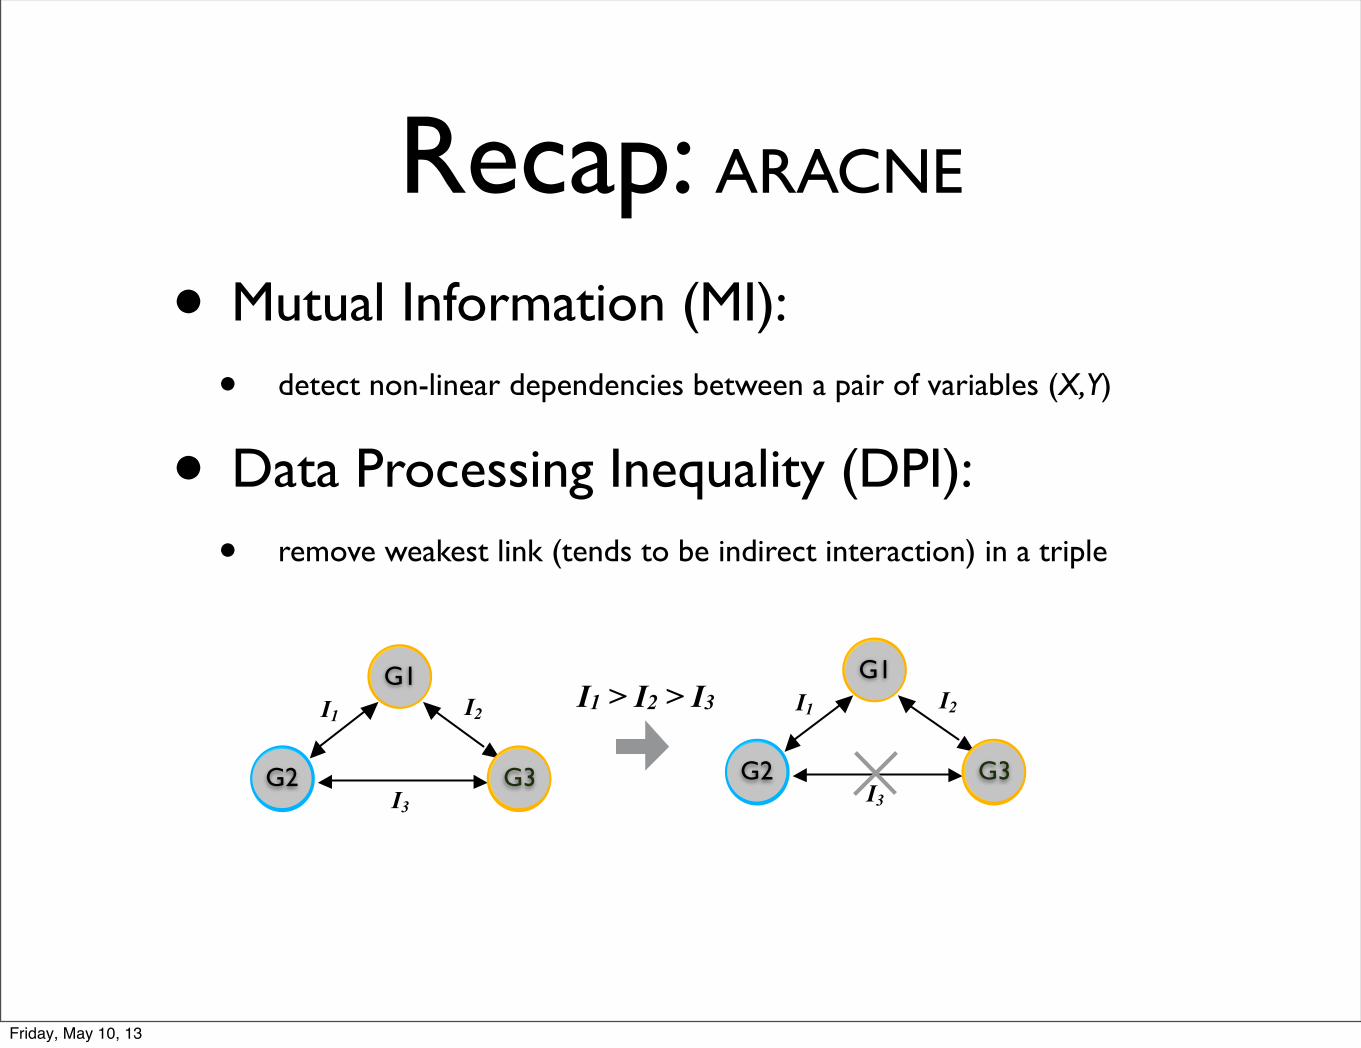
Recap: ARACNE
• Mutual Information (MI):
• detect non-linear dependencies between a pair of variables (X, Y)
• Data Processing Inequality (DPI):
• remove weakest link (tends to be indirect interaction) in a triple
TF
nTF I1 I2
I3 nTF
G1
G2 G3
I1 > I2 > I3
TF
nTF I1 I2
I3 nTF
G1
G2 G3
Friday, May 10, 13
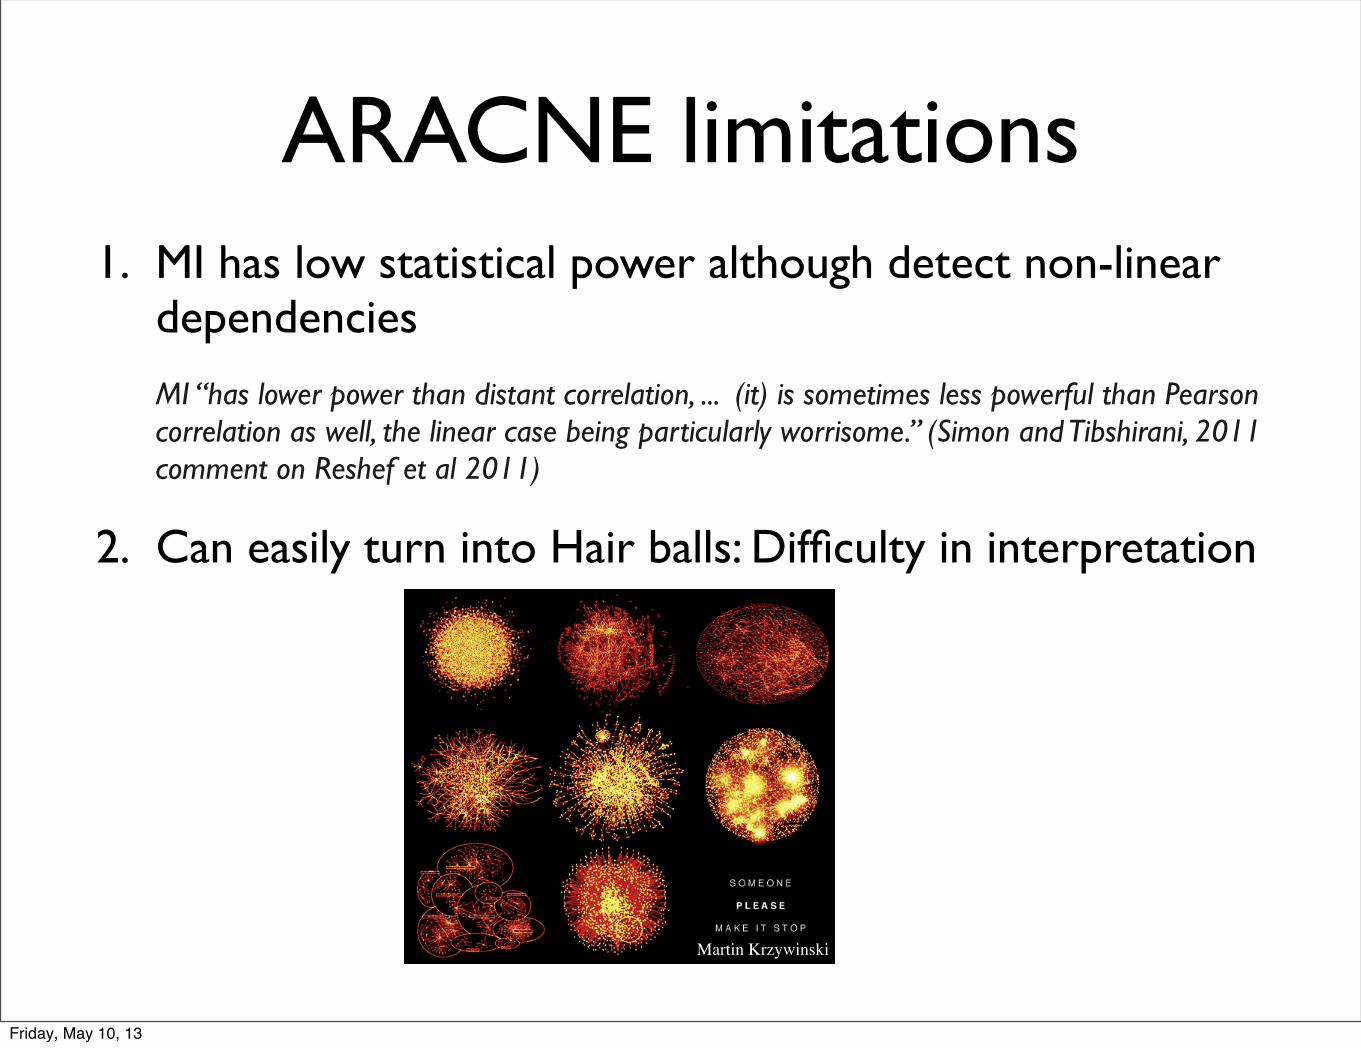
ARACNE limitations1. MI has low statistical power although detect non-linear
dependencies
MI “has lower power than distant correlation, ... (it) is sometimes less powerful than Pearson correlation as well, the linear case being particularly worrisome.” (Simon and Tibshirani, 2011 comment on Reshef et al 2011)
2. Can easily turn into Hair balls: Difficulty in interpretation
Martin Krzywinski
Friday, May 10, 13
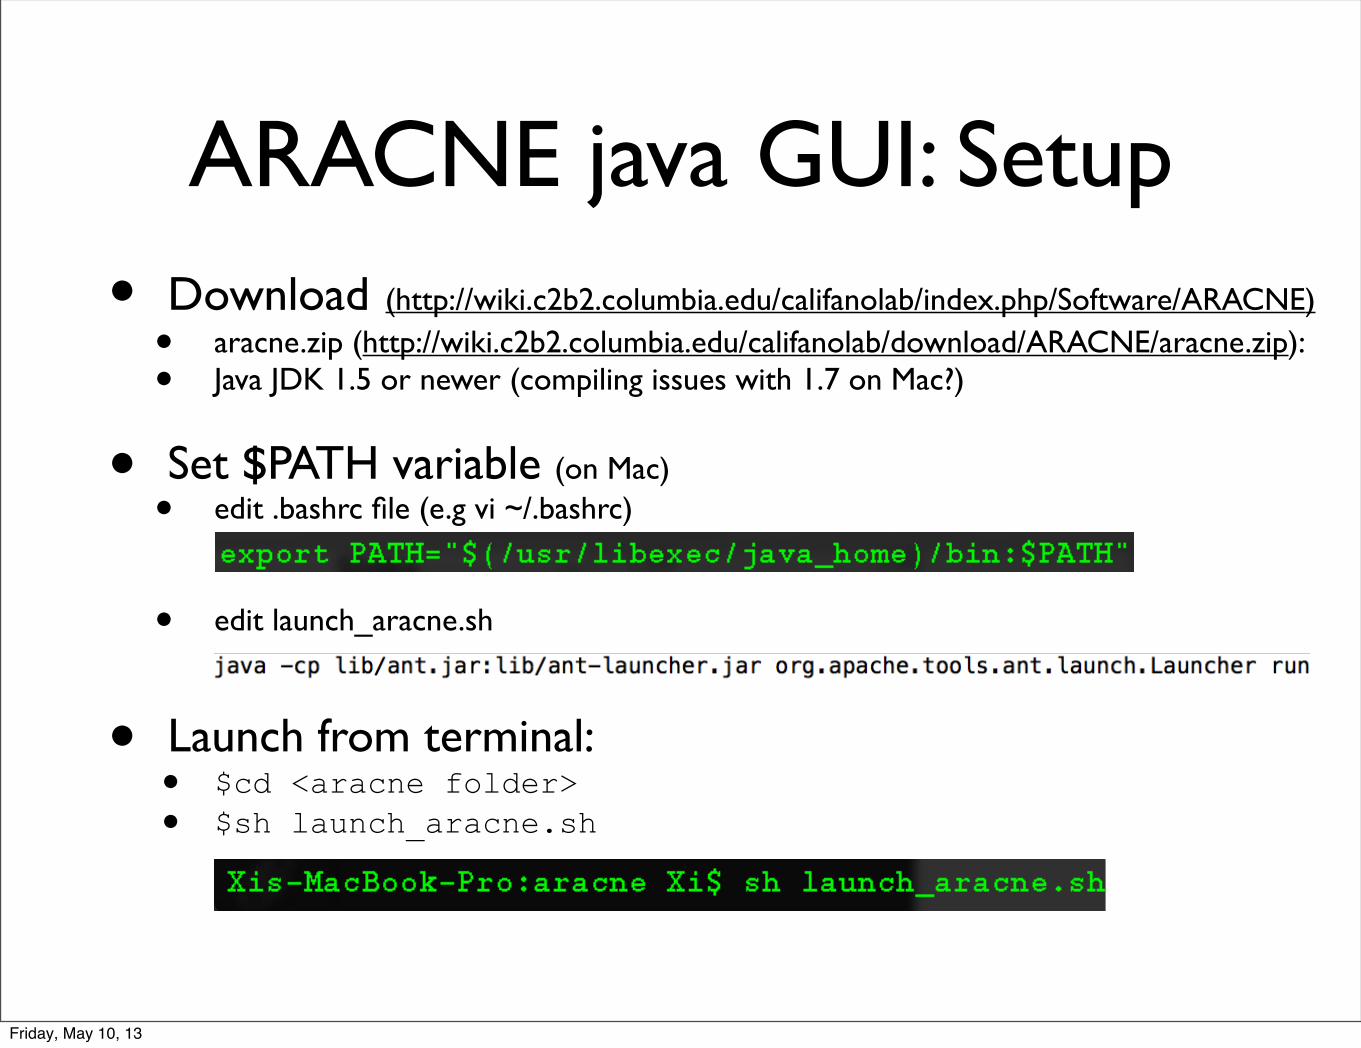
ARACNE java GUI: Setup• Download (http://wiki.c2b2.columbia.edu/califanolab/index.php/Software/ARACNE)
• aracne.zip (http://wiki.c2b2.columbia.edu/califanolab/download/ARACNE/aracne.zip): • Java JDK 1.5 or newer (compiling issues with 1.7 on Mac?)
• Set $PATH variable (on Mac)
• edit .bashrc file (e.g vi ~/.bashrc)
• edit launch_aracne.sh
• Launch from terminal:• $cd <aracne folder>
• $sh launch_aracne.sh
Friday, May 10, 13
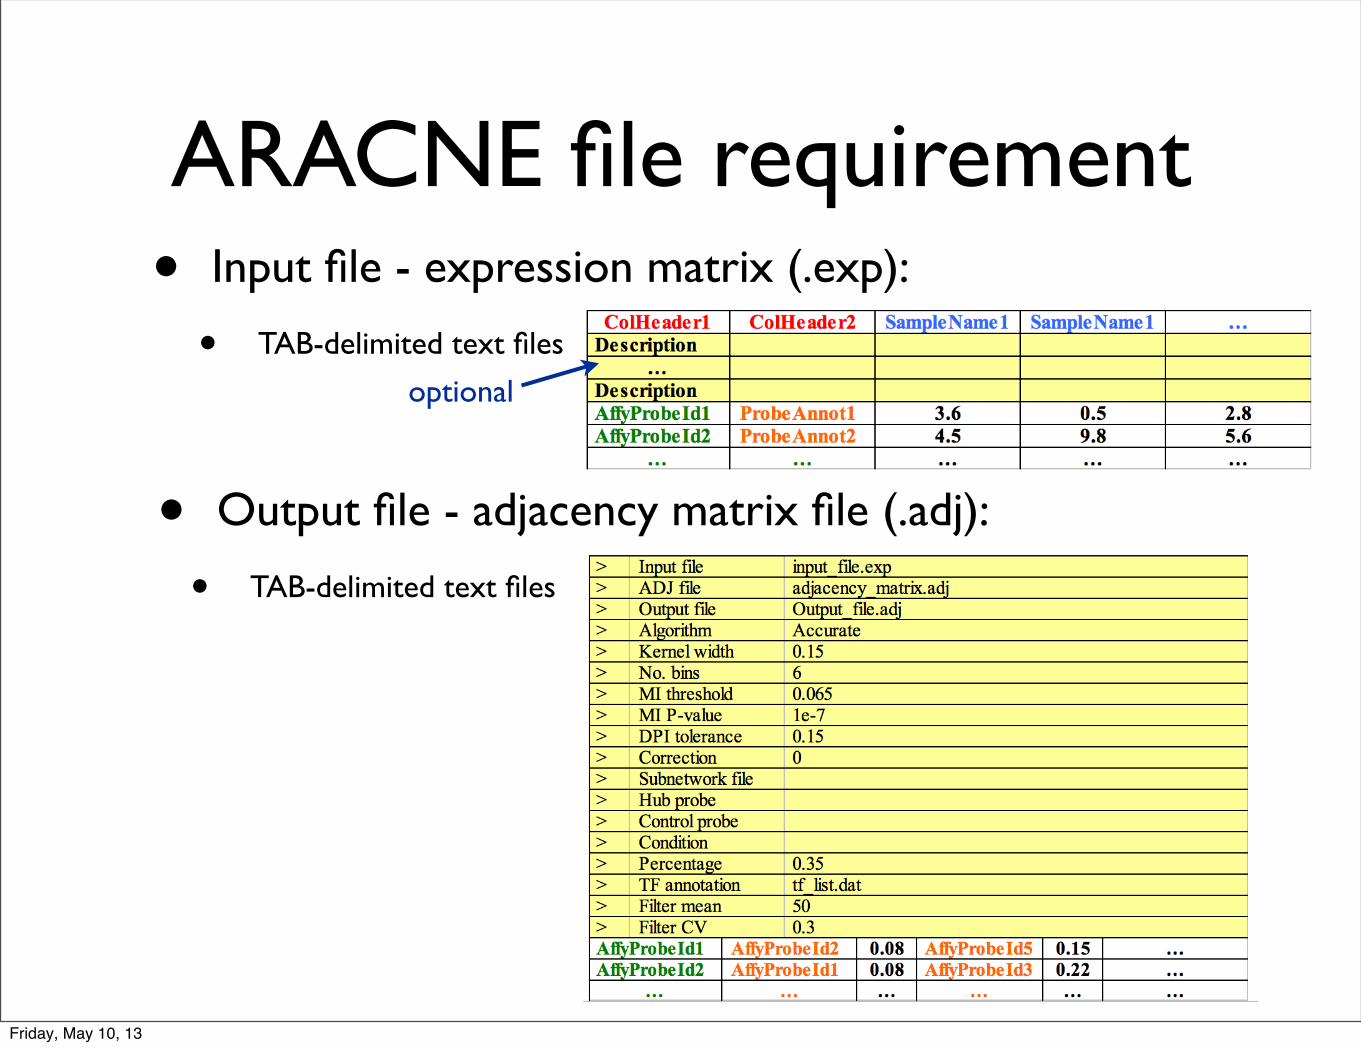
ARACNE file requirement• Input file - expression matrix (.exp):
• TAB-delimited text files
• Output file - adjacency matrix file (.adj):
• TAB-delimited text files
optional
Friday, May 10, 13
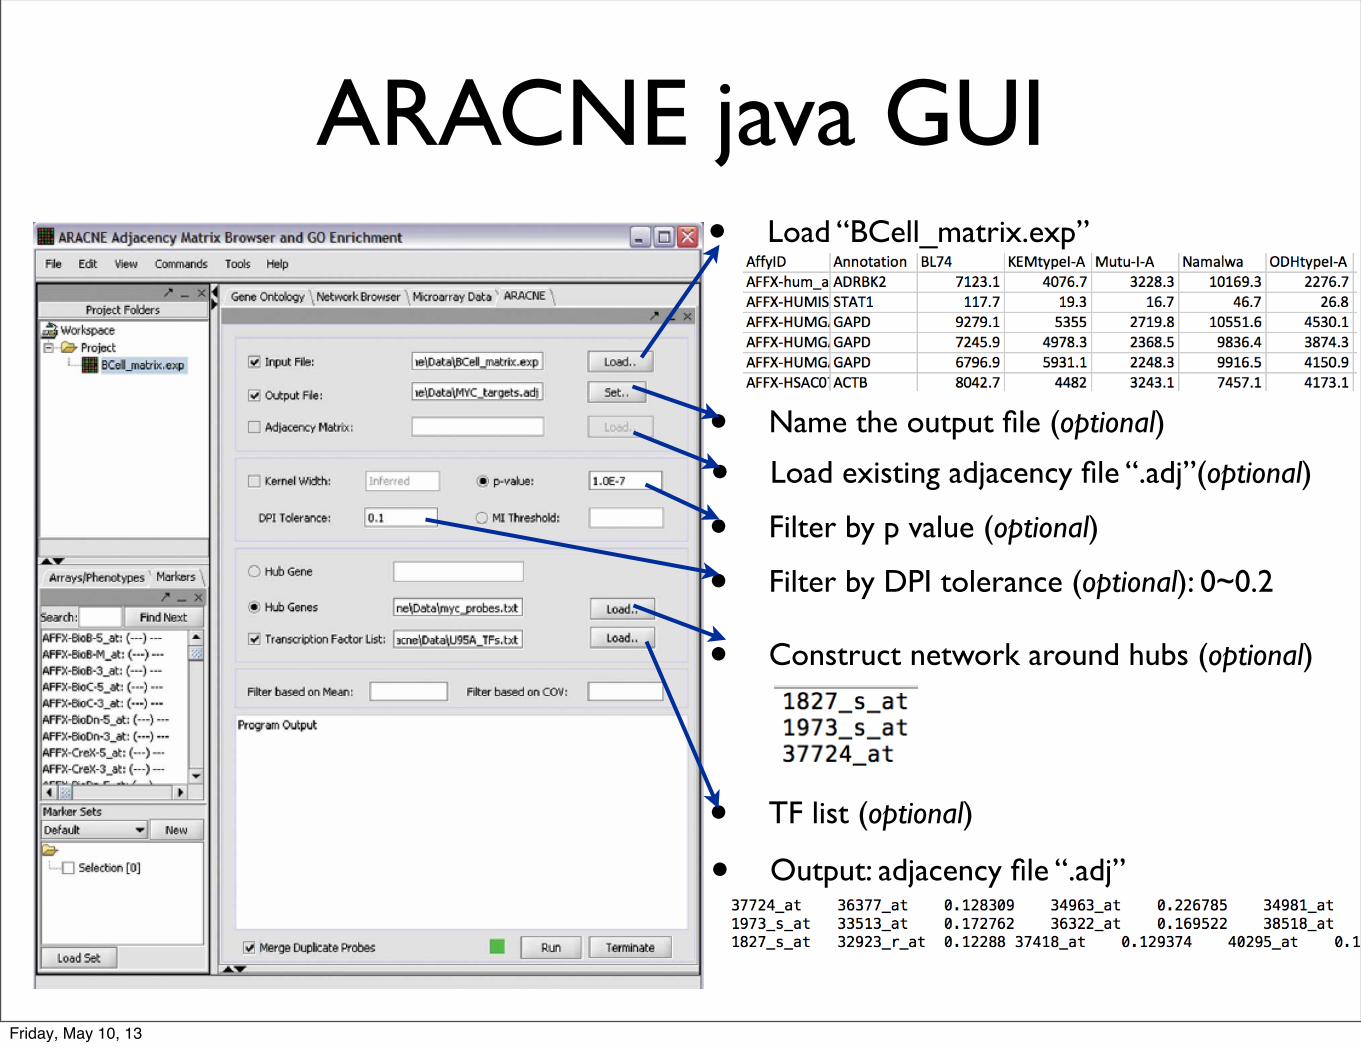
ARACNE java GUI• Load “BCell_matrix.exp”
• Construct network around hubs (optional)
• TF list (optional)
• Name the output file (optional)
• Filter by p value (optional)
• Filter by DPI tolerance (optional): 0~0.2
• Output: adjacency file “.adj”
• Load existing adjacency file “.adj”(optional)
Friday, May 10, 13

ARACNE java GUI• Network visualization
• Network Browser -> Load -> Draw -> Cytoscape
Friday, May 10, 13
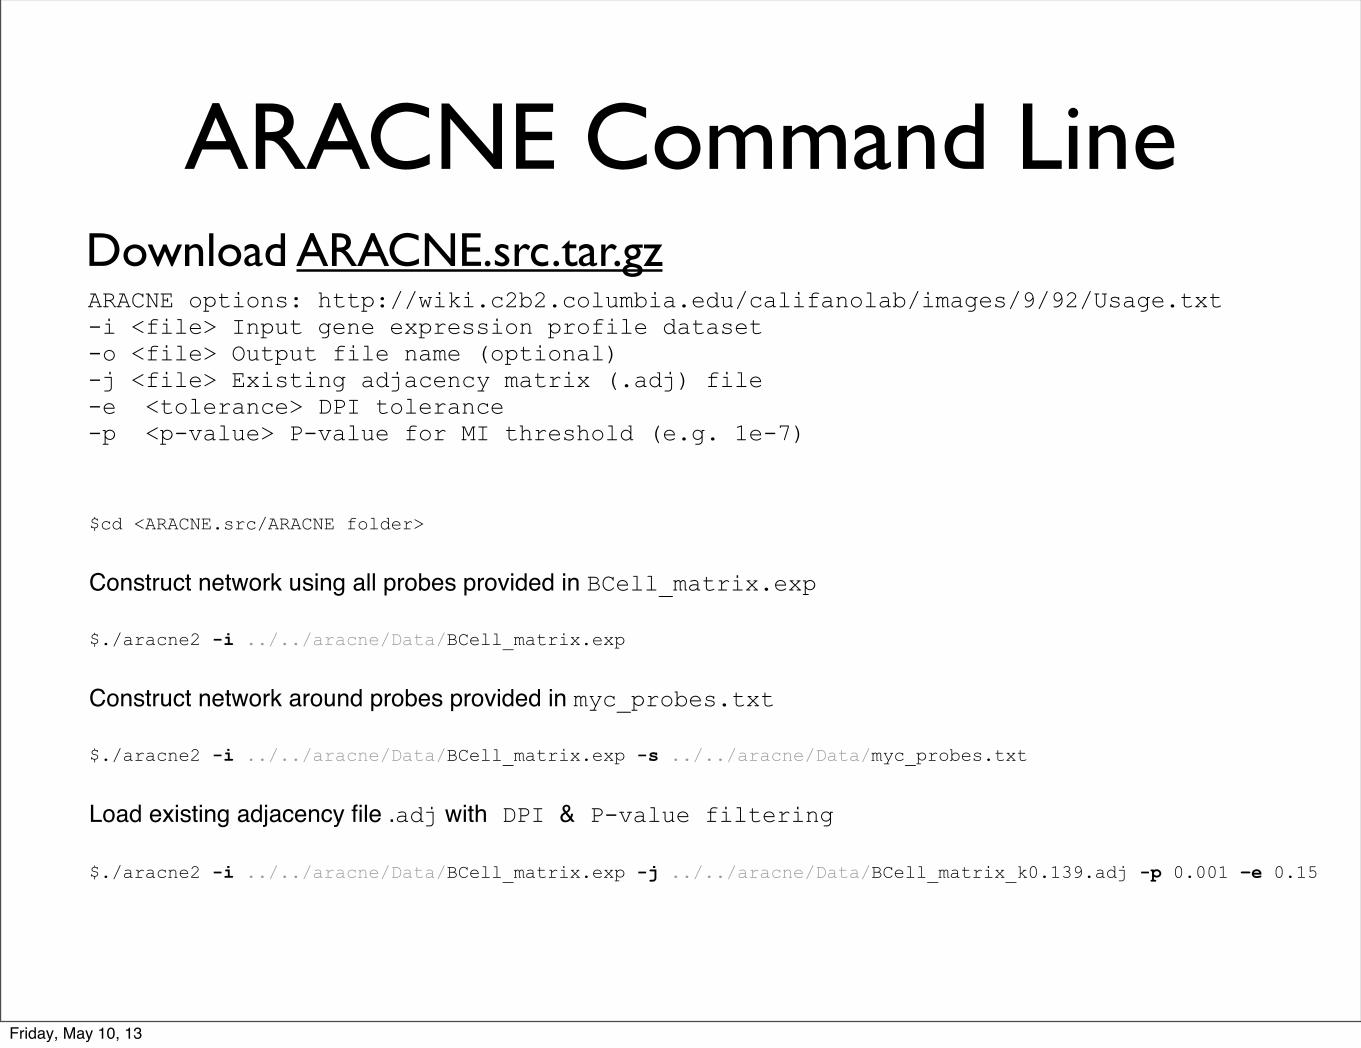
ARACNE Command Line
$cd <ARACNE.src/ARACNE folder>
Construct network using all probes provided in BCell_matrix.exp
$./aracne2 -i ../../aracne/Data/BCell_matrix.exp
Construct network around probes provided in myc_probes.txt
$./aracne2 -i ../../aracne/Data/BCell_matrix.exp -s ../../aracne/Data/myc_probes.txt
Load existing adjacency file .adj with DPI & P-value filtering
$./aracne2 -i ../../aracne/Data/BCell_matrix.exp -j ../../aracne/Data/BCell_matrix_k0.139.adj -p 0.001 –e 0.15
Download ARACNE.src.tar.gzARACNE options: http://wiki.c2b2.columbia.edu/califanolab/images/9/92/Usage.txt-i <file> Input gene expression profile dataset-o <file> Output file name (optional)-j <file> Existing adjacency matrix (.adj) file-e <tolerance> DPI tolerance-p <p-value> P-value for MI threshold (e.g. 1e-7)
Friday, May 10, 13

References• Basso, K., Margolin, A. a, Stolovitzky, G., Klein, U., Dalla-Favera, R., & Califano, A. (2005). Reverse
engineering of regulatory networks in human B cells. Nature genetics, 37(4), 382-90. doi:10.1038/ng1532
• Margolin, A. a, Nemenman, I., Basso, K., Wiggins, C., Stolovitzky, G., Dalla Favera, R., & Califano, A. (2006). ARACNE: an algorithm for the reconstruction of gene regulatory networks in a mammalian cellular context. BMC bioinformatics, 7 Suppl 1, S7. doi:10.1186/1471-2105-7-S1-S7
• Margolin, A. a, Wang, K., Lim, W. K., Kustagi, M., Nemenman, I., & Califano, A. (2006). Reverse engineering cellular networks. Nature protocols, 1(2), 662-71. doi:10.1038/nprot.2006.106
• Carro, M. S., Lim, W. K., Alvarez, M. J., Bollo, R. J., Zhao, X., Snyder, E. Y., Sulman, E. P., et al. (2010). The transcriptional network for mesenchymal transformation of brain tumours. Nature, 463(7279), 318-25. Nature Publishing Group. doi:10.1038/nature08712
• SIMON, N., and TIBSHIRANI R.. "comment on “detecting novel associations in large data sets” by Reshef et al, Science dec 16, 2011." Science (2011).
• Reshef et al (2011) Detecting Novel Associations in Large Data Sets. Science: 1518-1524. [DOI:10.1126/science.1205438]
Friday, May 10, 13