guide to results-based planning and facilitation...
TRANSCRIPT
Guide to Results-BasedPlanning and Facilitation:
Achieving Results and Equity forVulnerable Children and Youth
NATIONAL RESULTS & EQUITY COLLABORATIVE

About NREC
The National Results and Equity Collaborative is a new and game changing approach to ac-celerating positive and equitable results for children, youth, families and communitiesthroughout the United States. It enables networks of funders, technical assistance providers,
intermediary organizations, public and private civic and service organizations, government andothers to work together in greater alignment to help more vulnerable young people succeed frombirth throughout adulthood.
Our PurposeAs a newly formed voluntary organization, NREC aims to (1) accelerate positive results for vulner-able children throughout the country by creating a national network to align results-basedTA, meas-ures, effective strategies and solutions across multiple national and local initiatives; and, and in sodoing, (2) promote consistency and greater impact in the use of results-based methodologies atthe federal, state and local levels. As these elements are developed and tested, the collaborative willfunction as an open source peer network, with ever expanding circles of leaders testing and usingthis approach and sharing what they are learning with a network of peers throughout the country.
Our GoalsBy working closely together and recognizing that we are all in the same enterprise, NREC promotesalignment on several important dimensions of a results-based approach, including:
� A results and indicators framework that can serve as a common core to which communities andinitiatives can add their unique additional indicators and/or language:
� A shared commitment to building community capacity, allowing multiple initiatives to generateevidence about how community capacities contribute to results;
� A willingness to share tools and materials that support strategy development and on an ever-increasing knowledge base; and
� A willingness to use a common “results and data aggregator” tool - the Results Scorecard -as a common approach and tool for capturing the process, beginning with an initial cohort ofcommunities.
This Guide was created with the generous support of The Annie E. Casey Foundation andis based upon the principles of Results-Based Accountability™, developed by Mark Fried-man, author of Trying Hard is Not Good Enough: How to Produce Measurable Improvementsfor Customers and Communities (2005).
1
Table of ContentsOverview and Purpose ..................................................................................................................2
Introduction ....................................................................................................................................4
What is RBA? ........................................................................................................................4
How Does RBAWork? ..........................................................................................................4
Why Use RBA? ......................................................................................................................5
Putting the Key Principles Into Action ............................................................................................6
Maintaining Language Discipline ..........................................................................................6
Tool for Creating a Common Language ................................................................................7
The Outline of Planning Process ..................................................................................................8
Leadership and Stakeholders ................................................................................................8
Basic Process ........................................................................................................................9
Step-By-Step Planning Guidance ................................................................................................11
Prioritize Results and Indictors ............................................................................................11
Graph Each Prioritized Indicator ..........................................................................................12
Hold A Community Convening ............................................................................................12
Further Refine Action Plan ..................................................................................................13
Leadership Approval ............................................................................................................14
Implementation, On-going Review and Refinement ............................................................14
Process Planning Tools................................................................................................................16
Turn the Curve Thinking ..............................................................................................................18
Perormance Measure Development for All Partners....................................................................22
Using the Results Scorecard for Planning & Collabortion ..........................................................25
Facilitation Tips and Tricks ..........................................................................................................29
Contact NREC ............................................................................................................................36
Guide to Results-Based Planning and Facilitation:Achieving Results and Equity for Vulnerable Children and Youth

NAT I ONAL RE SULT S AND EQU I TY COLLABORAT I V E
Overview and Purpose
This guide is intended to help leaders and communities achieve positive and equitable resultsfor children and youth. It explains how to use a proven strategic planning discipline -Results-Based Accountability (RBA) - to achieve population level results.1.
Many communities today are working to improve education success and equity for the mostvulnerable children, youth and families. If they choose wrong stratgeies, then it won’t matter thosethings are done well. And if right things are not done well, then it it won’t matter if a communityprioritizes the right strategies. This guide offers leaders and facilitators a framework - Results-Based Accountability™ (RBA)2 - to ensure that community change efforts are guided by both doingthe right things and doing those things well.
This guide addresses how to:
1. select the best strategies to measurably improve and sustain a given condition of well-beingfor a community (e.g., the percentage of children entering school ready to succeed), and
2
2 For a comprehensive explanation of Results-Based Accountability™, read Trying Hard is Not Good Enough,by Mark Friedman and visit www.raguide.org.
1 Other strategic planning approaches, such as Outcomes-Focused Strategic Planning (OFSP) and Six Sigma mayalso be used and the tools referenced in this guide can also accommodate OFSP language.
3
2. ensure accountability for each strategy, activity and partner by measuring the impact ofhow each contributes to achieving the intended results.
RBA is a disciplined approach to decision making that, in the spirit of Lisbeth Schorr’s exhortation,fosters a “clear and unrelenting focus on results.” This guide offers leaders and facilitators at all lev-els a framework and tools to conduct collaborative, rigorous, data-driven decision making, whetherdeveloping and implementing a community-wide initiative or managing the smallest program oractivity.
RBA uses a decision making process, known as “Turn-the-Curve Thinking.” It begins by identify-ing a clear end result, uses data displayed graphically as a trend line (or “curve”) to gauge the ex-tent to which that result is being achieved, and works backwards, systematically and transparently,to determine the best ways to achieve the result.
NREC's members are committed to building greater alignment in the frameworks and data systemsthat national intermediaries and funders use in their work with communities. Founding NREC part-ners are using RBA and the Results Scorecard, the software that supports the use of RBA, as twovehicles for building such consistency.
Guide to Results-Based Planning and Facilitation:Achieving Results and Equity for Vulnerable Children and Youth

NAT I ONAL RE SULT S AND EQU I TY COLLABORAT I V E
IntroductionWhat is Results-Based Accountability™?
Results-Based Accountability™ is a disciplined way of thinking and taking action in commu-nities to improve the lives of children, families, and community as a whole. RBA is also usedby funders, government and community leaders to improve the performance of programs
that contribute to population-level results.
How does RBA work?RBA starts by identifying the end results or desired community conditions and works backwards,step by step, to identify success strategies, policies and programs. For communities, the ends areconditions of well-being for children and families. For example: Families are strong and supportive,children are reading on grade level or children are healthy, safe and developing on track. Forprograms, the ends are how customers or participants are better off when the program works theway it should. For example: The percentage of young children in Head Start programs who areready for school.
4

5
Why use RBA?RBA improves the lives of children, families andcommunities and the performance of programs be-cause it helps:
� Move from talk to action quickly;
� All stakeholders understand strategic planning;
� Surface and challenge assumptions that can bebarriers to innovation;
� Build collaboration and consensus; and
� Use data and transparency to ensure account-ability for both the well-being of children,families and communities and the performanceof contributing programs or activities.
Guide to Results-Based Planning and Facilitation:Achieving Results and Equity for Vulnerable Children and Youth
Key RBA Principles1. Maintain language discipline
2. Start with the desired result oroutcome and work backwards toselect strategies
3. Identify the appropriate level ofaccountability:
a. Population or CommunityAccountability
b. Performance, Partner orProgram Accountability
4. Identify the most powerful head-line performance measures foreach of the three types of per-formance measures:
a. How much do you do?
b. How well do you do it?
c. Is anyone better off?
5. Get from “Talk to Action” using theseven question “Turn the Curve”process.
NAT I ONAL RE SULT S AND EQU I TY COLLABORAT I V E
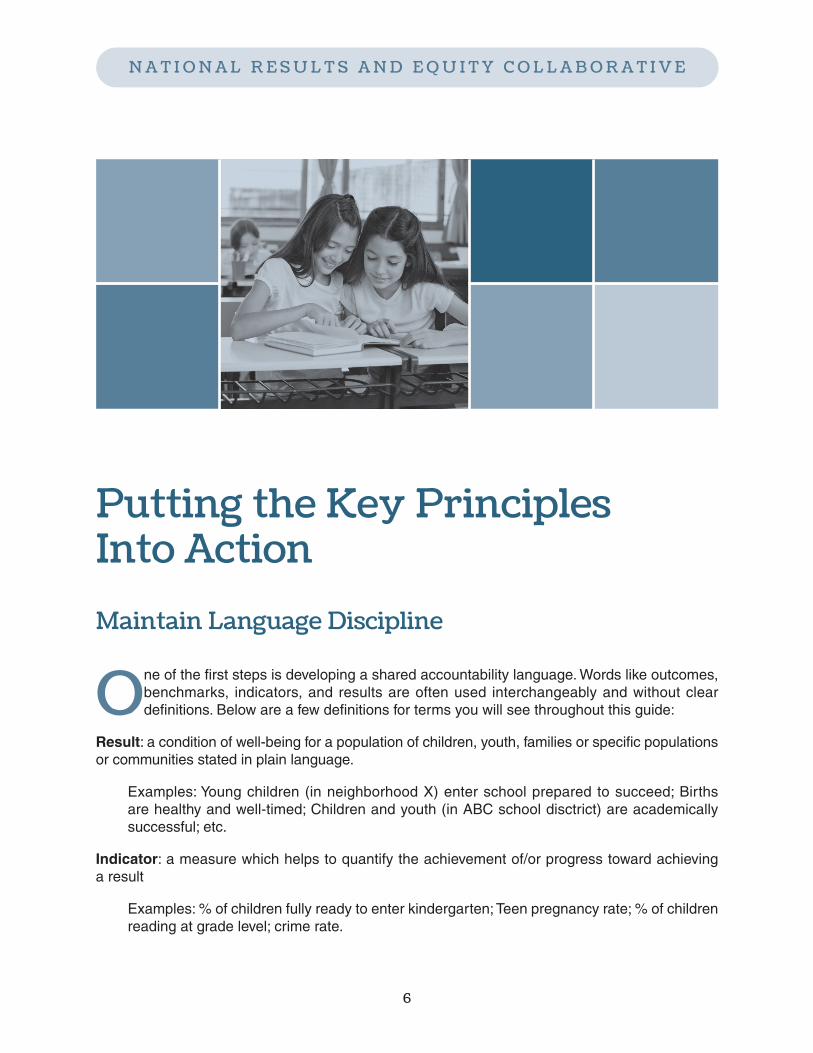
Putting the Key PrinciplesInto ActionMaintain Language Discipline
One of the first steps is developing a shared accountability language.Words like outcomes,benchmarks, indicators, and results are often used interchangeably and without cleardefinitions. Below are a few definitions for terms you will see throughout this guide:
Result: a condition of well-being for a population of children, youth, families or specific populationsor communities stated in plain language.
Examples: Young children (in neighborhood X) enter school prepared to succeed; Birthsare healthy and well-timed; Children and youth (in ABC school disctrict) are academicallysuccessful; etc.
Indicator: a measure which helps to quantify the achievement of/or progress toward achievinga result
Examples: % of children fully ready to enter kindergarten;Teen pregnancy rate; % of childrenreading at grade level; crime rate.
6

7
Story Behind the Data: an analysis of the conditions, causes and forces at work that help explainwhy a baseline of an indicator looks the way it does or why a specific indicator has or hasn’tchanged.
Strategy: a coherent collection of actions with a reasonable chance of improving results andindicators.
Performance Measure: a measure of how well an initiative, service system or collaborative effortis working.
Guide to Results-Based Planning and Facilitation:Achieving Results and Equity for Vulnerable Children and Youth
Tool: Selecting a Common LanguageRBA does not require you to use the same words written above.The table below can help youto select the common language that you want to use in your own coalition, organization or team.For example, if you are used to Outcomes-Focused Strategic Planning, your efforts can usethat strategic planning discipline and language.There is also a “Language Editor “in the “Admin”section of the Results Scorecard that will allow the words selected to be used in the tool.
Framework Idea Possible Modifiers ChoiceChoices
1. Condition of well being for children, Result Population 1.adults, families or communities Outcome Communitystated in plain language. Goal
2. A measure that helps to quantify Indicator Population 2.the achievement of a condition of Measures Communitywell being or progress toward theresult, outcome or goal.
3. A coherent set of actions with a Strategy 3.with a reasonable chance of working.
4. A measure of how well an initiative, Performance 4.program, service system or Measurecollaborative effort is working.
NAT I ONAL RE SULT S AND EQU I TY COLLABORAT I V E
The Planning Process
Before beginning this process it is important to take the time to ensure that there is leadershipsupport from throughout the community. Many types and levels of leadership are necessaryfor a Birth to 8 community change effort to succeed and endure.
Leadership:Typically, at least two levels of leadership should be involved in the process:
1) LeadershipTeam: A public-private, inter-organization and/or community-wide team of individualsat a high enough level to authorize and approve action plans.
2) Planning and Action Team: A public-private inter-organization and/or community wide teammade up of mid-level leaders who are able to meet regularly to develop and implement strategicplans. This team can also plan and facilitate community convenings.
8

9
Stakeholders:In addition to leadership, it is important to be thoughtful about engaging key stakeholders inleadership, action and design and evaluation roles, including: youth, families, employers,neighborhood residents, civic leaders, non-profit organizations and others.
Basic Process:1. Prioritize Results and Indicators: The Leadership Team develops and prioritizes Results andIndicators that will be the primary focus of the planning process based on community conditionsand guidance from those most affected by needed changes (Leadership Teams and Stake-holders). It is assumed that Results and Indicators have already been selected and promotedby the NREC partners you are affiliated with. If not, see Appendix A for a process to selectResults and Indicators.
2.Graph Each Prioritized Result and Indicator: Identify data for each of the primary indicatorsto identify the local trends.Disaggregate data for the primary indicators to identify challenges andpromote equity among sub-populations.
3.Hold Community Convenings:Gather key stakeholders including youth and families from thecommunity to:
a. Analyze each prioritized result and indicator to determine the underlying issues that influencethe indicator and identify key factors that contribute to the progress or lack of progress on theindicator. Use information from completed community needs assessments and/or researchother information. Disaggregate data for primary indicators to analyze how to promote equityamong sub-populations.
b. Review the graph of the indicator and determine the progress or lack of progress that is beingmade on the result and indicator;
c. Identify other important partners that can help to improve the indicator and achieve theprioritized result;
d. Brainstorm “what works” to address the contributing factors and improve the indicators. Thisstep should also include identifying what is already working in the community. This may beaccomplished through a Results Resource Map and Program Directory;
e. Prioritize the best strategies from the brainstormed list of “what works” and develop actionsteps to implement these strategies.
f. Identify common themes among contributing factors and strategies so that unnecessaryduplication is avoided and strategies:
i. Have the highest level of potential impact on the indicator:
Guide to Results-Based Planning and Facilitation:Achieving Results and Equity for Vulnerable Children and Youth
NAT I ONAL RE SULT S AND EQU I TY COLLABORAT I V E
ii. Are strengths-based and promote equity;
iii. Are child and family-focused;
iv. Are feasible and affordable to accomplish within the 3-5 year plan.
4. Further Refine Strategies: Further refine the strategies and action plans for presentationto the Leadership Team, following community convenings.
5. Leadership Approval: Leadership Team reviews the Action Plan and approves it forimplementation.
6.Continue This Process On An Ongoing Basis.
10
Step-By-StepPlanning Guidance1. Prioritize B-8 Results and IndicatorsMany communities already have a set of results and indicators on which they currently collect data.They may have been selected by local, or state government as connected to funding or foundationsand community impact organizations as a part of their vision for work in communities. Using an RBAprocess, communities can look at their collective results and indicators to align activities, and identifygaps.This will result in a collaborative plan that can be used across agencies and results areas. In thatspirit, NREC Partners have identified common B-8 results and indicators that partners have incommon that we could collectively focus on to align national efforts.
RESULT: Families are strong and supportive
INDICATOR: Families read regularly to their children
RESULT: Births are healthy
INDICATOR: Infants are born at healthy weight
Guide to Results-Based Planning and Facilitation:Achieving Results and Equity for Vulnerable Children and Youth
1 1

NAT I ONAL RE SULT S AND EQU I TY COLLABORAT I V E
RESULT: Children are safe, healthy and developing on track
INDICATOR: Children are free from unintentional injury
INDICATOR: Children have access to a consistent primary health care provider.
INDICATOR: Children with developmental concerns identified through screening who accessneeded treatment or services
RESULT: Children are emotionally, socially and cognitively ready for school
INDICATOR: Children enter school ready to succeed
RESULT: Children perform on grade level
INDICATOR: Children attend school or pre-school regularly
INDICATOR: Children are reading on grade level
INDICATOR: Children are performing math on grade level
2. Graph Each Prioritized IndicatorEach indicator should be graphed to show a history of at least 3 historical data points and a futureforecast for 3 periods if nothing is done differently. It is also important to disaggregate the data tobe able to assess disparities among sub-populations.
3. Hold a Results-Driven Community ConveningHolding a Results-Driven Community Convening requires:
a. Pre-work:
i. Obtain a location that can comfortably seat 60-100 people at round or rectangular tables of6-8 people each.
ii. Train or orient facilitators. It is helpful to have 1 facilitator for each table. These facilitatorscan also be members of the Action Planning Team.
iii. Develop poster-sized “Turn the Curve” worksheets for each result and indicator.
iv. Invite a wide variety of stakeholders at least three weeks in advance of the event, includingrepresentation from throughout the county; various parts of the community; all types of childand family service providers; youth and families, civic leaders, neighborhood residents,employers, faith leaders, cultural institution leaders (libraries and museums) etc..
v. Hold more than one Community Convening if necessary.
12
13
b. At the Community Convening:
i. Have each table labeled with the result and indicator that people will address. Try toencourage diversity at each table. Have a poster-sized “Turn the CurveWorksheet” at eachtable.
ii. Provide a brief overview of the purpose of the meeting.
iii. Lead each table through the steps of analyzing the result and indicator and developingstrategies to address these contributing factors.
iv. Ask a spokesperson from each table to “passionately sell” the strategies that they arerecommending.
v. Post all posters around the room.
vi. Provide each person with 3 dots or 3 votes to prioritize the strategies that:1. Have the highest level of potential impact on the indicator:2. Are strengths-based and promote racial and economic equity;3. Are child and family-focused;4. Have considered strategies focused on sub-populations; and5. Are feasible and affordable to accomplish within the 3-5 year plan.
vii. Summarize and facilitate a whole group dialogue around common themes that theyencountered.
4. Further Refine the Action PlanAfter the Community Convening the Action Planning Committee should:
i. Type up results for each worksheet;
ii. Refine common themes;
iii. Refine the strategies and action steps by:1. Combining duplicative strategies;2. Make sure that the action steps are specific and clearly stated;3. Identify if other strategic plans or agencies are currently tackling a particular actionstep and note this; and
4. Identify people or groups who will be responsible for the each action step.
Guide to Results-Based Planning and Facilitation:Achieving Results and Equity for Vulnerable Children and Youth
NAT I ONAL RE SULT S AND EQU I TY COLLABORAT I V E
5. Leadership ApprovalThe revised action plan should be sent to the Leadership Team one week before a meeting forfinal approval. A meeting can then be held to:
a. Review the results of the Community Convening;
b. Identify ways to further align the strategies;
c. Ensure that the plan is aligned with other agency strategic plans. Ideally, this process willidentify the most important results and indicators to improve, the key contributing factors thatunderlie the results and indicator and the best strategies to address these contributing factors.The result should be a holistic approach to improving the conditions of well-being of the children,youth, adults and families in the community. The Leadership Team can then make sure thatall aspects of the plan are being addressed. This may be accomplished by combining variousstrategic plans of multiple players and partners. It is important to acknowledge the importantrole of various task forces, services systems, organizations and coalitions to align the work ofeach to improve the indicators in the most effective and efficient way possible.
d. No single agency, service system, program or collaborative can improve the results and indicatorsalone. In addition to aligning the work of all these entities, it is important to engage members of thecommunity in all aspects of the work to both inform and sustain successful efforts.
6. Implementation, Ongoing Review and Refinementa. The action plan is designed to involve all relevant agencies and the community. Each partner mayalso have another strategic plan that they are required to develop.This plan works best if it is linkedto the other strategic plans.Separate programs can use particular strategies from this plan and addother strategies to it if necessary. Implementation should follow from the action steps.
b. This action planning process is very data driven, dynamic and results-focused. Ongoing reviewof the indicators and adjustment of the plan as needed is imperative.
c. It is recommended that the action plan be continuously revisited quarterly with the LeadershipTeam.
i. Action Planning Team Review meetings should focus on ensuring that the action steps arebeing completed on a timely basis and revising action steps as needed. If action steps are notbeing completed on a timely basis, the Action Planning Team can identify the barriersimpeding completion and brainstorm “what works” to remove the barriers.
14

15
ii. Leadership Team should focus on the larger strategies and data. The agenda for theLeadership Team will be to:
1. Review new data, including new disaggregated data on sub-populations2. Review new information on the story behind the data3. Ensure that the current strategies are the correct strategies4. Update what works with the new information.
d. It is recommended that all stakeholders in the Action Plan use Turn the Curve Thinking with theirheadline performance measures.
Guide to Results-Based Planning and Facilitation:Achieving Results and Equity for Vulnerable Children and Youth

NAT I ONAL RE SULT S AND EQU I TY COLLABORAT I V E
Planning Process ToolsReport Card
Many communities publish an annual Report Card that provides data for the results andindicators being tracked. Communities use the release of the Report Card to highlightprogress on key indicators and challenges that still remain for the community to tackle.
16
Automated Results ScorecardThe Results Scorecard® is s a web-based tool used by all of the partners in the NRECcollaborative, designed to help communities, agencies and organizations to track results,indicators and performance measures and to strategically plan for improving these metrics.This low-cost software simplifies and increases the effectiveness of the Action PlanningProcess by giving all participants access to key data wherever they are located or workingfrom. It also increases the flexibility of the planning process engaging communities tosimultaneously be forward-thinking and respond to changes in community conditions quickly.
17
Guide to Results-Based Planning and Facilitation:Achieving Results and Equity for Vulnerable Children and Youth
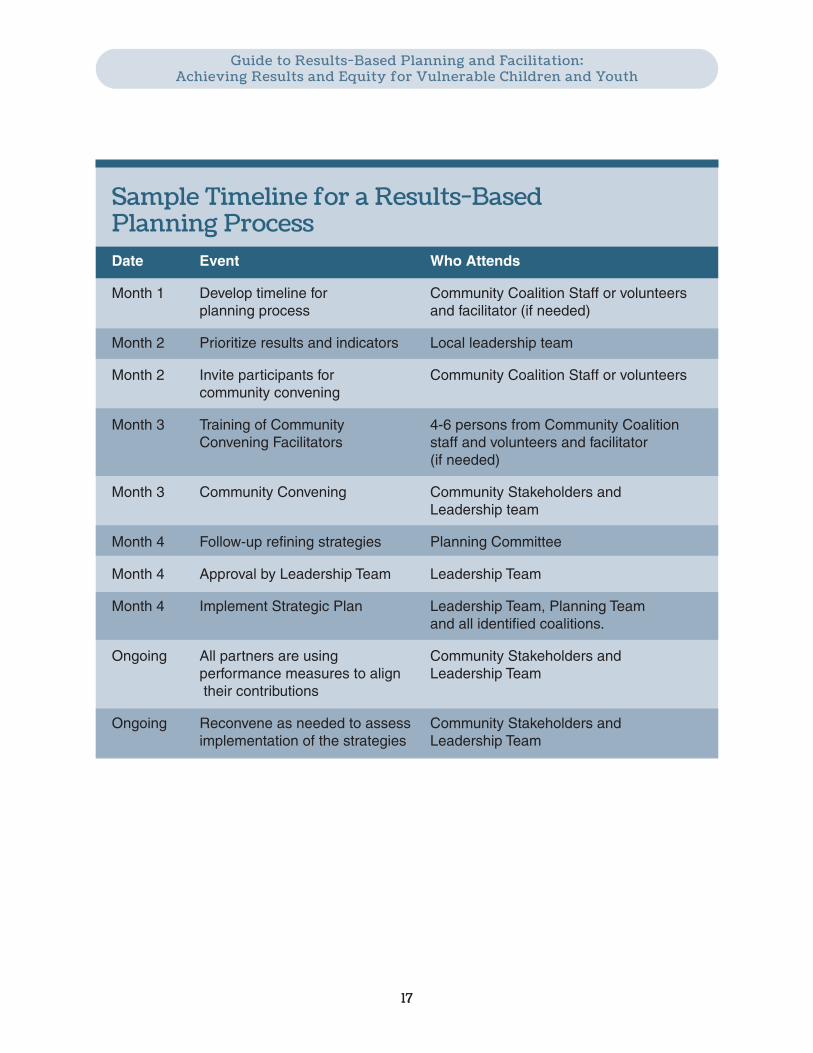
Sample Timeline for a Results-BasedPlanning ProcessDate Event Who Attends
Month 1 Develop timeline for Community Coalition Staff or volunteersplanning process and facilitator (if needed)
Month 2 Prioritize results and indicators Local leadership team
Month 2 Invite participants for Community Coalition Staff or volunteerscommunity convening
Month 3 Training of Community 4-6 persons from Community CoalitionConvening Facilitators staff and volunteers and facilitator
(if needed)
Month 3 Community Convening Community Stakeholders andLeadership team
Month 4 Follow-up refining strategies Planning Committee
Month 4 Approval by Leadership Team Leadership Team
Month 4 Implement Strategic Plan Leadership Team, Planning Teamand all identified coalitions.
Ongoing All partners are using Community Stakeholders andperformance measures to align Leadership Teamtheir contributions
Ongoing Reconvene as needed to assess Community Stakeholders andimplementation of the strategies Leadership Team
NAT I ONAL RE SULT S AND EQU I TY COLLABORAT I V E
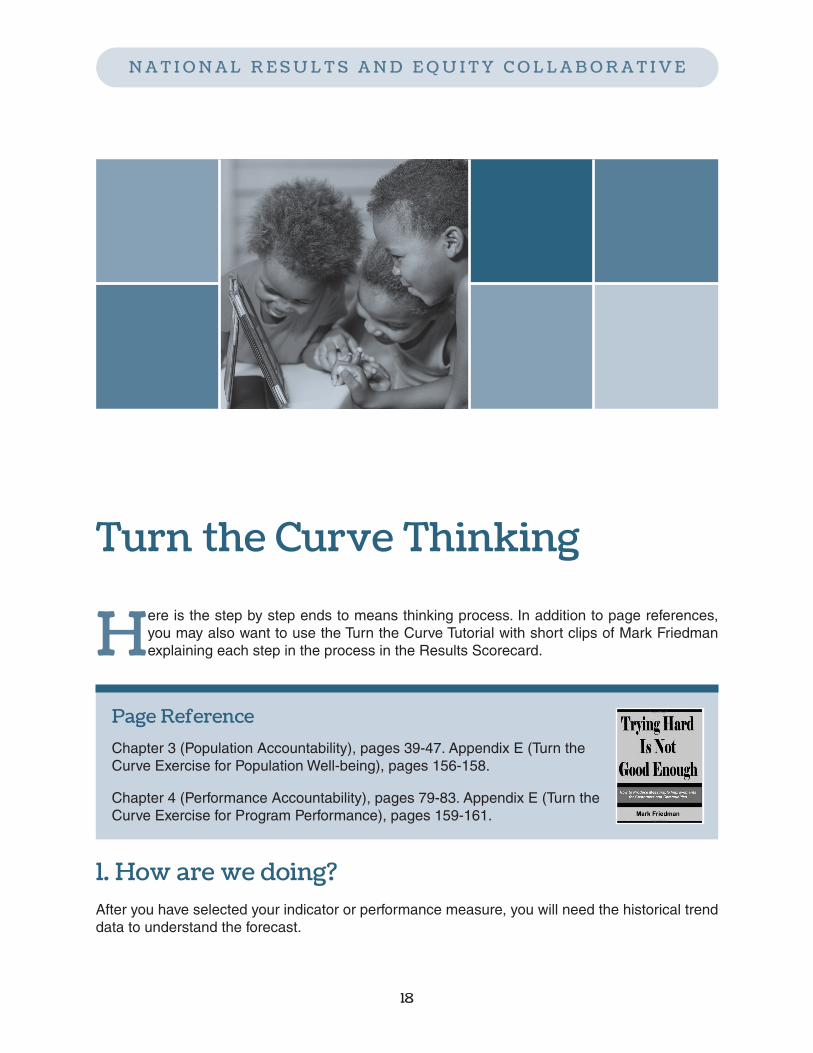
Turn the Curve Thinking
Here is the step by step ends to means thinking process. In addition to page references,you may also want to use the Turn the Curve Tutorial with short clips of Mark Friedmanexplaining each step in the process in the Results Scorecard.
1. How are we doing?After you have selected your indicator or performance measure, you will need the historical trenddata to understand the forecast.
18
Page ReferenceChapter 3 (Population Accountability), pages 39-47. Appendix E (Turn theCurve Exercise for Population Well-being), pages 156-158.
Chapter 4 (Performance Accountability), pages 79-83. Appendix E (Turn theCurve Exercise for Program Performance), pages 159-161.
19
2. What is the Story Behind the Curve?List the key factors underlying the historic baseline and forecast for the indicator or performancemeasure. Identify: (1) contributing factors that are supporting progress and (2) restricting factorsthat are hindering progress. Progress is defined as turning the curve of the baseline (or acceler-ating the curve if it is already headed in the right direction).
It is important to identify not only the most immediate and easily observed factors impacting thebaseline (i.e., the “proximate causes”), but to engage in the kind of rigorous analysis that willidentify the underlying or more systemic factors (i.e., the “root causes”). It is also important toconduct additional research where necessary and feasible. Also focus on root causes for thedisaggregated trends focused on promoting equity among sub-populations.
Once the root causes have been identified, prioritize those root causes according to which havethe greatest influence on progress and, therefore, are the most critical to address to improveprogress. Dig deep for root causes. Don’t settle for easy rhetorical answers.
The best format is a “bullet” for each root cause with a brief header that is underlined and a briefdescription of the root cause.
3. Partners?Identify potential partners, including current ones, who may have a role to play in improvingprogress.The identification of root causes impacting progress will often point the way to the typesof partners who should be engaged. Identify partners that can help reach sub-populations.
The best format is to bullet each partner with a short description of their role.
4. WhatWorks?Before selecting a strategy or action plan to undertake to turn the curve of the baseline, it isnecessary to determine whether what would work to turn the curve is known. It is also important tobe sure to explore the full range of options for strategies or action plans.A strategy or action plan may,of course, involve the discontinuation of existing activities as well as the implementation of new ones.And in most cases a strategy or action plan should be multi-year and integrated. The following arecriteria to consider in developing options:
� Does the option address one or more of the root causes you have identified?
� Have the people affected informed the strategy?
� Is the proposed option evidence-based?
Guide to Results-Based Planning and Facilitation:Achieving Results and Equity for Vulnerable Children and Youth

NAT I ONAL RE SULT S AND EQU I TY COLLABORAT I V E
� Have “no-cost/low-cost” options been developed?
� Have options been explored that focus on promoting equity among sub-populations?
� Is additional research necessary to determine what would work or to identify other options?
5. Strategy/Action Plan?Selecting the proposed strategy or action plan involves applying five criteria to each of the options:leverage, feasibility (or reach), specificity, and values.
� Leverage: How strongly will the proposed strategy or action impact progress as measured bythe baselines?
� Feasibility (or reach). Is the proposed strategy or action plan feasible? Can it be done?
� Specificity. Is the strategy or action plan specific enough to be implemented? Is there a timelinewith deliverables that answers the questions:Who?What? When?Where? How?
� Values. Is the strategy consistent with the values of the community and/or agency?
� Equity.Will the strategy help accelerate equity among sub-populations?
Once elements of the proposed strategy or action plan are selected, list them in order of priority.The best format is a “bullet” for each element which provides a brief header that is underlined anda brief description of the element.The specificity of your action plan can be outlined in the Actionson the Turn the Curve Template. (see page 21)
20
21
Guide to Results-Based Planning and Facilitation:Achieving Results and Equity for Vulnerable Children and Youth
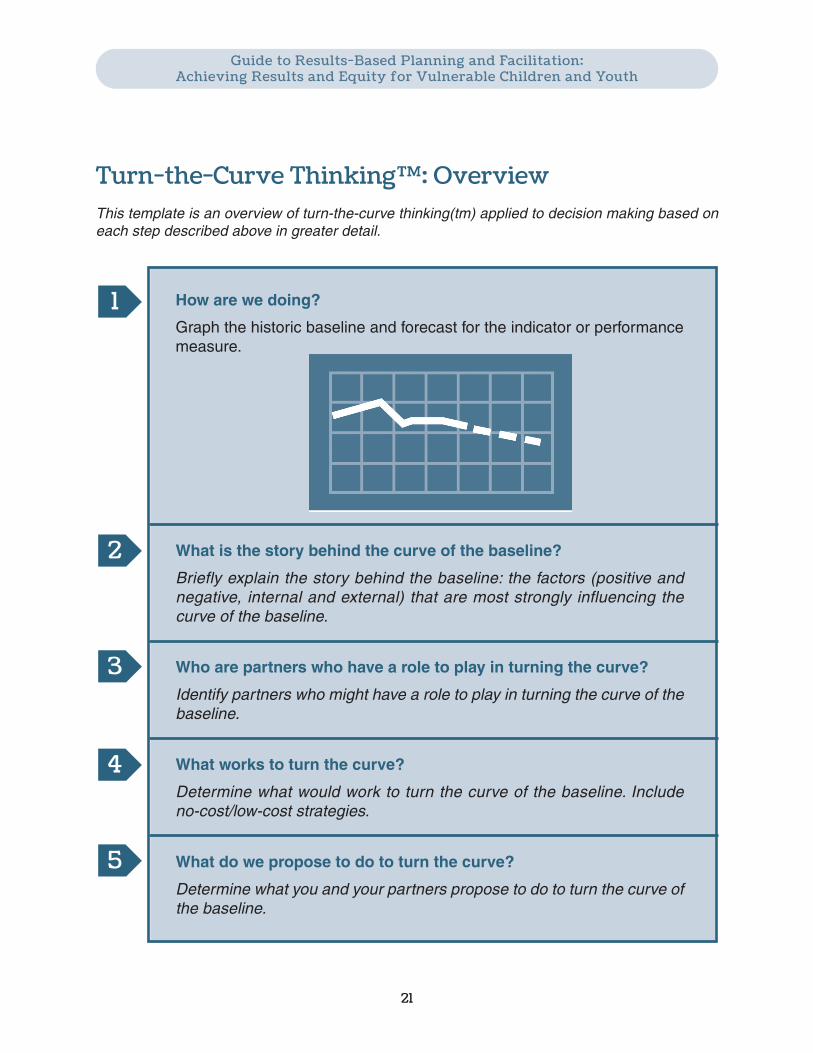
Turn-the-Curve Thinking™: OverviewThis template is an overview of turn-the-curve thinking(tm) applied to decision making based oneach step described above in greater detail.
How are we doing?
Graph the historic baseline and forecast for the indicator or performancemeasure.
What is the story behind the curve of the baseline?
Briefly explain the story behind the baseline: the factors (positive andnegative, internal and external) that are most strongly influencing thecurve of the baseline.
Who are partners who have a role to play in turning the curve?
Identify partners who might have a role to play in turning the curve of thebaseline.
What works to turn the curve?
Determine what would work to turn the curve of the baseline. Includeno-cost/low-cost strategies.
What do we propose to do to turn the curve?
Determine what you and your partners propose to do to turn the curve ofthe baseline.
1
2
3
4
5

Performance MeasureDevelopment for all Partners
1. Getting Started
The selection of performance measures is the first and most essential step in the performanceplanning process for each element of the Population Accountability strategy.
Your organization, partnership or coalition acts to improve the quality of life of its community and/ortarget population. Performance measures simply give you the means to know how well theseefforts, including the efforts of each partner, are working to improve those lives.
NAT I ONAL RE SULT S AND EQU I TY COLLABORAT I V E
22
Page ReferenceChapter 4 (Performance Accountability), page 65. Appendix G (A 5-stepmethod for identifying performance measures for any program in 45 min-utes), page 164. Appendix H (More Performance Measurement Examples),page 167.
23
Guide to Results-Based Planning and Facilitation:Achieving Results and Equity for Vulnerable Children and Youth
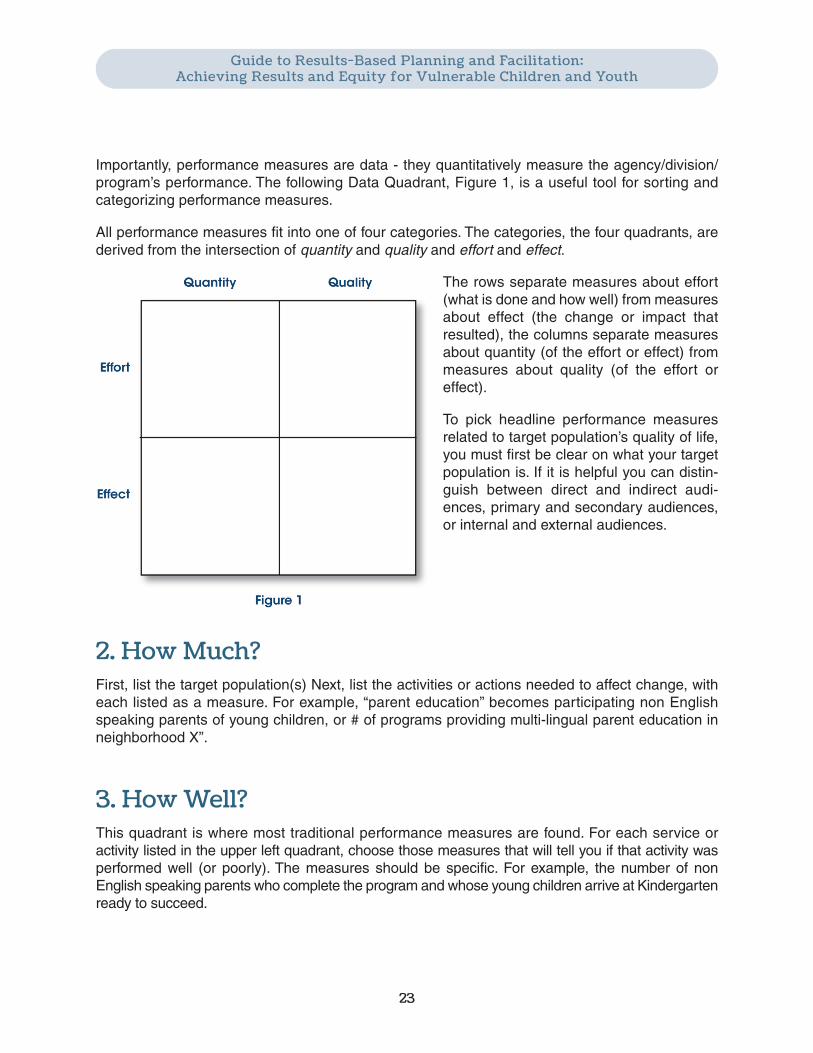
Importantly, performance measures are data - they quantitatively measure the agency/division/program’s performance. The following Data Quadrant, Figure 1, is a useful tool for sorting andcategorizing performance measures.
All performance measures fit into one of four categories. The categories, the four quadrants, arederived from the intersection of quantity and quality and effort and effect.
The rows separate measures about effort(what is done and how well) from measuresabout effect (the change or impact thatresulted), the columns separate measuresabout quantity (of the effort or effect) frommeasures about quality (of the effort oreffect).
To pick headline performance measuresrelated to target population’s quality of life,you must first be clear on what your targetpopulation is. If it is helpful you can distin-guish between direct and indirect audi-ences, primary and secondary audiences,or internal and external audiences.
2. HowMuch?First, list the target population(s) Next, list the activities or actions needed to affect change, witheach listed as a measure. For example, “parent education” becomes participating non Englishspeaking parents of young children, or # of programs providing multi-lingual parent education inneighborhood X”.
3. HowWell?This quadrant is where most traditional performance measures are found. For each service oractivity listed in the upper left quadrant, choose those measures that will tell you if that activity wasperformed well (or poorly). The measures should be specific. For example, the number of nonEnglish speaking parents who complete the program and whose young children arrive at Kindergartenready to succeed.
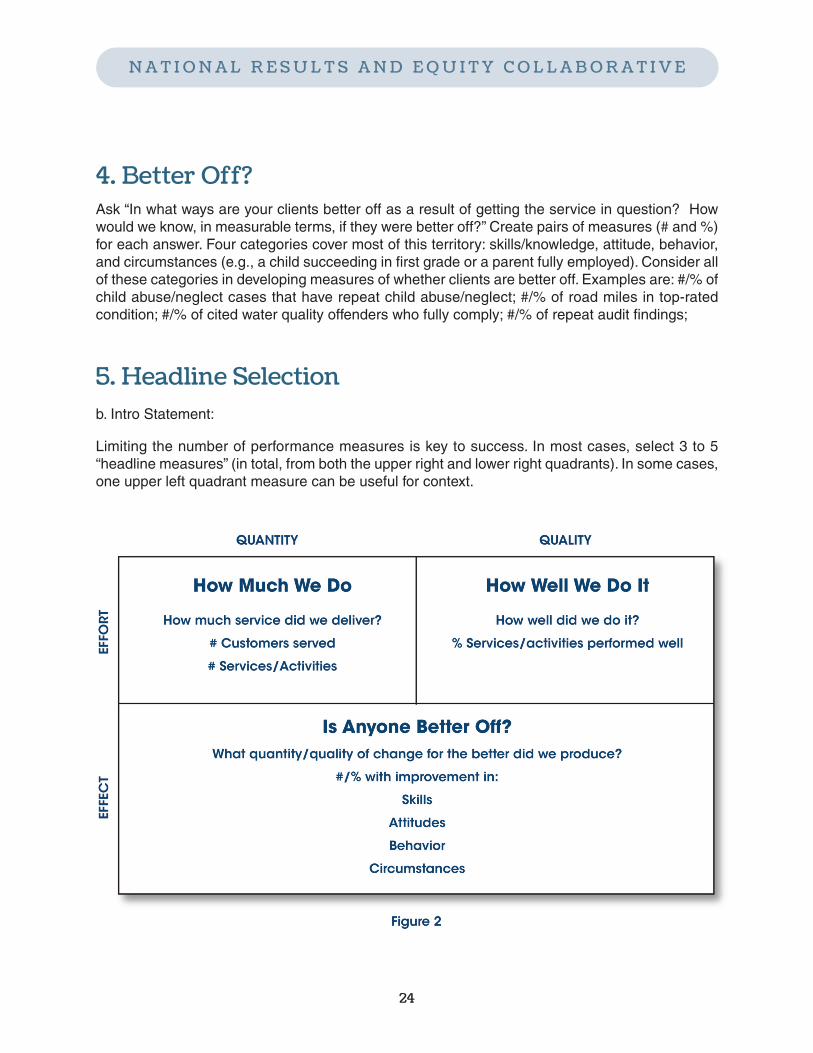
4. Better Off?Ask “In what ways are your clients better off as a result of getting the service in question? Howwould we know, in measurable terms, if they were better off?” Create pairs of measures (# and %)for each answer. Four categories cover most of this territory: skills/knowledge, attitude, behavior,and circumstances (e.g., a child succeeding in first grade or a parent fully employed). Consider allof these categories in developing measures of whether clients are better off. Examples are: #/% ofchild abuse/neglect cases that have repeat child abuse/neglect; #/% of road miles in top-ratedcondition; #/% of cited water quality offenders who fully comply; #/% of repeat audit findings;
5. Headline Selectionb. Intro Statement:
Limiting the number of performance measures is key to success. In most cases, select 3 to 5“headline measures” (in total, from both the upper right and lower right quadrants). In some cases,one upper left quadrant measure can be useful for context.
NAT I ONAL RE SULT S AND EQU I TY COLLABORAT I V E
24

25
Guide to Results-Based Planning and Facilitation:Achieving Results and Equity for Vulnerable Children and Youth
Using the Results Scorecard for:Strategic Planning andCommunity Collaboration
Community change efforts can succeed and be sustained when diverse players and partnerscollaborate for collective impact.The process of organizing effective cross-sector coalitions,however, is far easier said than done. Too often such coalitions are rendered ineffective by
competing agendas, unaligned goals, and parallel performance management languages andsystems. The Results Scorecard1 can facilitate collaborative efforts to:
� Determine a common vision (shared results);
� Provide a visual profile of their community conditions that inspires a need for change;
1 Results Scorecard is a web-based strategic data system built specifically to support the implementation of RBA andenhance the usability and sustainability of RBA for a strategic planning process. NREC members support the useof Results Scorecard since it can provide a common language and approach for various community stakeholders towork towards common community improvement.
� Conduct an in-depth exploration of the “story behind the data” in your community;
� Strategically plan in a coordinated manner to align programs across participating agencies;
� Identify and communicate what is working in your community and what is needed; and
� Monitor and help to improve the organization.
Altogether, the interactive Scorecard improves leaders’ abilities to support and sustain results-based community change and collective impact efforts.
Scorecards are easily configured to reflect the population results, indicators, programs and/orperformance measures that important to your planning process. It allows you to define measurablywhat you want to accomplish and then provides the Turn the Curve templates for each measure tocreate data-driven action plans.
In the Early Childhood Scorecard example on the next page, two results and four indicators havedetermined to be the focus of that community’s planning process. It then has three programscollaborating and sharing data in its strategic planning process.
On the following page, you will see an example Turn the Curve Template for one of the indicatorson the Early Childhood Scorecard, % of children entering school ready to learn. While thisexample shows how an action plan can be created on the one indicator, a similar process isencouraged for all indicators. Simultaneously, all programs are encouraged to do Turn the CurveThinking on all of their determined performance measures. This facilitates complete transparencyand trust between partners equally committed in collaborating to turn curves.
NAT I ONAL RE SULT S AND EQU I TY COLLABORAT I V E
26

27
Guide to Results-Based Planning and Facilitation:Achieving Results and Equity for Vulnerable Children and Youth
Example Scorecard Used for Strategic Planning and Community Collaboration

28
NAT I ONAL RE SULT S AND EQU I TY COLLABORAT I V E
Example Turn the Curve Template Used for a Single Indicator in Strategic Planning
Here, leaders can outline thecontributing and restrictingfactors for the data baseline.
Here, leaders can identifypartners with a role to play.
Here, leaders can prioritizethe action items that are partof their strategy.
Here, leaders can createspecificity in terms of who isdoing what by when.
Here, leaders can brainstormstrategies of what works,including those that areevidence-based.
29
Guide to Results-Based Planning and Facilitation:Achieving Results and Equity for Vulnerable Children and Youth
Facilitation Tips and Tricks1
Results-Based Accountability offers the opportunity for challenging, innovative, rigorouscollaboration. Skilled leadership and facilitation can play a critical role in realizing thispotential. The following suggested competencies can help leaders facilitate the process of
selecting Results and Indicators, identifying program performance measures, and conducting Turnthe Curve Thinking and can be used with or without the Results Scorecard. Following thecompetencies are some tips on the use of Effective Questions and method for reaching groupconsensus, while facilitating, called Proposal-Based Decision-Making.
Facilitation Competencies1. Appreciative/Neutral Listen to understand rather than to persuade.Reflects back what
has been said to confirm understanding in the group. Remainneutral on the topic being discussed, facilitating rather thanadvocating. Trusted to play the role of an “honest broker” in thediscussion.
1 Adapted from materials developed by the Annie E. Casey Foundation Leadership in Action Program, SherbrookeConsulting, and Results Leadership Group.

2. Observe and Respond to The capacity to “go to the balcony,” observe objectivelyGroup Dynamics what is taking place on the “dance floor,” determine what will help
to move the discussion forward, and intervene accordingly.
3. Set a Context for a At the opening of a meeting or at the start of the discussion ofConversation a topic in a meeting, set the context for the meeting/discussion.
4. Meeting Objectives Identify and confirm meeting objectives.
5. Agenda Provide and confirm agenda with time allocated to eachsection of the agenda.
6. Meeting Roles Identify and confirm roles in the meeting. (Facilitation, leading,chairing, note taking)
7. Label Conversations Name the kind of conversation taking place to help orientparticipants. Updates, decision making, negotiation, venting ...
8. Flip Chart or Record Flip chart/record meeting notes; feature decisions and actionitems.
9. Ask Effective Questions Uses forward-looking questions to focus discussion on solutions.
10. Sequence When more than one person wants to talk, give them an order:“Bob, then Adam, then Jane ...”
11. Give the work back to Recognizing, when in the role of facilitator, when the groupthe group needs to do its own work and will not benefit from the facilitator
doing the work for the group.
12. Synthesize or Summarize Pulling together (i.e., synthesizing) the themes and key pointsfrom a discussion of a topic and providing them to the group insummary form at the end of the discussion.
13. Proposal-Based Use of combination of consensus and proposal making toDecision Making accelerate decision making.
NAT I ONAL RE SULT S AND EQU I TY COLLABORAT I V E
30
31
Guide to Results-Based Planning and Facilitation:Achieving Results and Equity for Vulnerable Children and Youth
Effective Questions(from Enlightened Leadership, by Doug Krug and Ed Oakley)
Effective Questions help to stay away from ineffective and “backward focused” questions such as“Why?” “Who did it?” and “What’s the problem?” Human beings are naturally inclined to focus onthe “problem” in any given situation. This is a survival-driven behavior to attack the cause of pain.However, this “backwards-looking” focus can lock people out of finding more satisfying solutionsto problems. “Focusing on the negative locks us out of solutions like drifting off the highway whentaking your eyes off the road,” says Doug Krug. In their book, Enlightened Leadership, Krug andEd Oakley believe all of society would change for the better with an “effective questions” approachto problems.
The key characteristics of Effective Questions are:
� open-ended (not answered with “yes” or “no”)
� inquisitive (“What?”, “How?” not “Why?”);
� you-oriented (What do you think....?”, How do you feel about...?”; and,
� appreciative (trust that the person has the answer)
� forward-looking (looking ahead to what will be the solution)
Examples of effective questions include:
1) “What is already working?”
2) “What are our strengths?”
3) “Where are we successful?”
4) “Where do we agree?”
5) “What specifically causes it to work?”
6) “What is our objective, goal, or vision?”
7) “What would be the benefits to the customers, the organization, the department, ourselves, ofreaching our goal?”
8) “What specifically can we do more of, better, or differently to begin moving toward our goal?”
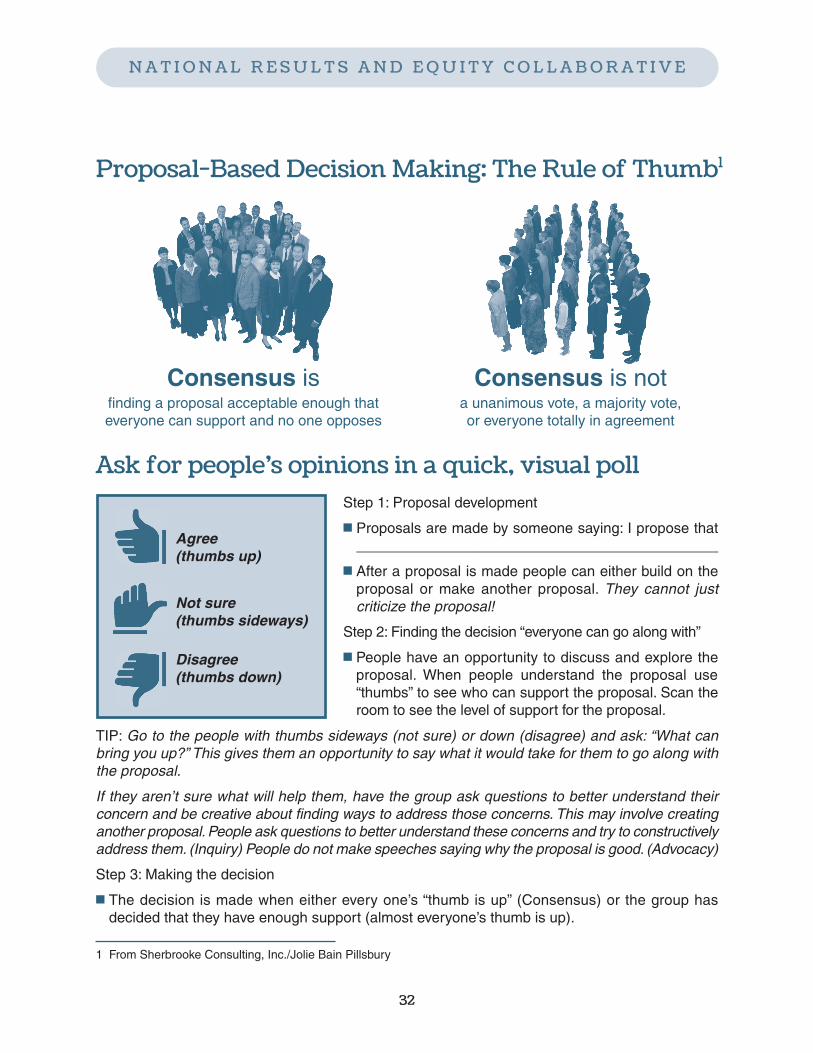
Proposal-Based Decision Making: The Rule of Thumb1
NAT I ONAL RE SULT S AND EQU I TY COLLABORAT I V E
32
1 From Sherbrooke Consulting, Inc./Jolie Bain Pillsbury
Ask for people’s opinions in a quick, visual pollStep 1: Proposal development
� Proposals are made by someone saying: I propose that_____________________________________________
� After a proposal is made people can either build on theproposal or make another proposal. They cannot justcriticize the proposal!
Step 2: Finding the decision “everyone can go along with”
� People have an opportunity to discuss and explore theproposal. When people understand the proposal use“thumbs” to see who can support the proposal. Scan theroom to see the level of support for the proposal.
TIP: Go to the people with thumbs sideways (not sure) or down (disagree) and ask: “What canbring you up?” This gives them an opportunity to say what it would take for them to go along withthe proposal.
If they aren’t sure what will help them, have the group ask questions to better understand theirconcern and be creative about finding ways to address those concerns. This may involve creatinganother proposal. People ask questions to better understand these concerns and try to constructivelyaddress them. (Inquiry) People do not make speeches saying why the proposal is good. (Advocacy)
Step 3: Making the decision
� The decision is made when either every one’s “thumb is up” (Consensus) or the group hasdecided that they have enough support (almost everyone’s thumb is up).
Consensus isfinding a proposal acceptable enough thateveryone can support and no one opposes
Consensus is nota unanimous vote, a majority vote,or everyone totally in agreement
Agree(thumbs up)
Not sure(thumbs sideways)
Disagree(thumbs down)

33
Guide to Results-Based Planning and Facilitation:Achieving Results and Equity for Vulnerable Children and Youth
Additional Resources1. www.raguide.org, Results-Based Accountability™ Implementation Guide, Mark Friedman’s web-site with How To Questions and Answers.
2. www.resultsaccountability.com, Mark Friedman’s website with the latest in Results-BasedAccountability™ news and information.
3. Friedman, Mark. Trying Hard is Not Good Enough. Trafford Publishing. 2005.
4. www.resultsleadership.org, Results Leadership Group website with information on consultants,trainers and facilitators that can support your quest. The following useful articles can also befound:
a. Achieving Collective Impact with Results-Based Accountability™, by Deitre Epps
b. Making Your Work Count: Achieving Child and Youth Results Workbook, by Karen Finn
c. ResultsStat Overview, by Lee, Luecking, Friedman and Boyd.
5. www.resultsscorecard.com: Results Scorecard is a web-based strategic management tooldeveloped to support the Results-Based Accountability™ framework.
Additional Readings on Accountabilityand Leadership:1. Behn, Robert D. Rethinking Democratic Accountability. Brookings. 2001.
2. Fisher, Roger , and William Ury, Getting to Yes . Random House Business Books. 2003.
3. Heifetz, Ronald A., and Marty Linsky Leadership on the Line: Staying Alive through the Dangersof Leading, Harvard Business School Press. 2002.
4. Krug, Doug ,and Ed Oakley, Enlightened Leadership: Getting to the Heart of Change .Simon andSchuster Canada. 1994.
5. Pink, Daniel.Drive: The Surprising Truth About What Motivates Us. Riverhead Books. 2009
6. Schorr, Lisbeth B. Common Purpose: Strengthening Families and Neighborhoods to RebuildAmerica. Doubleday.1997.
7. Senge, Peter . The Fifth Discipline: The Art and Practice of the Learning Organization.Double-day. 1990.
NAT I ONAL RE SULT S AND EQU I TY COLLABORAT I V E
Appendix A: Selecting Results and Indicators forYour CommunityIt is assumed that Results and Indicators have been adopted or are being promoted by the NationalNREC partners you are affiliated with and the templates are likely already built in your ResultsScorecard site. However, below is a process for selecting Results and Indicators if you arestarting from scratch or expanding on your use of RBA for other planning processes. The step bystep process below can also be accessed with videos in the Virtual Facilitator section of theResults Scorecard.
1. Getting Started
It doesn’t matter where you start. Start anywhere. Start where the passion is. Whatever youdo will have beneficial effects across a range of results.
As a first step, what set of statements captures the most important hopes for our children,families, community, city, county, state, or nation? Complete the sentences below withadjectives descriptive of well-being.
2. Results Statements
A result is a population condition of well-being for children, adults, families and communities,stated in plain language. Results are conditions that voters and taxpayers can understand.
In creating results statements, one of the most important characteristics is that it not be aboutdata and not about service.Others tips include not using descriptors that speak to the directionof the data like “increase” or “decrease.”
3. Result Selection
Of the results you have created, which do you want to focus on first and those that you wantto identify indicators.
34
Page ReferenceChapter 3 (Population Accountability), pages 49-50

35
4. Indicator Selection
An indicator is a measure that helps quantify the achievement of a result. Indicators help answerthe question, “How would we recognize this result if we fell over it?
In selecting indicators, we offer three criteria for which you can rate them High, Medium or Low:
1. Communication power: Does this indicator communicate to a broad range of audiences?2. Proxy Power: Does the indicator say something of central importance about the result?3. Data Power: Do we have quality data on a timely basis? Can it be disaggregated bysub-populations?
We are looking for indicators that rank high on all three criteria. These become our headlineindicators. Secondary indicators may be created which help in assessing the story behind thebaselines and other parts of the process. A data development agenda can also be created forindicators we would like but not yet available on a timely basis.
Guide to Results-Based Planning and Facilitation:Achieving Results and Equity for Vulnerable Children and Youth

NAT I ONAL RE SULT S AND EQU I TY COLLABORAT I V E
36
ContactNational Results and Equity Collaborativec/o Center for the Study of Social Policy
1575 Eye Street NW, Suite 500Washington, D.C. [email protected]

NATIONAL RESULTS & EQUITY COLLABORATIVE
c/o Center for the Study of Social Policy1575 Eye Street NW, Suite 500Washington, D.C. 20005