guide to exchange-rate determination...
TRANSCRIPT
DB Guide to Exchange-Rate DeterminationMay 2002 Deutsche Bank @
Deutsche Bank Foreign Exchange Research 1
Deutsche Bank@
May 2002
FX
Researc
hG
lob
al
Mark
ets
Researc
h
Michael R. RosenbergHead of Global FX Research
David Folkerts-LandauManaging Director, Head ofGlobal Markets Research
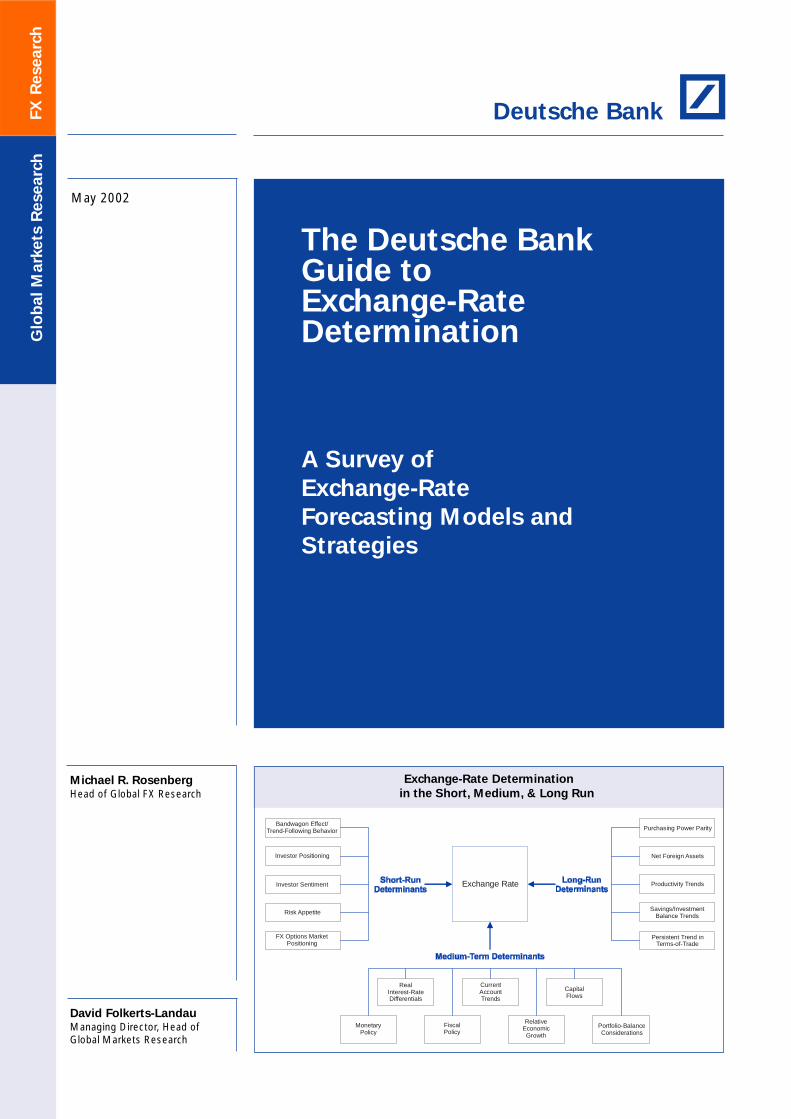
Exchange-Rate Determination
in the Short, Medium, & Long Run
The Deutsche BankGuide toExchange-RateDetermination
A Survey of
Exchange-Rate
Forecasting Models and
Strategies
Bandwagon Effect/Trend-Following Behavior
RealInterest-RateDifferentials
Purchasing Power Parity
CapitalFlows
FiscalPolicy
Portfolio-BalanceConsiderations
CurrentAccountTrends
RelativeEconomicGrowth
MonetaryPolicy
Investor Positioning
FX Options MarketPositioning
Risk Appetite
Investor Sentiment
Net Foreign Assets
Productivity Trends
Savings/InvestmentBalance Trends
Persistent Trend inTerms-of-Trade
Exchange Rate
DB Guide to Exchange-Rate Determination May 2002Deutsche Bank @
2 Deutsche Bank Foreign Exchange Research
Introduction .................................................................................................... 4
Exchange Rate Determination in the Short Run ........................................ 7Currency Forecasting Using Technical Analysis ......................................... 11Sentiment and Positioning Indicators ....................................................... 21Currency Options Market ......................................................................... 22Order Flow and the Determination of Exchange Rates ........................... 24Investor Positioning and the Trend in Exchange Rates ............................. 27Risk Appetite Shifts and Currency Trends ................................................. 28
Exchange Rate Determination in the Long Run ....................................... 31Purchasing Power Parity ........................................................................... 33The Macroeconomic-Balance Approach to Long-Run
Exchange-Rate Determination ............................................................ 42The Real Long-Run Equilibrium Exchange Rate ....................................... 43Productivity Trends and Exchange Rates .................................................. 46Terms of Trade and Exchange Rates ......................................................... 50Net International Investment and the Equilibrium Exchange Rate ........... 51Long-Term Cycles in Exchange Rates ....................................................... 53Overshooting Exchange Rates ................................................................. 60
Exchange Rate Determination in the Medium Run .................................. 63International Parity Conditions .................................................................. 65Real Interest-Rate Differential Model ....................................................... 67Forward-Rate Bias Strategy ...................................................................... 72Current-Account Imbalances and the Determination of
Exchange Rates ................................................................................... 77Capital Flows and Exchange Rates ........................................................... 86Mundell-Fleming Model ........................................................................... 96Monetary Approach ................................................................................ 104Portfolio-Balance Approach ..................................................................... 108Fiscal Policy ............................................................................................. 115Economic Growth .................................................................................... 119Central-Bank Intervention ....................................................................... 124
Anticipating Currency Crises in Emerging Markets ............................... 129
References ................................................................................................... 155
Table of Contents
Datastream International, Inc. is the source of the majority of dataused in the charts and tables in this publication. Other sources arenoted individually.
Market sentiment data is by permission of Consensus, Inc., Con-sensus, National Futures and Financial Weekly,(1) (800) 383-1441 or (1) (816) 373-3700www.consensus-inc.com
Sources:
May 5, 2002
DB Guide to Exchange-Rate DeterminationMay 2002 Deutsche Bank @
Deutsche Bank Foreign Exchange Research 3
"If you think writing about the fortunes of the stockmarket is tricky, try getting your arms around cur-rencies."Bill GrossPIMCOInvestment Outlook, January 2002
"Having endeavored to forecast exchange ratesfor more than half a century, I have understand-ably developed significant humility about my abil-ity in this area...."Alan GreenspanRemarks Before the Euro 50 RoundtableWashington D.C., November 30, 2001
Deutsche Bank Guide to Exchange-Rate Determination
"Explaining the yen, dollar and euro exchange ratesis still a very difficult task, even ex-post."Kenneth RogoffEconomic Counselor and Director of Research,International Monetary Fund

DB Guide to Exchange-Rate Determination May 2002Deutsche Bank @
4 Deutsche Bank Foreign Exchange Research
Getting the exchange rate right is a critical objective of allinternational investors. Unfortunately, getting the exchangerate right on a reasonably consistent basis is far from easy.As anyone involved in the business of currency forecast-ing can attest, it can be a humbling experience.
Currency forecasts can go awry for a variety of reasons.For instance, if one's expectation of the direction in whichfundamental-based forces are heading is flawed, so willbe one's forecast of a currency's future path. Even if one'sinterpretation of the underlying fundamental forces werecorrect, currency forecasts might still go awry if short-termtechnical forces carried exchange rates far from their fun-damental equilibrium path.
Scores of empirical studies have found that fundamental-based models tend to perform poorly in terms of explain-ing exchange-rate trends, particularly over short-term peri-ods. However, fundamental-based models tend to workbetter over medium and especially longer-run horizons.Unfortunately, most fund managers, whose performancesare evaluated over relatively short time spans these days,are often not willing to risk significant sums of capital onthe basis of longer-term, fundamental-based projections.That is why many market participants have recently turnedtheir attention away from longer-run fundamental-basedforecasting approaches in favor of shorter-term forecast-ing tools such as technical-based trend-following tradingrules. In addition, there has recently been significant inter-est in flow, sentiment, and positioning indicators to deter-mine the exposure of market participants to the individualcurrencies. Such indicators are often used as contrarianindicators to determine whether a currency is significantlyoverbought or oversold, and thus ripe for a correction.
Given the wide variety of forecasting approaches, wethought it would be useful to put together a guidebookthat summarized each of those approaches in an easy-to-read format. Our intention was to create a user-friendlyformat where the written text was purposely kept to aminimum and where the charts and tables—about 400 inall—would tell the story.
This guidebook recognizes that the tools required for short-term investors differ significantly from those needed formedium and long-term currency managers. Hence, theguidebook devotes separate chapters to the determina-tion of exchange rates over short, medium, and long-termhorizons.
The adjacent schematic diagram provides a convenient il-lustration of the layout of this guidebook and highlightsthe myriad of channels through which fundamental andtechnical forces jointly affect exchange rates. Some of thosechannels will tend to exert a more profound impact on ex-change rates in the short run, while others will tend have amore profound impact in the medium or long run. We ex-plore each of those channels in the chapters that follow.
In the chapter entitled "Exchange Rate Determination inthe Short Run," we investigate the potential risks and re-wards of using a variety of short-run forecasting tools informulating short-term FX strategies. These include mov-ing-average trend-following trading rules, sentiment andpositioning surveys, FX dealer customer-flow data, infor-mation embedded in currency option prices, and risk ap-petite indices.
We find that moving-average trading rules would have gen-erated significant risk-adjusted excess returns over rela-tively long periods for most major currency pairs, althoughlosing trades tend to occur far more frequently than win-ning trades, in many cases by a factor of 3 to 1. The highfrequency of losing trades suggests that moving-averagetrading rules can be risky over short periods and that aninvestor would need considerable risk capital on hand toabsorb such losses to stay in the game until exchange rateseventually become more highly trended.
The evidence on flow, sentiment, and positioning surveyssuggests that these indicators should be viewed more ascontemporaneous rather than as leading indicators of ex-change-rate movements. We argue that such indicators canbe useful as confirmation indicators in conjunction withtraditional trend-following trading rules in formulating short-term FX strategies.
In the chapter entitled "Exchange Rate Determination inthe Long Run," we explore the fundamental forces thatgive rise to long-term cycles in exchange rates. The chap-ter begins by noting that deviations from estimated PPPvalues have tended to be large and persistent, suggestingthat fundamental forces other than relative national infla-tion rates have played a key role in driving the long-termpath that exchange rates have taken. We investigate a va-riety of fundamental variables that have had some suc-cess in explaining the long-term path that currencies havetaken, including relative productivity growth, persistenttrends in a country's terms of trade, long-term trends innet foreign asset and liability positions, and long-termtrends in national savings and investment.
Introduction

DB Guide to Exchange-Rate DeterminationMay 2002 Deutsche Bank @
Deutsche Bank Foreign Exchange Research 5
In the chapter entitled "Exchange Rate Determination inthe Medium Run," we investigate a wide range of cyclicalforces that have caused currencies either to rise or fall ona medium-term basis relative to their long-run equilibriumpath. In many cases, these medium-term deviations fromthe long-run equilibrium path have been quite sizeable andpersistent. We find that medium-term trends are influencedby a variety of macroeconomic indicators such as the trendin real interest-rate differentials, current and capital-accountbalances, relative monetary and fiscal policies, relative eco-nomic growth, and portfolio-balance considerations.
Finally, in the chapter entitled "Anticipating Currency Cri-ses in Emerging Markets," we set out to identify thoseeconomic and financial variables that have had success incorrectly predicting whether an emerging-market currencymight be vulnerable to a speculative attack, and whether itis possible to construct an early-warning system that cansuccessfully pinpoint when a speculative attack might oc-cur. Empirical research finds that crises-prone currenciestypically display a number of classic symptoms that warnof an impending attack. Those symptoms include exces-sive real appreciation of the emerging-market currency,weak domestic economic growth, rising unemployment,an adverse terms of trade shock, deteriorating current-ac-count balances, excessive domestic credit expansion, bank-ing-system difficulties, unsustainably large governmentbudget deficits, overly expansionary monetary policies, ahigh ratio of M2 money supply to reserves, foreign-ex-change reserve losses, falling asset prices, and/or a hugebuild-up in short-term liabilities by either the private or publicsector.
The overall conclusion one draws from a variety of empiri-cal studies is that the success of early-warning systems interms of generating correct out-of-sample projections ismixed. While most early-warning models can point to asignificant number of correctly predicted crises, thosesame models also have a tendency to generate a sizablenumber of false alarms and missed crises.
Perhaps all that one can say after reviewing all the differ-ent approaches to exchange-rate determination is that nosingle approach has a monopoly on being right all of thetime. Some strategy systems such as moving-average trad-ing rules and forward-rate bias strategies appear to have along-run track record of success, but one needs to be mind-ful that there were a number of periods in the past whensignificant losses were incurred from following these strat-egies. Likewise, some key fundamental variables may haveclosely tracked the trend in exchange rates in the past, butthere is no guarantee that they will continue to do so inthe future. If divergent trends begin to set in, fund manag-ers must decide whether to disregard the trend in thosekey fundamental variables or not.
Although many fund managers might prefer to follow arigid rule or trading system for formulating FX strategies,one should not sell short a judgment-based approach tocurrency investment management. In the end, successfulFX management is based as much on "art" as it is on "sci-ence."
Bandwagon Effect/Trend-Following Behavior
RealInterest-RateDifferentials
Purchasing Power Parity
CapitalFlows
FiscalPolicy
Portfolio-BalanceConsiderations
CurrentAccountTrends
RelativeEconomic
Growth
MonetaryPolicy
Investor Positioning
FX Options MarketPositioning
Risk Appetite
Investor Sentiment
Net Foreign Assets
Productivity Trends
Savings/InvestmentBalance Trends
Exchange-Rate Determinationin the Short, Medium, and Long Run
Persistent Trend inTerms-of-Trade
Exchange Rate

DB Guide to Exchange-Rate Determination May 2002Deutsche Bank @
6 Deutsche Bank Foreign Exchange Research

DB Guide to Exchange-Rate DeterminationMay 2002 Deutsche Bank @
Deutsche Bank Foreign Exchange Research 7
A Stylized Model of Exchange-Rate Overshootingat the End of a Long-Term Uptrend
Currency’sValue
Time
Economic Fundamentals
Exchange-Rate Determination
in the Short Run

DB Guide to Exchange-Rate Determination May 2002Deutsche Bank @
8 Deutsche Bank Foreign Exchange Research
Economists have come up with a wide range of theoriesto explain how exchange rates are determined. The over-whelming body of evidence from scores of empirical stud-ies indicates that fundamental-based models, while use-ful in explaining long-term trends, have not met much suc-cess in explaining short-term exchange-rate trends. Indeed,the evidence suggests that for short-term horizons, a ran-dom walk characterizes exchange-rate movements betterthan most conventional fundamental-based exchange ratemodels.
One of the reasons why researchers have not been ableto unearth any significant relationship between changesin macroeconomic variables and changes in exchange ratesover short periods is that exchange rates often exhibit muchgreater variability than do macroeconomic time series inthe short run. The often chaotic behavior of exchange ratesis capable of generating so much noise that it may ob-scure any discernable relationship between macroeco-nomic time series and the short-term movement of ex-change rates.
Bandwagon effects are also capable of causing exchangerates to wander away from fundamental equilibrium val-ues in the short run. Survey studies find that FX marketparticipants tend to have extrapolative expectations overshort-term horizons and mean-reverting or regressive ex-pectations over longer horizons. If investors have extrapo-lative expectations over short horizons, they may tend toaccentuate and perpetuate exchange-rate movements inthe short run far beyond the path justified by fundamen-tals alone. Indeed, if a significant number of investors en-
gaged in extrapolative/trend-following trading strategies,exchange rates might tend to overshoot on both the up-side and downside, which could further obscure the rela-tionship between macroeconomic fundamentals and theshort-term movement of exchange rates.
Because exchange rates can and often do deviate signifi-cantly from any semblance of fair value in the short run,investors have looked for alternative forecasting tools tohelp them formulate currency investment strategies overshort-term horizons. Short-run forecasting tools that haveattracted interest in recent years include technical-basedtrend-following trading rules, sentiment and positioning sur-veys, FX dealers' customer order flow data, informationembedded in currency option prices, and risk appetite in-dices.
Investors who concentrate their energies on such toolspresume that the market exhibits a tendency to tip its handahead of time as to which direction it intends to take ex-change rates in the future. While technical models havebeen found to be profitable in the past, most of the othershort-term indicators are relatively new to the FX arenaand thus only a limited time series is available to test theirpredictive power. What evidence we do have, however,suggests that in most cases, these indicators are moreuseful as contemporaneous rather than as leading indica-tors of exchange-rate movements. Nevertheless, they mayprove useful as confirmation indicators that can be used inconjunction with traditional technical-based trend-follow-ing trading rules in formulating short-term investment strat-egies.
Short-Run Forecasting Tools
Short-Run Forecasting Tools: A Checklist
Up
Short-Term Trend
Down
Moving-Average Crossover Trading Rule
Market Sentiment
Speculative Positioning
Order Flow
Option Market Sentiment
Risk Appetite Indices
Neutral Over-sold
Over-bought
Momentum
(Consensus Inc. Index of Bullish Opinion)
(Net IMM Contracts)
(DB Customer Order Flow Database)
(Risk Reversals)
Forecasting Tool

DB Guide to Exchange-Rate DeterminationMay 2002 Deutsche Bank @
Deutsche Bank Foreign Exchange Research 9
FX market participants typically fall into one of two camps:
(1) Shorter-run technically oriented traders or
(2) Longer-run fundamental-based investors.
Shorter-run technically oriented traders do not base theirinvestment decisions on fundamental considerations.Rather, they rely on trend-following trading rules to deter-mine their position taking: they buy when the currency isrising, and they sell when the currency is falling. In con-trast, longer-run fundamental-based investors base theirinvestment decisions largely on valuation considerations.If a currency is believed to be mispriced relative to its fairvalue, fundamental-based investors would buy those cur-rencies that are believed to be undervalued and wouldsell those currencies that are believed to be overvalued.
Knowing precisely what exchange-rate level represents acurrency's true equilibrium or fair value is not an easy task.Different exchange-rate models can and often do yield quitedifferent estimates of a currency's long-run equilibriumvalue. In most cases, the marketplace will have only a roughidea of where a currency's long-run equilibrium value lies.Because of this, fundamental-based investors will not settheir sights on an imprecise point estimate of fair value,but rather on an equilibrium range or band. Within thisequilibrium range or band, fundamental-based investorswill presume that the true but unknown equilibrium ex-change rate, q, lies somewhere between an upper bound,qU, and a lower bound, qL.
The qU-qL band has been referred to as the "band of agnos-ticism" in academic writings (see DeGrauwe, 1996). Whenexchange rates trade inside the qU-qL band, fundamental-based investors tend to be agnostic in terms of their cur-rency positioning, accepting the fact that the actual ex-change rate is probably trading close to its fair value. Ex-change-rate movements within the qU-qL band are viewedas noise and therefore not worthy of serious investmentconsideration. Fundamental-based investors would thusnot feel compelled to take on either aggressive long orshort currency positions when exchange rates are tradinginside the band. Instead, they would more likely adopt aneutral stance toward currency positioning.
When exchange rates fluctuate inside the band of agnosti-cism, trading tends to be dominated by short-term techni-cally oriented traders since fundamental-based investorswill refrain from joining the fray until the actual exchangerate moves outside of the band. When the actual exchangerate moves outside the qU-qL equilibrium range, fundamen-tal-based investors will tend to shed their agnosticism andbecome more willing to take on aggressive long positionsif the actual exchange rate falls below qL and aggressiveshort positions if the actual exchange rate rises above qU.
In times of greater market uncertainty, however, the bandof agnosticism is likely to widen since investor confidenceregarding estimates of fair value is likely to be less stronglyheld than in tranquil environments. In such cases, techni-cally oriented traders would tend to dominate trading ac-tivity over even wider ranges (q'U-qL'>qU- qL). That, in turn,would likely lead to even greater FX volatility in the shortrun.
One of the key problems for fundamental-based investorsis that even if the exchange rate moved outside of theband of agnosticism, there is no guarantee that it wouldmove back inside the band anytime soon. Indeed, funda-mental-based investors run the risk that an overvaluedcurrency might get even more overvalued if the exchangerate moved deeper into overvalued territory, and vice versa.
Since large financial resources are likely to be needed forinvestors to position themselves against an overshootingexchange rate, one has to wonder how many fund manag-ers would be willing to risk their clients' capital on thebasis of long-run valuation considerations, particularly ifclients evaluate their fund manager’s investment perfor-mance over a relatively short time span. If fund managersview it as simply too risky to take on long or short cur-rency positions on the basis of long-run valuation consid-erations, then there might be several occasions when ex-change rates could wander far from any semblance of fairvalue, and yet very few investors would be willing to risktheir clients' capital to bring the exchange rate back intoline with fair value.
Why FX Market Participants Focus Their Energies on Short-Run Rather
Than Long-Run Strategies
The "Band of Agnosticism"
Index of Investor Willingness toMake Currency Bets Based on"Fundamentals"
Real Exchange Rate
q ’L qL
Analyzing the Behavior of Fundamental-Based Investors WhenExpectations of Real Long-Run Equilibrium Exchange Rates Are Loosely Held
qU q ’U
Source: Adapted from DeGrauwe (1996)
q

DB Guide to Exchange-Rate Determination May 2002Deutsche Bank @
10 Deutsche Bank Foreign Exchange Research
When FX dealers were asked recently what role funda-mental factors played in the determination of exchangerates, 97% of the respondents felt that fundamentalsplayed no role on an intra-day basis. However, over me-dium and longer-term horizons, FX dealers felt that funda-mental forces did play an important role, with 57.4% ofthe respondents believing that exchange rates reflect fun-damental value on a medium-term (within six months)basis, and 87% believing exchange rates reflect fundamen-tal value on a long-term (over six months) basis.
When asked to rank the most important determinants ofexchange rates on an intra-day basis, FX dealers indicatedthat bandwagon effects, speculative forces, and over-re-action to news were the principal driving forces in the veryshort run. On a medium-term basis, economic fundamen-tals and technical trading increase in importance from thedealer community's perspective, but FX dealers also con-tinued to assign importance to speculative forces as a keydeterminant of medium-term trends in exchange rates. Forlonger horizons, FX dealers believed that economic funda-mentals were the dominant factor driving exchange rates.However, a not insignificant number (11.3%) believed thattechnical trading was important even in the long run.
The FX dealer survey also asked dealers whether theythought that exchange rates were more predictable on anintra-day basis or on a medium-term (up to six months) orlong-term (beyond six months) basis. FX dealers wereasked to assign a rating of 1 if there was no predictability,a rating of 5 if there was a high predictability and a ratingof 2, 3, or 4 if there was low, medium, or better than aver-age predictability, respectively. Since FX dealers tend totrade on an intra-day basis, one might have thought thatthey would assign a high rating to exchange-rate predict-ability on an intra-day basis. This was not the case. Indeed,62% of the dealer respondents gave ratings of 1 or 2, tothe predictability of exchange rates in the short run, whileonly 11% gave ratings of 4 or 5.
For medium and longer time horizons, the confidence inexchange-rate predictability increases, with 30.4% of deal-ers assigning a ranking of 4 or 5 on a medium-term basisand 35.1% assigning a ranking of 4 or 5 on a longer-termbasis. The question that we need to ask ourselves is: if FXdealers are more confident in predicting exchange rateson a medium/long-term basis rather than on an intra-daybasis, why then do traders concentrate their energies onvery short-run trading? The answer might be that tradersare in a better position to evaluate and manage FX risk ona short-term basis, which overrides their greater confidencein medium/long-term exchange-rate predictability.
FX Dealers’ Perception of the Role of Fundamentals
in Explaining Exchange-Rate Movements
FX Dealer Survey Question—Do You Believe Exchange-RateMovements Reflect Changes in Fundamental Value on an:
Intraday Medium-Run Long-Run
Basis Basis Basis
(up to 6 months) (beyond 6 months)
Yes 3% 57.8% 87%No 97% 42.2% 12%No Opinion 0% 0.0% 1%
Source: Yin-Wong Cheung, Menzie D. Chinn, and Ian W. Marsh,“How Do UK-Based Foreign Exchange Dealers Think Their Market Operates?”,NBER Working Paper 7524, February 2000.
FX Dealers’ Perception of the Most Important Factor
That Explains Exchange-Rate Movements
FX Dealer Survey Question—Select the Single Most ImportantFactor that Determines Exchange Rate Movements on an:
Intraday Medium-Run Long-Run
Basis Basis Basis
(up to 6 months) (beyond 6 months)
Bandwagon Effects 29.3% 9.5% 1.0%Over-reaction to News 32.8% 0.7% 0.0%Speculative Forces 25.3% 30.7% 3.1%Economic Fundamentals 0.6% 31.4% 82.5%Technical Trading 10.3% 26.3% 11.3%Other 1.7% 1.5% 2.1%
Source: Yin-Wong Cheung, Menzie D. Chinn, and Ian W. Marsh,“How Do UK-Based Foreign Exchange Dealers Think Their Market Operates?”,NBER Working Paper 7524, February 2000.
FX Dealers’ Perception of the Predictability of
Exchange-Rate Movements
FX Dealer Survey Question—On a Scale of 1 to 5, Indicate If YouBelieve the Market Trend Is Predictable on an:
Intraday Medium-Run Long-Run
Basis Basis Basis
(up to 6 months) (beyond 6 months)
1 (Least Predictable) 21.6% 5.9% 17.2%2 40.3% 20.7% 16.4%3 26.9% 43.0% 30.6%4 9.0% 18.5% 20.9%5 (Most Predictable) 2.2% 11.9% 14.2%
Source: Yin-Wong Cheung, Menzie D. Chinn, and Ian W. Marsh,“How Do UK-Based Foreign Exchange Dealers Think Their Market Operates?”,NBER Working Paper 7524, February 2000.
How FX Dealers View the Determination of Exchange Rates in the Short Run

DB Guide to Exchange-Rate DeterminationMay 2002 Deutsche Bank @
Deutsche Bank Foreign Exchange Research 11
Technical models generate exchange-rate forecasts byextrapolating past sequences of exchange-rate movementsinto the future. For example, if a currency begins to edgehigher and rises above some critical value, a technicalmodel will typically issue a recommendation to go longthat currency, the presumption being that the newly formedtrend will continue to carry the currency higher in the fu-ture. Similarly, a sell signal would be issued if the currencybegan to edge lower and fell below some critical value.
Trend-following trading rules will be profitable as long asthe ensuing trend does indeed move in the same direc-tion as the preceding trend, which would be the case ifexchange rates moved in broad, well-defined cycles. Butthat is not to say that exchange rates must always move inlarge swings for trend-following trading rules to be profit-
Technical Analysis: The Advantage of Trading
With and Not Against the TrendExchange Rate
Time
Long-Run EquilibriumExchange Rate
Technical Analysis:Even though a currency overshoots itslong-run equilibrium level, a technicianwill recommend maintaining long positionsas long as the trend in the exchangerate is up.
Fundamental Analysis:May prematurely recommend selling a currency that hasovershot its long-runequilibrium level.
Trendline
Market Price
Today’sSpotRate
able. What matters for long-term profitability is that largeexchange-rate upswings and downswings must occur ona frequent enough basis to overcome those occasionswhen currency movements are not highly trended.
Fundamental-based models tend to focus on whether acurrency lies above or below its long-run equilibrium or"fair" value. Technical models, on the other hand, are notinterested in whether a currency lies above or below itsfair value. Rather, technical models are only interested inwhether the trend in the exchange rate is upward or down-ward. As long as a confirmed uptrend (or downtrend) is inplace, a recommended long (short) position will be main-tained even if the prevailing trend carries the exchangerate well above (below) its long-run fair value.
Currency Forecasting Using Technical Analysis—
The Advantage of Trading with and Not Against the Trend
Source: Rosenberg (1996)
DB Guide to Exchange-Rate Determination May 2002Deutsche Bank @
12 Deutsche Bank Foreign Exchange Research
Identification and Confirmation of a Valid Uptrend/Downtrend
Exchange Rate
Time
Trendline
Market Price
Peak2
Exchange Rate
Time
Peak1
Peak3
Trough2
Trough1
Trough3
Trendline
Peak2
Peak3Trough2
Trough1
Trough3
Peak1
Market Price
Identification and Confirmationof a Market Reversal
Exchange Rate
Time
Trendline
Market Price
Head-and-Shoulders Reversal Pattern
Exchange Rate
Time
Neckline
Market Price
Head
Left Shoulder
Right Shoulder
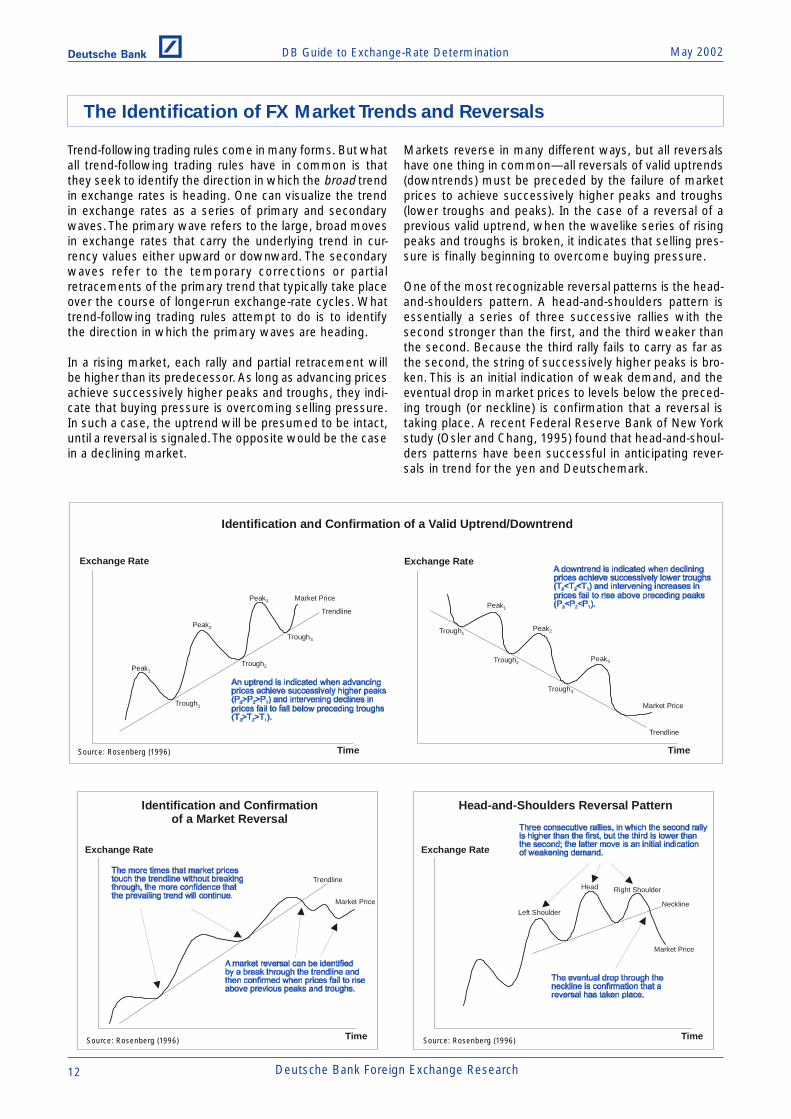
Trend-following trading rules come in many forms. But whatall trend-following trading rules have in common is thatthey seek to identify the direction in which the broad trendin exchange rates is heading. One can visualize the trendin exchange rates as a series of primary and secondarywaves. The primary wave refers to the large, broad movesin exchange rates that carry the underlying trend in cur-rency values either upward or downward. The secondarywaves refer to the temporary corrections or partialretracements of the primary trend that typically take placeover the course of longer-run exchange-rate cycles. Whattrend-following trading rules attempt to do is to identifythe direction in which the primary waves are heading.
In a rising market, each rally and partial retracement willbe higher than its predecessor. As long as advancing pricesachieve successively higher peaks and troughs, they indi-cate that buying pressure is overcoming selling pressure.In such a case, the uptrend will be presumed to be intact,until a reversal is signaled. The opposite would be the casein a declining market.
Markets reverse in many different ways, but all reversalshave one thing in common—all reversals of valid uptrends(downtrends) must be preceded by the failure of marketprices to achieve successively higher peaks and troughs(lower troughs and peaks). In the case of a reversal of aprevious valid uptrend, when the wavelike series of risingpeaks and troughs is broken, it indicates that selling pres-sure is finally beginning to overcome buying pressure.
One of the most recognizable reversal patterns is the head-and-shoulders pattern. A head-and-shoulders pattern isessentially a series of three successive rallies with thesecond stronger than the first, and the third weaker thanthe second. Because the third rally fails to carry as far asthe second, the string of successively higher peaks is bro-ken. This is an initial indication of weak demand, and theeventual drop in market prices to levels below the preced-ing trough (or neckline) is confirmation that a reversal istaking place. A recent Federal Reserve Bank of New Yorkstudy (Osler and Chang, 1995) found that head-and-shoul-ders patterns have been successful in anticipating rever-sals in trend for the yen and Deutschemark.
The Identification of FX Market Trends and Reversals
Source: Rosenberg (1996)
Source: Rosenberg (1996) Source: Rosenberg (1996)

DB Guide to Exchange-Rate DeterminationMay 2002 Deutsche Bank @
Deutsche Bank Foreign Exchange Research 13
A wide variety of trend-following trading rules abounds,but by and large they all share the basic property of ex-trapolation. A chartist who monitors the behavior of mar-ket prices on a bar chart with a ruler and pencil will as-sume that an uptrend is intact as long as advancing pricesachieve successively higher peaks and intervening declinesfail to fall below preceding troughs.
More sophisticated extrapolation techniques can be de-signed with the assistance of a computer. One popularcomputer-based technical model is the filter rule, whichissues a buy recommendation if an exchange rate rises byx% above its most recent trough, and issues a sell recom-mendation if the exchange rate falls by x% below its mostrecent peak. Another popular computer-based technicalmodel is the moving-average crossover model. By con-structing longer-run moving averages of daily exchange-rate movements, one can more easily isolate the primarytrend from short-run noise. If the short-run moving aver-age of the exchange rate rises above its long-run movingaverage, it is an indication that buying pressure is over-coming selling pressure, and vice versa.
In each case, predictions of the likely future path that ex-change rates might take are being generated by the ex-trapolation of the prevailing trend in exchange rates intothe future. Essentially, it really doesn't matter which trend-following rule you use. Since a trend is a trend, all trend-following trading rules should roughly generate the samedirectional forecast.
Because all of these models generate forecasts by extrapo-lating the recent past trend of exchange rates into the fu-ture, buy or sell signals will be issued only after a currencyhas already started rising or falling. Although this meansthat trend-following trading rules will not capture the verytop and bottom of market moves, they may neverthelessbe profitable if the ensuing exchange-rate movements per-sist long enough and carry far enough to generate signifi-cant excess returns.
Filter-Rule Strategy
DM/US$
Time
B
S
P
T
x%
x%
Moving-Average Crossover StrategyDM/US$
Time
B
S
SRMA
LRMA
All Trend-Following Trading Rules Sharethe Same Property: Extrapolation
DM/US$
Time
B
S
Down Trendline
Up Trendline
Trendline Penetration
Trend-Following Trading Rules and the Principle of Extrapolation
Source: Rosenberg (1996)
DB Guide to Exchange-Rate Determination May 2002Deutsche Bank @
14 Deutsche Bank Foreign Exchange Research
Investors Who Follow a Trend-Following Trading RuleMay Be Vulnerable to Whipsaws Caused by False Signals
DM/US$
Time
B
S
P
T
x%
x%
DM/US$
B1
S1
P1
T1
An Example of a False Signaland a Whipsaw Loss
Time1
Market-SwingRequirement
Market-Swing Requirementof Profitable Trend-Following Trading Rules
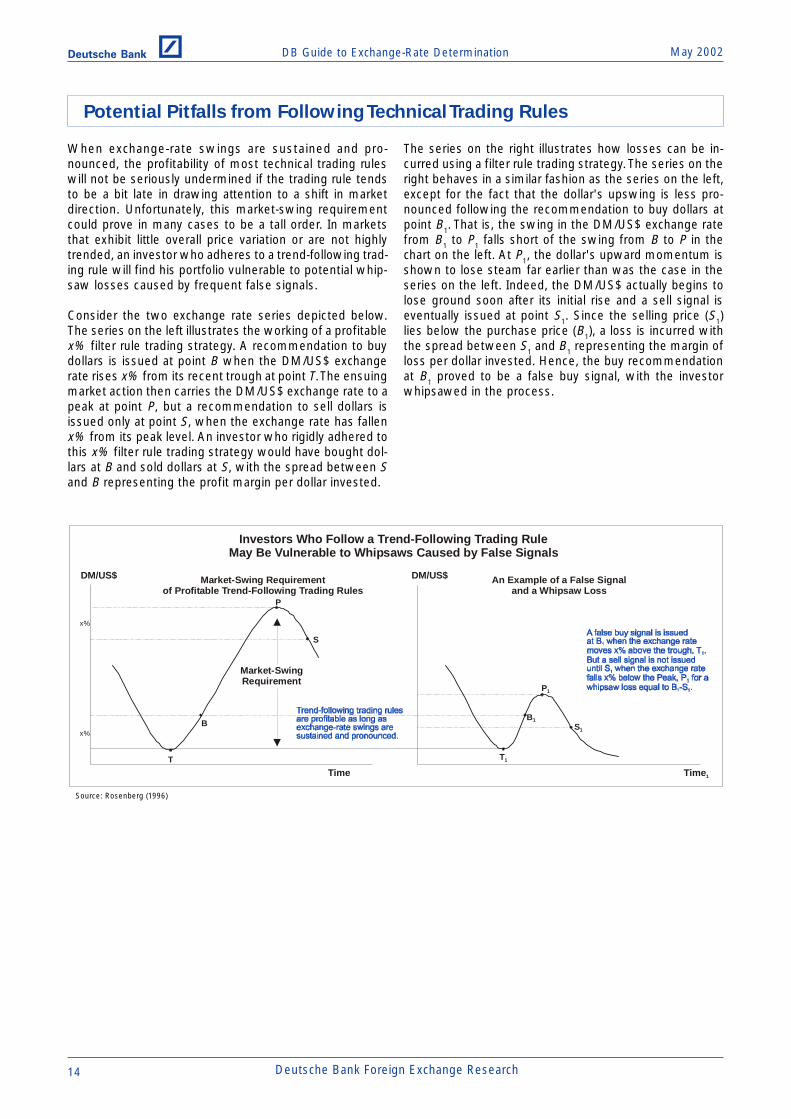
When exchange-rate swings are sustained and pro-nounced, the profitability of most technical trading ruleswill not be seriously undermined if the trading rule tendsto be a bit late in drawing attention to a shift in marketdirection. Unfortunately, this market-swing requirementcould prove in many cases to be a tall order. In marketsthat exhibit little overall price variation or are not highlytrended, an investor who adheres to a trend-following trad-ing rule will find his portfolio vulnerable to potential whip-saw losses caused by frequent false signals.
Consider the two exchange rate series depicted below.The series on the left illustrates the working of a profitablex% filter rule trading strategy. A recommendation to buydollars is issued at point B when the DM/US$ exchangerate rises x% from its recent trough at point T. The ensuingmarket action then carries the DM/US$ exchange rate to apeak at point P, but a recommendation to sell dollars isissued only at point S, when the exchange rate has fallenx% from its peak level. An investor who rigidly adhered tothis x% filter rule trading strategy would have bought dol-lars at B and sold dollars at S, with the spread between Sand B representing the profit margin per dollar invested.
The series on the right illustrates how losses can be in-curred using a filter rule trading strategy. The series on theright behaves in a similar fashion as the series on the left,except for the fact that the dollar's upswing is less pro-nounced following the recommendation to buy dollars atpoint B1. That is, the swing in the DM/US$ exchange ratefrom B1 to P1 falls short of the swing from B to P in thechart on the left. At P1, the dollar's upward momentum isshown to lose steam far earlier than was the case in theseries on the left. Indeed, the DM/US$ actually begins tolose ground soon after its initial rise and a sell signal iseventually issued at point S1. Since the selling price (S1)lies below the purchase price (B1), a loss is incurred withthe spread between S1 and B1 representing the margin ofloss per dollar invested. Hence, the buy recommendationat B1 proved to be a false buy signal, with the investorwhipsawed in the process.
Potential Pitfalls from Following Technical Trading Rules
Source: Rosenberg (1996)

DB Guide to Exchange-Rate DeterminationMay 2002 Deutsche Bank @
Deutsche Bank Foreign Exchange Research 15
Studies on the long-run profitability of technical-based trad-ing rules often find that simple moving-average rules wouldhave generated significant excess returns over relativelylong periods for most major currency pairs. We simulatedmore than 2500 sets of moving-average crossover tradingrules for seven currencies versus the U.S. dollar—the Deut-schemark, Japanese yen, Swiss franc, British pound, andthe dollar-bloc currencies—over the 1986-2002 period, andunearthed the optimal moving-average trading rules listedin the table below. The criterion used to choose the opti-mal trading rule in each case was to identify the rule thatyielded the highest Sharpe ratio (after adjusting for trans-action costs) for the entire 16-year period.
For each exchange rate, there were a number of moving-average crossover trading rules that yielded similar attrac-tive Sharpe ratios, and we list the top 10 trading rules foreach exchange rate. In each case, there was always onerule that eked out the highest Sharpe ratio and those areshown in the column on the left. (For example, the bestperforming trading rule for the Deutschemark/U.S. dollarexchange rate was a 1-day/32-day moving-average cross-over trading rule, which yielded an average annual totalreturn of 5.01% with a Sharpe ratio of 0.45.) The moving-average crossover trading rules are ranked for each ex-change rate and are listed from left to right in the tablebelow.
The 10 Best Moving-Average Crossover Trading Rules for 1986-2002(Average Annual Total Returns and Sharpe Ratios for January 1986-April 2002 )
US$ Exchange Rate #1 #2 #3 #4 #5 #6 #7 #8 #9 #10
DEM Mov. Avg. Days 1/32 1/33 1/31 1/28 1/30 1/29 1/34 1/20 1/35 1/19
Total Return (%) 5.01 4.89 4.38 4.20 3.96 3.88 3.98 3.58 3.43 3.13Std. Dev. (%) 11.06 11.06 11.06 11.06 11.06 11.06 11.06 11.06 11.06 11.06Sharpe Ratio 0.45 0.44 0.40 0.38 0.36 0.35 0.36 0.32 0.31 0.28
JPY Mov. Avg. Days 8/59 8/60 7/61 8/61 7/60 9/60 9/62 9/61 8/62 8/63
Total Return (%) 9.19 9.16 8.83 8.86 8.76 8.79 8.63 8.63 8.53 8.49Std. Dev. (%) 11.75 11.75 11.75 11.75 11.75 11.75 11.75 11.75 11.75 11.75Sharpe Ratio 0.78 0.78 0.75 0.75 0.75 0.75 0.73 0.73 0.73 0.72
GBP Mov. Avg. Days 1/19 1/18 1/20 1/21 1/22 1/16 1/24 1/15 1/17 1/23
Total Return (%) 5.80 5.45 5.36 5.32 5.28 5.20 4.91 4.82 4.80 4.49Std. Dev. (%) 9.46 9.47 9.46 9.46 9.46 9.47 9.45 9.47 9.47 9.45Sharpe Ratio 0.61 0.58 0.57 0.56 0.56 0.55 0.52 0.51 0.51 0.48
CHF Mov. Avg. Days 1/57 1/59 1/58 1/56 1/60 1/55 1/69 1/54 1/61 1/65
Total Return (%) 8.63 8.44 8.40 8.40 7.87 7.79 7.50 7.24 7.21 6.84Std. Dev. (%) 11.65 11.64 11.66 11.65 11.63 11.66 11.63 11.66 11.63 11.64Sharpe Ratio 0.74 0.72 0.72 0.72 0.68 0.67 0.65 0.62 0.62 0.59
CAD Mov. Avg. Days 14/199 14/200 14/197 13/197 14/198 13/198 15/195 15/193 15/194 14/196
Total Return (%) 1.88 1.88 1.86 1.83 1.82 1.81 1.75 1.66 1.64 1.59Std. Dev. (%) 4.81 4.81 4.81 4.81 4.81 4.81 4.81 4.81 4.81 4.81Sharpe Ratio 0.39 0.39 0.39 0.38 0.38 0.38 0.36 0.34 0.34 0.33
AUD Mov. Avg. Days 13/39 13/38 13/40 1/16 13/42 13/41 14/43 13/37 13/43 13/45
Total Return (%) 3.53 3.44 3.41 2.99 2.73 2.54 2.45 2.44 2.37 2.34Std. Dev. (%) 10.30 10.31 10.28 10.29 10.28 10.28 10.28 10.31 10.28 10.28Sharpe Ratio 0.34 0.33 0.33 0.29 0.27 0.25 0.24 0.24 0.23 0.23
NZD Mov. Avg. Days 10/17 11/15 10/18 10/15 11/17 14/196 10/16 11/20 11/16 11/14
Total Return (%) 5.20 4.99 5.10 4.76 4.67 4.28 4.28 4.41 3.85 3.38Std. Dev. (%) 10.79 10.80 10.78 10.80 10.79 10.14 10.80 10.78 10.80 10.81Sharpe Ratio 0.48 0.46 0.47 0.44 0.43 0.42 0.40 0.41 0.36 0.31
Note: A Sharpe Ratio measures the amount of return on an investment (less the return of a risk-free asset) per unit of risk, which is proxied by its standard deviation.Datastream is the source of the underlying exchange-rate data.
Empirical Evidence on the Profitability of Moving-Average Trading Rules

DB Guide to Exchange-Rate Determination May 2002Deutsche Bank @
16 Deutsche Bank Foreign Exchange Research
Given the Sharpe ratios shown in the table on the preced-ing page, one might wonder why more investors do notrely on trend-following trading rules more regularly. Onereason is that investors might have a fairly high Sharperatio threshold for committing capital to any particular trad-ing strategy. For instance, many investors might not em-brace a trading strategy rule unless it generated a Sharperatio of at least 0.50. And in some cases, an even higherSharpe ratio might be required for an investor to add sig-nificant risk capital to a particular trading rule. If that werethe case, only the yen and Swiss franc would qualify ascurrencies worthy of trading from a technical perspective.
While the estimated Sharpe ratios may have been high onaverage for the 1986-2002 period, one should note thatthe Sharpe ratios were highly volatile when viewed on a
one-year rolling basis. As the charts below show, therewere periods when risk-adjusted return performances werehigh and other periods when risk-adjusted return perfor-mances were downright poor. This was clearly the casefor several key exchange rates in 2001, with one-year roll-ing Sharpe ratios falling into negative territory for the Deut-schemark, British pound, and Swiss franc.
Except for the yen and the dollar-bloc currencies, total re-turn performances were not that impressive in 2001. Inmost cases, currencies were largely range-bound versusthe U.S. dollar in 2001 and therefore generated a consider-able number of false signals that yielded small but fre-quent losses. On the other hand, the yen’s downtrend—particularly in late 2001—was clearly evident and exploit-able by following a moving-average crossover trading rule.
Deutschemark Moving-Average CrossoverTrading Rule Risk-Adjusted Performance
(1993-2002)
-3
-2
-1
0
1
2
3
1993 1994 1995 1996 1997 1998 1999 2000 2001 2002
(One-Year Rolling Sharpe Ratio)
Japanese Yen Moving-Average CrossoverTrading Rule Risk-Adjusted Performance
(1993-2002)
-2
-1
0
1
2
3
1993 1994 1995 1996 1997 1998 1999 2000 2001 2002
(One-Year Rolling Sharpe Ratio)
British Pound Moving-Average CrossoverTrading Rule Risk-Adjusted Performance
(1993-2002)
-3
-2
-1
0
1
2
3
1993 1994 1995 1996 1997 1998 1999 2000 2001 2002
(One-Year Rolling Sharpe Ratio)
Swiss Franc Moving-Average CrossoverTrading Rule Risk-Adjusted Performance
(1993-2002)
-2
-1
0
1
2
3
1993 1994 1995 1996 1997 1998 1999 2000 2001 2002
(One-Year Rolling Sharpe Ratio)
DB Guide to Exchange-Rate DeterminationMay 2002 Deutsche Bank @
Deutsche Bank Foreign Exchange Research 17
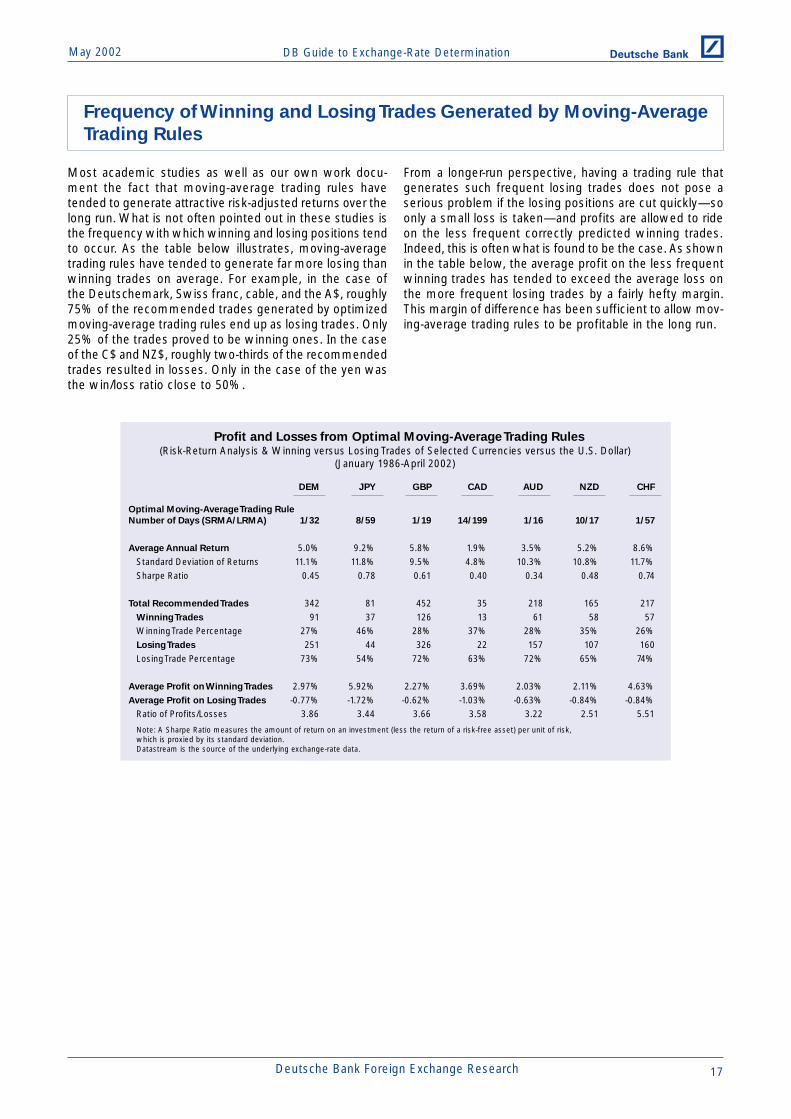
Most academic studies as well as our own work docu-ment the fact that moving-average trading rules havetended to generate attractive risk-adjusted returns over thelong run. What is not often pointed out in these studies isthe frequency with which winning and losing positions tendto occur. As the table below illustrates, moving-averagetrading rules have tended to generate far more losing thanwinning trades on average. For example, in the case ofthe Deutschemark, Swiss franc, cable, and the A$, roughly75% of the recommended trades generated by optimizedmoving-average trading rules end up as losing trades. Only25% of the trades proved to be winning ones. In the caseof the C$ and NZ$, roughly two-thirds of the recommendedtrades resulted in losses. Only in the case of the yen wasthe win/loss ratio close to 50%.
From a longer-run perspective, having a trading rule thatgenerates such frequent losing trades does not pose aserious problem if the losing positions are cut quickly—soonly a small loss is taken—and profits are allowed to rideon the less frequent correctly predicted winning trades.Indeed, this is often what is found to be the case. As shownin the table below, the average profit on the less frequentwinning trades has tended to exceed the average loss onthe more frequent losing trades by a fairly hefty margin.This margin of difference has been sufficient to allow mov-ing-average trading rules to be profitable in the long run.
Frequency of Winning and Losing Trades Generated by Moving-Average
Trading Rules
Profit and Losses from Optimal Moving-Average Trading Rules(Risk-Return Analysis & Winning versus Losing Trades of Selected Currencies versus the U.S. Dollar)
(January 1986-April 2002)
DEM JPY GBP CAD AUD NZD CHF
Optimal Moving-Average Trading Rule
Number of Days (SRMA/LRMA) 1/32 8/59 1/19 14/199 1/16 10/17 1/57
Average Annual Return 5.0% 9.2% 5.8% 1.9% 3.5% 5.2% 8.6%Standard Deviation of Returns 11.1% 11.8% 9.5% 4.8% 10.3% 10.8% 11.7%Sharpe Ratio 0.45 0.78 0.61 0.40 0.34 0.48 0.74
Total Recommended Trades 342 81 452 35 218 165 217Winning Trades 91 37 126 13 61 58 57Winning Trade Percentage 27% 46% 28% 37% 28% 35% 26%Losing Trades 251 44 326 22 157 107 160Losing Trade Percentage 73% 54% 72% 63% 72% 65% 74%
Average Profit on Winning Trades 2.97% 5.92% 2.27% 3.69% 2.03% 2.11% 4.63%Average Profit on Losing Trades -0.77% -1.72% -0.62% -1.03% -0.63% -0.84% -0.84%
Ratio of Profits/Losses 3.86 3.44 3.66 3.58 3.22 2.51 5.51
Note: A Sharpe Ratio measures the amount of return on an investment (less the return of a risk-free asset) per unit of risk,which is proxied by its standard deviation.Datastream is the source of the underlying exchange-rate data.

DB Guide to Exchange-Rate Determination May 2002Deutsche Bank @
18 Deutsche Bank Foreign Exchange Research
The charts below reveal the distribution of returns that eachof our optimal moving-average crossover trading rules hasgenerated over the past 16 years. As shown, the over-whelming majority of recommended trades resulted in ei-ther small gains or small losses. However, note that thedistribution of returns is skewed heavily to the right in mostcases. This indicates that large positive returns do occur
from time to time; it is just that the frequency of big win-ning trades tends to be quite low. These highly skewedreturn distributions raise the question whether conventionalmeasures of risk such as standard deviation, Sharpe ra-tios, and information ratios accurately convey the asym-metric risks facing technically oriented investors, particu-larly over short horizons.
Distribution of Returns from Moving-Average Trading Rules
Distribution of Returns of DEM Trades(Generated by Moving-Average Crossover Strategy)
(1986-2002)
0
50
100
150
200
-2.9 -2.0 -1.1 -0.2 0.7 1.6 2.5 3.4 4.3 5.2 6.1 7.0 7.9 8.8 9.710.6
11.512.4
13.1
Frequency
Return(%)
Distribution of Returns of JPY Trades(Generated by Moving-Average Crossover Strategy)
(1986-2002)
0
10
20
30
40
50
-5.4 -2.1 1.3 4.6 8.0 11.4 14.7 18.1 21.4 24.5
Frequency
Return(%)
Distribution of Returns of GBP Trades(Generated by Moving-Average Crossover Strategy)
(1986-2002)
0
50
100
150
200
250
300
-4.1
-2.8
-1.4
-0.1 1.2 2.5 3.8 5.2 6.5 7.8 9.1 10
.411
.813
.114
.415
.717
.018
.319
.721
.022
.323
.6
Frequency
Return(%)
Distribution of Returns of CAD Trades(Generated by Moving-Average Crossover Strategy)
(1986-2002)
0
5
10
15
20
25
30
-2.46 0.81 4.07 7.34 10.6 13.6
Frequency
Return(%)
Distribution of Returns of AUD Trades(Generated by Moving-Average Crossover Strategy)
(1986-2002)
0
20
40
60
80
-2.4 -1.7 -1.0 -0.4 0.3 1.0 1.7 2.3 3.0 3.7 4.4 5.1 5.7 6.4 6.8
Frequency
Return(%)
Distribution of Returns of CHF Trades(Generated by Moving-Average Crossover Strategy)
(1986-2002)
0
20
40
60
80
100
120
140
-5.73-4.13
-2.52-0.91
0.69 2.3 3.9 5.517.12
8.7210.33
11.9313.54
15.1516.2
Frequency
Return(%)
Source: DatastreamSource: Datastream
Source: DatastreamSource: Datastream
Source: DatastreamSource: Datastream

DB Guide to Exchange-Rate DeterminationMay 2002 Deutsche Bank @
Deutsche Bank Foreign Exchange Research 19
The charts below provide a different way of looking at theshort-term risks facing technically oriented investors in theFX arena. These charts show the actual gains and losseson the recommended trades that our optimal moving-av-erage trading rules have generated in recent years. Whatthese charts reveal is that there were often frequent runsof successive losing trades that had to be absorbed be-fore a sizeable winning trade was generated. While posi-tive returns were generated in most cases for the entiresample period, clearly there were uncomfortably lengthyintervals when frequent losses were incurred.
Our analysis raises several interesting issues. First, shouldtechnical-based moving-average trading rules be viewedas short-term forecasting tools or instead would it be bet-ter to view such trading rules as long-term forecastingtools? The results here suggest that technical-based mov-ing-average trading rules work best in the long run, not inthe short run. Indeed, the odds that a moving-average trad-ing rule recommendation will generate a profit appear tobe no better than 25%-35% in most cases in the short
run. Second, it is possible that since the frequency of los-ing trades is so large, this might actually dissuade inves-tors from using technical models in formulating currencyinvestment strategies. If investors shy away from usingtechnical models because of the high frequency of short-term losses, this might explain why excess returns in thelong run from technical-based models are not completelyarbitraged away.
In order to successfully trade currencies using a technical-based moving-average trading rule, an investor needs tohave staying power—considerable risk capital on hand toabsorb possible frequent short-term trading losses—andpatience. There might be other technical tools that couldbe used to cut down on the number of frequent losses onshort-term trading positions, but one needs to be mindfulof the fact that attempts to add "filters" or other types oftechnical bells and whistles to limit the frequency of falsesignals might hinder the upside potential of correctly pre-dicted winning trades.
Should Moving-Average Trading Rules Be Viewed as Short or Long-Run
Forecasting Tools?
Profit and Losses on Individual DEM Trades(Generated by Moving-Average Crossover Strategy)
(Most Recent 140 Trades)
-4
-2
0
2
4
6
8
10
12-27-95 04-21-97 03-27-98 01-14-99 11-08-2000 10-02-2001
Returns(%)
Trade Dates
Profit and Losses on Individual JPY Trades(Generated by Moving-Average Crossover Strategy)
(1986-2002)
-10
-5
0
5
10
15
20
25
30
01-01-87 12-27-89 02-02-94 01-23-98 03-07-2002
Returns(%)
Trade Dates
Profit and Losses on Individual GBP Trades(Generated by Moving-Average Crossover Strategy)
(Most Recent 140 Trades)
-2
-1
0
1
2
3
4
5
6
06-12-97 06-01-98 01-27-99 01-03-2000 01-12-2001 09-24-2001
Returns(%)
Trade Dates
Profit and Losses on Individual CAD Trades(Generaged by Moving-Average Crossover Strategy)
(1986-2002)
-5
0
5
10
15
20
11-03-86 06-23-89 11-02-90 09-16-94 04-25-96 01-14-97 08-06-99
Returns(%)
Trade Dates
Datastream is the source of theunderlying exchange-rate data.
Datastream is the source of theunderlying exchange-rate data.
Datastream is the source of theunderlying exchange-rate data.
Datastream is the source of theunderlying exchange-rate data.
DB Guide to Exchange-Rate Determination May 2002Deutsche Bank @
20 Deutsche Bank Foreign Exchange Research
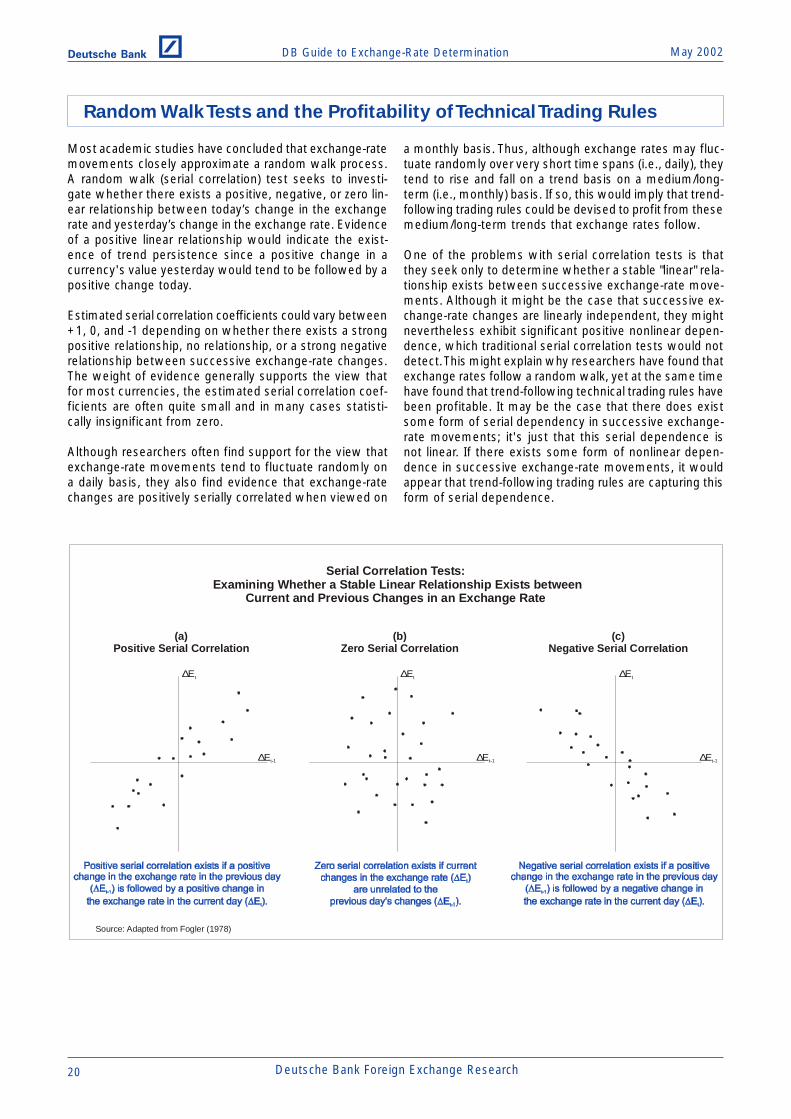
Most academic studies have concluded that exchange-ratemovements closely approximate a random walk process.A random walk (serial correlation) test seeks to investi-gate whether there exists a positive, negative, or zero lin-ear relationship between today’s change in the exchangerate and yesterday’s change in the exchange rate. Evidenceof a positive linear relationship would indicate the exist-ence of trend persistence since a positive change in acurrency's value yesterday would tend to be followed by apositive change today.
Estimated serial correlation coefficients could vary between+1, 0, and -1 depending on whether there exists a strongpositive relationship, no relationship, or a strong negativerelationship between successive exchange-rate changes.The weight of evidence generally supports the view thatfor most currencies, the estimated serial correlation coef-ficients are often quite small and in many cases statisti-cally insignificant from zero.
Although researchers often find support for the view thatexchange-rate movements tend to fluctuate randomly ona daily basis, they also find evidence that exchange-ratechanges are positively serially correlated when viewed on
a monthly basis. Thus, although exchange rates may fluc-tuate randomly over very short time spans (i.e., daily), theytend to rise and fall on a trend basis on a medium/long-term (i.e., monthly) basis. If so, this would imply that trend-following trading rules could be devised to profit from thesemedium/long-term trends that exchange rates follow.
One of the problems with serial correlation tests is thatthey seek only to determine whether a stable "linear" rela-tionship exists between successive exchange-rate move-ments. Although it might be the case that successive ex-change-rate changes are linearly independent, they mightnevertheless exhibit significant positive nonlinear depen-dence, which traditional serial correlation tests would notdetect. This might explain why researchers have found thatexchange rates follow a random walk, yet at the same timehave found that trend-following technical trading rules havebeen profitable. It may be the case that there does existsome form of serial dependency in successive exchange-rate movements; it's just that this serial dependence isnot linear. If there exists some form of nonlinear depen-dence in successive exchange-rate movements, it wouldappear that trend-following trading rules are capturing thisform of serial dependence.
Random Walk Tests and the Profitability of Technical Trading Rules
(a)Positive Serial Correlation
Serial Correlation Tests: Examining Whether a Stable Linear Relationship Exists between
Current and Previous Changes in an Exchange Rate
(b)Zero Serial Correlation
(c)Negative Serial Correlation
∆Et ∆Et ∆Et
∆Et-1∆Et-1∆Et-1
Source: Adapted from Fogler (1978)
DB Guide to Exchange-Rate DeterminationMay 2002 Deutsche Bank @
Deutsche Bank Foreign Exchange Research 21
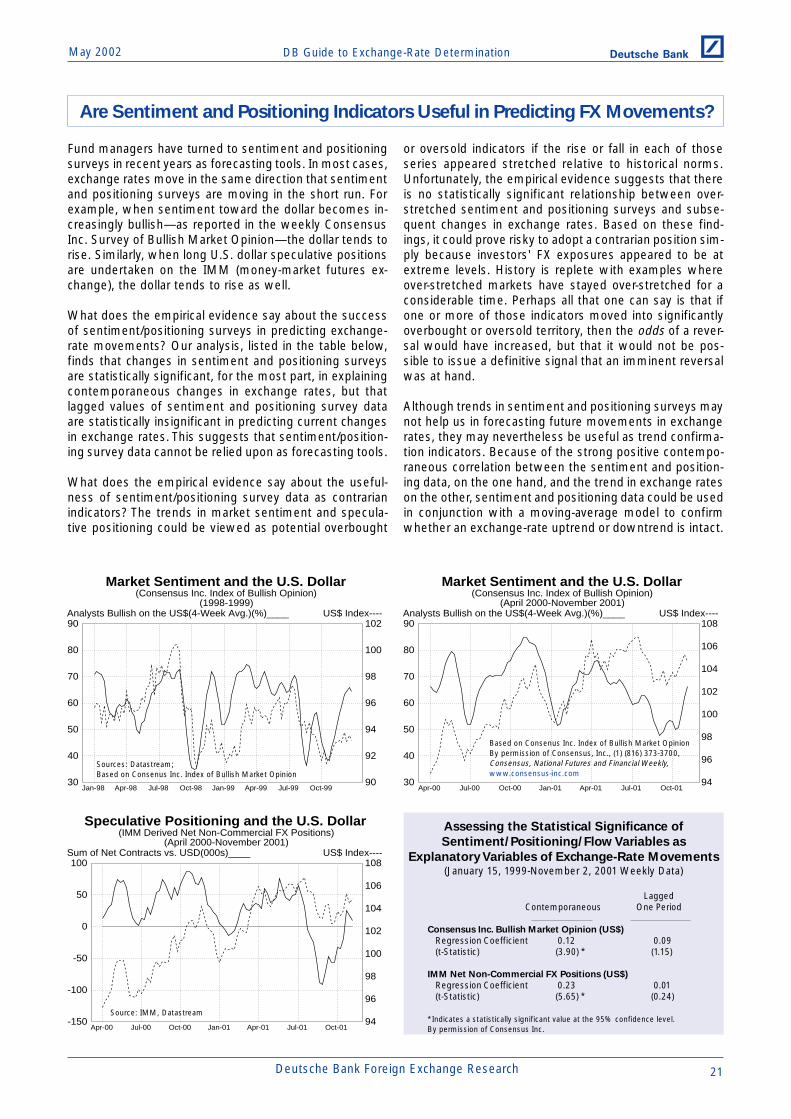
Fund managers have turned to sentiment and positioningsurveys in recent years as forecasting tools. In most cases,exchange rates move in the same direction that sentimentand positioning surveys are moving in the short run. Forexample, when sentiment toward the dollar becomes in-creasingly bullish—as reported in the weekly ConsensusInc. Survey of Bullish Market Opinion—the dollar tends torise. Similarly, when long U.S. dollar speculative positionsare undertaken on the IMM (money-market futures ex-change), the dollar tends to rise as well.
What does the empirical evidence say about the successof sentiment/positioning surveys in predicting exchange-rate movements? Our analysis, listed in the table below,finds that changes in sentiment and positioning surveysare statistically significant, for the most part, in explainingcontemporaneous changes in exchange rates, but thatlagged values of sentiment and positioning survey dataare statistically insignificant in predicting current changesin exchange rates. This suggests that sentiment/position-ing survey data cannot be relied upon as forecasting tools.
What does the empirical evidence say about the useful-ness of sentiment/positioning survey data as contrarianindicators? The trends in market sentiment and specula-tive positioning could be viewed as potential overbought
or oversold indicators if the rise or fall in each of thoseseries appeared stretched relative to historical norms.Unfortunately, the empirical evidence suggests that thereis no statistically significant relationship between over-stretched sentiment and positioning surveys and subse-quent changes in exchange rates. Based on these find-ings, it could prove risky to adopt a contrarian position sim-ply because investors' FX exposures appeared to be atextreme levels. History is replete with examples whereover-stretched markets have stayed over-stretched for aconsiderable time. Perhaps all that one can say is that ifone or more of those indicators moved into significantlyoverbought or oversold territory, then the odds of a rever-sal would have increased, but that it would not be pos-sible to issue a definitive signal that an imminent reversalwas at hand.
Although trends in sentiment and positioning surveys maynot help us in forecasting future movements in exchangerates, they may nevertheless be useful as trend confirma-tion indicators. Because of the strong positive contempo-raneous correlation between the sentiment and position-ing data, on the one hand, and the trend in exchange rateson the other, sentiment and positioning data could be usedin conjunction with a moving-average model to confirmwhether an exchange-rate uptrend or downtrend is intact.
Market Sentiment and the U.S. Dollar(Consensus Inc. Index of Bullish Opinion)
(1998-1999)
90
92
94
96
98
100
102
30
40
50
60
70
80
90
Jan-98 Apr-98 Jul-98 Oct-98 Jan-99 Apr-99 Jul-99 Oct-99
US$ Index----Analysts Bullish on the US$(4-Week Avg.)(%)____
Sources: Datastream;Based on Consenus Inc. Index of Bullish Market Opinion
Market Sentiment and the U.S. Dollar(Consensus Inc. Index of Bullish Opinion)
(April 2000-November 2001)
94
96
98
100
102
104
106
108
30
40
50
60
70
80
90
Apr-00 Jul-00 Oct-00 Jan-01 Apr-01 Jul-01 Oct-01
US$ Index----Analysts Bullish on the US$(4-Week Avg.)(%)____
Based on Consenus Inc. Index of Bullish Market OpinionBy permission of Consensus, Inc., (1) (816) 373-3700,Consensus, National Futures and Financial Weekly,www.consensus-inc.com
Speculative Positioning and the U.S. Dollar(IMM Derived Net Non-Commercial FX Positions)
(April 2000-November 2001)
94
96
98
100
102
104
106
108
-150
-100
-50
0
50
100
Apr-00 Jul-00 Oct-00 Jan-01 Apr-01 Jul-01 Oct-01
US$ Index----Sum of Net Contracts vs. USD(000s)____
Assessing the Statistical Significance of
Sentiment/Positioning/Flow Variables as
Explanatory Variables of Exchange-Rate Movements(January 15, 1999-November 2, 2001 Weekly Data)
LaggedContemporaneous One Period
Consensus Inc. Bullish Market Opinion (US$)
Regression Coefficient 0.12 0.09(t-Statistic) (3.90) * (1.15)
IMM Net Non-Commercial FX Positions (US$)
Regression Coefficient 0.23 0.01(t-Statistic) (5.65) * (0.24)
*Indicates a statistically significant value at the 95% confidence level.By permission of Consensus Inc.
Are Sentiment and Positioning Indicators Useful in Predicting FX Movements?
Source: IMM, Datastream

DB Guide to Exchange-Rate Determination May 2002Deutsche Bank @
22 Deutsche Bank Foreign Exchange Research
Investors often try to infer the market's expectation of fu-ture interest-rate movements by examining interest-ratefutures contracts for various maturities or by examiningthe implied future path in interest rates embedded in yield-curve slopes. Similarly, investors often try to infer themarket's expectation of future exchange-rate movementsby examining the level of domestic/foreign interest-ratespreads, or the implied path of long-dated forward ex-change rates.
Information on future interest-rate and exchange-rate move-ments can also be gleaned from the options market.Whereas interest-rate futures, yield-curve slopes, and yieldspreads provide point estimates regarding expected fu-ture values, the options market provides a different pieceof information—the market's expectation of the probabil-ity distribution of future interest rates and exchange rates.
For example, in the FX market, data on implied volatilityfor a range of maturities and strike prices are readily avail-able. Implied volatility provides us with a measure of themarketplace's uncertainty regarding future exchange-ratemovements. If implied volatility is rising, it "implies" greateruncertainty about future exchange-rate movements, andvice versa.
One could construct a forward implied volatility curve toglean expected future volatility movements by stringingtogether implied volatilities for a range of maturities withthe same strike price. If the forward implied volatility curvewere steeply upward sloping, the market would be pricingin the expectation of a future jump in currency volatility. Ifthe forward implied volatility curve were flat, the market-place would be pricing in no change in the level of cur-rency volatility in the future.
Does the forward implied volatility curve accurately antici-pate future jumps in exchange-rate volatility? Because vola-tility jumps often occur suddenly and without warning, itis highly unlikely that the forward implied volatility curvewould be able to consistently forecast future jumps in theexchange rate. Indeed, the Bank of England examinedwhether implied forward volatility curves anticipated theunwinding of the infamous yen carry (long dollar/short yen)trade in October 1998, and concluded that "Forward vola-tility curves…. did not expect the increase in volatilities(that occurred) in October 1998. Although (historical) vola-tility had increased throughout the summer, the forwardvolatility curve suggested that it would fall back towardsprevious levels." Indeed, in mid-September 1998, histori-cal volatility was running around 22%-26% and forwardvolatility curves were expecting implied volatilities to easetoward 14% in the October-November 1998 period. Instead,historical volatility soared to over 40% in early Octoberwhen the yen carry trade was suddenly unwound.
Can One Extract Information from the Currency Options Market
to Predict Future Exchange-Rate Movements?
Japanese Yen/U.S. Dollar Exchange Rate(1997-1998)
110
120
130
140
150
Jan-97 Apr-97 Jul-97 Oct-97 Jan-98 Apr-98 Jul-98 Oct-98
Yen/US$
Japanese Yen/U.S. Dollar Implied Volatility(1997-1998)
0
10
20
30
40
Jan-97 Apr-97 Jul-97 Oct-97 Jan-98 Apr-98 Jul-98 Oct-98
1-Month Volatility----(%) 12-Month Volatility____
Source: Datastream
Source: DRI

DB Guide to Exchange-Rate DeterminationMay 2002 Deutsche Bank @
Deutsche Bank Foreign Exchange Research 23
Assessing the Statistical Significance of
Sentiment/Positioning/Flow Variables as
Explanatory Variables of Exchange-Rate Movements(January 15, 1999-November 2, 2001 Weekly Data)
LaggedContemporaneous One Period
Option Market Sentiment (Euro Risk Reversals)
Regression Coefficient -0.02 0.03(t-Statistic) (-0.90) (1.23)
Option Market Sentiment (Yen Risk Reversals)
Regression Coefficient 0.11 0.04(t-Statistic) (3.06) * (1.19)
*Indicates a statistically significant value at the 95% confidence level.Source: Datastream; DB
Euro Risk Reversals & US$/Euro Exchange RateEuro Calls(+)/Puts(-) Trading at Premium vs. USD
0.82
0.84
0.86
0.88
0.90
0.92
0.94
0.96
0.98
-1.0
-0.5
0.0
0.5
1.0
1.5
Jul-00 Oct-00 Jan-01 Apr-01 Jul-01 Oct-01 Jan-02 Apr-02
US$/Euro----Calls(+)/Puts(-) Trading at Premium____
Yen Risk Reversals & Yen/US$ Exchange RateYen Calls(+)/Puts(-) Trading at Premium vs. USD
(140)
(135)
(130)
(125)
(120)
(115)
(110)
(105)
(100)
-2.0
-1.0
0.0
1.0
2.0
3.0
Jul-00 Oct-00 Jan-01 Apr-01 Jul-01 Oct-01 Jan-02 Apr-02
Yen/US$(reverse scale)----Calls(+)/Puts(-) Trading at Premium____
FX traders often use risk reversals to glean information onwhether the market might be attaching a higher probabil-ity to a large currency appreciation than to a large currencydepreciation, or vice versa. A risk reversal is a currencyoption position that consists of the purchase of an out-of-the-money (25 delta) call and the simultaneous sale of anout-of-the-money (25 delta) put, both in equal amounts andboth with the same expiration date. Risk reversals arequoted in terms of the implied volatility spread betweenthe 25 delta call and 25 delta put. For example, if the im-plied volatility on the call were 2% larger than the impliedvolatility on the put, the risk reversal would be quoted at+2.0%. If the implied volatility on the put were 2% greaterthan the implied volatility on the call, the risk reversal wouldbe quoted at -2%.
A risk reversal quoted at +2% would indicate that themarket was attaching a higher probability to a large cur-rency appreciation than to a large currency depreciation.This would indicate that the market was willing to pay moreto insure against the risk that the currency will rise sharplythan it was willing to pay to insure against the risk that thecurrency will fall sharply.
The key issue for traders and investors is whether the levelor trend in currency risk reversals can be used to correctlyanticipate future exchange-rate movements. The evidenceindicates a high contemporaneous correlation between thetrend in risk reversals and the trend in exchange rates, butno statistically significant relationship exists betweenlagged risk reversal data and future exchange-rate move-ments. Therefore, risk reversals are capable of confirmingan exchange rate’s trend, but not predicting it.
Nor is there evidence that overly stretched risk reversalmeasures can function as a consistently reliable contraryindicator. Indeed, the Bank of England's study on the un-winding of the yen carry trade in the fall of 1998 found thatdollar/yen risk reversals failed to provide an early warningof the dramatic unwinding of long dollar/short yen posi-tions that was about to occur.
Inferring Information about Future Exchange-Rate Movements
from Currency Risk Reversals
Yen/US$
Profit
Payoff Schedule of 25 DeltaRisk Reversal at Maturity
(-)
(+)
0
Source: Datastream; DB Source: Datastream; DB
DB Guide to Exchange-Rate Determination May 2002Deutsche Bank @
24 Deutsche Bank Foreign Exchange Research
In recent years, there has been increased interest on thepart of investors and academicians in FX-dealer customer-flow data. One of the characteristics that distinguishes theFX market from the world equity market is that the FXmarket has considerably less transparency. Equity-marketdisclosure requirements mandate that all trades are in-stantly posted. Thus, volume and price data are instantlyavailable to all parties. Not so in the FX market. No suchdisclosure requirements exist, which means that order-flowinformation is not immediately available to all parties.
Indeed, large FX dealers are in a unique position in thatthey are able to observe large trades that could move themarket before other parties are aware of such trades. Arecent survey of FX dealers indicated that most tradersbelieve that large FX dealers have a comparative advan-tage over smaller dealers because they have a large cus-tomer base that gives them privileged information aboutcustomer orders.
One could envisage a marketplace where there exists bothprivate and publicly available information. Publicly availableinformation consists largely of macroeconomic-relateddata, which is available to all market participants at thesame time. However, there may be microeconomic-relatedinformation that is important for exchange rates, but is not
publicly available. Examples of microeconomic-related in-formation are shifts in risk appetite, liquidity needs, hedg-ing demands, and institutional portfolio rebalancings. Suchmicroeconomic-related FX flows give rise to buy or sellorders that influence the short-term trend in exchangerates, just as investor responses to macroeconomic-relatedinformation do. Large FX dealers can use the informationgleaned from the change in their customer order flow todrive their own short-run strategies, which can then add tothe upward or downward pressure on the exchange rate'svalue.
Viewing the impact of order flow in this manner, it is evi-dent that order flow serves as a proximate determinantand not as the ultimate determinant of short-term ex-change-rate movements. The ultimate determinant of ex-change rates is the joint interplay of macroeconomic andmicroeconomic information underlying the change in or-der flow.
Given the potential impact that order flow can have onexchange rates in the short run, a large FX dealer's orderbook can provide valuable information to both traders andinvestors who wish to keep abreast of underlying privateinvestor shifts in portfolio behavior, whether those shiftsare of a macro or micro-economic nature.
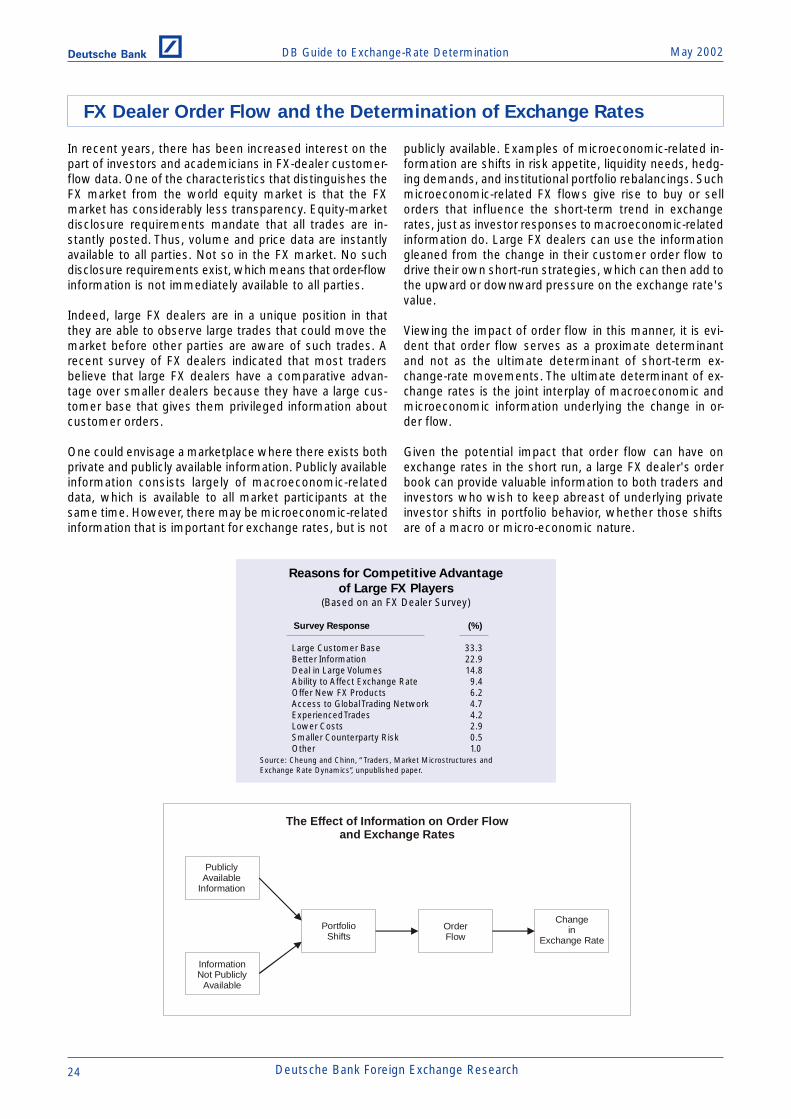
InformationNot Publicly
Available
PortfolioShifts
OrderFlow
Changein
Exchange Rate
The Effect of Information on Order Flowand Exchange Rates
PubliclyAvailable
Information
Reasons for Competitive Advantage
of Large FX Players(Based on an FX Dealer Survey)
Survey Response (%)
Large Customer Base 33.3Better Information 22.9Deal in Large Volumes 14.8Ability to Affect Exchange Rate 9.4Offer New FX Products 6.2Access to Global Trading Network 4.7Experienced Trades 4.2Lower Costs 2.9Smaller Counterparty Risk 0.5Other 1.0
Source: Cheung and Chinn, “Traders, Market Microstructures andExchange Rate Dynamics”, unpublished paper.
FX Dealer Order Flow and the Determination of Exchange Rates
DB Guide to Exchange-Rate DeterminationMay 2002 Deutsche Bank @
Deutsche Bank Foreign Exchange Research 25
How FX Dealers and Fund Managers View the Importance of
Flow Analysis Relative to Fundamental and Technical Analysis
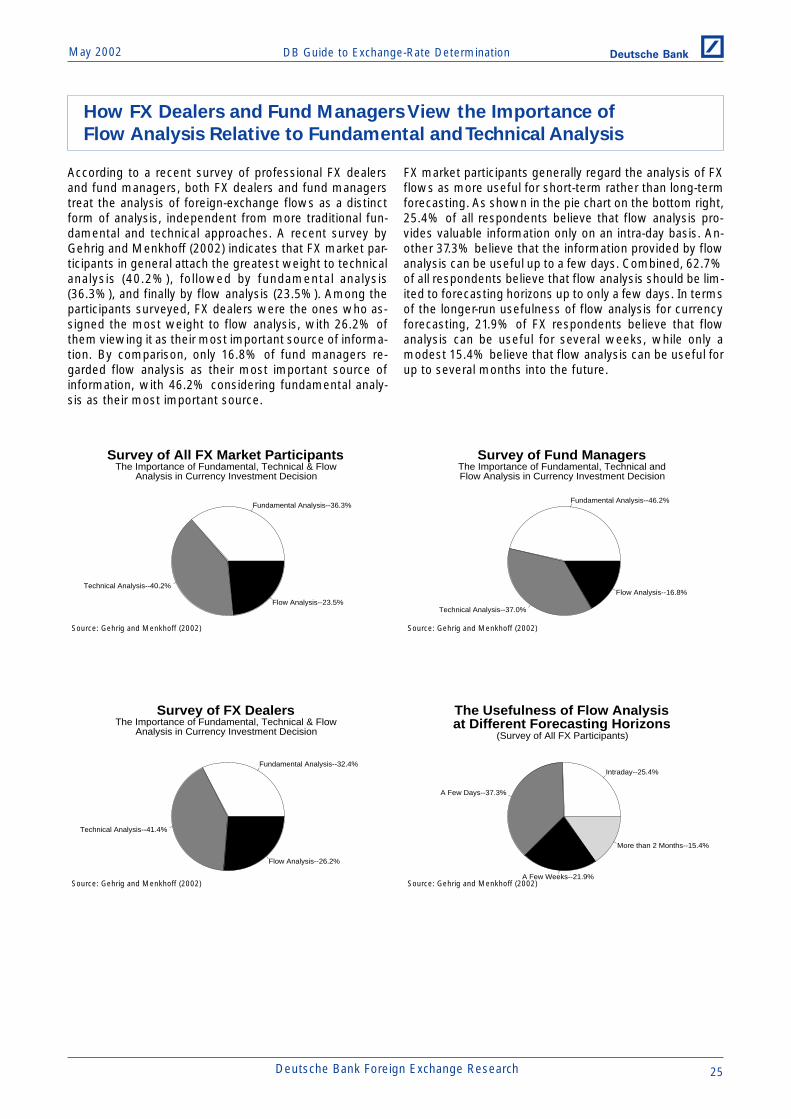
According to a recent survey of professional FX dealersand fund managers, both FX dealers and fund managerstreat the analysis of foreign-exchange flows as a distinctform of analysis, independent from more traditional fun-damental and technical approaches. A recent survey byGehrig and Menkhoff (2002) indicates that FX market par-ticipants in general attach the greatest weight to technicalanalysis (40.2%), followed by fundamental analysis(36.3%), and finally by flow analysis (23.5%). Among theparticipants surveyed, FX dealers were the ones who as-signed the most weight to flow analysis, with 26.2% ofthem viewing it as their most important source of informa-tion. By comparison, only 16.8% of fund managers re-garded flow analysis as their most important source ofinformation, with 46.2% considering fundamental analy-sis as their most important source.
FX market participants generally regard the analysis of FXflows as more useful for short-term rather than long-termforecasting. As shown in the pie chart on the bottom right,25.4% of all respondents believe that flow analysis pro-vides valuable information only on an intra-day basis. An-other 37.3% believe that the information provided by flowanalysis can be useful up to a few days. Combined, 62.7%of all respondents believe that flow analysis should be lim-ited to forecasting horizons up to only a few days. In termsof the longer-run usefulness of flow analysis for currencyforecasting, 21.9% of FX respondents believe that flowanalysis can be useful for several weeks, while only amodest 15.4% believe that flow analysis can be useful forup to several months into the future.
Survey of All FX Market Participants
The Importance of Fundamental, Technical & FlowAnalysis in Currency Investment Decision
Fundamental Analysis--36.3%
Technical Analysis--40.2%
Flow Analysis--23.5%
Survey of Fund Managers
The Importance of Fundamental, Technical andFlow Analysis in Currency Investment Decision
Fundamental Analysis--46.2%
Technical Analysis--37.0%
Flow Analysis--16.8%
Survey of FX Dealers
The Importance of Fundamental, Technical & FlowAnalysis in Currency Investment Decision
Fundamental Analysis--32.4%
Technical Analysis--41.4%
Flow Analysis--26.2%
The Usefulness of Flow Analysisat Different Forecasting Horizons
(Survey of All FX Participants)
Intraday--25.4%
A Few Days--37.3%
A Few Weeks--21.9%
More than 2 Months--15.4%
Source: Gehrig and Menkhoff (2002) Source: Gehrig and Menkhoff (2002)
Source: Gehrig and Menkhoff (2002) Source: Gehrig and Menkhoff (2002)
DB Guide to Exchange-Rate Determination May 2002Deutsche Bank @
26 Deutsche Bank Foreign Exchange Research
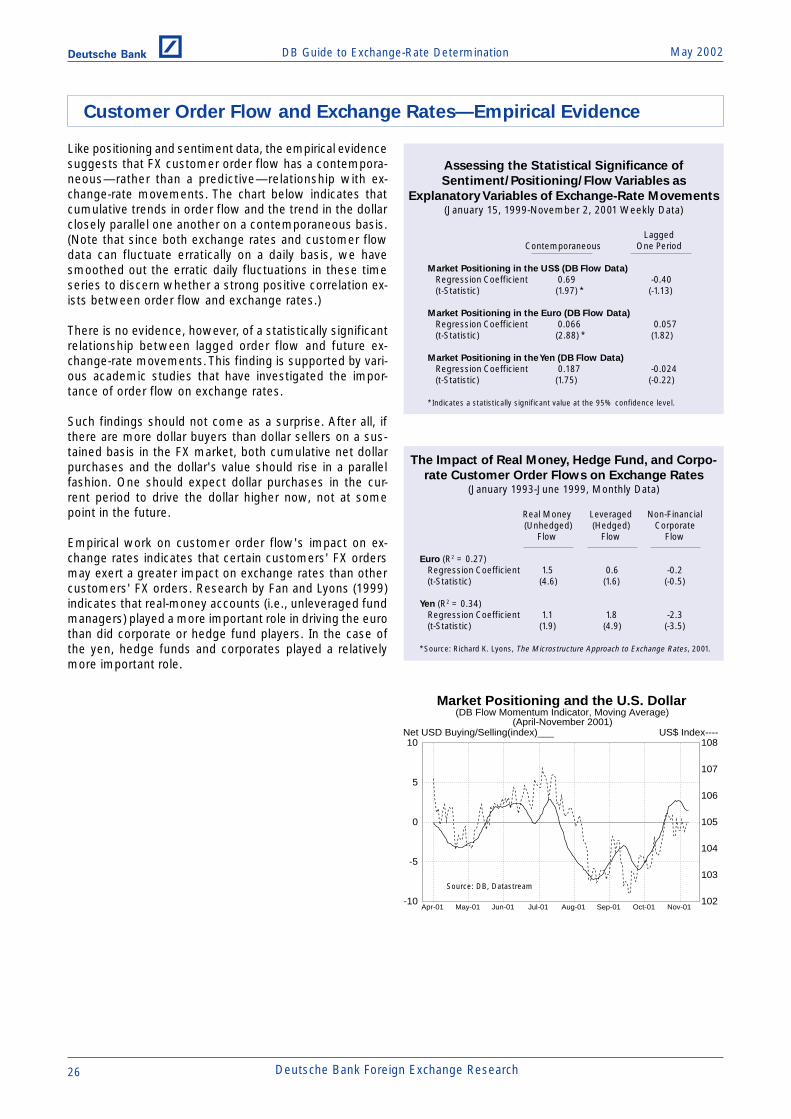
Like positioning and sentiment data, the empirical evidencesuggests that FX customer order flow has a contempora-neous—rather than a predictive—relationship with ex-change-rate movements. The chart below indicates thatcumulative trends in order flow and the trend in the dollarclosely parallel one another on a contemporaneous basis.(Note that since both exchange rates and customer flowdata can fluctuate erratically on a daily basis, we havesmoothed out the erratic daily fluctuations in these timeseries to discern whether a strong positive correlation ex-ists between order flow and exchange rates.)
There is no evidence, however, of a statistically significantrelationship between lagged order flow and future ex-change-rate movements. This finding is supported by vari-ous academic studies that have investigated the impor-tance of order flow on exchange rates.
Such findings should not come as a surprise. After all, ifthere are more dollar buyers than dollar sellers on a sus-tained basis in the FX market, both cumulative net dollarpurchases and the dollar's value should rise in a parallelfashion. One should expect dollar purchases in the cur-rent period to drive the dollar higher now, not at somepoint in the future.
Empirical work on customer order flow's impact on ex-change rates indicates that certain customers' FX ordersmay exert a greater impact on exchange rates than othercustomers' FX orders. Research by Fan and Lyons (1999)indicates that real-money accounts (i.e., unleveraged fundmanagers) played a more important role in driving the eurothan did corporate or hedge fund players. In the case ofthe yen, hedge funds and corporates played a relativelymore important role.
Assessing the Statistical Significance of
Sentiment/Positioning/Flow Variables as
Explanatory Variables of Exchange-Rate Movements(January 15, 1999-November 2, 2001 Weekly Data)
LaggedContemporaneous One Period
Market Positioning in the US$ (DB Flow Data)
Regression Coefficient 0.69 -0.40(t-Statistic) (1.97) * (-1.13)
Market Positioning in the Euro (DB Flow Data)
Regression Coefficient 0.066 0.057(t-Statistic) (2.88) * (1.82)
Market Positioning in the Yen (DB Flow Data)
Regression Coefficient 0.187 -0.024(t-Statistic) (1.75) (-0.22)
*Indicates a statistically significant value at the 95% confidence level.
The Impact of Real Money, Hedge Fund, and Corpo-
rate Customer Order Flows on Exchange Rates(January 1993-June 1999, Monthly Data)
Real Money Leveraged Non-Financial (Unhedged) (Hedged) Corporate
Flow Flow Flow
Euro (R2 = 0.27)Regression Coefficient 1.5 0.6 -0.2(t-Statistic) (4.6) (1.6) (-0.5)
Yen (R2 = 0.34)Regression Coefficient 1.1 1.8 -2.3(t-Statistic) (1.9) (4.9) (-3.5)
*Source: Richard K. Lyons, The Microstructure Approach to Exchange Rates, 2001.
Market Positioning and the U.S. Dollar(DB Flow Momentum Indicator, Moving Average)
(April-November 2001)
102
103
104
105
106
107
108
-10
-5
0
5
10
Apr-01 May-01 Jun-01 Jul-01 Aug-01 Sep-01 Oct-01 Nov-01
US$ Index----Net USD Buying/Selling(index)___
Source: DB, Datastream
Customer Order Flow and Exchange Rates—Empirical Evidence

DB Guide to Exchange-Rate DeterminationMay 2002 Deutsche Bank @
Deutsche Bank Foreign Exchange Research 27
Surveys of global fund-manager positioning are anothertool that FX market participants have turned to in recentyears for short-term exchange-rate forecasting. The monthlyRussell-Mellon survey summarizes the portfolio positionsof 28 global fixed-income managers in selected curren-cies and bond markets, with attention normally focusedon the 25th, median, and 75th percentile exposures. Thetrends in investor exposure to the dollar, euro, and yen forthe 1996-2001 period are shown in the charts on the left.
In an attempt to better detect underlying trends in currencypositioning, we have calculated a net weighted-average
exposure index for investor allocations to the dollar, euro,and yen in the Russell-Mellon survey. We make the heroicassumption that the range of all reported currency expo-sures can be defined by a normal distribution, and that the25th, median, and 75th percentile exposure fit comfortablyinside this normal distribution. We then calculate a netweighted-average exposure for each currency, which isplotted against each of the respective currencies in thediagrams on the right. These charts suggest that the use-fulness of fund-manager positioning in predicting exchange-rate movements may be tenuous at best.
Investor Positioning and the Trend in Exchange Rates
Source: Russell Mellon, Datastream
Source: Russell Mellon, Datastream
Source: Russell Mellon, Datastream
Investor Exposure to the U.S. Dollar(DB Net Weighted-Average Exposure to the US$)
(Russell-Mellon Survey)
-20
-10
0
10
20
30
40
1996 1997 1998 1999 2000 2001 2002
25 and 75 Percentiles----Net Weighted Exposure Index____
Source: Russell Mellon
Investor Exposure to the Euro(DB Net Weighted-Average Exposure to the Euro)
(Russell-Mellon Survey)
-30
-20
-10
0
10
20
1996 1997 1998 1999 2000 2001 2002
25 and 75 Percentiles----Net Weighted Exposure Index____
Source: Russell Mellon
Investor Exposure to the Japanese Yen(DB Net Weighted-Average Exposure to the Yen)
(Russell-Mellon Survey)
-20
-15
-10
-5
0
5
1996 1997 1998 1999 2000 2001 2002
25 and 75 Percentiles----Net Weighted Exposure Index____
Source: Russell Mellon
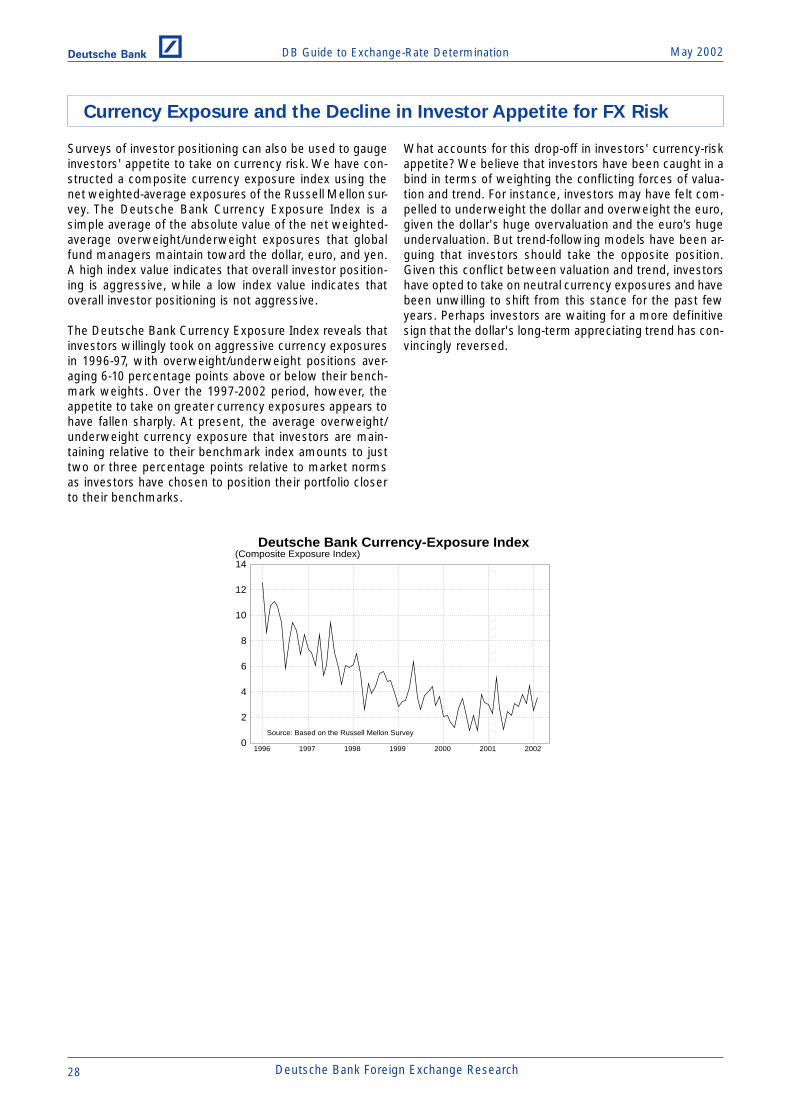
DB Guide to Exchange-Rate Determination May 2002Deutsche Bank @
28 Deutsche Bank Foreign Exchange Research
Surveys of investor positioning can also be used to gaugeinvestors' appetite to take on currency risk. We have con-structed a composite currency exposure index using thenet weighted-average exposures of the Russell Mellon sur-vey. The Deutsche Bank Currency Exposure Index is asimple average of the absolute value of the net weighted-average overweight/underweight exposures that globalfund managers maintain toward the dollar, euro, and yen.A high index value indicates that overall investor position-ing is aggressive, while a low index value indicates thatoverall investor positioning is not aggressive.
The Deutsche Bank Currency Exposure Index reveals thatinvestors willingly took on aggressive currency exposuresin 1996-97, with overweight/underweight positions aver-aging 6-10 percentage points above or below their bench-mark weights. Over the 1997-2002 period, however, theappetite to take on greater currency exposures appears tohave fallen sharply. At present, the average overweight/underweight currency exposure that investors are main-taining relative to their benchmark index amounts to justtwo or three percentage points relative to market normsas investors have chosen to position their portfolio closerto their benchmarks.
What accounts for this drop-off in investors' currency-riskappetite? We believe that investors have been caught in abind in terms of weighting the conflicting forces of valua-tion and trend. For instance, investors may have felt com-pelled to underweight the dollar and overweight the euro,given the dollar's huge overvaluation and the euro’s hugeundervaluation. But trend-following models have been ar-guing that investors should take the opposite position.Given this conflict between valuation and trend, investorshave opted to take on neutral currency exposures and havebeen unwilling to shift from this stance for the past fewyears. Perhaps investors are waiting for a more definitivesign that the dollar's long-term appreciating trend has con-vincingly reversed.
Deutsche Bank Currency-Exposure Index
0
2
4
6
8
10
12
14
1996 1997 1998 1999 2000 2001 2002
(Composite Exposure Index)
Source: Based on the Russell Mellon Survey
Currency Exposure and the Decline in Investor Appetite for FX Risk
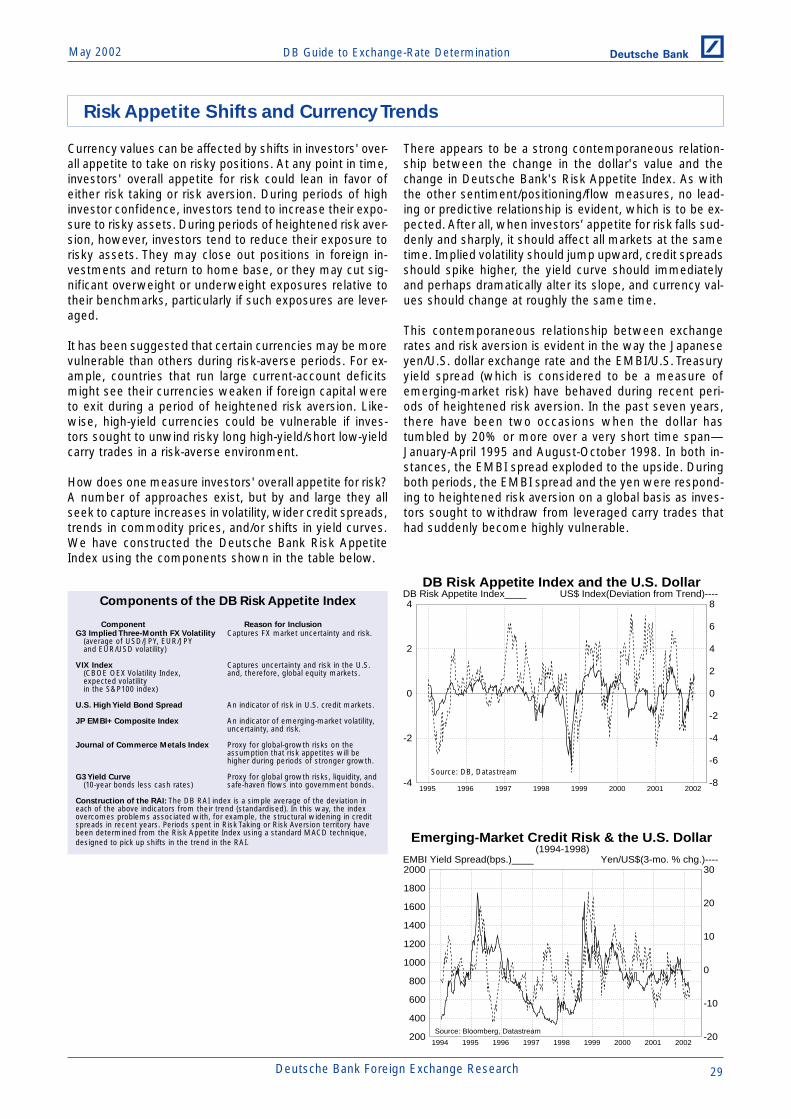
DB Guide to Exchange-Rate DeterminationMay 2002 Deutsche Bank @
Deutsche Bank Foreign Exchange Research 29
Currency values can be affected by shifts in investors' over-all appetite to take on risky positions. At any point in time,investors' overall appetite for risk could lean in favor ofeither risk taking or risk aversion. During periods of highinvestor confidence, investors tend to increase their expo-sure to risky assets. During periods of heightened risk aver-sion, however, investors tend to reduce their exposure torisky assets. They may close out positions in foreign in-vestments and return to home base, or they may cut sig-nificant overweight or underweight exposures relative totheir benchmarks, particularly if such exposures are lever-aged.
It has been suggested that certain currencies may be morevulnerable than others during risk-averse periods. For ex-ample, countries that run large current-account deficitsmight see their currencies weaken if foreign capital wereto exit during a period of heightened risk aversion. Like-wise, high-yield currencies could be vulnerable if inves-tors sought to unwind risky long high-yield/short low-yieldcarry trades in a risk-averse environment.
How does one measure investors' overall appetite for risk?A number of approaches exist, but by and large they allseek to capture increases in volatility, wider credit spreads,trends in commodity prices, and/or shifts in yield curves.We have constructed the Deutsche Bank Risk AppetiteIndex using the components shown in the table below.
There appears to be a strong contemporaneous relation-ship between the change in the dollar's value and thechange in Deutsche Bank's Risk Appetite Index. As withthe other sentiment/positioning/flow measures, no lead-ing or predictive relationship is evident, which is to be ex-pected. After all, when investors’ appetite for risk falls sud-denly and sharply, it should affect all markets at the sametime. Implied volatility should jump upward, credit spreadsshould spike higher, the yield curve should immediatelyand perhaps dramatically alter its slope, and currency val-ues should change at roughly the same time.
This contemporaneous relationship between exchangerates and risk aversion is evident in the way the Japaneseyen/U.S. dollar exchange rate and the EMBI/U.S. Treasuryyield spread (which is considered to be a measure ofemerging-market risk) have behaved during recent peri-ods of heightened risk aversion. In the past seven years,there have been two occasions when the dollar hastumbled by 20% or more over a very short time span—January-April 1995 and August-October 1998. In both in-stances, the EMBI spread exploded to the upside. Duringboth periods, the EMBI spread and the yen were respond-ing to heightened risk aversion on a global basis as inves-tors sought to withdraw from leveraged carry trades thathad suddenly become highly vulnerable.
DB Risk Appetite Index and the U.S. Dollar
-8
-6
-4
-2
0
2
4
6
8
-4
-2
0
2
4
1995 1996 1997 1998 1999 2000 2001 2002
US$ Index(Deviation from Trend)----DB Risk Appetite Index____Components of the DB Risk Appetite Index
Component Reason for InclusionG3 Implied Three-Month FX Volatility Captures FX market uncertainty and risk.
(average of USD/JPY, EUR/JPYand EUR/USD volatility)
VIX Index Captures uncertainty and risk in the U.S.(CBOE OEX Volatility Index, and, therefore, global equity markets.expected volatilityin the S&P100 index)
U.S. High Yield Bond Spread An indicator of risk in U.S. credit markets.
JP EMBI+ Composite Index An indicator of emerging-market volatility,uncertainty, and risk.
Journal of Commerce Metals Index Proxy for global-growth risks on theassumption that risk appetites will behigher during periods of stronger growth.
G3 Yield Curve Proxy for global growth risks, liquidity, and(10-year bonds less cash rates) safe-haven flows into government bonds.
Construction of the RAI: The DB RAI index is a simple average of the deviation ineach of the above indicators from their trend (standardised). In this way, the indexovercomes problems associated with, for example, the structural widening in creditspreads in recent years. Periods spent in Risk Taking or Risk Aversion territory havebeen determined from the Risk Appetite Index using a standard MACD technique,designed to pick up shifts in the trend in the RAI.
Source: DB, Datastream
Risk Appetite Shifts and Currency Trends
Emerging-Market Credit Risk & the U.S. Dollar(1994-1998)
-20
-10
0
10
20
30
200
400
600
800
1000
1200
1400
1600
1800
2000
1994 1995 1996 1997 1998 1999 2000 2001 2002
Yen/US$(3-mo. % chg.)----EMBI Yield Spread(bps.)____
Source: Bloomberg, Datastream
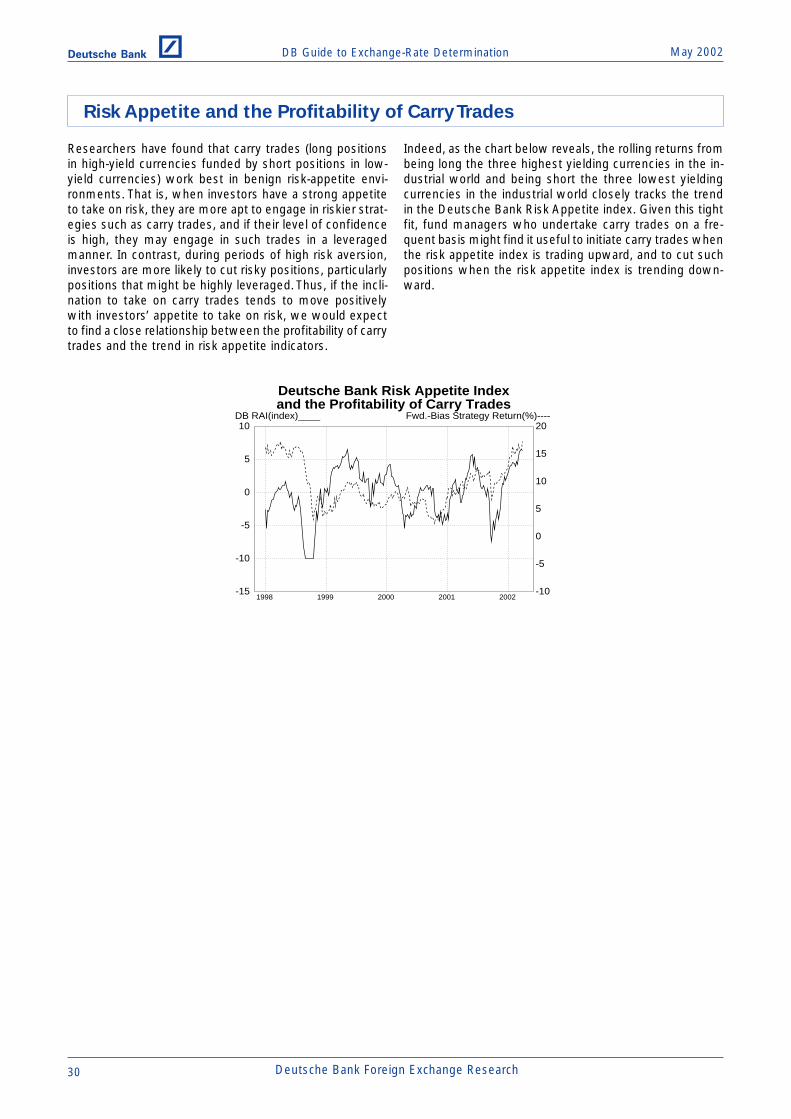
DB Guide to Exchange-Rate Determination May 2002Deutsche Bank @
30 Deutsche Bank Foreign Exchange Research
Researchers have found that carry trades (long positionsin high-yield currencies funded by short positions in low-yield currencies) work best in benign risk-appetite envi-ronments. That is, when investors have a strong appetiteto take on risk, they are more apt to engage in riskier strat-egies such as carry trades, and if their level of confidenceis high, they may engage in such trades in a leveragedmanner. In contrast, during periods of high risk aversion,investors are more likely to cut risky positions, particularlypositions that might be highly leveraged. Thus, if the incli-nation to take on carry trades tends to move positivelywith investors’ appetite to take on risk, we would expectto find a close relationship between the profitability of carrytrades and the trend in risk appetite indicators.
Indeed, as the chart below reveals, the rolling returns frombeing long the three highest yielding currencies in the in-dustrial world and being short the three lowest yieldingcurrencies in the industrial world closely tracks the trendin the Deutsche Bank Risk Appetite index. Given this tightfit, fund managers who undertake carry trades on a fre-quent basis might find it useful to initiate carry trades whenthe risk appetite index is trading upward, and to cut suchpositions when the risk appetite index is trending down-ward.
Risk Appetite and the Profitability of Carry Trades
Deutsche Bank Risk Appetite Indexand the Profitability of Carry Trades
-10
-5
0
5
10
15
20
-15
-10
-5
0
5
10
1998 1999 2000 2001 2002
Fwd.-Bias Strategy Return(%)----DB RAI(index)____
DB Guide to Exchange-Rate DeterminationMay 2002 Deutsche Bank @
Deutsche Bank Foreign Exchange Research 31
Exchange-Rate Determination in the
Long Run

DB Guide to Exchange-Rate Determination May 2002Deutsche Bank @
32 Deutsche Bank Foreign Exchange Research
In the long run, a currency’s value should gravitate towardits real long-run equilibrium value. If we were able to esti-mate which exchange-rate level represented long-run fairvalue, we would be able to identify the likely path that anexchange rate should take on a long-term basis. Unfortu-nately, there is no uniform agreement among economistson what exchange-rate level represents a currency's truelong-run equilibrium level. The purchasing power parity(PPP) approach to assessing long-run fair value probablyhas the widest following among economists and strate-gists, but it is also widely recognized that the PPP approachhas serious limitations. That is because historically, thedeviations from estimated PPP values have been both largeand persistent, which suggests that fundamental forcesother than relative national inflation rates have been play-ing an important role in driving the long-term path of ex-change rates.
The failure of PPP to hold over medium-term and, in somecases, long-term horizons has led economists to consideralternative approaches to assess long-term value in theFX markets. For instance, the IMF favors the macroeco-
nomic-balance approach to long-term exchange-rate deter-mination, in which the long-run equilibrium exchange rateis defined as the rate that would equalize a country's sav-ings-investment balance with its underlying current-accountbalance. According to this approach, if there is a shift in acountry's national savings, investment, or underlying cur-rent account, then the real long-run equilibrium exchangerate should adjust accordingly. This approach is quite simi-lar to the Fundamental Equilibrium Exchange Rate (FEER)approach pioneered by John Williamson.
More recently, economists have sought to identify the long-run equilibrium paths of currencies with econometric mod-els, relating key economic variables to long-term trends inexchange rates. These studies have found that long-termtrends in relative productivity growth, sectoral-productiv-ity differentials, persistent trends in a country’s terms oftrade, the net external investment position of a country asa percentage of its GDP, and trends in national savings andinvestment have had some success in explaining the long-term path of exchange rates.
A Stylized Model of the Long-Term Trend in a Currency’s Value
Real Exchange Rate
Time
Long-RunEquilibriumPath
Exchange-Rate Determination in the Long Run
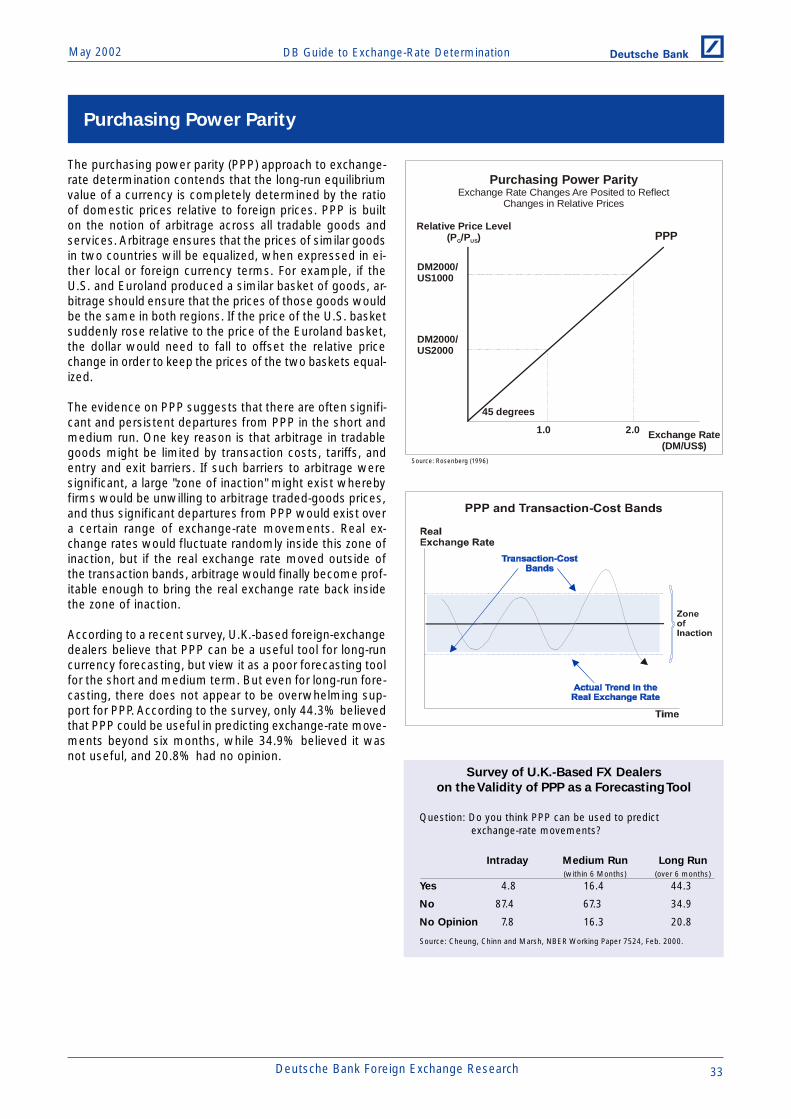
DB Guide to Exchange-Rate DeterminationMay 2002 Deutsche Bank @
Deutsche Bank Foreign Exchange Research 33
The purchasing power parity (PPP) approach to exchange-rate determination contends that the long-run equilibriumvalue of a currency is completely determined by the ratioof domestic prices relative to foreign prices. PPP is builton the notion of arbitrage across all tradable goods andservices. Arbitrage ensures that the prices of similar goodsin two countries will be equalized, when expressed in ei-ther local or foreign currency terms. For example, if theU.S. and Euroland produced a similar basket of goods, ar-bitrage should ensure that the prices of those goods wouldbe the same in both regions. If the price of the U.S. basketsuddenly rose relative to the price of the Euroland basket,the dollar would need to fall to offset the relative pricechange in order to keep the prices of the two baskets equal-ized.
The evidence on PPP suggests that there are often signifi-cant and persistent departures from PPP in the short andmedium run. One key reason is that arbitrage in tradablegoods might be limited by transaction costs, tariffs, andentry and exit barriers. If such barriers to arbitrage weresignificant, a large "zone of inaction" might exist wherebyfirms would be unwilling to arbitrage traded-goods prices,and thus significant departures from PPP would exist overa certain range of exchange-rate movements. Real ex-change rates would fluctuate randomly inside this zone ofinaction, but if the real exchange rate moved outside ofthe transaction bands, arbitrage would finally become prof-itable enough to bring the real exchange rate back insidethe zone of inaction.
According to a recent survey, U.K.-based foreign-exchangedealers believe that PPP can be a useful tool for long-runcurrency forecasting, but view it as a poor forecasting toolfor the short and medium term. But even for long-run fore-casting, there does not appear to be overwhelming sup-port for PPP. According to the survey, only 44.3% believedthat PPP could be useful in predicting exchange-rate move-ments beyond six months, while 34.9% believed it wasnot useful, and 20.8% had no opinion.
Survey of U.K.-Based FX Dealers
on the Validity of PPP as a Forecasting Tool
Question: Do you think PPP can be used to predict exchange-rate movements?
Intraday Medium Run Long Run
(within 6 Months) (over 6 months)
Yes 4.8 16.4 44.3
No 87.4 67.3 34.9
No Opinion 7.8 16.3 20.8
Source: Cheung, Chinn and Marsh, NBER Working Paper 7524, Feb. 2000.
Purchasing Power ParityExchange Rate Changes Are Posited to Reflect
Changes in Relative Prices
Relative Price Level(P /P )G US
1.0
DM2000/US2000
Exchange Rate(DM/US$)
2.0
DM2000/US1000
PPP
45 degrees
Purchasing Power Parity
Source: Rosenberg (1996)
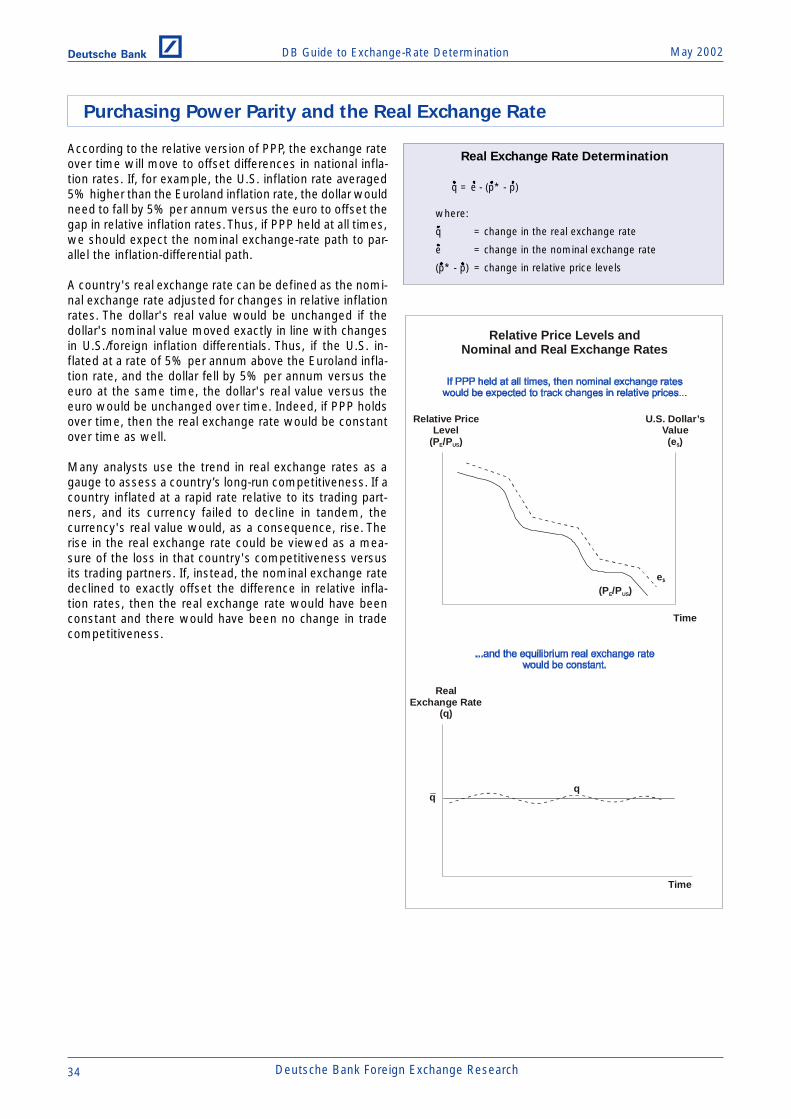
DB Guide to Exchange-Rate Determination May 2002Deutsche Bank @
34 Deutsche Bank Foreign Exchange Research
According to the relative version of PPP, the exchange rateover time will move to offset differences in national infla-tion rates. If, for example, the U.S. inflation rate averaged5% higher than the Euroland inflation rate, the dollar wouldneed to fall by 5% per annum versus the euro to offset thegap in relative inflation rates. Thus, if PPP held at all times,we should expect the nominal exchange-rate path to par-allel the inflation-differential path.
A country's real exchange rate can be defined as the nomi-nal exchange rate adjusted for changes in relative inflationrates. The dollar's real value would be unchanged if thedollar's nominal value moved exactly in line with changesin U.S./foreign inflation differentials. Thus, if the U.S. in-flated at a rate of 5% per annum above the Euroland infla-tion rate, and the dollar fell by 5% per annum versus theeuro at the same time, the dollar's real value versus theeuro would be unchanged over time. Indeed, if PPP holdsover time, then the real exchange rate would be constantover time as well.
Many analysts use the trend in real exchange rates as agauge to assess a country’s long-run competitiveness. If acountry inflated at a rapid rate relative to its trading part-ners, and its currency failed to decline in tandem, thecurrency's real value would, as a consequence, rise. Therise in the real exchange rate could be viewed as a mea-sure of the loss in that country's competitiveness versusits trading partners. If, instead, the nominal exchange ratedeclined to exactly offset the difference in relative infla-tion rates, then the real exchange rate would have beenconstant and there would have been no change in tradecompetitiveness.
Real Exchange Rate Determination
q = e - (p* - p)
where:
q = change in the real exchange rate
e = change in the nominal exchange rate
(p* - p) = change in relative price levels
Purchasing Power Parity and the Real Exchange Rate
Relative Price Levels andNominal and Real Exchange Rates
Relative Price Level
(P /P )E US
(P /P )E US
Time
e$
U.S. Dollar’sValue(e )$
Time
Real Exchange Rate
(q)

DB Guide to Exchange-Rate DeterminationMay 2002 Deutsche Bank @
Deutsche Bank Foreign Exchange Research 35
PPP misalignments occur when nominal exchange ratesfail to move in line with relative inflation rates. Considerwhat would happen if the U.S. inflation rate averaged 5%per annum faster than Euroland’s inflation rate but the U.S.dollar/euro exchange rate was fixed. By preventing a de-cline in the dollar's nominal value that would offset therelatively higher U.S. inflation rate, the dollar's real value
q$ = e$ - (pE - pUS)
would be pushed steadily higher as the gap between thefixed nominal value for the dollar, e$, and a falling inflationdifferential, (pE - pUS), steadily widened. The more the U.S.inflates relative to Euroland, with no offsetting dollar de-preciation, the less competitive the U.S. would be.
PPP misalignments can also occur if the nominal exchangerate rises or falls by large amounts relative to modestlychanging or unchanging inflation differentials. For example,if the U.S. and Euroland inflated at similar rates, but thedollar's nominal value nevertheless soared versus the euro,then the dollar's real value
q$ = e$ - (pE - pUS)
would rise as the gap between a rising dollar, e$, and anunchanged inflation differential, (pE - pUS), steadily widened.The consequences of a steadily rising real value for thedollar would be a long-run decline in U.S. competitiveness.
Real Appreciations and Exchange-Rate Misalignments
The Response of Real Exchange Ratesto Changes in Relative Prices
When Nominal Exchange Rates are Fixed
Relative Price Level
(P - /P )E - US
(p /p )E US
Time
e$
U.S Dollar’sNominal Value
(e )$
Time
Real Exchange Rate
(q )$
q$
q$
The Response of Real Exchange Ratesto Changes in Nominal Exchange RatesWhen Relative Prices Levels are Stable
Relative Price Level
(P -/P )E US
(p /p )E US
Time
e$
U.S. Dollar’sNominal Value
(e )$
Time
Real Exchange Rate
(q )$
q$
q$

DB Guide to Exchange-Rate Determination May 2002Deutsche Bank @
36 Deutsche Bank Foreign Exchange Research
Evidence for both developed and developing countriessuggests that PPP misalignments tend to build up gradu-ally over time. A key reason why this pattern tends to re-cur so often is that in the early years of an overly appreci-ated currency, firms and households find a way to adjust,and this, at least temporarily, works to temper the harsheffects of real currency appreciation on the domesticeconomy. For example, firms may try to maintain marketshare by cutting their profit margins, while households mayattempt to maintain their spending by running down theirsavings. Because of these and other adjustments, realgrowth might not show any visible signs of weakness andthe current-account balance might not deteriorate signifi-cantly in the early years of a misaligned exchange rate.
Since an overly appreciated currency is not likely to giverise initially to a deteriorating trend in domestic economicactivity or in the current-account balance, it is highly un-likely that the market will feel compelled to wage an attackon the overvalued currency in the early years of real ap-preciation. The larger a PPP misalignment grows and thelonger it lasts, however, the greater the likelihood that itwill eventually lead to a visible deterioration in economicfundamentals. Only when economic fundamentals dete-riorate beyond a certain threshold level (point A in the dia-gram below) will market participants become emboldenedto wage an attack on the misaligned currency and push itback toward its real long-run equilibrium level.
PPP Misalignments and Their Eventual Corrections
PPP
Time
% Overvalued
(0)
% Undervalued
(+)
(-)
Weighted-Average Trendin Fundamentals
Time
Real Exchange Rate
Economic Fundamentals
A
PPP Cycle of Exchange-Rate Misalignment and Correction
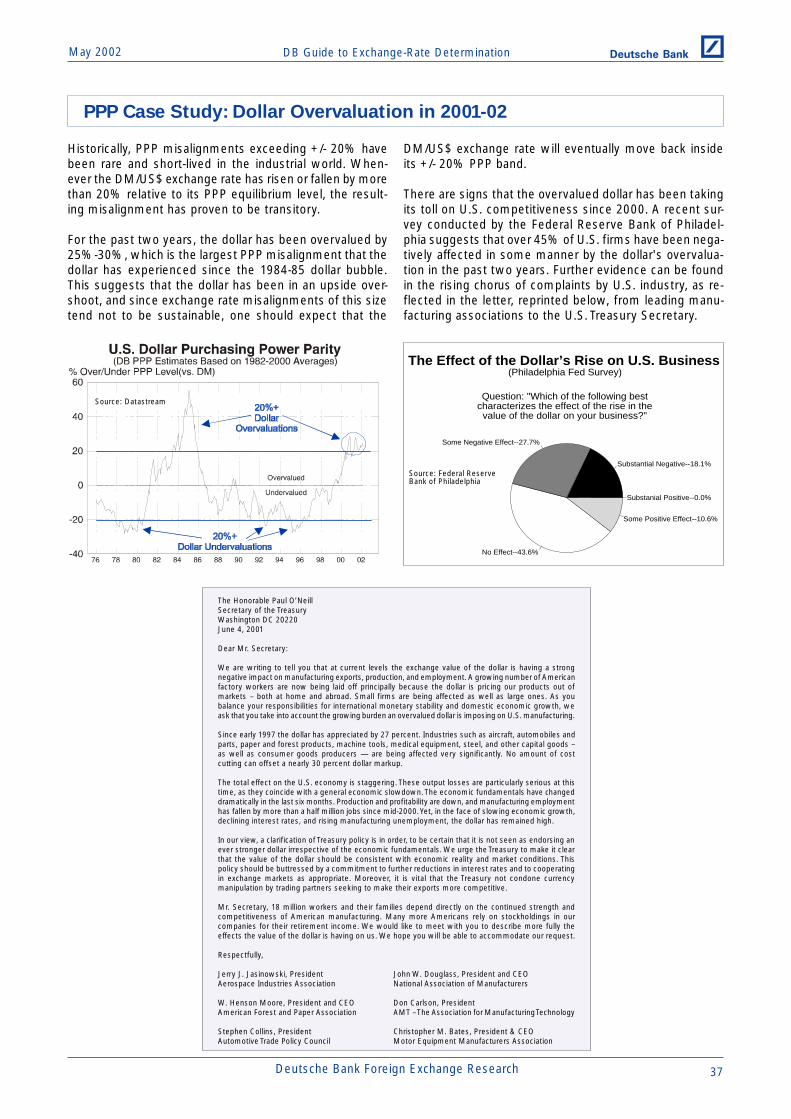
DB Guide to Exchange-Rate DeterminationMay 2002 Deutsche Bank @
Deutsche Bank Foreign Exchange Research 37
Historically, PPP misalignments exceeding +/- 20% havebeen rare and short-lived in the industrial world. When-ever the DM/US$ exchange rate has risen or fallen by morethan 20% relative to its PPP equilibrium level, the result-ing misalignment has proven to be transitory.
For the past two years, the dollar has been overvalued by25%-30%, which is the largest PPP misalignment that thedollar has experienced since the 1984-85 dollar bubble.This suggests that the dollar has been in an upside over-shoot, and since exchange rate misalignments of this sizetend not to be sustainable, one should expect that the
DM/US$ exchange rate will eventually move back insideits +/- 20% PPP band.
There are signs that the overvalued dollar has been takingits toll on U.S. competitiveness since 2000. A recent sur-vey conducted by the Federal Reserve Bank of Philadel-phia suggests that over 45% of U.S. firms have been nega-tively affected in some manner by the dollar's overvalua-tion in the past two years. Further evidence can be foundin the rising chorus of complaints by U.S. industry, as re-flected in the letter, reprinted below, from leading manu-facturing associations to the U.S. Treasury Secretary.
The Honorable Paul O’NeillSecretary of the TreasuryWashington DC 20220June 4, 2001
Dear Mr. Secretary:
We are writing to tell you that at current levels the exchange value of the dollar is having a strongnegative impact on manufacturing exports, production, and employment. A growing number of Americanfactory workers are now being laid off principally because the dollar is pricing our products out ofmarkets – both at home and abroad. Small firms are being affected as well as large ones. As youbalance your responsibilities for international monetary stability and domestic economic growth, weask that you take into account the growing burden an overvalued dollar is imposing on U.S. manufacturing.
Since early 1997 the dollar has appreciated by 27 percent. Industries such as aircraft, automobiles andparts, paper and forest products, machine tools, medical equipment, steel, and other capital goods –as well as consumer goods producers — are being affected very significantly. No amount of costcutting can offset a nearly 30 percent dollar markup.
The total effect on the U.S. economy is staggering. These output losses are particularly serious at thistime, as they coincide with a general economic slowdown. The economic fundamentals have changeddramatically in the last six months. Production and profitability are down, and manufacturing employmenthas fallen by more than a half million jobs since mid-2000. Yet, in the face of slowing economic growth,declining interest rates, and rising manufacturing unemployment, the dollar has remained high.
In our view, a clarification of Treasury policy is in order, to be certain that it is not seen as endorsing anever stronger dollar irrespective of the economic fundamentals. We urge the Treasury to make it clearthat the value of the dollar should be consistent with economic reality and market conditions. Thispolicy should be buttressed by a commitment to further reductions in interest rates and to cooperatingin exchange markets as appropriate. Moreover, it is vital that the Treasury not condone currencymanipulation by trading partners seeking to make their exports more competitive.
Mr. Secretary, 18 million workers and their families depend directly on the continued strength andcompetitiveness of American manufacturing. Many more Americans rely on stockholdings in ourcompanies for their retirement income. We would like to meet with you to describe more fully theeffects the value of the dollar is having on us. We hope you will be able to accommodate our request.
Respectfully,
Jerry J. Jasinowski, President John W. Douglass, President and CEOAerospace Industries Association National Association of Manufacturers
W. Henson Moore, President and CEO Don Carlson, PresidentAmerican Forest and Paper Association AMT – The Association for Manufacturing Technology
Stephen Collins, President Christopher M. Bates, President & CEOAutomotive Trade Policy Council Motor Equipment Manufacturers Association
The Effect of the Dollar’s Rise on U.S. Business
(Philadelphia Fed Survey)
Question: "Which of the following bestcharacterizes the effect of the rise in thevalue of the dollar on your business?"
Substantial Negative--18.1%
Some Negative Effect--27.7%
No Effect--43.6%
Some Positive Effect--10.6%
Substanial Positive--0.0%
PPP Case Study: Dollar Overvaluation in 2001-02
Source: Datastream
Source: Federal ReserveBank of Philadelphia
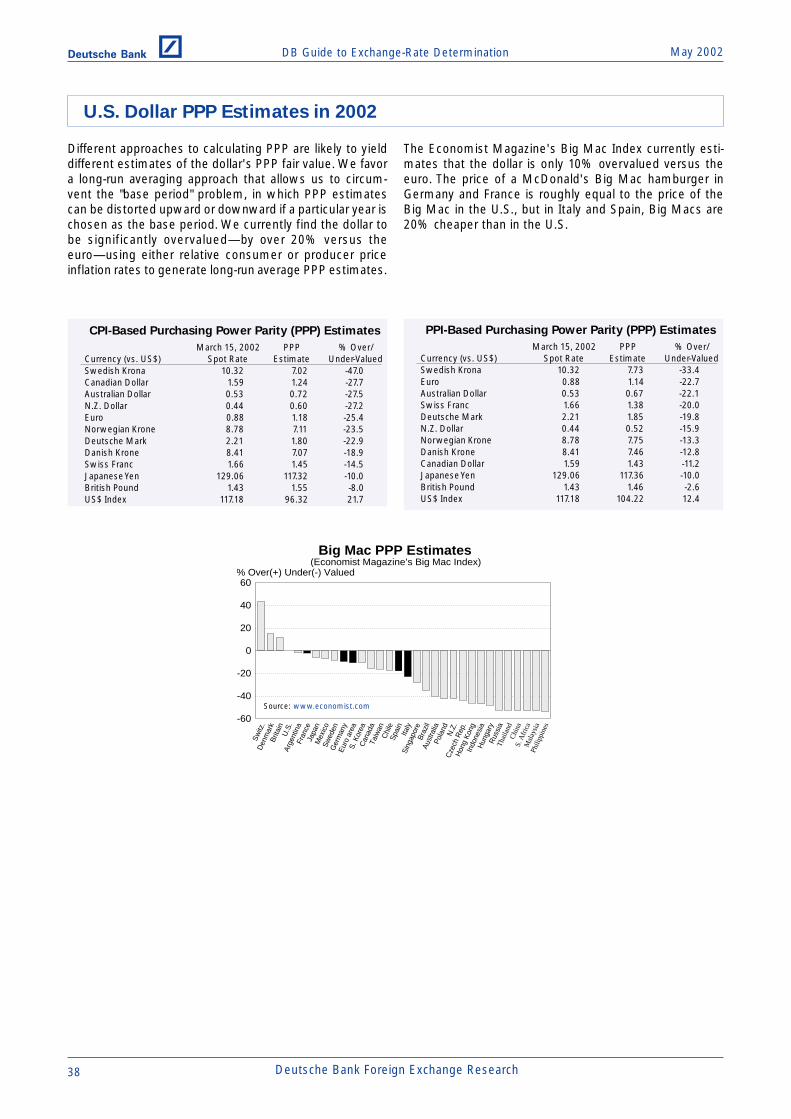
DB Guide to Exchange-Rate Determination May 2002Deutsche Bank @
38 Deutsche Bank Foreign Exchange Research
Different approaches to calculating PPP are likely to yielddifferent estimates of the dollar's PPP fair value. We favora long-run averaging approach that allows us to circum-vent the "base period" problem, in which PPP estimatescan be distorted upward or downward if a particular year ischosen as the base period. We currently find the dollar tobe significantly overvalued—by over 20% versus theeuro—using either relative consumer or producer priceinflation rates to generate long-run average PPP estimates.
The Economist Magazine's Big Mac Index currently esti-mates that the dollar is only 10% overvalued versus theeuro. The price of a McDonald's Big Mac hamburger inGermany and France is roughly equal to the price of theBig Mac in the U.S., but in Italy and Spain, Big Macs are20% cheaper than in the U.S.
March 15, 2002 PPP % Over/Currency (vs. US$) Spot Rate Estimate Under-ValuedSwedish Krona 10.32 7.02 -47.0Canadian Dollar 1.59 1.24 -27.7Australian Dollar 0.53 0.72 -27.5N.Z. Dollar 0.44 0.60 -27.2Euro 0.88 1.18 -25.4Norwegian Krone 8.78 7.11 -23.5Deutsche Mark 2.21 1.80 -22.9Danish Krone 8.41 7.07 -18.9Swiss Franc 1.66 1.45 -14.5Japanese Yen 129.06 117.32 -10.0British Pound 1.43 1.55 -8.0US$ Index 117.18 96.32 21.7
CPI-Based Purchasing Power Parity (PPP) Estimates
March 15, 2002 PPP % Over/Currency (vs. US$) Spot Rate Estimate Under-ValuedSwedish Krona 10.32 7.73 -33.4Euro 0.88 1.14 -22.7Australian Dollar 0.53 0.67 -22.1Swiss Franc 1.66 1.38 -20.0Deutsche Mark 2.21 1.85 -19.8N.Z. Dollar 0.44 0.52 -15.9Norwegian Krone 8.78 7.75 -13.3Danish Krone 8.41 7.46 -12.8Canadian Dollar 1.59 1.43 -11.2Japanese Yen 129.06 117.36 -10.0British Pound 1.43 1.46 -2.6US$ Index 117.18 104.22 12.4
PPI-Based Purchasing Power Parity (PPP) Estimates
Big Mac PPP Estimates(Economist Magazine’s Big Mac Index)
-60
-40
-20
0
20
40
60
Sw
itz.
Den
mar
kB
ritai
nU
.S.
Arg
entin
aFr
ance
Japa
nM
exic
oS
wed
enG
erm
any
Eur
o ar
eaS
. Kor
eaC
anad
aTa
iwan
Chi
leS
pain
Italy
Sin
gapo
reB
razi
lA
ustra
liaP
olan
dN
.Z.
Cze
ch R
ep.
Hon
g K
ong
Indo
nesi
aH
unga
ryR
ussi
aTh
aila
ndC
hina
S. A
frica
Mal
aysi
aP
hilip
pine
s
% Over(+) Under(-) Valued
U.S. Dollar PPP Estimates in 2002
Source: www.economist.com
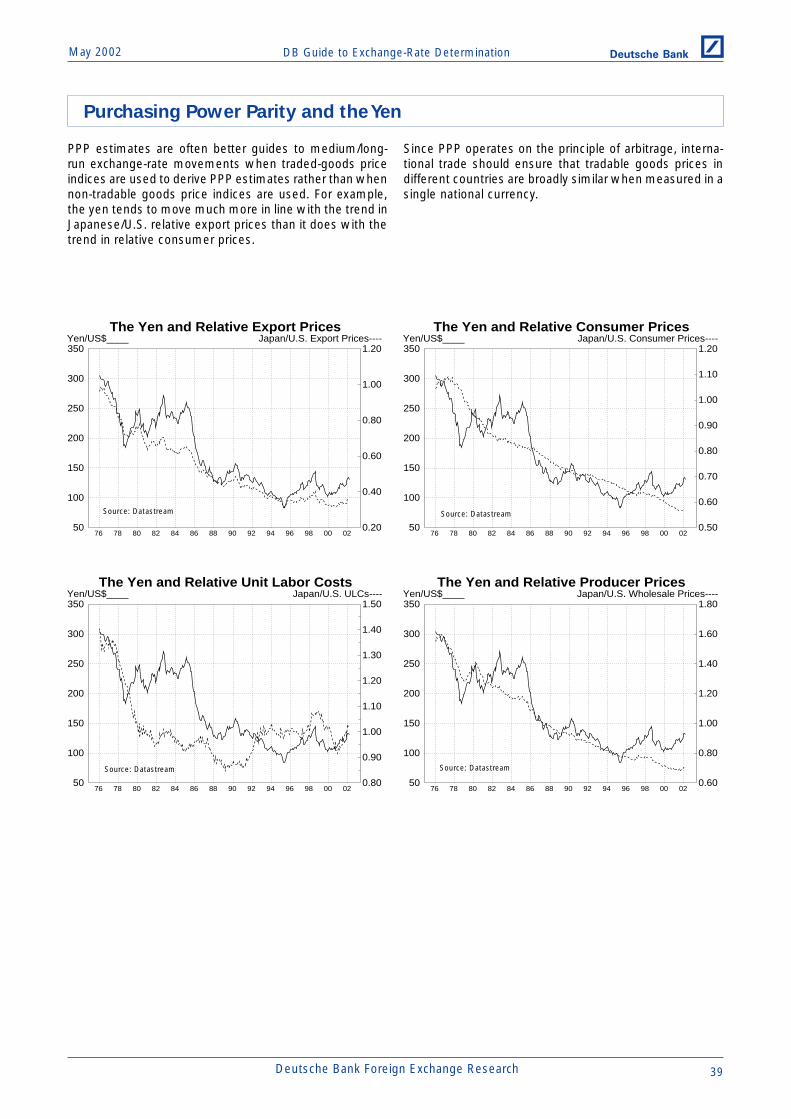
DB Guide to Exchange-Rate DeterminationMay 2002 Deutsche Bank @
Deutsche Bank Foreign Exchange Research 39
PPP estimates are often better guides to medium/long-run exchange-rate movements when traded-goods priceindices are used to derive PPP estimates rather than whennon-tradable goods price indices are used. For example,the yen tends to move much more in line with the trend inJapanese/U.S. relative export prices than it does with thetrend in relative consumer prices.
Since PPP operates on the principle of arbitrage, interna-tional trade should ensure that tradable goods prices indifferent countries are broadly similar when measured in asingle national currency.
The Yen and Relative Unit Labor Costs
0.80
0.90
1.00
1.10
1.20
1.30
1.40
1.50
50
100
150
200
250
300
350
76 78 80 82 84 86 88 90 92 94 96 98 00 02
Japan/U.S. ULCs----Yen/US$____The Yen and Relative Producer Prices
0.60
0.80
1.00
1.20
1.40
1.60
1.80
50
100
150
200
250
300
350
76 78 80 82 84 86 88 90 92 94 96 98 00 02
Japan/U.S. Wholesale Prices----Yen/US$____
The Yen and Relative Consumer Prices
0.50
0.60
0.70
0.80
0.90
1.00
1.10
1.20
50
100
150
200
250
300
350
76 78 80 82 84 86 88 90 92 94 96 98 00 02
Japan/U.S. Consumer Prices----Yen/US$____The Yen and Relative Export Prices
0.20
0.40
0.60
0.80
1.00
1.20
50
100
150
200
250
300
350
76 78 80 82 84 86 88 90 92 94 96 98 00 02
Japan/U.S. Export Prices----Yen/US$____
Purchasing Power Parity and the Yen
Source: Datastream Source: Datastream
Source: Datastream Source: Datastream
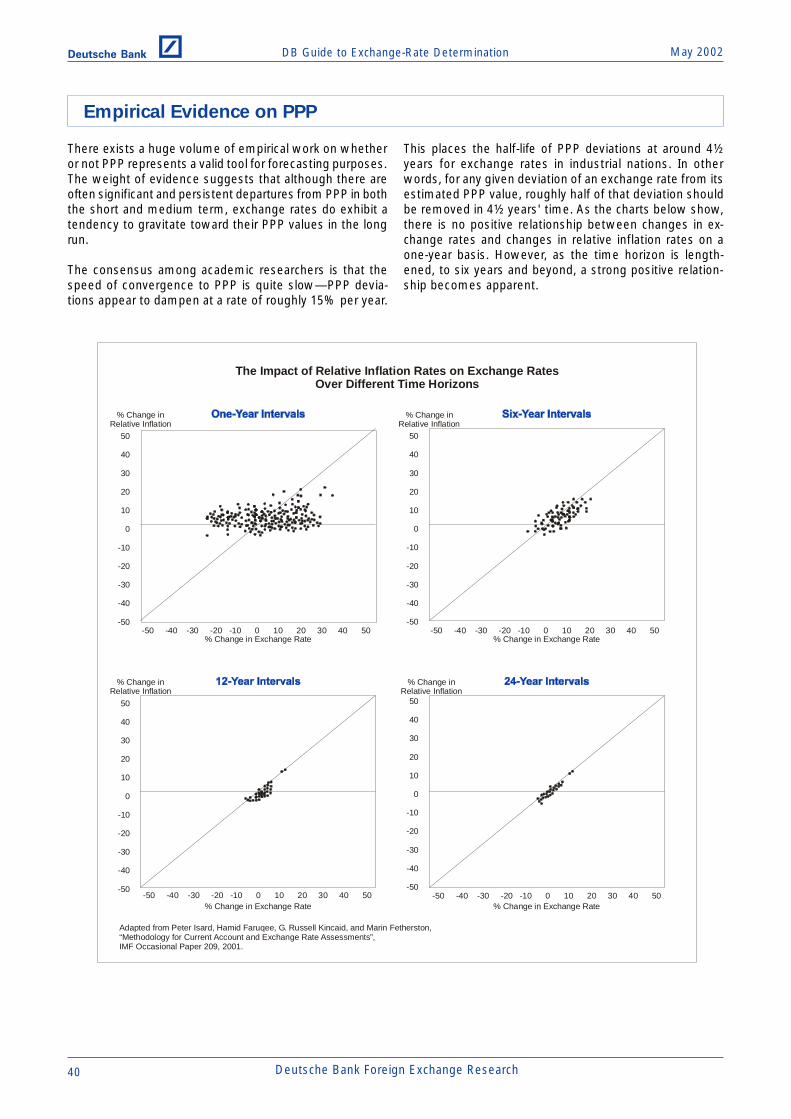
DB Guide to Exchange-Rate Determination May 2002Deutsche Bank @
40 Deutsche Bank Foreign Exchange Research
There exists a huge volume of empirical work on whetheror not PPP represents a valid tool for forecasting purposes.The weight of evidence suggests that although there areoften significant and persistent departures from PPP in boththe short and medium term, exchange rates do exhibit atendency to gravitate toward their PPP values in the longrun.
The consensus among academic researchers is that thespeed of convergence to PPP is quite slow—PPP devia-tions appear to dampen at a rate of roughly 15% per year.
Empirical Evidence on PPP
This places the half-life of PPP deviations at around 4½years for exchange rates in industrial nations. In otherwords, for any given deviation of an exchange rate from itsestimated PPP value, roughly half of that deviation shouldbe removed in 4½ years' time. As the charts below show,there is no positive relationship between changes in ex-change rates and changes in relative inflation rates on aone-year basis. However, as the time horizon is length-ened, to six years and beyond, a strong positive relation-ship becomes apparent.
The Impact of Relative Inflation Rates on Exchange RatesOver Different Time Horizons
Adapted from Peter Isard, Hamid Faruqee, G. Russell Kincaid, and Marin Fetherston, “Methodology for Current Account and Exchange Rate Assessments”,IMF Occasional Paper 209, 2001.
50
40
30
20
10
0
-10
-20
-30
-40
-50-50 -40 -30 -20 -10 0 10 20 30 40 50
50
40
30
20
10
0
-10
-20
-30
-40
-50-50 -40 -30 -20 -10 0 10 20 30 40 50
50
40
30
20
10
0
-10
-20
-30
-40
-50-50 -40 -30 -20 -10 0 10 20 30 40 50
50
40
30
20
10
0
-10
-20
-30
-40
-50-50 -40 -30 -20 -10 0 10 20 30 40 50
% Change in Exchange Rate % Change in Exchange Rate
% Change in Exchange Rate % Change in Exchange Rate
% Change in Relative Inflation
% Change in Relative Inflation
% Change in Relative Inflation
% Change in Relative Inflation

DB Guide to Exchange-Rate DeterminationMay 2002 Deutsche Bank @
Deutsche Bank Foreign Exchange Research 41
PPP and Investment Strategy
Source: Datastream, Bloomberg
Source: Datastream, Bloomberg
Since many empirical studies find that exchange rates ex-hibit a tendency to gravitate toward their PPP levels in thelong run, long-term investors and issuers would stand tobenefit by positioning themselves for an eventual correc-tion of a large PPP misalignment. If investors could counton a rapid return to PPP, they could purchase undervaluedcurrencies in the hope that the undervaluation would soonbe corrected via an appreciation of the currency. Similarly,they would look to sell overvalued currencies.
For instance, the euro's gross PPP undervaluations ver-sus both the dollar and the yen do not appear to be sus-tainable, given the long-run track record of these twocrossrates. Yet long-dated euro/dollar and euro/yen forwardexchange rates are not anticipating a significant correctionin the euro’s PPP misalignment over the next five years.With conventional PPP analysis arguing for a long-term ap-preciation of the euro versus both the dollar and the yen,this would seem to present an opportunity for investorsand issuers to exploit the divergent trends in PPP and long-dated forward rates.
Because the deviations from PPP can be large and persis-tent over short and medium-term horizons, it can be dan-gerous to pursue strategies that are based solely on anexpected rapid return of exchange rates to their estimatedPPP values. The major risk to such strategies is that thedeviations from PPP may widen further instead of narrow-ing. Investors who embrace a PPP approach to investmentstrategy would have to have substantial risk capital on handto absorb losses that could be incurred if the departuresfrom PPP proved to be sizable and persistent.
One way to manage FX risk using a PPP approach to in-vestment strategy would be to gradually take on long po-sitions in undervalued currencies (or short positions in over-valued currencies) as misalignments build. Modest posi-tions would be undertaken when the misalignments weresmall, and if the deviations from PPP grow and persist,more aggressive positions could then be undertaken.

DB Guide to Exchange-Rate Determination May 2002Deutsche Bank @
42 Deutsche Bank Foreign Exchange Research
According to the macroeconomic-balance approach to long-run exchange-rate determination, a currency's real long-run equilibrium value is defined as that rate that equalizesa country's savings-investment balance with its underly-ing current-account balance. The IMF uses the macroeco-nomic-balance approach to derive quantitative estimatesof long-run fair value for all industrial-country currencies.The IMF's approach is a three-step procedure.
1. The IMF estimates a trade-equation model to calcu-late a country's underlying current-account position.
2. The IMF then estimates a national income model todetermine the normal or sustainable savings-invest-ment imbalance that would prevail over the mediumrun if that country were operating at its full-employ-ment potential.
3. Finally, the IMF estimates the equilibrium exchangerate that would equate the underlying current-accountimbalance with the sustainable savings-investmentgap.
A country's underlying current-account balance tends tomove inversely with the real exchange rate. That is, acountry's current account would tend to improve as thecurrency's real value moved lower and its tradable goodsbecame more competitive. Hence, the underlying current-account balance, CAB, is shown to be negatively relatedto the real exchange rate in the top diagram.
A country's savings-investment gap typically moves posi-tively with the real exchange rate. Although the overall levelof national savings does not typically respond to changesin the exchange rate, investment spending tends to moveinversely with changes in the real exchange rate. This isbecause a rising real exchange rate lowers profitability,which in turn discourages investment spending. Thus, asthe real exchange rate rises, investment spending shouldfall, and the gap between savings and investment shouldtherefore rise. Hence, the savings-investment, S-I, gap isshown in the middle diagram to move positively with thereal exchange rate.
A currency's real long-run equilibrium value is determinedat the point where a country's savings-investment imbal-ance just matches its underlying current-account imbal-ance. The equilibrium exchange rate is shown to be q0 inthe bottom diagram where the S-I and CAB schedules in-tersect at point E.
The Macroeconomic-Balance Approach
to Long-Run Exchange-Rate Determination
The Underlying Current-Account Balanceand the Real Exchange Rate
Current Account Balance
Real Exchange Rate
(-) (0) (+)
q1
CAB
The Savings-Investment Scheduleand the Real Exchange Rate
Savings-Investment
Real Exchange Rate
(-) (0) (+)
S-I
q2
The Equilibrium Real Exchange Rate Is Determined When the Current-Account Gap
Equals the Savings-Investment Gap
Current-Account Balance,Savings-Investment
Real Exchange Rate
(-) (0) (+)
q1
S-I
q0
q2
CAB
E

DB Guide to Exchange-Rate DeterminationMay 2002 Deutsche Bank @
Deutsche Bank Foreign Exchange Research 43
If a currency's real long-run equilibrium value is determinedby the interaction of savings, investment, and external-balance considerations, its value would be constant overtime only if there were no structural changes on the sav-ings, investment, or external-balance fronts over the rel-evant time period. (This is illustrated in the top diagram.)
When structural changes on those three fronts occur, how-ever, the real long-run equilibrium exchange rate will ei-ther rise or fall in response to those changes. A structuralrise in investment, a sustained move toward fiscal stimu-lus, or a persistent decline in private savings should giverise to a trend increase in the real long-run equilibrium ex-change rate over time, as shown in the bottom diagram.The opposite would give rise to a trend decline in the reallong-run equilibrium exchange rate.
Equilibrium Exchange Rate—Constant or Variable?
Investment-SpendingSchedule Stable Over Time
Savings minus Investment,Current-Account Surplus
Equilibrium Real Exchange Rate (q)
$
CAB1
q1
(0)
S-I1
Current-Account Deficit
StructuralShifts in InvestmentSpending
%
Savings minus Investment,Current-Account Surplus
Equilibrium Real Exchange Rate (q)
S-I2
$
CAB1
q2
q1
(0)
S-I1
Current-Account Deficit
S-I3
S-I4
q3
q4
(
'
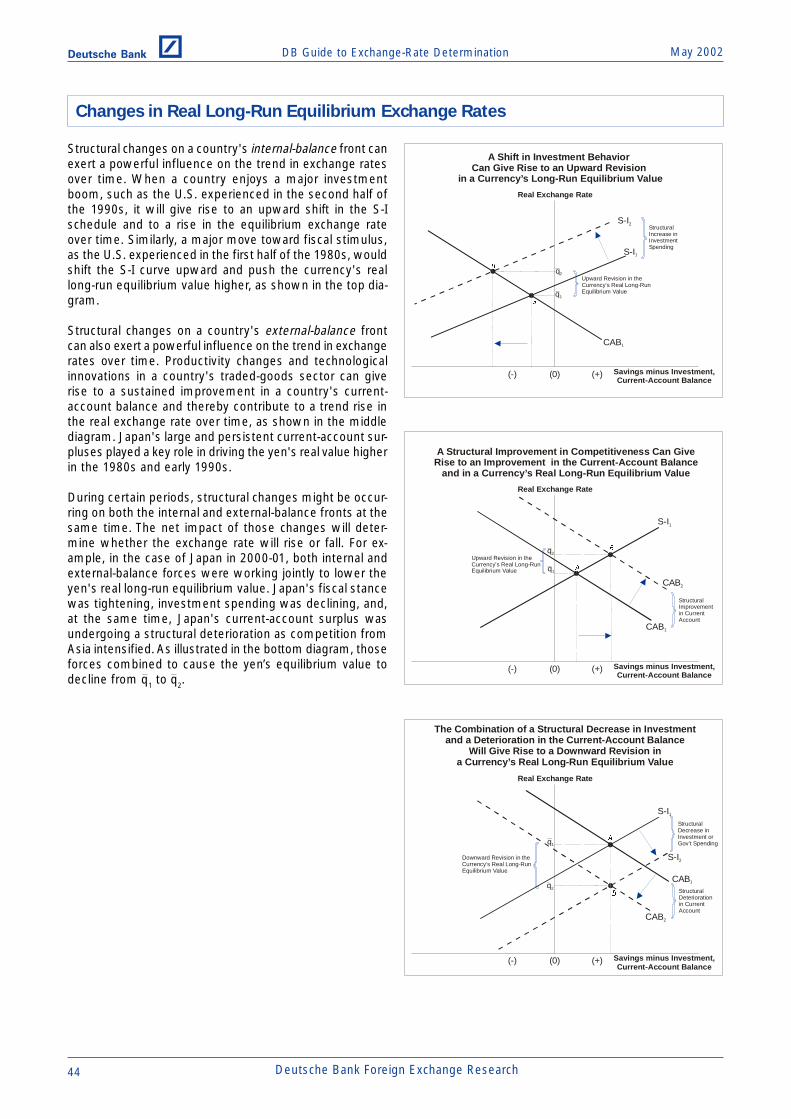
DB Guide to Exchange-Rate Determination May 2002Deutsche Bank @
44 Deutsche Bank Foreign Exchange Research
Structural changes on a country's internal-balance front canexert a powerful influence on the trend in exchange ratesover time. When a country enjoys a major investmentboom, such as the U.S. experienced in the second half ofthe 1990s, it will give rise to an upward shift in the S-Ischedule and to a rise in the equilibrium exchange rateover time. Similarly, a major move toward fiscal stimulus,as the U.S. experienced in the first half of the 1980s, wouldshift the S-I curve upward and push the currency's reallong-run equilibrium value higher, as shown in the top dia-gram.
Structural changes on a country's external-balance frontcan also exert a powerful influence on the trend in exchangerates over time. Productivity changes and technologicalinnovations in a country's traded-goods sector can giverise to a sustained improvement in a country's current-account balance and thereby contribute to a trend rise inthe real exchange rate over time, as shown in the middlediagram. Japan's large and persistent current-account sur-pluses played a key role in driving the yen's real value higherin the 1980s and early 1990s.
During certain periods, structural changes might be occur-ring on both the internal and external-balance fronts at thesame time. The net impact of those changes will deter-mine whether the exchange rate will rise or fall. For ex-ample, in the case of Japan in 2000-01, both internal andexternal-balance forces were working jointly to lower theyen's real long-run equilibrium value. Japan's fiscal stancewas tightening, investment spending was declining, and,at the same time, Japan's current-account surplus wasundergoing a structural deterioration as competition fromAsia intensified. As illustrated in the bottom diagram, thoseforces combined to cause the yen’s equilibrium value todecline from q1 to q2.
A Shift in Investment BehaviorCan Give Rise to an Upward Revision
in a Currency’s Long-Run Equilibrium Value
%
Savings minus Investment,Current-Account Balance
Real Exchange Rate
StructuralIncrease inInvestmentSpending
S-I2
$
CAB1
Upward Revision in theCurrency’s Real Long-RunEquilibrium Value
q2
q1
(0)(-) (+)
S-I1
A Structural Improvement in Competitiveness Can Give Rise to an Improvement in the Current-Account Balance
and in a Currency’s Real Long-Run Equilibrium Value
%
Savings minus Investment,Current-Account Balance
Real Exchange Rate
Structural Improvementin CurrentAccount
$
CAB1
Upward Revision in theCurrency’s Real Long-RunEquilibrium Value
q2
q1
(0)(-) (+)
S-I1
CAB2
The Combination of a Structural Decrease in Investment and a Deterioration in the Current-Account Balance
Will Give Rise to a Downward Revision in a Currency’s Real Long-Run Equilibrium Value
%
Savings minus Investment,Current-Account Balance
Real Exchange Rate
Structural Deteriorationin CurrentAccount
$
CAB1
Downward Revision in theCurrency’s Real Long-RunEquilibrium Value
q2
q1
(0)(-) (+)
S-I1
CAB2
StructuralDecrease inInvestment orGov’t Spending
S-I2
Changes in Real Long-Run Equilibrium Exchange Rates

DB Guide to Exchange-Rate DeterminationMay 2002 Deutsche Bank @
Deutsche Bank Foreign Exchange Research 45
The problem for currency forecasters and investment strat-egists is how to precisely quantify what exchange rate leveltruly represents a currency's real long-run equilibrium level.Estimates of the equilibrium exchange rate are often sen-sitive to the assumptions that a macro-econometric mod-eler might make. Indeed, it is quite possible that a widerange of equilibrium exchange-rate estimates are plausible,with each estimate dependent on the underlying assump-tions made.
Estimates of the dollar's equilibrium value by the Institutefor International Economics show the dollar to be signifi-cantly overvalued versus the yen and euro by 25%-30%.A recent report by the OECD surveyed a broad range ofeconometric studies that constructed estimates for theeuro's long-run equilibrium value. Although the estimatesvary widely, they tend to center around the US$/€ 1.10-1.20 range, suggesting that the euro is significantly under-valued versus the U.S. dollar.
Selected Estimates of the Euro's
Medium/Long-Run "Equilibrium" ValueEquilibrium
Key Explanatory Exchange Rate
Study Variables/Model Estimate
(US$/€)
Wren-Lewis & Driver (1998) FEER Model 1.19-1.45
Borowski and Couharde (2000) FEER Model 1.23-1.31
Alberola et al. (1999) Ratio of Nontraded/Traded Goods Prices, 1.26Net Foreign Assets
Chinn and Alquist (2000) M1, GDP, Short-Term Interest Rates, CPI, 1.19-1.28Ratio of Nontraded/Traded Goods Prices
Lorenzen and Thygessen (2000) Net Foreign Assets, R&D Spending, 1.17-1.24Demographics,Ratio of Nontraded/Traded Goods Prices
Duval (2001) Consumption, Multi-Factor Productivity, 1.15Real Long-Term Yield Spread,Ratio of Nontraded/Traded Goods Prices
Clostermann and Schnatz (2000) Real Long-Term Yield Spread, Oil Price, 1.13Government Spending,Ratio of Nontraded/Traded Goods Prices
Teiletche (2000) Productivity, Government Spending, 1.09Real Long-Term Yield Spread, M1,Industrial Production
OECD GDP PPP 1.09
Gern et al. Short-Term Real Interest-Rate Differential 1.03
Schulmeister PPP for Tradeables 0.87
Deutsche Bank PPP (Long-Run Average) 1.20
Source: OECD Working Paper Number 298, June 2001 (for other than Deutsche Bank).
Equilibrium Exchange Rate Estimates
Fundamental Equilibrium Exchange Rate Estimates(Estimates of U.S. Dollar FEERs for 2000)
Euro Japanese Yen
Range 1.135-1.387 77.3-94.5
Midpoint 1.26 86.0
Source: Simon Wren-Lewis and Rebecca Driver,Exchange Rates for the Year 2000, Institute for International Economics, 1998.

DB Guide to Exchange-Rate Determination May 2002Deutsche Bank @
46 Deutsche Bank Foreign Exchange Research
Many economists cite the rise in U.S. productivity growthrelative to productivity growth overseas beginning in thesecond half of the 1990s as one of the key variables thatdrove the dollar sharply higher versus most major curren-cies. Clearly, the gains in productivity were a uniquely U.S.phenomenon. A recent Federal Reserve Board Study foundthat multifactor productivity growth in the U.S. surged inthe second half of the 1990s, while it decelerated in Japanand was broadly unchanged in Euroland.
Fed Chairman Alan Greenspan has been a strong advo-cate of the thesis that the dollar’s seven-year uptrend wasproductivity-related. According to Mr. Greenspan, "The evi-dent strengthened demand for the dollar, relative to theeuro, has reflected a market expectation that productivitygrowth in the United States is likely to be greater than incontinental Europe in the years ahead."
The importance of relative productivity growth as a keydeterminant of the dollar's value versus the euro can begleaned from the accompanying charts. U.S. and Eurolandlabor productivity growth did not differ by much in the 1980sand early 1990s. But beginning in 1995, U.S. productivitygrowth surged relative to the trend in Euroland. Indeed,the trend in long-term Euroland/U.S. relative productivitygrowth appears to explain a large portion of the 1995-2000slide in the euro's value versus the U.S. dollar.
U.S. and Euroland Productivity(Derived from OECD Calculations of
Unit Labor Costs and Compensation Growth Rates)
0
500
1000
1500
2000
2500
3000
1983 1985 1987 1989 1991 1993 1995 1997 1999 2001
Euroland----(Index) U.S.____
Source: OECD Economic Outlook
Productivity Growth Rates(Percentage Changes in Multifactor Productivity)
1990-95 1996-99
(%) (%)
U.S. 0.79 1.47
Canada 0.26 0.27France 0.89 1.12Germany 1.02 1.07
Italy 1.32 -0.14Japan 1.31 0.85
U.K. 1.21 0.95Australia 1.15 2.11Denmark 2.37 0.31Norway 2.48 1.13Switzerland -0.57 0.84
Source: Gust, C. and Marquez, J., “Productivity Developments Abroad”,Federal Reserve Bulletin, October 2000.
U.S./Euroland Productivity Ratioand the U.S. Dollar/Euro Exchange Rate
0.90
1.00
1.10
1.20
1.30
1.40
0.6
0.7
0.8
0.9
1.0
1.1
1.2
87 88 89 90 91 92 93 94 95 96 97 98 99 00
US$/Euro----Euroland/US Productivity(ratio)____
Source: OECD Economic Outlook
Productivity Trends and Exchange Rates
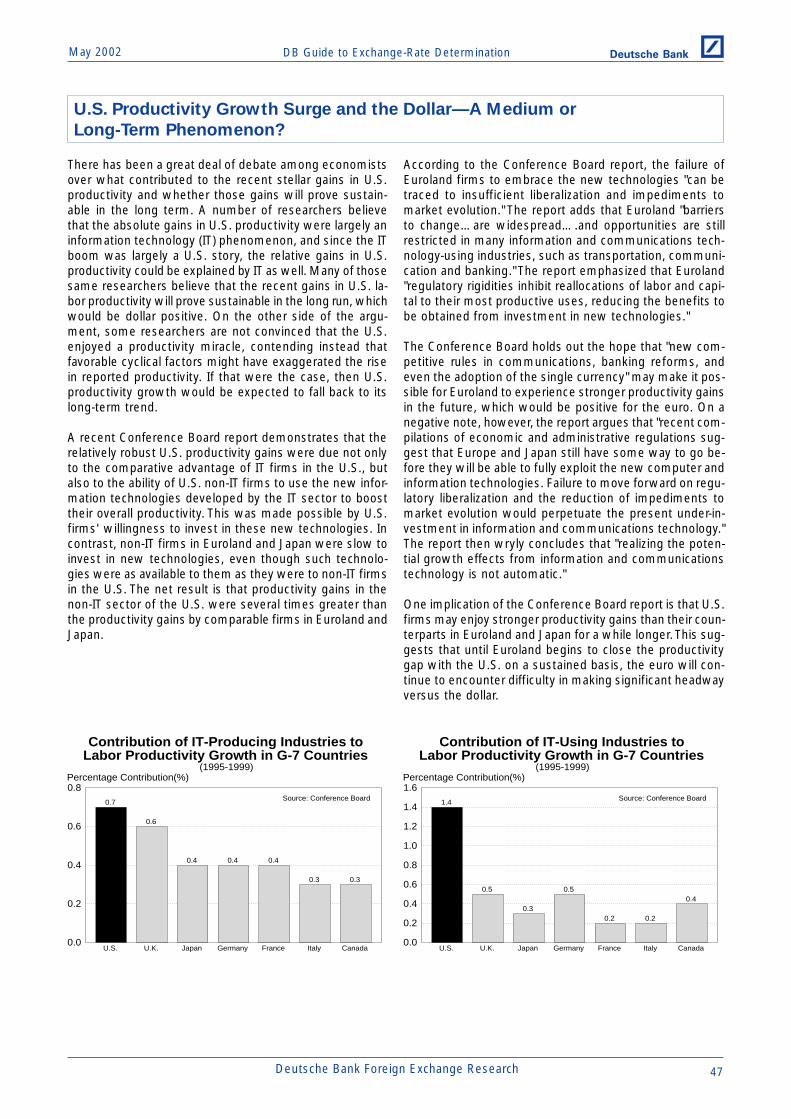
DB Guide to Exchange-Rate DeterminationMay 2002 Deutsche Bank @
Deutsche Bank Foreign Exchange Research 47
There has been a great deal of debate among economistsover what contributed to the recent stellar gains in U.S.productivity and whether those gains will prove sustain-able in the long term. A number of researchers believethat the absolute gains in U.S. productivity were largely aninformation technology (IT) phenomenon, and since the ITboom was largely a U.S. story, the relative gains in U.S.productivity could be explained by IT as well. Many of thosesame researchers believe that the recent gains in U.S. la-bor productivity will prove sustainable in the long run, whichwould be dollar positive. On the other side of the argu-ment, some researchers are not convinced that the U.S.enjoyed a productivity miracle, contending instead thatfavorable cyclical factors might have exaggerated the risein reported productivity. If that were the case, then U.S.productivity growth would be expected to fall back to itslong-term trend.
A recent Conference Board report demonstrates that therelatively robust U.S. productivity gains were due not onlyto the comparative advantage of IT firms in the U.S., butalso to the ability of U.S. non-IT firms to use the new infor-mation technologies developed by the IT sector to boosttheir overall productivity. This was made possible by U.S.firms' willingness to invest in these new technologies. Incontrast, non-IT firms in Euroland and Japan were slow toinvest in new technologies, even though such technolo-gies were as available to them as they were to non-IT firmsin the U.S. The net result is that productivity gains in thenon-IT sector of the U.S. were several times greater thanthe productivity gains by comparable firms in Euroland andJapan.
According to the Conference Board report, the failure ofEuroland firms to embrace the new technologies "can betraced to insufficient liberalization and impediments tomarket evolution." The report adds that Euroland "barriersto change…are widespread….and opportunities are stillrestricted in many information and communications tech-nology-using industries, such as transportation, communi-cation and banking." The report emphasized that Euroland"regulatory rigidities inhibit reallocations of labor and capi-tal to their most productive uses, reducing the benefits tobe obtained from investment in new technologies."
The Conference Board holds out the hope that "new com-petitive rules in communications, banking reforms, andeven the adoption of the single currency" may make it pos-sible for Euroland to experience stronger productivity gainsin the future, which would be positive for the euro. On anegative note, however, the report argues that "recent com-pilations of economic and administrative regulations sug-gest that Europe and Japan still have some way to go be-fore they will be able to fully exploit the new computer andinformation technologies. Failure to move forward on regu-latory liberalization and the reduction of impediments tomarket evolution would perpetuate the present under-in-vestment in information and communications technology."The report then wryly concludes that "realizing the poten-tial growth effects from information and communicationstechnology is not automatic."
One implication of the Conference Board report is that U.S.firms may enjoy stronger productivity gains than their coun-terparts in Euroland and Japan for a while longer. This sug-gests that until Euroland begins to close the productivitygap with the U.S. on a sustained basis, the euro will con-tinue to encounter difficulty in making significant headwayversus the dollar.
Contribution of IT-Producing Industries toLabor Productivity Growth in G-7 Countries
(1995-1999)
0.30.3
0.40.40.4
0.6
0.7
0.0
0.2
0.4
0.6
0.8
U.S. U.K. Japan Germany France Italy Canada
Percentage Contribution(%)
Source: Conference Board
Contribution of IT-Using Industries toLabor Productivity Growth in G-7 Countries
(1995-1999)
0.4
0.20.2
0.5
0.3
0.5
1.4
0.0
0.2
0.4
0.6
0.8
1.0
1.2
1.4
1.6
U.S. U.K. Japan Germany France Italy Canada
Percentage Contribution(%)
Source: Conference Board
U.S. Productivity Growth Surge and the Dollar—A Medium or
Long-Term Phenomenon?
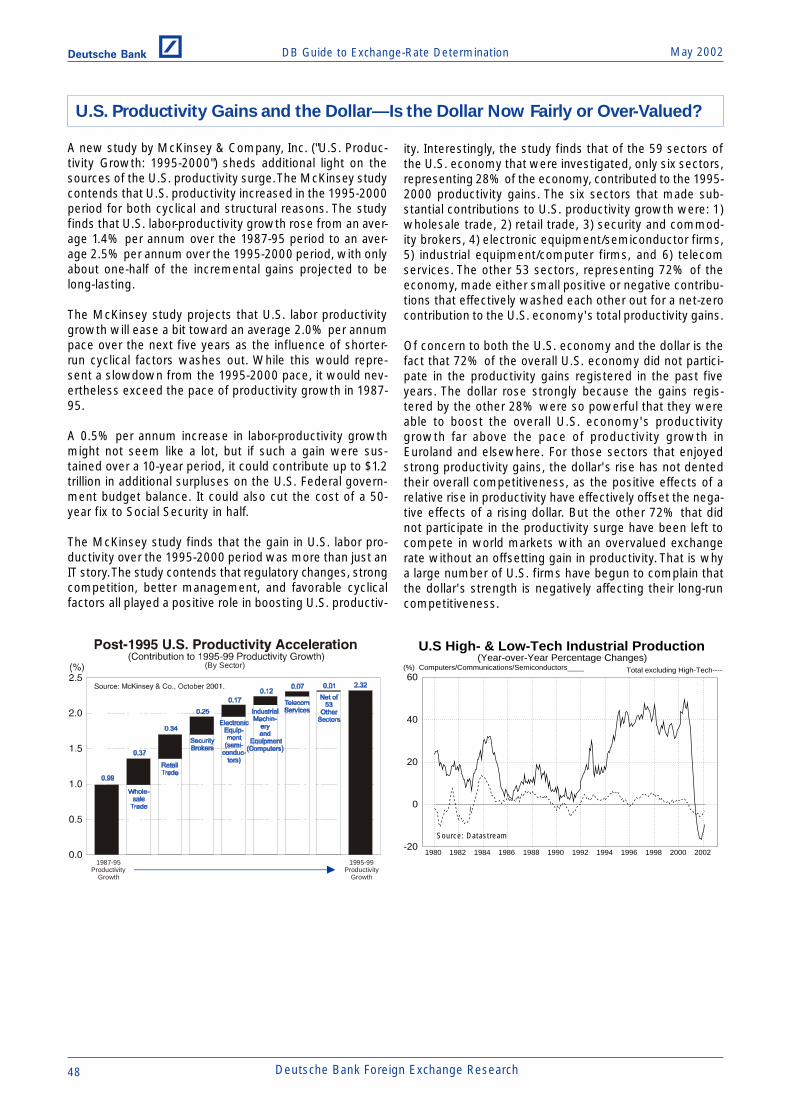
DB Guide to Exchange-Rate Determination May 2002Deutsche Bank @
48 Deutsche Bank Foreign Exchange Research
A new study by McKinsey & Company, Inc. ("U.S. Produc-tivity Growth: 1995-2000") sheds additional light on thesources of the U.S. productivity surge. The McKinsey studycontends that U.S. productivity increased in the 1995-2000period for both cyclical and structural reasons. The studyfinds that U.S. labor-productivity growth rose from an aver-age 1.4% per annum over the 1987-95 period to an aver-age 2.5% per annum over the 1995-2000 period, with onlyabout one-half of the incremental gains projected to belong-lasting.
The McKinsey study projects that U.S. labor productivitygrowth will ease a bit toward an average 2.0% per annumpace over the next five years as the influence of shorter-run cyclical factors washes out. While this would repre-sent a slowdown from the 1995-2000 pace, it would nev-ertheless exceed the pace of productivity growth in 1987-95.
A 0.5% per annum increase in labor-productivity growthmight not seem like a lot, but if such a gain were sus-tained over a 10-year period, it could contribute up to $1.2trillion in additional surpluses on the U.S. Federal govern-ment budget balance. It could also cut the cost of a 50-year fix to Social Security in half.
The McKinsey study finds that the gain in U.S. labor pro-ductivity over the 1995-2000 period was more than just anIT story. The study contends that regulatory changes, strongcompetition, better management, and favorable cyclicalfactors all played a positive role in boosting U.S. productiv-
ity. Interestingly, the study finds that of the 59 sectors ofthe U.S. economy that were investigated, only six sectors,representing 28% of the economy, contributed to the 1995-2000 productivity gains. The six sectors that made sub-stantial contributions to U.S. productivity growth were: 1)wholesale trade, 2) retail trade, 3) security and commod-ity brokers, 4) electronic equipment/semiconductor firms,5) industrial equipment/computer firms, and 6) telecomservices. The other 53 sectors, representing 72% of theeconomy, made either small positive or negative contribu-tions that effectively washed each other out for a net-zerocontribution to the U.S. economy's total productivity gains.
Of concern to both the U.S. economy and the dollar is thefact that 72% of the overall U.S. economy did not partici-pate in the productivity gains registered in the past fiveyears. The dollar rose strongly because the gains regis-tered by the other 28% were so powerful that they wereable to boost the overall U.S. economy's productivitygrowth far above the pace of productivity growth inEuroland and elsewhere. For those sectors that enjoyedstrong productivity gains, the dollar's rise has not dentedtheir overall competitiveness, as the positive effects of arelative rise in productivity have effectively offset the nega-tive effects of a rising dollar. But the other 72% that didnot participate in the productivity surge have been left tocompete in world markets with an overvalued exchangerate without an offsetting gain in productivity. That is whya large number of U.S. firms have begun to complain thatthe dollar's strength is negatively affecting their long-runcompetitiveness.
1987-95Productivity
Growth
1995-99Productivity
Growth
(By Sector)
U.S High- & Low-Tech Industrial Production(Year-over-Year Percentage Changes)
-20
0
20
40
60
1980 1982 1984 1986 1988 1990 1992 1994 1996 1998 2000 2002
Total excluding High-Tech----(%) Computers/Communications/Semiconductors____
U.S. Productivity Gains and the Dollar—Is the Dollar Now Fairly or Over-Valued?
Source: Datastream

DB Guide to Exchange-Rate DeterminationMay 2002 Deutsche Bank @
Deutsche Bank Foreign Exchange Research 49
Productivity gains will tend to exert a greater impact onexchange rates if those productivity gains are concentratedin the traded-goods sector of an economy. A recent Fed-eral Reserve Bank of New York study ("To What Extent DoesProductivity Drive the Dollar?", Current Issues in Econom-ics and Finance, Volume 7, Number 8, August 2001) findsthat most of the gains in U.S. productivity in the 1990swere concentrated in the U.S. traded-goods sector.
Looking at sectoral productivity gaps (the difference be-tween traded-goods productivity and non-traded-goods pro-ductivity) in the U.S., Japan, and Euroland, one finds thatthe U.S. sectoral productivity gap has risen in the past 30years as the gap between U.S. traded and non-traded pro-ductivity growth has widened. In contrast, the sectoral pro-ductivity gap has fallen in Japan and has been steady inEuroland. The New York Fed's findings reveal that relativesectoral productivity gaps explain more than two-thirds ofthe movement in the yen and euro in the past decade.
U.S. Productivity Growth by Sector(1970-1999)
1.2
0.40.4
4.6
3.2
1.0
0
1
2
3
4
5
1970-80 1980-90 1990-99
Nontraded Sector(dark)(%) Traded Sector(light)
Source: OECD; Federal Reserve Bank of New York, August 2001
Japan Productivity Growth by Sector(1970-1999)
0.2
2.32.4
1.7
4.7
5.4
0
1
2
3
4
5
6
1970-80 1980-90 1990-99
Nontraded Sector(dark)(%) Traded Sector(light)
Source: OECD; Federal Reserve Bank of New York, August 2001
Euroland Productivity Growth by Sector(1970-1999)
0.91.2
1.8
2.93.0
4.0
0
1
2
3
4
5
1970-80 1980-90 1990-99
Nontraded Sector(dark)(%) Traded Sector(light)
Source: OECD; Federal Reserve Bank of New York, August 2001
U.S. Productivity and Changes in theU.S./Euro Real Exchange Rate
(1970-1999)
1.10.8
-1.0
1.8
0.1
-4.9
-6
-4
-2
0
2
4
1970-80 1980-90 1990-99
HBS Productivity Measure(dark)(%) Real Exchange Rate Chg.(light)
Note: Harrod, Balassa, Samuelson Productivity.Source: OECD; Federal Reserve Bank of New York, August 2001.
U.S. Productivity and Changes in theU.S./Japan Real Exchange Rate
(1970-1999)
1.5
0.4
-1.6
1.9
0.6
-2.3
-3
-2
-1
0
1
2
3
1970-80 1980-90 1990-99
HBS Productivity Measure(dark)(%) Real Exchange Rate Chg.(light)
Note: Harrod, Balassa, Samuelson Productivity.Source: OECD; Federal Reserve Bank of New York, August 2001.
Productivity Growth in the Traded-Goods Sector and the Determination of
Exchange Rates
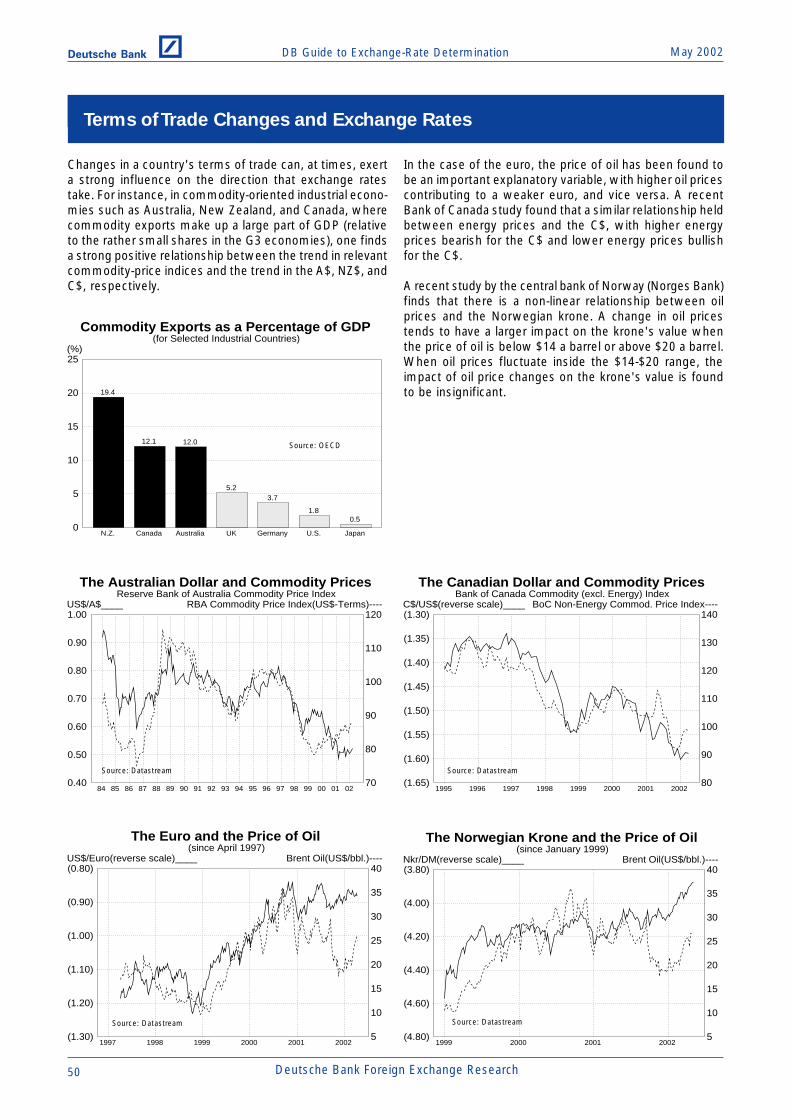
DB Guide to Exchange-Rate Determination May 2002Deutsche Bank @
50 Deutsche Bank Foreign Exchange Research
The Norwegian Krone and the Price of Oil(since January 1999)
5
10
15
20
25
30
35
40
(4.80)
(4.60)
(4.40)
(4.20)
(4.00)
(3.80)
1999 2000 2001 2002
Brent Oil(US$/bbl.)----Nkr/DM(reverse scale)____
Changes in a country's terms of trade can, at times, exerta strong influence on the direction that exchange ratestake. For instance, in commodity-oriented industrial econo-mies such as Australia, New Zealand, and Canada, wherecommodity exports make up a large part of GDP (relativeto the rather small shares in the G3 economies), one findsa strong positive relationship between the trend in relevantcommodity-price indices and the trend in the A$, NZ$, andC$, respectively.
In the case of the euro, the price of oil has been found tobe an important explanatory variable, with higher oil pricescontributing to a weaker euro, and vice versa. A recentBank of Canada study found that a similar relationship heldbetween energy prices and the C$, with higher energyprices bearish for the C$ and lower energy prices bullishfor the C$.
A recent study by the central bank of Norway (Norges Bank)finds that there is a non-linear relationship between oilprices and the Norwegian krone. A change in oil pricestends to have a larger impact on the krone's value whenthe price of oil is below $14 a barrel or above $20 a barrel.When oil prices fluctuate inside the $14-$20 range, theimpact of oil price changes on the krone's value is foundto be insignificant.
The Australian Dollar and Commodity PricesReserve Bank of Australia Commodity Price Index
70
80
90
100
110
120
0.40
0.50
0.60
0.70
0.80
0.90
1.00
84 85 86 87 88 89 90 91 92 93 94 95 96 97 98 99 00 01 02
RBA Commodity Price Index(US$-Terms)----US$/A$____
The Euro and the Price of Oil(since April 1997)
5
10
15
20
25
30
35
40
(1.30)
(1.20)
(1.10)
(1.00)
(0.90)
(0.80)
1997 1998 1999 2000 2001 2002
Brent Oil(US$/bbl.)----US$/Euro(reverse scale)____
The Canadian Dollar and Commodity PricesBank of Canada Commodity (excl. Energy) Index
80
90
100
110
120
130
140
(1.65)
(1.60)
(1.55)
(1.50)
(1.45)
(1.40)
(1.35)
(1.30)
1995 1996 1997 1998 1999 2000 2001 2002
BoC Non-Energy Commod. Price Index----C$/US$(reverse scale)____
Commodity Exports as a Percentage of GDP(for Selected Industrial Countries)
0.51.8
3.75.2
12.012.1
19.4
0
5
10
15
20
25
N.Z. Canada Australia UK Germany U.S. Japan
(%)
Source: Datastream Source: Datastream
Source: Datastream Source: Datastream
Source: OECD
Terms of Trade Changes and Exchange Rates
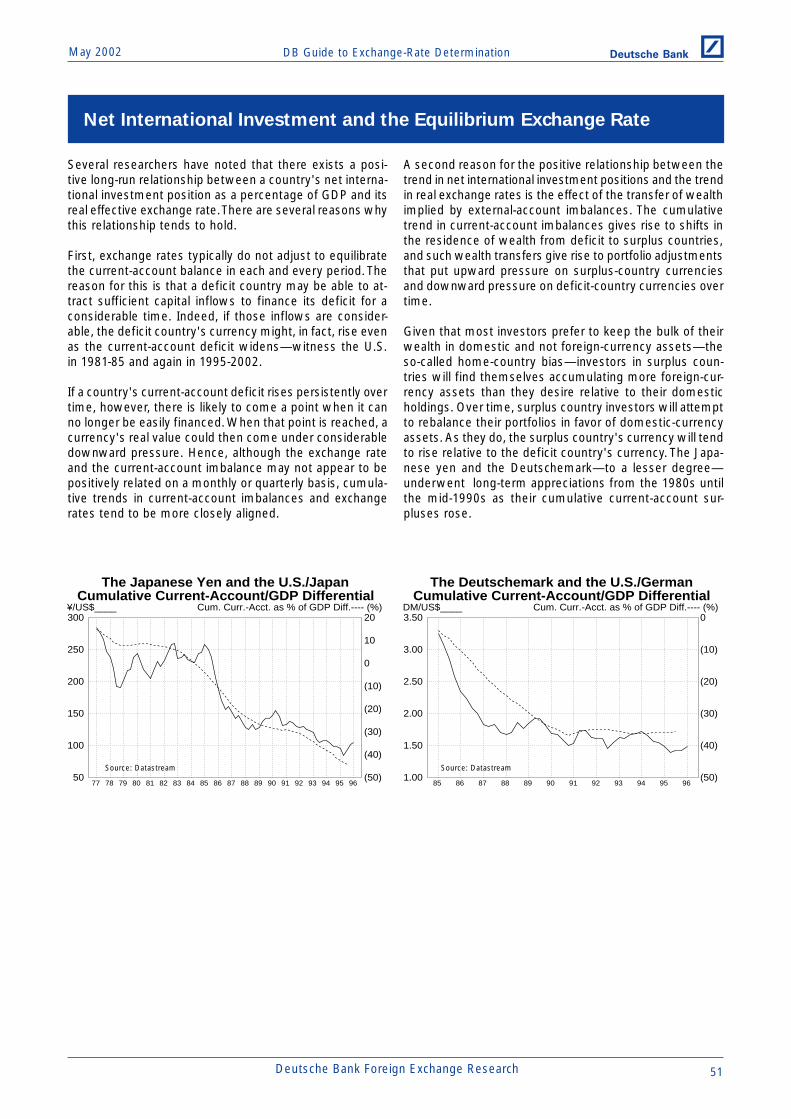
DB Guide to Exchange-Rate DeterminationMay 2002 Deutsche Bank @
Deutsche Bank Foreign Exchange Research 51
Several researchers have noted that there exists a posi-tive long-run relationship between a country's net interna-tional investment position as a percentage of GDP and itsreal effective exchange rate. There are several reasons whythis relationship tends to hold.
First, exchange rates typically do not adjust to equilibratethe current-account balance in each and every period. Thereason for this is that a deficit country may be able to at-tract sufficient capital inflows to finance its deficit for aconsiderable time. Indeed, if those inflows are consider-able, the deficit country's currency might, in fact, rise evenas the current-account deficit widens—witness the U.S.in 1981-85 and again in 1995-2002.
If a country's current-account deficit rises persistently overtime, however, there is likely to come a point when it canno longer be easily financed. When that point is reached, acurrency's real value could then come under considerabledownward pressure. Hence, although the exchange rateand the current-account imbalance may not appear to bepositively related on a monthly or quarterly basis, cumula-tive trends in current-account imbalances and exchangerates tend to be more closely aligned.
A second reason for the positive relationship between thetrend in net international investment positions and the trendin real exchange rates is the effect of the transfer of wealthimplied by external-account imbalances. The cumulativetrend in current-account imbalances gives rise to shifts inthe residence of wealth from deficit to surplus countries,and such wealth transfers give rise to portfolio adjustmentsthat put upward pressure on surplus-country currenciesand downward pressure on deficit-country currencies overtime.
Given that most investors prefer to keep the bulk of theirwealth in domestic and not foreign-currency assets—theso-called home-country bias—investors in surplus coun-tries will find themselves accumulating more foreign-cur-rency assets than they desire relative to their domesticholdings. Over time, surplus country investors will attemptto rebalance their portfolios in favor of domestic-currencyassets. As they do, the surplus country's currency will tendto rise relative to the deficit country's currency. The Japa-nese yen and the Deutschemark—to a lesser degree—underwent long-term appreciations from the 1980s untilthe mid-1990s as their cumulative current-account sur-pluses rose.
The Japanese Yen and the U.S./JapanCumulative Current-Account/GDP Differential
(50)
(40)
(30)
(20)
(10)
0
10
20
50
100
150
200
250
300
77 78 79 80 81 82 83 84 85 86 87 88 89 90 91 92 93 94 95 96
Cum. Curr.-Acct. as % of GDP Diff.---- (%)¥/US$____
The Deutschemark and the U.S./GermanCumulative Current-Account/GDP Differential
(50)
(40)
(30)
(20)
(10)
0
1.00
1.50
2.00
2.50
3.00
3.50
85 86 87 88 89 90 91 92 93 94 95 96
Cum. Curr.-Acct. as % of GDP Diff.---- (%)DM/US$____
Source: Datastream Source: Datastream
Net International Investment and the Equilibrium Exchange Rate

DB Guide to Exchange-Rate Determination May 2002Deutsche Bank @
52 Deutsche Bank Foreign Exchange Research
A final reason why the trends in net international invest-ment positions and real exchange rates are positively re-lated is that heavily indebted nations need to service theirnet external debts, and that can only be done if the debtorcountry runs a trade surplus to generate the income toservice those debts. In order for the debtor country to runa trade surplus consistently over time, the real exchangerate of a debtor country would need to decline. Similarly, acountry with a large cumulative current-account surpluswould need to see its currency's real value rise over timeto insure that the surplus and the associated net foreignasset position did not continue rising to unsustainably highlevels.
Although the U.S. has seen its net international investmentposition deteriorate sharply in the past decade, the dollarhas nevertheless remained extraordinarily resilient. Oneexplanation is that, although U.S. external liabilities exceedU.S. external assets by a wide margin, the U.S. has tendedto earn a higher return on its external assets than it haspaid out on its external liabilities. The result has been thatnet investment income flows, until recently, posted a mod-est surplus. While U.S. net investment income flows haverecently swung into a modest deficit position, the deficitdoes not appear to be sizeable enough at this stage toseriously damage the dollar's long-run prospects.
U.S. Balance on Investment Income(Four-Quarter Moving Sum)
-30
-20
-10
0
10
20
30
40
1980 1982 1984 1986 1988 1990 1992 1994 1996 1998 2000 2002
(US$ bn.)
U.S. Net Investment Position(at Current Cost and Market Value)
-2000
-1500
-1000
-500
0
500
80 81 82 83 84 85 86 87 88 89 90 91 92 93 94 95 96 97 98 99
Market Value(light)(US$ bn.) Current Cost(dark)
Source: Datastream Source: Datastream

DB Guide to Exchange-Rate DeterminationMay 2002 Deutsche Bank @
Deutsche Bank Foreign Exchange Research 53
The dollar has exhibited a tendency to both rise and fallover long-term cycles, with each of the dollar cycles sincethe floating of exchange rates in 1973 sharing a number ofcommon features.
First, the magnitude of the dollar's exchange-rate move-ments in each cycle has generally been large, often farexceeding the forecasts of portfolio managers, market pun-dits and forward-exchange rates.
Second, the period of each dollar cycle has tended to belong, often surpassing by a wide margin the typical lengthof U.S. and foreign business cycles. That would suggestthat cyclical factors alone cannot account for the tendencyof the dollar to move in large and protracted swings.
Third, at the end of each major cycle, there has been atendency for the dollar to overshoot its long-run equilib-rium level, often in a climactic fashion.
Finally, when the dollar has overshot its fair value at theend of a long cycle, the deviation in the dollar's value fromits estimated PPP value has often given rise to seriousimbalances on either the internal or external-balance frontsin the U.S., Europe, or Japan. When those imbalancesreached a critical level, it often set market forces in motionto bring the overshoot to an end, and to plant the seedsfor a 180-degree shift in the dollar's long-term trend.
Long-Term Cycles in Exchange Rates
Source: DatastreamSource: Datastream
Source: Datastream
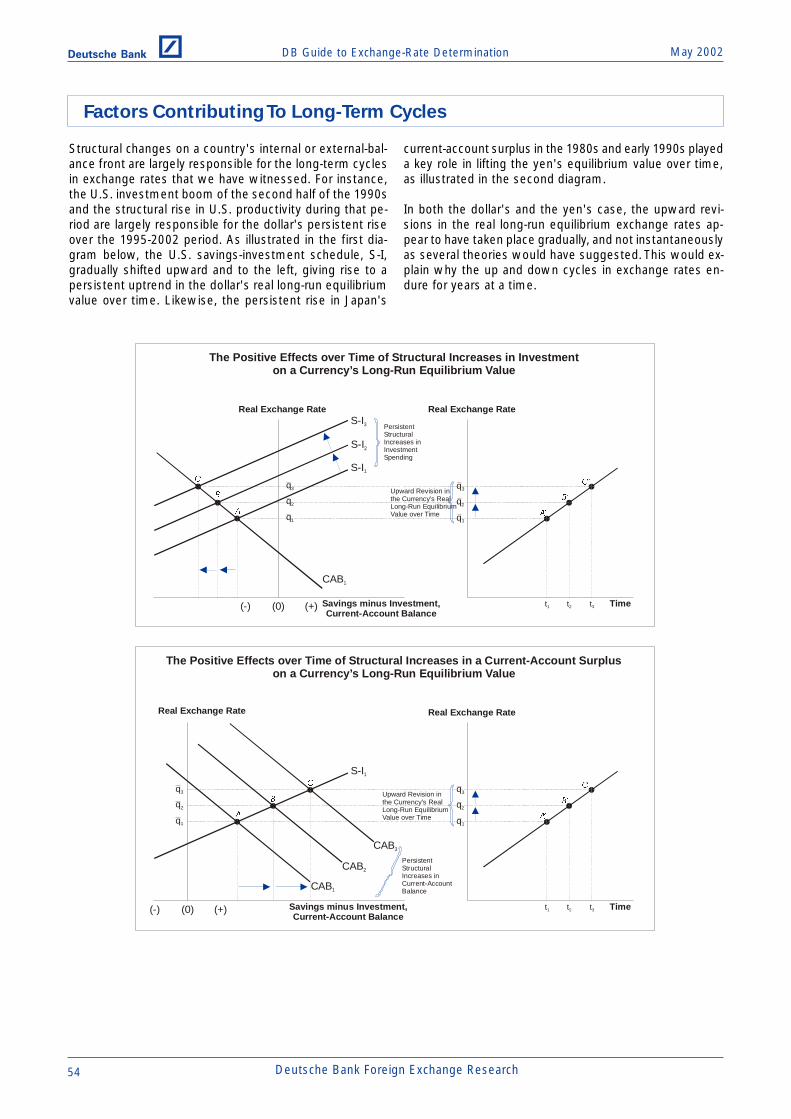
DB Guide to Exchange-Rate Determination May 2002Deutsche Bank @
54 Deutsche Bank Foreign Exchange Research
Structural changes on a country's internal or external-bal-ance front are largely responsible for the long-term cyclesin exchange rates that we have witnessed. For instance,the U.S. investment boom of the second half of the 1990sand the structural rise in U.S. productivity during that pe-riod are largely responsible for the dollar's persistent riseover the 1995-2002 period. As illustrated in the first dia-gram below, the U.S. savings-investment schedule, S-I,gradually shifted upward and to the left, giving rise to apersistent uptrend in the dollar's real long-run equilibriumvalue over time. Likewise, the persistent rise in Japan's
current-account surplus in the 1980s and early 1990s playeda key role in lifting the yen's equilibrium value over time,as illustrated in the second diagram.
In both the dollar's and the yen's case, the upward revi-sions in the real long-run equilibrium exchange rates ap-pear to have taken place gradually, and not instantaneouslyas several theories would have suggested. This would ex-plain why the up and down cycles in exchange rates en-dure for years at a time.
Factors Contributing To Long-Term Cycles
The Positive Effects over Time of Structural Increases in Investmenton a Currency’s Long-Run Equilibrium Value
%·
Savings minus Investment,Current-Account Balance
Real Exchange Rate
PersistentStructuralIncreases inInvestmentSpending
S-I2
$·
CAB1
Upward Revision inthe Currency’s Real Long-Run Equilibrium Value over Time
q2
q1
(0)(-) (+)
S-I1
&·
S-I3
q3
Time
Real Exchange Rate
q2
q1
q3%
$
&
t1 t2 t3
The Positive Effects over Time of Structural Increases in a Current-Account Surpluson a Currency’s Long-Run Equilibrium Value
%
Savings minus Investment,Current-Account Balance
Real Exchange Rate
PersistentStructuralIncreases inCurrent-Account Balance
CAB2
$
CAB1
Upward Revision inthe Currency’s Real Long-Run Equilibrium Value over Time
q2
q1
(0)(-) (+)
S-I1
&
CAB3
q3
Time
Real Exchange Rate
q2
q1
q3
%·
$·
&·
t1 t2 t3
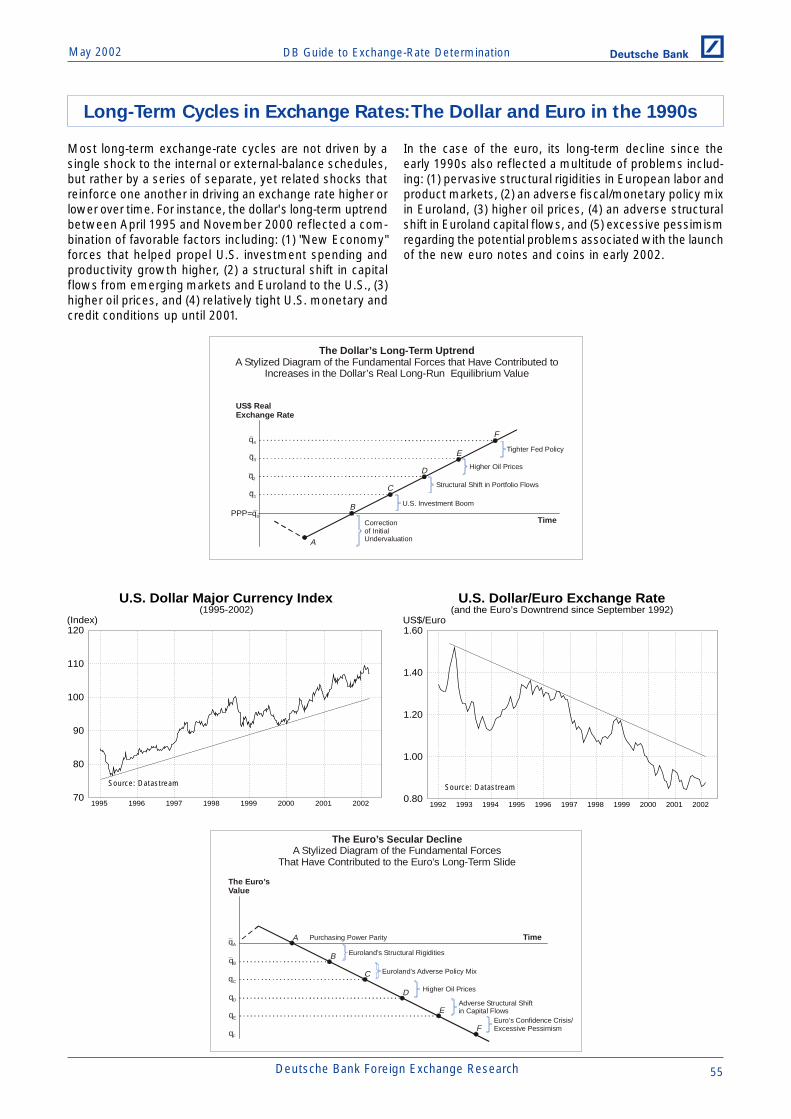
DB Guide to Exchange-Rate DeterminationMay 2002 Deutsche Bank @
Deutsche Bank Foreign Exchange Research 55
Most long-term exchange-rate cycles are not driven by asingle shock to the internal or external-balance schedules,but rather by a series of separate, yet related shocks thatreinforce one another in driving an exchange rate higher orlower over time. For instance, the dollar's long-term uptrendbetween April 1995 and November 2000 reflected a com-bination of favorable factors including: (1) "New Economy"forces that helped propel U.S. investment spending andproductivity growth higher, (2) a structural shift in capitalflows from emerging markets and Euroland to the U.S., (3)higher oil prices, and (4) relatively tight U.S. monetary andcredit conditions up until 2001.
In the case of the euro, its long-term decline since theearly 1990s also reflected a multitude of problems includ-ing: (1) pervasive structural rigidities in European labor andproduct markets, (2) an adverse fiscal/monetary policy mixin Euroland, (3) higher oil prices, (4) an adverse structuralshift in Euroland capital flows, and (5) excessive pessimismregarding the potential problems associated with the launchof the new euro notes and coins in early 2002.
U.S. Dollar Major Currency Index(1995-2002)
70
80
90
100
110
120
1995 1996 1997 1998 1999 2000 2001 2002
(Index)
U.S. Dollar/Euro Exchange Rate(and the Euro’s Downtrend since September 1992)
0.80
1.00
1.20
1.40
1.60
1992 1993 1994 1995 1996 1997 1998 1999 2000 2001 2002
US$/Euro
Long-Term Cycles in Exchange Rates: The Dollar and Euro in the 1990s
Source: Datastream Source: Datastream
The Dollar’s Long-Term Uptrend A Stylized Diagram of the Fundamental Forces that Have Contributed to
Increases in the Dollar’s Real Long-Run Equilibrium Value
A
B
C
E
US$ Real Exchange Rate
Correctionof InitialUndervaluation
U.S. Investment Boom
Time
q1
PPP=q0
F
q2
Higher Oil Prices
Structural Shift in Portfolio Flows
Tighter Fed Policyq4
q3
D
The Euro’s Secular DeclineA Stylized Diagram of the Fundamental Forces
That Have Contributed to the Euro’s Long-Term Slide
A
B
C
D
The Euro’s Value
Purchasing Power Parity
Euroland’s Adverse Policy Mix
Time
qD
E
qC
Higher Oil Prices
Euroland’s Structural Rigidities
Adverse Structural Shiftin Capital Flows
qB
qE
qA
FEuro’s Confidence Crisis/Excessive Pessimism
qF
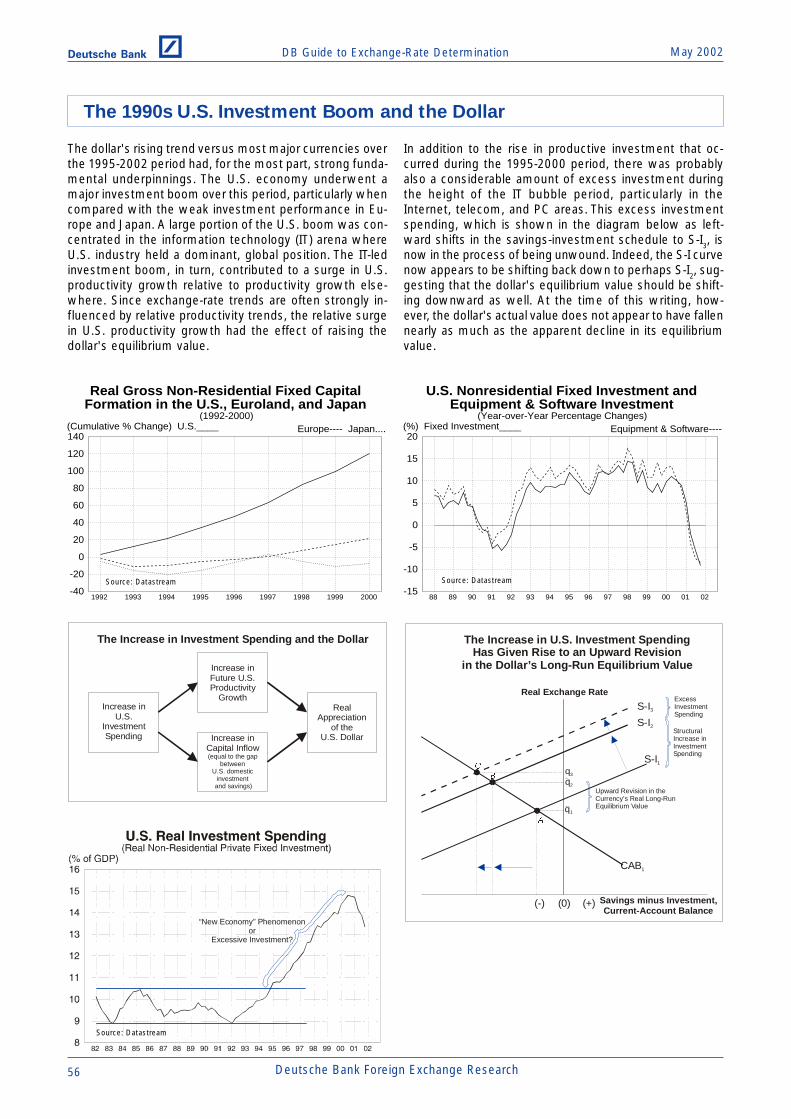
DB Guide to Exchange-Rate Determination May 2002Deutsche Bank @
56 Deutsche Bank Foreign Exchange Research
U.S. Nonresidential Fixed Investment andEquipment & Software Investment
(Year-over-Year Percentage Changes)
-15
-10
-5
0
5
10
15
20
88 89 90 91 92 93 94 95 96 97 98 99 00 01 02
Equipment & Software----(%) Fixed Investment____
Source: Datastream
The dollar's rising trend versus most major currencies overthe 1995-2002 period had, for the most part, strong funda-mental underpinnings. The U.S. economy underwent amajor investment boom over this period, particularly whencompared with the weak investment performance in Eu-rope and Japan. A large portion of the U.S. boom was con-centrated in the information technology (IT) arena whereU.S. industry held a dominant, global position. The IT-ledinvestment boom, in turn, contributed to a surge in U.S.productivity growth relative to productivity growth else-where. Since exchange-rate trends are often strongly in-fluenced by relative productivity trends, the relative surgein U.S. productivity growth had the effect of raising thedollar's equilibrium value.
In addition to the rise in productive investment that oc-curred during the 1995-2000 period, there was probablyalso a considerable amount of excess investment duringthe height of the IT bubble period, particularly in theInternet, telecom, and PC areas. This excess investmentspending, which is shown in the diagram below as left-ward shifts in the savings-investment schedule to S-I3, isnow in the process of being unwound. Indeed, the S-I curvenow appears to be shifting back down to perhaps S-I2, sug-gesting that the dollar's equilibrium value should be shift-ing downward as well. At the time of this writing, how-ever, the dollar's actual value does not appear to have fallennearly as much as the apparent decline in its equilibriumvalue.
Real Gross Non-Residential Fixed CapitalFormation in the U.S., Euroland, and Japan
(1992-2000)
-40
-20
0
20
40
60
80
100
120
140
1992 1993 1994 1995 1996 1997 1998 1999 2000
Europe---- Japan....(Cumulative % Change) U.S.____
The 1990s U.S. Investment Boom and the Dollar
Increase inCapital Inflow(equal to the gap
betweenU.S. domestic
investment and savings)
The Increase in Investment Spending and the Dollar
Increase inU.S.
InvestmentSpending
Real Appreciation
of theU.S. Dollar
Increase inFuture U.S.Productivity
Growth
The Increase in U.S. Investment Spending Has Given Rise to an Upward Revision
in the Dollar’s Long-Run Equilibrium Value
%
Savings minus Investment,Current-Account Balance
Real Exchange Rate
StructuralIncrease inInvestmentSpending
S-I2
$
CAB1
Upward Revision in theCurrency’s Real Long-RunEquilibrium Value
q2
q1
(0)(-) (+)
S-I1&
ExcessInvestmentSpending
S-I3
q3
“New Economy” Phenomenonor
Excessive Investment?
Source: Datastream
Source: Datastream
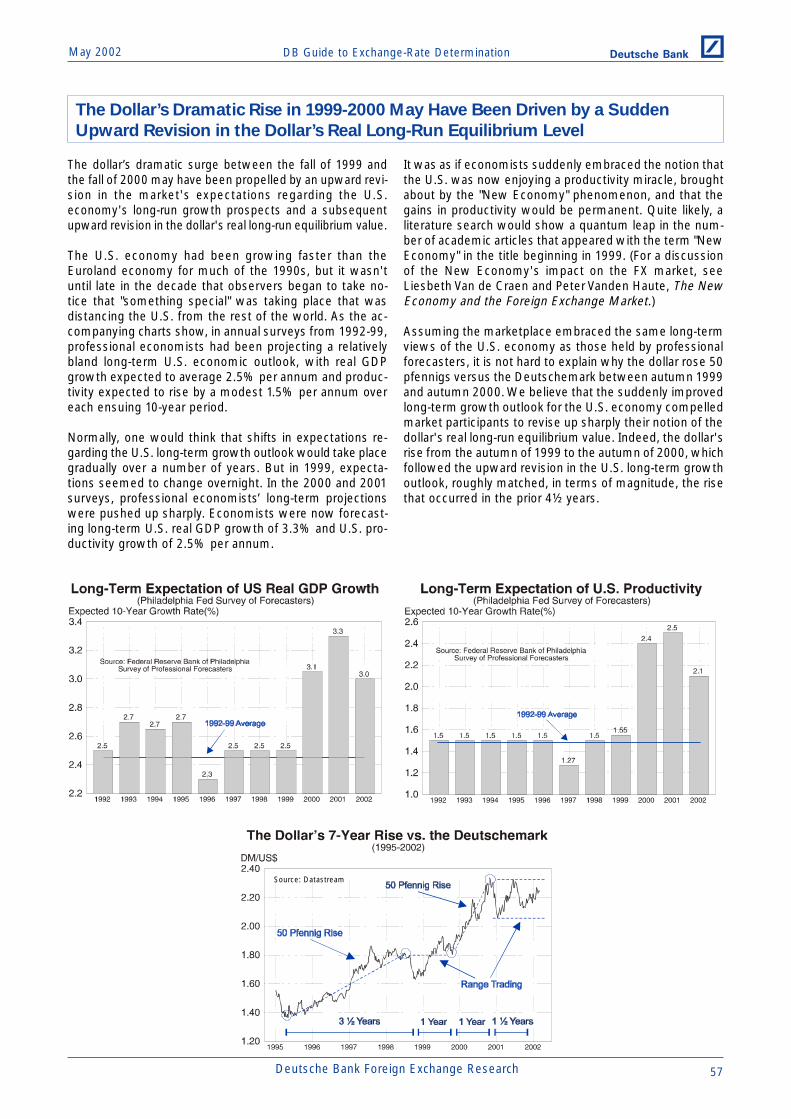
DB Guide to Exchange-Rate DeterminationMay 2002 Deutsche Bank @
Deutsche Bank Foreign Exchange Research 57
The Dollar’s Dramatic Rise in 1999-2000 May Have Been Driven by a Sudden
Upward Revision in the Dollar’s Real Long-Run Equilibrium Level
Source: Datastream
The dollar’s dramatic surge between the fall of 1999 andthe fall of 2000 may have been propelled by an upward revi-sion in the market's expectations regarding the U.S.economy's long-run growth prospects and a subsequentupward revision in the dollar's real long-run equilibrium value.
The U.S. economy had been growing faster than theEuroland economy for much of the 1990s, but it wasn'tuntil late in the decade that observers began to take no-tice that "something special" was taking place that wasdistancing the U.S. from the rest of the world. As the ac-companying charts show, in annual surveys from 1992-99,professional economists had been projecting a relativelybland long-term U.S. economic outlook, with real GDPgrowth expected to average 2.5% per annum and produc-tivity expected to rise by a modest 1.5% per annum overeach ensuing 10-year period.
Normally, one would think that shifts in expectations re-garding the U.S. long-term growth outlook would take placegradually over a number of years. But in 1999, expecta-tions seemed to change overnight. In the 2000 and 2001surveys, professional economists’ long-term projectionswere pushed up sharply. Economists were now forecast-ing long-term U.S. real GDP growth of 3.3% and U.S. pro-ductivity growth of 2.5% per annum.
It was as if economists suddenly embraced the notion thatthe U.S. was now enjoying a productivity miracle, broughtabout by the "New Economy" phenomenon, and that thegains in productivity would be permanent. Quite likely, aliterature search would show a quantum leap in the num-ber of academic articles that appeared with the term "NewEconomy" in the title beginning in 1999. (For a discussionof the New Economy's impact on the FX market, seeLiesbeth Van de Craen and Peter Vanden Haute, The NewEconomy and the Foreign Exchange Market.)
Assuming the marketplace embraced the same long-termviews of the U.S. economy as those held by professionalforecasters, it is not hard to explain why the dollar rose 50pfennigs versus the Deutschemark between autumn 1999and autumn 2000. We believe that the suddenly improvedlong-term growth outlook for the U.S. economy compelledmarket participants to revise up sharply their notion of thedollar's real long-run equilibrium value. Indeed, the dollar'srise from the autumn of 1999 to the autumn of 2000, whichfollowed the upward revision in the U.S. long-term growthoutlook, roughly matched, in terms of magnitude, the risethat occurred in the prior 4½ years.

DB Guide to Exchange-Rate Determination May 2002Deutsche Bank @
58 Deutsche Bank Foreign Exchange Research
The "synthetic" euro's real trade-weighted value had beendeclining on a trend basis for much of the decade headinginto its 1999 launch date. Yet many pundits expected thatthe new single currency would be strong, believing thatthe euro would embrace all of the hard-currency attributesof the Deutschemark and would discard all the soft-cur-rency attributes of its depreciation-prone ERM members.This did not happen. By 2001, the euro was trading closeto its 20-year low versus the yen and British pound, and—except for the 1985 dollar bubble—the euro was tradingclose to a record low versus the U.S. dollar.
Perhaps those pundits failed to recognize that the euro'slong-term behavior, being a weighted average of all EMUmember currencies, resembled that of a soft and not ahard currency. In fact, its persistent decline versus a widerange of currencies suggests that negative fundamentaldevelopments intrinsic to Euroland probably played a largerole in the euro's long-term slide.
US$/Euro Exchange Rate(1980-2002)
0.60
0.80
1.00
1.20
1.40
1.60
1.80
1980 1982 1984 1986 1988 1990 1992 1994 1996 1998 2000 2002
US$/Euro
Synthetic Euro Real Trade-Weighted Index(1980-2002)
70
80
90
100
110
120
1980 1982 1984 1986 1988 1990 1992 1994 1996 1998 2000 2002
Bank of England Index
Average
Canadian Dollar/Euro andAustralian Dollar/Euro Exchange Rates
(1980-2002)
0.80
1.00
1.20
1.40
1.60
1.80
2.00
2.20
1980 1982 1984 1986 1988 1990 1992 1994 1996 1998 2000 2002
A$/Euro----C$/Euro____
The Euro Relative to the Euroland Currencies(European Currencies versus the U.S. Dollar)
20
40
60
80
100
120
140
160
180
75 77 79 81 83 85 87 89 91 93 95 97 99 01
France.... Italy/Spain__ __(Index) Euro____ DM----
British Pound/Euro Exchange Rate(1970-2002)
0.50
0.60
0.70
0.80
0.90
1.00
70 72 74 76 78 80 82 84 86 88 90 92 94 96 98 00 02
£/Euro
Japanese Yen/Euro Exchange Rate(1970-2002)
0
100
200
300
400
500
600
70 72 74 76 78 80 82 84 86 88 90 92 94 96 98 00 02
¥/Euro
The Euro's Long-Term Struggle
Source: Datastream
Source: Datastream Source: Datastream
Source: Datastream
Source: DatastreamSource: Datastream
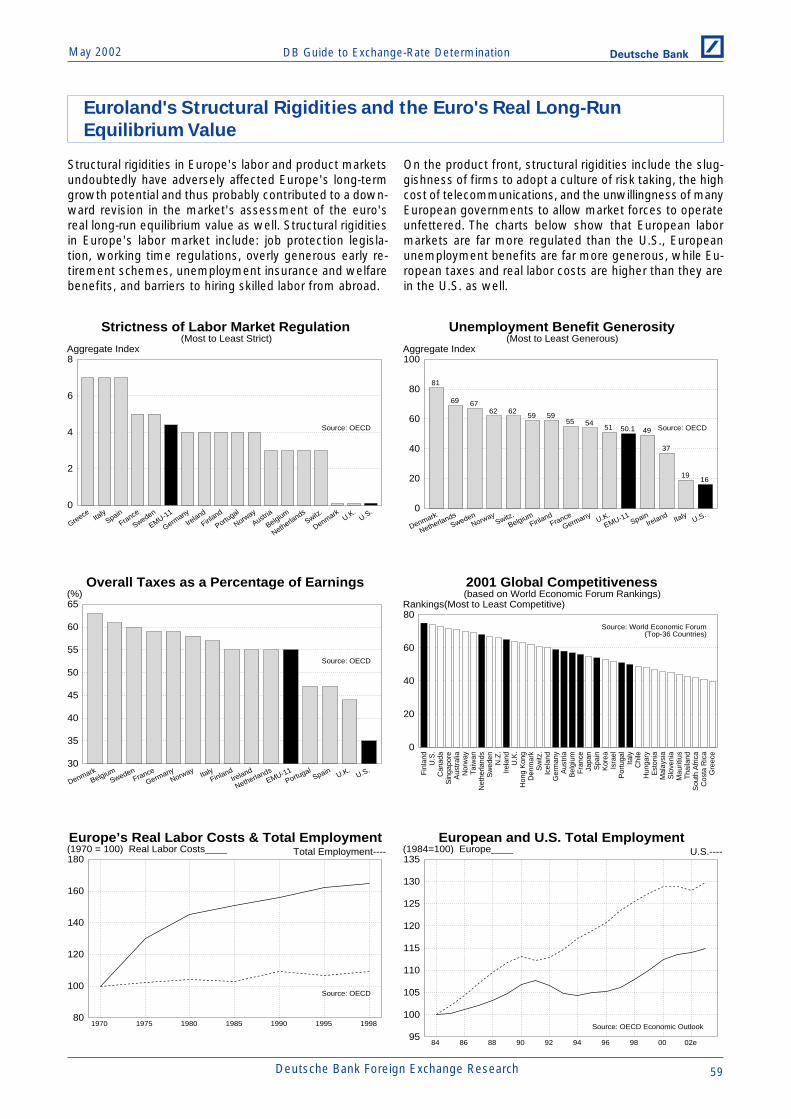
DB Guide to Exchange-Rate DeterminationMay 2002 Deutsche Bank @
Deutsche Bank Foreign Exchange Research 59
Structural rigidities in Europe's labor and product marketsundoubtedly have adversely affected Europe's long-termgrowth potential and thus probably contributed to a down-ward revision in the market's assessment of the euro'sreal long-run equilibrium value as well. Structural rigiditiesin Europe's labor market include: job protection legisla-tion, working time regulations, overly generous early re-tirement schemes, unemployment insurance and welfarebenefits, and barriers to hiring skilled labor from abroad.
On the product front, structural rigidities include the slug-gishness of firms to adopt a culture of risk taking, the highcost of telecommunications, and the unwillingness of manyEuropean governments to allow market forces to operateunfettered. The charts below show that European labormarkets are far more regulated than the U.S., Europeanunemployment benefits are far more generous, while Eu-ropean taxes and real labor costs are higher than they arein the U.S. as well.
Strictness of Labor Market Regulation(Most to Least Strict)
0
2
4
6
8
Greece Italy
Spain
France
Sweden
EMU-11
Germany
Ireland
Finland
Portugal
Norway
Austria
Belgium
Netherlands
Switz.
DenmarkU.K.
U.S.
Aggregate Index
Source: OECD
Overall Taxes as a Percentage of Earnings
30
35
40
45
50
55
60
65
DenmarkBelgium
SwedenFrance
GermanyNorway
ItalyFinland
Ireland
NetherlandsEMU-11
PortugalSpain U.K.
U.S.
(%)
Source: OECD
Unemployment Benefit Generosity(Most to Least Generous)
1619
37
4950.1515455
59596262
6769
81
0
20
40
60
80
100
Denmark
NetherlandsSweden
NorwaySwitz.
BelgiumFinland
France
GermanyU.K.
EMU-11Spain
Ireland Italy U.S.
Aggregate Index
Source: OECD
Europe’s Real Labor Costs & Total Employment
80
100
120
140
160
180
1970 1975 1980 1985 1990 1995 1998
Total Employment----(1970 = 100) Real Labor Costs____
Source: OECD
2001 Global Competitiveness(based on World Economic Forum Rankings)
0
20
40
60
80
Fin
land
U.S
.C
anad
aS
inga
pore
Aus
tral
iaN
orw
ayT
aiw
anN
ethe
rland
sS
wed
enN
.Z.
Irel
and
U.K
.H
ong
Kon
gD
enm
ark
Sw
itz.
Icel
and
Ger
man
yA
ustr
iaB
elgi
umF
ranc
eJa
pan
Spa
inK
orea
Isra
elP
ortu
gal
Italy
Chi
leH
unga
ryE
ston
iaM
alay
sia
Slo
veni
aM
aurit
ius
Tha
iland
Sou
th A
fric
aC
osta
Ric
aG
reec
e
Rankings(Most to Least Competitive)
Source: World Economic Forum(Top-36 Countries)
European and U.S. Total Employment
95
100
105
110
115
120
125
130
135
84 86 88 90 92 94 96 98 00 02e
U.S.----(1984=100) Europe____
Source: OECD Economic Outlook
Euroland's Structural Rigidities and the Euro's Real Long-Run
Equilibrium Value
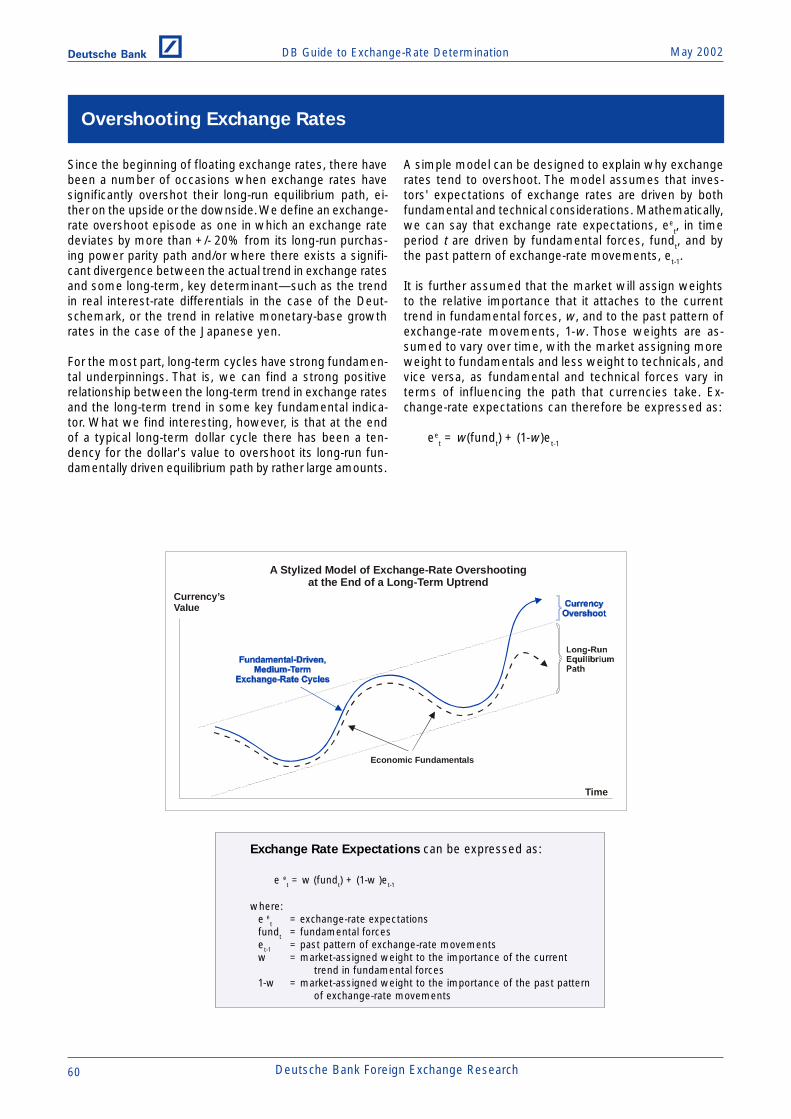
DB Guide to Exchange-Rate Determination May 2002Deutsche Bank @
60 Deutsche Bank Foreign Exchange Research
Since the beginning of floating exchange rates, there havebeen a number of occasions when exchange rates havesignificantly overshot their long-run equilibrium path, ei-ther on the upside or the downside. We define an exchange-rate overshoot episode as one in which an exchange ratedeviates by more than +/- 20% from its long-run purchas-ing power parity path and/or where there exists a signifi-cant divergence between the actual trend in exchange ratesand some long-term, key determinant—such as the trendin real interest-rate differentials in the case of the Deut-schemark, or the trend in relative monetary-base growthrates in the case of the Japanese yen.
For the most part, long-term cycles have strong fundamen-tal underpinnings. That is, we can find a strong positiverelationship between the long-term trend in exchange ratesand the long-term trend in some key fundamental indica-tor. What we find interesting, however, is that at the endof a typical long-term dollar cycle there has been a ten-dency for the dollar's value to overshoot its long-run fun-damentally driven equilibrium path by rather large amounts.
A simple model can be designed to explain why exchangerates tend to overshoot. The model assumes that inves-tors' expectations of exchange rates are driven by bothfundamental and technical considerations. Mathematically,we can say that exchange rate expectations, ee
t, in timeperiod t are driven by fundamental forces, fundt, and bythe past pattern of exchange-rate movements, et-1.
It is further assumed that the market will assign weightsto the relative importance that it attaches to the currenttrend in fundamental forces, w, and to the past pattern ofexchange-rate movements, 1-w. Those weights are as-sumed to vary over time, with the market assigning moreweight to fundamentals and less weight to technicals, andvice versa, as fundamental and technical forces vary interms of influencing the path that currencies take. Ex-change-rate expectations can therefore be expressed as:
eet = w(fundt) + (1-w)et-1
A Stylized Model of Exchange-Rate Overshootingat the End of a Long-Term Uptrend
Currency’sValue
Time
Economic Fundamentals
Exchange Rate Expectations can be expressed as:
e et = w (fundt) + (1-w )et-1
where:e e
t = exchange-rate expectationsfundt = fundamental forceset-1 = past pattern of exchange-rate movementsw = market-assigned weight to the importance of the current
trend in fundamental forces1-w = market-assigned weight to the importance of the past pattern
of exchange-rate movements
Overshooting Exchange Rates

DB Guide to Exchange-Rate DeterminationMay 2002 Deutsche Bank @
Deutsche Bank Foreign Exchange Research 61
Typically, in the early and middle stages of an extendedexchange-rate cycle, the market tends to attach greaterweight to the trend in economic fundamentals (i.e., wrises). This is because the trend in exchange rates and thetrend in key fundamental variables parallel each other quiteclosely. In the latter stages of an extended exchange-ratecycle, however, there often occurs some disconnect be-tween the trend in the exchange rate and the trend in keyfundamental variables.
What causes this disconnect to occur is the tendency ofthe market at the end of a long cycle to assign less weightto fundamental forces and more weight to the prevailingtrend in exchange rates (i.e., 1-w rises). For instance, aftera long cycle of currency appreciation, the market gets ac-customed to being long the appreciating currency andtends to shrug off any adverse underlying fundamentaldevelopments as being just a temporary phenomenon.Hence, the market will begin to attach less weight to thedeteriorating trend in fundamentals (i.e., w will graduallyfall) and more weight to the past favorable trend in theexchange rate (i.e., 1-w will gradually rise).
By attaching greater weight to expectations that the pre-vailing trend will remain strong and less weight to the de-terioration of fundamental forces, the trend in exchangerates and the trend in fundamentals becomes discon-nected. Eventually, a point will be reached when the mar-ket finally recognizes that the deterioration in fundamen-
tals is a permanent, and not just a temporary phenom-enon. At that point, market expectations will shift, result-ing in greater weight being assigned to deteriorating fun-damental forces and less weight to the prospect that theexchange-rate overshoot will persist. It is at this stage thatthe unwinding of long speculative positions gives rise to arapid, and at times violent, correction of the exchange-rateovershoot.
There have been several extraordinary episodes of majorcurrency overshooting since the beginning of floating ex-change rates—the Deutschemark in the mid-1980s, theyen in 1995 and 1998, and the dollar in general in 2000-02.In the case of the Deutschemark, there was a significantdisconnect between the trend in U.S./German real long-term interest-rate differentials and the DM/US$ exchangerate towards the end of the dollar's remarkable run up-ward during its bubble period. There was simply no way toexplain the dollar's surge in 1984-85 on the basis of realyield spreads, and this overshoot in the dollar's value waseventually corrected in 1985-87.
In the case of the yen, there was a similar disconnect be-tween the trend in U.S. and Japanese relative monetary-base growth and the trend in the yen's value versus thedollar in 1995 and again in 1998. The dollar overshot to thedownside in 1995 and overshot to the upside in 1998, andin both cases the overshoots were subsequently corrected.
Source: Datastream
Source: Datastream
The Market Attaches Less Weightto Fundamental Forces During
an Exchange-Rate Overshooting Period
Market-AssignedWeight (w)
Time
Market-Assigned Weight (1-w)
Beginning of Exchange-Rate Cycle
OvershootingPeriod

DB Guide to Exchange-Rate Determination May 2002Deutsche Bank @
62 Deutsche Bank Foreign Exchange Research
It is widely recognized that financial markets need stabiliz-ing speculators to ensure that financial market prices donot wander too far from fair value. By buying at price lev-els that are perceived to be low and selling at price levelsthat are perceived to be high, speculators will ensure thatasset prices do not become too stretched relative to fairvalue. If there is a fairly elastic supply of speculative capi-tal in the foreign-exchange market, a significant increasein commercial demand for dollars (perhaps generated by aforeign acquisition of a U.S. firm) need not give rise to adramatic rise in the dollar's value. Instead, the increasedcommercial demand for dollars may give rise to only amodest increase in the dollar's value from e0 to e1 as shownin the diagram below.
However, consider a situation where there is an absenceor a shortage of stabilizing speculative capital. This mightoccur if hedge funds, investors, and foreign-exchange trad-ers are unwilling or unable to commit relatively large sumsof capital for speculative purposes. In such a case, thesupply of speculative capital in the foreign-exchange mar-ket would appear to be relatively inelastic. In that environ-ment, it may only take a modest increase in the commer-cial demand for dollars to push the dollar's value sharply
higher from e0 to e2. In other words, when there is a short-age of stabilizing speculative capital, exchange rates arelikely to be more volatile and prone to overshooting, evenamid modest changes in the commercial demand for dol-lars.
Such behavior might explain why the dollar has remainedsignificantly overvalued against a wide range of curren-cies in the past few years. With many investors, hedgefunds, and foreign-exchange traders unwilling or unable torisk sufficient capital to bet against the dollar, there simplyhas not been enough speculative capital in the market toreverse the dollar's overshoot.
The tendency of speculative capital to dry up when mar-ket prices move far out of line with fair value is not uniqueto the foreign-exchange market. Indeed, most speculativebubbles, particularly at their peaks, are not fed by exces-sive speculation, but instead are driven by an absence ofstabilizing speculation. When an absence of stabilizingspeculative capital causes exchange rates to overshoottheir long-run equilibrium value, central banks often inter-vene and take on the role of a stabilizing speculator.
How a Shortage of Stabilizing Speculative Capital Can Give Rise to
Exchange-Rate Overshooting
An Absence of Currency SpeculationCan Lead to Greater Exchange-Rate Volatility
and Exchange-Rate Overshooting
Quantity of Dollars
Exchange Rate
C
Commercial Demand for Dollars2
Commercial Demand for Dollars1
Inelastic SpeculativeSupply of Dollars
B
A
Elastic SpeculativeSupply of Dollars
e2
e1
e0
QC QBQA

DB Guide to Exchange-Rate DeterminationMay 2002 Deutsche Bank @
Deutsche Bank Foreign Exchange Research 63
Exchange-Rate Determination
in the Medium Term

DB Guide to Exchange-Rate Determination May 2002Deutsche Bank @
64 Deutsche Bank Foreign Exchange Research
Exchange rates are simultaneously determined by long-term structural, medium-term cyclical, and short-termspeculative forces. Since long-term structural forces oftenchange at a glacial pace, they are likely to exert a greaterinfluence on a currency's long-run equilibrium path thanon a currency's short or medium-term path. A variety ofstructural forces operate jointly to influence a currency'slong-run equilibrium path. These include the long-term trendin national inflation rates, relative productivity growth, long-term trends in net foreign asset and liability positions, per-sistent trends in a country's terms of trade, and long-termtrends in national savings and investment.
Medium-term cyclical forces often cause a currency to ei-ther rise or fall relative to its long-run equilibrium path. Inmany cases the medium-term deviations from the long-run equilibrium path can be quite sizeable, and in someinstances they can be quite persistent. In the long run,these medium-term cyclical forces tend to wash out, andonce they do, there is a tendency for the exchange rate toreturn to its long-run equilibrium path.
Nevertheless, in the interim, fund managers must find away to adjust their portfolios to account for these devia-tions from long-run equilibrium levels or else risk seriousunderperformance over medium-term horizons. Since in-vestment performance is often evaluated over relativelyshort time spans today, it is important for fund managersto channel their energies towards getting the direction thatexchange rates take over short and medium-term horizonsright.
Medium-term trends in exchange rates tend to be influ-enced by the direction of macroeconomic variables. Thekey medium-term determinants of exchange rates includetrends in real interest-rate differentials, current and capitalaccount trends, relative monetary and fiscal policies, rela-tive economic growth, and portfolio-balance considerations.The success that these variables have had in explainingthe medium-term trends that exchange rates have takenin the past is at best mixed. In many cases, one can findevidence of a strong correlation between one or more ofthese variables and the trend in exchange rates over sev-eral cycles. But something often happens to break thistight cyclical linkage. When it does, the subsequent use-fulness of that variable as an explanatory variable becomesseriously undermined.
Overall, we find that shifts in fiscal and monetary policiesplay the most important role in driving a currency's valueon a medium-term basis, with many of the major exchange-rate cycles in the 1990s attributable to shifts in fiscal/mon-etary policy mixes of individual countries. We find that thetrend in the ratio of Japan's monetary base to the U.S.monetary base has done the best job of explaining theJapanese yen/U.S. dollar exchange rate's medium-term cy-clical path over the past 12 years. In the case of the Deut-schemark (and now the euro), the trend in the U.S./Ger-man real long-term yield spread has done the best job ofexplaining the medium-term cyclical paths that the Deut-schemark/U.S. dollar exchange rate has taken over the past25 years.
The Yen and Japanese/U.S. Monetary Policies
0.90
1.00
1.10
1.20
1.30
1.40
1.50
80
100
120
140
160
180
89 90 91 92 93 94 95 96 97 98 99 00 01 02
Japan/U.S. Monetary Base(ratio)----Yen/US$____
Note: Y2K Adjusted,Japan Reserve Require. Rate Change Adj. Series
Exchange-Rate Determination in the Medium Term
DM/US$ Exchange Rate and U.S./GermanReal Interest-Rate Differentials
(10-Year Bond Yields Less CPI)
-1000
-800
-600
-400
-200
0
200
400
600
1.00
1.50
2.00
2.50
3.00
3.50
75 77 79 81 83 85 87 89 91 93 95 97 99 01
U.S. Less German Real Interest Rates(bp)----DM/US$____
Source: Datastream
Source: Datastream
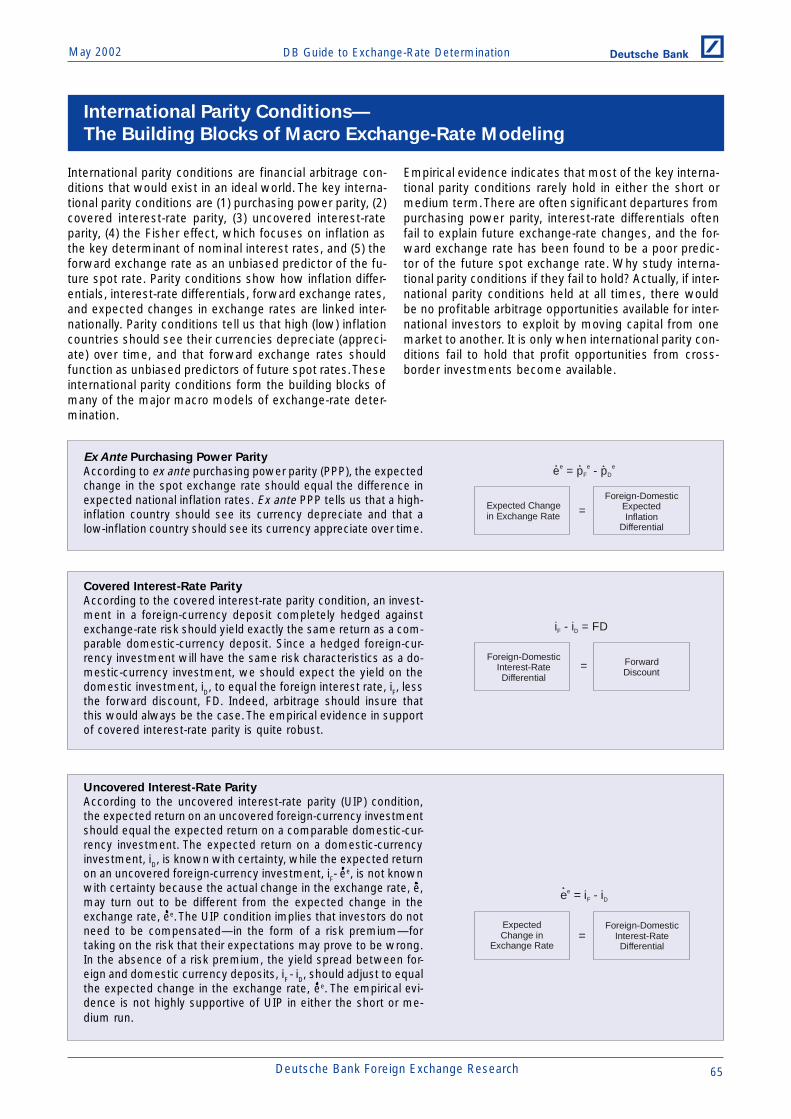
DB Guide to Exchange-Rate DeterminationMay 2002 Deutsche Bank @
Deutsche Bank Foreign Exchange Research 65
International parity conditions are financial arbitrage con-ditions that would exist in an ideal world. The key interna-tional parity conditions are (1) purchasing power parity, (2)covered interest-rate parity, (3) uncovered interest-rateparity, (4) the Fisher effect, which focuses on inflation asthe key determinant of nominal interest rates, and (5) theforward exchange rate as an unbiased predictor of the fu-ture spot rate. Parity conditions show how inflation differ-entials, interest-rate differentials, forward exchange rates,and expected changes in exchange rates are linked inter-nationally. Parity conditions tell us that high (low) inflationcountries should see their currencies depreciate (appreci-ate) over time, and that forward exchange rates shouldfunction as unbiased predictors of future spot rates. Theseinternational parity conditions form the building blocks ofmany of the major macro models of exchange-rate deter-mination.
Empirical evidence indicates that most of the key interna-tional parity conditions rarely hold in either the short ormedium term. There are often significant departures frompurchasing power parity, interest-rate differentials oftenfail to explain future exchange-rate changes, and the for-ward exchange rate has been found to be a poor predic-tor of the future spot exchange rate. Why study interna-tional parity conditions if they fail to hold? Actually, if inter-national parity conditions held at all times, there wouldbe no profitable arbitrage opportunities available for inter-national investors to exploit by moving capital from onemarket to another. It is only when international parity con-ditions fail to hold that profit opportunities from cross-border investments become available.
Ex Ante Purchasing Power Parity
According to ex ante purchasing power parity (PPP), the expectedchange in the spot exchange rate should equal the difference inexpected national inflation rates. Ex ante PPP tells us that a high-inflation country should see its currency depreciate and that alow-inflation country should see its currency appreciate over time.
Covered Interest-Rate Parity
According to the covered interest-rate parity condition, an invest-ment in a foreign-currency deposit completely hedged againstexchange-rate risk should yield exactly the same return as a com-parable domestic-currency deposit. Since a hedged foreign-cur-rency investment will have the same risk characteristics as a do-mestic-currency investment, we should expect the yield on thedomestic investment, iD, to equal the foreign interest rate, iF, lessthe forward discount, FD. Indeed, arbitrage should insure thatthis would always be the case. The empirical evidence in supportof covered interest-rate parity is quite robust.
Uncovered Interest-Rate Parity
According to the uncovered interest-rate parity (UIP) condition,the expected return on an uncovered foreign-currency investmentshould equal the expected return on a comparable domestic-cur-rency investment. The expected return on a domestic-currencyinvestment, iD, is known with certainty, while the expected returnon an uncovered foreign-currency investment, iF- e
e, is not knownwith certainty because the actual change in the exchange rate, e,may turn out to be different from the expected change in theexchange rate, ee. The UIP condition implies that investors do notneed to be compensated—in the form of a risk premium—fortaking on the risk that their expectations may prove to be wrong.In the absence of a risk premium, the yield spread between for-eign and domestic currency deposits, iF - iD, should adjust to equalthe expected change in the exchange rate, ee. The empirical evi-dence is not highly supportive of UIP in either the short or me-dium run.
e = p - pe e eF D
Expected Changein Exchange Rate
Foreign-Domestic ExpectedInflation
Differential
=
i - i = FDF D
Foreign-DomesticInterest-RateDifferential
ForwardDiscount
=
e = i - ieF D
Foreign-DomesticInterest-RateDifferential
ExpectedChange in
Exchange Rate=
International Parity Conditions—
The Building Blocks of Macro Exchange-Rate Modeling

DB Guide to Exchange-Rate Determination May 2002Deutsche Bank @
66 Deutsche Bank Foreign Exchange Research
Fisher Effect
According to the Fisher effect, the nominal interest rate, i,in a given country will equal the real interest rate, r, plusthe expected inflation rate, pe. If the real interest rate inthe foreign country is equal to the domestic real interestrate, rF = rD, then the yield spread between two countries,iF - iD, should equal the expected inflation differential be-tween the two countries, pF
e - pDe. Empirical evidence sug-
gests that real interest rates often differ among countries.Thus, nominal yield spreads will not necessarily reflect dif-ferences in national inflation rates.
Forward Rate as an Unbiased Predictor of the
Future Spot Rate
If covered interest-rate parity holds such that iF- iD=FD, anduncovered interest-rate parity holds such that ee= iF- iD, thenthe forward discount, FD, will equal the expected changein the spot exchange rate, ee. Empirical evidence suggests,however, that the forward exchange rate is a poor and bi-ased predictor of the future spot exchange rate.
International Parity Conditions—
How Spot Exchange Rates, Forward Exchange Rates,
and Interest Rates Are Linked Internationally
If all of the key international parity conditions held at alltimes, the expected change in the spot exchange ratewould equal (1) the forward discount, (2) the interest-ratedifferential, and (3) the expected inflation differential. Theseconditions will hold only in an ideal world. Empirical stud-ies actually reject most of the parity conditions (coveredinterest-rate parity being the exception). There are oftenlarge and persistent deviations from PPP and UIP, and theforward exchange rate has been found to be both a poorand a biased predictor of the future spot rate. When theseparity conditions fail to hold, profitable investment oppor-tunities become available.
e = FDe
ForwardDiscount
ExpectedChange in
Exchange Rate=
i - i = p - pF D F De e
Foreign-DomesticInterest-RateDifferential
=Foreign-Domestic
ExpectedInflation
Differential
ExpectedChange in
Exchange Rateee
Foreign-Domestic ExpectedInflation
Differentialp - pF D
e e
Foreign-DomesticInterest-RateDifferential
i - iF D
ForwardDiscount
FD
e = p - pe e eF D
i - i = FDF D
e = i - ieF D
i - i = p - pF D F De e
e = FDe

DB Guide to Exchange-Rate DeterminationMay 2002 Deutsche Bank @
Deutsche Bank Foreign Exchange Research 67
Derivation of the Real Interest-Rate Differential Model
of Exchange-Rate Determination
(1) ee$ = iF - iUS Uncovered Interest-Rate Parity
(2) ee$ = qe
$ - (peF - p
eUS) Ex Ante Purchasing Power Parity
(3) qe$ = (iF - p
eF ) - (iUS - p
eUS) (2) minus (1)
(4) qe$ = rF - rUS Real Interest-Rate Parity
(5) qe$ = q$ - q$ Long-Run Exchange-Rate Adjustment
(6) q$ - q$ = rF - rUS Combine (4) and (5)
(7) q$ = q$ + (rUS - rF) RID Model
(8) q$ = q$ + (rUS - rF) - (φUS - φF) Extended RID Model
International capital flows have become increasingly mo-bile in the past 20 years as barriers to cross-border move-ments of capital have been gradually lifted in most mar-kets. As cross-border capital flows have risen in importance,interest-rate differentials have come to play a more impor-tant role in the determination of exchange rates. Indeed,empirical evidence has shown that relative current-accounttrends have become less important in explaining exchange-rate movements in the past two decades, while interest-rate differentials have become more important.
To analyze the role that interest-rate differentials play inthe determination of exchange rates, many internationaleconomists use the real interest-rate differential (RID)model as their principal analytical tool. The RID model is aformal model that links the trend in real exchange rates tothe trend in real interest-rate differentials.
The RID model is fairly simple to derive. If it is assumedthat both uncovered interest-rate parity (equation 1) andex ante purchasing power parity (equation 2) hold in thelong run, then the expected long-run change in the dollar's
real value will equal the real long-term yield spread (equa-tions 3 and 4). If it is assumed that the expected change inthe dollar’s real value in the long run equals the differencebetween the dollar’s actual real value and its long-run equi-librium level (equation 5), it can then be shown in equation7 that the dollar's actual real value, q$, can be expressedas a function of two key variables—the dollar's real long-run equilibrium value, q$, and the real long-term interest-rate differential, rUS-rF. According to this model, the dollar'sreal value would rise if there were an upward revision inthe market's assessment of the dollar's real long-run equi-librium value and/or if there were a rise in the U.S./foreignreal long-term interest-rate differential.
The RID model can be extended to incorporate shifts inrisk premiums on U.S., φUS, and foreign assets, φF. The ex-tended model is shown in equation 8, where a rise in therisk premium on U.S. assets tends to exert downward pres-sure on the dollar’s value, while a rise in the risk premiumon foreign assets tends to exert upward pressure on thedollar’s value.
The Real Interest-Rate Differential Model
of Exchange-Rate Determination
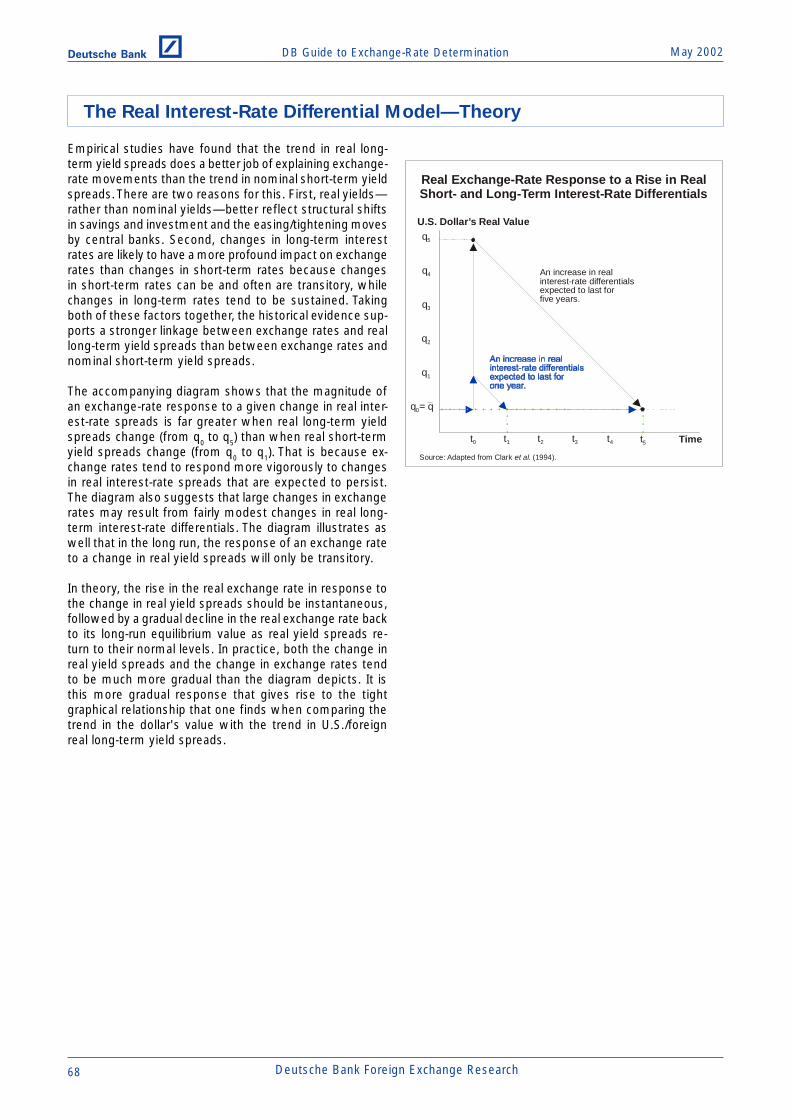
DB Guide to Exchange-Rate Determination May 2002Deutsche Bank @
68 Deutsche Bank Foreign Exchange Research
Empirical studies have found that the trend in real long-term yield spreads does a better job of explaining exchange-rate movements than the trend in nominal short-term yieldspreads. There are two reasons for this. First, real yields—rather than nominal yields—better reflect structural shiftsin savings and investment and the easing/tightening movesby central banks. Second, changes in long-term interestrates are likely to have a more profound impact on exchangerates than changes in short-term rates because changesin short-term rates can be and often are transitory, whilechanges in long-term rates tend to be sustained. Takingboth of these factors together, the historical evidence sup-ports a stronger linkage between exchange rates and reallong-term yield spreads than between exchange rates andnominal short-term yield spreads.
The accompanying diagram shows that the magnitude ofan exchange-rate response to a given change in real inter-est-rate spreads is far greater when real long-term yieldspreads change (from q0 to q5) than when real short-termyield spreads change (from q0 to q1). That is because ex-change rates tend to respond more vigorously to changesin real interest-rate spreads that are expected to persist.The diagram also suggests that large changes in exchangerates may result from fairly modest changes in real long-term interest-rate differentials. The diagram illustrates aswell that in the long run, the response of an exchange rateto a change in real yield spreads will only be transitory.
In theory, the rise in the real exchange rate in response tothe change in real yield spreads should be instantaneous,followed by a gradual decline in the real exchange rate backto its long-run equilibrium value as real yield spreads re-turn to their normal levels. In practice, both the change inreal yield spreads and the change in exchange rates tendto be much more gradual than the diagram depicts. It isthis more gradual response that gives rise to the tightgraphical relationship that one finds when comparing thetrend in the dollar's value with the trend in U.S./foreignreal long-term yield spreads.
Real Exchange-Rate Response to a Rise in RealShort- and Long-Term Interest-Rate Differentials
U.S. Dollar’s Real Value
Time
q2
Source: Adapted from Clark . (1994).et al
q1
t0 t1 t2 t3 t4 t5
q = q0
q3
q4
q5
An increase in realinterest-rate differentialsexpected to last forfive years.
The Real Interest-Rate Differential Model—Theory

DB Guide to Exchange-Rate DeterminationMay 2002 Deutsche Bank @
Deutsche Bank Foreign Exchange Research 69
The trend in real long-term interest-rate differentials hasplayed a pivotal role in driving the dollar's value versus theDeutschemark in the past few decades (as shown belowin the charts of the various periods).
The decline of the dollar in the late 1970s, the rise of thedollar in the first half of the 1980s, and the dollar's declineafter 1985 can be attributed to changes in U.S./Germanreal long-term yield spreads.
Over the 1993-98 period, an adverse shift in real yieldspreads led to the dollar's decline in 1994-95, while thedollar's rise in 1995-98 can be attributed to a shift in theU.S./German real yield spread that was favorable to thedollar.
In the 1999-2000 period, the relationship broke down whenthe trend in Deutschemark (now the euro) completely di-verged from the trend in the U.S./German (now the U.S./European) real long-term yield spread. Although real yieldspreads moved against the U.S., the dollar neverthelesssurged against the euro, with the dollar’s gains likely at-tributable to a rise in the dollar’s real long-run equilibriumlevel.
We believe that the breakdown in the real yield spread/exchange rate linkage in 1999-2000 will prove to be only atemporary phenomenon. The indications are now that thereal-interest-rate-spread/exchange-rate linkage has been re-established in 2001-02.
The Real Interest-Rate Differential Model—Evidence
DM/US$ Exchange Rate and U.S./GermanReal Interest-Rate Differentials(10-Year Bond Yields Less CPI, 1977-1990)
-800
-600
-400
-200
0
200
400
600
1.00
1.50
2.00
2.50
3.00
3.50
77 78 79 80 81 82 83 84 85 86 87 88 89 90
U.S. Less German Real Interest Rates(bp)----DM/US$____
DM/US$ Exchange Rate and U.S./GermanReal Interest-Rate Differentials
(10-Year Bond Yields Less CPI, 1993-June 1999)
-300
-200
-100
0
100
200
1.30
1.40
1.50
1.60
1.70
1.80
1.90
2.00
1993 1994 1995 1996 1997 1998 1999
U.S. Less German Real Interest Rates(bp)----DM/US$____
DM/US$ Exchange Rate and U.S./GermanReal Interest-Rate Differentials
(10-Year Bond Yields Less CPI, July 1999-2000)
-120
-100
-80
-60
-40
-20
0
20
1.80
1.90
2.00
2.10
2.20
Jul-99 Oct-99 Jan-00 Apr-00 Jul-00
U.S. Less German Real Interest Rates(bp)----DM/US$____
DM/US$ Exchange Rate and U.S./GermanReal Interest-Rate Differentials
(10-Year Bond Yields Less CPI, Aug. 2000-2002)
-150
-100
-50
0
50
100
150
2.05
2.10
2.15
2.20
2.25
2.30
2.35
Aug-00 Nov-00 Feb-01 May-01 Aug-01 Nov-01 Feb-02
U.S. Less German Real Interest Rates(bp)----DM/US$____
Source: Datastream Source: Datastream
Source: Datastream Source: Datastream

DB Guide to Exchange-Rate Determination May 2002Deutsche Bank @
70 Deutsche Bank Foreign Exchange Research
To many FX market participants, 2001 was a highly un-usual year. The Federal Reserve cut short-term interestrates from 6.5% to 1.75% and U.S./foreign short-term yieldspreads narrowed dramatically, yet the dollar remainedremarkably resilient. This has led some observers to ques-tion whether the old rules for FX forecasting still apply.Indeed, some observers have tried to redefine the linkagebetween interest rates and exchange rates by arguing thatlower interest rates may, in fact, be positive for a currencyif they raise expectations of future economic growth inboth absolute and relative terms.
From an historical vantage point, 2001 does not appear tobe that unusual. Indeed, 2001 is not the first time thatnominal U.S. short-term interest rates and the dollar's valuehave moved in opposite directions. Consider the Fed tight-ening episodes of 1972-74, 1977-80, 1986-88, and 1994-95. In all of those cases, the dollar actually fell, and in mostcases, quite sharply.
Nominal Short-Term Yields and the Dollar’s Value
The Dollar & U.S. Short-Term Interest Rates(January 1972-August 1974)
4
6
8
10
12
14
16
2.20
2.40
2.60
2.80
3.00
3.20
3.40
1972 1973 1974
3-Month Euro-$ Rate(%)----DM/US$____
The Dollar & U.S. Short-Term Interest Rates(January 1977-March 1980)
0
5
10
15
20
25
1.60
1.80
2.00
2.20
2.40
2.60
1977 1978 1979 1980
3-Month Euro-$ Rate(%)----DM/US$____
The Dollar & U.S. Short-Term Interest Rates(August 1986-December 1988)
5
6
7
8
9
10
1.60
1.70
1.80
1.90
2.00
2.10
1986 1987 1988
3-Month Euro-$ Rate(%)----DM/US$____
The Dollar & U.S. Short-Term Interest Rates(1994-1995)
3
4
5
6
7
1.30
1.40
1.50
1.60
1.70
1.80
1994 1995
3-Month Euro-$ Rate(%)----DM/US$____
Source: Datastream Source: Datastream
Source: Datastream Source: Datastream
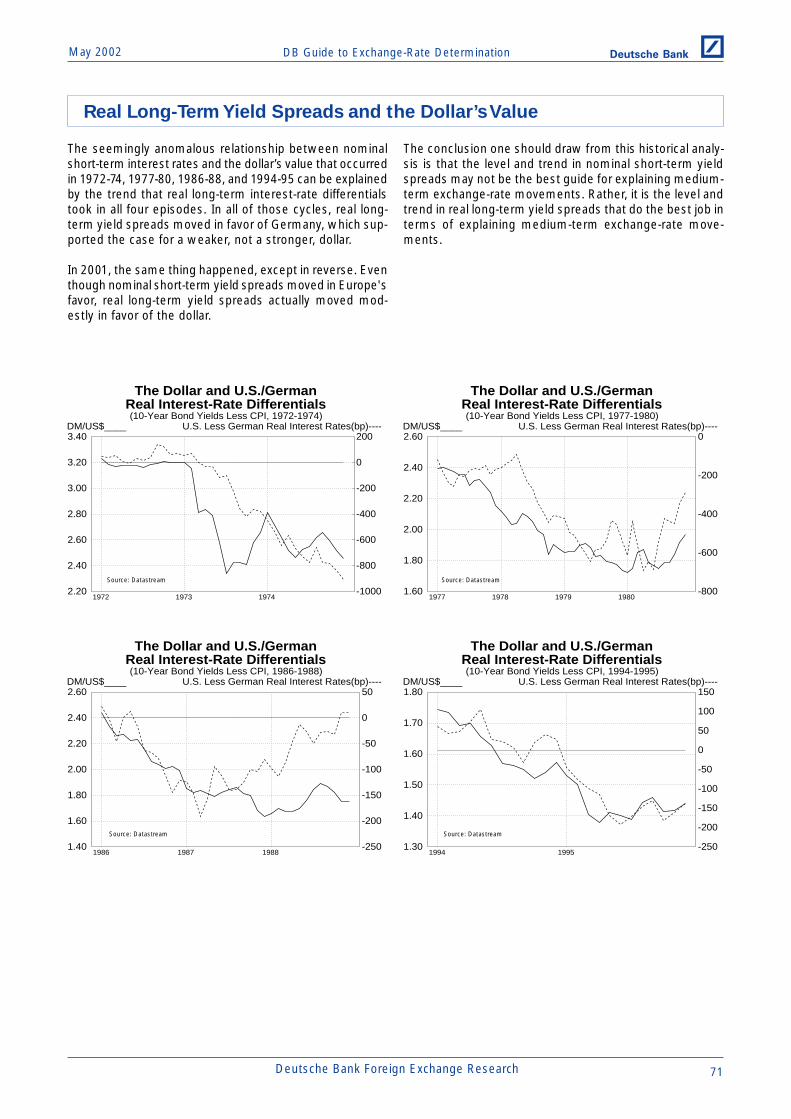
DB Guide to Exchange-Rate DeterminationMay 2002 Deutsche Bank @
Deutsche Bank Foreign Exchange Research 71
The seemingly anomalous relationship between nominalshort-term interest rates and the dollar’s value that occurredin 1972-74, 1977-80, 1986-88, and 1994-95 can be explainedby the trend that real long-term interest-rate differentialstook in all four episodes. In all of those cycles, real long-term yield spreads moved in favor of Germany, which sup-ported the case for a weaker, not a stronger, dollar.
In 2001, the same thing happened, except in reverse. Eventhough nominal short-term yield spreads moved in Europe'sfavor, real long-term yield spreads actually moved mod-estly in favor of the dollar.
The conclusion one should draw from this historical analy-sis is that the level and trend in nominal short-term yieldspreads may not be the best guide for explaining medium-term exchange-rate movements. Rather, it is the level andtrend in real long-term yield spreads that do the best job interms of explaining medium-term exchange-rate move-ments.
Real Long-Term Yield Spreads and the Dollar’s Value
The Dollar and U.S./GermanReal Interest-Rate Differentials(10-Year Bond Yields Less CPI, 1972-1974)
-1000
-800
-600
-400
-200
0
200
2.20
2.40
2.60
2.80
3.00
3.20
3.40
1972 1973 1974
U.S. Less German Real Interest Rates(bp)----DM/US$____
The Dollar and U.S./GermanReal Interest-Rate Differentials(10-Year Bond Yields Less CPI, 1977-1980)
-800
-600
-400
-200
0
1.60
1.80
2.00
2.20
2.40
2.60
1977 1978 1979 1980
U.S. Less German Real Interest Rates(bp)----DM/US$____
The Dollar and U.S./GermanReal Interest-Rate Differentials(10-Year Bond Yields Less CPI, 1986-1988)
-250
-200
-150
-100
-50
0
50
1.40
1.60
1.80
2.00
2.20
2.40
2.60
1986 1987 1988
U.S. Less German Real Interest Rates(bp)----DM/US$____
The Dollar and U.S./GermanReal Interest-Rate Differentials(10-Year Bond Yields Less CPI, 1994-1995)
-250
-200
-150
-100
-50
0
50
100
150
1.30
1.40
1.50
1.60
1.70
1.80
1994 1995
U.S. Less German Real Interest Rates(bp)----DM/US$____
Source: Datastream Source: Datastream
Source: Datastream Source: Datastream
DB Guide to Exchange-Rate Determination May 2002Deutsche Bank @
72 Deutsche Bank Foreign Exchange Research
Numerous academic papers have investigated empiricallywhether the forward exchange rate has served as a reli-able unbiased predictor of the future spot exchange rate.The forward-rate predictor hypothesis is usually tested byregressing the change in the exchange rate, et+k, on theforward discount, FDt,k:
et+k = a + ß (FDt,k)
If the forward exchange rate were an unbiased predictorof the future spot rate, estimates of the regression coeffi-cient, beta (ß), would be equal to 1.0. If ß = 1.0, then et+kwould be expected to equal FDt,k, on average, over time.
Interestingly, the academic evidence strongly rejects thehypothesis that the forward exchange rate is an unbiasedpredictor of the future spot exchange rate, with estimatesof ß that are often significantly less than one. Indeed, ßhas often been found to be less than zero. In a survey of75 published papers on the forward rate predictor hypoth-esis, the average estimate of ß was found to be - 0.88.
This startling finding has the following implication for cur-rency investment strategies. Currencies that trade at a for-ward discount, on average, weaken less than the amountimplied by the forward discount. If anything, there has beena tendency for such currencies to appreciate, not depreci-ate, over time. This means that the forward discount hasbeen a biased predictor of future changes in the spot ex-change rate. Hence, the term "forward discount bias." Theopposite applies for currencies that trade at a forward pre-mium. From a strategy standpoint, if these findings on pastperformance were to remain valid in the future, investorswould stand to benefit by over-weighting currencies thattrade at a forward discount and under-weighting curren-cies that trade at a forward premium.
Various interpretations have been offered to explain theseanomalous findings. One view holds that currencies thattrade at a forward discount are more risky than those thattrade at a forward premium. Hence, investors demand ahigher risk premium to buy and hold such currencies, andthe excess return earned by investing in such currenciesmerely represents the reward for accepting higher risk.Another view holds that the market simply makes repeatedexpectational errors, and that investors could exploit thisby trading against the implicit views expressed in the for-ward exchange market.
Although excess returns could have been earned in thepast by investors who sought to exploit the "bias" in theforward discount, the risk/return tradeoff is not always at-tractive for such strategies. Monthly returns can be andoften are quite volatile for single-currency trades. In fact,single-currency trading strategies have not been attractiveenough to justify risking large sums to trade the bias. (Asingle-currency strategy consists of buying, or going long,only the highest yielding currency, i.e., the currency withthe largest forward discount, and funding it by borrowing(or going short) only the lowest yielding currency, i.e., thecurrency with the largest forward premium.)
Risk-adjusted excess returns from following diversifiedmulti-currency approaches to exploit the bias, however,have been more impressive. Adopting a diversified strat-egy of going long the three highest-yielding currencies inthe industrial world and funding that position by going shortthe three lowest-yielding currencies has yielded estimatedSharpe ratios averaging 0.7-0.8 for dollar, euro, and yen-based investors. That is nearly double the Sharpe ratiosgenerated by buying and holding the shares of the S&P500 index. This basket approach to trading the forward dis-count bias is the bedrock of Deutsche Bank's Forward-Rate Bias trading system.
Forward-Rate Bias

DB Guide to Exchange-Rate DeterminationMay 2002 Deutsche Bank @
Deutsche Bank Foreign Exchange Research 73
Our favorite approach to trading the forward-rate bias is toadopt a diversified strategy to exploit the fact that curren-cies trading at a forward discount tend to outperform thosecurrencies trading at a forward premium. The 11 curren-cies that we include in our trading system are the U.S.dollar, euro, Japanese yen, Swiss franc, British pound,Canadian dollar, Australian dollar, New Zealand dollar, Dan-ish krone, Norwegian krone, and Swedish krona. Our in-vestment approach is straightforward: we recommendgoing long the three highest-yielding currencies in the in-dustrial world and going short the three lowest-yieldingcurrencies in the industrial world. Net long/short positionsare put on at the beginning of each month and then closedat the end of each month. This process is repeated eachmonth over time.
The table below shows how our monthly recommenda-tions for long and short currency positions for the 11 in-dustrial country currencies can vary over time. At the be-ginning of 2001, a high-yield/low-yield currency investmentstrategy would have favored being long the Norwegiankrone, New Zealand dollar, and U.S. dollar, and being shortthe Swedish krona, Swiss franc, and Japanese yen. Bythe end of 2001, with U.S. yields having fallen below thosein most other markets, this strategy shifted in favor of be-ing long the Norwegian krone, New Zealand dollar, andAustralian dollar, and short the Swiss franc, U.S. dollar, andJapanese yen.
Recommended Long and Short Positions versus the U.S. Dollar
from Adhering to Long High-Yielders/Short Low-Yielders Currency-Investment Strategy(January 2001-April 2002)
Month AUD CAD DKK EUR JPY NZD NOK SEK CHF GBP USD
Jan-01 - - - - short long long short short - long
Feb-01 - - - - short long long short short long -Mar-01 - - - - short long long short short long -
Apr-01 - - - - short long long short short long -May-01 - - - - short long long short short long -
Jun-01 - - - - short long long - short long short
Jul-01 - - - - short long long - short long shortAug-01 - - - - short long long - short long shortSep-01 - - - - short long long - short long short
Oct-01 - - - - short long long - short long shortNov-01 long - - - short long long - short - shortDec-01 long - - - short long long - short - short
Jan-02 long - - - short long long - short - shortFeb-02 long - - - short long long - short - shortMar-02 long - - - short long long - short - short
Apr-02 long - - - short long long - short - shortMay-02 - - - - short long long long short - short
Note: Datastream is the source of the underlying data.
Trading the Bias
Three-Month Nominal Interest Rates(as of December 31, 2000)
0.6
3.4
4.1
4.95.3
5.75.86.16.36.5
7.4
0
2
4
6
8
Norway N.Z. U.S.Aust. U.K.
CanadaDenmark Euro
SwedenSwitzerland
Japan
(%) 3-Month Euro-Deposit Rates
Three-Month Nominal Interest Rates(as of December 31, 2001)
0.1
1.81.82.1
3.33.6
3.84.04.2
4.8
6.5
0
1
2
3
4
5
6
7
Norway N.Z.Aust. U.K.
SwedenDenmark Euro
CanadaSwitzerland U.S.
Japan
(%) 3-Month Euro-Deposit Rates
Source: Datastream Source: Datastream
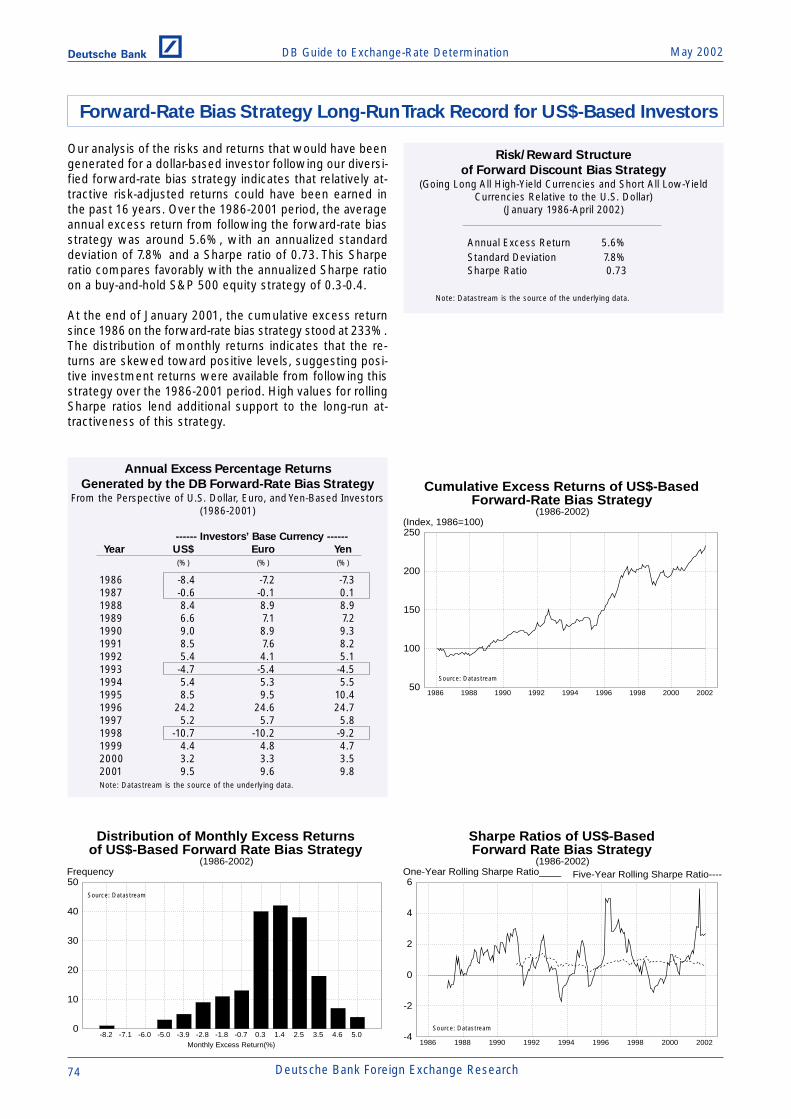
DB Guide to Exchange-Rate Determination May 2002Deutsche Bank @
74 Deutsche Bank Foreign Exchange Research
Our analysis of the risks and returns that would have beengenerated for a dollar-based investor following our diversi-fied forward-rate bias strategy indicates that relatively at-tractive risk-adjusted returns could have been earned inthe past 16 years. Over the 1986-2001 period, the averageannual excess return from following the forward-rate biasstrategy was around 5.6%, with an annualized standarddeviation of 7.8% and a Sharpe ratio of 0.73. This Sharperatio compares favorably with the annualized Sharpe ratioon a buy-and-hold S&P 500 equity strategy of 0.3-0.4.
At the end of January 2001, the cumulative excess returnsince 1986 on the forward-rate bias strategy stood at 233%.The distribution of monthly returns indicates that the re-turns are skewed toward positive levels, suggesting posi-tive investment returns were available from following thisstrategy over the 1986-2001 period. High values for rollingSharpe ratios lend additional support to the long-run at-tractiveness of this strategy.
Risk/Reward Structure
of Forward Discount Bias Strategy(Going Long All High-Yield Currencies and Short All Low-Yield
Currencies Relative to the U.S. Dollar)(January 1986-April 2002)
Annual Excess Return 5.6%Standard Deviation 7.8%Sharpe Ratio 0.73
Note: Datastream is the source of the underlying data.
Cumulative Excess Returns of US$-BasedForward-Rate Bias Strategy
(1986-2002)
50
100
150
200
250
1986 1988 1990 1992 1994 1996 1998 2000 2002
(Index, 1986=100)
Distribution of Monthly Excess Returnsof US$-Based Forward Rate Bias Strategy
(1986-2002)
0
10
20
30
40
50
-8.2 -7.1 -6.0 -5.0 -3.9 -2.8 -1.8 -0.7 0.3 1.4 2.5 3.5 4.6 5.0
Frequency
Monthly Excess Return(%)
Sharpe Ratios of US$-BasedForward Rate Bias Strategy
(1986-2002)
-4
-2
0
2
4
6
1986 1988 1990 1992 1994 1996 1998 2000 2002
Five-Year Rolling Sharpe Ratio----One-Year Rolling Sharpe Ratio____
Forward-Rate Bias Strategy Long-Run Track Record for US$-Based Investors
Annual Excess Percentage Returns
Generated by the DB Forward-Rate Bias StrategyFrom the Perspective of U.S. Dollar, Euro, and Yen-Based Investors
(1986-2001)
------ Investors’ Base Currency ------
Year US$ Euro Yen
(%) (%) (%)
1986 -8.4 -7.2 -7.31987 -0.6 -0.1 0.11988 8.4 8.9 8.91989 6.6 7.1 7.21990 9.0 8.9 9.31991 8.5 7.6 8.21992 5.4 4.1 5.11993 -4.7 -5.4 -4.51994 5.4 5.3 5.51995 8.5 9.5 10.41996 24.2 24.6 24.71997 5.2 5.7 5.81998 -10.7 -10.2 -9.21999 4.4 4.8 4.72000 3.2 3.3 3.52001 9.5 9.6 9.8Note: Datastream is the source of the underlying data.
Source: Datastream
Source: Datastream
Source: Datastream

DB Guide to Exchange-Rate DeterminationMay 2002 Deutsche Bank @
Deutsche Bank Foreign Exchange Research 75
Empirical evidence indicates that in the very long run, thecumulative returns on dollar-denominated and foreign-cur-rency-denominated short-term fixed-income instrumentsare broadly the same. That is, high-yield markets have seentheir currencies weaken over time, while low-yield mar-kets have seen their currencies strengthen over time.
Indeed, consider the economic consequences if the cu-mulative returns on a persistently high-yielding marketexceeded the cumulative returns on a persistently low-yielding market. One market could consistently outperformanother market only if (1) its real yields were consistentlyhigher, which would dampen that country's long-run growthprospects, or (2) its currency became progressively moreovervalued on a PPP basis, which would dampen thecountry's long-run trade competitiveness. Eventually, a de-terioration in growth and/or competitiveness would giverise to corrective moves on the interest-rate and/or ex-change-rate fronts that would erase the cumulative excessreturns. As shown below, the cumulative returns of U.S.and foreign money-market instruments in U.S. dollar termswere virtually the same for the 1990-1999 period.
How, then, do forward-rate bias strategies generate suchattractive risk-adjusted excess returns? The answer is thatin the industrialized world, individual markets often tradeplaces with other markets in terms of which market hasthe highest or lowest yield. When currency A's yield risesabove currency B's yield, the widening of the A-B yieldspread will likely contribute to a rise in currency A's value.When currency A's yield begins to fall relative to currencyB's yield, downward pressure on currency A is likely tomaterialize. The forward-rate bias strategy would gener-ate excess returns if an investor went long currency A whenits yields rose above currency B's, and would also gener-ate excess returns if that investor went short currency Awhen its yields fell below currency B's, as long as the ex-change rate moved in sympathy with the A-B yield spread.Thus, the forward-rate strategy could generate significantexcess returns, even though the cumulative returns oncurrencies A and B might be the same in the long run.
World Money-Market Performance(in US$ terms)
80
100
120
140
160
180
200
1990 1991 1992 1993 1994 1995 1996 1997 1998 1999 2000
U.S.---- (Index) Non-US____
Source: Salomon Bothers Money Market Indices
Forward-Rate Bias—The Economic Rationale

DB Guide to Exchange-Rate Determination May 2002Deutsche Bank @
76 Deutsche Bank Foreign Exchange Research
The monetary, fiscal, external, and financial-sector shocksthat hit Japan in 1995-98 were all largely yen-negative. Asthe yen steadily weakened, investors became increasinglyconfident that the yen's path was essentially a one-waystreet, which encouraged fund managers to take on ag-gressive long-dollar/short-yen positions. As the yen weak-ened on a trend basis for 3½ straight years, consistentlyremaining above its 60-week moving average, and withthe U.S./Japan short-term yield spread averaging around500 basis points, the "Yen Carry Trade" (borrowing in yento invest in dollar-denominated securities) became enor-mously popular.
The yen carry trade generated large and persistent excessreturns over the April 1995-August 1998 period. While it isdifficult to quantify precisely how large the outstandingpositions were at their peak, BIS data on foreign-exchangemarket turnover suggest that the yen carry trades wereprobably quite sizable, given that the yen's share of totalforeign-exchange turnover rose substantially between 1995and 1998. As the BIS notes, "Between 1995 and 1998, thevalue of transactions involving the Japanese currency (atconstant exchange rates) had grown at twice the rate ofthose involving the U.S. dollar or the Deutschemark, and60% faster than global market turnover."
Excessive optimism or pessimism can often carry an ex-change rate to extreme levels, and such was the case forthe yen. The popularity of the yen carry trade had pushedthe dollar into substantial overbought territory versus theyen by the summer of 1998.
Undervalued and oversold, the yen was, in retrospect, ripefor a corrective move upward. Although Japan's fundamen-tal backdrop had not improved much, the existence of largehighly leveraged positions in the yen carry trade by thespeculative community raised the risk that a sudden un-winding of those positions could drive the yen's value upsharply. When the Russian debt crisis hit in the summer of1998, investors around the world felt compelled to unwindall highly leveraged fixed-income and currency positions,including the yen carry trade.
U.S./Japanese Short-Term Interest-Rate Spread(Three-Month Euro-Deposit Rates)
(1995-2002)
100
200
300
400
500
600
700
1995 1996 1997 1998 1999 2000 2001 2002
(Basis Points)
During the ensuing melee, the yen carry trade became avictim of the global deleveraging process. The dollar fell by9% versus the yen between August 31 and September 7,1998, and then fell an additional 12% October 6-8 as highlyleveraged long-dollar/short-yen positions were aggressivelyunwound. From a peak of ¥/US$ 147 on August 11, 1998,the dollar had fallen by 34 big figures in just two months toa low of ¥/US$ 113 on October 16, 1998.
Huge losses were incurred during the dollar sell-off of 1998,which highlights the risks of taking on leveraged positionsin carry trades. However, from a long-run perspective, thecumulative excess returns on the yen-carry strategy havebeen fairly attractive, despite those losses. Indeed, therehave been only two periods (the shaded areas in the chartbelow) when the long-dollar/short-yen carry trade has suf-fered brief, albeit large, short-run losses since April 1995.Note that the cumulative excess returns from followingthis strategy have now surpassed those recorded just be-fore the unwinding of the yen carry trade in 1998.
Forward-Rate Bias Strategy Opportunities and Pitfalls—
The Case of the Yen Carry Trade
Source: Datastream
Source: Datastream
Source: Datastream

DB Guide to Exchange-Rate DeterminationMay 2002 Deutsche Bank @
Deutsche Bank Foreign Exchange Research 77
Conventional wisdom holds that countries that run persis-tent current-account surpluses will see their currenciesappreciate over time, while countries that run persistentcurrent-account deficits will see their currencies depreci-ate over time.
Current-account imbalances can affect exchange ratesthrough a variety of channels. First, the existence of majorexternal imbalances can influence the flow supply of anddemand for individual currencies and thereby directly in-fluence the paths that exchange rates take.
Second, major current-account imbalances can shift theresidence of financial wealth among deficit and surplusnations, decreasing it in the former and raising it in thelatter. Such shifts in the residence of financial wealth couldthen lead to a shift in global asset preferences, which, inturn, could influence the paths that exchange rates take.
Third, there is a general notion that there exists some limiton the ability of countries to run sizeable and persistentcurrent-account deficits, because such deficits could leadto an unending rise in debt owed by deficit countries toforeign investors. If foreign investors view the rise in ex-ternal debt as unsustainable, they would reason that atsome point, a major depreciation of the deficit country'scurrency might be required to ensure that the current-ac-count deficit narrowed and that the external debt stabi-lized at a level deemed sustainable.
In such a manner, the existence of a large current-accountimbalance will tend to alter the market's notion of whatlevel of the exchange rate constitutes a currency's real long-run equilibrium value, with ever-larger deficits and externaldebt levels giving rise to steady, downward revisions inmarket expectations of the real long-run equilibrium ex-change rate.
Current Account Imbalances and Exchange Rates—The Channels of Influence
FlowSupply and Demandfor Foreign Exchange
ExchangeRate
Transfer of Wealthfrom Deficit
to Surplus Countries
ExternalDebt
Sustainability
CurrentAccount
Imbalance
Current-Account Imbalances and the Determination of Exchange Rates

DB Guide to Exchange-Rate Determination May 2002Deutsche Bank @
78 Deutsche Bank Foreign Exchange Research
Most market participants view U.S. current-account trendsas important for the dollar because such trends directlyinfluence the flow supply of and demand for dollars in theforeign-exchange market. Using the traditional balance-of-payments flow model of exchange-rate determination, wecan describe how current-account flows determine thesupply of and demand for dollars.
Let's assume that the flow demand for dollars, D$, is gen-erated by foreign demand for U.S. goods and services,while the flow supply of dollars, S$, is generated by U.S.demand for foreign goods and services. If current-accountflows determine the supply of and demand for dollars, thenit should be the case that when the U.S. current-accountbalance is in equilibrium, the supply of and demand fordollars will be in equilibrium as well. In terms of the dia-gram below, the dollar's equilibrium value, q0, would bedetermined by the intersection of the supply, S$, and de-mand, D$, curves for dollars.
Balance-of-Trade Flow Modelof Exchange-Rate Determination
Dollar’s Value
Quantity ofDollars
D$
S$
q0
A Bq1
QA QB
C
If, however, the U.S. were running a current-account defi-cit, perhaps because the value of the dollar was too highat q1 relative to its equilibrium value, q0, then the supply ofdollars, S$, on the foreign-exchange market would exceedthe demand for dollars, D$. The excess supply of dollars,which is the foreign-exchange market counterpart of theU.S. current-account deficit, is represented as the gap be-tween points A and B. The dollar's value at q1 would clearlynot be sustainable since the excess supply of dollars, AB,on the foreign-exchange market would exert continualdownward pressure on the dollar's value. Once the dollar'svalue falls toward its long-run equilibrium value, q0, thesupply of dollars would be brought back into line with thedemand for dollars, and the U.S. current account would bebrought back into balance at point C.
Balance of Payments Flow Model of Exchange-Rate Determination

DB Guide to Exchange-Rate DeterminationMay 2002 Deutsche Bank @
Deutsche Bank Foreign Exchange Research 79
The traditional balance-of-payments flow model posits thatexchange rates will adjust until all current-account imbal-ances are corrected and current-account equilibrium is re-stored. How much exchange rates must adjust to restorecurrent-account equilibrium depends on the elasticities ofthe supply and demand curves for foreign exchange.
In the accompanying diagram, we plot two sets of supplyand demand curves for dollars—one set that is highly elas-tic (Se
$ and De$, respectively) and another set that is highly
inelastic (Si$ and Di
$, respectively). Initially, it is assumedthat the U.S. is running a current-account deficit equal toAB at the prevailing exchange rate, q1. The exchange-ratechange necessary to correct the U.S. current-account im-balance will differ depending on whether the prevailingsupply and demand curves for dollars are highly elastic orinelastic.
Elasticities of Supply and Demandfor Dollars and
Exchange-Rate Determination
Exchange Rate
Quantity ofDollars
De$
A B
QA QE QB
q1
Se$
Si$
Di$
C
C´
q0
q2
If the supply and demand curves for dollars were highlyelastic, only a modest decline in the dollar's value to q0would be required to restore equilibrium to the U.S. cur-rent account. If, instead, the supply and demand curvesfor dollars were highly inelastic, a large decline in the dol-lar to q2 would be required to restore equilibrium to theU.S. current account.
U.S. export and import price elasticities are estimated tobe quite small, perhaps averaging only around -1.0 for ex-ports and -0.3 for imports. Based on these rather low elas-ticities, it would likely require a rather large depreciation ofthe dollar to restore a sizeable U.S. current-account deficitto a more sustainable level. Thus, the inelastic supply anddemand curves shown below may be a more realistic pic-ture of the potentially large dollar adjustment that mightbe required to restore equilibrium to the U.S. current-ac-count balance.
Trade Elasticities and the Exchange-Rate/Trade-Balance
Adjustment Process

DB Guide to Exchange-Rate Determination May 2002Deutsche Bank @
80 Deutsche Bank Foreign Exchange Research
The dramatic appreciation of the dollar over the 1995-2001period despite a record deterioration of the U.S. currentaccount is clear evidence that a current-account deficit neednot be bearish for a currency. Indeed, the same thing hap-pened in the first half of the 1980s when the dollar soared,yet the current-account deficit steadily widened.
Current-account imbalances are typically driven by struc-tural changes in international competitiveness, changes inthe terms of trade, and long-term shifts in national sav-ings-investment (S-I) balances. Consider the impact onexchange rates and the current account if a country under-went a major investment boom or undertook a long-termpolicy of fiscal expansion. In both cases, the S-I schedulewould shift upward to the left. The increase in investmentrelative to national savings would result in a wider current-account deficit and, at the same time, put upward pres-sure on the real exchange rate. That is pretty much whathappened to the U.S. savings-investment balance, the cur-rent-account balance, and the dollar in both the 1980-85and 1995-2001 episodes. Hence, when the source of thedeterioration in the current-account balance is a rise in in-vestment relative to national savings, there is a high likeli-hood that the currency will strengthen over time, notweaken.
Current-Account/Exchange-Rate Linkages
and the Impact of Economic and Financial Disturbances
Economic Current Exchange
Conditions Account Rate Linkage
Expansionary Monetary Policy Deterioration Depreciation PositiveRestrictive Monetary Policy Improvement Appreciation Positive
Expansionary Fiscal Policy Deterioration Appreciation NegativeRestrictive Fiscal Policy Improvement Depreciation Negative
Exogenous Increase Improvement Appreciation Positivein Domestic Supply
Exogenous Increase Improvement Appreciation Positivein Foreign Demand
U.S. Savings-Investment Balanceand the Dollar
%
Savings minus Investment,Current-Account Balance
U.S. DollarReal Exchange Rate
“New Economy”Increase inInvestmentSpending
S-I2
$
CAB1
“New Economy”Upward Revision in theDollar’s Real Long-RunEquilibrium Value
q2
q1
(0)(-) (+)
S-I1
If the deterioration in a country's current-account balancewere instead due to a long-run deterioration in thatcountry's competitiveness, the CAB schedule would shiftdownward to the left relative to an unchanged S-I sched-ule. In such a case, the deterioration of the current ac-count would coincide with a long-term slide in the domes-tic currency’s real long-run equilibrium value.
The message from all this is that certain economic distur-bances may cause exchange rates and the current-accountbalance to move in the same direction while other distur-bances may cause exchange rates and the current accountto diverge. Consider the current-account/exchange-rate link-age that arises in response to fiscal and monetary policychanges. A country that pursues a highly expansionarymonetary policy will likely see its current account deterio-rate and its currency weaken at the same time. The ques-tion is whether the weakening of the currency is due tothe easier monetary policy or the current-account deterio-ration or possibly both. In the case of a highly expansion-ary fiscal policy, the trend in the current account and thetrend in the exchange rate may diverge as the current ac-count deteriorates while the currency appreciates.
Are Current-Account Deficits Necessarily Bearish for Exchange Rates?
U.S. Current-Account Deficit and the Dollar
$
Savings minus Investment,Current-Account Balance
U.S. DollarReal Exchange Rate
%
S-I
CAB2
CAB1
Downward Revision in theDollar’s Real Long-RunEquilibrium Value
Long-Run Deterioration inU.S. Trade Competitiveness
q1
q2
(0)(-) (+)
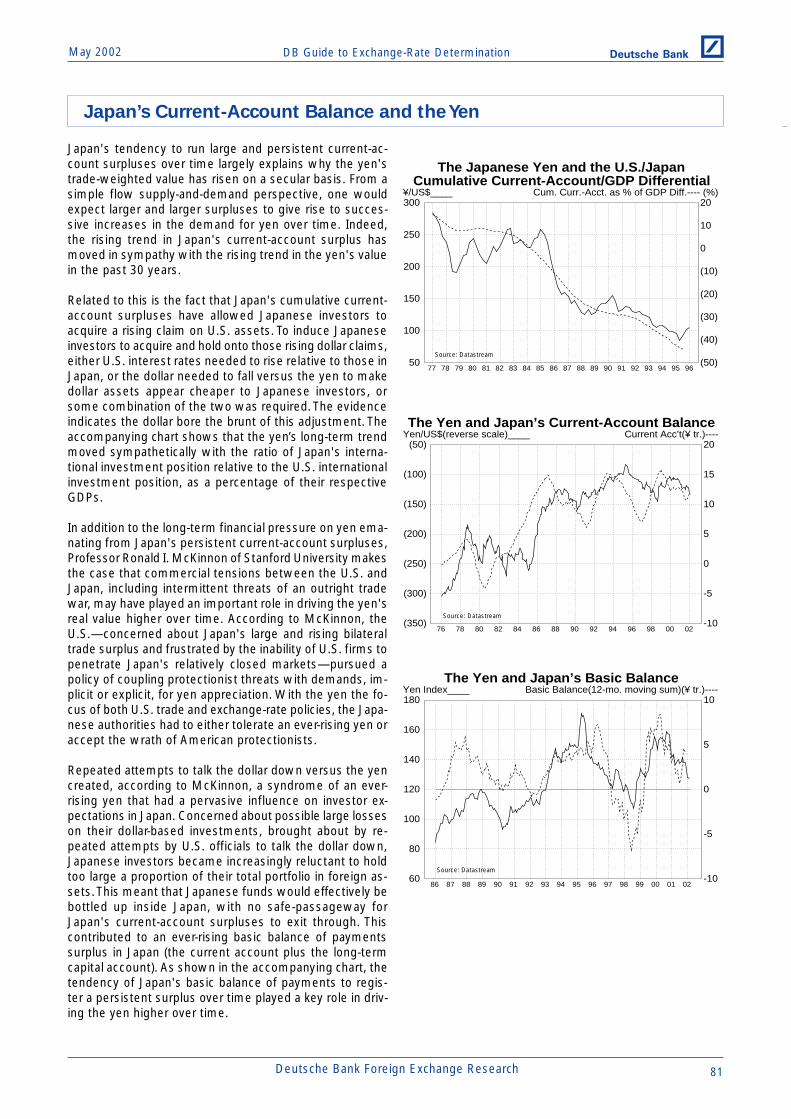
DB Guide to Exchange-Rate DeterminationMay 2002 Deutsche Bank @
Deutsche Bank Foreign Exchange Research 81
Japan's tendency to run large and persistent current-ac-count surpluses over time largely explains why the yen'strade-weighted value has risen on a secular basis. From asimple flow supply-and-demand perspective, one wouldexpect larger and larger surpluses to give rise to succes-sive increases in the demand for yen over time. Indeed,the rising trend in Japan's current-account surplus hasmoved in sympathy with the rising trend in the yen's valuein the past 30 years.
Related to this is the fact that Japan's cumulative current-account surpluses have allowed Japanese investors toacquire a rising claim on U.S. assets. To induce Japaneseinvestors to acquire and hold onto those rising dollar claims,either U.S. interest rates needed to rise relative to those inJapan, or the dollar needed to fall versus the yen to makedollar assets appear cheaper to Japanese investors, orsome combination of the two was required. The evidenceindicates the dollar bore the brunt of this adjustment. Theaccompanying chart shows that the yen’s long-term trendmoved sympathetically with the ratio of Japan's interna-tional investment position relative to the U.S. internationalinvestment position, as a percentage of their respectiveGDPs.
In addition to the long-term financial pressure on yen ema-nating from Japan's persistent current-account surpluses,Professor Ronald I. McKinnon of Stanford University makesthe case that commercial tensions between the U.S. andJapan, including intermittent threats of an outright tradewar, may have played an important role in driving the yen'sreal value higher over time. According to McKinnon, theU.S.—concerned about Japan's large and rising bilateraltrade surplus and frustrated by the inability of U.S. firms topenetrate Japan's relatively closed markets—pursued apolicy of coupling protectionist threats with demands, im-plicit or explicit, for yen appreciation. With the yen the fo-cus of both U.S. trade and exchange-rate policies, the Japa-nese authorities had to either tolerate an ever-rising yen oraccept the wrath of American protectionists.
Repeated attempts to talk the dollar down versus the yencreated, according to McKinnon, a syndrome of an ever-rising yen that had a pervasive influence on investor ex-pectations in Japan. Concerned about possible large losseson their dollar-based investments, brought about by re-peated attempts by U.S. officials to talk the dollar down,Japanese investors became increasingly reluctant to holdtoo large a proportion of their total portfolio in foreign as-sets. This meant that Japanese funds would effectively bebottled up inside Japan, with no safe-passageway forJapan's current-account surpluses to exit through. Thiscontributed to an ever-rising basic balance of paymentssurplus in Japan (the current account plus the long-termcapital account). As shown in the accompanying chart, thetendency of Japan's basic balance of payments to regis-ter a persistent surplus over time played a key role in driv-ing the yen higher over time.
The Japanese Yen and the U.S./JapanCumulative Current-Account/GDP Differential
(50)
(40)
(30)
(20)
(10)
0
10
20
50
100
150
200
250
300
77 78 79 80 81 82 83 84 85 86 87 88 89 90 91 92 93 94 95 96
Cum. Curr.-Acct. as % of GDP Diff.---- (%)¥/US$____
The Yen and Japan’s Current-Account Balance
-10
-5
0
5
10
15
20
(350)
(300)
(250)
(200)
(150)
(100)
(50)
76 78 80 82 84 86 88 90 92 94 96 98 00 02
Current Acc’t(¥ tr.)----Yen/US$(reverse scale)____
The Yen and Japan’s Basic Balance
-10
-5
0
5
10
60
80
100
120
140
160
180
86 87 88 89 90 91 92 93 94 95 96 97 98 99 00 01 02
Basic Balance(12-mo. moving sum)(¥ tr.)----Yen Index____
Japan’s Current-Account Balance and the Yen
Source: Datastream
Source: Datastream
Source: Datastream
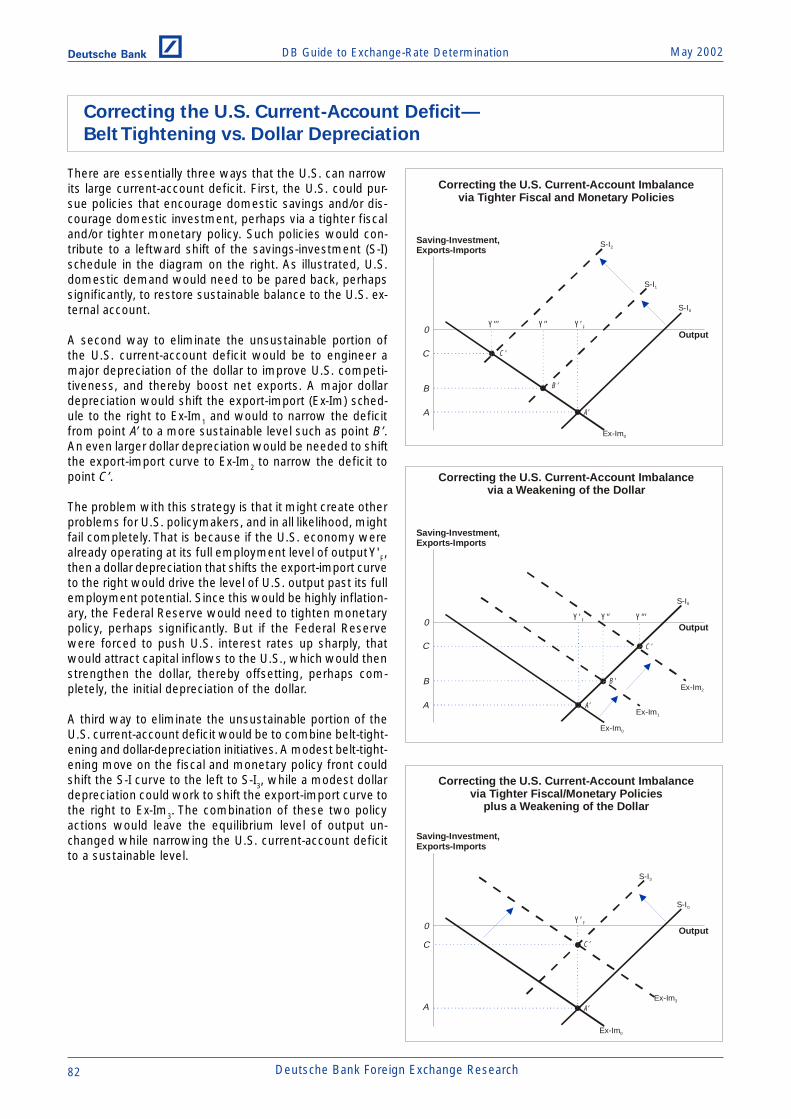
DB Guide to Exchange-Rate Determination May 2002Deutsche Bank @
82 Deutsche Bank Foreign Exchange Research
There are essentially three ways that the U.S. can narrowits large current-account deficit. First, the U.S. could pur-sue policies that encourage domestic savings and/or dis-courage domestic investment, perhaps via a tighter fiscaland/or tighter monetary policy. Such policies would con-tribute to a leftward shift of the savings-investment (S-I)schedule in the diagram on the right. As illustrated, U.S.domestic demand would need to be pared back, perhapssignificantly, to restore sustainable balance to the U.S. ex-ternal account.
A second way to eliminate the unsustainable portion ofthe U.S. current-account deficit would be to engineer amajor depreciation of the dollar to improve U.S. competi-tiveness, and thereby boost net exports. A major dollardepreciation would shift the export-import (Ex-Im) sched-ule to the right to Ex-Im1 and would to narrow the deficitfrom point A’ to a more sustainable level such as point B’.An even larger dollar depreciation would be needed to shiftthe export-import curve to Ex-Im2 to narrow the deficit topoint C’.
The problem with this strategy is that it might create otherproblems for U.S. policymakers, and in all likelihood, mightfail completely. That is because if the U.S. economy werealready operating at its full employment level of output Y'F,then a dollar depreciation that shifts the export-import curveto the right would drive the level of U.S. output past its fullemployment potential. Since this would be highly inflation-ary, the Federal Reserve would need to tighten monetarypolicy, perhaps significantly. But if the Federal Reservewere forced to push U.S. interest rates up sharply, thatwould attract capital inflows to the U.S., which would thenstrengthen the dollar, thereby offsetting, perhaps com-pletely, the initial depreciation of the dollar.
A third way to eliminate the unsustainable portion of theU.S. current-account deficit would be to combine belt-tight-ening and dollar-depreciation initiatives. A modest belt-tight-ening move on the fiscal and monetary policy front couldshift the S-I curve to the left to S-I3, while a modest dollardepreciation could work to shift the export-import curve tothe right to Ex-Im3. The combination of these two policyactions would leave the equilibrium level of output un-changed while narrowing the U.S. current-account deficitto a sustainable level.
Correcting the U.S. Current-Account Deficit—
Belt Tightening vs. Dollar Depreciation
Correcting the U.S. Current-Account Imbalancevia a Weakening of the Dollar
Output
Saving-Investment,Exports-Imports
C
B’
C’
S-I0
Ex-Im2
Ex-Im1
A’
B
A
Y’F Y’’ Y ’’’
Ex-Im0
0
Correcting the U.S. Current-Account Imbalancevia Tighter Fiscal/Monetary Policies
plus a Weakening of the Dollar
Output
Saving-Investment,Exports-Imports
C C’
S-I3
S-I0
Ex-Im3
A’A
Y’F
Ex-Im0
0
Correcting the U.S. Current-Account Imbalancevia Tighter Fiscal and Monetary Policies
Output
Saving-Investment,Exports-Imports
C
B’
C ’
S-I0
S-I2
S-I1
Ex-Im0
A’
B
A
Y’FY’’Y’’’0
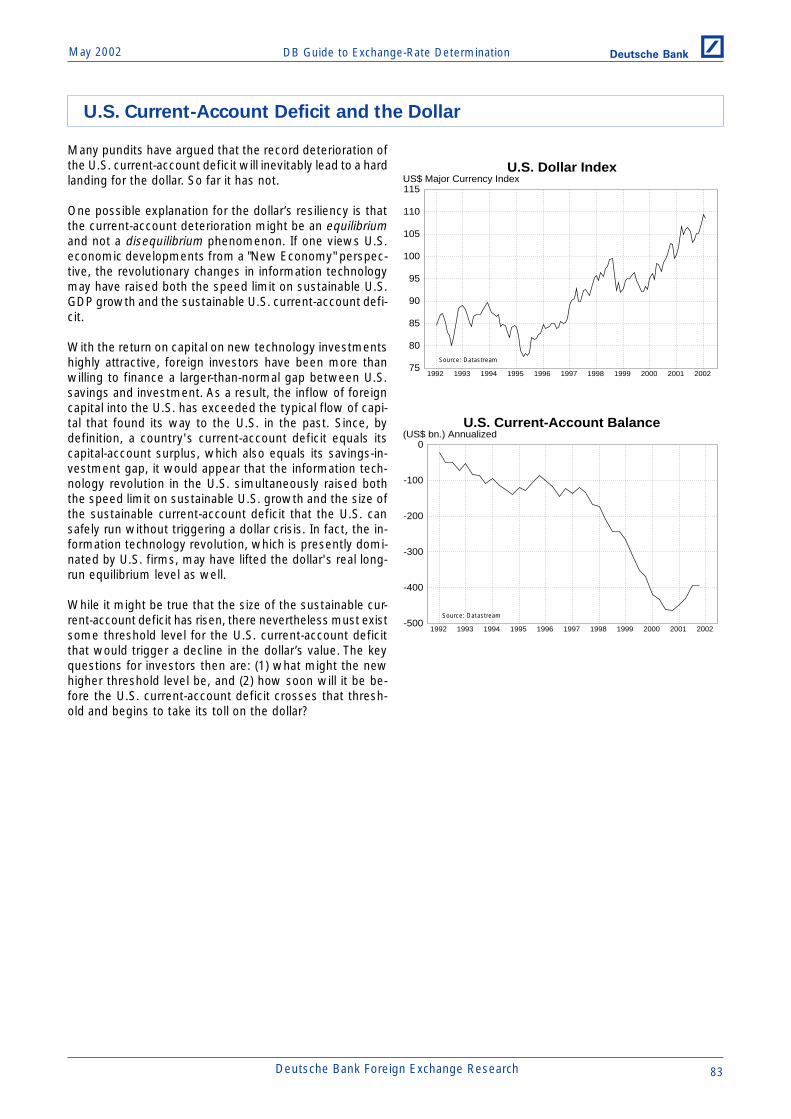
DB Guide to Exchange-Rate DeterminationMay 2002 Deutsche Bank @
Deutsche Bank Foreign Exchange Research 83
Many pundits have argued that the record deterioration ofthe U.S. current-account deficit will inevitably lead to a hardlanding for the dollar. So far it has not.
One possible explanation for the dollar’s resiliency is thatthe current-account deterioration might be an equilibriumand not a disequilibrium phenomenon. If one views U.S.economic developments from a "New Economy" perspec-tive, the revolutionary changes in information technologymay have raised both the speed limit on sustainable U.S.GDP growth and the sustainable U.S. current-account defi-cit.
With the return on capital on new technology investmentshighly attractive, foreign investors have been more thanwilling to finance a larger-than-normal gap between U.S.savings and investment. As a result, the inflow of foreigncapital into the U.S. has exceeded the typical flow of capi-tal that found its way to the U.S. in the past. Since, bydefinition, a country's current-account deficit equals itscapital-account surplus, which also equals its savings-in-vestment gap, it would appear that the information tech-nology revolution in the U.S. simultaneously raised boththe speed limit on sustainable U.S. growth and the size ofthe sustainable current-account deficit that the U.S. cansafely run without triggering a dollar crisis. In fact, the in-formation technology revolution, which is presently domi-nated by U.S. firms, may have lifted the dollar's real long-run equilibrium level as well.
While it might be true that the size of the sustainable cur-rent-account deficit has risen, there nevertheless must existsome threshold level for the U.S. current-account deficitthat would trigger a decline in the dollar’s value. The keyquestions for investors then are: (1) what might the newhigher threshold level be, and (2) how soon will it be be-fore the U.S. current-account deficit crosses that thresh-old and begins to take its toll on the dollar?
U.S. Dollar Index
75
80
85
90
95
100
105
110
115
1992 1993 1994 1995 1996 1997 1998 1999 2000 2001 2002
US$ Major Currency Index
U.S. Current-Account Balance
-500
-400
-300
-200
-100
0
1992 1993 1994 1995 1996 1997 1998 1999 2000 2001 2002
(US$ bn.) Annualized
U.S. Current-Account Deficit and the Dollar
Source: Datastream
Source: Datastream

DB Guide to Exchange-Rate Determination May 2002Deutsche Bank @
84 Deutsche Bank Foreign Exchange Research
Based on an analysis of 17 episodes in industrial countriesover the 1980-95 period, Catherine L. Mann (1999) foundthat current-account deficits reaching 4.2% of GDP tendedto set forces in motion—including corrective currency ad-justments—for a reversal of the current-account shortfall.The U.S. current-account deficit as a percentage of GDP ispresently at 4.1%. If the U.S. economy recovers stronglyover the course of 2002, the U.S. current-account deficitcould widen to as much as 5% of GDP, well above the4.2% average threshold.
Another study (Caroline L. Freund, 2000) examined a largersample of industrial country current-account adjustmentepisodes and found that the median current-account defi-cit/GDP ratio that triggered corrective adjustments in thecurrent account was around 4.9%. Those results are re-ported in the table below.
As shown by the median current-account adjustment pro-cess, an industrial-country deficit of 4.9% of GDP has, inthe past, led to a 19% real depreciation of the deficitcountry's currency over a three-year period, with the de-cline beginning one year prior to the peak in the current-account deficit and ending about three years after the peak.In conjunction with a slowdown in domestic demand, thedecline of the currency has typically helped bring about an83% decline in the current-account imbalance. If the U.S.conforms to the median episode, and the U.S. current-ac-count deficit/GDP ratio rises to 5% by year-end 2002, thenthe corrective downward adjustment in the dollar's value(which typically occurs one year prior to the peak in thedeficit) should have started in early 2002.
Estimating the Threshold Level for the U.S. Current-Account Deficit
That Would Trigger a Decline in the Dollar’s Value
Current-Account Adjustment and Real Exchange-Rate Depreciation(in 25 Episodes of Large Current-Account Adjustments, 1980-1995)
Relative to Peak Deficit Year (t0),Current Account/GDP Ratio Three-Year Real the Year in which
at Peak 3 Years after Peak Percentage Exchange-Rate Exchange-Rate DepreciationDate (t0) (t3) Change Depreciation Began Ended Duration
Australia (1989) -6.2% -3.7% 40% 21% 1 5 4
Austria (1980) -4.9% 0.4% 108% 19% -1 2 3Belgium (1981) -4.2% -0.1% 98% 51% -3 4 7
Canada (1981) -4.2% -0.4% 91% - - - -Canada (1993) -3.9% 0.6% 114% 19% -1 3 4Denmark (1986) -5.3% -1.0% 81% - - - -
Finland (1991) -5.5% 1.3% 124% 30% -1 2 3France (1982) -2.2% 0.0% 100% 15% -1 3 4Greece (1985) -8.1% -1.5% 82% 21% -2 2 4
Hong Kong (1980) -5.0% 0.6% 111% - - - -Ireland (1981) -13.6% -5.6% 59% 41% -2 1 3Israel (1982) -8.7% 4.8% 155% 14% 2 6 4
Italy (1981) -2.6% -0.8% 70% 12% -1 1 2Italy (1992) -2.5% 2.3% 194% 28% 0 4 4Korea (1980) -8.5% -1.8% 78% - - - -
New Zealand (1984) -13.6% -8.0% 41% 11% -1 1 2Norway (1986) -6.0% 0.2% 104% 5% -3 1 4Portugal (1981) -16.8% -2.8% 83% 8% 1 3 2
Singapore (1980) -13.3% -3.5% 74% - - - -Spain (1981) -2.9% 1.1% 139% 36% -1 3 4Spain (1981) -3.8% -1.4% 62% 17% 1 4 3
Sweden (1980) -3.5% -0.8% 77% 20% 1 4 3Sweden (1992) -3.6% 2.1% 160% 21% 1 4 3United Kingdom (1989) -4.4% -1.8% 60% 15% 3 5 2
United States (1987) -3.7% -1.7% 56% 34% -1 2 3
Median -4.9% -0.8% 83% 19% -1 3 3
Source: Caroline L. Freund, “Current Account Adjustment in Industrial Countries", Federal Reserve Board, International Finance Discussion Paper, No. 692, December 2000.
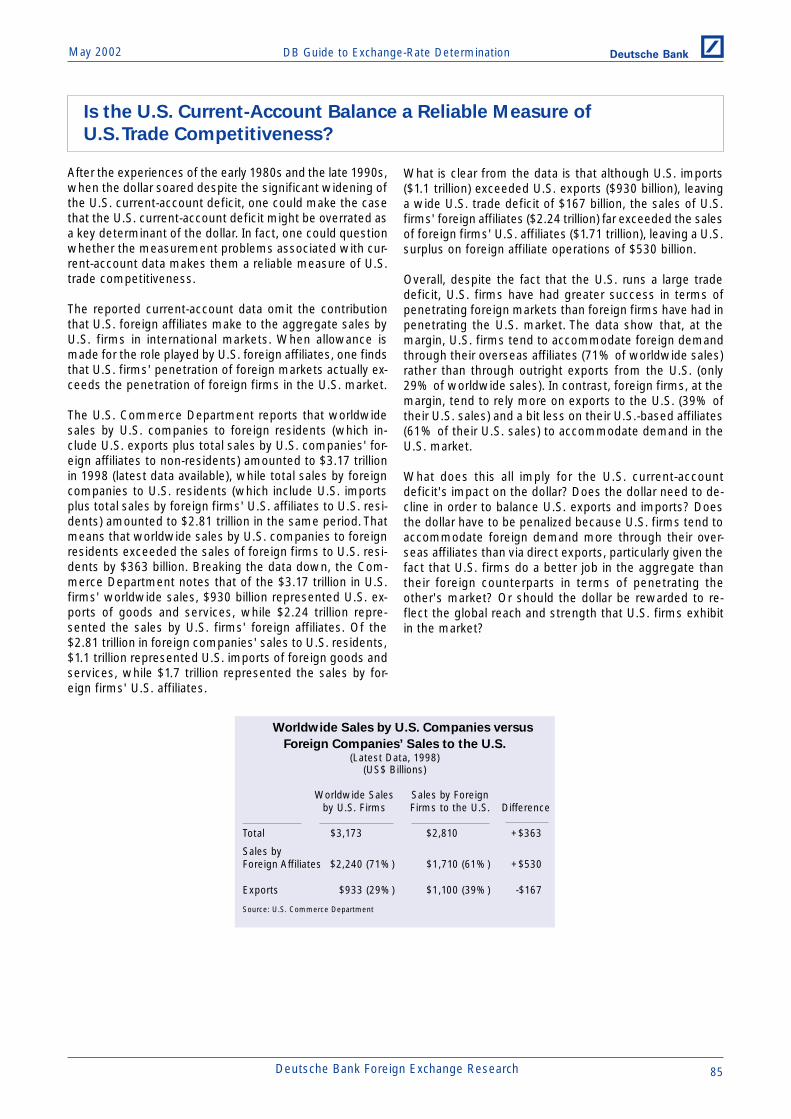
DB Guide to Exchange-Rate DeterminationMay 2002 Deutsche Bank @
Deutsche Bank Foreign Exchange Research 85
After the experiences of the early 1980s and the late 1990s,when the dollar soared despite the significant widening ofthe U.S. current-account deficit, one could make the casethat the U.S. current-account deficit might be overrated asa key determinant of the dollar. In fact, one could questionwhether the measurement problems associated with cur-rent-account data makes them a reliable measure of U.S.trade competitiveness.
The reported current-account data omit the contributionthat U.S. foreign affiliates make to the aggregate sales byU.S. firms in international markets. When allowance ismade for the role played by U.S. foreign affiliates, one findsthat U.S. firms' penetration of foreign markets actually ex-ceeds the penetration of foreign firms in the U.S. market.
The U.S. Commerce Department reports that worldwidesales by U.S. companies to foreign residents (which in-clude U.S. exports plus total sales by U.S. companies' for-eign affiliates to non-residents) amounted to $3.17 trillionin 1998 (latest data available), while total sales by foreigncompanies to U.S. residents (which include U.S. importsplus total sales by foreign firms' U.S. affiliates to U.S. resi-dents) amounted to $2.81 trillion in the same period. Thatmeans that worldwide sales by U.S. companies to foreignresidents exceeded the sales of foreign firms to U.S. resi-dents by $363 billion. Breaking the data down, the Com-merce Department notes that of the $3.17 trillion in U.S.firms' worldwide sales, $930 billion represented U.S. ex-ports of goods and services, while $2.24 trillion repre-sented the sales by U.S. firms' foreign affiliates. Of the$2.81 trillion in foreign companies' sales to U.S. residents,$1.1 trillion represented U.S. imports of foreign goods andservices, while $1.7 trillion represented the sales by for-eign firms' U.S. affiliates.
What is clear from the data is that although U.S. imports($1.1 trillion) exceeded U.S. exports ($930 billion), leavinga wide U.S. trade deficit of $167 billion, the sales of U.S.firms' foreign affiliates ($2.24 trillion) far exceeded the salesof foreign firms' U.S. affiliates ($1.71 trillion), leaving a U.S.surplus on foreign affiliate operations of $530 billion.
Overall, despite the fact that the U.S. runs a large tradedeficit, U.S. firms have had greater success in terms ofpenetrating foreign markets than foreign firms have had inpenetrating the U.S. market. The data show that, at themargin, U.S. firms tend to accommodate foreign demandthrough their overseas affiliates (71% of worldwide sales)rather than through outright exports from the U.S. (only29% of worldwide sales). In contrast, foreign firms, at themargin, tend to rely more on exports to the U.S. (39% oftheir U.S. sales) and a bit less on their U.S.-based affiliates(61% of their U.S. sales) to accommodate demand in theU.S. market.
What does this all imply for the U.S. current-accountdeficit's impact on the dollar? Does the dollar need to de-cline in order to balance U.S. exports and imports? Doesthe dollar have to be penalized because U.S. firms tend toaccommodate foreign demand more through their over-seas affiliates than via direct exports, particularly given thefact that U.S. firms do a better job in the aggregate thantheir foreign counterparts in terms of penetrating theother's market? Or should the dollar be rewarded to re-flect the global reach and strength that U.S. firms exhibitin the market?
Worldwide Sales by U.S. Companies versus
Foreign Companies’ Sales to the U.S.(Latest Data, 1998)
(US$ Billions)
Worldwide Sales Sales by Foreignby U.S. Firms Firms to the U.S. Difference
Total $3,173 $2,810 +$363
Sales byForeign Affiliates $2,240 (71%) $1,710 (61%) +$530
Exports $933 (29%) $1,100 (39%) -$167
Source: U.S. Commerce Department
Is the U.S. Current-Account Balance a Reliable Measure of
U.S. Trade Competitiveness?

DB Guide to Exchange-Rate Determination May 2002Deutsche Bank @
86 Deutsche Bank Foreign Exchange Research
Greater financial integration of the world's capital marketsand the increased freedom of capital to flow across na-tional borders have increased the importance of financialflows in the determination of exchange rates. The rise inthe dollar's value in recent years was largely driven bystrong increases in the demand for U.S. assets by over-seas investors. For example, Euroland investors had beenstructurally underweight equities for a long time, but be-ginning in the late 1990s they started to shift their portfo-lio allocations away from bonds and toward equities. Withintheir rising equity holdings, European investors also madethe decision to increase the percentage allocated to U.S.equities and reduce the percentage allocated to Eurolandequities. Overall, there was a marked rise in European in-vestors' demand for U.S. equities in 1999-2001 that helpedlift the dollar versus the euro.
Foreign demand for Japanese equities has also played arole in influencing the medium-term direction of the yen.The yen's weakness over the 1995-98 period coincidedwith declining foreign demand for Japanese equities, andthe yen's subsequent rebound in late 1998 and in 1999coincided with a rise in foreign demand for Japanese equi-ties. The drop-off in foreign demand for Japanese equitiesin 2000-01 coincided with a sharp decline in the yen's value.
Foreign direct investment (FDI) and portfolio capital flowswere highly positive for the dollar and negative for the euroin the past few years. As shown in the table below,Euroland's overall balance of payments was in huge defi-cit—because of sizable FDI and portfolio outflows fromEuroland—which is in stark contrast to the U.S. and Japa-nese overall balance of payments surpluses.
Although the U.S. has seen its current-account deficitdouble between 1998 ($217 billion) and 2000 ($435 bil-lion), the U.S. over the same period was the recipient ofmassive FDI and portfolio inflows, which exceeded the sizeof the U.S. current-account deficit. As a result, the U.S.overall balance of payments swung from a deficit of $43billion in 1998 to a surplus of $52 billion in 2000.
In contrast, Euroland saw its current account swing froma surplus to a deficit position, while FDI and portfolio flowsrecorded large outflows as well. As a result, Euroland ranoverall balance of payments deficits averaging $173-$183billion per annum in 1998-2000, which weighed heavily onthe euro during this period.
European Investor Demand for U.S. Equitiesand the U.S. Dollar/Euro Exchange Rate
(12-Month Moving Sum of Net Equity Purchases)
(1.50)
(1.40)
(1.30)
(1.20)
(1.10)
(1.00)
(0.90)
(0.80)
-50
0
50
100
150
200
1995 1996 1997 1998 1999 2000 2001 2002
US$/Euro(reverse scale)----European Net Purchases(US$ bn.)____
The Japanese Yen andForeign Investor Demand for Japanese Equities
(12-Month Moving Sum of Net Equity Purchases)
-20
0
20
40
60
80
100
120
140
100
110
120
130
140
150
160
170
180
1995 1996 1997 1998 1999 2000 2001 2002
Foreign Net Purchases(US$ bn.)----Yen Effective Rate____
U.S., Euroland, and Japanese Balance of Payments(1998-2000)
(US$ Billions)
Current Account FDI and Portfolio Flows Overall Balance of Payments
1998 1999 2000 1998 1999 2000 1998 1999 2000
U.S. -217 -331 -435 174 338 487 -43 7 52
Euroland 35 -7 -32 -218 -166 -144 -183 -173 -176
Japan 120 109 118 -63 -36 -60 57 73 58
Source: DatastreamSource: Datastream
Capital Flows and Exchange Rates

DB Guide to Exchange-Rate DeterminationMay 2002 Deutsche Bank @
Deutsche Bank Foreign Exchange Research 87
Despite all of the attention that capital flows receive in theFX market, there has not been much rigorous empiricaltesting to determine whether these flows have a statisti-cally significant and quantitatively important impact onexchange rates, at least until lately. The International Mon-etary Fund recently published a report examining the im-pact that capital flows have had on the euro and the yen inthe past decade. The IMF examined the trend in capitalflows and other relevant indicators to determine whetherthey had statistically significant and quantitatively impor-tant effects on exchange rates. The IMF's findings (basedon an analysis of exchange rates over the 1988-2000 pe-riod) can be summarized as follows:
(1) "There is evidence that equity flows matter for the euro-dollar rate, but not for the yen-dollar rate."
(2) Relative expected current and future growth rates de-rived from Consensus Economic Forecasts are cor-rectly signed and statistically significant in explainingthe euro, but not the yen.
(3) Relative equity returns are not statistically significantin explaining either the euro or the yen.
(4) Bilateral current-account trends vis-à-vis the U.S. arenot statistically significant in explaining either theeuro's or the yen's trend. However, the IMF notes thatwhen multilateral, and not bilateral, current-accountpositions were investigated, there was some evidenceof a positive effect of current-account trends on ex-change rates.
(5) "There is little evidence that merger and acquisitionflows are important for exchange-rate determination.The coefficients on net foreign direct-investment (FDI)flows are correctly signed, but statistically insignifi-cant for both the euro and yen." These results are con-sistent with the view that "the majority of cross-bor-der merger and acquisition flows are financed throughshare-swaps that have no immediate impact on thedemand for currencies."
(6) "Net bond flows appear to have no significant effecton the euro- or yen-dollar rate."
(7) "The movements of the euro-dollar and yen-dollar ex-change rates are significantly correlated with the long-term interest-rate differential, but not their short-termequivalent." The IMF did note, however, that in the caseof the euro, the explanatory power of the long-termspread is weaker than that for equity flows.
IMF Analysis of Factors That Explain Movements
in the Euro and the Yen versus the U.S. Dollar
(1988-2000)
Euro Yen
Coefficient Coefficient
Current Account & Capital Flows
Current Account Insignificant Insignificant
Capital Account
Net Bond Flows Insignificant Incorrect Sign
Net Equities Flows Significant Insignificant
Foreign Direct Investment Insignificant Insignificant
Traditional Underlying Factors
Long-Term Interest Differential Significant Significant
(Marginally)
Short-Term Interest Differential Insignificant Insignificant
Relative Current Growth Insignificant Insignificant
Alternative Underlying Factors
Relative Stock Returns Insignificant Insignificant
Relative Expected Growth Significant InsignificantNote: Coefficients of regression of change in the logarithm of the U.S. dollar exchangerate on a constant and the contemporaneous value of the explanatory variable usingquarterly data since 1988. Significant denotes that the variable was both statisticallysignificant and had the correct sign. All other variables were not statistically significant.
Source: Robin J. Brooks, Hali Edison, Manmohan S. Kumar, Torsten M. Slok,"Exchange Rates and Capital Flows", International Monetary Fund, ResearchDepartment Series, Working Paper, No. 01/190, May 2000, available on the IMF'sWeb site (www.imf.org).
The IMF concluded that its findings were "supportive ofthe new conventional wisdom that net equity flows areimportant for the euro-dollar exchange rate, although long-term interest-rate differentials also appear to matter. Forthe yen, however, there is little evidence that net equityflows have been an important determinant of the bilateralexchange rate with the U.S. dollar." The IMF noted that theimportance of equity flows for the euro might stem fromthe fact that European investors might have been diversi-fying their portfolios away from intra-European investmentsto U.S. equity investments. The IMF warned that if suchportfolio adjustments are not yet complete, then the eurocould remain weak for some time until European portfo-lios are completely rebalanced.
Capital Flows and Exchange Rates: Empirical Evidence

DB Guide to Exchange-Rate Determination May 2002Deutsche Bank @
88 Deutsche Bank Foreign Exchange Research
Correlation Between Equity Market Trends
and Exchange Rates(Daily, Weekly, Monthly, and Quarterly Data)
(January 1983-May 2000)
Equity Market/ Correlation Coefficient
Exchange Rate Daily Weekly Monthly Quarterly
Dow Jones/US$ Index 0.03 0.04 0.04 0.11
Dow Jones-Nikkei/Yen/US$ 0.04* 0.07* 0.08 0.11
Dow Jones-DAX/DM/US$ 0.17** -0.15** -0.25** -0.22**
* Statistically significant at 5% level** Statistically significant at 1% levelSource: BIS Quarterly Review, August 2000
Correlation Between International Portfolio
Equity Flows and Exchange Rates(Monthly Data)
(January 1983-May 2000)
Equity Market Flows/Exchange Rate Correlation Coefficient
U.S.-Japan Equity Flows/Yen/US$ 0.04
U.S.-European Flows/DM/US$ 0.05
Japan-European Flows/Yen/DM -0.26
Source: BIS Quarterly Review, August 2000
Given the surge in the U.S. equity market in the secondhalf of the 1990s, many observers have naturally associ-ated the rise in the dollar's value over this period with theincrease in U.S. equity values. Appearances, however, canbe deceiving. As the Bank of International Settlementsreports in its August 2000 BIS Quarterly Review, "There islittle evidence of a robust significant correlation betweenstock market indices and the major exchange rates." TheBIS finds that the "correlation coefficient for the Dow Jonesindex and the nominal effective dollar rate is positive butvery small and not statistically significant."
The BIS also reports that "a similar result holds for the co-movement of the return on the Dow Jones relative to theNikkei and the percentage change of the bilateral yen/dol-lar rate." What was particularly surprising regarding the BISfindings was that "the correlation between the return onthe Dow Jones relative to Germany's DAX equity indexand movements in the Deutschemark/U.S. dollar exchangerate was negative and statistically significant." In otherwords, when the U.S. equity market has risen relative tothe German equity market, the dollar has tended to fall,not rise in value versus the Deutschemark, as conventionalreasoning would have suggested.
Not only did the BIS find a weak relationship between eq-uity indices and exchange-rate movements, it also found aweak relationship between international portfolio equityflows and the trend in exchange rates. The correlation be-tween U.S./Japan equity flows and the Japanese yen/U.S.dollar exchange rate was close to zero, as was the correla-tion between U.S./European equity flows and the Deut-schemark/U.S. dollar exchange rate. Contrary to conven-tional wisdom, the BIS found that the yen tended tostrengthen versus the Deutschemark when equity flowsmoved in favor of Europe, although the reported correla-tion coefficient was not statistically significant.
Given the historically weak relationship between equity-market trends and exchange rates, why has the foreign-exchange market become so fixated on equity-market de-velopments? One reason may be that in the late 1990sthe correlation between the Dow Jones Industrial Aver-age and the dollar was in fact highly positively correlated(even though the long-run correlation between the DowJones index and the dollar has averaged close to zero).The high correlation in the late 1990s may have led marketobservers to believe that this trend would continue intothe future. This proved not to be the case over the 2000-01period, however, as the correlation between the Dow Jonesindex and the dollar plummeted.
Correlation of U.S. Equity Prices & the Dollar(Rolling Six-Mo. Correlation of Log Differences
of Daily Dow Jones Ind. & US$ Trade Wgt Indices)
-0.3
-0.2
-0.1
0.0
0.1
0.2
0.3
0.4
0.5
1993 1994 1995 1996 1997 1998 1999 2000 2001 2002
Correlation Coefficient (Month-end Values)
Equity-Market Trends and the Dollar
Source: Datastream

DB Guide to Exchange-Rate DeterminationMay 2002 Deutsche Bank @
Deutsche Bank Foreign Exchange Research 89
Although exchange rates and equity markets will move insync from time to time, the relationship between equity-market trends and exchange rates is not stable. For in-stance, between 1990 and 1995, the U.S. dollar fell de-spite a strongly performing U.S. equity market, while theJapanese yen soared despite a weakly performing equitymarket. In both cases the correlation between local eq-uity-market performances and the local currency's valuewas negative. In contrast, between 1995 and 2001, the
correlation between local equity-market performances andthe local currency's value turned highly positive. The U.S.dollar soared in tandem with a rising U.S. equity market,at least up until late 1999, while the yen weakened in tan-dem with a trend decline in the Japanese equity market.Such instability makes it difficult to form judgments on pos-sible future currency moves based solely on expected eq-uity-market performances.
The Dollar and U.S. Equity Prices(1990-1995)
250
300
350
400
450
500
550
600
650
75
80
85
90
95
1990 1991 1992 1993 1994 1995
S&P 500 Index----US$ Index____
The Yen and Japanese Equity Prices(1990-1995)
1000
1500
2000
2500
3000
(180)
(160)
(140)
(120)
(100)
(80)
(60)
1990 1991 1992 1993 1994 1995
TOPIX Index----Yen/US$(reverse scale)____
The Yen and Japanese Equity Prices(1996-2002)
800
1000
1200
1400
1600
1800
(150)
(140)
(130)
(120)
(110)
(100)
1996 1997 1998 1999 2000 2001 2002
TOPIX Index----Yen/US$(reverse scale)____
The Dollar and U.S. Equity Prices(1995-2002)
400
600
800
1000
1200
1400
1600
70
80
90
100
110
120
1995 1996 1997 1998 1999 2000 2001 2002
S&P 500 Index----US$ Index____
Source: Datastream Source: Datastream
Source: Datastream Source: Datastream
Equity-Market Trends and Exchange Rates—An Unstable Relationship

DB Guide to Exchange-Rate Determination May 2002Deutsche Bank @
90 Deutsche Bank Foreign Exchange Research
The market's recent fixation with foreign direct investmentflows as an explanatory variable in projecting future ex-change-rate movements is a phenomenon that deriveslargely from recent large acquisitions of U.S. firms by Eu-ropean corporates and the surge in the dollar that appearedto accompany those acquisitions. But the relationship be-tween FDI flows and the dollar is not robust over time.
If one plots the trend in the U.S. dollar trade-weighted in-dex against the smoothed trend (four-quarter moving sum)in U.S. net FDI over the 1988-2000 period, a careful read-ing of that plot would reveal that U.S. net FDI flows were
actually negative from 1991 to mid-1998, yet the dollar wasstrong during a considerable portion of that time. Mean-while, quarterly data reveal that net FDI flows were quitelarge in the fourth quarter of 1998, yet the dollar fell duringthat period.
Since then, FDI flows have been quite volatile—large inone quarter and then modest in the following quarter. Thetrend in the dollar has clearly not moved in sympathy withthis quarterly pattern in net FDI flows during the past twoyears. Indeed, the correlation between quarterly net FDIflows and the dollar's value since 1981 is a low 0.05.
U.S. Annual Net FDI and the Dollar(Net Foreign Direct Investment, 4-Qtr. Mov. Sum)
(1988-2002)
75
80
85
90
95
100
105
110
-100
-50
0
50
100
150
200
250
88 89 90 91 92 93 94 95 96 97 98 99 00 01 02
US$ Index----Annual Net FDI(US$ bn.)____
U.S. Quarterly Net FDI and the Dollar(Net Foreign Direct Investment)
(1995-2002)
70
80
90
100
110
-40
-20
0
20
40
60
80
100
120
140
1995 1996 1997 1998 1999 2000 2001 2002
US$ Index(line)Quarterly Net FDI(US$ bn.)(bars)
Foreign Direct Investment Flows and Exchange Rates
Source: Datastream Source: Datastream

DB Guide to Exchange-Rate DeterminationMay 2002 Deutsche Bank @
Deutsche Bank Foreign Exchange Research 91
A recent BIS study entitled "The Impact of TransatlanticM&A Activity on the Dollar/Euro Exchange Rate" finds thatover the 1999-2000 period, M&A announcements of Eu-ropean firms' acquisitions of U.S. firms had a statisticallysignificant impact on the dollar's value versus the euro,and that the size of this impact was independent of howthe deal was financed. Interestingly, M&A deals involvingU.S. firms' acquisitions of Euroland firms were found notto have a statistically significant impact on the dollar's valueversus the euro.
This asymmetric response suggests that the influence ofM&A deals on the dollar's value over the 1999-2001 pe-riod may have less to do with the FX flows, if any, gener-ated by such deals, and more to do with the way the mar-ket perceived the underlying rationale for those deals. Thatis, the market may have perceived the steady acquisitionof U.S. firms by Euroland firms as a sign that Eurolandfirms had greater confidence in the long-run growth pros-pects of the U.S. relative to Euroland. The fact that thepace of transatlantic activity slowed sharply in 2001, yetthe dollar remained remarkably resilient, suggests that thelinkage between M&A activity and the dollar may be lessrobust when viewed over longer time horizons.
Estimates of the Effect of M&A Flows
on the U.S. Dollar/Euro Exchange Rate
(January 1999-September 2001)
Coefficient
(t-Statistic)
Current and Lagged M&A Flows into Euroland +0.346(1.55)
Current and Lagged M&A Flows into U.S. -0.481*(-2.52)
Note: * denotes that the variable was statistically significant and had the correct sign.Source: Ingo Fender and Gabriele Galati, “The Impact of Transatlantic M&A Activity
on the Dollar/Euro Exchange Rate”, BIS Quarterly Review, December 2001.
Merger & Acquisition Flows and the Dollar(Cumulative Net Flow from Euroland to the U.S.)
(1998-2002)
(1.30)
(1.20)
(1.10)
(1.00)
(0.90)
(0.80)
0
50
100
150
200
250
300
1998 1999 2000 2001 2002
US$/Euro(reverse scale)(line)M&A Flows(US$ bn.)(bars)
Merger and Acquisition Flows and the Dollar—1999-2001
Source: Bloomberg, Datastream

DB Guide to Exchange-Rate Determination May 2002Deutsche Bank @
92 Deutsche Bank Foreign Exchange Research
It is widely recognized that part of the dollar's strengthen-ing trend in recent years can be explained by the dramaticsurge in foreign direct investment and portfolio flows intothe U.S. from overseas markets. Many assume that thissurge in capital inflows reflected a newfound optimism inthe health and vigor of the U.S. economy and financialmarkets. While this is undoubtedly true, it may also be thecase that a significant portion of the capital flow that hasfound its way to the U.S. simply reflected capital flight fromother parts of the world, notably emerging markets.
The evidence suggests that a series of crises in emergingmarkets—from Asia to Russia to Brazil to Turkey to Argen-tina—persuaded investors to exit from emerging-marketinvestments and look for more stable returns in the indus-trialized markets. Given the U.S. dollar's dominant posi-tion as a global medium of exchange and store of value,the U.S. naturally benefited from that capital flight. Netprivate capital flows into emerging markets peaked at $233billion in 1996, just prior to the Asian financial crisis of 1997.Since then, private capital flows to emerging markets haveplummeted, with the 2000 inflow amounting to only $9.0billion.
As the charts below indicate, net FDI flows into emergingmarkets did not change much over the 1997-2001 period.Net FDI inflows remained stable, averaging around $170billion per annum. Where there was a striking change inthe path of capital flows was in the bond financing andbank lending areas. Bank lending plummeted from an in-flow of $51.9 billion in 1998 to an outflow of $32.3 billion in2001. Bond financing flows fell from a high of $62.3 billionin 1996 to a mere $9.5 billion in 2001.
The Impact of Emerging-Market Capital Flight on the Dollar—1997-2001
Capital Flows into Emerging Markets(Net Private Capital Flows)
20.18.9
59.669.6
116.8
233.2
205.7
151.3145.6
0
50
100
150
200
250
1993 1994 1995 1996 1997 1998 1999 2000 2001e
(US$ bn.)
Source: IMF World Economic Outlook, December 2001
Bond Flows into Emerging Markets
9.5
16.9
29.5
40.9
49.6
62.3
30.7
38.136.7
11.111.0
0
10
20
30
40
50
60
70
1991 1992 1993 1994 1995 1996 1997 1998 1999 2000 2001e
(US$ bn.)
Source: World Bank
Equity Flows into Emerging Markets
18.5
50.9
34.5
15.6
30.1
48.9
36.135.2
51.0
14.1
7.6
0
10
20
30
40
50
60
1991 1992 1993 1994 1995 1996 1997 1998 1999 2000 2001e
(US$ bn.)
Source: World Bank
FDI Flows into Emerging Markets
168.2166.7
184.4178.3
172.5
130.8
106.8
90.0
66.6
47.135.7
0
50
100
150
200
1991 1992 1993 1994 1995 1996 1997 1998 1999 2000 2001e
(US$ bn.)
Source: World Bank
Banking Flows into Emerging Markets
-32.3
-6.1
-23.3
51.9
45.6
32.230.9
9.34.1
16.3
5.0
-40
-20
0
20
40
60
1991 1992 1993 1994 1995 1996 1997 1998 1999 2000 2001e
(US$ bn.)
Source: World Bank
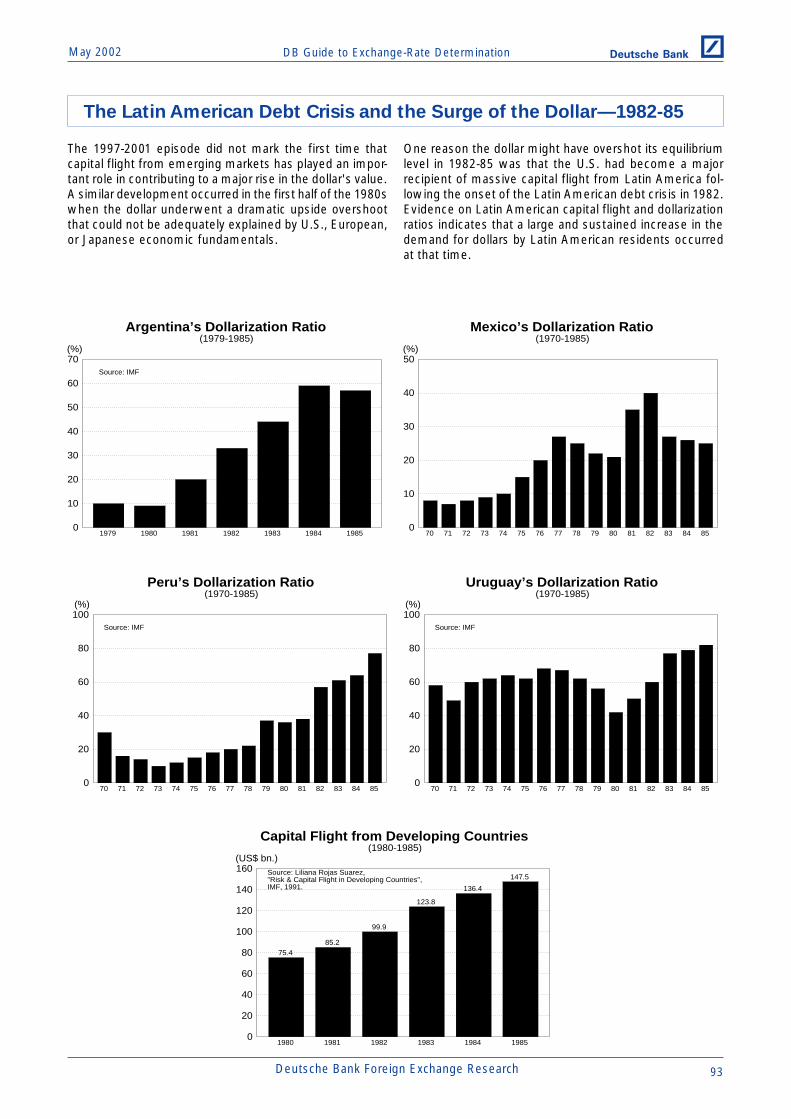
DB Guide to Exchange-Rate DeterminationMay 2002 Deutsche Bank @
Deutsche Bank Foreign Exchange Research 93
The 1997-2001 episode did not mark the first time thatcapital flight from emerging markets has played an impor-tant role in contributing to a major rise in the dollar's value.A similar development occurred in the first half of the 1980swhen the dollar underwent a dramatic upside overshootthat could not be adequately explained by U.S., European,or Japanese economic fundamentals.
One reason the dollar might have overshot its equilibriumlevel in 1982-85 was that the U.S. had become a majorrecipient of massive capital flight from Latin America fol-lowing the onset of the Latin American debt crisis in 1982.Evidence on Latin American capital flight and dollarizationratios indicates that a large and sustained increase in thedemand for dollars by Latin American residents occurredat that time.
Argentina’s Dollarization Ratio(1979-1985)
0
10
20
30
40
50
60
70
1979 1980 1981 1982 1983 1984 1985
(%)
Source: IMF
Mexico’s Dollarization Ratio(1970-1985)
0
10
20
30
40
50
70 71 72 73 74 75 76 77 78 79 80 81 82 83 84 85
(%)
Peru’s Dollarization Ratio(1970-1985)
0
20
40
60
80
100
70 71 72 73 74 75 76 77 78 79 80 81 82 83 84 85
(%)
Source: IMF
Uruguay’s Dollarization Ratio(1970-1985)
0
20
40
60
80
100
70 71 72 73 74 75 76 77 78 79 80 81 82 83 84 85
(%)
Source: IMF
The Latin American Debt Crisis and the Surge of the Dollar—1982-85
Capital Flight from Developing Countries(1980-1985)
147.5
136.4
123.8
99.9
85.275.4
0
20
40
60
80
100
120
140
160
1980 1981 1982 1983 1984 1985
(US$ bn.)Source: Liliana Rojas Suarez,"Risk & Capital Flight in Developing Countries",IMF, 1991.
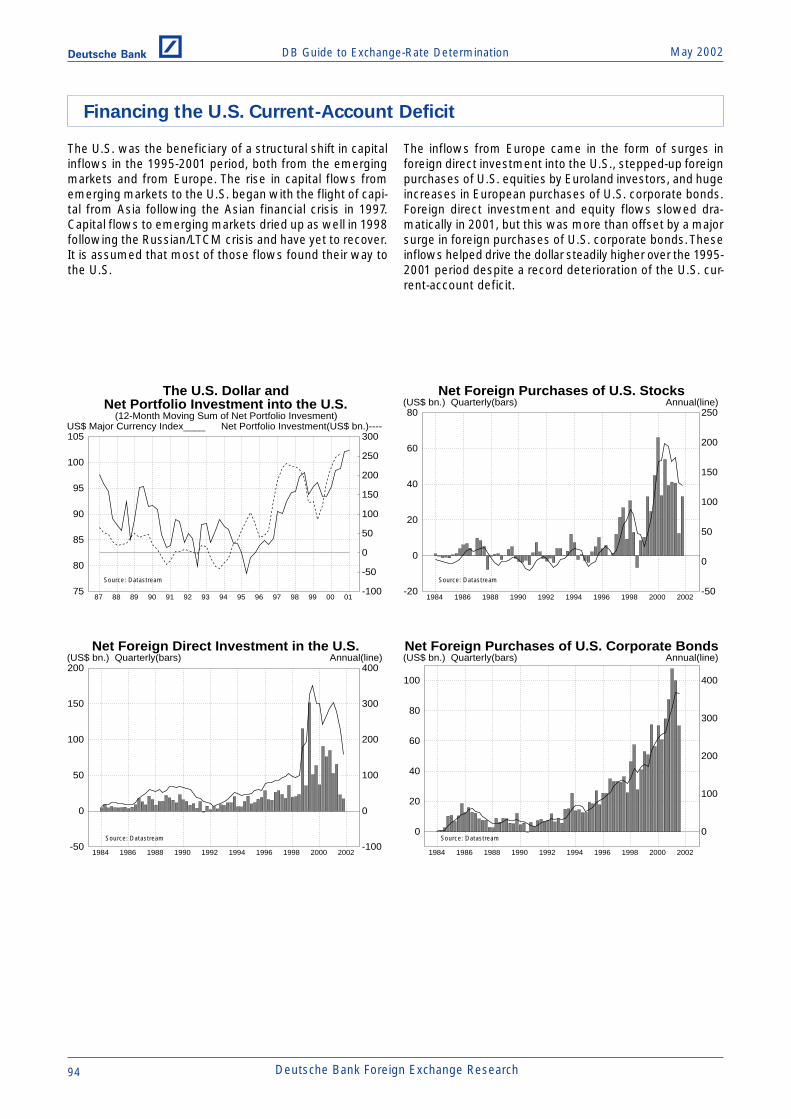
DB Guide to Exchange-Rate Determination May 2002Deutsche Bank @
94 Deutsche Bank Foreign Exchange Research
The U.S. was the beneficiary of a structural shift in capitalinflows in the 1995-2001 period, both from the emergingmarkets and from Europe. The rise in capital flows fromemerging markets to the U.S. began with the flight of capi-tal from Asia following the Asian financial crisis in 1997.Capital flows to emerging markets dried up as well in 1998following the Russian/LTCM crisis and have yet to recover.It is assumed that most of those flows found their way tothe U.S.
The inflows from Europe came in the form of surges inforeign direct investment into the U.S., stepped-up foreignpurchases of U.S. equities by Euroland investors, and hugeincreases in European purchases of U.S. corporate bonds.Foreign direct investment and equity flows slowed dra-matically in 2001, but this was more than offset by a majorsurge in foreign purchases of U.S. corporate bonds. Theseinflows helped drive the dollar steadily higher over the 1995-2001 period despite a record deterioration of the U.S. cur-rent-account deficit.
Net Foreign Direct Investment in the U.S.
-100
0
100
200
300
400
-50
0
50
100
150
200
1984 1986 1988 1990 1992 1994 1996 1998 2000 2002
Annual(line)(US$ bn.) Quarterly(bars)Net Foreign Purchases of U.S. Corporate Bonds
0
100
200
300
400
0
20
40
60
80
100
1984 1986 1988 1990 1992 1994 1996 1998 2000 2002
Annual(line)(US$ bn.) Quarterly(bars)
Net Foreign Purchases of U.S. Stocks
-50
0
50
100
150
200
250
-20
0
20
40
60
80
1984 1986 1988 1990 1992 1994 1996 1998 2000 2002
Annual(line)(US$ bn.) Quarterly(bars)The U.S. Dollar and
Net Portfolio Investment into the U.S.(12-Month Moving Sum of Net Portfolio Invesment)
-100
-50
0
50
100
150
200
250
300
75
80
85
90
95
100
105
87 88 89 90 91 92 93 94 95 96 97 98 99 00 01
Net Portfolio Investment(US$ bn.)----US$ Major Currency Index____
Financing the U.S. Current-Account Deficit
Source: Datastream
Source: Datastream
Source: Datastream
Source: Datastream

DB Guide to Exchange-Rate DeterminationMay 2002 Deutsche Bank @
Deutsche Bank Foreign Exchange Research 95
Under normal conditions, U.S. interest rates would havebeen required to rise relative to foreign interest rates inorder to attract greater capital inflows to finance the steadywidening of the U.S. current-account deficit. As shown inFigure (a) in the diagram below, the equilibrium value forthe dollar is shown to be determined at the point wherethe U.S. savings-investment schedule (S-I) and the U.S.current-account balance schedule (CAB) intersect. Asshown in Figure (b), the U.S./foreign interest-rate spreadrequired to finance the current-account deficit and attractthe necessary capital flows is (rUS -rF)1.
An increase in U.S. investment, such as the one experi-enced by the U.S. during the 1990s, would have shiftedthe S-I schedule to the left, which under normal circum-stances would have required a relative rise in U.S. interestrates in order to induce foreign investors to finance thewider U.S. current-account deficit. Higher U.S. interest rateswould, in turn, have led to wider U.S./foreign yield spreads,from (rUS -rF)1 to (rUS -rF)2.
It was truly remarkable during the 1995-2001 period of dollarappreciation that the U.S. was able to finance a record de-terioration in its current-account deficit without having topush U.S. interest rates higher relative to interest ratesoverseas.
How did the U.S. accomplish this? The U.S. was the ben-eficiary of a major structural shift in capital flows to theU.S. (shown in Figure (b) as a shift of the capital flow sched-ule from U.S. Capital Flows1 to U.S. Capital Flows2) thatwas independent of any change in U.S./foreign yieldspreads. Indeed, the capital flight from the emerging mar-kets and the inflow of capital from Euroland actually al-lowed nominal and real yield spreads to narrow during thedollar's run-up in 1999-2001. Hence, the normally reliable,positive correlation between trends in U.S./foreign yieldspreads and trends in the dollar’s value was broken in 1999-2000. At the same time, the correlation between the trendin U.S./foreign yield spreads and the U.S. current-accountdeficit was broken as well.
U.S. Current-Account Deficit and theU.S./German Short-Term Interest-Rate Spread
-800
-600
-400
-200
0
200
400
600
-1
0
1
2
3
4
5
85 86 87 88 89 90 91 92 93 94 95 96 97 98 99 00 01 02
U.S.-German 3-Mo. Rates(bp)----Curr’t Acc’t Deficit/GDP(%)____
How a Surge in U.S. Investment SpendingTypically Affects the Dollar
and U.S./Foreign Real Yield Spreads
%
Savings minus Investment,Current-Account Surplus
U.S. DollarReal Exchange Rate
Surge inInvestmentSpending
S-I2
$
CAB1
Upward Revision in theDollar’s Real Long-RunEquilibrium Value
q2
q1
(0)
S-I1
%
U.S. Capital Outflows
U.S./ForeignReal Yield Spreads
$
U.S. Capital Flows1
Typical Rise in U.S. Real Interest RatesNecessary to AttractAdditional Capital Inflows(from point to ).A B
(r - r )US F 2
(0)U.S. Capital Inflows
(r - r )US F 1
U.S. Capital Flows2
&
(b)
(a)
%· $·
Current-Account Deficit
But the 1995-2000 StructuralShift in Capital Inflows (from US Capital Flow to US Capital Flow )Allowed Real Interest-Rate Spreadsto Remain at (r -r ) .
1 2
US F 1
The U.S. Current-Account Deficit and U.S./Foreign Yield Spreads
U.S. Current-Account Deficit and theU.S./German Real Long-Term Yield Spread
-600
-400
-200
0
200
400
-1
0
1
2
3
4
5
85 86 87 88 89 90 91 92 93 94 95 96 97 98 99 00 01 02
U.S.-German Real 10-Year Yield(bp)----Curr’t Acc’t Def./GDP(%)____
Source: Datastream
Source: Datastream

DB Guide to Exchange-Rate Determination May 2002Deutsche Bank @
96 Deutsche Bank Foreign Exchange Research
Our understanding of the impact that monetary and fiscalpolicy changes have on exchange rates owes much to thepioneering work of Robert A. Mundell and J. MarcusFleming. The Mundell-Fleming (MF) model has becomethe textbook standard that most students today use tostudy the role of monetary and fiscal policy in an openeconomy.
In the MF model, the degree of capital mobility plays apivotal role in determining the exchange rate's responseto a change in fiscal or monetary policy. For example, anexpansionary monetary policy will lead to a depreciationof the domestic currency in large part because the induceddecline in domestic interest rates will generate an outflowof capital that puts downward pressure on the domesticcurrency. The more sensitive capital flows are to changesin interest rates, the greater will be the outflow of capitalin response to the interest-rate decline. Hence, the moremobile capital is, the more the currency will depreciate inresponse to a monetary expansion.
Fiscal policy's impact on the exchange rate is a bit am-biguous. If capital is highly mobile, an expansionary fiscalpolicy will likely give rise to an appreciation of the domes-tic currency. If capital is relatively immobile, then an ex-pansionary fiscal policy could lead to a decline in the do-mestic currency's value. This is because an expansionaryfiscal policy typically results in a rise in domestic interestrates and an increase in economic activity. The rise in do-mestic interest rates should attract an inflow of capital fromabroad, which should be positive for the domestic currency,but at the same time, the consequent rise in domesticeconomic activity will contribute to the deterioration of thetrade account, which should be negative for the domesticcurrency.
Whether the exchange rate rises or falls in response to afiscal expansion will depend on how sensitive capital flowsare to changes in interest rates. If capital flows are highlymobile, the induced inflow of capital from abroad shoulddominate the deterioration in trade, and thus the domes-tic currency will tend to appreciate in value. If capital flowsare relatively immobile, the opposite will be the case.
The Mundell-Fleming Model of Exchange-Rate Determination
Source: Rosenberg (1996)
Source: Rosenberg (1996)
The Mundell-Fleming Model Transmission Mechanism
OverallBalance ofPayments
Deficit
DomesticExpansionary
MonetaryPolicy
Decrease inDomestic
Interest Rates
Increase inDomesticEconomic
Activity
Deteriorationof
TradeBalance
CapitalOutflow
Depreciationof
DomesticCurrency
How Changes in Monetary Policy Affect Exchange Rates
The Mundell-Fleming Model Transmission Mechanism
OverallBalance ofPayments
(?)
DomesticExpansionary
FiscalPolicy
Increase inDomestic
Interest Rates
Increase inDomesticEconomic
Activity
Deteriorationof
TradeBalance
CapitalInflow
Depreciationof
DomesticCurrency
How Changes in Fiscal Policy Affect Exchange Rates
Appreciationof
DomesticCurrency
Trade-BalanceDeteriorationDominatesCapital Inflow
Capital InflowDominatesDeterioration ofTrade Balance

DB Guide to Exchange-Rate DeterminationMay 2002 Deutsche Bank @
Deutsche Bank Foreign Exchange Research 97
In the MF model, an expansionary domestic monetarypolicy will exert downward pressure on a domesticcurrency's value while a restrictive domestic monetarypolicy will exert upward pressure on a domestic currency'svalue. The more mobile is capital, the greater will be theexchange-rate response.
In an IS-LM context, an expansionary domestic monetarypolicy will shift the LM (liquidity) curve downward and tothe right to LM1, resulting in a decline in domestic interestrates and a rise in domestic demand. The decline in do-mestic interest rates will cause capital to flow abroad, whilethe rise in domestic demand will cause the trade balance
to deteriorate. The combined deterioration of the trade andcapital accounts will lead to a deterioration of the overallbalance of payments and, in the process, exert downwardpressure on the domestic currency.
Under conditions of low capital mobility, the interest-rate-induced outflow of capital should be modest (from K0 toK1). A modest capital outflow in turn should result in amodest decline in the domestic currency's value (from E0to E1). Under conditions of high capital mobility, the inter-est-rate-induced outflow of capital should be large (fromK0 to K2), and the resultant decline in the domesticcurrency's value (from E0 to E2) should be large as well.
Monetary Policy's Impact on Exchange Rates in the MF Model
The Effect of an Easing in Monetary Policy on an Exchange Rateunder Conditions of Low and High Capital Mobility
Output
Interest Rate
IS1
LM1
B
A
LM0
Y0 Capital Inflow
Interest Rate
B’
A
K2
i0
i1
Y1
Low Capital Mobility
High Capital Mobility
K1 K0
B
i0
i1
Trade Deficit
Exchange Rate
B
A
Im -Ex0 0 Capital Inflow
Exchange Rate
B’A
K2
E0
E2
K1 K0
B
E0
E2
Im -Ex1 1
E1
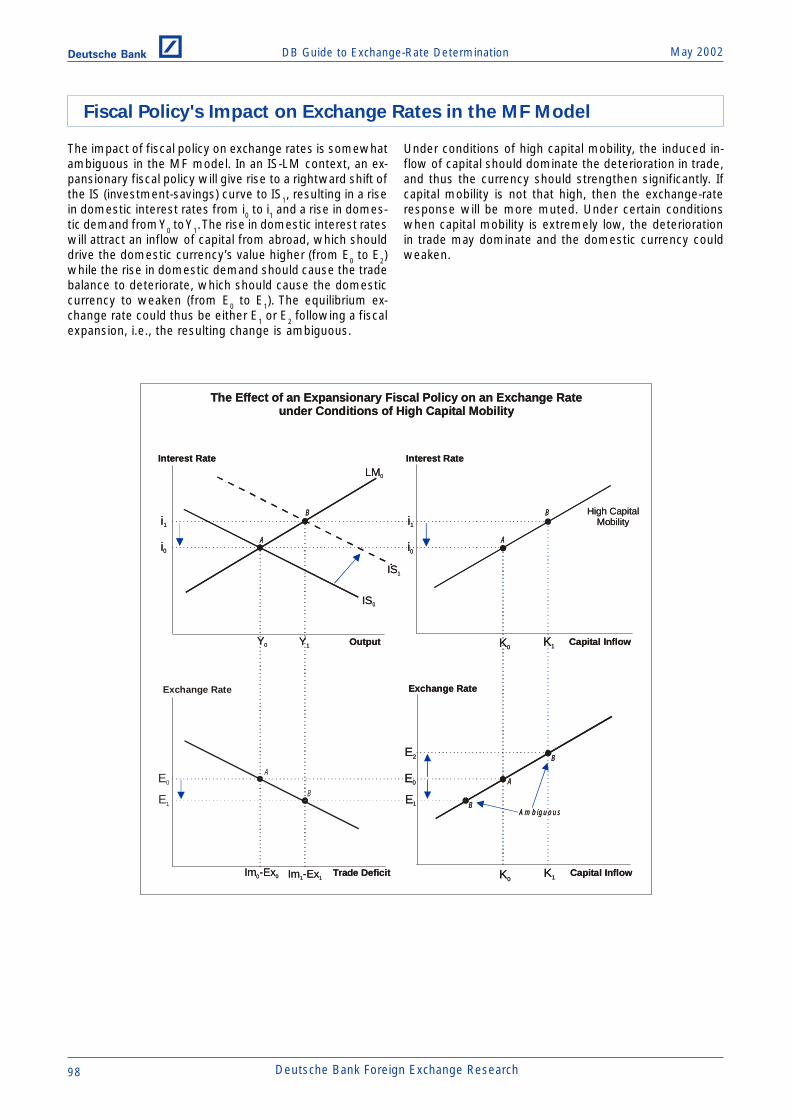
DB Guide to Exchange-Rate Determination May 2002Deutsche Bank @
98 Deutsche Bank Foreign Exchange Research
The impact of fiscal policy on exchange rates is somewhatambiguous in the MF model. In an IS-LM context, an ex-pansionary fiscal policy will give rise to a rightward shift ofthe IS (investment-savings) curve to IS1, resulting in a risein domestic interest rates from i0 to i1 and a rise in domes-tic demand from Y0 to Y1. The rise in domestic interest rateswill attract an inflow of capital from abroad, which shoulddrive the domestic currency’s value higher (from E0 to E2)while the rise in domestic demand should cause the tradebalance to deteriorate, which should cause the domesticcurrency to weaken (from E0 to E1). The equilibrium ex-change rate could thus be either E1 or E2 following a fiscalexpansion, i.e., the resulting change is ambiguous.
Under conditions of high capital mobility, the induced in-flow of capital should dominate the deterioration in trade,and thus the currency should strengthen significantly. Ifcapital mobility is not that high, then the exchange-rateresponse will be more muted. Under certain conditionswhen capital mobility is extremely low, the deteriorationin trade may dominate and the domestic currency couldweaken.
Fiscal Policy's Impact on Exchange Rates in the MF Model
The Effect of an Expansionary Fiscal Policy on an Exchange Rateunder Conditions of High Capital Mobility
Output
Interest Rate
IS1
IS1
B
A
LM0
Y0 Capital Inflow
Interest Rate
Ai0
i1
Y1
High Capital Mobility
K1K0
B
i0
i1
Trade Deficit
Exchange Rate
B
A
Im -Ex0 0 Capital Inflow
Exchange Rate
B
AE0
E1
K1K0
B
E0
E1
Im -Ex1 1
Am b iguous
E2
The Effect of an Expansionary Fiscal Policy on an Exchange Rateunder Conditions of High Capital Mobility
Output
Interest Rate
IS0
IS1
B
A
LM0
Y0 Capital Inflow
Interest Rate
Ai0
i1
Y1
High Capital Mobility
K1K0
B
i0
i1
Trade DeficitIm -Ex0 0 Capital Inflow
Exchange Rate
B
A
K1K0
B
E0
E1
Im -Ex1 1
Am b iguous
E2
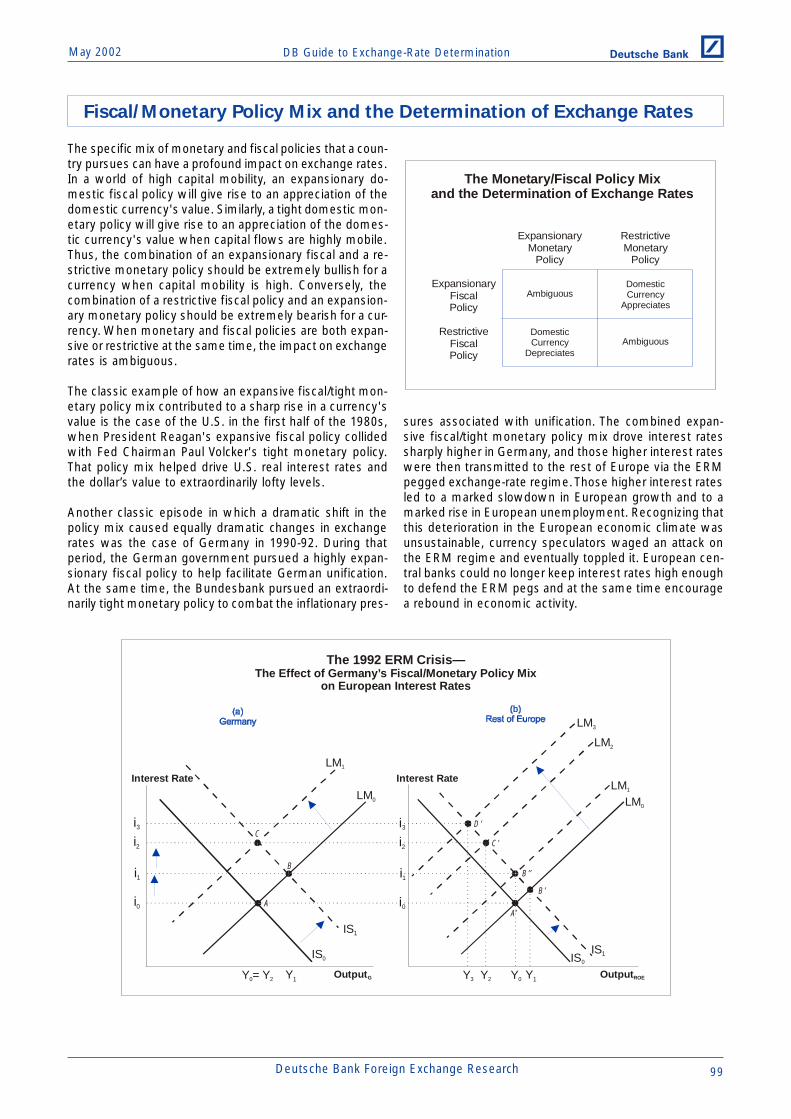
DB Guide to Exchange-Rate DeterminationMay 2002 Deutsche Bank @
Deutsche Bank Foreign Exchange Research 99
The specific mix of monetary and fiscal policies that a coun-try pursues can have a profound impact on exchange rates.In a world of high capital mobility, an expansionary do-mestic fiscal policy will give rise to an appreciation of thedomestic currency's value. Similarly, a tight domestic mon-etary policy will give rise to an appreciation of the domes-tic currency's value when capital flows are highly mobile.Thus, the combination of an expansionary fiscal and a re-strictive monetary policy should be extremely bullish for acurrency when capital mobility is high. Conversely, thecombination of a restrictive fiscal policy and an expansion-ary monetary policy should be extremely bearish for a cur-rency. When monetary and fiscal policies are both expan-sive or restrictive at the same time, the impact on exchangerates is ambiguous.
The classic example of how an expansive fiscal/tight mon-etary policy mix contributed to a sharp rise in a currency'svalue is the case of the U.S. in the first half of the 1980s,when President Reagan's expansive fiscal policy collidedwith Fed Chairman Paul Volcker's tight monetary policy.That policy mix helped drive U.S. real interest rates andthe dollar’s value to extraordinarily lofty levels.
Another classic episode in which a dramatic shift in thepolicy mix caused equally dramatic changes in exchangerates was the case of Germany in 1990-92. During thatperiod, the German government pursued a highly expan-sionary fiscal policy to help facilitate German unification.At the same time, the Bundesbank pursued an extraordi-narily tight monetary policy to combat the inflationary pres-
The Monetary/Fiscal Policy Mixand the Determination of Exchange Rates
ExpansionaryMonetary
Policy
RestrictiveMonetary
Policy
ExpansionaryFiscalPolicy
RestrictiveFiscalPolicy
Ambiguous
Ambiguous
DomesticCurrency
Appreciates
DomesticCurrency
Depreciates
The 1992 ERM Crisis—The Effect of Germany’s Fiscal/Monetary Policy Mix
on European Interest Rates
OutputG
Interest Rate
IS1
LM1
B
A
LM0
Y = Y0 2 OutputROE
Interest Rate
B’
A’i0
i1
Y1
B’’
Y0 Y1Y2Y3
C’
D ’C
IS0
i2
i3
i0
i1
i2
i3
IS1IS0
LM1
LM0
LM2
LM3
sures associated with unification. The combined expan-sive fiscal/tight monetary policy mix drove interest ratessharply higher in Germany, and those higher interest rateswere then transmitted to the rest of Europe via the ERMpegged exchange-rate regime. Those higher interest ratesled to a marked slowdown in European growth and to amarked rise in European unemployment. Recognizing thatthis deterioration in the European economic climate wasunsustainable, currency speculators waged an attack onthe ERM regime and eventually toppled it. European cen-tral banks could no longer keep interest rates high enoughto defend the ERM pegs and at the same time encouragea rebound in economic activity.
Fiscal/Monetary Policy Mix and the Determination of Exchange Rates

DB Guide to Exchange-Rate Determination May 2002Deutsche Bank @
100 Deutsche Bank Foreign Exchange Research
The (synthetic) euro's decline in the past nine years pro-vides an example of how an adverse fiscal/monetary policymix can have a negative impact on a currency’s value. Inthe run-up to European Monetary Union (EMU), Europe'soverall fiscal stance leaned toward significant restraint asmost governments in Europe steadily trimmed their struc-tural budget deficits to satisfy the EMU admission criteriaon budget deficits and debt levels set out in the MaastrichtTreaty. All else being equal, fiscal restraint would have beennegative for the euro.
To counteract the negative economic consequences ofEurope's relatively restrictive fiscal policy stances, mostEuropean central banks felt compelled to pursue relativelyeasy monetary-policy stances. Real short-term interestrates in Europe were pushed steadily lower in the 1990s.All else being equal, the pursuit of a relatively easy mon-etary policy should have exerted downward pressure onthe euro's value.
A tight fiscal or an easy monetary policy alone would havebeen enough to depress the euro's value in the 1990s.But the combination of the two proved to be deadly. Asillustrated in the IS-LM diagram below, the pursuit of aneasy monetary policy in Europe resulted in a rightwardshift in Europe's LM schedule from LM0 to LM1, while thepursuit of a tight fiscal policy in Europe resulted in a left-ward shift in Europe's IS schedule from IS0 to IS1. The inter-section of the newly shifted IS1 and LM1 curves at point Cindicates that Europe's policy mix drove European real in-terest rates lower, and those lower real rates then contrib-uted to a decline in the euro's value from point A’ to pointC’.
Euroland Real Short-Term Rates & the Euro(Three-Month Euro Deposit Rate less CPI)
0.80
1.00
1.20
1.40
1.60
0
2
4
6
8
10
1992 1993 1994 1995 1996 1997 1998 1999 2000 2001 2002
US$/Euro----Euroland Real 3-Mo. Rate(%)____
Euroland’s Budget Deficit and the Euro
0.80
0.90
1.00
1.10
1.20
1.30
1.40
-1
0
1
2
3
4
5
6
7
1992 1993 1994 1995 1996 1997 1998 1999 2000 2001 2002 2003
US$/Euro(line)Budget Deficit/GDP(%)(bars)
Source: OECD Economic Outlook
The Effect of Europe’s Fiscal/Monetary Policy Mix on the Euro
Output
Real Interest Rate
C
IS1
IS0
LM1
B
A
LM0
Y1Y0Euro’s Value
Real Interest Rate
C’
A’
E0E1
r0
r1
r01
r1
(a ) (b )
Euroland's Fiscal/Monetary Policy Mix in the 1990s and the Long-Term
Decline in the Euro's Value
Source: Datastream

DB Guide to Exchange-Rate DeterminationMay 2002 Deutsche Bank @
Deutsche Bank Foreign Exchange Research 101
The Japanese yen’s response to changing monetary/fiscalpolicy conditions during 1999-2001 provides another ex-ample of the influence of policy mixes on exchange rates.In 1998-99, a number of prominent economists offeredpolicy prescriptions to help Japan out of its decade-longeconomic slump. Adam Posen, of the Institute for Interna-tional Economics in Washington, D.C. wrote a book en-titled Restoring Japan's Economic Growth (1998), in whichhe recommended that the Japanese government shouldundertake a major fiscal stimulus initiative to reverse thedecline in Japanese economic activity. Posen argued thatJapan's fiscal stance had been too austere in the 1990s,particularly after the 1997 hike in Japan's consumption tax.Therefore, massive fiscal stimulus was needed to offsetthe contractionary forces underway in Japan. In an IS-LMcontext, Posen's solution amounted to shifting the IS curveas far to the right as possible.
Paul Krugman of Princeton University offered a differentpolicy prescription. Krugman (1998) argued that Japan hadfallen into a liquidity trap and stressed that the Japaneseeconomy needed a negative real interest rate to restoreeconomic growth. Since nominal interest rates were al-ready near zero and could not move into negative territory,Krugman asserted that Japan needed to generate expec-tations of higher inflation to drive real interest rates intonegative territory. That could be accomplished only if theBank of Japan made a credible commitment to expandthe rate of growth of the money supply now and in thefuture. In an IS-LM context, Krugman's solution amountedto shifting the LM curve downward and to the right, sothat it intersected the IS curve in negative real interest-rate territory.
A combination of fiscal and monetary stimulus probablywould have been the most desirable policy, allowingJapan's real growth to expand by more than would havebeen possible with either fiscal or monetary stimulus alone.In addition, the impact of such a policy mix would havebeen broadly neutral for the yen. An expansive fiscal policystance would have been yen supportive, while an expan-sive monetary policy stance would have been yen nega-tive, leaving the yen's value largely unchanged.
Posen’s Solution for ResolvingJapan’s Economic Problems
A Massive Fiscal Stimulus
Output
Real Interest Rate
IS2
B
A
LM1
Y1 Y2
r1
r2
IS1
IS2
Easy Monetary Policy and Negative Real Interest Rates
Output
Real Interest Rate
IS1
LM2
B
A
LM1
Y1
Y2
Krugman’s Solution for ResolvingJapan’s Economic Problems
r1
r2
Japan’s Monetary/Fiscal Policy Mix Debate and the Yen’s Value in 1999-2000
Output
Real Interest Rate
IS2
IS1
LM2
BA
Preferable 1999 JapaneseFiscal/Monetary Policy Mix
LM1
Y1
A Combination of Fiscal and Monetary Stimulus
Y3
r1
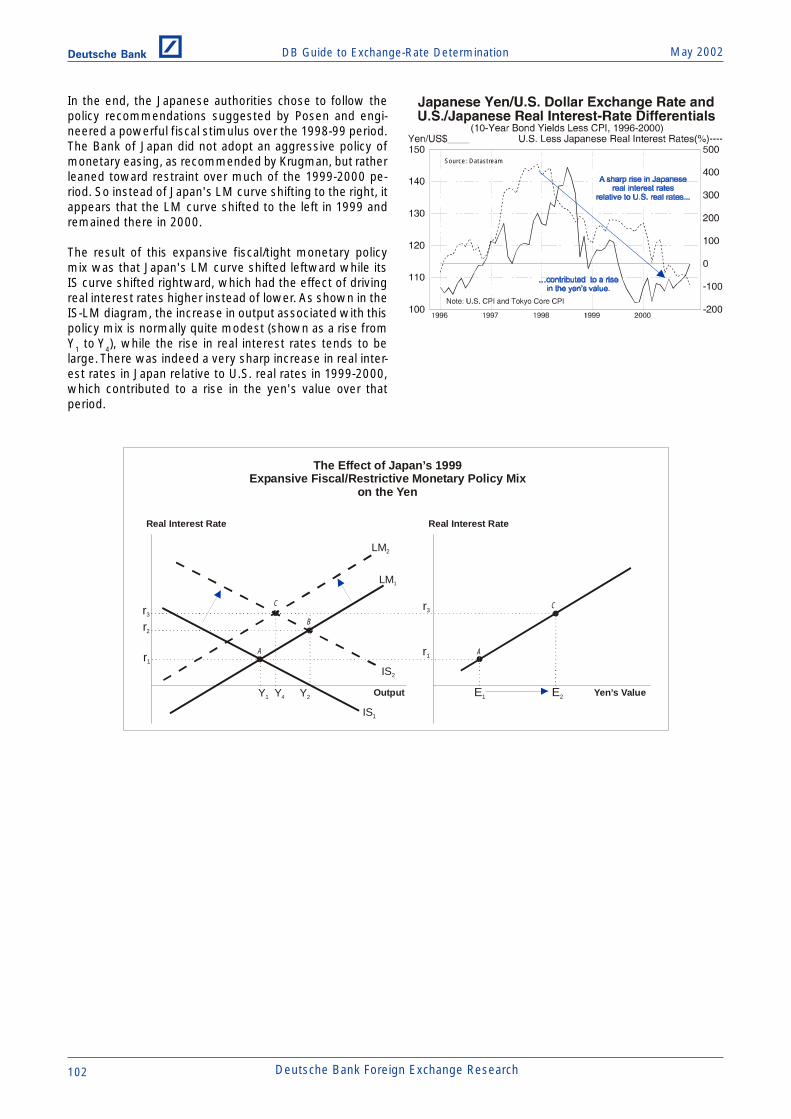
DB Guide to Exchange-Rate Determination May 2002Deutsche Bank @
102 Deutsche Bank Foreign Exchange Research
In the end, the Japanese authorities chose to follow thepolicy recommendations suggested by Posen and engi-neered a powerful fiscal stimulus over the 1998-99 period.The Bank of Japan did not adopt an aggressive policy ofmonetary easing, as recommended by Krugman, but ratherleaned toward restraint over much of the 1999-2000 pe-riod. So instead of Japan's LM curve shifting to the right, itappears that the LM curve shifted to the left in 1999 andremained there in 2000.
The result of this expansive fiscal/tight monetary policymix was that Japan's LM curve shifted leftward while itsIS curve shifted rightward, which had the effect of drivingreal interest rates higher instead of lower. As shown in theIS-LM diagram, the increase in output associated with thispolicy mix is normally quite modest (shown as a rise fromY1 to Y4), while the rise in real interest rates tends to belarge. There was indeed a very sharp increase in real inter-est rates in Japan relative to U.S. real rates in 1999-2000,which contributed to a rise in the yen's value over thatperiod.
The Effect of Japan’s 1999 Expansive Fiscal/Restrictive Monetary Policy Mix
on the Yen
Output
Real Interest Rate
C
IS2
IS1
LM2
B
A
LM1
Y1 Y4 Y2 Yen’s Value
Real Interest Rate
C
A
E1 E2
r1
r2
r1
r3r3
Source: Datastream
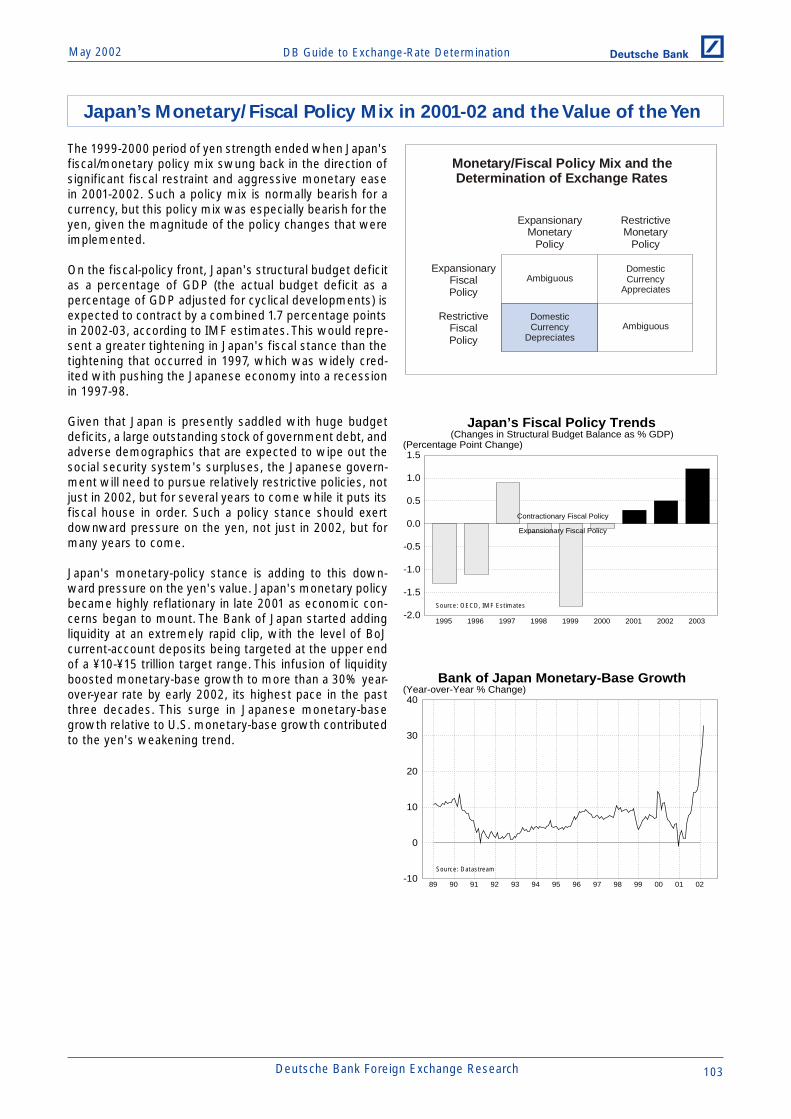
DB Guide to Exchange-Rate DeterminationMay 2002 Deutsche Bank @
Deutsche Bank Foreign Exchange Research 103
The 1999-2000 period of yen strength ended when Japan'sfiscal/monetary policy mix swung back in the direction ofsignificant fiscal restraint and aggressive monetary easein 2001-2002. Such a policy mix is normally bearish for acurrency, but this policy mix was especially bearish for theyen, given the magnitude of the policy changes that wereimplemented.
On the fiscal-policy front, Japan's structural budget deficitas a percentage of GDP (the actual budget deficit as apercentage of GDP adjusted for cyclical developments) isexpected to contract by a combined 1.7 percentage pointsin 2002-03, according to IMF estimates. This would repre-sent a greater tightening in Japan's fiscal stance than thetightening that occurred in 1997, which was widely cred-ited with pushing the Japanese economy into a recessionin 1997-98.
Given that Japan is presently saddled with huge budgetdeficits, a large outstanding stock of government debt, andadverse demographics that are expected to wipe out thesocial security system's surpluses, the Japanese govern-ment will need to pursue relatively restrictive policies, notjust in 2002, but for several years to come while it puts itsfiscal house in order. Such a policy stance should exertdownward pressure on the yen, not just in 2002, but formany years to come.
Japan's monetary-policy stance is adding to this down-ward pressure on the yen's value. Japan's monetary policybecame highly reflationary in late 2001 as economic con-cerns began to mount. The Bank of Japan started addingliquidity at an extremely rapid clip, with the level of BoJcurrent-account deposits being targeted at the upper endof a ¥10-¥15 trillion target range. This infusion of liquidityboosted monetary-base growth to more than a 30% year-over-year rate by early 2002, its highest pace in the pastthree decades. This surge in Japanese monetary-basegrowth relative to U.S. monetary-base growth contributedto the yen's weakening trend.
Monetary/Fiscal Policy Mix and theDetermination of Exchange Rates
ExpansionaryMonetary
Policy
RestrictiveMonetary
Policy
ExpansionaryFiscalPolicy
RestrictiveFiscalPolicy
Ambiguous
Ambiguous
DomesticCurrency
Appreciates
DomesticCurrency
Depreciates
Japan’s Fiscal Policy Trends(Changes in Structural Budget Balance as % GDP)
-2.0
-1.5
-1.0
-0.5
0.0
0.5
1.0
1.5
1995 1996 1997 1998 1999 2000 2001 2002 2003
(Percentage Point Change)
Contractionary Fiscal Policy
Expansionary Fiscal Policy
Bank of Japan Monetary-Base Growth
-10
0
10
20
30
40
89 90 91 92 93 94 95 96 97 98 99 00 01 02
(Year-over-Year % Change)
Japan’s Monetary/Fiscal Policy Mix in 2001-02 and the Value of the Yen
Source: Datastream
Source: OECD, IMF Estimates

DB Guide to Exchange-Rate Determination May 2002Deutsche Bank @
104 Deutsche Bank Foreign Exchange Research
Historically, changes in monetary policy have had a pro-found impact on exchange rates. In the case of the dollar,relatively easy monetary policies pursued by the U.S. dur-ing the Carter Administration contributed to a sharp de-cline of the dollar in 1977-78. The dramatic tightening inU.S. monetary policy by the Volcker-led Federal Reserve inthe early 1980s helped drive the dollar dramatically higherbetween 1981 and 1985. In the case of the yen, a rela-tively tight monetary policy by the Bank of Japan in theearly 1990s contributed to a major strengthening of theyen during that period. Then beginning in 1995 and con-tinuing until 1998, the Bank of Japan pursued an extraordi-nary easy monetary policy that contributed to a weakeryen. More recently, the Bank of Japan has been engagingin a very dramatic easing in monetary policy and the yenhas fallen commensurately. Finally, in the case of manyemerging-market currencies, overly easy monetary poli-cies have often been the catalyst for currency-crisis epi-sodes.
The monetary approach asserts that changes in the sup-ply of and demand for money are the primary determi-nants of exchange-rate movements. Although the mon-etary approach is widely regarded as an incomplete theoryof exchange-rate determination because it ignores otherimportant explanatory variables, it nevertheless correctlywarns that the pursuit of overly expansionary monetarypolicies will exert downward pressure on a currency'svalue, and vice versa.
The monetary model of exchange-rate determination canbe derived from a basic model of the demand for money.If it is assumed that purchasing power parity (PPP) holdsat all times, the equilibrium exchange rate can be shownto be completely determined by trends in relative money-supply growth, relative GDP growth, and relative interest-rate differentials. According to the monetary model, a rela-tive increase in domestic monetary growth, a relative de-crease in domestic GDP growth, and a relative rise in do-mestic interest rates will exert downward pressure on adomestic currency's value.
Derivation of the Flexible-Price Monetary Model
of Exchange-Rate Determination
(1) mS = mD = m = p + b1y - b2i Money supply and demandas a function of prices,output, and interest rates
(2) p = m - b1y + b2i Price-level determination
(3) e$ = (pF - pUS) Purchasing power parityassumption
(4) e$ = (mF-mUS) - b1(yF-yUS) + b2(iF-iUS)Flexible-price monetary modelof the exchange rate
Source: Rosenberg (1996) Source: Rosenberg (1996)
Source: Rosenberg (1996)
How Real Economic Forces Influence Exchange Ratesin the Flexible-Price Monetary Model
of Exchange-Rate Determination
Change inReal
EconomicActivity
Change inPriceLevel
Change inExchange
Rate
Change inReal
MoneyDemand
The Monetary Approach to Exchange-Rate Determination
The Direct Effect of Money-Supply Changeson Exchange Rates
in the Flexible-Price Monetary Model of Exchange-Rate Determination
Change inMoneySupply
Change inPriceLevel
Change inExchange
Rate
The Impact of Money-Supply Changeson Price Levels and Exchange Rates
Domestic Price Level
m0 e0m1
p1
Foreign Currency’sValue
DomesticMoney Supply
p0
e1
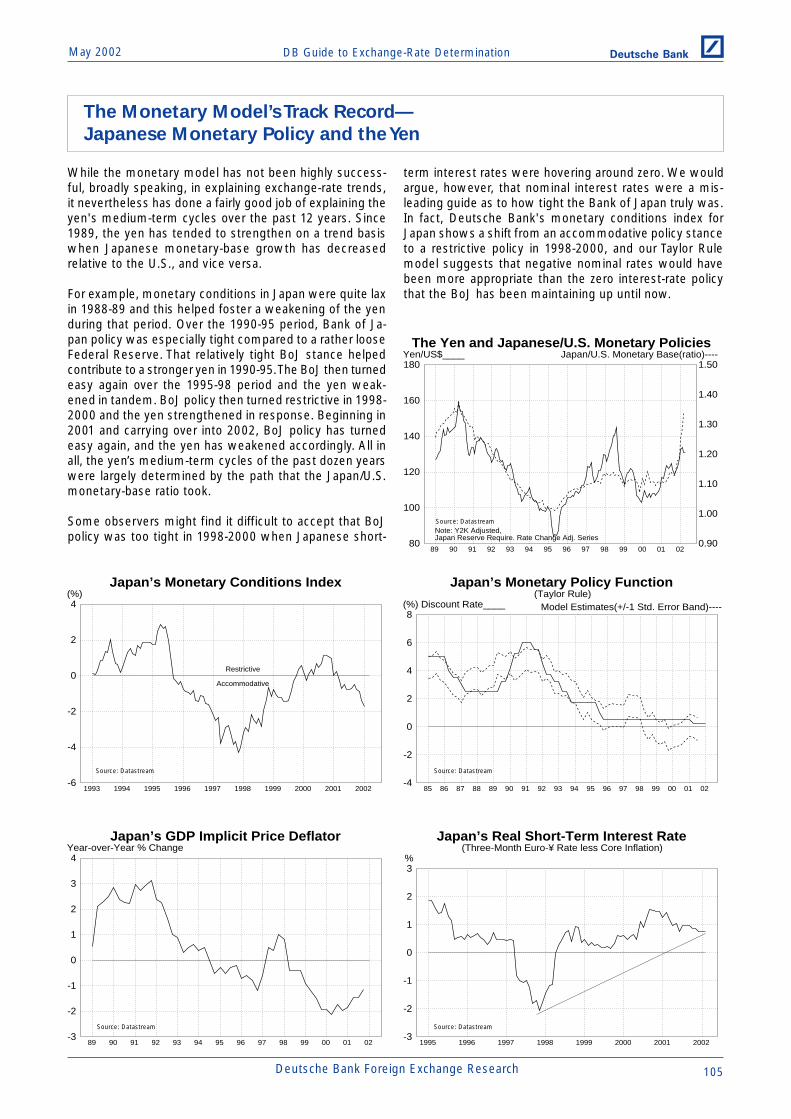
DB Guide to Exchange-Rate DeterminationMay 2002 Deutsche Bank @
Deutsche Bank Foreign Exchange Research 105
While the monetary model has not been highly success-ful, broadly speaking, in explaining exchange-rate trends,it nevertheless has done a fairly good job of explaining theyen's medium-term cycles over the past 12 years. Since1989, the yen has tended to strengthen on a trend basiswhen Japanese monetary-base growth has decreasedrelative to the U.S., and vice versa.
For example, monetary conditions in Japan were quite laxin 1988-89 and this helped foster a weakening of the yenduring that period. Over the 1990-95 period, Bank of Ja-pan policy was especially tight compared to a rather looseFederal Reserve. That relatively tight BoJ stance helpedcontribute to a stronger yen in 1990-95. The BoJ then turnedeasy again over the 1995-98 period and the yen weak-ened in tandem. BoJ policy then turned restrictive in 1998-2000 and the yen strengthened in response. Beginning in2001 and carrying over into 2002, BoJ policy has turnedeasy again, and the yen has weakened accordingly. All inall, the yen’s medium-term cycles of the past dozen yearswere largely determined by the path that the Japan/U.S.monetary-base ratio took.
Some observers might find it difficult to accept that BoJpolicy was too tight in 1998-2000 when Japanese short-
The Yen and Japanese/U.S. Monetary Policies
0.90
1.00
1.10
1.20
1.30
1.40
1.50
80
100
120
140
160
180
89 90 91 92 93 94 95 96 97 98 99 00 01 02
Japan/U.S. Monetary Base(ratio)----Yen/US$____
Note: Y2K Adjusted,Japan Reserve Require. Rate Change Adj. Series
Japan’s Monetary Conditions Index
-6
-4
-2
0
2
4
1993 1994 1995 1996 1997 1998 1999 2000 2001 2002
(%)
Restrictive
Accommodative
Japan’s Monetary Policy Function(Taylor Rule)
-4
-2
0
2
4
6
8
85 86 87 88 89 90 91 92 93 94 95 96 97 98 99 00 01 02
Model Estimates(+/-1 Std. Error Band)----(%) Discount Rate____
Source: Datastream Source: Datastream
Source: Datastream
The Monetary Model’s Track Record—
Japanese Monetary Policy and the Yen
term interest rates were hovering around zero. We wouldargue, however, that nominal interest rates were a mis-leading guide as to how tight the Bank of Japan truly was.In fact, Deutsche Bank's monetary conditions index forJapan shows a shift from an accommodative policy stanceto a restrictive policy in 1998-2000, and our Taylor Rulemodel suggests that negative nominal rates would havebeen more appropriate than the zero interest-rate policythat the BoJ has been maintaining up until now.
Japan’s GDP Implicit Price Deflator
-3
-2
-1
0
1
2
3
4
89 90 91 92 93 94 95 96 97 98 99 00 01 02
Year-over-Year % ChangeJapan’s Real Short-Term Interest Rate
(Three-Month Euro-¥ Rate less Core Inflation)
-3
-2
-1
0
1
2
3
1995 1996 1997 1998 1999 2000 2001 2002
%
Source: Datastream Source: Datastream
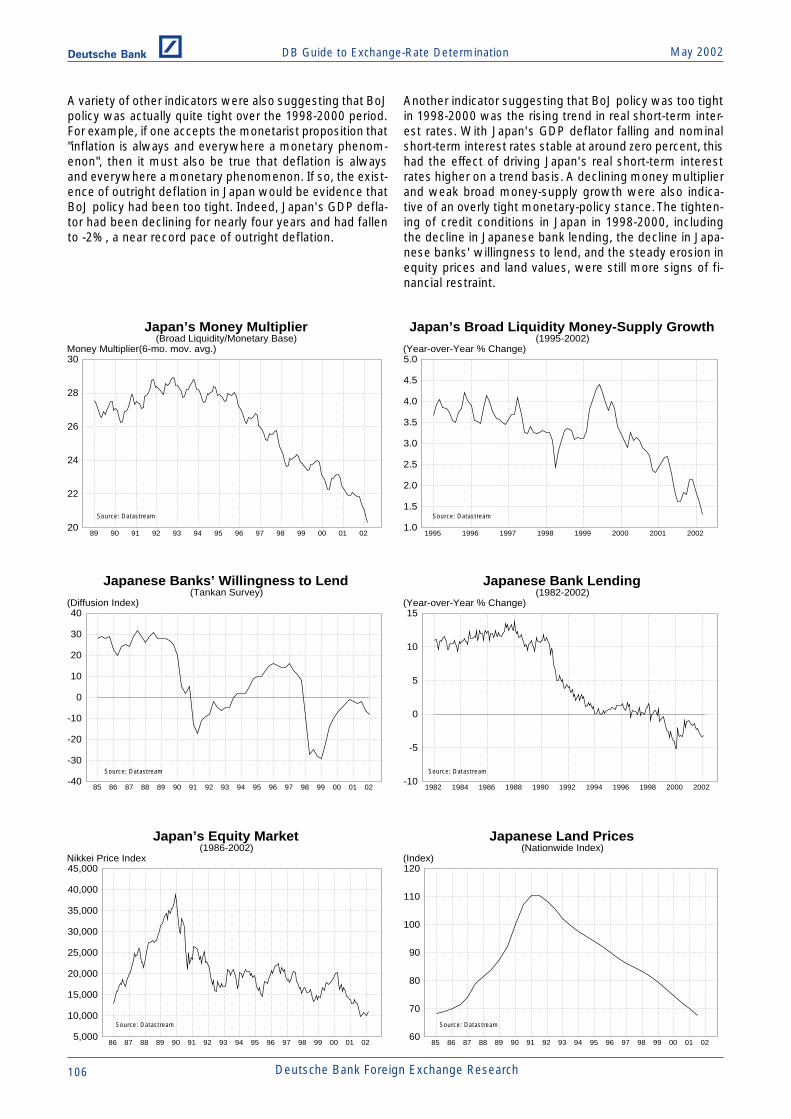
DB Guide to Exchange-Rate Determination May 2002Deutsche Bank @
106 Deutsche Bank Foreign Exchange Research
A variety of other indicators were also suggesting that BoJpolicy was actually quite tight over the 1998-2000 period.For example, if one accepts the monetarist proposition that"inflation is always and everywhere a monetary phenom-enon", then it must also be true that deflation is alwaysand everywhere a monetary phenomenon. If so, the exist-ence of outright deflation in Japan would be evidence thatBoJ policy had been too tight. Indeed, Japan's GDP defla-tor had been declining for nearly four years and had fallento -2%, a near record pace of outright deflation.
Another indicator suggesting that BoJ policy was too tightin 1998-2000 was the rising trend in real short-term inter-est rates. With Japan's GDP deflator falling and nominalshort-term interest rates stable at around zero percent, thishad the effect of driving Japan's real short-term interestrates higher on a trend basis. A declining money multiplierand weak broad money-supply growth were also indica-tive of an overly tight monetary-policy stance. The tighten-ing of credit conditions in Japan in 1998-2000, includingthe decline in Japanese bank lending, the decline in Japa-nese banks' willingness to lend, and the steady erosion inequity prices and land values, were still more signs of fi-nancial restraint.
Japan’s Money Multiplier(Broad Liquidity/Monetary Base)
20
22
24
26
28
30
89 90 91 92 93 94 95 96 97 98 99 00 01 02
Money Multiplier(6-mo. mov. avg.)
Japan’s Broad Liquidity Money-Supply Growth(1995-2002)
1.0
1.5
2.0
2.5
3.0
3.5
4.0
4.5
5.0
1995 1996 1997 1998 1999 2000 2001 2002
(Year-over-Year % Change)
Japanese Bank Lending(1982-2002)
-10
-5
0
5
10
15
1982 1984 1986 1988 1990 1992 1994 1996 1998 2000 2002
(Year-over-Year % Change)
Japan’s Equity Market(1986-2002)
5,000
10,000
15,000
20,000
25,000
30,000
35,000
40,000
45,000
86 87 88 89 90 91 92 93 94 95 96 97 98 99 00 01 02
Nikkei Price Index
Japanese Land Prices(Nationwide Index)
60
70
80
90
100
110
120
85 86 87 88 89 90 91 92 93 94 95 96 97 98 99 00 01 02
(Index)
Japanese Banks’ Willingness to Lend(Tankan Survey)
-40
-30
-20
-10
0
10
20
30
40
85 86 87 88 89 90 91 92 93 94 95 96 97 98 99 00 01 02
(Diffusion Index)
Source: Datastream Source: Datastream
Source: Datastream Source: Datastream
Source: Datastream Source: Datastream

DB Guide to Exchange-Rate DeterminationMay 2002 Deutsche Bank @
Deutsche Bank Foreign Exchange Research 107
Monetary policy typically affects economic activity througha variety of channels: (1) an interest-rate channel, (2) a bank-lending or credit channel, (3) an exchange-rate channel, (4)an inflation-expectations channel, and (5) a wealth-effectchannel. Under normal circumstances, an easier monetarypolicy will lead to lower short-term interest rates, and aslower short rates are transmitted to lower rates across theentire yield curve, investment spending will tend to rise.If, however, nominal short-term interest rates are alreadyat zero, as has been the case in Japan, an easier policystance will not be able to drive short-term interest ratesany lower, thereby rendering the interest-rate channel in-effective.
The bank-lending channel in Japan has also been renderedineffective as the Bank of Japan's attempt to ease policyhas been blunted by the financial problems besetting thebanking industry. Indeed, since Japanese bank lending hasoutright contracted in the past four years, this channel hasbeen effectively closed. And if bank share prices are anyindication of what is in store, the banking system's prob-lems are not likely to go away anytime soon.
The exchange-rate channel has also failed to operate prop-erly in Japan. Normally an easy monetary policy gives riseto a depreciation of the exchange rate and that, in turn,contributes to a rise in net exports and therefore economicactivity. Up until recently, the yen was fairly strong, sug-gesting that monetary policy in Japan had been tight inthe first place. Given the yen’s firmness in 1999-2000, it isobvious that this channel did not function properly duringthat period. However, the yen’s weakness in 2001-02 mayrender this channel more effective in the future.
When nominal short-term interest rates are zero, monetarypolicy can still be effective if the money supply is expandedat a sufficiently rapid rate so as to raise the expected infla-tion rate. A higher expected inflation rate will then lowerthe real short-term interest rate, even if nominal rates arezero. In theory, those lower real interest rates should stimu-late investment spending as outlined in the conventionalinterest-rate channel. Many outside observers have rec-ommended that the Bank of Japan engineer a quantitativeeasing in policy and adopt a positive inflation target. ButJapan's deflationary pressures remain intact, thereby ren-dering the inflation-expectations channel inoperative overthe last decade.
Finally, the wealth-effect channel in Japan has not beenoperative for some time now. Normally, an easier mon-etary policy can be transmitted to the domestic economythrough rising equity prices and real estate values, whichthen increases net wealth and, in turn, helps boost con-sumption. But with the Tokyo stock market and real estatevalues down significantly on a trend basis, there has beena trend decline in net financial wealth over time. Indeed,the inability of equity and real estate prices in Japan torally raises questions whether monetary policy has beentruly easy even when interest rates are near zero.
With the traditional channels of monetary policy not func-tioning properly, the Bank of Japan's policy actions havenot been as accommodative as would have been the caseunder normal conditions. The end result of all this is thatthe Bank of Japan has been too tight, perhaps inadvert-ently, and this gave rise to a stronger-than-desired Japa-nese yen.
Why Monetary and Credit Conditions in Japan Became Too Tight in the
Past Decade
The Channels of Monetary PolicyHow Monetary Policy Changes Are Transmitted to Economic Activity
ExpansionaryMonetary
Policy
StimulateInvestmentSpending
LowerNominal
Interest Rates
StimulateInvestmentSpending
Increase inEconomic
Activity
Increase inBankLoans
ExchangeRate
Depreciation
StimulateNet
Exports
ExpansionaryMonetary
Policy
ExpansionaryMonetary
Policy
ExpansionaryMonetary
Policy
ExpansionaryMonetary
Policy
Increase inEconomic
Activity
Increase inEconomic
Activity
Increase inEconomic
Activity
Increase inEconomic
Activity
Rise inInflation
Expectations
Rise inEquity Prices
Rise in Land &Housing Prices
LowerReal
Interest Rates
Rise inValue of
Financial Wealth
Interest RateChannel
Bank LendingChannel
Exchange RateChannel
InflationExpectations
Channel
Wealth EffectChannel
Adapted from Frederick Mishkin, “The Channels of Monetary Transmission: Lessons for Monetary Policy”,NBER Working Paper, No. 5464, February 1996.

DB Guide to Exchange-Rate Determination May 2002Deutsche Bank @
108 Deutsche Bank Foreign Exchange Research
The portfolio-balance model posits that exchange rates aredetermined by the supply of and demand for all financialassets. The monetary model is actually a subset of thebroader portfolio-balance model in that the monetary modelnarrowly focuses on the supply of and demand for moneyas the key determinant of exchange-rate movements. Theportfolio-balance model broadens the menu of assets thatcan determine the path that exchange rates take. In addi-tion to relative changes in money supply and demand, theportfolio-balance model focuses on relative changes in bondsupply and demand (domestic as well as foreign) as keydeterminants of exchange-rate movements.
In the portfolio-balance model, global investors are as-sumed to hold a diversified portfolio of domestic and for-eign bonds. Their desired allocation to domestic and for-eign bonds is assumed to vary in response to changes inexpected return and risk considerations. In the portfolio-balance framework, a steady increase in the supply of do-mestic bonds outstanding, generated by a continued wid-ening of the government budget deficit, will be willinglyheld only if asset holders are compensated in the form ofa higher expected return or risk premium. The higher riskpremium could come in the form of higher domestic inter-est rates or an immediate decline in the domesticcurrency's value, or some combination of the two. Themajor insight one draws from this is that in the long run,governments that run large budget deficits on a sustainedbasis will eventually see their currencies decline in value.
Portfolio-Balance ModelTransmission Mechanism
Increase inSupply of
GovernmentDebt
Outstanding
Increasein
RiskPremium
Increase inDomesticInterestRates
Decline inDomestic
Currency’sValue
The Supply and Demand for Domestic Bonds and the Risk Premium
Risk Premium
Supply ofDomestic Bonds
e1 DomesticCurrency’s Value
Ø1
Ø0
Ø1
Ø0
e0
Risk Premium
BS BS1 BD
Portfolio-Balance Model of Exchange-Rate Determination
Source: Rosenberg (1996)

DB Guide to Exchange-Rate DeterminationMay 2002 Deutsche Bank @
Deutsche Bank Foreign Exchange Research 109
According to the portfolio-balance model, a rising net ex-ternal debt burden will, in the long run, have negative con-sequences for domestic interest rates and/or the domes-tic currency's value. That is because, in the long run, for-eign investors will demand a higher risk premium to buyand hold increasing claims on the debtor country's assets.That higher risk premium could come in the form of widerdomestic/foreign interest-rate spreads and/or a weaker do-mestic currency. If the external debt becomes particularlyburdensome, the domestic currency may have to weakensharply, thereby allowing foreign investors to buy the debtorcountry's assets at fire-sale prices.
The diagram below illustrates what normally happens whena country undergoes a rapid deterioration in its net exter-nal debt position. The risk premium on a debtor country'sassets, Ø1, is determined at point A, where the outstand-ing stock of external debt, DS
1, is willingly held by foreigninvestors. If the outstanding stock of debt rises to DS
2, for-eign investors will demand a higher risk premium, Ø2, tobuy and hold that debt (at point B). The result would be awidening in domestic/foreign yield spreads and/or a weak-ening of the domestic currency.
Rising Net External Debt and theRisk Premium on U.S. Dollar-Denominated Assets
(A Stylized Diagram of the 1997-2002 Period)
Risk Premiumon U.S. Assets
U.S. Net External Debt
DS1
Ø2
Ø1A
B
U.S. Net External Debt DD1
Foreign Demand for
US$-Denominated Assets
DS2
External Debt, Portfolio Balance & Exchange-Rate Determination—Theory
CumulativeCurrent-Account
Deficits
RisingNet ExternalDebt Ratio
Increase inDomesticInterestRates
Decline inDomestic
Currency’sValue
Current-Account Imbalances and Exchange Rates—The Channels of Influence
Increasein
Risk Premium

DB Guide to Exchange-Rate Determination May 2002Deutsche Bank @
110 Deutsche Bank Foreign Exchange Research
Just how long can a country run large and persistent cur-rent-account deficits (or surpluses) before there is a re-quired adjustment in the exchange rate to correct the grow-ing external imbalance? There must be some limit on theability of a country to run sizable and persistent current-account deficits, because the financing of such deficitswould lead to an unending rise in debt owed by deficitcountries to foreign investors. Since that debt must beserviced, there is a risk that a deficit country could fall intoa "debt trap" with rising debts adding to debt-service obli-gations, which then worsen the current-account deficit.Once entrenched in a debt trap, the deteriorating current-account trend adds to the rising external debt, which mag-nifies the debt-service burden further, and so on.
The trend in the outstanding external debt as a percent-age of GDP would rise without limit, unless this was off-set by a rising trade surplus as a percentage of GDP. In theabsence of an improving trade position, the market wouldbe faced with the task of adding more and more risky debtof the deficit country to its portfolios. At some point, themarket would probably demand a higher risk premium toinduce it to buy and hold onto that rising debt. Eventually,there may come a time when the market perceives thedebt of the deficit country as so risky that it refuses to addany more of that debt to its portfolios.
Debt-Trap Dynamics
TradeDeficit
Current-AccountDeficit
External DebtOutstanding
DebtService
Real Currency Appreciation vs.the Change in Net Foreign Assets/GDP Ratio
(in Selected OECD Countries, 1986-90 vs. 1981-85)
Rate of RealCurrency Appreciation
Change in Net Foreign Assets/GDP Ratio
40%
30%
20%
10%
0%
-10%
-20%
-0.15 -0.05-0.10 0.0 0.05 0.10 0.15
Australia
U.S.
U.K.Finland
SwedenNetherlands
CanadaDenmark
Italy FranceSpain
Belgium
Germany
Japan
Norway
Source: Obstfeld and Rogoff (1994).
Thus, although it may be difficult to quantify precisely, therewill clearly be a limit on just how long a country can runlarge and persistent current-account deficits (or surpluses).It is unlikely that an efficient forward-looking market wouldbe willing to finance an unending string of current-accountdeficits until the deficit country became hopelessly en-gulfed in a debt trap. Rather, an efficient forward-lookingmarket would look far into the future, and if it judged thefuture path of the net external debt/GDP ratio to be unsus-tainable, then the exchange rate would adjust sooner toensure that the trade balance would improve by a suffi-cient amount to offset the rising debt-service burden andthus stabilize the net foreign debt/GDP ratio at a level thatwas deemed sustainable.
Using the sustainability criterion to determine a currency'sreal long-run equilibrium level, the equilibrium real exchangerate could be defined as that rate that will ensure a stablenet external debt/GDP ratio in the long run. One wouldthen expect to find a positive (negative) relationship be-tween a currency's real value and the trend in the net ex-ternal asset (liability) position of that country, and long-runequilibrium would be attained only when the net invest-ment position stabilized. Obtsfeld and Rogoff (1994) pro-vide evidence suggesting that there has been a significantpositive relationship between an increase in a country'snet foreign asset position as a percentage of GDP and thetrend in its real effective exchange rate for 15 OECD coun-tries.
Debt Trap Dynamics and the Equilibrium Exchange Rate
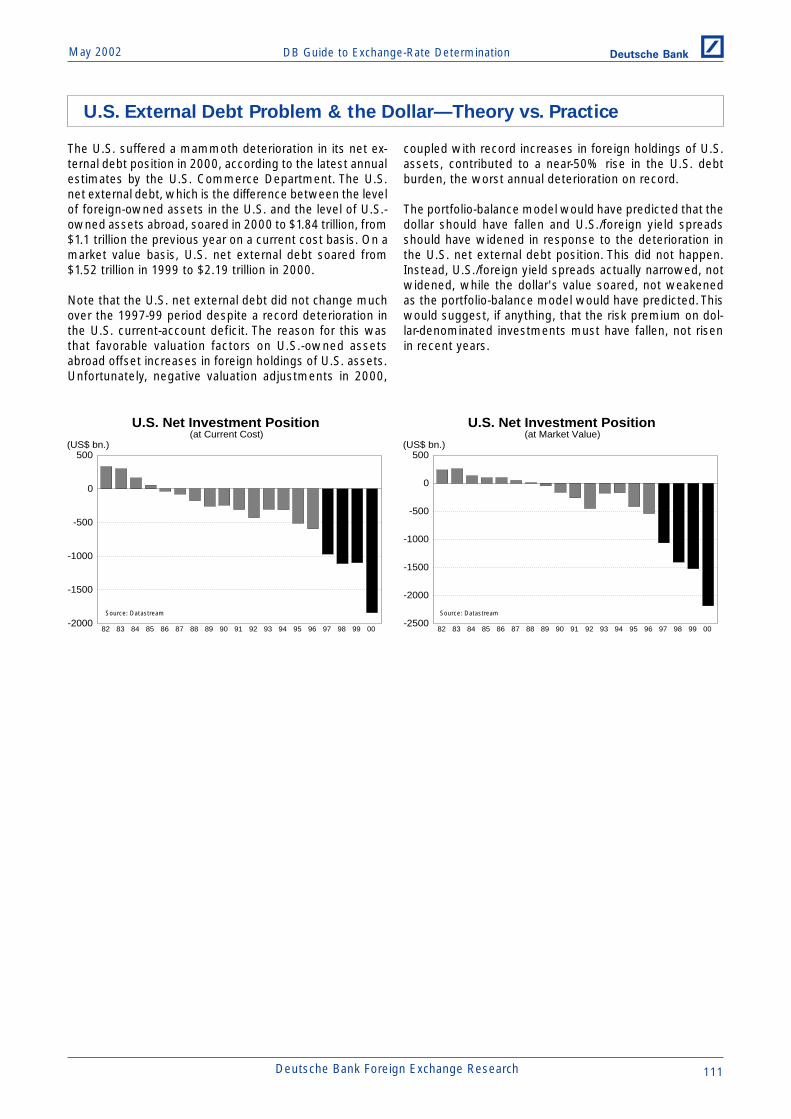
DB Guide to Exchange-Rate DeterminationMay 2002 Deutsche Bank @
Deutsche Bank Foreign Exchange Research 111
The U.S. suffered a mammoth deterioration in its net ex-ternal debt position in 2000, according to the latest annualestimates by the U.S. Commerce Department. The U.S.net external debt, which is the difference between the levelof foreign-owned assets in the U.S. and the level of U.S.-owned assets abroad, soared in 2000 to $1.84 trillion, from$1.1 trillion the previous year on a current cost basis. On amarket value basis, U.S. net external debt soared from$1.52 trillion in 1999 to $2.19 trillion in 2000.
Note that the U.S. net external debt did not change muchover the 1997-99 period despite a record deterioration inthe U.S. current-account deficit. The reason for this wasthat favorable valuation factors on U.S.-owned assetsabroad offset increases in foreign holdings of U.S. assets.Unfortunately, negative valuation adjustments in 2000,
coupled with record increases in foreign holdings of U.S.assets, contributed to a near-50% rise in the U.S. debtburden, the worst annual deterioration on record.
The portfolio-balance model would have predicted that thedollar should have fallen and U.S./foreign yield spreadsshould have widened in response to the deterioration inthe U.S. net external debt position. This did not happen.Instead, U.S./foreign yield spreads actually narrowed, notwidened, while the dollar's value soared, not weakenedas the portfolio-balance model would have predicted. Thiswould suggest, if anything, that the risk premium on dol-lar-denominated investments must have fallen, not risenin recent years.
U.S. Net Investment Position(at Current Cost)
-2000
-1500
-1000
-500
0
500
82 83 84 85 86 87 88 89 90 91 92 93 94 95 96 97 98 99 00
(US$ bn.)
U.S. Net Investment Position(at Market Value)
-2500
-2000
-1500
-1000
-500
0
500
82 83 84 85 86 87 88 89 90 91 92 93 94 95 96 97 98 99 00
(US$ bn.)
U.S. External Debt Problem & the Dollar—Theory vs. Practice
Source: Datastream Source: Datastream
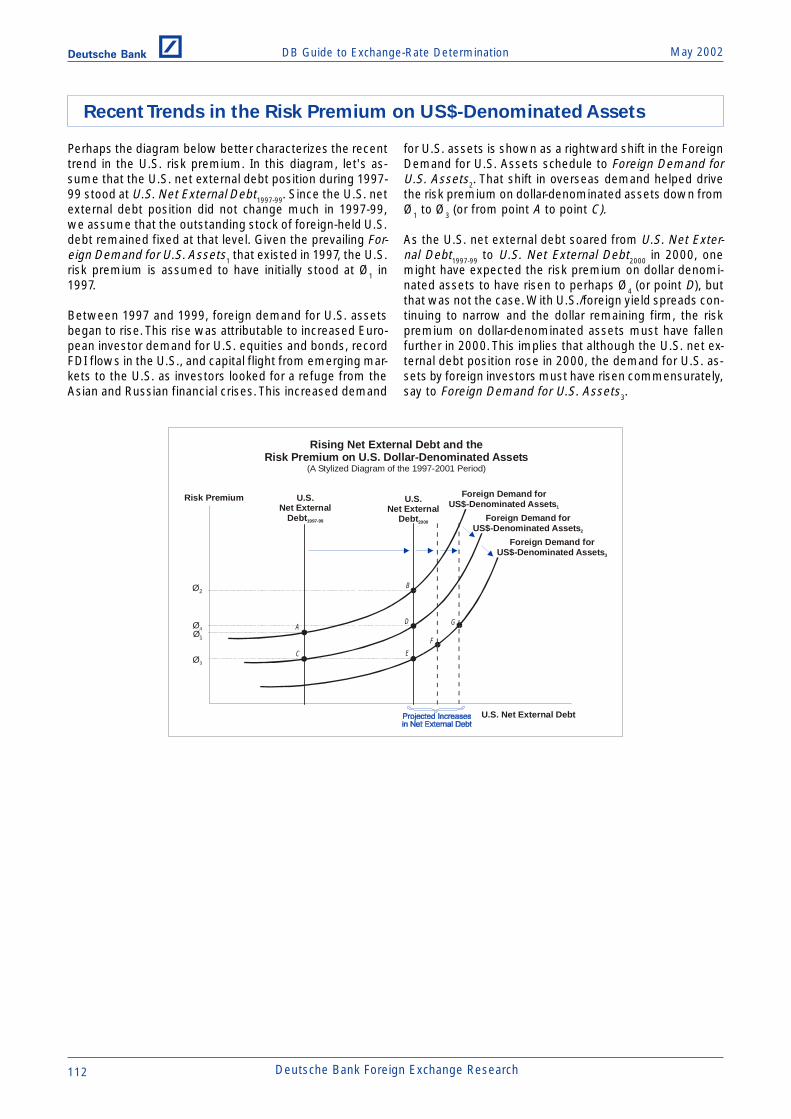
DB Guide to Exchange-Rate Determination May 2002Deutsche Bank @
112 Deutsche Bank Foreign Exchange Research
Perhaps the diagram below better characterizes the recenttrend in the U.S. risk premium. In this diagram, let's as-sume that the U.S. net external debt position during 1997-99 stood at U.S. Net External Debt1997-99. Since the U.S. netexternal debt position did not change much in 1997-99,we assume that the outstanding stock of foreign-held U.S.debt remained fixed at that level. Given the prevailing For-eign Demand for U.S. Assets1 that existed in 1997, the U.S.risk premium is assumed to have initially stood at Ø1 in1997.
Between 1997 and 1999, foreign demand for U.S. assetsbegan to rise. This rise was attributable to increased Euro-pean investor demand for U.S. equities and bonds, recordFDI flows in the U.S., and capital flight from emerging mar-kets to the U.S. as investors looked for a refuge from theAsian and Russian financial crises. This increased demand
for U.S. assets is shown as a rightward shift in the ForeignDemand for U.S. Assets schedule to Foreign Demand forU.S. Assets2. That shift in overseas demand helped drivethe risk premium on dollar-denominated assets down fromØ1 to Ø3 (or from point A to point C).
As the U.S. net external debt soared from U.S. Net Exter-nal Debt1997-99 to U.S. Net External Debt2000 in 2000, onemight have expected the risk premium on dollar denomi-nated assets to have risen to perhaps Ø4 (or point D), butthat was not the case. With U.S./foreign yield spreads con-tinuing to narrow and the dollar remaining firm, the riskpremium on dollar-denominated assets must have fallenfurther in 2000. This implies that although the U.S. net ex-ternal debt position rose in 2000, the demand for U.S. as-sets by foreign investors must have risen commensurately,say to Foreign Demand for U.S. Assets3.
Recent Trends in the Risk Premium on US$-Denominated Assets
Rising Net External Debt and theRisk Premium on U.S. Dollar-Denominated Assets
(A Stylized Diagram of the 1997-2001 Period)
Risk Premium
U.S. Net External Debt
U.S.Net External
Debt1997-99
Ø2
Ø1
Ø3
A
B
C
D
E
F
U.S.Net External
Debt2000
Foreign Demand forUS$-Denominated Assets1
Foreign Demand forUS$-Denominated Assets2
Foreign Demand forUS$-Denominated Assets3
Ø4G

DB Guide to Exchange-Rate DeterminationMay 2002 Deutsche Bank @
Deutsche Bank Foreign Exchange Research 113
RelativeIncrease inU.S. Equity
MarketCapitalization
Ratio
RelativeIncrease
inU.S. Wealth
RelativeRise inU.S.
AggregateDemand
RelativeRise in
U.S. RealInterest Rate
How a Relative Rise in the U.S. Equity Market’s Capitalization RatioWould Help Raise the Dollar’s Value
RelativeRise in U.S.HouseholdPropensity
to Consume
CapitalInflow
into U.S.
Rise inU.S. Dollar’s
Value
Analysts attribute the rise in the dollar's value versus theeuro in the second half of the 1990s to a wide range offactors including strong productivity gains in the U.S., struc-tural shifts in portfolio flows from Euroland to the U.S., in-creased M&A flows from Euroland to the U.S., structuralrigidities in Euroland, "New Economy" forces in the U.S.,relative economic growth rates, policy mixes, and euro-changeover risk. The portfolio-balance model offers an ad-ditional explanation—the increase in wealth generated bythe U.S. equity-market rally in the second half of the 1990sand its impact on U.S. domestic demand.
While it is true that both the U.S. and Euroland equity mar-kets rallied strongly in the second half of the 1990s, U.S.equity-market capitalization as a percentage of GDP roseby a larger amount than the comparable capitalization ra-tio in Euroland. According to the IMF, U.S. market capitali-zation rose from about 80% of GDP in 1994 to 160% in1999, while the comparable capitalization ratio in Eurolandrose from 30% of GDP to 90% of GDP. Thus, the capitali-zation ratio in the U.S. rose a full 100%, while Euroland'scapitalization rose just 60%. Since U.S. households havea higher propensity to consume out of equity wealth thando their Euroland counterparts, the greater increase in U.S.wealth relative to Euroland had a larger impact on the risein U.S. demand relative to Euroland demand in the secondhalf of the 1990s.
Shifts in Equity Market Capitalization Ratios & the Trend in Exchange Rates
Euroland & U.S. Equity-Market Capitalization(as a Percentage of GDP)
0
20
40
60
80
100
120
140
160
180
1991 1992 1993 1994 1995 1996 1997 1998 1999 2000 2001
Euroland----(%) U.S.____
Adapted from Guy Meredith,"Why Has the Euro Been So Weak?", IMFSource: FIBV
Euroland-U.S. Equity-Market CapitalizationDifferential and the Euro
0.80
0.90
1.00
1.10
1.20
1.30
1.40
-100
-90
-80
-70
-60
-50
-40
-30
1991 1992 1993 1994 1995 1996 1997 1998 1999 2000 2001
US$/Euro----(%) Euroland-U.S. Capitalization Ratios___
Adapted from Guy Meredith,"Why Has the Euro Been So Weak?", IMFSource: FIBV

DB Guide to Exchange-Rate Determination May 2002Deutsche Bank @
114 Deutsche Bank Foreign Exchange Research
At the outset of the euro's launch, EMU optimists pre-dicted that global investors and central banks would at-tempt to build their holdings of euro assets at the expenseof their dollar holdings. It was widely felt that such portfo-lio shifts would be extremely bullish for the euro.
What was not considered by EMU optimists was the pos-sibility that issuers might also find the euro as an attrac-tive vehicle in which to fund their operations. If the issu-ance of euro-denominated debt exceeded the demand forthat debt, then the euro would weaken, not strengthen.
That is pretty much what happened to the euro over the1999-2001 period. Issuance of euro-denominated debt by
non-residents soared between 1999 and 2001, both inabsolute terms and as a share of all foreign-currency de-nominated debt. As shown in the accompanying chart, theshare of international debt denominated in euros rose from17% prior to the euro's launch to around 27% in 2000.Most of that increase in debt was purchased by Eurolandresidents, as little was purchased by international inves-tors.
Overall, the increased issuance of euro-denominated debt,the increased demand for foreign equities by euro-area resi-dents, and the stepped-up acquisition of U.S. firms by Eu-ropean firms resulted in a large flow of capital out ofEuroland, which acted to depress the euro's value overthe 1999-01 period.
Euro-Denominated Debt Issuance and the Value of the Euro
IncreasedInvestment in
Non-Euro Assetsby EurolandResidents
How Euro-Area Portfolio Shifts Might HaveContributed to a Trend Decline in the Euro’s Value
CapitalOutflow
fromEuroland
Decline inEuro’sValue
Increase inEuro-Denominated
Borrowingby Non-Residents
Euro-Denominated Share ofInternational Debt Issues
(Percentage of Total Issues in All Currencies)
16
18
20
22
24
26
28
1994 1995 1996 1997 1998 1999 2000
Current Currency Values----(%) Constant Currency Values____
Adapted from Guy Meredith,"Why Has the Euro Been So Weak?", IMFSource: Detkon and Hartmann (2000)
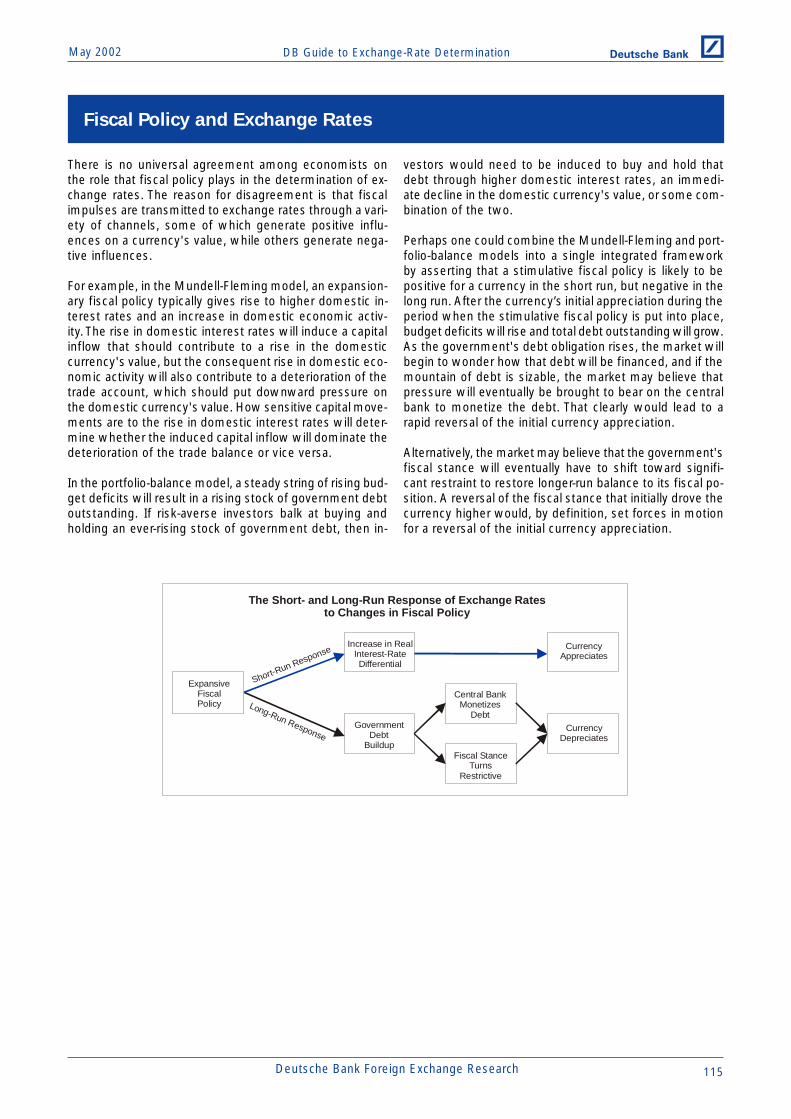
DB Guide to Exchange-Rate DeterminationMay 2002 Deutsche Bank @
Deutsche Bank Foreign Exchange Research 115
There is no universal agreement among economists onthe role that fiscal policy plays in the determination of ex-change rates. The reason for disagreement is that fiscalimpulses are transmitted to exchange rates through a vari-ety of channels, some of which generate positive influ-ences on a currency's value, while others generate nega-tive influences.
For example, in the Mundell-Fleming model, an expansion-ary fiscal policy typically gives rise to higher domestic in-terest rates and an increase in domestic economic activ-ity. The rise in domestic interest rates will induce a capitalinflow that should contribute to a rise in the domesticcurrency's value, but the consequent rise in domestic eco-nomic activity will also contribute to a deterioration of thetrade account, which should put downward pressure onthe domestic currency's value. How sensitive capital move-ments are to the rise in domestic interest rates will deter-mine whether the induced capital inflow will dominate thedeterioration of the trade balance or vice versa.
In the portfolio-balance model, a steady string of rising bud-get deficits will result in a rising stock of government debtoutstanding. If risk-averse investors balk at buying andholding an ever-rising stock of government debt, then in-
vestors would need to be induced to buy and hold thatdebt through higher domestic interest rates, an immedi-ate decline in the domestic currency's value, or some com-bination of the two.
Perhaps one could combine the Mundell-Fleming and port-folio-balance models into a single integrated frameworkby asserting that a stimulative fiscal policy is likely to bepositive for a currency in the short run, but negative in thelong run. After the currency’s initial appreciation during theperiod when the stimulative fiscal policy is put into place,budget deficits will rise and total debt outstanding will grow.As the government's debt obligation rises, the market willbegin to wonder how that debt will be financed, and if themountain of debt is sizable, the market may believe thatpressure will eventually be brought to bear on the centralbank to monetize the debt. That clearly would lead to arapid reversal of the initial currency appreciation.
Alternatively, the market may believe that the government'sfiscal stance will eventually have to shift toward signifi-cant restraint to restore longer-run balance to its fiscal po-sition. A reversal of the fiscal stance that initially drove thecurrency higher would, by definition, set forces in motionfor a reversal of the initial currency appreciation.
The Short- and Long-Run Response of Exchange Ratesto Changes in Fiscal Policy
ExpansiveFiscalPolicy
Increase in RealInterest-RateDifferential
CurrencyAppreciates
GovernmentDebt
Buildup
CurrencyDepreciates
Short-Run Response
Long-Run Response
Central BankMonetizes
Debt
Fiscal StanceTurns
Restrictive
Fiscal Policy and Exchange Rates

DB Guide to Exchange-Rate Determination May 2002Deutsche Bank @
116 Deutsche Bank Foreign Exchange Research
U.S./German Real Interest-Rate Differentialsand the U.S. Federal Budget Deficit
(1977-1987)
0
1
2
3
4
5
6
-800
-600
-400
-200
0
200
400
600
76 77 78 79 80 81 82 83 84 85 86 87
Budget Deficit as a % of GDP----U.S.-German Real 10-Yr.(bp)____
The U.S. Dollar and U.S. Defense Spending
3
4
5
6
7
8
70
80
90
100
110
120
130
140
150
74 76 78 80 82 84 86 88 90 92 94 96 98 00 02
Defense Spending(% of GDP)----US$ Index____
One of the best examples of how a stimulative fiscal policycan have a favorable impact on a currency is U.S. Presi-dent Reagan's Economic Recovery and Tax Act of 1981.The dollar rose sharply following the passage of the act asit contributed to both a rise in the dollar's real long-runequilibrium level and a significant rise in U.S./foreign realinterest-rate differentials.
The U.S. 1981 tax bill included cuts in marginal tax ratesfor individuals and investment tax credits and accelerateddepreciation allowances for corporations to help spur busi-ness investment. From an exchange-rate determinationstandpoint, the business-oriented tax cuts helped boostthe dollar's real long-run equilibrium value because theymade U.S. industry more competitive. But the dollar gotits real boost when U.S. government spending soared atthe same time that taxes were cut. That pushed the U.S.budget deficit as a percentage of GDP from 1.6% up to ahigh of 6.1% in just four years in the early 1980s. Alongwith an extremely tight monetary policy during the early1980s, this helped drive U.S./European real yield spreadsup sharply, thereby sending the dollar up sharply as well.
Until the last decade, trends in U.S. military spending as apercentage of GDP were highly positively correlated withtrends in the dollar's value. Higher military spending wasgenerally dollar supportive, while lower military spendingwas generally dollar bearish. Academic research positedthat when U.S. military spending rose, it was likely due toincreased uncertainty in the global political landscape, withthe dollar benefiting from its role as a safe-haven currencyduring troubled times. However, the close relationshipbetween military spending and the dollar appears to havebroken down in recent years.
The U.S. Dollar and theU.S. Federal Budget Deficit
(1976-1990)
1
2
3
4
5
6
80
90
100
110
120
130
140
150
76 77 78 79 80 81 82 83 84 85 86 87 88 89 90
Deficit as a % of GDP----US$ Index____
U.S. Fiscal Policy and the Dollar
Source: Datastream
Source: Datastream
Source: Datastream

DB Guide to Exchange-Rate DeterminationMay 2002 Deutsche Bank @
Deutsche Bank Foreign Exchange Research 117
Japan’s Budget Deficit(Excluding Social Security)
7.16.7
7.0
7.8
6.7
5.3
6.56.0
4.74.5
1.6
0.7
1.51.42.0
2.5
3.53.1
4.0
6.2
0
2
4
6
8
10
83 84 85 86 87 88 89 90 91 92 93 94 95 96 97 98 99 00 01 02
(% of GDP)
Source: OECD Economic Outlook, 2001-02 OECD Projections
Japan’s Mounting Debt Problem(Assuming Unchanged Fiscal Policies)
0
50
100
150
200
250
300
1990 1995 2000 2005 2010 2015 2020 2025
Assuming 3.5% Real Interest Rate____ 1.5%----Net Debt(% of GDP)
Source: OECD Economic Outlook, June 1999
Japan’s Fiscal Stance and GDP Growth(Annual Percentage Change in Japan’s Structural
Balance as a Percent of GDP)
-2.0
-1.0
0.0
1.0
2.0
3.0
4.0
91 92 93 94 95 96 97 98 99 00 01e 02e 03e 04e
GDP Growth(%)----Fiscal Stance(Led One Year)(%)____
Expansionary
Restictive
Japan's fiscal deficit—at both the central and local author-ity level—has been swelling in recent years, partly becauseof past stimulus efforts and partly because governmentrevenue growth has been weak during Japan's decade-long slump. Japan already has the industrial world's larg-est government debt outstanding as a percentage of GDP,and that debt burden seems certain to mount in futureyears, according to OECD projections. Even those debtprojections probably understate Japan's true debt burdenby a sizeable amount, given Japan's seriously under-fundedsocial security and public pension systems, as well as otheroff-balance-sheet liabilities that the government will beobliged to underwrite.
The path for Japanese debt is clearly not sustainable. Inthe long run, the Japanese government will have to dowhat every other government in the industrial world hashad to do when faced with a similar set of circumstances.That is, the Japanese government will have to engineer amulti-year plan of fiscal consolidation—either by raisingtaxes and/or by curtailing government spending—to bringthe budget deficit/GDP ratio down to sustainable levels.
Changes in Japan's fiscal stance have historically had amarked impact on Japan's GDP growth rate, with stimula-tive policies boosting GDP growth higher and restrictivepolicies dragging GDP growth lower. Therefore, as Japan'sfiscal stance is tightened, pressure will come to bear onthe BoJ to turn more accommodative to sustain economicgrowth.
As a result of these anticipated policy changes, Japan'sfiscal/monetary policy mix appears destined to shift towarda stance of significant fiscal restraint and considerablemonetary ease. Hence, Japan's policy mix should there-fore be highly yen negative. Indeed, since such a policymix will need to be put in place for a number of years, theyen appears destined to weaken on a long-term basis.
Japan’s Fiscal Policy Mix and the Yen
Source: OECD Economic Outlook

DB Guide to Exchange-Rate Determination May 2002Deutsche Bank @
118 Deutsche Bank Foreign Exchange Research
Euroland’s Budget Deficit and the Euro
0.80
0.90
1.00
1.10
1.20
1.30
1.40
-1
0
1
2
3
4
5
6
7
1992 1993 1994 1995 1996 1997 1998 1999 2000 2001 2002 2003
US$/Euro(line)Budget Deficit/GDP(%)(bars)
Source: OECD Economic Outlook
Canada’s Budget Deficit and the C$
(1.60)
(1.50)
(1.40)
(1.30)
(1.20)
-4
-2
0
2
4
6
8
10
1992 1993 1994 1995 1996 1997 1998 1999 2000 2001 2002 2003
C$/US$(reverse scale)(line)Budget Deficit/GDP(%)(bars)
Source: OECD Economic Outlook
Australia’s Budget Deficit and the A$
0.50
0.55
0.60
0.65
0.70
0.75
0.80
-2
0
2
4
6
8
1992 1993 1994 1995 1996 1997 1998 1999 2000 2001 2002 2003
US$/A$(line)Budget Deficit/GDP(%)(bars)
Source: OECD Economic Outlook
Sweden’s Budget Deficit and the Krona
(11)
(10)
(9)
(8)
(7)
(6)
(5)
-5
0
5
10
15
1992 1993 1994 1995 1996 1997 1998 1999 2000 2001 2002 2003
Skr/US$(reverse scale)(line)Budget Deficit/GDP(%)(bars)
Source: OECD Economic Outlook
A number of currencies—notably the Canadian dollar, euro,Australian dollar, and Swedish krona—weakened on a trendbasis over the past 10 years as their respective govern-ments engineered major fiscal consolidations to rein inexcessively wide budget deficits.
In all cases, pressure was brought to bear on the respec-tive central banks to pursue highly accommodative mon-etary policies during those extended periods of fiscal con-solidations. Therefore, the policy mix in each of those casesexerted significant downward pressure on the respectivecurrencies.
The Experience of Other Countries with Restrictive Fiscal Policies
in the Past 10 Years

DB Guide to Exchange-Rate DeterminationMay 2002 Deutsche Bank @
Deutsche Bank Foreign Exchange Research 119
Is a strongly growing domestic economy bullish or bear-ish for a currency? According to the monetary model ofexchange-rate determination, an increase in domestic eco-nomic activity will give rise to an increase in the demandfor domestic money, and the increased demand for money(everything else being equal) should then lead to an ap-preciation of the domestic currency. In contrast, in theMundell-Fleming and Balance of Payments Flow models,an increase in domestic economic activity will give rise toan increase in import demand, which should cause thetrade balance to deteriorate. The deterioration of the tradebalance should then exert downward pressure on the do-mestic currency.
One could combine the conclusions drawn from these twomodels by arguing that in the short/medium run, a stronglygrowing domestic economy should be bullish for a domes-tic currency because increases in economic activity areoften associated with attractive investment opportunitiesthat should attract significant inflows of capital from abroad.But in the long run, the balance of payments may place aconstraint on how rapidly a domestic economy can growrelative to growth overseas. If strong domestic demandgives rise to a significant deterioration of the trade bal-ance that is deemed unsustainable, then either domesticdemand will have to be restrained or the domesticcurrency's real value will have to fall to bring the trade/current-account imbalance back to sustainable levels.
How Changes in Economic Activity Influence Exchange Ratesin the Balance of Payments Flow (Mundell-Fleming) Model
of Exchange-Rate Determination
Increase inDomesticEconomic
Activity
Deteriorationof
TradeBalance
Decrease inDomestic
Currency’sValue
Deteriorationin Balance
of Payments
How Changes in Economic Activity Influence Exchange Ratesin the Monetary Model
of Exchange-Rate Determination
Increase inDomesticEconomic
Activity
Increase inDemand
for Money
Increase inDomestic
Currency’sValue
Economic Growth and Exchange Rates

DB Guide to Exchange-Rate Determination May 2002Deutsche Bank @
120 Deutsche Bank Foreign Exchange Research
Trends in economic activity have been a key determinantof exchange-rate trends in recent years. In the case of thedollar, the trends in the U.S. unemployment rate and U.S.consumer confidence were, until recently, highly correlatedwith the trend in the dollar. However, in both cases, therewas a disconnect between those economic indicators andthe dollar in 2001.
The trend in the euro has also been found to be highlycorrelated with the difference in U.S./Euroland expectedGDP growth rates since the euro's inception in 1999.
Expectations of U.S./European GDP Growthand the Euro
0.80
0.90
1.00
1.10
1.20
-1.2
-1.0
-0.8
-0.6
-0.4
-0.2
0.0
0.2
0.4
1999 2000 2001 2002
US$/Euro----German-U.S. GDP Expectations(%)____
Source: Consensus Economics Inc.;Forecasts of U.S. and German GDP growthfor the following year (three-month average)
Euroland/U.S. Real GDP Growth Differentialsand the Euro
(Year-over-Year Percent Changes in Real GDP)
0.80
0.90
1.00
1.10
1.20
1.30
1.40
1.50
-6
-4
-2
0
2
4
6
8
91 92 93 94 95 96 97 98 99 00 01 02
US$/Euro----(%) EMU-US GDP Diff.(led 2 qtr.)____
U.S. GDP Growth and the Dollar(1993-2002)
75
80
85
90
95
100
105
110
0
1
2
3
4
5
6
1993 1994 1995 1996 1997 1998 1999 2000 2001 2002
US$ Major Currency Index----Real GDP(y-o-y % chg.)____
U.S. Consumer Sentiment and the Dollar(Conference Board Consumer Confidence Index)
(1.50)
(1.40)
(1.30)
(1.20)
(1.10)
(1.00)
(0.90)
(0.80)
60
80
100
120
140
160
1994 1995 1996 1997 1998 1999 2000 2001 2002
US$/Euro(reverse scale)----Consumer Confidence Index____
U.S. Unemployment and the Dollar(1995-2002)
0.80
0.90
1.00
1.10
1.20
1.30
1.40
1.50
3.5
4.0
4.5
5.0
5.5
6.0
1995 1996 1997 1998 1999 2000 2001 2002
US$/Euro----U.S. Unemployment Rate(%)____
How Changes in Economic Activity Have Influenced Recent Trends in
Exchange Rates
Source: Datastream
Source: DatastreamSource: Datastream
Source: Datastream

DB Guide to Exchange-Rate DeterminationMay 2002 Deutsche Bank @
Deutsche Bank Foreign Exchange Research 121
The Yen & Japan’s Leading Economic Indicator(OECD Composite Leading Indicator for Japan)
(6)
(4)
(2)
0
2
4
6
8
(150)
(140)
(130)
(120)
(110)
(100)
(90)
(80)
1993 1994 1995 1996 1997 1998 1999 2000 2001 2002
Leading Indicator(%)----Yen/US$(reverse scale)____
U.K./German Unemployment and the Pound
2.00
2.20
2.40
2.60
2.80
3.00
3.20
3.40
1.0
1.5
2.0
2.5
3.0
3.5
1996 1997 1998 1999 2000 2001 2002
DM/£----German/U.K. Unemployment Rate(ratio)____
Trends in Global Economic Growthand the Australian Dollar
-30
-20
-10
0
10
20
30
-6
-4
-2
0
2
4
6
8
89 90 91 92 93 94 95 96 97 98 99 00 01 02
US$/A$(y-o-y %)----OECD Leading Economic Indicator(y-o-y %)____
Other currencies have also exhibited a tendency to movein tandem with relative economic performances. For in-stance, there has been a close relationship in recent yearsbetween the yen and the OECD's leading indicator of Japa-nese economic activity, with weaker Japanese growthprospects negative for the yen and vice versa. In the caseof the British pound, the ratio of German/U.K. unemploy-ment rates has served as a good guide to sterling's pros-pects. All things being equal, a decline (rise) in the U.K.unemployment rate relative to the German unemploymentrate has been bullish (bearish) for sterling.
Finally, in the case of Australia, the A$'s fortunes have of-ten been tied to global economic prospects, with strongglobal growth positive for the A$ and vice versa. Evidently,strong global growth boosts the world's demand for com-modities, which is positive for Australia's trade balance,and thus the A$.
Source: Datastream Source: Datastream
Source: Datastream

DB Guide to Exchange-Rate Determination May 2002Deutsche Bank @
122 Deutsche Bank Foreign Exchange Research
It is not too difficult to unearth the reasons for the dollar'srising trend over the past six years. The U.S. grew two tothree times faster than either the German or Japaneseeconomies, with 'New Economy' forces in the U.S. widelycredited for the relative strength of the U.S. economy, andthus the dollar.
According to the ‘New Economy’ view, the surge in U.S.investment spending and the consequent rise in U.S. pro-ductivity helped push U.S. growth significantly above thepace of overseas growth, which, in turn, raised the dollar'sreal long-run equilibrium value versus the euro. This view
appears to be shared by many economists. However, whatis open to dispute is: (1) by how much did the dollar's reallong-run equilibrium value actually rise, and (2) did thedollar's rise in 2000-01 push it above its new long-run equi-librium level?
(Note that the German economy did not fare much betterthan Japan over the past 10 years. Given that the 1990shave often been characterized as Japan's lost decade, theycould just as easily have been characterized as Germany'slost decade as well.)
Structural Rigidities, Long-Term Growth, and Long-Term Trends
in Exchange Rates
U.S., German, and Japanese Real GDP GrowthAnnual Percentage Growth Rates
(1993-2002)1993-2002
1993 1994 1995 1996 1997 1998 1999 2000 2001p 2002p Average
U.S. 2.7 4.0 2.7 3.6 4.4 4.3 4.1 4.1 1.2 2.3 3.3
Germany -1.1 2.3 1.7 0.8 1.4 2.0 1.8 3.0 0.6 0.9 1.2
Japan 0.5 1.1 1.5 3.6 1.8 -1.0 0.7 2.2 -0.4 -1.0 0.9
Source: IMF
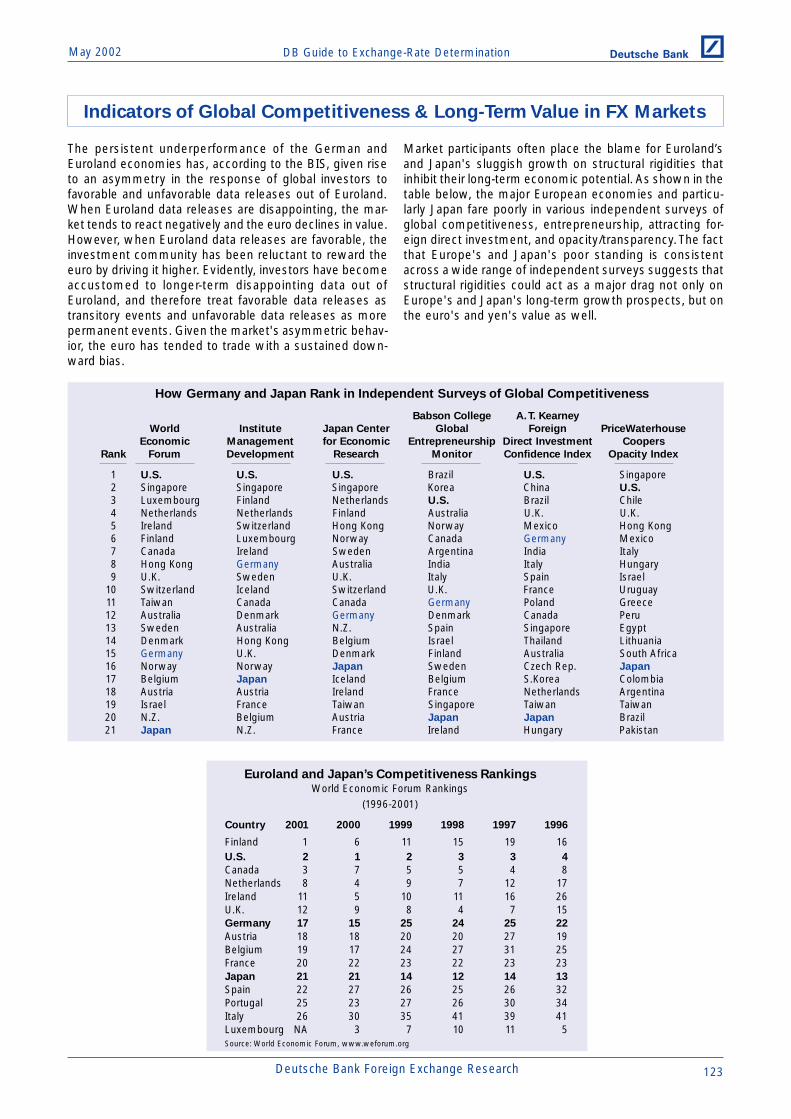
DB Guide to Exchange-Rate DeterminationMay 2002 Deutsche Bank @
Deutsche Bank Foreign Exchange Research 123
How Germany and Japan Rank in Independent Surveys of Global Competitiveness
Babson College A. T. Kearney
World Institute Japan Center Global Foreign PriceWaterhouse
Economic Management for Economic Entrepreneurship Direct Investment Coopers
Rank Forum Development Research Monitor Confidence Index Opacity Index
1 U.S. U.S. U.S. Brazil U.S. Singapore2 Singapore Singapore Singapore Korea China U.S.
3 Luxembourg Finland Netherlands U.S. Brazil Chile4 Netherlands Netherlands Finland Australia U.K. U.K.5 Ireland Switzerland Hong Kong Norway Mexico Hong Kong6 Finland Luxembourg Norway Canada Germany Mexico7 Canada Ireland Sweden Argentina India Italy8 Hong Kong Germany Australia India Italy Hungary9 U.K. Sweden U.K. Italy Spain Israel
10 Switzerland Iceland Switzerland U.K. France Uruguay11 Taiwan Canada Canada Germany Poland Greece12 Australia Denmark Germany Denmark Canada Peru13 Sweden Australia N.Z. Spain Singapore Egypt14 Denmark Hong Kong Belgium Israel Thailand Lithuania15 Germany U.K. Denmark Finland Australia South Africa16 Norway Norway Japan Sweden Czech Rep. Japan
17 Belgium Japan Iceland Belgium S.Korea Colombia18 Austria Austria Ireland France Netherlands Argentina19 Israel France Taiwan Singapore Taiwan Taiwan20 N.Z. Belgium Austria Japan Japan Brazil21 Japan N.Z. France Ireland Hungary Pakistan
Euroland and Japan’s Competitiveness RankingsWorld Economic Forum Rankings
(1996-2001)
Country 2001 2000 1999 1998 1997 1996
Finland 1 6 11 15 19 16U.S. 2 1 2 3 3 4
Canada 3 7 5 5 4 8Netherlands 8 4 9 7 12 17Ireland 11 5 10 11 16 26U.K. 12 9 8 4 7 15Germany 17 15 25 24 25 22
Austria 18 18 20 20 27 19Belgium 19 17 24 27 31 25France 20 22 23 22 23 23Japan 21 21 14 12 14 13
Spain 22 27 26 25 26 32Portugal 25 23 27 26 30 34Italy 26 30 35 41 39 41Luxembourg NA 3 7 10 11 5Source: World Economic Forum, www.weforum.org
The persistent underperformance of the German andEuroland economies has, according to the BIS, given riseto an asymmetry in the response of global investors tofavorable and unfavorable data releases out of Euroland.When Euroland data releases are disappointing, the mar-ket tends to react negatively and the euro declines in value.However, when Euroland data releases are favorable, theinvestment community has been reluctant to reward theeuro by driving it higher. Evidently, investors have becomeaccustomed to longer-term disappointing data out ofEuroland, and therefore treat favorable data releases astransitory events and unfavorable data releases as morepermanent events. Given the market's asymmetric behav-ior, the euro has tended to trade with a sustained down-ward bias.
Market participants often place the blame for Euroland’sand Japan's sluggish growth on structural rigidities thatinhibit their long-term economic potential. As shown in thetable below, the major European economies and particu-larly Japan fare poorly in various independent surveys ofglobal competitiveness, entrepreneurship, attracting for-eign direct investment, and opacity/transparency. The factthat Europe's and Japan's poor standing is consistentacross a wide range of independent surveys suggests thatstructural rigidities could act as a major drag not only onEurope's and Japan's long-term growth prospects, but onthe euro's and yen's value as well.
Indicators of Global Competitiveness & Long-Term Value in FX Markets

DB Guide to Exchange-Rate Determination May 2002Deutsche Bank @
124 Deutsche Bank Foreign Exchange Research
The argument most often made to justify official interven-tion in the FX markets is that the exchange rate is simplytoo important a price to be left to the market. Interventionadvocates contend that financial markets cannot be trustedto get the exchange rate "right". They argue that interven-tion is necessary to keep exchange rates broadly in linewith their long-run fundamental equilibrium value. Thus,the case for intervention relies largely on the belief thatthe authorities can do a better job than the market in termsof driving exchange rates towards their long-run equilib-rium value. This assumes that government officials havebetter information and greater knowledge than the mar-ket, which, of course, is highly debatable.
No precise rules govern the conduct of FX intervention,but the IMF has established guidelines to prevent onecountry from unfairly manipulating its exchange rate to gainan unfair advantage over others.
Numerous empirical studies have been conducted to as-sess whether intervention operations have a statisticallysignificant and quantitatively important impact on exchangerates. In most studies, the results have been negative. Inthose cases where a statistically significant relationshipbetween intervention and exchange rates has been found,it has generally been the case that the impact was notquantitatively important, i.e., the effect of the interventioneffort was neither sizable nor lasting. The major reason forsuch findings is that intervention operations are typicallysmall relative to the volume of foreign exchange thatchanges hands on a daily basis in the FX markets. Dailyintervention efforts typically average in the hundreds ofmillions or perhaps only several billion. This contrasts withaverage daily FX turnover of $1.2 trillion. While episodes ofsuccessful intervention can be found, no systematic rela-tionship exists between official intervention efforts and thetrend in exchange rates.
Why FX Intervention Advocates Believe
That the Market Cannot Be Trusted
to Get the Exchange Rate "Right"
• FX market may fail to use "all" existing information.
• FX market may be dominated by noise (trend-fol-lowing) traders.
• Excessive speculation.
• Excessive risk aversion (shortage of speculation).
• FX market may be using a defective model of ex-change-rate determination.
• Market perceptions of the future may be flawed orinappropriately skewed.
• FX market may be pre-occupied with extraneousinformation.
• FX market may be subject to persistent moodswings, shifting from excessive optimism to exces-sive pessimism, and then back.
Acceptable Forms of FX Intervention
That Help Foster Orderly Market Conditions
• Simple smoothing operations to limit erratic short-run fluctuation in exchange rates.
• Counter excessive speculation or market overreac-tion to news.
• Trend-breaking operation to put an end to an unde-sirable uptrend or downtrend in a currency's value.
• Counter excessive risk aversion.
• Intervention to target a currency's value to somespecific level or range.
• Intervention to prevent large and persistentmisalignments.
Central Bank Intervention

DB Guide to Exchange-Rate DeterminationMay 2002 Deutsche Bank @
Deutsche Bank Foreign Exchange Research 125
Dollar Over/Undervaluations & U.S. Intervention(DM/US$ PPP Estimates, 1998-2002)
-1000
-500
0
500
1000
1500
2000
-20
-10
0
10
20
30
40
1998 1999 2000 2001 2002
Intervention(US$ mn.)(bars)% Over/Under PPP Level(DM/US$)(line)
Dollar Overvalued -- Sell Dollars
Dollar Undervalued -- Buy Dollars
U.S. intervention policy has been highly changeable overthe past 30 years. Official attitude toward the dollar hasswung from benign neglect, to active encouragement ofa weaker dollar, to active intervention to stop the dollarfrom falling, and most recently to acknowledge that astrong dollar is in the U.S. national interest.
Intervention was most pronounced in the late 1970s, thelate 1980s, and in 1994-95. Since 1995, the Fed has inter-vened on only two occasions—in mid-1998 (to guide thedollar lower versus the yen) and in the fall of 2000 (to guidethe dollar lower versus the euro).
Dollar Over/Undervaluations & U.S. Intervention(1976-1980)
-4000
-2000
0
2000
4000
6000
-40
-20
0
20
40
60
1976 1977 1978 1979 1980
Intervention(US$ mn.)(bars)% Over/Under PPP Level(DM/US$)(line)
Dollar Overvalued--Sell Dollars
Dollar Undervalued--Buy Dollars
Dollar Over/Undervaluations & U.S. Intervention(1981-1986)
-4000
-2000
0
2000
4000
6000
-40
-20
0
20
40
60
1981 1982 1983 1984 1985 1986
Intervention(US$ mn.)(bars)% Over/Under PPP Level(DM/US$)(line)
Dollar Overvalued--Sell Dollars
Dollar Undervalued--Buy Dollars
Dollar Over/Undervaluations & U.S. Intervention(1987-1998)
-4000
-2000
0
2000
4000
6000
-40
-20
0
20
40
60
87 88 89 90 91 92 93 94 95 96 97 98
Intervention(US$ mn.)(bars)% Over/Under PPP Level(DM/US$)(line)
Dollar Overvalued--Sell Dollars
Dollar Undervalued--Buy Dollars
Changeability of U.S. Exchange-Rate Policy
Administration/Period Policy
Nixon 1969-71 Benign neglect.1971-73 Cut dollar loose from gold.
Devaluated dollar.
Carter 1977-78 Encouraged decline of dollar.1978-80 Major intervention to arrest dollar’s decline.
Reagan/ 1981-84 Benign neglect/laissez-faire attitude towardBush dollar’s rise.
1985-86 Encouraged decline of dollar (Plaza Accord).1987-92 Promoted dollar stability (Louvre Accord).
Clinton 1993-96 Encouraged decline of dollar.1997-00 Strong-dollar policy.
Bush 2001- Strong-dollar policy.
U.S. Intervention Policy
Source: Federal Reserve Bank, Datastream Source: Federal Reserve Bank, Datastream
Source: Federal Reserve Bank, Datastream Source: Federal Reserve Bank, Datastream
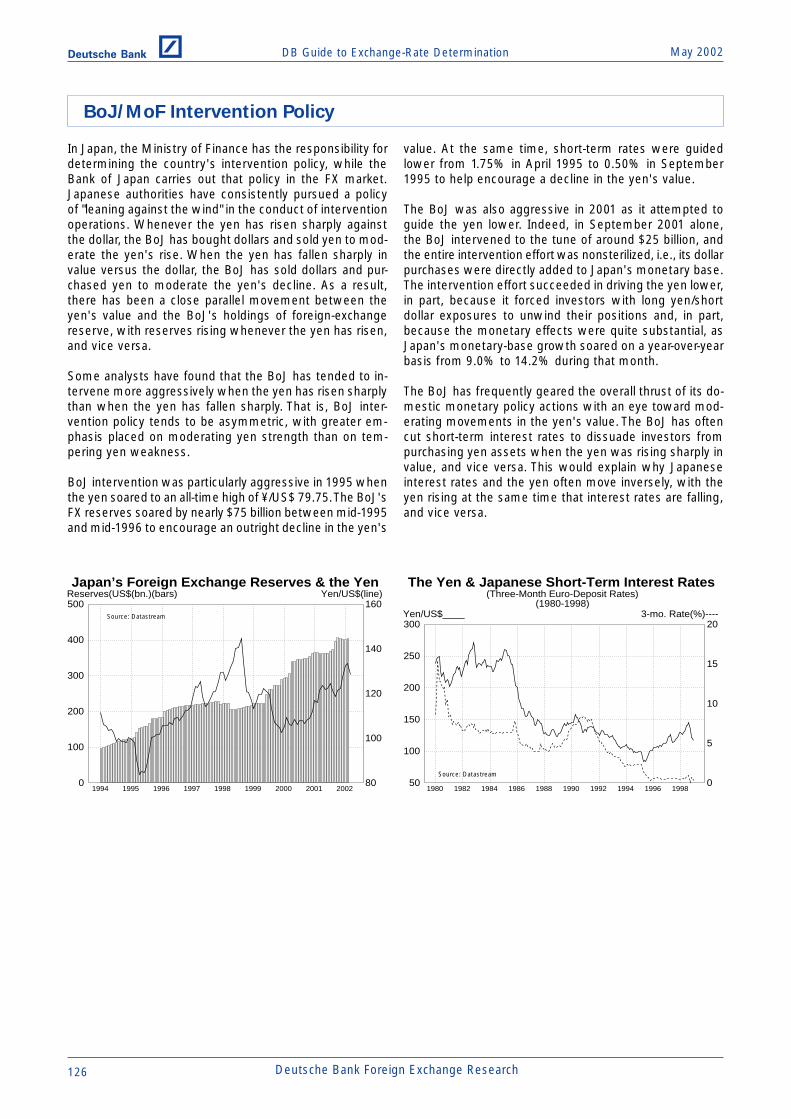
DB Guide to Exchange-Rate Determination May 2002Deutsche Bank @
126 Deutsche Bank Foreign Exchange Research
In Japan, the Ministry of Finance has the responsibility fordetermining the country's intervention policy, while theBank of Japan carries out that policy in the FX market.Japanese authorities have consistently pursued a policyof "leaning against the wind" in the conduct of interventionoperations. Whenever the yen has risen sharply againstthe dollar, the BoJ has bought dollars and sold yen to mod-erate the yen's rise. When the yen has fallen sharply invalue versus the dollar, the BoJ has sold dollars and pur-chased yen to moderate the yen's decline. As a result,there has been a close parallel movement between theyen's value and the BoJ's holdings of foreign-exchangereserve, with reserves rising whenever the yen has risen,and vice versa.
Some analysts have found that the BoJ has tended to in-tervene more aggressively when the yen has risen sharplythan when the yen has fallen sharply. That is, BoJ inter-vention policy tends to be asymmetric, with greater em-phasis placed on moderating yen strength than on tem-pering yen weakness.
BoJ intervention was particularly aggressive in 1995 whenthe yen soared to an all-time high of ¥/US$ 79.75. The BoJ'sFX reserves soared by nearly $75 billion between mid-1995and mid-1996 to encourage an outright decline in the yen's
Japan’s Foreign Exchange Reserves & the Yen
80
100
120
140
160
0
100
200
300
400
500
1994 1995 1996 1997 1998 1999 2000 2001 2002
Yen/US$(line)Reserves(US$(bn.)(bars)
BoJ/MoF Intervention Policy
The Yen & Japanese Short-Term Interest Rates(Three-Month Euro-Deposit Rates)
(1980-1998)
0
5
10
15
20
50
100
150
200
250
300
1980 1982 1984 1986 1988 1990 1992 1994 1996 1998
3-mo. Rate(%)----Yen/US$____Source: Datastream
Source: Datastream
value. At the same time, short-term rates were guidedlower from 1.75% in April 1995 to 0.50% in September1995 to help encourage a decline in the yen's value.
The BoJ was also aggressive in 2001 as it attempted toguide the yen lower. Indeed, in September 2001 alone,the BoJ intervened to the tune of around $25 billion, andthe entire intervention effort was nonsterilized, i.e., its dollarpurchases were directly added to Japan's monetary base.The intervention effort succeeded in driving the yen lower,in part, because it forced investors with long yen/shortdollar exposures to unwind their positions and, in part,because the monetary effects were quite substantial, asJapan's monetary-base growth soared on a year-over-yearbasis from 9.0% to 14.2% during that month.
The BoJ has frequently geared the overall thrust of its do-mestic monetary policy actions with an eye toward mod-erating movements in the yen's value. The BoJ has oftencut short-term interest rates to dissuade investors frompurchasing yen assets when the yen was rising sharply invalue, and vice versa. This would explain why Japaneseinterest rates and the yen often move inversely, with theyen rising at the same time that interest rates are falling,and vice versa.
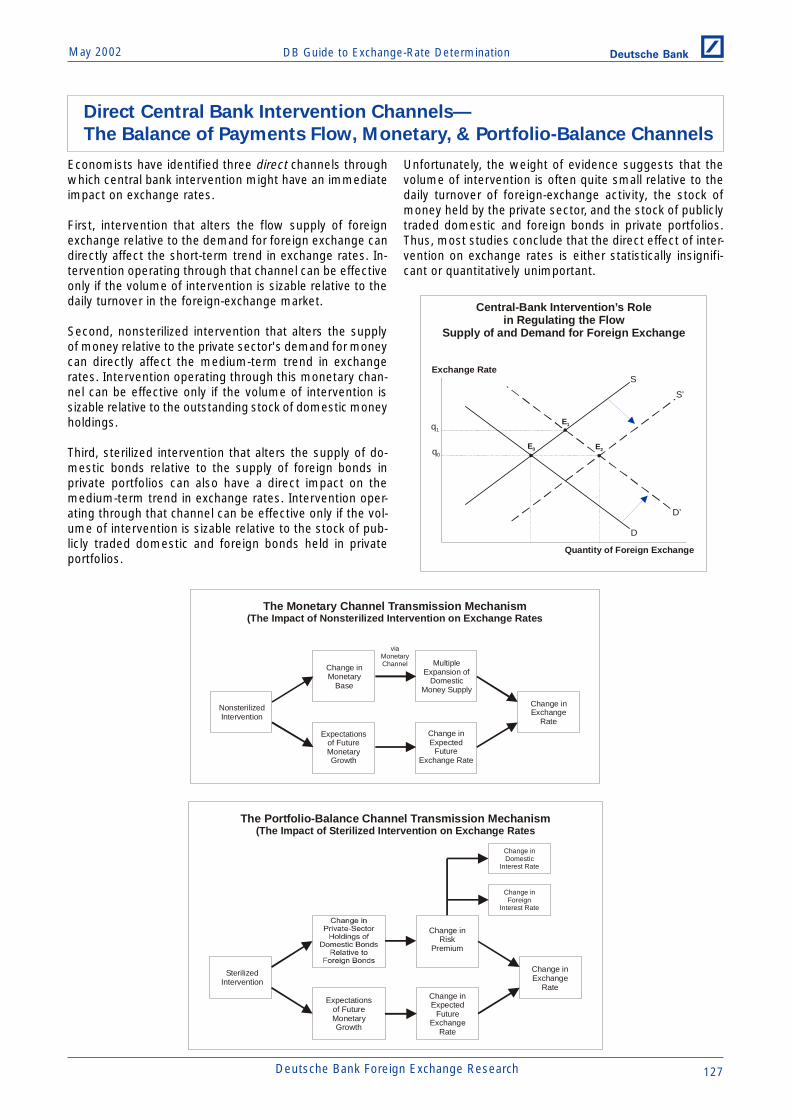
DB Guide to Exchange-Rate DeterminationMay 2002 Deutsche Bank @
Deutsche Bank Foreign Exchange Research 127
Economists have identified three direct channels throughwhich central bank intervention might have an immediateimpact on exchange rates.
First, intervention that alters the flow supply of foreignexchange relative to the demand for foreign exchange candirectly affect the short-term trend in exchange rates. In-tervention operating through that channel can be effectiveonly if the volume of intervention is sizable relative to thedaily turnover in the foreign-exchange market.
Second, nonsterilized intervention that alters the supplyof money relative to the private sector's demand for moneycan directly affect the medium-term trend in exchangerates. Intervention operating through this monetary chan-nel can be effective only if the volume of intervention issizable relative to the outstanding stock of domestic moneyholdings.
Third, sterilized intervention that alters the supply of do-mestic bonds relative to the supply of foreign bonds inprivate portfolios can also have a direct impact on themedium-term trend in exchange rates. Intervention oper-ating through that channel can be effective only if the vol-ume of intervention is sizable relative to the stock of pub-licly traded domestic and foreign bonds held in privateportfolios.
Unfortunately, the weight of evidence suggests that thevolume of intervention is often quite small relative to thedaily turnover of foreign-exchange activity, the stock ofmoney held by the private sector, and the stock of publiclytraded domestic and foreign bonds in private portfolios.Thus, most studies conclude that the direct effect of inter-vention on exchange rates is either statistically insignifi-cant or quantitatively unimportant.
Central-Bank Intervention’s Rolein Regulating the Flow
Supply of and Demand for Foreign Exchange
Exchange Rate
Quantity of Foreign Exchange
S
D
E2E0
D’
q1
q0
S’
E1
The Portfolio-Balance Channel Transmission Mechanism(The Impact of Sterilized Intervention on Exchange Rates
Change inExchange
Rate
Expectationsof FutureMonetaryGrowth
SterilizedIntervention
Change inRisk
Premium
Change inExpected
FutureExchange
Rate
Change inDomestic
Interest Rate
Change inForeign
Interest Rate
Direct Central Bank Intervention Channels—
The Balance of Payments Flow, Monetary, & Portfolio-Balance Channels
The Monetary Channel Transmission Mechanism(The Impact of Nonsterilized Intervention on Exchange Rates
Change inMonetary
Base
Change inExchange
Rate
Expectationsof FutureMonetaryGrowth
NonsterilizedIntervention
MultipleExpansion of
DomesticMoney Supply
Change inExpected
FutureExchange Rate
viaMonetaryChannel

DB Guide to Exchange-Rate Determination May 2002Deutsche Bank @
128 Deutsche Bank Foreign Exchange Research
Economists have also identified a number of indirect chan-nels through which intervention can alter investors' expec-tations and positioning and, in so doing, help push cur-rency values in the direction desired by monetary officials.
First, a central bank may use intervention as a signal of itsmonetary-policy intentions. To the extent that expectationsof monetary growth are altered, intervention could havean immediate impact on exchange rates.
Second, a central bank may use intervention as a signal tothe market that an exchange rate is deviating too far fromits long-run equilibrium value. To the extent that interven-tion helps anchor market expectations to the true long-runequilibrium exchange rate, it can have a stabilizing influ-ence.
Central Bank Intervention— Signaling Channel Transmission Mechanism
Change inExchange
RateConvey Official
Intention ofFuture
Monetary-PolicyActions
to the Market
Central BankIntervention
Revisionof Market
Expectationsof FutureExchange
Rate
Market EfficiencyChannel
SuperiorInformation
Channel
Third, a central bank may want to take advantage of theelement of surprise and intervene when exchange rateshave overshot their equilibrium level and the market isheavily overbought or oversold. If trend-followers dominateforeign exchange activity and drive exchange rates far fromtheir true long-run equilibrium values, a surprise round ofintervention, appropriately timed, could force traders withvulnerable long or short positions to unwind their positions.Such actions could serve to break the prevailing trend andpossibly lead to a trend reversal if trend-followers could bepersuaded to jump in and help reinforce the new trend inexchange rates.
As was the case above, the evidence in support of inter-vention operations working through one of these indirectchannels is mixed. There have clearly been selected epi-sodes of successful intervention operations, but most stud-ies conclude that central banks cannot unduly influenceexchange rates on a sustained basis.
Central Bank Intervention— Noise-Trading Channel Transmission Mechanism
Change inExchange
Rate
Central BankIntervention
TradersAdjust TheirShort-RunCurrencyPositions
Indirect Central Bank Intervention Channels—
Signaling and Noise-Trading Channels

DB Guide to Exchange-Rate DeterminationMay 2002 Deutsche Bank @
Deutsche Bank Foreign Exchange Research 129
Anticipating Currency Crises in
Emerging Markets
Note: This section draws, in part, from Michael Rosenberg’s “Currency Crises in Emerging Markets”, Merrill Lynch, 1998.
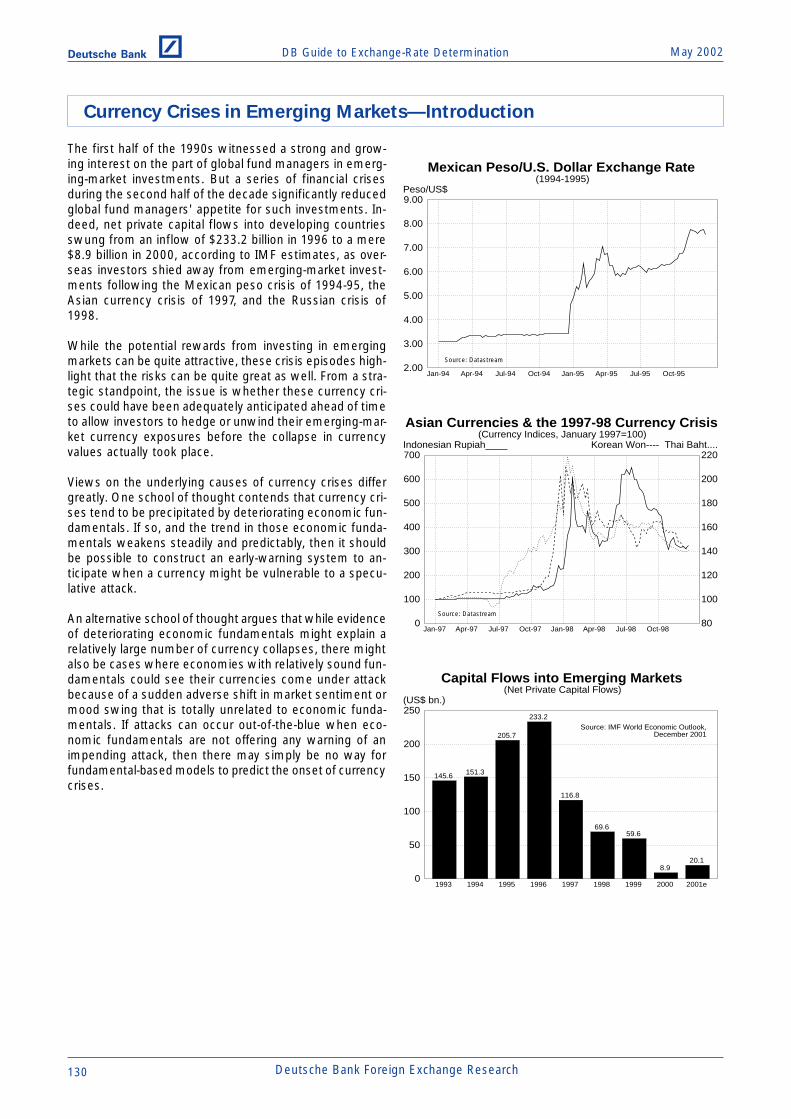
DB Guide to Exchange-Rate Determination May 2002Deutsche Bank @
130 Deutsche Bank Foreign Exchange Research
The first half of the 1990s witnessed a strong and grow-ing interest on the part of global fund managers in emerg-ing-market investments. But a series of financial crisesduring the second half of the decade significantly reducedglobal fund managers' appetite for such investments. In-deed, net private capital flows into developing countriesswung from an inflow of $233.2 billion in 1996 to a mere$8.9 billion in 2000, according to IMF estimates, as over-seas investors shied away from emerging-market invest-ments following the Mexican peso crisis of 1994-95, theAsian currency crisis of 1997, and the Russian crisis of1998.
While the potential rewards from investing in emergingmarkets can be quite attractive, these crisis episodes high-light that the risks can be quite great as well. From a stra-tegic standpoint, the issue is whether these currency cri-ses could have been adequately anticipated ahead of timeto allow investors to hedge or unwind their emerging-mar-ket currency exposures before the collapse in currencyvalues actually took place.
Views on the underlying causes of currency crises differgreatly. One school of thought contends that currency cri-ses tend to be precipitated by deteriorating economic fun-damentals. If so, and the trend in those economic funda-mentals weakens steadily and predictably, then it shouldbe possible to construct an early-warning system to an-ticipate when a currency might be vulnerable to a specu-lative attack.
An alternative school of thought argues that while evidenceof deteriorating economic fundamentals might explain arelatively large number of currency collapses, there mightalso be cases where economies with relatively sound fun-damentals could see their currencies come under attackbecause of a sudden adverse shift in market sentiment ormood swing that is totally unrelated to economic funda-mentals. If attacks can occur out-of-the-blue when eco-nomic fundamentals are not offering any warning of animpending attack, then there may simply be no way forfundamental-based models to predict the onset of currencycrises.
Currency Crises in Emerging Markets—Introduction
Capital Flows into Emerging Markets(Net Private Capital Flows)
20.18.9
59.669.6
116.8
233.2
205.7
151.3145.6
0
50
100
150
200
250
1993 1994 1995 1996 1997 1998 1999 2000 2001e
(US$ bn.)
Source: IMF World Economic Outlook, December 2001
Mexican Peso/U.S. Dollar Exchange Rate(1994-1995)
2.00
3.00
4.00
5.00
6.00
7.00
8.00
9.00
Jan-94 Apr-94 Jul-94 Oct-94 Jan-95 Apr-95 Jul-95 Oct-95
Peso/US$
Asian Currencies & the 1997-98 Currency Crisis(Currency Indices, January 1997=100)
80
100
120
140
160
180
200
220
0
100
200
300
400
500
600
700
Jan-97 Apr-97 Jul-97 Oct-97 Jan-98 Apr-98 Jul-98 Oct-98
Korean Won---- Thai Baht....Indonesian Rupiah____
Source: Datastream
Source: Datastream

DB Guide to Exchange-Rate DeterminationMay 2002 Deutsche Bank @
Deutsche Bank Foreign Exchange Research 131
Crisis-prone currencies typically display a number of clas-sic symptoms that warn of an impending speculative at-tack. These symptoms include:
• Excessive real appreciation of the emerging-marketcurrency.
• Weak domestic economic growth.
• Rising unemployment.
• A deteriorating current-account balance.
• Excessive domestic credit expansion.
• Banking-system difficulties.
• Unsustainably large government budget deficits.
• Overly expansionary monetary policies.
• A high ratio of M2 money supply to reserves.
• Foreign-exchange reserve losses.
• Falling asset prices.
• A huge buildup in short-term liabilities by either theprivate or public sector.
While not all of these symptoms are present in each andevery currency crisis, most crises display a number of thesesymptoms, enough to at least warn of the possibility of animpending speculative attack.
Typically, analysts will look for evidence of deterioratingfundamentals to determine whether an emerging-marketcurrency might be vulnerable to a speculative attack. Onecan visualize that there exist critical threshold levels foreconomic vulnerability indicators where, if economic fun-damentals deteriorate beyond those threshold levels, anattack on the currency will inevitably be waged.
The seeds of an inevitable currency collapse are plantedwhen a policy shift or an economic or financial shock givesrise to a serious deterioration in one or more key economicvariables. Once economic fundamentals deteriorate be-yond critical threshold levels (point A in the middle dia-gram), a currency will naturally collapse under its ownweight.
Deteriorating Economic Fundamentals and the Onset of Currency Crises
Deteriorating Economic Fundamentalsand the Onset of Currency Crises
EconomicFundamentals
A
Time
PolicyVariableorFinancialShock
Time
Time
NominalExchangeRate
0
A’’
0
(+)
(-)
(b)
(a)
(c)
Source: Rosenberg (1998)

DB Guide to Exchange-Rate Determination May 2002Deutsche Bank @
132 Deutsche Bank Foreign Exchange Research
Since speculators, investors, and borrowers tend to beforward looking, they will recognize before the fact that asteady deterioration in economic fundamentals will leadto an inevitable currency collapse. By looking ahead andreasoning backward, speculators, investors, and borrow-ers will not wait for point A to be reached to capitalize onor to hedge against a possible currency collapse. Instead,
forward-looking market participants will begin to sell thevulnerable currency well ahead of the inevitable collapseat point A. By doing so, heavy selling pressure will occurwell before point A is reached. Such selling might trigger acurrency collapse in the vicinity of point B.
Forward-Looking Speculators Bring Forwardthe Day of Reckoning
EconomicFundamentals
B
B’
TimeA
NominalExchangeRate
Time
Forward-Looking Investors May Wage an Attack Before Fundamentals
Deteriorate Beyond Threshold Levels
Source: Rosenberg (1998)

DB Guide to Exchange-Rate DeterminationMay 2002 Deutsche Bank @
Deutsche Bank Foreign Exchange Research 133
In a world where there is complete certainty regarding thefuture path that economic fundamentals will take, it shouldbe possible to pinpoint exactly when a speculative attackmight occur. However, in a world where there is less thancomplete certainty, it might not be possible for a leading-indicator model to correctly anticipate the onset of all cur-rency crises.
Consider the case where economic fundamentals do notdeteriorate in a steady and predictable manner. Assumethat the trend in economic fundamentals is gradually weak-ening, but there comes a point (such as point C in thediagram below) where a sudden, unexpected improvementin one or more key fundamental indicators permanentlyalters the long-term trend in economic fundamentals in afavorable direction. The danger here is that prior to point Cbeing reached, an early detection system might have pre-maturely warned of an inevitable currency collapse at pointB when no such warning was truly called for.
In contrast to situations where leading-indicator modelsmight falsely warn of an attack that does not in fact occur,there might be situations where leading-indicator modelsfail to correctly warn market participants of an actual at-tack. Consider a situation where the trend in economicfundamentals appears to be sound and displays no sign ofserious deterioration right up until the time of a specula-tive attack. Just prior to the point of attack, the trend in
economic fundamentals is shown to suddenly deterioratein the diagram below, perhaps because of an adverseterms-of-trade shock, a sudden collapse of a large corpo-ration or bank that undermines business confidence, orbecause of contagion effects stemming from financial cri-ses in neighboring markets. The deterioration in the funda-mental backdrop and the attack on the now vulnerable,but previously sound, currency occur virtually simulta-neously with little or no warning.
One additional problem that model builders face is thatnot all leading indicators of currency crises point in thesame direction at the same time. In many instances, wemay find that certain economic indicators deterioratesteadily and predictably and therefore warn of an impend-ing crisis, while other indicators may exhibit no sign ofdeterioration and therefore suggest no need for a correc-tive exchange-rate adjustment.
The simple fact is that when a country's economic funda-mentals point in different directions, there is likely to beconsiderable uncertainty whether the general trend in abroad grouping of fundamental indicators argues for aninevitable currency collapse or not. And when there is ahigh level of uncertainty, it is difficult to generate signifi-cant confidence in a mechanical, fundamental-based modelthat purportedly predicts the onset of currency crises.
Uncertainty and the Timing of Speculative Attacks
A Sudden Deterioration in Economic FundamentalsCould Trigger a Speculative Attack with Little Advance Warning
EconomicFundamentals
A
A’Time
Source: Rosenberg (1998) Source: Rosenberg (1998)
Uncertainty about the Future Course of Economic FundamentalsMakes It Difficult to Pinpoint When an Attack Might Occur
EconomicFundamentals
B
C
TimeA

DB Guide to Exchange-Rate Determination May 2002Deutsche Bank @
134 Deutsche Bank Foreign Exchange Research
A number of economists have tried to make the case thatan exchange-rate regime might not have a unique equilib-rium, but instead might face multiple equilibria. The dia-gram below illustrates the possible range of equilibriumsettings that might exist for a particular exchange rate. Atthe right end of the fundamental economic spectrum, aunique equilibrium exists since countries with strong fun-damentals are unlikely to see their currencies come underspeculative attack. At the left end of the fundamental eco-nomic spectrum, a unique equilibrium also exists sincecountries with weak fundamentals are highly likely to seetheir currencies come under speculative attack. In themiddle, a so-called "gray area" exists where exchange-ratecrises may or may not occur.
It is in this gray area where multiple equilibria may exist—economic fundamentals are either not strong enough that
a speculative attack can be completely avoided or not weakenough that a crisis is an inevitable outcome. Operating inthe gray area, speculative attacks are possible but not in-evitable. Exchange rates may be stable in the gray area fora while, but they can easily be pushed over the edge by asudden adverse shift in market sentiment or mood swing.
Should a currency operating in the gray area come underspeculative attack, domestic economic fundamentals coulddeteriorate unexpectedly if business confidence suddenlysours or if foreign-currency debt burdens suddenly rise. Ifthe fundamental economic deterioration is truly serious,the currency could be pushed out of the gray area towardthe "weak fundamentals" area where attacks are inevitable.By so doing, the initial attack, which occurred when thecurrency was still in the gray area, would prove to havebeen a self-fulfilling prophecy.
Multiple Equilibria and Self-Fulfilling Expectations
Multiple Equilibria and theProbability of Exchange-Rate Crises
Weak Fundamentals
No AttackAttack Inevitable
"Gray Area"(Vulnerable to Attack but Not Inevitable)
Strong Fundamentals
Probability of Attack on Currency
Source: Rosenberg (1998)

DB Guide to Exchange-Rate DeterminationMay 2002 Deutsche Bank @
Deutsche Bank Foreign Exchange Research 135
If market participants were truly forward looking, interest-rate differentials would tend to widen as an impendingcurrency crisis drew nearer and investors demanded ahigher return or risk premium to cover the expected cur-rency loss on their investment. However, a careful readingof the history of speculative attacks, particularly the crisesof the 1990s, suggests that this has not been the case.
For example, interest-rate differentials failed to widenmeasurably in anticipation of the ERM currency crisis of1992-93, the Mexican peso crisis of 1994-95 or the Asiancurrency crisis of 1997-98. Not only did interest-rate differ-entials fail to widen, but the consensus forecasts of pri-vate economists, the risk assessments by credit ratingagencies, and the economic outlook reports of the IMFand the World Bank also failed to provide adequate warn-ing of the impending currency crises. Even in those caseswhere doomsayers might have correctly anticipated theonset of an impending currency crisis, the eventual ex-change-rate collapse often exceeded the direst projectionsof doom and gloom analysts.
If anything, the evidence seems to be more consistentwith the view that market participants are more often thannot taken by surprise when an attack occurs. Indeed, in-vestors and borrowers often tend to be leaning the wrongway in terms of their portfolio positioning at the time of anattack. Once an attack is waged, investors and borrowersare immediately forced to reposition their portfolios to avoidexcessive currency losses, and such portfolio reposition-ing works to intensify selling pressure on the currencyunder attack. It is this massive liquidation of vulnerablepositions that is largely responsible for the seemingly ex-cessive exchange-rate moves that typically occur duringspeculative attacks.
Can the Marketplace Adequately Anticipate the Onset of Currency Crises?
Mexican/U.S. Short-Term Yield SpreadPrior to the 1994 Mexican Peso Crisis
(91-Day Cetes less U.S. T-Bill Rate)
400
600
800
1000
1200
1400
1600
03-Jan-94 04-Mar-94 05-May-94 06-Jul-94 06-Sep-94 07-Nov-94
(Basis Points)
Asian/U.S. Short-Term Yield SpreadsPrior to the 1997 Asian Currency Crisis
(Local 3-Month Rates less U.S. T-Bill Rate)
0
200
400
600
800
1000
1200
01-Jul-96 30-Aug-96 31-Oct-96 01-Jan-97 04-Mar-97 05-May-97 04-Jul-97
Thailand---- Malaysia....(Basis Points) Korea____
European/German Short-Term Yield SpreadsPrior to the 1992 ERM Crisis
(3-Month Euro-Rates less Euro-DM)
0
100
200
300
400
01-Jan-92 03-Mar-92 04-May-92 03-Jul-92 03-Sep-92
Spain----(Basis Points) U.K.____
Source: Datastream
Source: Datastream
Source: Datastream

DB Guide to Exchange-Rate Determination May 2002Deutsche Bank @
136 Deutsche Bank Foreign Exchange Research
Why does the market fail to adequately anticipate the on-set of currency crises? To answer this question one needsto develop a model of investor and borrower behavior thatexplains why market participants might assign decreasingweight to the probability of a currency collapse at a timewhen the actual probability of a currency collapse is rising.A variant of the model developed by Frankel and Froot(1990) may help explain this phenomenon.
The Frankel-Froot model can be applied to the case of anemerging-market economy that is maintaining a fixed ex-change rate and where there may be some questionwhether the fixed exchange-rate regime will prove to besustainable. Let's assume that investors’ expectations re-garding the outlook for an emerging-market currency (ee
EM)that is pegged to the U.S. dollar are determined as aweighted-average of two possible outcomes: (1) the fixedexchange-rate regime continues to survive (ee
EM=0), and(2) the fixed exchange-rate regime comes under attack,where the currency is expected to collapse at a rate equalto ee
EM= k (k being the expected percentage rate collapseof the emerging-market currency). Investors are assumedto assign a certain probability, w, to the existing exchange-rate regime staying intact and another probability, 1-w, tothe regime collapsing. Let's assume that the interest-ratedifferential between the emerging-market country and theU.S., iEM - iUS, equals the market's "average" expected changein the emerging-market exchange rate. Mathematically, theaverage change in the expected exchange rate can be ex-pressed as the weighted-average probability of the twopossible exchange-rate outcomes:
eeEM= iEM - iUS = w(0) + (1 - w)k
Investors are assumed to vary the weights, w and 1-w,that they attach to the two possible exchange-rate out-comes depending on how successful the authorities arein preserving a stable, fixed exchange-rate regime. Thelonger the fixed exchange-rate regime survives, the moreconfident investors will be that the regime will continue tosurvive in the future. In other words, investors are proneto extrapolate favorable past behavior into the future muchlike chartists do.
Hence, the longer a fixed exchange-rate regime survives,the more weight investors will assign to the likelihood ofno exchange-rate change in the future (i.e., w will rise) andless weight to the likelihood of a currency collapse (i.e., 1-w will decline). As w rises and 1-w declines, the interest-rate differential, iEM - iUS, will tend to decline over time. Thisimplies that the market will assign less weight to the pos-sibility of a future currency collapse over time.
Thus, the long-term success of an existing exchange-rateregime might in and of itself encourage investors to as-sign less weight to the likelihood of a crisis even if theexisting regime is enjoying unwarranted excess credibil-ity. As the exchange-rate misalignment builds, the market"expectation" of a possible currency collapse could divergesharply from the actual risk of such a collapse.
The Longer a Fixed Exchange-Rate Regime Stays Intact,the Less Weight Investors Assign to the Likelihood of a Crash
Market-AssignedWeight to theLikelihood of aCurrency Crash
Time
The Market’s Assessment of the Risk of an Imminent Currency Crisis Might Differ Greatly from the True Risk
Probability of aCurrency Crisis
Exchange-RateMisalignment
True Probabilityof a Crisis
Market’s Assessment of theRisk of a Currency Crisis
Widening GapBetweenPerception & Reality
Exchange-Rate Expectations and the Anticipation of Currency Crises
Source: Rosenberg (1998)Source: Rosenberg (1998)
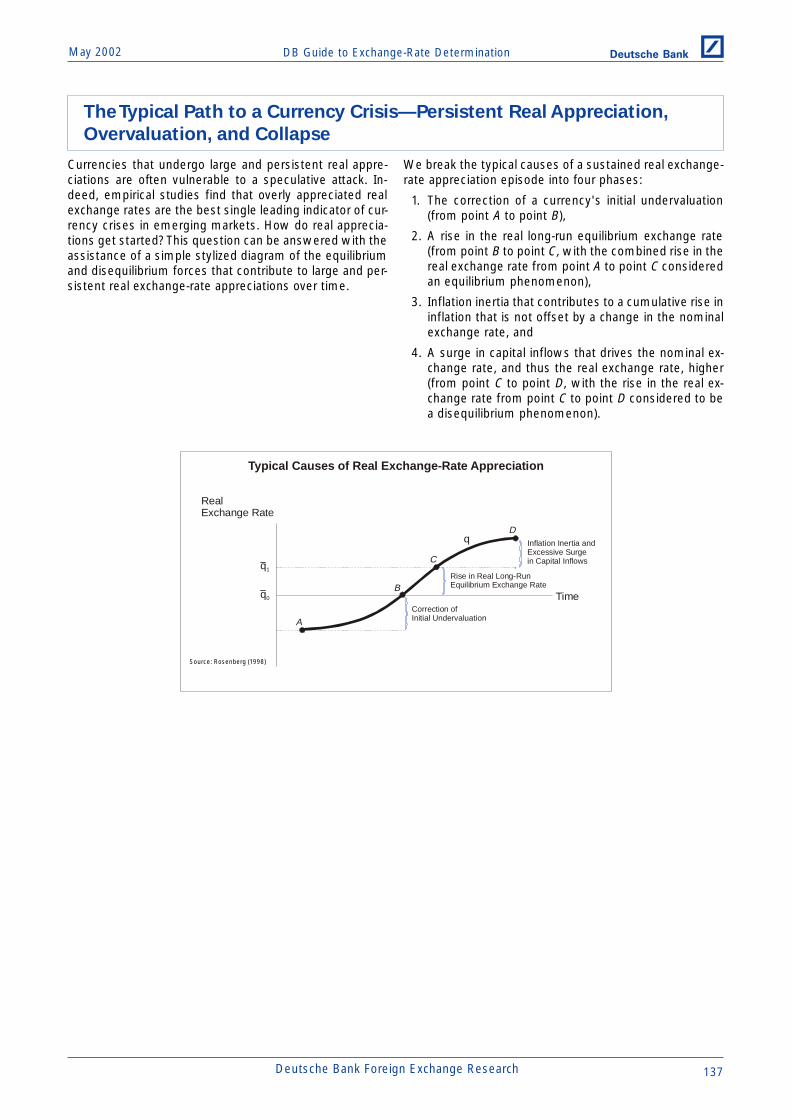
DB Guide to Exchange-Rate DeterminationMay 2002 Deutsche Bank @
Deutsche Bank Foreign Exchange Research 137
Currencies that undergo large and persistent real appre-ciations are often vulnerable to a speculative attack. In-deed, empirical studies find that overly appreciated realexchange rates are the best single leading indicator of cur-rency crises in emerging markets. How do real apprecia-tions get started? This question can be answered with theassistance of a simple stylized diagram of the equilibriumand disequilibrium forces that contribute to large and per-sistent real exchange-rate appreciations over time.
The Typical Path to a Currency Crisis—Persistent Real Appreciation,
Overvaluation, and Collapse
We break the typical causes of a sustained real exchange-rate appreciation episode into four phases:
1. The correction of a currency's initial undervaluation(from point A to point B),
2. A rise in the real long-run equilibrium exchange rate(from point B to point C, with the combined rise in thereal exchange rate from point A to point C consideredan equilibrium phenomenon),
3. Inflation inertia that contributes to a cumulative rise ininflation that is not offset by a change in the nominalexchange rate, and
4. A surge in capital inflows that drives the nominal ex-change rate, and thus the real exchange rate, higher(from point C to point D, with the rise in the real ex-change rate from point C to point D considered to bea disequilibrium phenomenon).
Typical Causes of Real Exchange-Rate Appreciation
RealExchange Rate
Timeq0
Rise in Real Long-RunEquilibrium Exchange Rate
q1
Inflation Inertia andExcessive Surgein Capital Inflows
Correction ofInitial Undervaluation
q
A
B
C
D
Source: Rosenberg (1998)
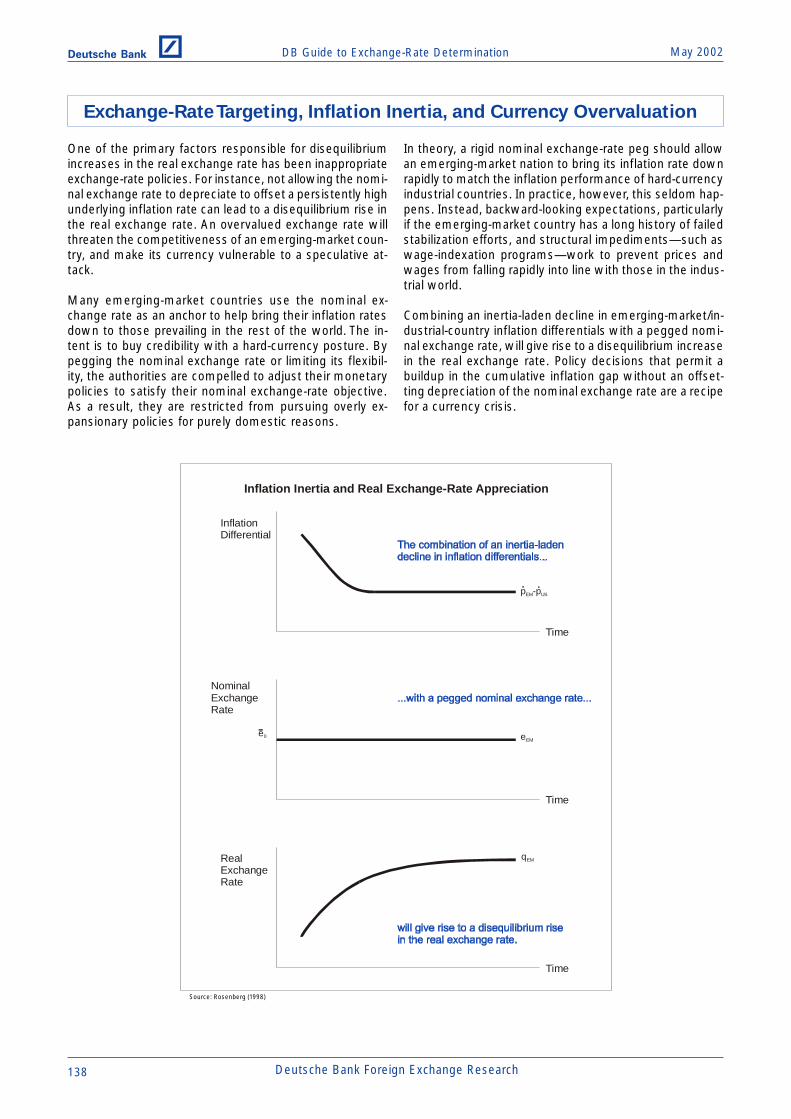
DB Guide to Exchange-Rate Determination May 2002Deutsche Bank @
138 Deutsche Bank Foreign Exchange Research
Exchange-Rate Targeting, Inflation Inertia, and Currency Overvaluation
One of the primary factors responsible for disequilibriumincreases in the real exchange rate has been inappropriateexchange-rate policies. For instance, not allowing the nomi-nal exchange rate to depreciate to offset a persistently highunderlying inflation rate can lead to a disequilibrium rise inthe real exchange rate. An overvalued exchange rate willthreaten the competitiveness of an emerging-market coun-try, and make its currency vulnerable to a speculative at-tack.
Many emerging-market countries use the nominal ex-change rate as an anchor to help bring their inflation ratesdown to those prevailing in the rest of the world. The in-tent is to buy credibility with a hard-currency posture. Bypegging the nominal exchange rate or limiting its flexibil-ity, the authorities are compelled to adjust their monetarypolicies to satisfy their nominal exchange-rate objective.As a result, they are restricted from pursuing overly ex-pansionary policies for purely domestic reasons.
In theory, a rigid nominal exchange-rate peg should allowan emerging-market nation to bring its inflation rate downrapidly to match the inflation performance of hard-currencyindustrial countries. In practice, however, this seldom hap-pens. Instead, backward-looking expectations, particularlyif the emerging-market country has a long history of failedstabilization efforts, and structural impediments—such aswage-indexation programs—work to prevent prices andwages from falling rapidly into line with those in the indus-trial world.
Combining an inertia-laden decline in emerging-market/in-dustrial-country inflation differentials with a pegged nomi-nal exchange rate, will give rise to a disequilibrium increasein the real exchange rate. Policy decisions that permit abuildup in the cumulative inflation gap without an offset-ting depreciation of the nominal exchange rate are a recipefor a currency crisis.
Inflation Inertia and Real Exchange-Rate Appreciation
NominalExchangeRate
Time
InflationDifferential
Time
Time
RealExchangeRate
qEM
e0 eEM
p -pEM US
Source: Rosenberg (1998)
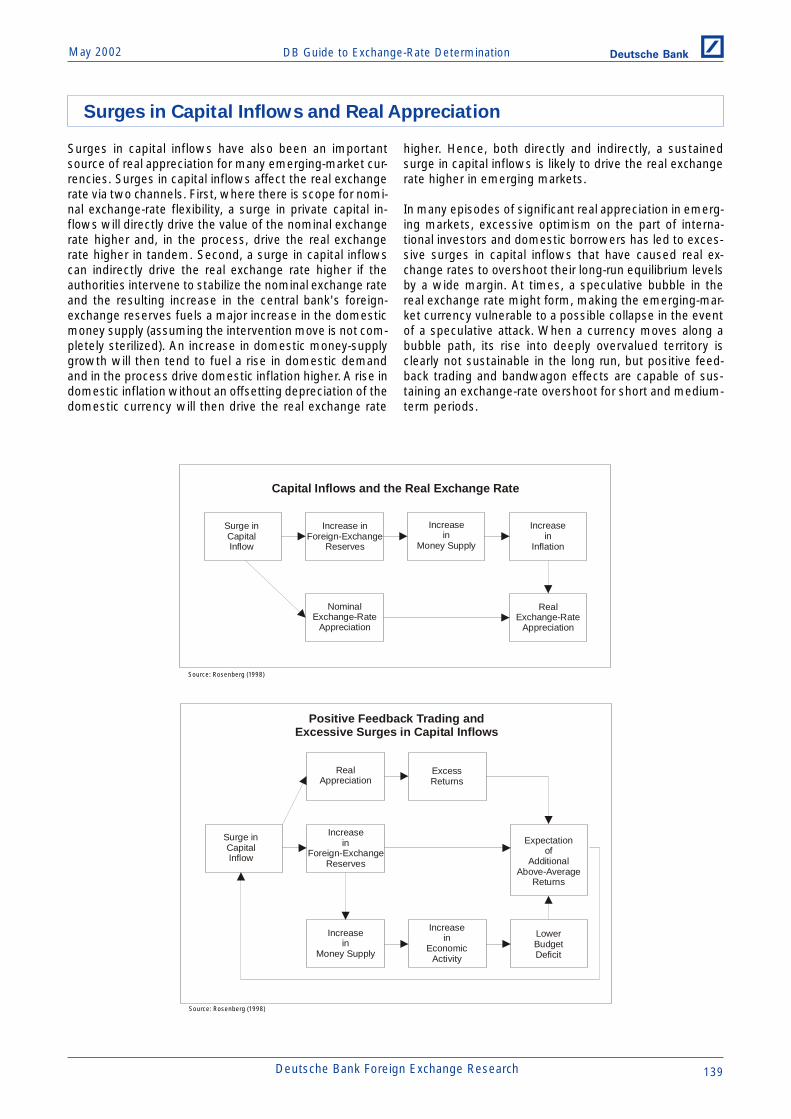
DB Guide to Exchange-Rate DeterminationMay 2002 Deutsche Bank @
Deutsche Bank Foreign Exchange Research 139
Surges in Capital Inflows and Real Appreciation
Surges in capital inflows have also been an importantsource of real appreciation for many emerging-market cur-rencies. Surges in capital inflows affect the real exchangerate via two channels. First, where there is scope for nomi-nal exchange-rate flexibility, a surge in private capital in-flows will directly drive the value of the nominal exchangerate higher and, in the process, drive the real exchangerate higher in tandem. Second, a surge in capital inflowscan indirectly drive the real exchange rate higher if theauthorities intervene to stabilize the nominal exchange rateand the resulting increase in the central bank's foreign-exchange reserves fuels a major increase in the domesticmoney supply (assuming the intervention move is not com-pletely sterilized). An increase in domestic money-supplygrowth will then tend to fuel a rise in domestic demandand in the process drive domestic inflation higher. A rise indomestic inflation without an offsetting depreciation of thedomestic currency will then drive the real exchange rate
higher. Hence, both directly and indirectly, a sustainedsurge in capital inflows is likely to drive the real exchangerate higher in emerging markets.
In many episodes of significant real appreciation in emerg-ing markets, excessive optimism on the part of interna-tional investors and domestic borrowers has led to exces-sive surges in capital inflows that have caused real ex-change rates to overshoot their long-run equilibrium levelsby a wide margin. At times, a speculative bubble in thereal exchange rate might form, making the emerging-mar-ket currency vulnerable to a possible collapse in the eventof a speculative attack. When a currency moves along abubble path, its rise into deeply overvalued territory isclearly not sustainable in the long run, but positive feed-back trading and bandwagon effects are capable of sus-taining an exchange-rate overshoot for short and medium-term periods.
Capital Inflows and the Real Exchange Rate
Surge inCapitalInflow
Increase inForeign-Exchange
Reserves
Increasein
Money Supply
Increasein
Inflation
NominalExchange-Rate
Appreciation
RealExchange-Rate
Appreciation
Positive Feedback Trading andExcessive Surges in Capital Inflows
Surge inCapitalInflow
RealAppreciation
ExcessReturns
Increasein
Foreign-ExchangeReserves
Expectationof
AdditionalAbove-Average
Returns
Increasein
Money Supply
Increasein
EconomicActivity
LowerBudgetDeficit
Source: Rosenberg (1998)
Source: Rosenberg (1998)

DB Guide to Exchange-Rate Determination May 2002Deutsche Bank @
140 Deutsche Bank Foreign Exchange Research
Capital Flows, Excessive Leverage, and Crisis Vulnerability
An excessive surge in capital inflows can plant the seedsof a currency crisis by contributing to: (1) an unwarrantedreal appreciation of the emerging-market currency, (2) ahuge build-up in external indebtedness, (3) a financial as-set or property-market bubble, (4) a consumption bingethat contributes to an explosive growth in domestic creditand/or the current-account deficit, or (5) over-investmentin risky projects and questionable activities.
It is no accident that the ERM, Mexican, and Asian cur-rency crises were all preceded by a surge in capital in-flows. In each case, the surge in capital inflows led to abuildup of huge, highly leveraged, long speculative posi-tions by local as well as international investors in the cur-rencies that eventually came under heavy attack. For ex-ample, in the run-up to the ERM crisis, investors, believingthat European yield convergence would occur as EuropeanMonetary Union (EMU) approached, took on highly lever-aged long positions in the high-yielding European curren-cies and short positions in the lower-yielding Deutsche-mark. Likewise, in the run-up to the Mexican peso crisis,investors and banks were highly leveraged and made ex-tensive use of derivative products in taking on speculative
long peso/short dollar positions. And in the run-up to theAsian currency crisis, it was Asian firms and banks thatwere highly leveraged as they took on a huge volume ofshort-term dollar-denominated debt to fund local activities.The seemingly excessive currency collapses (at least rela-tive to underlying economic fundamentals) that followedin each of those episodes simply reflected the suddenunwinding of those leveraged positions at the time of eachattack.
When investors assign a smaller and smaller probability toan imminent currency collapse, they often tend to becomeoverconfident that no attack will occur, and thus appearwilling to take on highly leveraged, long speculative posi-tions in currencies that are in reality vulnerable to a sud-den collapse. What actually triggers a collapse is less im-portant than the fact that at the time of an attack investorstend to be leaning, perhaps heavily, the wrong way in termsof their portfolio positioning. When the attack comes, feartakes over, as highly leveraged investors need to unwindtheir vulnerable long positions. It is the unwinding of thoselong positions that causes exchange rates to depreciateviolently at the time of an attack.
Excessive Surges in Capital InflowsOften Plant the Seeds of Future Currency Crises
Excessive Surgein
Capital Inflow
RealAppreciation
Increase inExternal Indebtedness
Current-AccountDeficit
Excessive Growthin Domestic Credit
Equity and/orProperty Bubble
CurrencyCrisis
Over-investmentin Risky Projects
Source: Rosenberg (1998)
Source: Rosenberg (1998)
Investors and Borrowers Are Often Caught Leaning the Wrong Wayat the Time of an Exchange-Rate Collapse
Net Long Positionsin Emerging-MarketCurrency
A’
Time
A
NominalExchangeRate
Time

DB Guide to Exchange-Rate DeterminationMay 2002 Deutsche Bank @
Deutsche Bank Foreign Exchange Research 141
Real Exchange-Rate Misalignment and Collapse
A currency that undergoes significant real appreciation willbe vulnerable to a speculative attack only if the actual realexchange rate (q) rises relative to its real long-run equilib-rium value (q). In such cases, the resulting overvaluationof the real exchange rate relative to its long-run equilib-rium level should be viewed as a "disequilibrium" rise inthe real exchange rate that would call for an eventual cor-rection of the misaligned exchange rate.
Since the real long-run equilibrium exchange rate, q, is notdirectly observable, it will never be known for sure whethera rise in the actual real exchange rate, q, is an "equilibrium"or a "disequilibrium" phenomenon. This will be especiallytrue for small and medium-sized real appreciations. How-ever, for large and sustained real appreciations, the oddsof a persistent rise in q being a purely equilibrium phe-nomenon are likely to be small. Instead, large and persis-tent real appreciations are more likely to be disequilibriumphenomena in need of correction. Indeed, in a recent ex-haustive study of real appreciation episodes in 93 coun-tries over the 1960-94 period, Goldfajn and Valdes (1996)found that virtually all currencies that underwent real ap-preciations exceeding 35% from trough to peak eventu-ally collapsed either through a speculative attack or a sur-prise devaluation.
Views on what real exchange-rate level constitutes acurrency's real long-run equilibrium value often differ amongmarket participants. Hence, views on the magnitude ofthe prevailing real exchange-rate misalignment will differ
as well. Given such high levels of uncertainty, the marketwill generally presume that a sustained increase in thereal exchange rate is an equilibrium phenomenon unlessconvinced otherwise. Hence real exchange-ratemisalignments are unlikely to be corrected until there arevisible signs of fundamental economic deterioration.
In a typical real appreciation/misalignment episode, realappreciation tends to proceed gradually. As the exchange-rate misalignment builds, there will probably be no correc-tive adjustment early on, since economic fundamentalslikely will display little sign of significant deterioration. Butas the real exchange-rate misalignment grows and persists,the trend in economic fundamentals will gradually beginto deteriorate. When the deterioration in fundamentalsreaches a point that convinces speculators that remedialaction is called for, then and only then will they attack theoverly appreciated currency.
Evidence presented by Goldfajn and Valdes (1996) suggeststhat real appreciations tend to build up gradually and thenend abruptly. They find that there is a large asymmetrybetween the average duration of real appreciation episodesand the time that it takes to unwind the appreciation ofthe real exchange rate. Goldfajn and Valdes estimate thatthe average duration of real appreciation episodes is abouttwice as long as the time that it takes to unwind the realappreciation.
Real Exchange-Rate Misalignments Tend toBuild Up Gradually and End Abruptly
EconomicFundamentals
A’
Time
A
RealExchange Rate
Time
Source: Rosenberg (1998)
Probability That a Real Appreciation EpisodeWill Come to an End without a
Speculative Attack or Surprise Devaluation
0.00
0.06
0.11
0.23
0.32
0.00
0.05
0.10
0.15
0.20
0.25
0.30
0.35
15 20 25 30 35
Probability
Source: Goldfajn and Valdes (1996).
Real Currency Appreciation(%)
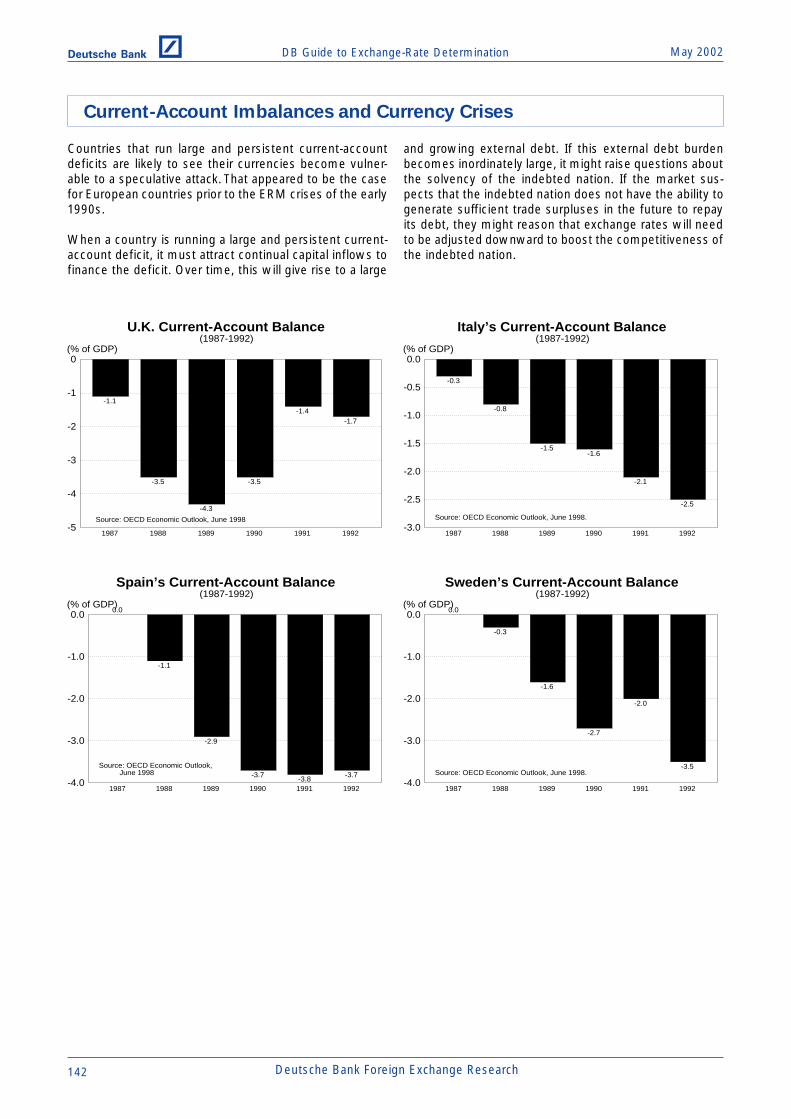
DB Guide to Exchange-Rate Determination May 2002Deutsche Bank @
142 Deutsche Bank Foreign Exchange Research
Current-Account Imbalances and Currency Crises
Countries that run large and persistent current-accountdeficits are likely to see their currencies become vulner-able to a speculative attack. That appeared to be the casefor European countries prior to the ERM crises of the early1990s.
When a country is running a large and persistent current-account deficit, it must attract continual capital inflows tofinance the deficit. Over time, this will give rise to a large
and growing external debt. If this external debt burdenbecomes inordinately large, it might raise questions aboutthe solvency of the indebted nation. If the market sus-pects that the indebted nation does not have the ability togenerate sufficient trade surpluses in the future to repayits debt, they might reason that exchange rates will needto be adjusted downward to boost the competitiveness ofthe indebted nation.
Italy’s Current-Account Balance(1987-1992)
-2.5
-2.1
-1.6-1.5
-0.8
-0.3
-3.0
-2.5
-2.0
-1.5
-1.0
-0.5
0.0
1987 1988 1989 1990 1991 1992
(% of GDP)
Source: OECD Economic Outlook, June 1998.
U.K. Current-Account Balance(1987-1992)
-1.7-1.4
-3.5
-4.3
-3.5
-1.1
-5
-4
-3
-2
-1
0
1987 1988 1989 1990 1991 1992
(% of GDP)
Source: OECD Economic Outlook, June 1998
Spain’s Current-Account Balance(1987-1992)
-3.7-3.8
-3.7
-2.9
-1.1
0.0
-4.0
-3.0
-2.0
-1.0
0.0
1987 1988 1989 1990 1991 1992
(% of GDP)
Source: OECD Economic Outlook, June 1998
Sweden’s Current-Account Balance(1987-1992)
-3.5
-2.0
-2.7
-1.6
-0.3
0.0
-4.0
-3.0
-2.0
-1.0
0.0
1987 1988 1989 1990 1991 1992
(% of GDP)
Source: OECD Economic Outlook, June 1998.

DB Guide to Exchange-Rate DeterminationMay 2002 Deutsche Bank @
Deutsche Bank Foreign Exchange Research 143
While current-account imbalances may have played animportant role in triggering the Mexican peso and Asiancurrency crises in the 1990s, most international econo-mists would argue that the violent character of those cur-rency-crisis episodes could be explained only by financial-sector weaknesses, and not by external-balance consider-ations.
What does the empirical evidence suggest about the roleof current-account imbalances in triggering currency cri-ses in emerging markets? Frankel and Rose (1996) exam-ined the fundamental forces that triggered currencycrashes in over 100 emerging-market countries over the
1971-92 period, and found that current-account imbalanceswere not statistically significant in predicting currencycrashes. Sachs, Tornell, and Velasco (1996) found that cur-rent-account imbalances were not helpful in determiningwhich currencies were vulnerable to contagion effects fol-lowing the Mexican peso collapse in 1994-95. However,Goldstein et al. (2000) and the IMF (1998) found that cur-rent-account deficit/GDP ratios have, on average, been sig-nificantly larger in periods leading up to a crisis than dur-ing tranquil periods. The latter results suggest that current-account imbalances may have some predictive power inanticipating currency crises.
Mexico’s Current-Account Balance(1990-1994)
-7.1
-5.8
-6.7
-4.6
-2.8
-8
-6
-4
-2
0
1990 1991 1992 1993 1994
(% of GDP)
Source: OECD Economic Outlook, June 1998.
Malaysia’s Current-Account Balance(1992-1997)
-5.1-4.9
-9.9
-7.8
-4.8
-3.8
-12
-10
-8
-6
-4
-2
0
1992 1993 1994 1995 1996 1997
(% of GDP)
Source: National government data.
Thailand’s Current-Account Balance(1992-1997)
-0.8
-8.1-8.0
-5.6-5.1
-5.7
-10
-8
-6
-4
-2
0
1992 1993 1994 1995 1996 1997
(% of GDP)
Source: National government data.
Indonesia’s Current-Account Balance(1992-1997)
-2.4
-3.4-3.4
-1.7-1.5
-2.3
-4
-3
-2
-1
0
1992 1993 1994 1995 1996 1997
(% of GDP)
Source: National government data.
Korea’s Current-Account Balance(1992-1997)
-1.8
-4.8
-1.8
-1.0
0.3
-1.3
-6
-5
-4
-3
-2
-1
0
1
1992 1993 1994 1995 1996 1997
(% of GDP)
Source: OECD Economic Outlook, June 1998.
Philippine’s Current-Account Balance(1992-1997)
-4.5-4.7
-4.4-4.6
-5.6
-1.6
-6
-5
-4
-3
-2
-1
0
1992 1993 1994 1995 1996 1997
(% of GDP)
Source: National government data.

DB Guide to Exchange-Rate Determination May 2002Deutsche Bank @
144 Deutsche Bank Foreign Exchange Research
Overly Expansionary Monetary Policy and Currency Crises
Countries that pursue overly expansionary monetary poli-cies are likely to see their currencies become vulnerableto a speculative attack. History is replete with examples inwhich domestic credit creation by a central bank in excessof money demand has planted the seeds of a speculativeattack.
If a central bank wished to peg its currency to a hard cur-rency, it would need to pursue monetary policies consis-tent with that exchange-rate objective. An overly expan-sionary monetary policy would be inconsistent with themaintenance of stable nominal exchange rates in the longrun. Examples of inconsistent policies would be situationsin which a central bank felt compelled to monetize a largeand persistent budget deficit or had to inject massive sumsof liquidity to prop up an ailing banking system. In bothcases, such policy stances would inevitably lead to a col-lapse of a pegged exchange-rate regime.
We can illustrate the inherent inconsistency between thepursuit of a stable nominal exchange rate, on the one hand,and an excessively expansionary monetary policy, on theother, with a simple model. We start by assuming thatchanges in a currency's value, e, are inversely related tochanges in that country's monetary base, M:
e = - M (1)
That is, an expansion of the monetary base will lead to anequiproportionate decline in a currency's value, while acontraction of the monetary base will lead to anequiproportionate rise in a currency's value. In this simpli-fied model, a fixed exchange rate can be maintained overtime only if the monetary base is kept constant over time.That is, if:
M = 0 (2)
then, from (1) above
e = 0 (3)
A country's monetary base consists of domestic creditissued by the central bank, D, and the central bank's hold-ings of foreign-exchange reserves, R:
M = D + R (4)
If a central bank attempted to monetize a large budgetdeficit by expanding domestic credit, D, that would lead toa corresponding rise in the monetary base, M, unless thecentral bank’s holdings of reserves, R, were run down byan amount equal to the rise in D. If the central bank's hold-ings of foreign-exchange reserves, R, were run down byan amount equal to the increase in domestic credit, D, themonetary base would be held constant and the nominalexchange rate would remain fixed.
Since a central bank's holdings of foreign-exchange re-serves are finite, there is a limit to how much a centralbank can continuously run down its reserves to offset acontinuous expansion of domestic credit. At the pointwhere the central bank's holdings of foreign-exchange re-serves approach zero (shown as t1 in the diagram above),an exchange-rate peg would collapse on its own accordbecause at that point the monetary base would begin toexpand at the same rate as domestic credit was expand-ing. That is, if
R = 0 (5)
then changes in the monetary base, M, would be entirelydetermined by changes in domestic credit, D:
M = D (6)
With both D and M rising at the same rate, the rise in Mwould no longer be consistent with the maintenance of astable exchange rate. Once M starts to expand, the ex-change rate would begin to decline at the same rate thatM is rising. In practice, if forward-looking investors sawthat the central bank’s FX reserves were falling to danger-ously low levels, they would, in all likelihood, wage an at-tack on the vulnerable currency prior to point t1 beingreached.
Overly Expansionary Monetary Policies, Reserve Loss,and the Inevitability of an Exchange-Rate Collapse
Time
MonetaryBase
Time
Time
Foreign-ExchangeReserves
e
DomesticCredit
NominalExchangeRate
M
t1
t1
t1
D
R
M0
e0
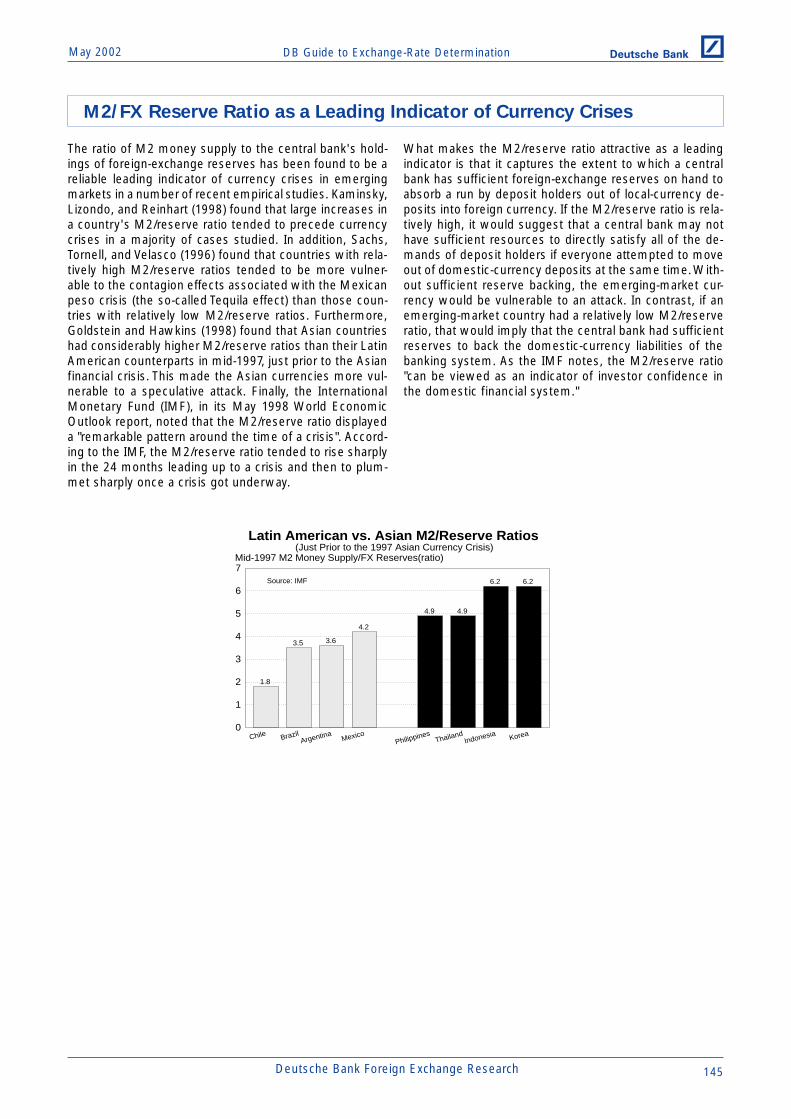
DB Guide to Exchange-Rate DeterminationMay 2002 Deutsche Bank @
Deutsche Bank Foreign Exchange Research 145
M2/FX Reserve Ratio as a Leading Indicator of Currency Crises
The ratio of M2 money supply to the central bank's hold-ings of foreign-exchange reserves has been found to be areliable leading indicator of currency crises in emergingmarkets in a number of recent empirical studies. Kaminsky,Lizondo, and Reinhart (1998) found that large increases ina country's M2/reserve ratio tended to precede currencycrises in a majority of cases studied. In addition, Sachs,Tornell, and Velasco (1996) found that countries with rela-tively high M2/reserve ratios tended to be more vulner-able to the contagion effects associated with the Mexicanpeso crisis (the so-called Tequila effect) than those coun-tries with relatively low M2/reserve ratios. Furthermore,Goldstein and Hawkins (1998) found that Asian countrieshad considerably higher M2/reserve ratios than their LatinAmerican counterparts in mid-1997, just prior to the Asianfinancial crisis. This made the Asian currencies more vul-nerable to a speculative attack. Finally, the InternationalMonetary Fund (IMF), in its May 1998 World EconomicOutlook report, noted that the M2/reserve ratio displayeda "remarkable pattern around the time of a crisis". Accord-ing to the IMF, the M2/reserve ratio tended to rise sharplyin the 24 months leading up to a crisis and then to plum-met sharply once a crisis got underway.
What makes the M2/reserve ratio attractive as a leadingindicator is that it captures the extent to which a centralbank has sufficient foreign-exchange reserves on hand toabsorb a run by deposit holders out of local-currency de-posits into foreign currency. If the M2/reserve ratio is rela-tively high, it would suggest that a central bank may nothave sufficient resources to directly satisfy all of the de-mands of deposit holders if everyone attempted to moveout of domestic-currency deposits at the same time. With-out sufficient reserve backing, the emerging-market cur-rency would be vulnerable to an attack. In contrast, if anemerging-market country had a relatively low M2/reserveratio, that would imply that the central bank had sufficientreserves to back the domestic-currency liabilities of thebanking system. As the IMF notes, the M2/reserve ratio"can be viewed as an indicator of investor confidence inthe domestic financial system."
Latin American vs. Asian M2/Reserve Ratios(Just Prior to the 1997 Asian Currency Crisis)
6.26.2
4.94.9
4.2
3.63.5
1.8
0
1
2
3
4
5
6
7
Chile BrazilArgentina
MexicoPhilippines
ThailandIndonesia Korea
Mid-1997 M2 Money Supply/FX Reserves(ratio)
Source: IMF
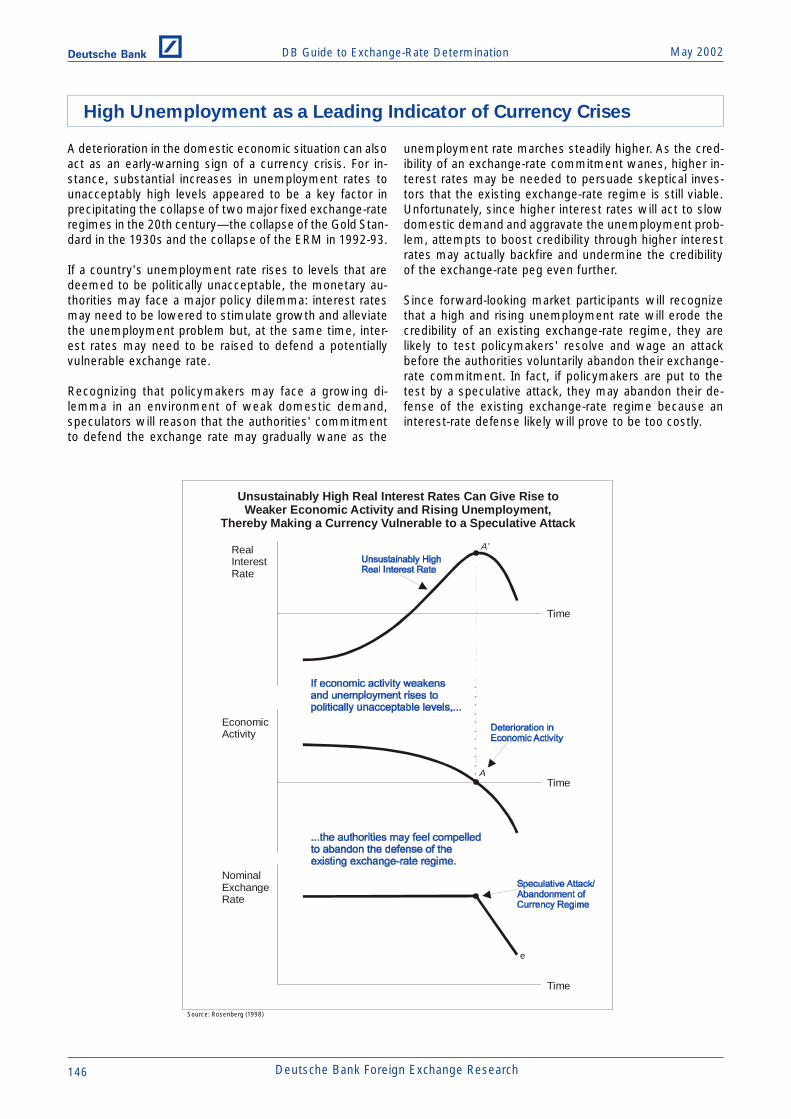
DB Guide to Exchange-Rate Determination May 2002Deutsche Bank @
146 Deutsche Bank Foreign Exchange Research
High Unemployment as a Leading Indicator of Currency Crises
A deterioration in the domestic economic situation can alsoact as an early-warning sign of a currency crisis. For in-stance, substantial increases in unemployment rates tounacceptably high levels appeared to be a key factor inprecipitating the collapse of two major fixed exchange-rateregimes in the 20th century—the collapse of the Gold Stan-dard in the 1930s and the collapse of the ERM in 1992-93.
If a country's unemployment rate rises to levels that aredeemed to be politically unacceptable, the monetary au-thorities may face a major policy dilemma: interest ratesmay need to be lowered to stimulate growth and alleviatethe unemployment problem but, at the same time, inter-est rates may need to be raised to defend a potentiallyvulnerable exchange rate.
Recognizing that policymakers may face a growing di-lemma in an environment of weak domestic demand,speculators will reason that the authorities' commitmentto defend the exchange rate may gradually wane as the
unemployment rate marches steadily higher. As the cred-ibility of an exchange-rate commitment wanes, higher in-terest rates may be needed to persuade skeptical inves-tors that the existing exchange-rate regime is still viable.Unfortunately, since higher interest rates will act to slowdomestic demand and aggravate the unemployment prob-lem, attempts to boost credibility through higher interestrates may actually backfire and undermine the credibilityof the exchange-rate peg even further.
Since forward-looking market participants will recognizethat a high and rising unemployment rate will erode thecredibility of an existing exchange-rate regime, they arelikely to test policymakers' resolve and wage an attackbefore the authorities voluntarily abandon their exchange-rate commitment. In fact, if policymakers are put to thetest by a speculative attack, they may abandon their de-fense of the existing exchange-rate regime because aninterest-rate defense likely will prove to be too costly.
Source: Rosenberg (1998)
Unsustainably High Real Interest Rates Can Give Rise toWeaker Economic Activity and Rising Unemployment,
Thereby Making a Currency Vulnerable to a Speculative Attack
EconomicActivity
A’
Time
A
RealInterest Rate
Time
Time
NominalExchangeRate
e

DB Guide to Exchange-Rate DeterminationMay 2002 Deutsche Bank @
Deutsche Bank Foreign Exchange Research 147
Debt Crises and Currency Crises
When an emerging-market country's government or pri-vate sector amasses a large volume of short-term debt, itplaces its currency in a vulnerable position where a self-fulfilling panic can lead to a sudden and massive specula-tive attack. For example, a country that issues a lot of short-term local-currency debt could run into problems if, forwhatever reason, domestic and foreign creditors refuse toroll over the existing stock of debt.
In such a case, the local monetary authorities might feelcompelled to push domestic short-term interest rates upsharply to induce the investment community to buy andhold the large stock of short-term debt. Unfortunately, highand rising short-term interest rates can place the highlyindebted public or private sectors of an emerging marketin a vulnerable position directly—by increasing the cost ofservicing the large stock of local-currency debt—or indi-rectly—by leading to a slowdown in domestic economicactivity, which acts to reduce public and private sectors'revenue intake and thereby makes it even more difficult toservice the debt.
A rising local-currency debt-service burden poses threemajor risks for an emerging-market currency. First, it mightraise questions about long-term solvency, which couldspark a sudden panic withdrawal of funds by local and for-eign creditors. Second, it might raise fears that the localauthorities will attempt to reduce the real value of the debt
burden by inflating. Third, a large local-currency debt-ser-vice burden could constrain the local authorities from pur-suing a tight monetary policy that might be necessary todefend their currency from speculative attack. All of theserisk factors highlight the fact that currency vulnerability islikely to rise when local-currency debt-service burdens arelarge and growing.
Currency vulnerability is also likely to be high when anemerging-market economy amasses a large volume ofshort-term foreign-currency debt. Indeed, short-term for-eign-currency debt has the potential to impose a greaterburden on an emerging-market country than local-currencydebt because the local authorities cannot reduce the realburden of a foreign-currency debt obligation by inflating.In addition, given that the local-currency value of a foreign-currency debt obligation is sensitive to changes in the ex-change rate, currency depreciation could be extremelycostly, since that would directly raise the local-currencyvalue of the foreign-currency debt. Crisis-prone currenciesare therefore likely to be in an especially vulnerable statewhen short-term foreign-currency debt obligations are highand rising.
A large buildup in short-term foreign-currency debt, by it-self, will not precipitate a currency crisis if foreign credi-tors are willing to extend new loans and roll over any exist-ing loans. However, if for whatever reason fear strikes in
The Local-Currency Value of Short-Term Foreign-Currency DebtTends to Soar Following a Major Currency Collapse
Time
US$ Valueof Dollar-DenominatedDebt
Time
Time
NominalExchangeRate
e
Local-CurrencyValueof Dollar-DenominatedDebt
Source: Rosenberg (1998)

DB Guide to Exchange-Rate Determination May 2002Deutsche Bank @
148 Deutsche Bank Foreign Exchange Research
the hearts of foreign creditors, and foreign funds are with-held, the emerging-market currency could come underheavy downward pressure. If so, the local-currency valueof the short-term foreign-currency debt could soar, possi-bly throwing otherwise viable local entities into insolvency.
The importance of short-term foreign-currency debt as ameasure of financial vulnerability is highlighted by the factthat debt crises played an important role in the currencycrises in both Mexico and Asia. Indeed, the buildup of alarge volume of short-term foreign-currency debt by thepublic sector in Mexico and the private sector in Asia iswidely credited with planting the seeds of the Mexicanpeso and Asian currency crises. In both situations, the lo-cal-currency value of the foreign-currency debt soared asthe peso and Asian currencies came under heavy down-ward pressure.
The local-currency value of foreign-currency debt is highlysensitive to changes in the exchange rate. A sudden sharpdepreciation of an emerging-market currency will instantlyraise the local-currency value of all short-term foreign-cur-rency-denominated debt, and by so doing, will dramati-cally increase the burden of servicing that debt. As indebt-edness soared in Mexico and Asia, default risk rose sharplyand, as a result, overseas private capital was no longerforthcoming. With no funds forthcoming, the trend in eco-nomic fundamentals deteriorated suddenly and markedly.
The stylized diagram below demonstrates that a sharp risein the local-currency value of short-term foreign-currencydebt places a nation's economy in a vulnerable position ifsoaring debt burdens make it difficult for local firms to ser-
vice their debts. Note that right up until the time of a specu-lative currency attack, a highly indebted nation may notshow any visible signs of economic weakness. Once anattack takes place and the local-currency value of short-term foreign-currency debt soars, the trend in economicfundamentals is shown to suddenly deteriorate as firmsgo bankrupt, banks fail, and the government's fiscal bal-ance deteriorates.
A country's economic vulnerability might not reveal itselfprior to a debt-induced attack, and there may be few signssuggesting that an attack is imminent. An emerging-mar-ket economy might successfully leverage off of relativelycheap short-term foreign-currency debt and post an im-pressive growth performance for a long while without trig-gering a crisis, much as Asia did in the decade leading upto the crisis in 1997. In fact, Asia's solid growth performancemight have deluded the majority of market participants intobelieving that Asia's underlying fundamentals were soundwhen, in fact, they were all the time vulnerable if the valueof the Asian currencies, for whatever reason, suddenlydeclined.
This has important implications for modeling currency cri-ses in emerging markets. Signs of fundamental economicdeterioration may not be visible going into a crisis. Whileevidence of deteriorating fundamentals may be useful inpredicting certain currency crises, there may be few reli-able guideposts available to predict when a debt-drivencurrency crisis might occur. A large foreign-currency debtburden may be a sign of currency vulnerability in the longrun, but there may simply be no way of knowing before-hand when an attack might actually be waged.
A Sharp Increase in the Local-Currency Value ofShort-Term Foreign-Currency Debt Could Lead
to a Sudden Deline in Economic Activity
EconomicFundamentals
A’
A’’
Time
A
Local-CurrencyValue of Dollar-DenominatedDebt
Time
Source: Rosenberg (1998)
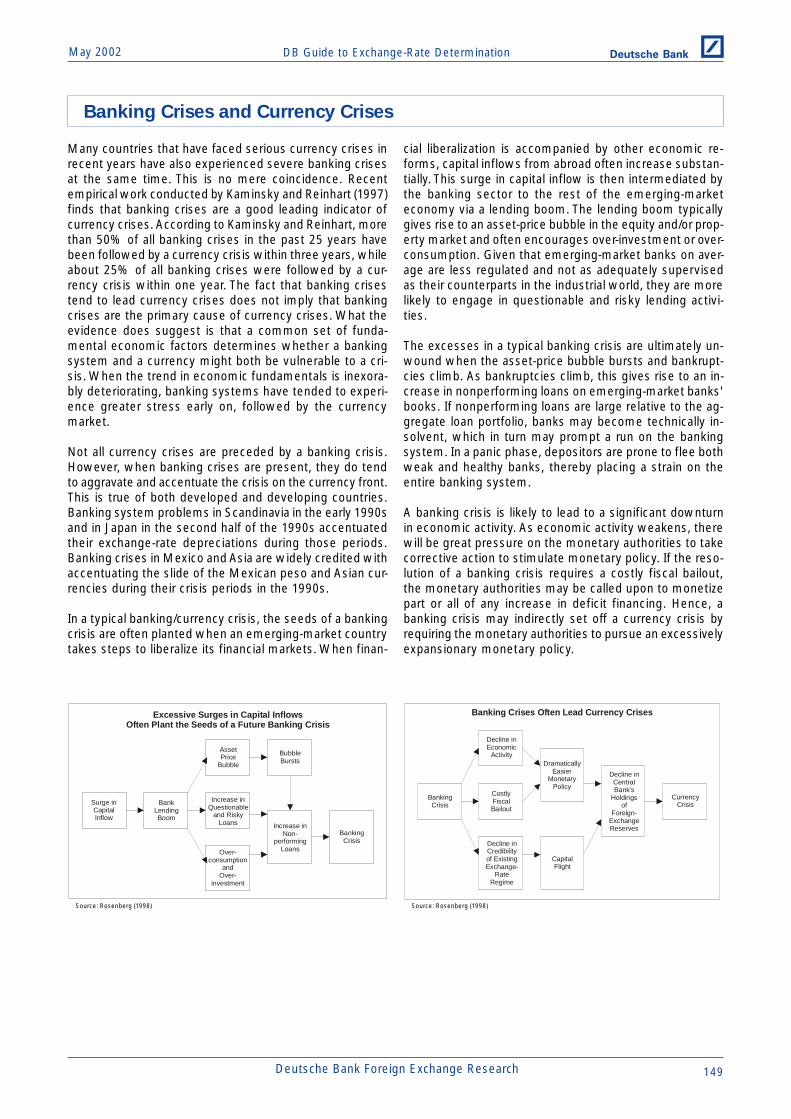
DB Guide to Exchange-Rate DeterminationMay 2002 Deutsche Bank @
Deutsche Bank Foreign Exchange Research 149
Banking Crises and Currency Crises
Many countries that have faced serious currency crises inrecent years have also experienced severe banking crisesat the same time. This is no mere coincidence. Recentempirical work conducted by Kaminsky and Reinhart (1997)finds that banking crises are a good leading indicator ofcurrency crises. According to Kaminsky and Reinhart, morethan 50% of all banking crises in the past 25 years havebeen followed by a currency crisis within three years, whileabout 25% of all banking crises were followed by a cur-rency crisis within one year. The fact that banking crisestend to lead currency crises does not imply that bankingcrises are the primary cause of currency crises. What theevidence does suggest is that a common set of funda-mental economic factors determines whether a bankingsystem and a currency might both be vulnerable to a cri-sis. When the trend in economic fundamentals is inexora-bly deteriorating, banking systems have tended to experi-ence greater stress early on, followed by the currencymarket.
Not all currency crises are preceded by a banking crisis.However, when banking crises are present, they do tendto aggravate and accentuate the crisis on the currency front.This is true of both developed and developing countries.Banking system problems in Scandinavia in the early 1990sand in Japan in the second half of the 1990s accentuatedtheir exchange-rate depreciations during those periods.Banking crises in Mexico and Asia are widely credited withaccentuating the slide of the Mexican peso and Asian cur-rencies during their crisis periods in the 1990s.
In a typical banking/currency crisis, the seeds of a bankingcrisis are often planted when an emerging-market countrytakes steps to liberalize its financial markets. When finan-
cial liberalization is accompanied by other economic re-forms, capital inflows from abroad often increase substan-tially. This surge in capital inflow is then intermediated bythe banking sector to the rest of the emerging-marketeconomy via a lending boom. The lending boom typicallygives rise to an asset-price bubble in the equity and/or prop-erty market and often encourages over-investment or over-consumption. Given that emerging-market banks on aver-age are less regulated and not as adequately supervisedas their counterparts in the industrial world, they are morelikely to engage in questionable and risky lending activi-ties.
The excesses in a typical banking crisis are ultimately un-wound when the asset-price bubble bursts and bankrupt-cies climb. As bankruptcies climb, this gives rise to an in-crease in nonperforming loans on emerging-market banks'books. If nonperforming loans are large relative to the ag-gregate loan portfolio, banks may become technically in-solvent, which in turn may prompt a run on the bankingsystem. In a panic phase, depositors are prone to flee bothweak and healthy banks, thereby placing a strain on theentire banking system.
A banking crisis is likely to lead to a significant downturnin economic activity. As economic activity weakens, therewill be great pressure on the monetary authorities to takecorrective action to stimulate monetary policy. If the reso-lution of a banking crisis requires a costly fiscal bailout,the monetary authorities may be called upon to monetizepart or all of any increase in deficit financing. Hence, abanking crisis may indirectly set off a currency crisis byrequiring the monetary authorities to pursue an excessivelyexpansionary monetary policy.
Excessive Surges in Capital InflowsOften Plant the Seeds of a Future Banking Crisis
Surge inCapitalInflow
AssetPrice
Bubble
Increase inQuestionable
and RiskyLoans
BankLendingBoom
BubbleBursts
Increase inNon-
performingLoansOver-
consumptionand
Over-investment
BankingCrisis
Banking Crises Often Lead Currency Crises
BankingCrisis
Decline inEconomic
ActivityDramatically
EasierMonetary
PolicyCostlyFiscalBailout
Decline inCentralBank’s
Holdingsof
Foreign-ExchangeReserves
Decline inCredibilityof ExistingExchange-
RateRegime
CapitalFlight
CurrencyCrisis
Source: Rosenberg (1998) Source: Rosenberg (1998)

DB Guide to Exchange-Rate Determination May 2002Deutsche Bank @
150 Deutsche Bank Foreign Exchange Research
Contagion—How Currency Crises Spread from One Market to Another
Each of the major currency crises of the 1990s has had anelement of contagion that saw speculative pressuresspread rapidly from one currency to another. For example,in the ERM crisis of 1992-93, the collapse of the Italian liraspread rapidly to the U.K., Spain, and Scandinavia, and then,after a one-year respite, spread to France and Belgium.During the Mexican peso crisis of 1994-95, speculativepressures spread rapidly to a number of markets, with Ar-gentina the most adversely affected. In the case of theAsian currency crisis of 1997-98, the collapse of the Thaibaht spread both north and east to affect most countriesin the region.
While economists agree that currency crises often con-tain a powerful contagion element, there is disagreementas to the underlying causes of contagion. There are actu-ally several channels through which contagion effects cancause speculative attacks to spread from one currency toanother. First, strong bilateral or third-party trade links canbe an important source of contagion. For example, if thecurrency of country A declines and this adversely affectsthe competitiveness of country B, this might raise the vul-nerability of country B's currency to speculative attack.
Second, similar macroeconomic performances might liebehind contagious speculative attacks. If country A's cur-rency came under attack because of poor current-accountbalance or economic growth prospects, this might leadinvestors to believe that country B, which might have similarweak macroeconomic prospects, could also see its cur-rency come under attack.
Third, financial linkages in the form of common lenders/creditors, market liquidity, and investor risk appetite canbe important sources of contagion. For example, asset-allocation shifts by global investors might play a role in thespillover of currency crises from one country to another.Global fund managers with exposure to the emergingmarkets often diversify their investments among severalemerging markets. If one of the currencies in a fundmanager's emerging-market portfolio were to come un-der heavy speculative attack, the fund manager—con-cerned about the possibility of fund withdrawals by indi-vidual investors—might decide to build up cash positionsand to reduce the fund’s overall exposure to the entirebasket of emerging-market currencies in his portfolio. Ifother fund manager portfolios are rebalanced in a similarfashion, this may place downward pressure on a large num-ber of emerging-market currencies.
The Channels of Contagion
Crisisin
Country “A”
BilateralTrade Linkages
Level ofMarket Liquidity
CommonLender
Trade with aCommon Third Party
Crisisin
Country “B”
Global Reduction inAppetite for Risk
Source: Rosenberg (1998)
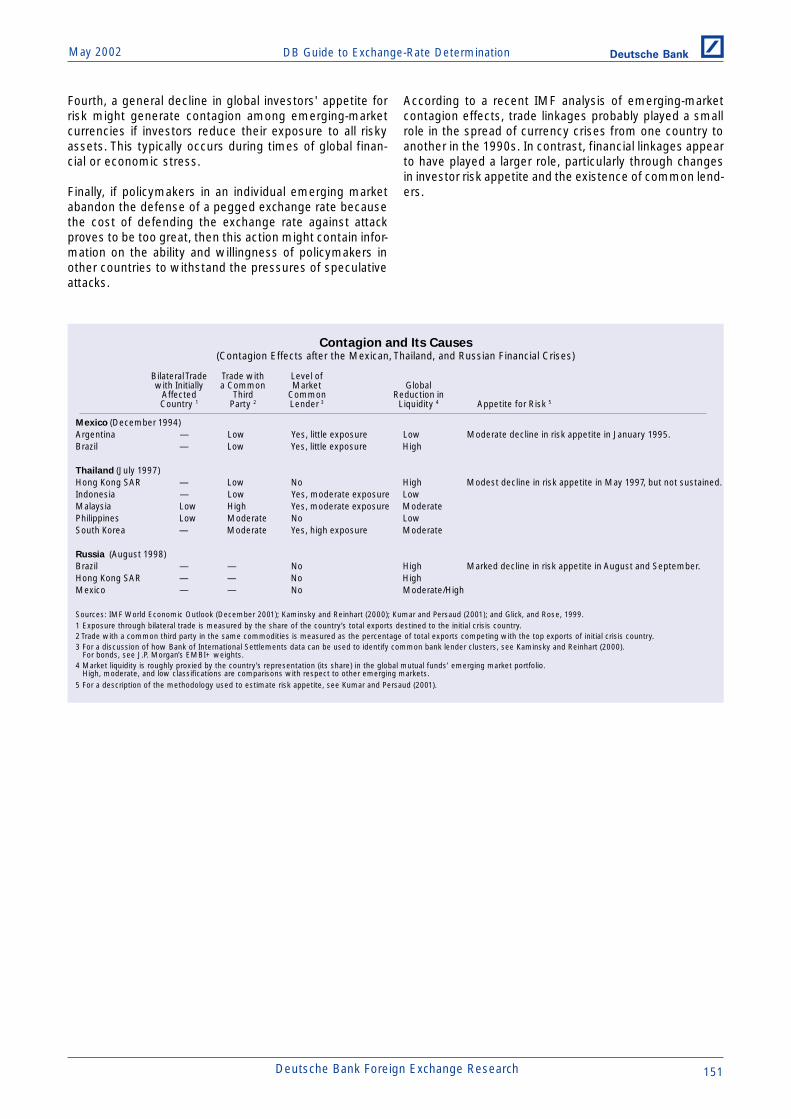
DB Guide to Exchange-Rate DeterminationMay 2002 Deutsche Bank @
Deutsche Bank Foreign Exchange Research 151
Fourth, a general decline in global investors' appetite forrisk might generate contagion among emerging-marketcurrencies if investors reduce their exposure to all riskyassets. This typically occurs during times of global finan-cial or economic stress.
Finally, if policymakers in an individual emerging marketabandon the defense of a pegged exchange rate becausethe cost of defending the exchange rate against attackproves to be too great, then this action might contain infor-mation on the ability and willingness of policymakers inother countries to withstand the pressures of speculativeattacks.
According to a recent IMF analysis of emerging-marketcontagion effects, trade linkages probably played a smallrole in the spread of currency crises from one country toanother in the 1990s. In contrast, financial linkages appearto have played a larger role, particularly through changesin investor risk appetite and the existence of common lend-ers.
Contagion and Its Causes(Contagion Effects after the Mexican, Thailand, and Russian Financial Crises)
Bilateral Trade Trade with Level ofwith Initially a Common Market Global
Affected Third Common Reduction inCountry 1 Party 2 Lender 3 Liquidity 4 Appetite for Risk 5
Mexico (December 1994)Argentina — Low Yes, little exposure Low Moderate decline in risk appetite in January 1995.Brazil — Low Yes, little exposure High
Thailand (July 1997)Hong Kong SAR — Low No High Modest decline in risk appetite in May 1997, but not sustained.Indonesia — Low Yes, moderate exposure LowMalaysia Low High Yes, moderate exposure ModeratePhilippines Low Moderate No LowSouth Korea — Moderate Yes, high exposure Moderate
Russia (August 1998)Brazil — — No High Marked decline in risk appetite in August and September.Hong Kong SAR — — No HighMexico — — No Moderate/High
Sources: IMF World Economic Outlook (December 2001); Kaminsky and Reinhart (2000); Kumar and Persaud (2001); and Glick, and Rose, 1999.1 Exposure through bilateral trade is measured by the share of the country’s total exports destined to the initial crisis country.2 Trade with a common third party in the same commodities is measured as the percentage of total exports competing with the top exports of initial crisis country.3 For a discussion of how Bank of International Settlements data can be used to identify common bank lender clusters, see Kaminsky and Reinhart (2000). For bonds, see J.P. Morgan’s EMBI+ weights.4 Market liquidity is roughly proxied by the country’s representation (its share) in the global mutual funds’ emerging market portfolio. High, moderate, and low classifications are comparisons with respect to other emerging markets.5 For a description of the methodology used to estimate risk appetite, see Kumar and Persaud (2001).
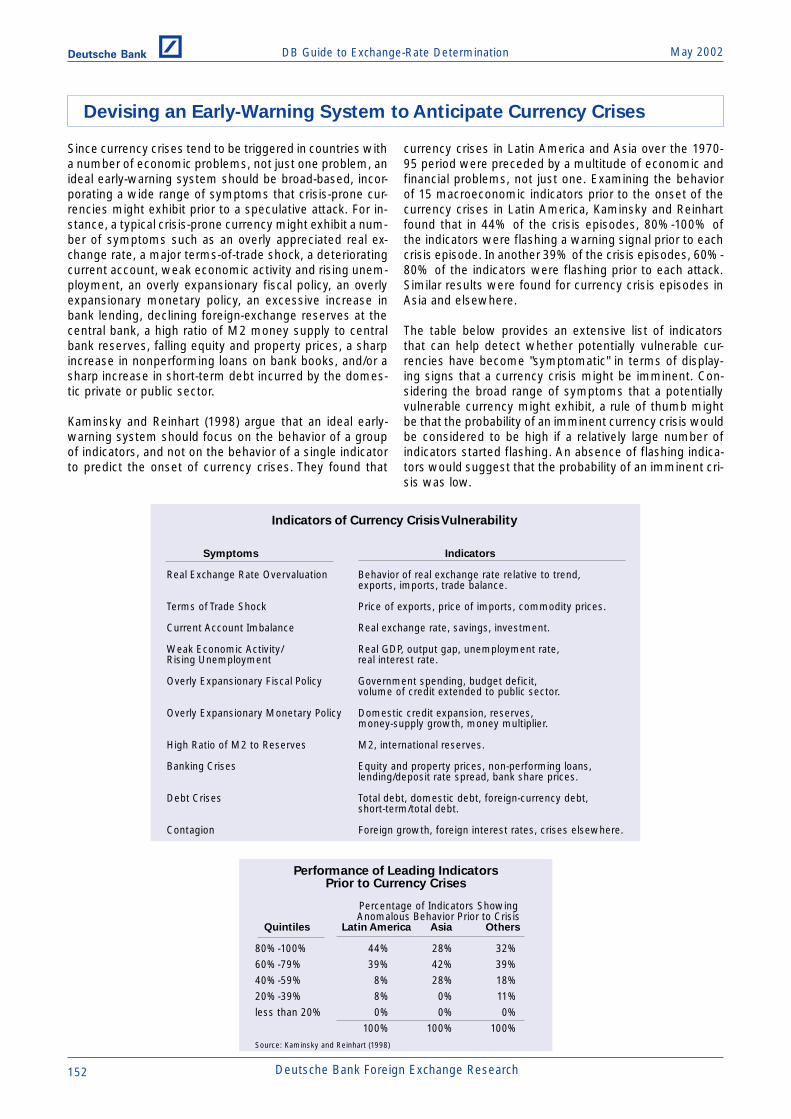
DB Guide to Exchange-Rate Determination May 2002Deutsche Bank @
152 Deutsche Bank Foreign Exchange Research
Devising an Early-Warning System to Anticipate Currency Crises
Since currency crises tend to be triggered in countries witha number of economic problems, not just one problem, anideal early-warning system should be broad-based, incor-porating a wide range of symptoms that crisis-prone cur-rencies might exhibit prior to a speculative attack. For in-stance, a typical crisis-prone currency might exhibit a num-ber of symptoms such as an overly appreciated real ex-change rate, a major terms-of-trade shock, a deterioratingcurrent account, weak economic activity and rising unem-ployment, an overly expansionary fiscal policy, an overlyexpansionary monetary policy, an excessive increase inbank lending, declining foreign-exchange reserves at thecentral bank, a high ratio of M2 money supply to centralbank reserves, falling equity and property prices, a sharpincrease in nonperforming loans on bank books, and/or asharp increase in short-term debt incurred by the domes-tic private or public sector.
Kaminsky and Reinhart (1998) argue that an ideal early-warning system should focus on the behavior of a groupof indicators, and not on the behavior of a single indicatorto predict the onset of currency crises. They found that
currency crises in Latin America and Asia over the 1970-95 period were preceded by a multitude of economic andfinancial problems, not just one. Examining the behaviorof 15 macroeconomic indicators prior to the onset of thecurrency crises in Latin America, Kaminsky and Reinhartfound that in 44% of the crisis episodes, 80%-100% ofthe indicators were flashing a warning signal prior to eachcrisis episode. In another 39% of the crisis episodes, 60%-80% of the indicators were flashing prior to each attack.Similar results were found for currency crisis episodes inAsia and elsewhere.
The table below provides an extensive list of indicatorsthat can help detect whether potentially vulnerable cur-rencies have become "symptomatic" in terms of display-ing signs that a currency crisis might be imminent. Con-sidering the broad range of symptoms that a potentiallyvulnerable currency might exhibit, a rule of thumb mightbe that the probability of an imminent currency crisis wouldbe considered to be high if a relatively large number ofindicators started flashing. An absence of flashing indica-tors would suggest that the probability of an imminent cri-sis was low.
Indicators of Currency Crisis Vulnerability
Symptoms Indicators
Real Exchange Rate Overvaluation Behavior of real exchange rate relative to trend,exports, imports, trade balance.
Terms of Trade Shock Price of exports, price of imports, commodity prices.
Current Account Imbalance Real exchange rate, savings, investment.
Weak Economic Activity/ Real GDP, output gap, unemployment rate,Rising Unemployment real interest rate.
Overly Expansionary Fiscal Policy Government spending, budget deficit,volume of credit extended to public sector.
Overly Expansionary Monetary Policy Domestic credit expansion, reserves,money-supply growth, money multiplier.
High Ratio of M2 to Reserves M2, international reserves.
Banking Crises Equity and property prices, non-performing loans,lending/deposit rate spread, bank share prices.
Debt Crises Total debt, domestic debt, foreign-currency debt,short-term/total debt.
Contagion Foreign growth, foreign interest rates, crises elsewhere.
Performance of Leading IndicatorsPrior to Currency Crises
Percentage of Indicators ShowingAnomalous Behavior Prior to Crisis
Quintiles Latin America Asia Others
80%-100% 44% 28% 32%60%-79% 39% 42% 39%40%-59% 8% 28% 18%20%-39% 8% 0% 11%less than 20% 0% 0% 0%
100% 100% 100%Source: Kaminsky and Reinhart (1998)
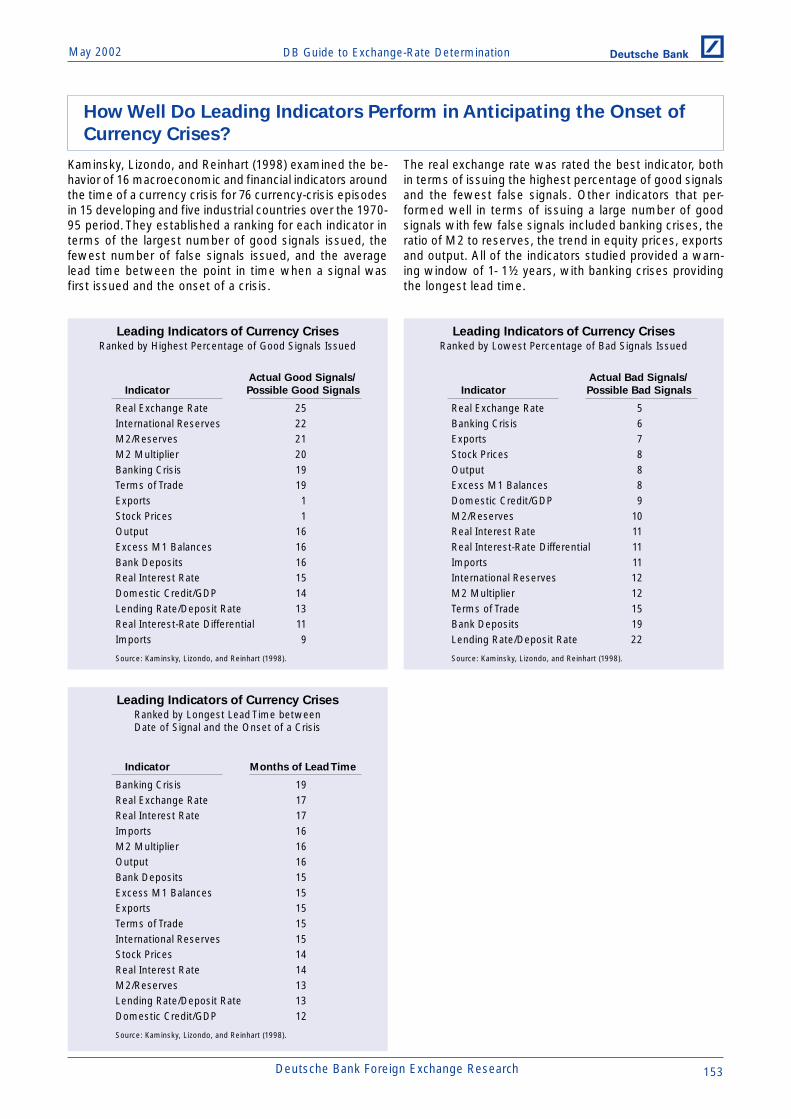
DB Guide to Exchange-Rate DeterminationMay 2002 Deutsche Bank @
Deutsche Bank Foreign Exchange Research 153
Kaminsky, Lizondo, and Reinhart (1998) examined the be-havior of 16 macroeconomic and financial indicators aroundthe time of a currency crisis for 76 currency-crisis episodesin 15 developing and five industrial countries over the 1970-95 period. They established a ranking for each indicator interms of the largest number of good signals issued, thefewest number of false signals issued, and the averagelead time between the point in time when a signal wasfirst issued and the onset of a crisis.
How Well Do Leading Indicators Perform in Anticipating the Onset of
Currency Crises?
The real exchange rate was rated the best indicator, bothin terms of issuing the highest percentage of good signalsand the fewest false signals. Other indicators that per-formed well in terms of issuing a large number of goodsignals with few false signals included banking crises, theratio of M2 to reserves, the trend in equity prices, exportsand output. All of the indicators studied provided a warn-ing window of 1- 1½ years, with banking crises providingthe longest lead time.
Leading Indicators of Currency CrisesRanked by Highest Percentage of Good Signals Issued
Actual Good Signals/
Indicator Possible Good Signals
Real Exchange Rate 25International Reserves 22M2/Reserves 21M2 Multiplier 20Banking Crisis 19Terms of Trade 19Exports 1Stock Prices 1Output 16Excess M1 Balances 16Bank Deposits 16Real Interest Rate 15Domestic Credit/GDP 14Lending Rate/Deposit Rate 13Real Interest-Rate Differential 11Imports 9
Source: Kaminsky, Lizondo, and Reinhart (1998).
Leading Indicators of Currency CrisesRanked by Lowest Percentage of Bad Signals Issued
Actual Bad Signals/
Indicator Possible Bad Signals
Real Exchange Rate 5Banking Crisis 6Exports 7Stock Prices 8Output 8Excess M1 Balances 8Domestic Credit/GDP 9M2/Reserves 10Real Interest Rate 11Real Interest-Rate Differential 11Imports 11International Reserves 12M2 Multiplier 12Terms of Trade 15Bank Deposits 19Lending Rate/Deposit Rate 22
Source: Kaminsky, Lizondo, and Reinhart (1998).
Leading Indicators of Currency CrisesRanked by Longest Lead Time betweenDate of Signal and the Onset of a Crisis
Indicator Months of Lead Time
Banking Crisis 19Real Exchange Rate 17Real Interest Rate 17Imports 16M2 Multiplier 16Output 16Bank Deposits 15Excess M1 Balances 15Exports 15Terms of Trade 15International Reserves 15Stock Prices 14Real Interest Rate 14M2/Reserves 13Lending Rate/Deposit Rate 13Domestic Credit/GDP 12
Source: Kaminsky, Lizondo, and Reinhart (1998).
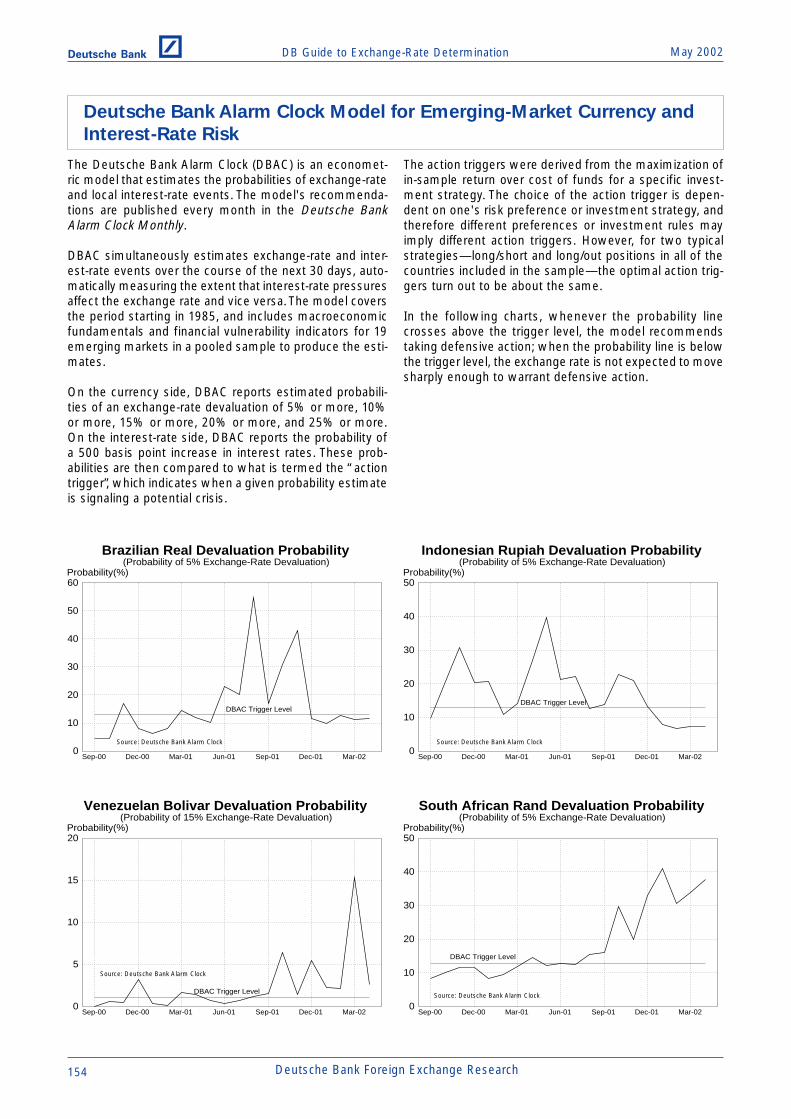
DB Guide to Exchange-Rate Determination May 2002Deutsche Bank @
154 Deutsche Bank Foreign Exchange Research
The Deutsche Bank Alarm Clock (DBAC) is an economet-ric model that estimates the probabilities of exchange-rateand local interest-rate events. The model's recommenda-tions are published every month in the Deutsche BankAlarm Clock Monthly.
DBAC simultaneously estimates exchange-rate and inter-est-rate events over the course of the next 30 days, auto-matically measuring the extent that interest-rate pressuresaffect the exchange rate and vice versa. The model coversthe period starting in 1985, and includes macroeconomicfundamentals and financial vulnerability indicators for 19emerging markets in a pooled sample to produce the esti-mates.
On the currency side, DBAC reports estimated probabili-ties of an exchange-rate devaluation of 5% or more, 10%or more, 15% or more, 20% or more, and 25% or more.On the interest-rate side, DBAC reports the probability ofa 500 basis point increase in interest rates. These prob-abilities are then compared to what is termed the “actiontrigger”, which indicates when a given probability estimateis signaling a potential crisis.
The action triggers were derived from the maximization ofin-sample return over cost of funds for a specific invest-ment strategy. The choice of the action trigger is depen-dent on one's risk preference or investment strategy, andtherefore different preferences or investment rules mayimply different action triggers. However, for two typicalstrategies—long/short and long/out positions in all of thecountries included in the sample—the optimal action trig-gers turn out to be about the same.
In the following charts, whenever the probability linecrosses above the trigger level, the model recommendstaking defensive action; when the probability line is belowthe trigger level, the exchange rate is not expected to movesharply enough to warrant defensive action.
Deutsche Bank Alarm Clock Model for Emerging-Market Currency and
Interest-Rate Risk
Brazilian Real Devaluation Probability(Probability of 5% Exchange-Rate Devaluation)
0
10
20
30
40
50
60
Sep-00 Dec-00 Mar-01 Jun-01 Sep-01 Dec-01 Mar-02
Probability(%)
DBAC Trigger Level
Indonesian Rupiah Devaluation Probability(Probability of 5% Exchange-Rate Devaluation)
0
10
20
30
40
50
Sep-00 Dec-00 Mar-01 Jun-01 Sep-01 Dec-01 Mar-02
Probability(%)
DBAC Trigger Level
Venezuelan Bolivar Devaluation Probability(Probability of 15% Exchange-Rate Devaluation)
0
5
10
15
20
Sep-00 Dec-00 Mar-01 Jun-01 Sep-01 Dec-01 Mar-02
Probability(%)
DBAC Trigger Level
South African Rand Devaluation Probability(Probability of 5% Exchange-Rate Devaluation)
0
10
20
30
40
50
Sep-00 Dec-00 Mar-01 Jun-01 Sep-01 Dec-01 Mar-02
Probability(%)
DBAC Trigger Level
Source: Deutsche Bank Alarm Clock
Source: Deutsche Bank Alarm Clock
Source: Deutsche Bank Alarm ClockSource: Deutsche Bank Alarm Clock
DB Guide to Exchange-Rate DeterminationMay 2002 Deutsche Bank @
Deutsche Bank Foreign Exchange Research 155
References
Aziz, Jahangir, Francesco Caramazza and Ranil Salgado(2000), "Currency Crises: In Search of Common Elements",IMF World Economic Outlook Supporting Studies, 2000,pp. 86-128.
Bank For International Settlements (1999), "The Yen CarryTrade and Recent Foreign Exchange Market Volatility", BISQuarterly Review, March 1999, pp. 33-37.
Berg, Andrew, Eduardo Borensztein, Gian Maria Milesi-Ferretti and Catherine Pattilo (1999), Anticipating Balanceof Payment Crises: The Role of Early Warning Systems,IMF Occasional Paper No. 186, Washington, D.C.
Bernard, Henri J. and Gabriele E.B. Galati (2000), "The Co-Movement of US Stock Markets and the Dollar", BIS Quar-terly Review, August 2000, pp. 31-34.
Bernhardsen, Tom and Oistein Roisland (2000), "FactorsThat Influence the Krone Exchange Rate", Norges BankEconomic Bulletin, Fourth Quarter 2000.
Bilson, John F.O. (1984), "Purchasing Power Parity as a Trad-ing Strategy", Journal of Finance, Vol. 39, No.3, pp. 715-25.
Brooks, Robin, Hali Edison, Manmohan S. Kumar andTorsten Slok (2001), "Exchange Rates and Capital Flows",IMF Working Paper, WP/01/190.
Cheung, Yin-Wong, Menzie D. Chinn and Ian W. Marsh(2000), "How Do UK-Based Foreign Exchange Dealers ThinkTheir Market Operates", NBER Working Paper, No.7524,February 2000.
Chinn, Menzie D. and Ron Alquist (2000), "Tracking theEuro's Progress", International Finance, Vol. 3, No. 3, No-vember 2000, pp. 357-373.
Clostermann, Jorg and Bernd Schnatz (2000), "The Deter-minants of the Euro-Dollar Exchange Rate: Synthetic Fun-damentals and a Non-Existing Currency", DeutscheBundesbank Discussion Paper, 2/00.
Cooper, Neil and James Talbot (1999), "The Yen/Dollar Ex-change Rate in 1998: Views From Options Markets", Bankof England Quarterly Bulletin, February 1999, pp. 68-77.
Copeland, Laurence S. (2000), Exchange Rates and Inter-national Finance, Third Edition, Pearson Education Limited,Essex.
DeGrauwe, Paul (1996), International Money: PostwarTrends and Theories, 2nd Edition, Oxford University Press,Oxford.
Dominguez, Kathryn M. and Jeffrey Frankel (1993), DoesForeign Exchange Intervention Work?, Institute For Inter-national Economics, Washington, D.C.
Dornbusch, Rudiger (1976), "Expectations and ExchangeRates Dynamics", Journal of Political Economy, Vol. 84, pp.1161-76.
Dunis, Christian and Pierre Lequeux (2001), "The Informa-tion Content of Risk Reversals", Derivatives Use, Tradingand Regulation, Vol. 7, Number 2, pp.98-117.
European Central Bank (2002), "Economic Fundamentalsand the Exchange Rate of the Euro", ECB Monthly Bulle-tin, January 2002.
Fender, Ingo and Gabriele Galati (2001), "The Impact ofTransatlantic M&A Activity on the Dollar/Euro ExchangeRate", BIS Quarterly Review, December 2001, pp. 58-68.
Fleming, J. Marcus (1962), "Domestic Financial PoliciesUnder Fixed and Floating Exchange Rates", IMF Staff Pa-pers, Vol.9, November 1962, pp. 369-79.
Frankel, Jeffrey (1979), "On the Mark: A Theory of FloatingExchange Rates Based on Real Interest Rate Differentials",American Economic Review, Vol. 69, September 1979, pp.610-22.
Frankel, Jeffrey and Kenneth Froot (1990), "Chartists, Fun-damentalists and the Demand For Dollars", in Policy Is-sues in Interdependent Economics, edited by T. Courakisand M. Taylor, Clarendon Press, Oxford.
Frankel, Jeffrey A. and Andrew K. Rose (1996), "CurrencyCrashes in Emerging Markets: Empirical Indicators", NBERWorking Paper, No. 5437.

DB Guide to Exchange-Rate Determination May 2002Deutsche Bank @
156 Deutsche Bank Foreign Exchange Research
Froot, Kenneth A. and Richard H. Thaler (1990), "Anoma-lies: Foreign Exchange", Journal of Economic Perspectives,Vol.4, No.3, Summer 1990, pp. 179-192.
Gehrig, Thomas and Lukas Menkhoff (2002), "The Use ofFlow Analysis in Foreign Exchange," CEPR Discussion Pa-per Series, No. 3221.
Goldfajn, Ilan and Rodrigo O. Valdes (1996), "The Aftermathof Appreciations", NBER Working Paper, No. 5650.
Goldstein, Morris, Graciela L. Kaminisky and Carmen M.Reinhart (2000), Assessing Financial Vulnerability: An EarlyWarning System For Emerging Markets, Institute For In-ternational Economics, Washington, D.C.
Goldstein, Morris, and John Hawkins (1998), "The Originof the Asian Financial Turmoil", Reserve Bank of Australia,Research Discussion Paper, No. 9805.
Gruen, David (2001), "Some Possible Long-Term Trends inthe Australian Dollar", Reserve Bank of Australia Bulletin,December 2001, pp.30-41.
Gust, Christopher and Jaime Marquez (2000), "Productiv-ity Developments Abroad", Federal Reserve Bulletin, Oc-tober 2000, pp. 665-681.
Hallwood, C. Paul and Ronald MacDonald (2000), Interna-tional Money and Finance, 3rd Edition, Blackwell Publish-ers, Malden, Massachusetts.
IMF, World Economic Outlook Reports, May 1998, Decem-ber 2001.
Isard, Peter and Hamid Faruqee, editors (1998), “ExchangeRate Assessment: Extensions of the Macroeconomic Bal-ance Approach”, IMF Occasional Paper, No. 167.
Isard, Peter, Hamid Faruqee, G. Russell Kincaid and Mar-tin Fetherston (2001), “Methodology For Current Accountand Exchange Rate Assessments”, IMF Occasional Paper,No. 209.
Kaminsky, Graciela L. and Carmen M. Reinhart (1997), "TheTwin Crises: The Causes of Banking and Balance of Pay-ments Problems", University of Maryland Working Paper,No. 37.
Kaminsky, Graciela L. and Carmen M. Reinhart (1998), "Fi-nancial Crises in Asia and Latin America: Then and Now",mimeo.
Kaminsky, Graciela L., Saul Lizondo and Carmen M.Reinhart (1998), "Leading Indicators of Currency Crises",IMF Staff Papers, Vol. 45, No. 1, March 1998, pp. 1-48.
Koen, Vincent, Laurence Boone, Alain de Serres and NicolaFuchs (2001), "Tracking the Euro", OECD Economic Depart-ment Working Paper, No. 298.
Kritzman, Mark P. (1998), "The Forward Rate Bias", AIMRConference Proceedings, Currency Risk in InvestmentPortfolios, Charlottesville, VA.
Krugman, Paul (1998), "It's Baaack: Japan's Slump and theReturn of the Liquidity Trap", Brookings Papers on EconomicActivity, 1998, Vol. 2.
Laidler, David and Shay Aba (2002), "Productivity and theDollar: Commodities and the Exchange Rate Connection",C.D. Howe Institute Commentary, No. 158, February 2002.
Lyons, Richard K. (2000), "Multiple Currency InvestmentStrategies To Take Advantage of the Forward Discount Bias",class project for International Finance 285 course, (http://haas.berkeley.edu/~Lyons/285.html).
Lyons, Richard K. (2001), The Microstructure Approach toExchange Rates, MIT Press, Cambridge, Mass.
MacDonald, Ronald and J. Nagayasu (2000), "The Long-Run Relationship Between Real Exchange Rates and RealInterest Rate Differentials: A Panel Study", IMF Staff Pa-pers, Vol. 47, No. 1, pp. 116-128.
MacDonald, Ronald and Jerome L. Stein (1999), Equilib-rium Exchange Rates, Kluwer Academic Publishers,Dordrecht, Netherlands.
MacDonald, Ronald and Philip Swagel (2000), "BusinessCycle Influences on Exchange Rates: Survey and Evidence",IMF World Economic Outlook Supporting Studies, 2000,pp.129-160.
Mann, Catherine L. (1999), Is the US Trade Deficit Sustain-able?, Institute For International Economics, Washington,D.C.

DB Guide to Exchange-Rate DeterminationMay 2002 Deutsche Bank @
Deutsche Bank Foreign Exchange Research 157
Mark, Nelson C. (2001), International Macroeconomics andFinance: Theory and Econometric Methods, Blackwell Pub-lishers, Malden, Mass.
McGuckin, Robert H. and Bart Van Ark (2001), Making theMost of the Information Age: Productivity and StructuralReform in the New Economy, The Conference Board, Inc.,New York.
McKinsey Global Institute (2001), US Productivity Growth,1995-2000, McKinsey and Co., Washington D.C.
McKinnon, Ronald I. (1979), Money in International Ex-change: The Convertible Currency System, Oxford Univer-sity Press, New York.
McKinnon, Ronald I. And Kenichi Ohno (1997), Dollar andYen: Resolving Economic Conflict Between The UnitedStates and Japan, MIT Press, Cambridge, Mass.
Meredith, Guy (2001), "Why Has the Euro Been So Weak?"IMF Working Paper, WP/01/155.
Meese, Richard and Kenneth Roguff (1983), "EmpiricalExchange Rate Models of the Seventies: Do They Fit Outof Sample", Journal of International Economics, Vol. 14,No. 1, pp. 3-24.
Mundell, Robert A. (1963), "Capital Mobility and Stabiliza-tion Policy Under Fixed and Flexible Exchange Rates", Ca-nadian Journal of Economics and Political Science, Vol. 29,November 1963, pp. 475-85.
Neely, Christopher J. (1997), "Technical Analysis in the For-eign Exchange Market: A Layman's Guide", Federal Re-serve Bank of St. Louis Review, September/October 1997,pp. 23-38.
Obstfeld, Maurice and Kenneth Rogoff (1994), "TheIntertemporal Approach to the Current Account", NBERWorking Paper, No. 4893.
Osler, Carol and P.N. Kevin Chang (1995), "Head and Shoul-ders: Not Just A Flaky Pattern", Federal Reserve Bank ofNew York Staff Reports, No. 4.
Pilbeam, Keith (1998), International Finance, 2nd Edition,Macmillan Press LTD, London.
Posen, Adam S. (1998), Restoring Japan's EconomicGrowth, Institute For International Economics, Washing-ton, D.C.
Rogoff, Kenneth (1996), "The Purchasing Power ParityPuzzle", Journal of Economic Literature, Vol. XXXIV, June1996, pp. 647-668.
Rosenberg, Michael R. (1998), Currency Crises in Emerg-ing Markets: A Guide To Speculative Attack Models andEarly Warning Systems, Merrill Lynch Research Report.
Rosenberg, Michael R. (1996), Currency Forecasting: AGuide To Fundamental and Technical Models of ExchangeRate Determination, Richard D. Irwin Co., Chicago, IL.
Sachs, Jeffrey, Aaron Tornell and Andres Velasco (1996),"Financial Crises in Emerging-markets: The Lessons From1995", Brookings Papers on Economic Activity, 1996, No.1, pp. 147-215.
Sarno, Lucio and Mark P. Taylor (2001), "Official Interven-tion in the Foreign Exchange Market: Is It Effective and, IfSo, How Does It Work?", Journal of Economic Literature,Vol. XXXIV, No. 3, September 2001, pp. 839-868.
Tille, Cedric, et al. (2001), "To What Extent Does Productiv-ity Drive the Dollar", Federal Reserve Bank of New YorkCurrent Issues in Economics and Finance, Vol. 7, No. 8,August 2001.
Williamson, John, editor (1994), Estimating EquilibriumExchange Rates, Institute For International Economics,Washington, D.C.

DB Guide to Exchange-Rate Determination May 2002Deutsche Bank @
158 Deutsche Bank Foreign Exchange Research

FX Weekly 7 December 2001Deutsche Bank @
14 Deutsche Bank Foreign Exchange Research
Global Markets ResearchDavid Folkerts-Landau
Managing Director, Global Head of Research Tel: +44 20 754 55502Stuart Parkinson, Chief Operating Officer Tel: +44 20 754 57303Peter Garber, Global Strategist Tel: +1 212 469 5466
Credit Derivatives Research and StrategyJohn F. Tierney, Global Head Tel: +1 212 469 6795
Credit ResearchSimon Adamson, Co-head, European High Grade Credit Research Tel: +44 20 754 58715David Bitterman, Co-head, US High Yield Credit Research Tel: +1 212 469 2599Nuj Chiaranussati, Head of Asian Credit Research Tel: +65 6423 5930Anja King, Co-head, European High Grade Credit Research Tel: +44 20 754 59260Helen Rodriguez, Head, European High Yield Research Tel: +44 20 754 53824Andrew W. Van Houten, Co-head, US High Yield Credit Research Tel: +1 212 469 2777
Economic ResearchCiaran Barr, Chief Economist UK Tel: +44 20 754 52088Ulrich Beckmann, Co-head, European Economics Tel: +49 69 910 31729Marco Annunziata, Chief Economist, Emerging Europe Tel: +44 20 754 55506Ivan Colhoun, Chief Economist, Australia Tel: +61 2 9258 1667Peter Hooper, Chief US Economist Tel: +1 212 469 7352Atsushi Mizuno, Chief Economist, Japan Tel: +81 3 5156 6316Carlo Monticelli, Co-head, European Economics Tel: +44 20 754 72884Michael Spencer, Chief Economist, Asia Tel: +852 2203 8305
Emerging Markets ResearchJose Luis Daza, Head of Emerging Markets Strategy Tel: +1 212 469 8985Leonardo Leiderman, Head of Emerging Markets Economics Tel: +1 212 469 5894
Fixed Income and Relative Value ResearchJamil Baz, Global Head Tel +44 20 754 54017
Foreign Exchange ResearchMichael Rosenberg, Global Head Tel +1 212 469 4776
IndicesFergus Lynch, Head of Index Development Tel: +44 20 754 58765
Quantitative Flow ResearchRobin Lumsdaine, Head/Global Econometric Strategist Tel: +44 20 754 54858
Securitization ResearchKaren Weaver, Global Head Tel: +1 212 469 3125
Main OfficesLondon
Winchester House1 Great Winchester StreetLondon EC2N 2DBUnited KingdomTel: +44 20 7545 8000Frankfurt
Grosse Gallusstrasse 10-1460311 FrankfurtGermanyTel: +49 69 9100-0New York
31 West 52nd StreetNew York, NY 10019United States of AmericaTel: +1 212 469 5000Hong Kong
55/F, Cheung Kong Center2 Queen’s Road, CentralHong KongTel: +852 2203 8888Sydney
Grosvenor PlaceLevel 18,225 George StreetSydney NSW 2000AustraliaTel: +61 2 9258 1661Singapore
5 Temasek Boulevard#08-01 Suntec Tower FiveSingapore 038985Tel: +65 6224 4677Tokyo
Sanno Park Tower2-11-1, Nagatacho,Chiyoda-ku, Tokyo 100-6171JapanTel: +81 3 5156 6000
�"210 %"���+(�
Publication Address:Deutsche Bank AG LondonWinchester House1 Great Winchester StreetLondon EC2N 2DB
Internet:http://research.gm.db.comAsk your usual contact for ausername and password.
The information and opinions in this report were prepared by Deutsche Bank AG or one of its affiliates (collectively “DeutscheBank”). This report is based upon information available to the public. The information herein is believed by Deutsche Bank to bereliable and has been obtained from sources believed to be reliable, but Deutsche Bank makes no representation as to theaccuracy or completeness of such information. Deutsche Bank may be market makers or specialists in, act as advisers or lendersto, have positions in and effect transactions in securities of companies mentioned herein and also may provide, may haveprovided, or may seek to provide investment banking services for those companies. In addition, Deutsche Bank or its respectiveofficers, directors and employees hold or may hold long or short positions in the securities, options thereon or other relatedfinancial products of companies discussed herein. Opinions, estimates and projections in this report constitute the currentjudgement of the author as of the date of this report. They do not necessarily reflect the opinions of Deutsche Bank and aresubject to change without notice. Deutsche Bank has no obligation to update, modify or amend this report or to otherwise notifya reader thereof in the event that any matter stated herein, or any opinion, projection, forecast or estimate set forth herein,changes or subsequently becomes inaccurate or misleading. Prices and availability of financial instruments also are subject tochange without notice. This report is provided for informational purposes only. It is not to be construed as an offer to buy or sellor a solicitation of an offer to buy or sell any financial instruments or to participate in any particular trading strategy in anyjurisdiction in which such an offer or solicitation would violate applicable laws or regulations. The financial instruments discussedin this report may not be suitable for all investors and investors must make their own investment decisions using their ownindependent advisors as they believe necessary and based upon their specific financial situations and investment objectives. If afinancial instrument is denominated in a currency other than an investor’s currency, a change in exchange rates may adverselyaffect the price or value of, or the income derived from, the financial instrument, and such investor effectively assumes currencyrisk. In addition, income from an investment may fluctuate and the price or value of financial instruments described in this report,either directly or indirectly, may rise or fall. Furthermore, past performance is not necessarily indicative of future results, andshould not therefore form the basis of a decision whether or not to invest in any securities issued by any company mentionedherein. Unless governing law permits otherwise, all transactions should be executed through the Deutsche Bank entity in theinvestor’s home jurisdiction. In the U.S. this report is approved and/or distributed by Deutsche Bank Securities Inc., a member ofthe NYSE, the NASD and SIPC. In the United Kingdom this report is approved and/or communicated by Deutsche Bank AGLondon. In jurisdictions other than the U.S. and the U.K. this report is distributed by the Deutsche Bank affiliate in the investor’sjurisdiction, and interested parties are advised to contact the Deutsche Bank office with which they currently deal. Additionalinformation relative to securities, other financial products or issuers discussed in this report is available upon request. No part ofthis material may be copied or duplicated in any form or by any means, or redistributed, without Deutsche Bank’s prior writtenconsent. Copyright• 2002 Deutsche Bank AG
Subscribers to research via
email receive their
electronic publication on
average 1-2 working days
earlier than the printed
version.
If you would like to receive
this or any other product
via email please contact
your usual Deutsche Bank
representative.
Global Markets Global Markets Global Markets