guide to computing and reporting the life cycle cost of ... · pdf filephilip j. bond, under...
TRANSCRIPT

NISTIR 6968
U.S. Department of Commerce Technology Administration Building and Fire Research Laboratory National Institute of Standards and Technology Gaithersburg, MD 20899
Office of Applied Economics
Guide to Computing and Reporting the Life Cycle Cost of Environmental Management Projects Laura I. Schultz and Stephen F. Weber
U.S. Department Of Energy Office of Environmental Management

NISTIR 6968
U.S. Department of Commerce Technology AdministrationNational Institute of Standards and Technology Gaithersburg, MD 20899
Office of Applied Economics Building and Fire Research Laboratory
Guide to Computing and Reporting the Life-Cycle Cost of Environmental Management Projects Laura I. Schultz and Stephen F. Weber
Funded by:
U.S. Department of Energy Washington, DC 20585
March 2003
U.S. DEPARTMENT OF COMMERCE Donald L. Evans, Secretary
TECHNOLOGY ADMINISTRATION Philip J. Bond, Under Secretary for Technology
NATIONAL INSTITUTE OF STANDARDS AND TECHNOLOGY Arden L. Bement, Jr., Director
Abstract
Life-cycle cost (LCC) analysis is an economic measurement technique used to determine the
total cost of an investment project or activity over its lifetime. This Guide applies the principles
of LCC to the special requirements of Environmental Management (EM) projects. The approach
integrates two ASTM International consensus standards: a widely used standard on LCC, and a
recently adopted standard on the work breakdown structure expressed in the Environmental Cost
Element Structure (ECES) developed by a Federal interagency working group concerned with
efficient execution of EM projects. The LCC method described in the Guide can be applied to
any EM project that has adopted the ECES cost management framework. Users of the Guide are
assumed to be familiar with the ECES and the consensus standards that support it. The Guide
covers economic comparisons across environmentally equivalent alternatives for an EM project
addressing a single site as well as economic analysis of EM projects at different sites. Both one-
time and recurring expenditures are covered as well as discounting on both an annual and a
monthly basis. Several realistic case examples illustrate the method.
Keywords: discounting; economic evaluation; engineering economics; environmental
management; investment analysis; life-cycle costing; present value; project evaluation; standards
Guide to Computing and Reporting the LCC of EM Projects iii

Contents
Abstract…… ............................................................................................................ iii
List of Exhibits and Figures......................................................................................vi
1. Introduction............................................................................................................1
1.1 Purpose.......................................................................................................................1 1.2 Scope..........................................................................................................................2 1.3 Overview....................................................................................................................3
2. Defining the Environmental Management Project ................................................5
2.1 Project Definition.......................................................................................................5 2.2 Specifying Alternatives..............................................................................................5 2.3 Illustration: Report Form for Project Definition.......................................................5
3. Setting the LCC Parameters...................................................................................9
3.1 Base Date ...................................................................................................................9 3.2 Study Period...............................................................................................................9 3.3 Treatment of Sunk Costs..........................................................................................11 3.4 Discount Rate...........................................................................................................11 3.5 Illustration: Report Form for LCC Parameters .......................................................13
4. Organizing ECES Cost Data ................................................................................15
4.1 Timing of Costs........................................................................................................15 4.2 Treatment of Inflation or Deflation in Cost Estimates.............................................15 4.3 Area Cost Factors.....................................................................................................16 4.4 Illustration: Sample Cost Database.........................................................................16
5. Computing the LCC of the EM Project ...............................................................19
5.1 Computing the Present Value of a Single Amount..................................................19 5.2 Discounting of Annual versus Monthly Costs .........................................................20 5.3 Computing the Present Value of Monthly Costs .....................................................22 5.4 Computing the Present Value of a Uniform Series..................................................23 5.5 Illustration: Computing the LCC of the Sample Project.........................................25 5.6 Interpreting the Total LCC.......................................................................................26
6. Comparing EM Alternatives Using LCC Analysis ..............................................27
6.1 Environmental Management Project Specification .................................................27 6.2 Project Alternatives..................................................................................................27 6.3 Setting Analysis Parameters ....................................................................................28 6.4 Calculations of LCC for Both Alternatives .............................................................28 6.5 Calculation of the Adjusted LCC.............................................................................29 6.6 Life-Cycle Cost Report ............................................................................................30 6.7 Conclusion ...............................................................................................................32
Guide to Computing and Reporting the LCC of EM Projects v

References… ............................................................................................................33
Appendix A: Data for Sample Project without Alternatives....................................35
Appendix B: Data for Case Study with Two Alternatives—In Situ Soil Vapor Extraction ...........................................................................................43
Appendix C: Data for Case Study with Two Alternatives—Natural Attenuation.........................................................................................47
Appendix D: Derivation of the Equation for Discounting Monthly Costs..............53
Appendix E: Blank Report Forms............................................................................55
List of Exhibits and Figures
Exhibit 1: Project Definition.......................................................................................................... 7
Exhibit 2: LCC Parameters .......................................................................................................... 14
Exhibit 3: Excerpt from the Sample Cost Database..................................................................... 17
Exhibit 4: Illustrative Cost Data Extracted from the Sample Project in Appendix A ................. 22
Exhibit 5: Illustrative Cost Data for a Uniform Series of Expenditures Extracted from the
Sample Project in Appendix A ................................................................................... 24
Exhibit 6: Present Value Costs for Phase 4 of Sample Project in Appendix A ........................... 25
Exhibit 7: Present Value Costs by Phase for Sample Project in Appendix A ............................. 26
Exhibit 8: Present Value Costs by Phase for In Situ Vapor Extraction (Alternative A) ............. 29
Exhibit 9: Present Value Costs by Phase for Natural Attenuation (Alternative B) ..................... 29
Figure 1: Cash Flow over the Life Cycle of a Project ................................................................. 10
Figure 2: Uniform Series of Expenditures ................................................................................... 23
Guide to Computing and Reporting the LCC of EM Projects vi

1. Introduction
1.1 Purpose
Life-cycle cost (LCC) analysis is an economic measurement technique used to determine the
total cost of an investment project or activity over its lifetime.1 This Guide applies the general
principles of LCC to the special requirements of Environmental Management (EM) projects.
The approach defined and illustrated in the Guide provides a method for computing a single
number that represents the total present value cost of an EM project over its entire life cycle.
The approach is primarily based on a widely used consensus standard published by ASTM
International (formerly known as the American Society for Testing and Materials).2 While this
standard was developed to be applied to building systems, the LCC method that it defines may
be applied to any type of investment project. As the Forward to the published compilation of
ASTM International building economics standards states, “Although the standards focus on
buildings and building components, the standards are equally applicable to non-building
investments. The same principles apply in evaluating any capital budget expenditure.”
The LCC measure explicitly takes into account the time value of money, that is, the variation in
the cost of an expenditure due to its timing.3 Two types of variation are accounted for in the time
value of money. One is the result of changes in prices due to inflation or deflation. The second
arises from the real earning power of money over time. This real earning power means that
identical dollar expenditures impose differing costs depending on when they are incurred. The
Guide addresses both types of variation due to timing. The LCC measure presented here
1 For background on the various methods of project evaluation and capital budgeting, of which LCC is one, seecomprehensive engineering economics texts, such as Au, Tung and Au, Thomas P. 1992. Engineering Economics for Capital Investment Analysis. 2nd Edition. Englewood Cliffs, NJ: Prentice Hall, and Park, Chan S. 2001. Contemporary Engineering Economics. 3rd Edition. Englewood Cliffs, NJ: Prentice Hall College Division. For a thorough treatment of LCC itself, see Fuller, Sieglinde K., and Petersen, Stephen R. 1996. Life-Cycle Costing Manual for the Federal Energy Management Program. NIST Handbook 135. 1995 Edition. Gaithersburg, MD: National Institute of Standards and Technology.2 ASTM International. 2003. Standard Practice for Measuring Life-Cycle Costs of Buildings and Building Systems.E 917-02. West Conshohocken, PA: ASTM International.3 Terminology, such as “time value of money,” used in the Guide is consistent with the definitions given in: ASTM International. 2003. Standard Terminology of Building Economics. E 833-02a. West Conshohocken, PA: ASTMInternational.
Guide to Computing and Reporting the LCC of EM Projects 1

represents the total cost of a project over its life, fully accounting for the timing of every
expenditure.
1.2 Scope
The Guide describes how to apply the LCC technique to EM projects by using the work
breakdown structure defined in the Environmental Cost Element Structure (ECES). The ECES
has been developed and maintained by the Environmental Cost Engineering Committee, a
Federal interagency working group concerned with efficient execution of EM projects.4 The first
two levels of the ECES have been adopted as a voluntary consensus industry standard, ASTM
E 2150-02.5 In addition, an Adjunct to this standard has recently been adopted to cover the
remaining three levels of the ECES (Levels 3, 4, and 5).6 The Guide uses examples that
explicitly address all five levels of ECES covered by the published standard and the adjunct.
The LCC method described in the Guide can be applied to any EM project that has adopted the
ECES cost management framework. The ECES work breakdown structure allows project
managers to easily manage the costs, timing, and objectives associated with an EM project. This
framework allows for straightforward calculation of the LCC of an EM project using the Guide.
The Guide may also be used to analyze projects whose data are organized and coded using other
work breakdown structures, such as the Construction Specifications Institute MasterFormat
system7 or the ASTM International UNIFORMAT II system.8 MasterFormat arranges related
construction products and activities into 16 level-one titles, called divisions. Each division is
further defined in MasterFormat by numbers and titles for levels two and three, and suggested
titles for level four. Level-two numbers and titles identify clusters of products and activities
having an identifying characteristic in common. UNIFORMAT II is a common elemental
4 U.S. Department of Energy. 2002. Environmental Cost Element Structure. Washington, DC: InteragencyEnvironmental Cost Engineering Committee.5 ASTM International. 2003. Standard Classification for Life-Cycle Environmental Work Elements—Environmental Cost Element Structure. E 2150-02. West Conshohocken, PA: ASTM International. 6 ASTM International. 2002. Environmental Cost Element Structure at Levels 3, 4 and 5 and Definitions. Adjunctto ASTM Classification Standard E 2150-02. West Conshohocken, PA: ASTM International.7Construction Specifications Institute, MasterFormat 1995, Alexandria, VA: Construction Specifications Institute. 8ASTM International. 2003. Standard Classification for Building Elements and Related Sitework-UNIFORMAT II.E 1557-02. West Conshohocken, PA: ASTM International.
Guide to Computing and Reporting the LCC of EM Projects 2

classification for the description, economic analysis, and management of a building over its life
cycle. Elements—often referred to as systems or assemblies—are major components common to
most buildings that usually perform a given function regardless of the design specification,
construction method, or materials use.
Users of the Guide are assumed to be familiar with the ECES and the ASTM International
standard and adjunct that support it. It is further assumed that the cost data for EM projects to be
analyzed by the method of this Guide are organized using ECES and that every cost item is
coded as a specific element of ECES. Each cost item must be assigned to the specific time
period in which it is expected to be incurred.
The LCC method defined in the Guide may be used to perform two types of analysis, prospective
and retrospective. Prospective LCC analysis may be used to examine a single EM project that
has not yet started. Prospective analysis will reliably compare alternative approaches to the same
EM project, provided all alternatives are expected to achieve the same level of environmental
performance over the same time period. The LCC estimates may also be used for budgetary
purposes.
Retrospective LCC analysis examines EM projects that have been completed. The analysis may
be used to look at past approaches to similar projects. The analysis of past projects may provide
insight to improve the efficiency of future budget decisions. Comparisons across different EM
projects require a geographic cost index factor to adjust for variations in construction costs
throughout the country.
1.3 Overview
Section 2 describes how to define the particular EM project being analyzed. Section 3 explains
how to establish the key LCC parameters used in calculating the LCC of any project and its
alternatives. These parameters are the base date, the study period, and the discount rate. Section
4 discusses the organization of the cost data in terms of timing and cost conditions sensitive to
geographic variation as well as the treatment of inflation. Section 5 explains and illustrates how
to compute the LCC of a sample EM project that has only one environmental solution. Section 5
Guide to Computing and Reporting the LCC of EM Projects 3

also covers the discounting of one-time expenditures as well as expenditures that recur over
several time periods. It treats the discounting of both annual costs and monthly costs. Finally,
Section 6 demonstrates how to compare the LCC of multiple alternatives. A case study with two
alternative environmental solutions is included to illustrate the approach. Appendixes A, B, and
C present tables of all the sample data used in the illustrations throughout the Guide.
Guide to Computing and Reporting the LCC of EM Projects 4

2. Defining the Environmental Management Project
The Guide uses a comprehensive report form to organize and summarize the LCC analysis of an
EM project. This LCC report form has four sections: (1) Project Definition; (2) LCC
Parameters; (3) LCC by Phase and Alternative; and (4) Summary Table of LCC by Alternative.
This section of the Guide discusses how to prepare the Project Definition section of the LCC
report. Section 3 covers the LCC Parameters section of the report. Section 6 shows how to use
the third and fourth sections of the report covering the results of the LCC analysis.
2.1 Project Definition
Define the EM project before performing any calculations. The project definition allows readers
to understand the scope of the project analysis and provides them with information about
important factors that may influence the results. Include the Title, Location, Type, Record of
Decision Date, Analyst contact information, and Project Description in the Project Definition
Section of the LCC report.
2.2 Specifying Alternatives
If the purpose of the LCC analysis is to evaluate alternative approaches to completing a single
project, include a description of the alternatives in the project definition. Although the
alternatives may employ different environmental remediation methods, they must all be designed
to achieve the same level of environmental performance. The alternatives must be analyzed
using the same base date, study period, and discount rate, as discussed in Section 3.
2.3 Illustration: Report Form for Project Definition
To better illustrate the principles of LCC, a sample project has been developed based on an
actual EM project. This project offers only one environmental solution, so that there is no need
to evaluate and compare multiple alternatives. The examples given through Section 5 use data
from this sample project. A table with all cost data for this sample project is in Appendix A.
Section 6 presents a case study of a more complex project that involves two alternatives.
Guide to Computing and Reporting the LCC of EM Projects 5
The sample EM project used through Section 5 is a decontamination of a former nuclear
production facility. The clean-up site is a three-story building measuring approximately 27.4 m
x 45.7 m x 45.7 m (90 ft x 150 ft x150 ft), constructed in 1950 to convert uranium hexafluoride
(UF6) to uranium tetrafluoride (UF4). The production was initiated in 1953 and continued until
1957. This facility contains asbestos, radiological contamination, lead paint and flashing, and
health risk due to biological contaminants such as bacteria found in soil and plant debris. The
facility is located on 0.4 hectares (1 acre) of land, near the town of Lockport, in upstate New
York. Cleaning the facility and surrounding area will begin in January 2004. Once the facility
has been decontaminated, the site will be in long-term surveillance and maintenance (legacy
management) until 2028. Exhibit 1 is the first section of the LCC report form, called Project
Definition, filled out using information from the sample EM project. Blank versions of all four
sections of the LCC report form can be found in Appendix E.
Guide to Computing and Reporting the LCC of EM Projects 6

1.
Project Title: Nuclear Production Facility Decontamination
Location (City / ST / Zip): Lockport / NY / 14094
Project Type (Circle One): RCRA CERCLA A WM D&D
Record of Decision Date: January / 31 / 2003
Analyst: John Doe Phone: (XXX)XXX-XXXX Email: [email protected]
Project Description: D e co ntam ination, m onito rin g , an d lo ng-te rm stew ardship of a fo rm er nucle ar prod uctio n fa c ility. T h e fa c ility w a s shut dow n a nd d e com m iss ioned w hen it w a s tran sferre d in to th e environ m enta l pro g ra m . T h is is a th re e-story build ing m e a s urin g app ro x im a te ly 27 m x 46 m x 46 m (90 ft x 15 0 ft x 150 ft), co nstructe d
roof an d stee l s id ing pane ls on the exte rio r. S o m e of th e soil surroun d ing th e fa c ility is a lso contam in ated .
in 195 0 to co nv e rt uran iu m h e xafluo ride (U F 6 ) to u ranium te trafluorid e (U F 4 ). P ro duction w a s in itia te d in 1953 and continue d until 1 957 . T h is fa c ility conta ins a s besto s, ra d io logical co ntam ination, lead paint a nd flash ing, and health risk d ue to b io lo g ic a l deb ris . T h e fa c ility consis ts of s te e l fram e w ith ste e l
Number of Alternatives: 1
List of Alternatives:
Short Name Description
Alternative A Decontamination
Project Definition
Exhibit 1: Project Definition
Guide to Computing and Reporting the LCC of EM Projects 7

3. Setting the LCC Parameters
Several parameters must be defined before computing the LCC of an EM project.9 The first is
the base date, which is the date to which all expenditures are discounted. The second parameter
is the length of the study period (also referred to as the time horizon), which establishes the start
and end date of the project. The length of the study period thus determines the number of years
and months over which project expenditures are included in the analysis. The third parameter is
the discount rate used to account for the time value of money. Use the same values for these
three LCC parameters across all alternatives within a project.
3.1 Base Date
The base date of a project is the date to which all future (and past) costs are discounted.
Theoretically, the base date could be any point in time within or even outside the study period,
but it usually coincides with the beginning of the study period. The date on which the LCC
analysis is conducted (the Analysis Date) is also sometimes used as the base date. The base date
may fall on any date, although the beginning of either a particular month or a particular year is
recommended.
When performing a prospective analysis, define the timing of all costs included in the project
relative to the base date. All cost elements should be denominated in terms of base-date dollars.
If an analysis is performed in January 2004, all costs should be denominated in January 2004
dollars, regardless of the expected date of expenditure. Information on adjusting costs for
changes in the price level can be found in Section 4.
3.2 Study Period
The study period of an LCC analysis is the length of the time period covered by the economic
evaluation. With the exception of sunk costs (discussed in the next subsection), the study period
9 Standard definitions for these parameters can be found in: American Society for Testing and Materials. 2003. Standard Terminology of Building Economics. E 833-02a. West Conshohocken, PA: American Society for Testing and Materials.
Guide to Computing and Reporting the LCC of EM Projects 9
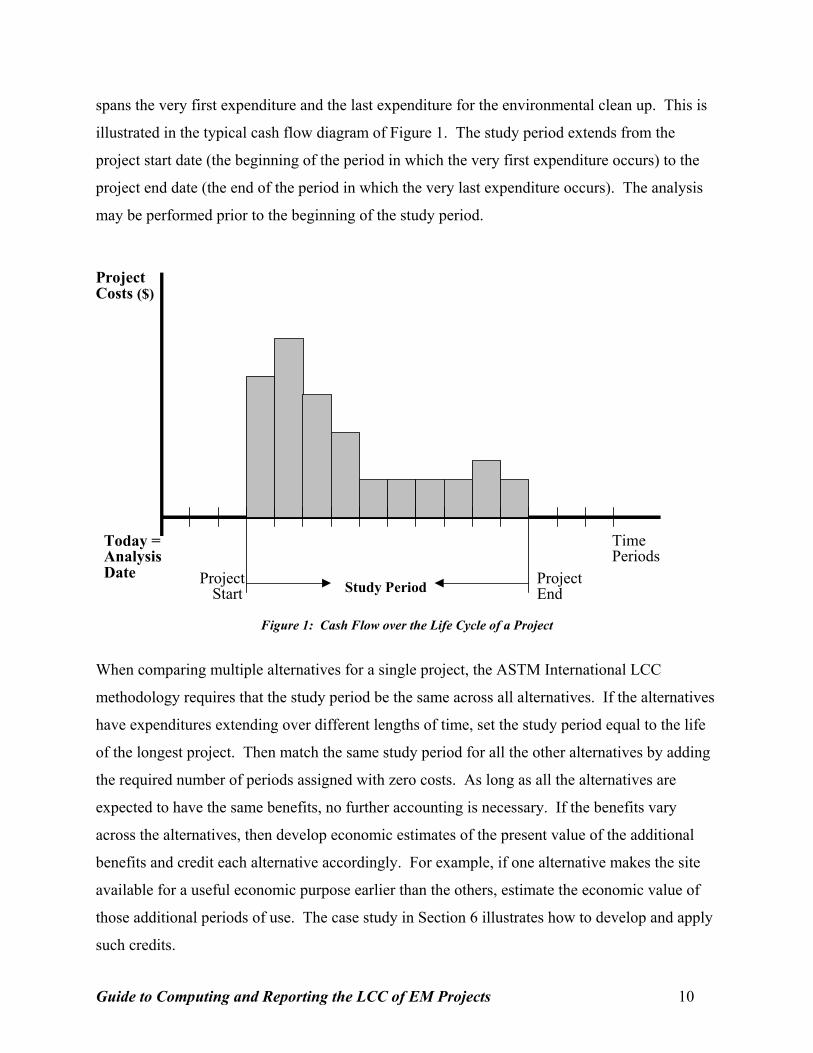
spans the very first expenditure and the last expenditure for the environmental clean up. This is
illustrated in the typical cash flow diagram of Figure 1. The study period extends from the
project start date (the beginning of the period in which the very first expenditure occurs) to the
project end date (the end of the period in which the very last expenditure occurs). The analysis
may be performed prior to the beginning of the study period.
Project Costs ($)
Time Periods
Today =
ProjectEnd
ProjectStart Study Period
AnalysisDate
Figure 1: Cash Flow over the Life Cycle of a Project
When comparing multiple alternatives for a single project, the ASTM International LCC
methodology requires that the study period be the same across all alternatives. If the alternatives
have expenditures extending over different lengths of time, set the study period equal to the life
of the longest project. Then match the same study period for all the other alternatives by adding
the required number of periods assigned with zero costs. As long as all the alternatives are
expected to have the same benefits, no further accounting is necessary. If the benefits vary
across the alternatives, then develop economic estimates of the present value of the additional
benefits and credit each alternative accordingly. For example, if one alternative makes the site
available for a useful economic purpose earlier than the others, estimate the economic value of
those additional periods of use. The case study in Section 6 illustrates how to develop and apply
such credits.
Guide to Computing and Reporting the LCC of EM Projects 10

3.3 Treatment of Sunk Costs
A sunk cost is any cost that has already been incurred prior to the date of the LCC analysis and
that cannot be recovered regardless of present or future decisions.10 Because sunk costs have
already been spent prior to the analysis, they should not influence decisions about which
alternative to select for an EM project. Thus when comparing multiple alternatives for the same
EM site in a prospective analysis, ignore sunk costs. If the purpose of LCC analysis is
retrospective, however, include all sunk costs.
3.4 Discount Rate
In LCC analysis the discount rate is the parameter used to represent the time value of money. It
reflects the opportunity cost of capital to an investor over time. To illustrate the concept,
suppose you must pay a bill of $1,000 one year from now. Consider how much you need now to
be able to pay the bill at the end of the year. Suppose you could put your money in ank account
that pays 5 % interest per year. If you deposit the full $1,000 now,you would have $1,050 in
your account at the end of the year – $50 extra because of the interest you earned. How much
should you deposit to end up with exactly $1,000 to pay the bill? The answer is found by
discounting the $1,000 cost at the end of the year to its equivalent present value using the
discount rate of 5 %. As explained in greater detail in Section 5, the amount you need to deposit
is only $952.38.11 Thus, the $1,000 cost due one year from now is worth $47.62 less than a
$1,000 cost that is due immediately.
Because costs expended at different times have different values, costs of an EM project
occurring at different times cannot be directly compared or summed. Costs must first be
converted into their time-equivalent value at the base date before being combined to compute the
total LCC of a project. This time-equivalent value is referred to as the Present Value (PV) of the
costs. The discount rate is the interest rate used to convert (or “discount”) future expenditures to
10 Standard definitions for the LCC parameters can be found in: American Society for Testing and Materials. 2003. Standard Terminology of Building Economics. E 833-02a. West Conshohocken, PA: American Society for Testing and Materials. This definition of sunk costs draws on this standard as well as OMB Circular A-94 Revised 10/29/92, Definition of Terms. 11 The computation is as follows: 1000/(1+0.05) = 952.38.
Guide to Computing and Reporting the LCC of EM Projects 11

their present value at the base date, taking into account the investor’s time value of money. The
discount rate selected for LCC analysis must make an investor indifferent between a future cash
amount and its present value.
Two types of discount rates are used in computing the present value: a “real” rate or a “nominal”
rate. The real discount rate reflects the time value of money without accounting for the effects of
inflation and deflation. That is, it reflects the real earning power of money over time. Use the
real discount rate (excluding the rate of inflation) when all cost data are denominated in terms of
“constant” dollars, that is, dollars with constant purchasing power. Nominal or market discount
rates take into account general inflation or deflation plus the real earning power of money. Use a
nominal rate when all cost data are denominated in “current” dollars, that is, dollars that change
in value from year to year depending on the general price level. The need for a nominal or
market discount rate often arises when the future cost estimates are based on a maintenance
contract that is typically specified to be paid in current dollars in future time periods. For all
illustrations in the Guide, a real discount rate is used, since all the cost estimate data in the
sample projects are in terms of constant dollars. For more information on how to treat inflation,
consult Section 4.
In the private sector, an individual investor’s discount rate is determined by the investor’s
minimum acceptable rate of return (MARR) for investments, as governed by available
investment opportunities and his or her risk tolerance. Because different investors have different
investment opportunities available to them as well as different levels of acceptable risk, private
discount rates vary greatly.
Most environmental projects using the ECES will be sponsored by government agencies rather
than by private investors. Two government agencies annually publish discount rates to be used
in the economic analysis of government projects.
The Department of Energy (DOE) establishes the specific discount rate to be used for energy and
water conservation and renewable resource projects under the Federal Energy Management
Guide to Computing and Reporting the LCC of EM Projects 12

Program (FEMP). This discount rate applies only to investments devoted to these specific
objectives in federally owned or leased facilities. The rates are published annually on April 1.12
Other Federal projects are required to use the discount rates published in January of each year by
the Office of Management and Budget (OMB). The real and nominal discount rates to be used
for investment analyses of Federal projects are found in Appendix C of OMB Circular A-94.
Appendix C is updated annually at the time of the President’s budget submission to Congress in
January. The rates vary by the length of the project with separate rates for 3-year, 5-year, 7-year,
10-year, and 30-year projects. The Circular requires use of the rate that corresponds to the
length of the study period for the project and indicates that one should interpolate linearly where
necessary. If the study period is longer than 30 years, the Circular says to use the 30-year rate.13
3.5 Illustration: Report Form for LCC Parameters
The sample EM project described below specifies decontamination beginning in January 2004.
Once the facility has been decontaminated, it will be in surveillance and maintenance mode until
2028. The study period will be 24 years and 2 months. Analysis of the EM project will begin in
2003. The date of analysis and the base date are both January 1, 2003. The discount rate will be
taken from the OMB Circular A-94, January 2003. Because the project will extend to 24 years,
the discount rate should be interpolated, as recommended by OMB. The most recently
published14 OMB rates for 10 years and 30 years are 2.5 % and 3.2 %, respectively. Thus the
interpolated rate for a 24-year project is 2.99 %.15 The LCC Parameters should be entered into
the appropriate fields in the Report Form.
12 The most recent edition can be found in: Fuller, Sieglinde K., and Rushing, Amy S. 2002. Energy Price Indices and Discount Factors for Life-Cycle Cost Analysis - April 2002. NISTIR 85-3273-17. Gaithersburg, MD: NationalInstitute of Standards and Technology. Updated annually.13 Office of Management and Budget (OMB). 2003. Guidelines and Discount Rates for Benefit-Cost Analysis ofFederal Programs. Circular A-94. Washington, DC: Office of Management and Budget. The OMB tables of rates are available online at http://www.whitehouse.gov/omb/circulars/a094/a94_appx-c.html. The complete Circular can be found at http://www.whitehouse.gov/omb/circulars/a094/a094.html, and a table of past years’ rates is located at http://www.whitehouse.gov/omb/circulars/a094/DISCHIST-2003.pdf. Updates of the appendix are also available upon request from the OMB Office of Economic Policy (202-395-3381). 14 January 31, 200315 The 24 year rate is interpolated as follows:
ilow + [(study period - yearlow) /(yearhigh – yearlow)]*(ihigh – ilow) = i. 2.5 + (24-10)/(30-10) * (3.2-2.5) = 2.99.
Guide to Computing and Reporting the LCC of EM Projects 13

2.
Study Period (Years):_24 Years, 2 Months Discount Rate: 2.99 %
Analysis Date: 01 / 01 / 2003 Base Date: 01 / 01 /
LCC Parameters
2003
Exhibit 2: LCC Parameters
Guide to Computing and Reporting the LCC of EM Projects 14

4. Organizing ECES Cost Data
Before performing the LCC analysis, all relevant costs associated with a project must be
compiled. The ECES provides a hierarchical list of elements representing all cost components
that are expected to occur over the life-cycle of an EM project. Each cost element represents a
task or activity performed during environmental projects. For easy reporting and analysis,
compile cost data into the work breakdown structure defined by the ECES classification. For
more information on designing and documenting the cost estimates for an EM project, consult
the Environmental Protection Agency’s Guide to Developing and Documenting Cost Estimates
During the Feasibility Study.16
4.1 Timing of Costs
In addition to compiling all costs, include the timing of each cost. The timing is needed to
correctly discount each cost to its equivalent present value. Discounting is keyed to a single
point in time (that is, the distance in time from the base date). The most appropriate approach
would be to discount from the exact date at which the expenditure takes place. However, it is
common practice to model expenditures that are incurred at varying times within a period as if
they were all incurred either at the beginning of the period, middle of the period, or the end of
the period. For example, ASTM International uses the end-of-year convention in its pre-
calculated discount factor tables.17
4.2 Treatment of Inflation or Deflation in Cost Estimates
General price inflation/deflation causes a reduction/increase in the purchasing power of the
dollar over time. The analysis can be calculated in constant-dollar terms (explicitly excluding
changes in the general price level) or in current-dollar terms (including changes in the general
price level). When excluding inflation, express all costs in terms of base date dollars and use
16 U.S. Environmental Protection Agency. 2000. A Guide to Developing and Documenting Cost Estimates During the Feasibility Study. Washington, DC.
17 ASTM International. 2003. Discount Factor Tables: Adjunct to ASTM Practice E 917, for Measuring Life-Cycle Costs of Buildings and Building Systems. West Conshohocken, PA: ASTM International.
Guide to Computing and Reporting the LCC of EM Projects 15

the real discount rate. On the other hand, if costs are expressed in current dollars (i.e., if they
include changes in prices), then a consistent projection of general price inflation must be used
throughout the cost estimates. In this case, the LCC analysis must take account of this price
inflation by using the nominal discount rate as discussed in Section 3 and published by the OMB.
It is preferable to use constant-dollar analysis since it eliminates the need to estimate the rate of
inflation over the duration of the study period. Current-dollar analysis may be used if there are
budgeting considerations based on current dollars included in the analysis. For example, if cost
data are based on a multiyear contract with fixed current dollar amounts, adjust future
expenditures for inflation.
4.3 Area Cost Factors
Projects may have different construction costs based on the geographic location of the site.
When comparing alternatives for the same site, use the area cost factors appropriate for that site
for all cost estimates. However, when comparing the LCCs of two projects at different sites, the
costs have to be adjusted by their area cost factors to put them on a common locality basis.
4.4 Illustration: Sample Cost Database
The costs may be arranged in any way convenient for the analysis. List each cost element by
Phase and Level and include the description, the cost, and the time period during which the task
will be performed. Exhibit 3 is an excerpt from a sample database showing costs for the case
study.
Guide to Computing and Reporting the LCC of EM Projects 16
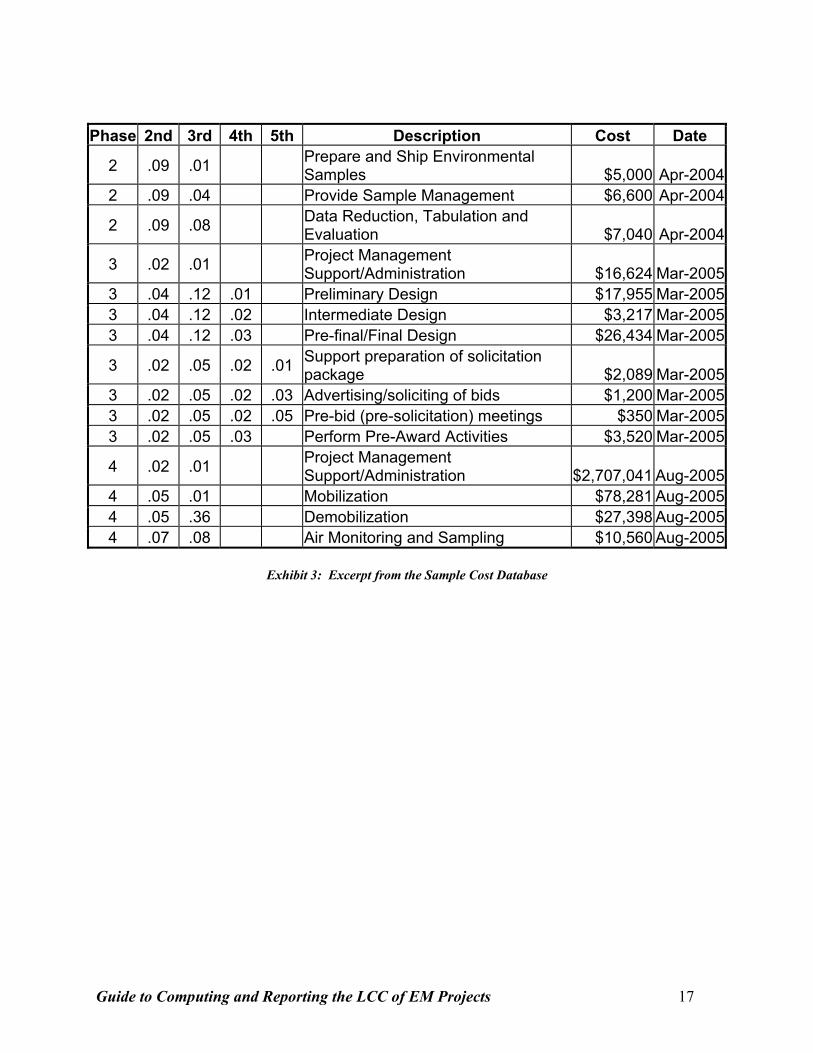
Phase 2nd 3rd 4th 5th Description Cost Date
2 .09 .01 Prepare and Ship Environmental Samples $5,000 Apr-2004
2 .09 .04 Provide Sample Management $6,600 Apr-2004
2 .09 .08 Data Reduction, Tabulation and Evaluation $7,040 Apr-2004
3 .02 .01 Project Management Support/Administration $16,624 Mar-2005
3 .04 .12 .01 Preliminary Design $17,955 Mar-2005 3 .04 .12 .02 Intermediate Design $3,217 Mar-2005 3 .04 .12 .03 Pre-final/Final Design $26,434 Mar-2005
3 .02 .05 .02 .01 Support preparation of solicitation package $2,089 Mar-2005
3 .02 .05 .02 .03 Advertising/soliciting of bids $1,200 Mar-2005 3 .02 .05 .02 .05 Pre-bid (pre-solicitation) meetings $350 Mar-2005 3 .02 .05 .03 Perform Pre-Award Activities $3,520 Mar-2005
4 .02 .01 Project Management Support/Administration $2,707,041 Aug-2005
4 .05 .01 Mobilization $78,281 Aug-2005 4 .05 .36 Demobilization $27,398 Aug-2005 4 .07 .08 Air Monitoring and Sampling $10,560 Aug-2005
Exhibit 3: Excerpt from the Sample Cost Database
Guide to Computing and Reporting the LCC of EM Projects 17

5. Computing the LCC of the EM Project
The total LCC of an EM project is the sum of all project-related expenditures. Before being
totaled all costs must be discounted to their present value. The primary formula for computing
the present-value LCC of a project is:18
N
PVLCC =∑ Ct
t=0 (1 + i)t (1)
where:
PVLCC = total Life-Cycle Cost in present value dollars at the base date;
Ct = costs occurring in period t, where t=1…N discounting periods;
N = the number of time periods in the study period; and
i = the discount rate in decimal form (e.g., 5 % is entered as 0.05).
This general formula discounts an individual cost, Ct, to the base date. Then all costs are
summed to calculate the PVLCC. The first step in calculating the PVLCC for an EM is to
compute the present value of a single expenditure.
5.1 Computing the Present Value of a Single Amount
The LCC calculated in Equation (1) is the sum of all costs associated with a project. Before the
costs are summed, they must be converted to their present value. The formula used to convert a
single future cost to present value is:
1P F *= (1 + i)t (2)
where:
F = the future cost;
P = discounted present value of the expenditure.
Guide to Computing and Reporting the LCC of EM Projects 19
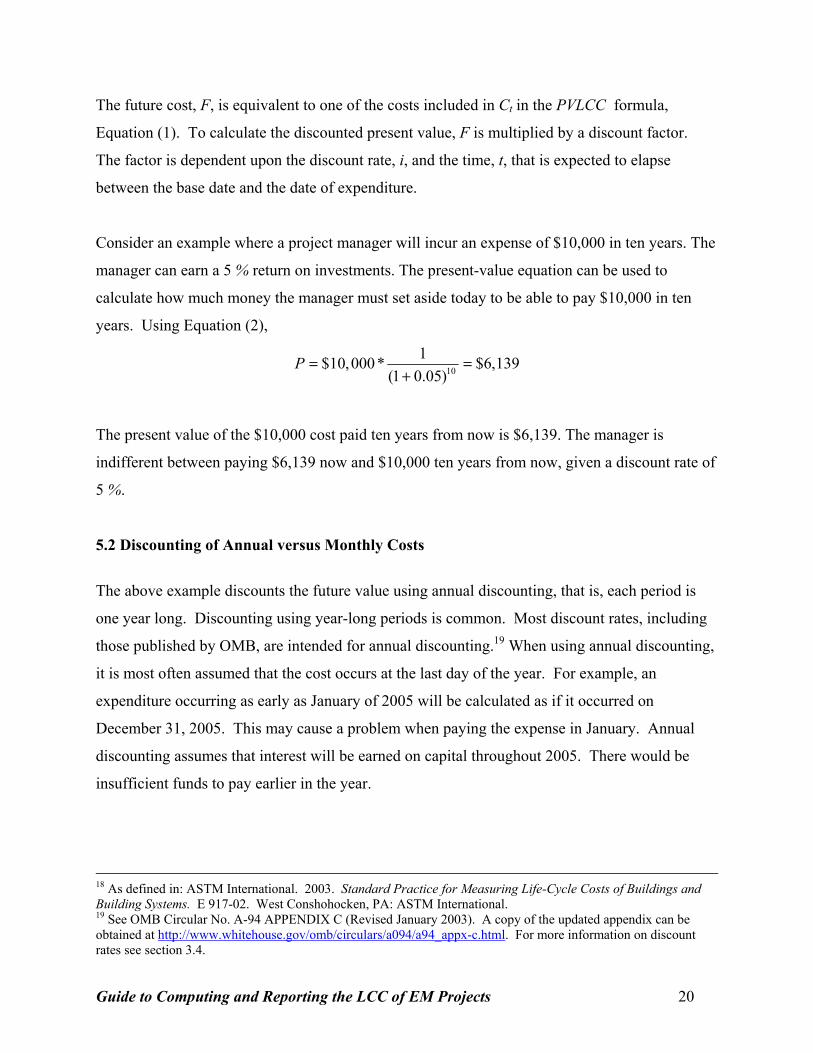
The future cost, F, is equivalent to one of the costs included in Ct in the PVLCC formula,
Equation (1). To calculate the discounted present value, F is multiplied by a discount factor.
The factor is dependent upon the discount rate, i, and the time, t, that is expected to elapse
between the base date and the date of expenditure.
Consider an example where a project manager will incur an expense of $10,000 in ten years. The
manager can earn a 5 % return on investments. The present-value equation can be used to
calculate how much money the manager must set aside today to be able to pay $10,000 in ten
years. Using Equation (2),
1P = $10,000* (1 + 0.05)10 = $6,139
The present value of the $10,000 cost paid ten years from now is $6,139. The manager is
indifferent between paying $6,139 now and $10,000 ten years from now, given a discount rate of
5 %.
5.2 Discounting of Annual versus Monthly Costs
The above example discounts the future value using annual discounting, that is, each period is
one year long. Discounting using year-long periods is common. Most discount rates, including
those published by OMB, are intended for annual discounting.19 When using annual discounting,
it is most often assumed that the cost occurs at the last day of the year. For example, an
expenditure occurring as early as January of 2005 will be calculated as if it occurred on
December 31, 2005. This may cause a problem when paying the expense in January. Annual
discounting assumes that interest will be earned on capital throughout 2005. There would be
insufficient funds to pay earlier in the year.
18 As defined in: ASTM International. 2003. Standard Practice for Measuring Life-Cycle Costs of Buildings andBuilding Systems. E 917-02. West Conshohocken, PA: ASTM International. 19 See OMB Circular No. A-94 APPENDIX C (Revised January 2003). A copy of the updated appendix can beobtained at http://www.whitehouse.gov/omb/circulars/a094/a94_appx-c.html. For more information on discount rates see section 3.4.
Guide to Computing and Reporting the LCC of EM Projects 20

Using shorter periods will reduce the magnitude of this problem. Shorter discounting periods
allow for more precise timing of expenditures. The period used for discounting can be of any
length and is determined by the timing of the project’s expenditures. The costs of EM projects
are usually defined by month, so discounting of monthly costs will be used to calculate the LCC.
The equation used for the discounting of monthly costs is:
1P F *= (1 + i 12 )
mon (3)
where:
mon = the number of months elapsed since the base date.
Equation (3) calculates the present value where i is the annual discount rate and mon is the
number of months between the base date and the date of expenditure. Appendix D discusses the
derivation of Equation (3) and its relationship to the standard annual discounting formula,
Equation (2).
To illustrate the difference in the two present-value calculation methods, consider the example
used above. With a discount rate of 5 % and the time elapsed equal to ten years, the present
value was $6,139. Suppose the cost was incurred in the first month of the 9th year instead of the
last. The time elapsed would be 109 months instead of 120. The annually discounted present
value can be compounded into the future using the following equation:
F P *(1+ i 12 )mon
(4)=
The compounding of the annually discounted present value of $6,139, occurring 109 months in
the future, yields:
F = $6,139* (1 + 0.05)109
12 = $9,562
The annual discounting approach will fall $438 short at the date of expenditure. The more
accurate approach of discounting monthly costs finds the present value:
Guide to Computing and Reporting the LCC of EM Projects 21
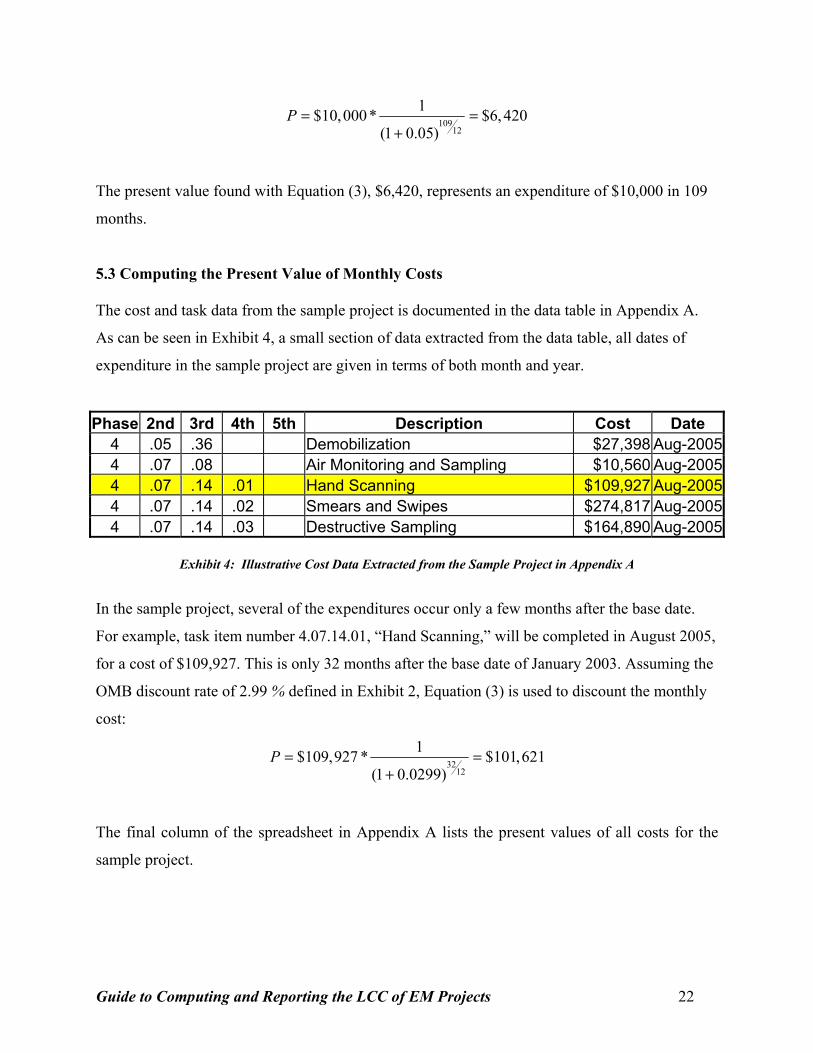
1P = $10,000* = $6,420 (1 + 0.05)
10912
The present value found with Equation (3), $6,420, represents an expenditure of $10,000 in 109
months.
5.3 Computing the Present Value of Monthly Costs
The cost and task data from the sample project is documented in the data table in Appendix A.
As can be seen in Exhibit 4, a small section of data extracted from the data table, all dates of
expenditure in the sample project are given in terms of both month and year.
Phase 2nd 3rd 4th 5th Description Cost Date 4 .05 .36 Demobilization $27,398 Aug-2005 4 .07 .08 Air Monitoring and Sampling $10,560 Aug-2005 4 .07 .14 .01 Hand Scanning $109,927 Aug-2005 4 .07 .14 .02 Smears and Swipes $274,817 Aug-2005 4 .07 .14 .03 Destructive Sampling $164,890 Aug-2005
Exhibit 4: Illustrative Cost Data Extracted from the Sample Project in Appendix A
In the sample project, several of the expenditures occur only a few months after the base date.
For example, task item number 4.07.14.01, “Hand Scanning,” will be completed in August 2005,
for a cost of $109,927. This is only 32 months after the base date of January 2003. Assuming the
OMB discount rate of 2.99 % defined in Exhibit 2, Equation (3) is used to discount the monthly
cost:
1P = $109,927 * = $101,621 (1 + 0.0299)
3212
The final column of the spreadsheet in Appendix A lists the present values of all costs for the
sample project.
Guide to Computing and Reporting the LCC of EM Projects 22

5.4 Computing the Present Value of a Uniform Series
Often an expense will be repeated over several consecutive time periods. This is not uncommon
in EM projects where some testing or maintenance tasks must be repeated annually. Figure 2
below, illustrates the timing of a six-period uniform series of expenditures. Starting in period 5,
there will be an annual cost that is repeated for 6 years. The final expenditure of the series is
scheduled for the end of period 11.
Project Costs ($)
TimeUniform Series Length=6
t=0 Base Periods(t)Date
t=5 t=11
Figure 2: Uniform Series of Expenditures
When calculating the present value of a series of annually repeated expenses, each occurrence
could be calculated individually. It is more efficient, however, to use an equation to calculate the
discounted value of the entire series of expenditures. The following equation calculates the
discounted future value of a uniform series:
FVS = A* (1 + i)t − 1 i(1 + i)t−1 (5)
where
FVS = Future value of the uniform series;
t = the number of years the cost is incurred;
A = the annual cost of the series.
Guide to Computing and Reporting the LCC of EM Projects 23

Equation (5) discounts the entire value of the series back to the date of the first expenditure.
Using the example in Figure 2, the series would be discounted to the last day in period 5. This is
the date that the first expenditure of the series is incurred. The FVS is the total of all the
expenditures in the series discounted to the time of the first occurrence of the uniform series. To
calculate the present value of the series, the FVS must be further discounted back to the base
date. To calculate the present value, use Equation (3):
1P = FVS * (1 + i)
mon 12
In the sample project, there are maintenance tasks that must be repeated in Phase 6, Surveillance.
Exhibit 5 shows an expense that must be repeated for five years starting in 2010.
Phase 2nd 3rd 4th 5th Description Cost Date 6 .07 .08 .04 Air Monitoring and Sampling $6,336 Feb-2010 6 .07 .08 .04 Air Monitoring and Sampling $6,336 Feb-2011 6 .07 .08 .04 Air Monitoring and Sampling $6,336 Feb-2012 6 .07 .08 .04 Air Monitoring and Sampling $6,336 Feb-2013 6 .07 .08 .04 Air Monitoring and Sampling $6,336 Feb-2014
Exhibit 5: Illustrative Cost Data for a Uniform Series of Expenditures Extracted from the Sample Project in Appendix A
The future value of the series is calculated using Equation (5):
FVS = $6,336* (1 + 0.0299)5 − 1 .1587 (0.0299)(1 + 0.0299)4 = $6,336*
(0.0299)(1.1251) = $29,890
The total cost of the series has been discounted to February 2010, the beginning of the series. To
calculate the value in terms of base date dollars, the $29,890 must be discounted back 86 months
to the base date in January 2003. Using Equation (3) the calculation would be:
1P = $29,890* (1 + 0.0299)86 /12 = $24,201
Guide to Computing and Reporting the LCC of EM Projects 24

Phase 2nd 3rd 4th 5th Description Cost Date PVC
4 .02 .01 Project Management/Support/Administration $2,707,041 Aug-2005 $2,502,503
4 .05 .01 Mobilization $78,281 Aug-2005 $72,366 4 .05 .36 Demobilization Aug-2005 $25,328 4 .07 .08 Air Monitoring and Sampling $10,560 Aug-2005 $9,762 4 .07 .14 .01 Hand Scanning $109,927 Aug-2005 $101,621 4 .07 .14 .02 Smears and Swipes Aug-2005 $254,052
4 .14 .03 Destructive Sampling (Including Removal of Paints, Drilling, Cutting of Structures/Equipment, etc) $164,890 Aug-2005 $152,431
4 .15 .04 Asbestos Abatement Aug-2005 $1,436,180 4 .15 .05 Piping & Pipeline Removal $288,428 Aug-2005 $266,635
4 .19 .01 Contaminated Soil Collection (Excavation) Aug-2005 $576,212
4 .31 .08 .06 Surface Decontamination of Floors $1,181,105 Aug-2005 $1,091,864 4 .31 .08 .07 Surface Decontamination of Walls $966,359 Aug-2005 $893,343
4 .08 .19 Decontamination Area/Facility for Equipment and Vehicles $62,625 Aug-2005 $57,893
4 .08 .20 Decontamination Area/Facility for Personnel (i.e., Showers, Changing Rooms, Monitors, Waste Handling) $15,656 Aug-2005 $14,473
4 .32 .01 Waste Stream Handling/Packaging Aug-2005 $1,149,747 4 .32 .11 Transportation by truck $1,854,400 Aug-2005 $1,714,286
4 .33 .08 Off-Site Commercial Disposal Costs, Fees, and Taxes $3,231,217 Aug-2005 $2,987,074
Phase 4 Total LCC: $13,305,773
$27,398
$274,817
.07
$1,553,564
$623,308
.31
.31
$1,243,720
Exhibit 6: Present Value Costs for Phase 4 of Sample Project in Appendix A
5.5 Illustration: Computing the LCC of the Sample Project
The present value of each cost element of the sample project is included in the far right column
of the worksheet in Appendix A. Exhibit 6 is an excerpt of the cost worksheet consisting of all
costs incurred during Phase 4, which covers construction activities.
The final step in computing the LCC of an entire project is to sum all present value costs
associated with the project. Exhibit 7 lists the LCC of each Phase of the sample project as well as
the total LCC of the project.
Guide to Computing and Reporting the LCC of EM Projects 25

1 2 3 4 5 6
Phase Present Value $147,494
$6,229,478 $66,809
$13,305,773 Operations and Maintenance $383,778
e $1,624,700 Total LCC: $21,758,032
Description Assessment Studies Design Construction
Surveillanc
Exhibit 7: Present Value Costs by Phase for Sample Project in Appendix A
5.6 Interpreting the Total LCC
The total LCC may be used for budgetary purposes or for comparison across multiple EM
projects. Note that when using the LCC for budget planning, the total LCC is an estimate. It is
only as accurate as estimations of the cost elements.
The total LCC can be helpful in comparing EM projects addressing similar environmental
conditions. When comparing across projects, use the same discount rate to calculate the
individual LCCs for all projects. There are other factors that can contribute to differences in cost
estimates. To make projects comparable be sure to account for differences in location with area
cost factors. The scale of the project will also impact the estimate and should be considered
when making comparisons.
Guide to Computing and Reporting the LCC of EM Projects 26

6. Comparing EM Alternatives Using LCC Analysis
When determining the best treatment for an EM project that addresses a single site, it is common
to examine multiple alternatives. In this section a detailed case study is used to illustrate the
application of LCC analysis to find the most cost-effective solution for an EM site. The proper
method for analyzing these multiple alternative projects is to compute the LCC for each
alternative and then select the one with the least cost, as indicated in ASTM E 1185-02, the
standard guide for selecting economic analysis methods.20 This ASTM International guide
identifies types of design and system decisions that require economic analysis and recommends
the appropriate economic methods for each decision type. It cautions that alternatives being
compared must all offer the same benefits over the same study period. This issue of equal
benefits and study period is treated in Subsection 6.5.
6.1 Environmental Management Project Specification
This illustrative case study is an EM project that includes the costs of program and project
management, characterization, feasibility study, design, remediation, monitoring, and long-term
stewardship activities associated with clean-up of a gasoline spill site located in north central
California, near Sacramento. The site was used as a refueling station from 1975 to 1992. The soil
and the surrounding groundwater were contaminated as a result of leaking gasoline tanks. The
contaminants of concern include lead and volatile organic compounds. The contaminated area is
approximately 3,720 m2 (40,000 ft2) and about 4.5 m to 15.2 m (15 ft to 50 ft) deep.
6.2 Project Alternatives
Two alternatives have been identified as options for remediation. Alternative A, In Situ Soil
Vapor Extraction, would begin in January 2004 and continue until August 2007. It would then
be monitored until September 2016. Alternative B is Natural Attenuation. Natural Attenuation
consists of initial model development and continued operation of the model and the sampling and
analysis conducted at the site. This alternative would also start in January 2004. The Natural
Attenuation alternative would continue until December 2034. After this period, air monitoring,
20ASTM International. 2003. E 1185-02 Standard Guide for Selecting Economic Methods for Evaluating Investments in Buildings and Building Systems. West Conshohocken, PA: ASTM International.
Guide to Computing and Reporting the LCC of EM Projects 27

records management, and other activities would be performed at the site until August 2043.
Note that the Vapor Extraction alternative would make the site available for other uses much
earlier than the Natural Attenuation alternative. To make the economic comparison valid, a
credit must be assigned to the Vapor Extraction alternative to account for the benefit of these
additional years of use of the site.
6.3 Setting Analysis Parameters
Before computing the LCC of multiple alternatives, a base date, study period, and discount rate
must be selected. The base date will be the date of analysis. The study period must be the same
across all alternatives. Most alternatives will have different life-cycle lengths. In this case,
Natural Attenuation will take longer than In Situ Vapor Extraction. When alternatives have
different lengths, the study period is defined using the completion date of the longest project.
This assumes all remediation for the shorter project has been completed. The shorter projects
will assume zero costs for any year after their completion, and benefits of earlier use should be
included, if applicable. Annual benefits for the remainder of the study period will be treated
separately below. In this example the study period will end in August 2043, a total of 40 years
and 8 months from the base date of January 1, 2003. The In Situ Vapor Extraction alternative,
which will be completed in September 2016, will record an annual cost of $0 from 2017 to 2043.
In addition to the zero costs, the shorter project will be credited with benefits received from
earlier use of the land.
Finally, the discount rate used in the analysis must be the same for all cash flows. For more
information on selecting the appropriate discount rate, consult Section 3. In this example we use
the discount rate of 3.2 %, as currently prescribed by OMB for projects lasting 30 years or
longer.
6.4 Calculations of LCC for Both Alternatives
The cost data and LCC calculations for the two alternatives are included in Appendices B and C.
Exhibits 8 and 9 give summaries of the LCC results by Phase for each alternative.
Guide to Computing and Reporting the LCC of EM Projects 28

1 2 3 4 5 6
1 2 3 4 5 6
Phase Present Value $80,989
$3,507,900 $89,438
$8,929,017 Operations and Maintenance
e $78,985 Total LCC: $15,188,091
Description Assessment Studies Design Construction
$2,501,762 Surveillanc
Exhibit 8: Present Value Costs by Phase for In Situ Vapor Extraction (Alternative A)
Phase Present Value $80,989
$3,507,913 $8,499
$4,670,585 Operations and Maintenance $0
e $50,355 Total LCC: $8,318,341
Description Assessment Studies Design Construction
Surveillanc
Exhibit 9: Present Value Costs by Phase for Natural Attenuation (Alternative B)
6.5 Calculation of the Adjusted LCC
When comparing the LCC of these two alternatives, any differences in the length of the clean-up
process must be analyzed further. Using Vapor Extraction will make the site available much
earlier than Natural Attenuation. The additional years of usage is a benefit of the alternative and
must be quantified and subtracted from the LCC of the alternative that makes it available (Vapor
Extraction).
An appropriate credit could be established by examining the real estate values in the area. One
method requires finding comparable land in the area that is leased and assigning an estimated
lease value for the intervening period. Comparable sale prices for similar land in the area could
also be used to establish a value. In this case, the credit is calculated by comparing the present
values of the proceeds of a sale of the land when available under each of the two alternatives.
Guide to Computing and Reporting the LCC of EM Projects 29

Alternative A (Vapor Extraction) makes the land available for sale October 1, 2016 (165 months
from the base date), while Alternative B (Natural Attenuation) makes it available September 1,
2043 (488 months from the base date). Thus, if the value of the uncontaminated commercial
land is $600,000 in today’s prices, then compute the present values of the amount for the two
dates using Equation (3) for each computation. The difference is the credit earned by the Vapor
Extraction alternative.
1 1Credit = $600,000* (1 + 0.032)165 /12 − $600,000*
(1 + 0.032)488 /12
Credit = $389,095 − $166,665 = $222,430
Subtract the credit calculated from the LCC of the Vapor Extraction alternative.
Adjusted LCC = LCC − Credit = $15,188,091 − $222,430 Adjusted LCC = $14,965,661
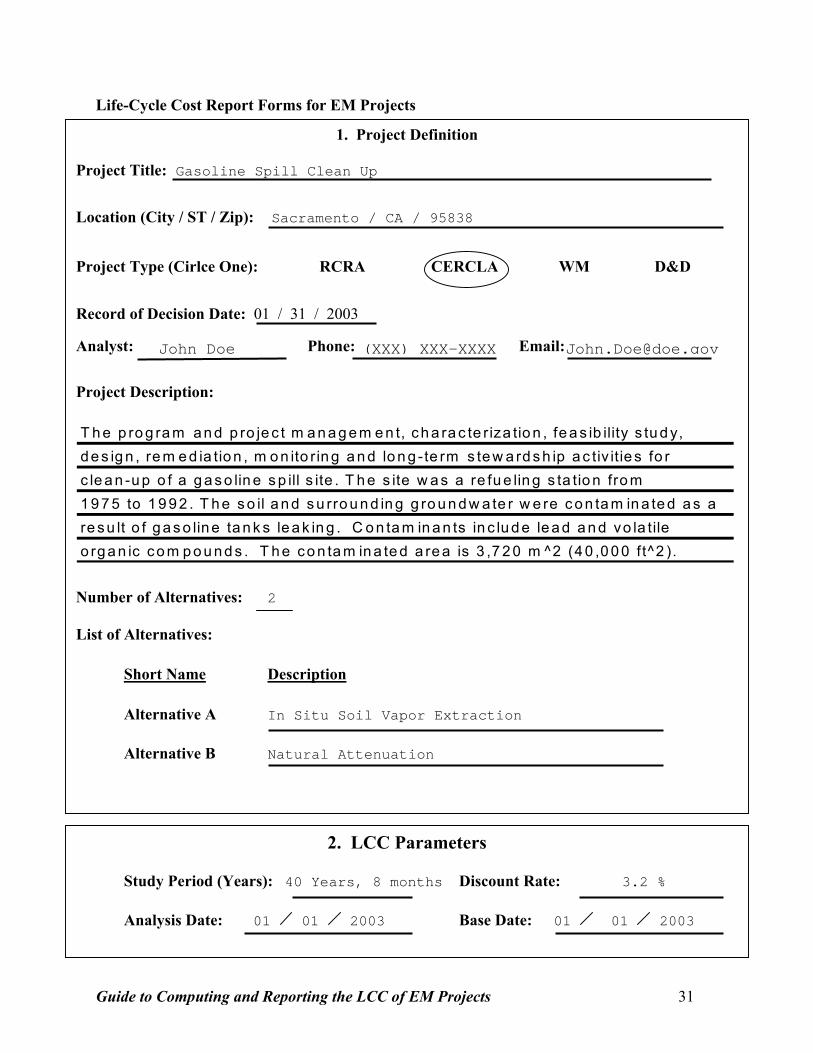
6.6 Life-Cycle Cost Report
The following is the Life-Cycle Cost Report form completed for this case study. Section 1,
Project Definition, provides information about the project, its location, and the alternatives being
examined with LCC analysis. Section 2 of the report defines the LCC parameters used for
analysis. Section 3, Life-Cycle Costs by Phase and Alternative, provides a cost breakdown by
ECES phase and alternative. The final section, Section 4, lists the total LCCs for each
alternative. It also lists the credit to be granted to the alternative where applicable, and the
Adjusted LCC.
Guide to Computing and Reporting the LCC of EM Projects 30
Life-Cycle Cost Report Forms for EM Projects
2.
Study Period (Years): 40 Years, 8 months Discount Rate: 3.2 %
Analysis Date: 01 01 2003 Base Date: 01 01 2003
1.
Project Title: Gasoline Spill Clean Up
Location (City / ST / Zip): Sacramento / CA / 95838
Project Type (Cirlce One): RCRA CERCLA X WM D&D
Record of Decision Date: 01
Analyst: Phone: Email:
Project Description:
re s u lt o f g a s o lin e ta n k s le a k in g . C o n ta m in a n ts in c lu d e le a d a n d v o la tile o r g a n ic c o m p o u n d s . T h e c o n ta m in a te d a r e a is 3 ,7 2 0 m ̂ 2 ( 4 0 ,0 0 0 ft^ 2 ).
T h e p ro g ra m a n d p ro je c t m a n a g e m e n t, c h a r a c te r iz a tio n , fe a s ib ility s tu d y, d e s ig n , r e m e d ia tio n , m o n ito r in g a n d lo n g - te rm s te w a rd s h ip a c tiv itie s fo r c le a n -u p o f a g a s o lin e s p ill s ite . T h e s ite w a s a re fu e lin g s ta tio n fr o m 1 9 7 5 to 1 9 9 2 . T h e s o il a n d s u rr o u n d in g g ro u n d w a te r w e re c o n ta m in a te d a s a
Number of Alternatives: 2
List of Alternatives:
Short Name Description
Alternative A In Situ Soil Vapor Extraction
Alternative B Natural Attenuation
John Doe (XXX) XXX-XXXX [email protected]
LCC Parameters
Project Definition
2003 / 31 /
Guide to Computing and Reporting the LCC of EM Projects 31

3.
Phase Alternative A Alternative B Assessment $80,989 $80,989 Studies $3,507,900 $3,507,913 Design $89,438 $8,499 Construction $8,929,017 $4,670,585 O&M $2,501,762 $0 SLTM $78,985 $50,355 Total LCC $15,188,091 $8,318,341
4. ycle Costs by Alternative
Alternative Total LCC Credit Adjusted Total LCC
Alternative A $15,188,091 $222,430 $14,965,661
Alternative B $8,318,341 $0 $8,318,341
Life-Cycle Costs by Phase and Alternative
Summary Table of Life-C
6.7 Conclusion
In this prospective LCC analysis two alternatives for a EM project addressing a single site were
compared. Each alternative would achieve the objective of cleaning gasoline spills to the same
level. The total cost for each alternative was calculated using LCC. Alternative A, the Vapor
Extraction approach, has a significantly higher LCC than Alternative B, Natural Attenuation.
However, the more aggressive extraction approach used in Alternative A allows for earlier
economic use of the land for other purposes. To account for the benefits expected from the
earlier availability, a value was estimated to account for the extra years of use and credited to
that alternative. Even after the value of the land is taken into account, the natural attenuation
method is economically preferred. The savings achieved from selecting Alternative B over A are
$6,647,320.
Guide to Computing and Reporting the LCC of EM Projects 32

References
ASTM International. 2002. Environmental Cost Element Structure at Levels 3, 4 and 5 and Definitions. Adjunct to ASTM Classification Standard E 2150-02. West Conshohocken, PA: ASTM International.
ASTM International. 2003. Discount Factor Tables: Adjunct to ASTM Practice E 91-027, for Measuring Life-Cycle Costs of Buildings and Building Systems. West Conshohocken, PA: ASTM International.
ASTM International. 2003. Standard Classification for Life-Cycle Environmental Work Elements—Environmental Cost Element Structure. E 2150-02. West Conshohocken, PA: ASTM International.
ASTM International. 2003. E 1185-02 Standard Guide for Selecting Economic Methods for Evaluating Investments in Buildings and Building Systems. West Conshohocken, PA: ASTM International.
ASTM International. 2003. Standard Practice for Measuring Life-Cycle Costs of Buildings and Building Systems. E 917-02. West Conshohocken, PA: ASTM International.
ASTM International. 2003. Standard Terminology of Building Economics. E 833-02a. West Conshohocken, PA: ASTM International.
ASTM International. 2003. Standard Classification for Building Elements and Related Sitework-UNIFORMAT II. E 1557-02. West Conshohocken, PA: ASTM International.
Au, Tung and Au, Thomas P. 1992. Engineering Economics for Capital Investment Analysis. 2nd Edition. Englewood Cliffs, NJ: Prentice Hall.
Construction Specifications Institute. 1995. MasterFormat 1995, Alexandria, VA: Construction Specifications Institute.
Fuller, Sieglinde K., and Rushing, Amy S. 2002. Energy Price Indices and Discount Factors for Life-Cycle Cost Analysis - April 2002. NISTIR 85-3273-17. Gaithersburg, MD: National Institute of Standards and Technology. *updated annually.
Fuller, Sieglinde K., and Petersen, Stephen R. 1996. Life-Cycle Costing Manual for the Federal Energy Management Program. NIST Handbook 135. 1995 Edition. Gaithersburg, MD: National Institute of Standards and Technology.
Office of Management and Budget (OMB). 2003. Guidelines and Discount Rates for Benefit-Cost Analysis of Federal Programs. Circular A-94 revised 10/29/92. Washington, DC: Office of Management and Budget.
Guide to Computing and Reporting the LCC of EM Projects 33

Park, Chan S. 2001. Contemporary Engineering Economics. 3rd Edition. Englewood Cliffs, NJ: Prentice Hall College Division.
U.S. Department of Energy. 2002. Environmental Cost Element Structure. Washington, DC: Interagency Environmental Cost Engineering Committee.
U.S. Environmental Protection Agency. 2000. A Guide to Developing and Documenting Cost Estimates During the Feasibility Study. Washington, DC.
.
Guide to Computing and Reporting the LCC of EM Projects 34

Appendix A: Data for Sample Project without Alternatives
Sample Project: Nuclear Production Facility Decontamination
Location: Lockport, NY Base Date: January 2003 Study Period: 24 Years, 2 Months Discount Rate: 2.99%
Phase 2nd 3rd 4th 5th Description Cost Date Months PVC 1 .02 .01 .01 Project Management $28,445 Jan-2004 13 $27,551 1 .02 .01 .02 Support Subcontracting Activities $3,346 Jan-2004 13 $3,241 1 .07 .01 .07 .01 Collection and review of existing documents $109,927 Jan-2004 13 $106,474 1 .07 .08 Air Monitoring and Sampling $10,560 Jan-2004 13 $10,228 2 .02 .01 Project Management/Support/Administration $479,930 Apr-2004 16 $461,443 2 .02 .03 .05 Regulatory Permitting (e.g., RCRA Part B Permit) $639,377 Apr-2004 16 $614,748 2 .03 .02 Chemical Data Acquisition Plan $2,816 Apr-2004 16 $2,708 2 .03 .03 Sampling and Analysis Plan $3,520 Apr-2004 16 $3,384 2 .03 .10 Risk Assessment Plan $1,760 Apr-2004 16 $1,692 2 .03 .11 Technical Project Goals and Objectives $1,584 Apr-2004 16 $1,523 2 .04 .02 Human Health Risk Assessment $18,000 Apr-2004 16 $17,307 2 .04 .03 Ecological Risk Assessment $18,000 Apr-2004 16 $17,307 2 .04 .04 Risk Assessment Documentation $16,800 Apr-2004 16 $16,153 2 .04 .05 Environmental Investigation Report $11,000 Apr-2004 16 $10,576 2 .04 .06 Develop Environmental Alternatives $7,200 Apr-2004 16 $6,923 2 .04 .07 Screen Environmental Alternatives $4,224 Apr-2004 16 $4,061 2 .04 .08 Evaluate Alternatives $4,200 Apr-2004 16 $4,038 2 .04 .09 Refinement of Alternatives $3,520 Apr-2004 16 $3,384 2 .04 .10 Document FS (CMS) $10,560 Apr-2004 16 $10,153 2 .04 .16 Engineering Evaluation/Cost Analysis $2,112 Apr-2004 16 $2,031 2 .04 .17 Record of Decision $4,200 Apr-2004 16 $4,038 2 .07 .03 Site Contaminant Surveys/Radiation Monitoring $47,520 Apr-2004 16 $45,689 2 .07 .08 Air Monitoring and Sampling $6,336 Apr-2004 16 $6,092 2 .07 .11 .01 Surface Soil Sample Collection $26,500 Apr-2004 16 $25,479 2 .07 .11 .02 Subsurface Soil Sample Collection $70,000 Apr-2004 16 $67,304 2 .07 .14 .01 Hand Scanning $824,453 Apr-2004 16 $792,694 2 .07 .14 .02 Smears and Swipes $2,061,128 Apr-2004 16 $1,981,731
Guide to Computing LCC of EM Projects 35

Phase 2nd 3rd 4th 5th Description Cost Date Months PVC
2 .07 .14 .03 Destructive Sampling (Including Removal of Paints, Drilling, Cutting of Structures/Equipment, etc) $1,236,677 Apr-2004 16 $1,189,039
2 .08 .04 Soil/Sediment Sample Analysis $604,500 Apr-2004 16 $581,214 2 .08 .07 Solid Material/Waste Sampling $354,500 Apr-2004 16 $340,844 2 .09 .01 Prepare and Ship Environmental Samples $5,000 Apr-2004 16 $4,807 2 .09 .04 Provide Sample Management $6,600 Apr-2004 16 $6,346 2 .09 .08 Data Reduction, Tabulation and Evaluation $7,040 Apr-2004 16 $6,769 3 .02 .01 Project Management/Support/Administration $16,624 Mar-2005 27 $15,557 3 .04 .12 .01 Preliminary Design $17,955 Mar-2005 27 $16,803 3 .04 .12 .02 Intermediate Design $3,217 Mar-2005 27 $3,011 3 .04 .12 .03 Pre-final/Final Design $26,434 Mar-2005 27 $24,738 3 .02 .05 .02 .01 Support preparation of solicitation package $2,089 Mar-2005 27 $1,955 3 .02 .05 .02 .03 Advertising/soliciting of bids $1,200 Mar-2005 27 $1,123 3 .02 .05 .02 .05 Pre-bid (pre-solicitation) meetings $350 Mar-2005 27 $328 3 .02 .05 .03 Perform Pre-Award Activities $3,520 Mar-2005 27 $3,294 4 .02 .01 Project Management/Support/Administration $2,707,041 Aug-2005 32 $2,502,503 4 .05 .01 Mobilization $78,281 Aug-2005 32 $72,366 4 .05 .36 Demobilization $27,398 Aug-2005 32 $25,328 4 .07 .08 Air Monitoring and Sampling $10,560 Aug-2005 32 $9,762 4 .07 .14 .01 Hand Scanning $109,927 Aug-2005 32 $101,621 4 .07 .14 .02 Smears and Swipes $274,817 Aug-2005 32 $254,052
4 .07 .14 .03 Destructive Sampling (Including Removal of Paints, Drilling, Cutting of Structures/Equipment, etc) $164,890 Aug-2005 32 $152,431
4 .15 .04 Asbestos Abatement $1,553,564 Aug-2005 32 $1,436,180 4 .15 .05 Piping & Pipeline Removal $288,428 Aug-2005 32 $266,635 4 .19 .01 Contaminated Soil Collection (Excavation) $623,308 Aug-2005 32 $576,212 4 .31 .08 .06 Surface Decontamination of Floors $1,181,105 Aug-2005 32 $1,091,864 4 .31 .08 .07 Surface Decontamination of Walls $966,359 Aug-2005 32 $893,343
4 .31 .08 .19 Decontamination Area/Facility for Equipment and Vehicles $62,625 Aug-2005 32 $57,893
4 .31 .08 .20 Decontamination Area/Facility for Personnel (i.e., Showers, Changing Rooms, Monitors, Waste Handling) $15,656 Aug-2005 32 $14,473
4 .32 .01 Waste Stream Handling/Packaging $1,243,720 Aug-2005 32 $1,149,747 4 .32 .11 Transportation by truck $1,854,400 Aug-2005 32 $1,714,286
4 .33 .08 Off-Site Commercial Disposal Costs, Fees, and Taxes $3,231,217 Aug-2005 32 $2,987,074
Guide to Computing and Reporting the LCC of EM Projects 36

Phase 2nd 3rd 4th 5th Description Cost Date Months PVC 5 .02 .01 Project Management/Support/Administration $35,058 Sep-2005 33 $32,330 5 .07 .14 .01 Hand Scanning $67,822 Sep-2005 33 $62,543 5 .07 .14 .02 Smears and Swipes $169,554 Sep-2005 33 $156,359
5 .07 .14 .03 Destructive Sampling (Including Removal of Paints, Drilling, Cutting of Structures/Equipment, etc) $101,732 Sep-2005 33 $93,815
5 .31 .08 .20 Decontamination Area/Facility for Personnel (I.e. Showers, Changing Rooms, Monitors, Waste Handling) $42,000 Sep-2005 33 $38,731
6 .02 .01 Project Management/Support/Administration $13,885 Feb-2008 62 $11,924 6 .02 .01 Project Management/Support/Administration $7,134 Feb-2009 74 $5,949 6 .02 .01 Project Management/Support/Administration $7,414 Feb-2010 86 $6,003 6 .02 .01 Project Management/Support/Administration $7,515 Feb-2011 98 $5,908 6 .02 .01 Project Management/Support/Administration $8,039 Feb-2012 110 $6,136 6 .02 .01 Project Management/Support/Administration $8,387 Feb-2013 122 $6,216 6 .02 .01 Project Management/Support/Administration $8,761 Feb-2014 134 $6,305 6 .02 .01 Project Management/Support/Administration $9,164 Feb-2015 146 $6,403 6 .02 .01 Project Management/Support/Administration $9,596 Feb-2016 158 $6,511 6 .02 .01 Project Management/Support/Administration $18,827 Feb-2017 170 $12,403 6 .02 .01 Project Management/Support/Administration $10,561 Feb-2018 182 $6,755 6 .02 .01 Project Management/Support/Administration $11,098 Feb-2019 194 $6,893 6 .02 .01 Project Management/Support/Administration $11,676 Feb-2020 206 $7,041 6 .02 .01 Project Management/Support/Administration $12,297 Feb-2021 218 $7,200 6 .02 .01 Project Management/Support/Administration $12,964 Feb-2022 230 $7,371 6 .02 .01 Project Management/Support/Administration $13,682 Feb-2023 242 $7,553 6 .02 .01 Project Management/Support/Administration $14,453 Feb-2024 254 $7,747 6 .02 .01 Project Management/Support/Administration $15,282 Feb-2025 266 $7,953 6 .02 .01 Project Management/Support/Administration $16,174 Feb-2026 278 $8,173 6 .02 .01 Project Management/Support/Administration $39,046 Feb-2027 290 $19,159 6 .02 .04 .04 Land Record Management $2,640 Feb-2008 62 $2,267 6 .02 .04 .04 Land Record Management $2,640 Feb-2009 74 $2,201 6 .02 .04 .04 Land Record Management $2,640 Feb-2010 86 $2,137 6 .02 .04 .04 Land Record Management $2,640 Feb-2011 98 $2,075 6 .02 .04 .04 Land Record Management $2,640 Feb-2012 110 $2,015 6 .02 .04 .04 Land Record Management $2,640 Feb-2013 122 $1,957 6 .02 .04 .04 Land Record Management $2,640 Feb-2014 134 $1,900
Guide to Computing and Reporting the LCC of EM Projects 37

Phase 2nd 3rd 4th 5th Description Cost Date Months PVC 6 .02 .04 .04 Land Record Management $2,640 Feb-2015 146 $1,845 6 .02 .04 .04 Land Record Management $2,640 Feb-2016 158 $1,791 6 .02 .04 .04 Land Record Management $2,640 Feb-2017 170 $1,739 6 .02 .04 .04 Land Record Management $2,640 Feb-2018 182 $1,689 6 .02 .04 .04 Land Record Management $2,640 Feb-2019 194 $1,640 6 .02 .04 .04 Land Record Management $2,640 Feb-2020 206 $1,592 6 .02 .04 .04 Land Record Management $2,640 Feb-2021 218 $1,546 6 .02 .04 .04 Land Record Management $2,640 Feb-2022 230 $1,501 6 .02 .04 .04 Land Record Management $2,640 Feb-2023 242 $1,457 6 .02 .04 .04 Land Record Management $2,640 Feb-2024 254 $1,415 6 .02 .04 .04 Land Record Management $2,640 Feb-2025 266 $1,374 6 .02 .04 .04 Land Record Management $2,640 Feb-2026 278 $1,334 6 .02 .04 .04 Land Record Management $2,640 Feb-2027 290 $1,295 6 .02 .04 .05 Transferred Property Restriction $1,584 Feb-2008 62 $1,360 6 .02 .04 .05 Transferred Property Restriction $1,584 Feb-2009 74 $1,321 6 .02 .04 .05 Transferred Property Restriction $1,584 Feb-2010 86 $1,282 6 .02 .04 .05 Transferred Property Restriction $1,584 Feb-2011 98 $1,245 6 .02 .04 .05 Transferred Property Restriction $1,584 Feb-2012 110 $1,209 6 .02 .04 .05 Transferred Property Restriction $1,584 Feb-2013 122 $1,174 6 .02 .04 .05 Transferred Property Restriction $1,584 Feb-2014 134 $1,140 6 .02 .04 .05 Transferred Property Restriction $1,584 Feb-2015 146 $1,107 6 .02 .04 .05 Transferred Property Restriction $1,584 Feb-2016 158 $1,075 6 .02 .04 .05 Transferred Property Restriction $1,584 Feb-2017 170 $1,043 6 .02 .04 .05 Transferred Property Restriction $1,584 Feb-2018 182 $1,013 6 .02 .04 .05 Transferred Property Restriction $1,584 Feb-2019 194 $984 6 .02 .04 .05 Transferred Property Restriction $1,584 Feb-2020 206 $955 6 .02 .04 .05 Transferred Property Restriction $1,584 Feb-2021 218 $927 6 .02 .04 .05 Transferred Property Restriction $1,584 Feb-2022 230 $901 6 .02 .04 .05 Transferred Property Restriction $1,584 Feb-2023 242 $874 6 .02 .04 .05 Transferred Property Restriction $1,584 Feb-2024 254 $849 6 .02 .04 .05 Transferred Property Restriction $1,584 Feb-2025 266 $824 6 .02 .04 .05 Transferred Property Restriction $1,584 Feb-2026 278 $800 6 .02 .04 .05 Transferred Property Restriction $1,584 Feb-2027 290 $777 6 .02 .04 .06 Verification of Institutional Controls $1,920 Feb-2008 62 $1,649 6 .02 .04 .06 Verification of Institutional Controls $1,920 Feb-2009 74 $1,601
Guide to Computing and Reporting the LCC of EM Projects 38

Phase 2nd 3rd 4th 5th Description Cost Date Months PVC 6 .02 .04 .06 Verification of Institutional Controls $1,920 Feb-2010 86 $1,555 6 .02 .04 .06 Verification of Institutional Controls $1,920 Feb-2011 98 $1,509 6 .02 .04 .06 Verification of Institutional Controls $1,920 Feb-2012 110 $1,466 6 .02 .04 .06 Verification of Institutional Controls $1,920 Feb-2013 122 $1,423 6 .02 .04 .06 Verification of Institutional Controls $1,920 Feb-2014 134 $1,382 6 .02 .04 .06 Verification of Institutional Controls $1,920 Feb-2015 146 $1,342 6 .02 .04 .06 Verification of Institutional Controls $1,920 Feb-2016 158 $1,303 6 .02 .04 .06 Verification of Institutional Controls $1,920 Feb-2017 170 $1,265 6 .02 .04 .06 Verification of Institutional Controls $1,920 Feb-2018 182 $1,228 6 .02 .04 .06 Verification of Institutional Controls $1,920 Feb-2019 194 $1,192 6 .02 .04 .06 Verification of Institutional Controls $1,920 Feb-2020 206 $1,158 6 .02 .04 .06 Verification of Institutional Controls $1,920 Feb-2021 218 $1,124 6 .02 .04 .06 Verification of Institutional Controls $1,920 Feb-2022 230 $1,092 6 .02 .04 .06 Verification of Institutional Controls $1,920 Feb-2023 242 $1,060 6 .02 .04 .06 Verification of Institutional Controls $1,920 Feb-2024 254 $1,029 6 .02 .04 .06 Verification of Institutional Controls $1,920 Feb-2025 266 $999 6 .02 .04 .06 Verification of Institutional Controls $1,920 Feb-2026 278 $970 6 .02 .04 .06 Verification of Institutional Controls $1,920 Feb-2027 290 $942 6 .06 .03 .01 Surveillance and Inspections $18,400 Feb-2008 62 $15,802 6 .06 .03 .01 Surveillance and Inspections $18,400 Feb-2009 74 $15,343 6 .06 .03 .01 Surveillance and Inspections $18,400 Feb-2010 86 $14,898 6 .06 .03 .01 Surveillance and Inspections $18,400 Feb-2011 98 $14,465 6 .06 .03 .01 Surveillance and Inspections $18,400 Feb-2012 110 $14,045 6 .06 .03 .01 Surveillance and Inspections $18,400 Feb-2013 122 $13,637 6 .06 .03 .01 Surveillance and Inspections $18,400 Feb-2014 134 $13,242 6 .06 .03 .01 Surveillance and Inspections $18,400 Feb-2015 146 $12,857 6 .06 .03 .01 Surveillance and Inspections $18,400 Feb-2016 158 $12,484 6 .06 .03 .01 Surveillance and Inspections $18,400 Feb-2017 170 $12,121 6 .06 .03 .01 Surveillance and Inspections $18,400 Feb-2018 182 $11,770 6 .06 .03 .01 Surveillance and Inspections $18,400 Feb-2019 194 $11,428 6 .06 .03 .01 Surveillance and Inspections $18,400 Feb-2020 206 $11,096 6 .06 .03 .01 Surveillance and Inspections $18,400 Feb-2021 218 $10,774 6 .06 .03 .01 Surveillance and Inspections $18,400 Feb-2022 230 $10,461 6 .06 .03 .01 Surveillance and Inspections $18,400 Feb-2023 242 $10,157 6 .06 .03 .01 Surveillance and Inspections $18,400 Feb-2024 254 $9,863
Guide to Computing and Reporting the LCC of EM Projects 39

Phase 2nd 3rd 4th 5th Description Cost Date Months PVC 6 .06 .03 .01 Surveillance and Inspections $18,400 Feb-2025 266 $9,576 6 .06 .03 .01 Surveillance and Inspections $18,400 Feb-2026 278 $9,298 6 .06 .03 .01 Surveillance and Inspections $18,400 Feb-2027 290 $9,028 6 .06 .03 .02 Facility/Building Maintenance $31,600 Feb-2008 62 $27,138 6 .06 .03 .02 Facility/Building Maintenance $33,970 Feb-2009 74 $28,326 6 .06 .03 .02 Facility/Building Maintenance $36,518 Feb-2010 86 $29,567 6 .06 .03 .02 Facility/Building Maintenance $39,257 Feb-2011 98 $30,862 6 .06 .03 .02 Facility/Building Maintenance $42,201 Feb-2012 110 $32,213 6 .06 .03 .02 Facility/Building Maintenance $45,366 Feb-2013 122 $33,624 6 .06 .03 .02 Facility/Building Maintenance $48,768 Feb-2014 134 $35,096 6 .06 .03 .02 Facility/Building Maintenance $52,426 Feb-2015 146 $36,633 6 .06 .03 .02 Facility/Building Maintenance $56,358 Feb-2016 158 $38,237 6 .06 .03 .02 Facility/Building Maintenance $60,585 Feb-2017 170 $39,912 6 .06 .03 .02 Facility/Building Maintenance $65,129 Feb-2018 182 $41,660 6 .06 .03 .02 Facility/Building Maintenance $70,013 Feb-2019 194 $43,484 6 .06 .03 .02 Facility/Building Maintenance $75,264 Feb-2020 206 $45,388 6 .06 .03 .02 Facility/Building Maintenance $80,909 Feb-2021 218 $47,375 6 .06 .03 .02 Facility/Building Maintenance $86,977 Feb-2022 230 $49,450 6 .06 .03 .02 Facility/Building Maintenance $93,501 Feb-2023 242 $51,616 6 .06 .03 .02 Facility/Building Maintenance $100,513 Feb-2024 254 $53,876 6 .06 .03 .02 Facility/Building Maintenance $108,052 Feb-2025 266 $56,235 6 .06 .03 .02 Facility/Building Maintenance $116,155 Feb-2026 278 $58,697 6 .06 .03 .02 Facility/Building Maintenance $124,867 Feb-2027 290 $61,268 6 .06 .03 .04 Major Facility Repairs $63,750 Feb-2008 62 $54,749 6 .06 .03 .04 Major Facility Repairs $79,688 Feb-2017 170 $52,496 6 .06 .03 .04 Major Facility Repairs $199,219 Feb-2027 290 $97,750 6 .07 .08 .04 Air Monitoring and Sampling $6,336 Feb-2008 62 $5,441 6 .07 .08 .04 Air Monitoring and Sampling $6,336 Feb-2009 74 $5,283 6 .07 .08 .04 Air Monitoring and Sampling $6,336 Feb-2010 86 $5,130 6 .07 .08 .04 Air Monitoring and Sampling $6,336 Feb-2011 98 $4,981 6 .07 .08 .04 Air Monitoring and Sampling $6,336 Feb-2012 110 $4,836 6 .07 .08 .04 Air Monitoring and Sampling $6,336 Feb-2013 122 $4,696 6 .07 .08 .04 Air Monitoring and Sampling $6,336 Feb-2014 134 $4,560 6 .07 .08 .04 Air Monitoring and Sampling $6,336 Feb-2015 146 $4,427 6 .07 .08 .04 Air Monitoring and Sampling $6,336 Feb-2016 158 $4,299
Guide to Computing and Reporting the LCC of EM Projects 40

Phase 2nd 3rd 4th 5th Description Cost Date Months PVC 6 .07 .08 .04 Air Monitoring and Sampling $6,336 Feb-2017 170 $4,174 6 .07 .08 .04 Air Monitoring and Sampling $6,336 Feb-2018 182 $4,053 6 .07 .08 .04 Air Monitoring and Sampling $6,336 Feb-2019 194 $3,935 6 .07 .08 .04 Air Monitoring and Sampling $6,336 Feb-2020 206 $3,821 6 .07 .08 .04 Air Monitoring and Sampling $6,336 Feb-2021 218 $3,710 6 .07 .08 .04 Air Monitoring and Sampling $6,336 Feb-2022 230 $3,602 6 .07 .08 .04 Air Monitoring and Sampling $6,336 Feb-2023 242 $3,498 6 .07 .08 .04 Air Monitoring and Sampling $6,336 Feb-2024 254 $3,396 6 .07 .08 .04 Air Monitoring and Sampling $6,336 Feb-2025 266 $3,298 6 .07 .08 .04 Air Monitoring and Sampling $6,336 Feb-2026 278 $3,202 6 .07 .08 .04 Air Monitoring and Sampling $6,336 Feb-2027 290 $3,109 6 .07 .08 .04 Air Monitoring and Sampling $6,336 Feb-2008 62 $5,441 6 .07 .08 .04 Air Monitoring and Sampling $6,336 Feb-2017 170 $4,174 6 .07 .08 .04 Air Monitoring and Sampling $6,336 Feb-2027 290 $3,109
Total LCC: $21,758,032
Guide to Computing and Reporting the LCC of EM Projects 41

Appendix B: Data for Case Study with Two Alternatives—In Situ Soil Vapor Extraction
Sample Project: Gasoline Spill Clean-up Alternative A: In Situ Soil Vapor Extraction Location: Sacramento, CA Base Date: January 2003 Study Period: 40 Years, 8 Months Discount Rate: 3.2%
Phase 2nd 3rd 4th 5th Description Cost Date Months PVC 1 .02 .01 .01 Project Management $16,760 Jan-2004 13 $16,198 1 .02 .01 .02 Support Subcontracting Activities $6,080 Jan-2004 13 $5,876 1 .07 .01 .07 .01 Collection and review of exisiting documents $50,400 Jan-2004 13 $48,709 1 .07 .08 Air Monitoring and Sampling $10,560 Jan-2004 13 $10,206 2 .02 .01 Project Management/Support/Administration $322,437 Mar-2004 15 $309,988 2 .02 .03 .05 Regulatory Permitting(e.g, RCA Part B Permit) $639,377 Mar-2004 15 $614,692 2 .03 .03 Sampling and Analysis Plan $3,520 Mar-2004 15 $3,384 2 .03 .10 Risk Assessment Plan $1,760 Mar-2004 15 $1,692 2 .03 .11 Technical Project Goals and Objectives $2,112 Mar-2004 15 $2,030 2 .04 .02 Human Health Risk Assessment $27,600 Mar-2004 15 $26,534 2 .04 .03 Ecological Risk Assessment $18,000 Mar-2004 15 $17,305 2 .04 .04 Risk Assessment Documentation $19,320 Mar-2004 15 $18,574 2 .04 .05 Environmental Investigation Report $14,520 Mar-2004 15 $13,959 2 .04 .06 Develop Environmental Alternatives $9,600 Mar-2004 15 $9,229 2 .04 .07 Screen Environmental Alternatives $5,632 Mar-2004 15 $5,415 2 .04 .08 Evaluate Alternatives $4,200 Mar-2004 15 $4,038 2 .04 .09 Refinement of Alternatives $4,211 Mar-2004 15 $4,048 2 .04 .10 Document FS(CMS) $12,060 Mar-2004 15 $11,594 2 .04 .16 Engineering Evaluation/Cost Analysis $2,112 Mar-2004 15 $2,030 2 .04 .17 Record of Decision $5,040 Mar-2004 15 $4,845 2 .07 .03 Site Contaminant Surveys/Radiation Monitoring $21,120 Mar-2004 15 $20,305 2 .07 .08 Air Monitoring and Sampling $12,672 Mar-2004 15 $12,183 2 .07 .11 .02 Subsurface Soil Sample Collection $460,000 Mar-2004 15 $442,240 2 .07 .09 Groundwater Sampling/Monitoring $354,500 Mar-2004 15 $340,813 2 .08 .04 Soil/Sediment Sample Analysis $1,155,000 Mar-2004 15 $1,110,407 2 .08 .06 Liquid Material/Waste Sample Analysis $503,220 Mar-2004 15 $483,792 2 .09 .01 Prepare and Ship Environmental Samples $5,000 Mar-2004 15 $4,807 2 .09 .04 Provide Sample Management $17,600 Mar-2004 15 $16,920
Guide to Computing and Reporting the LCC of EM Projects 43

Phase 2nd 3rd 4th 5th Description Cost Date Months PVC 2 .09 .08 Data Reduction, Tabulation and Evaluation $28,160 Mar-2004 15 $27,073 3 .02 .01 Project Management/Support/Administration $10,126 Sep-2004 21 $9,583 3 .04 .12 .01 Preliminary Design $44,380 Sep-2004 21 $42,000 3 .04 .12 .02 Intermediate Design $23,880 Sep-2004 21 $22,599 3 .04 .12 .03 Pre-final/Final Design $7,040 Sep-2004 21 $6,662 3 .02 .05 .02 .01 Support preparation of solicitation package $3,520 Sep-2004 21 $3,331 3 .02 .05 .02 .03 Advertising/soliciting of bids $1,200 Sep-2004 21 $1,136 3 .02 .05 .02 .05 Pre-bid (pre-soliciatation) meetings $840 Sep-2004 21 $795 3 .02 .05 .03 Perform Pre-Award Activities $3,520 Sep-2004 21 $3,331 4 .02 .01 Project Management/Support/Administration $1,018,888 Dec-2004 24 $956,681 4 .02 .04 .03 Fencing/Barriers $132,361 Dec-2004 24 $124,280 4 .05 .01 Mobilization $78,281 Dec-2004 24 $73,502 4 .05 .36 Demobilization $27,398 Dec-2004 24 $25,725 4 .07 .08 Air Monitoring and Sampling $10,560 Dec-2004 24 $9,915 4 .07 .09 Groundwater Sampling/Monitoring $18,304 Dec-2004 24 $17,186 4 .08 .01 Air/Gas Sample Analysis $68,000 Dec-2004 24 $63,848 4 .08 .06 Liquid Material/Waste Sample Analysis $80,000 Dec-2004 24 $75,116 4 .08 .04 Solid Material/Wast Sample Analysis $92,000 Dec-2004 24 $86,383 4 .09 .01 Prepare and Ship Environmental Samples $1,340 Dec-2004 24 $1,258 4 .26 .04 Air Stripping $53,476 Dec-2004 24 $50,211 4 .26 .23 Granular Activated Carbon Absorption-Liquid $6,196 Dec-2004 24 $5,818 4 .26 .30 Oil/Water Separation $12,323 Dec-2004 24 $11,571 4 .27 .04 Steam/Hot Water Injection Vacuum Extraction $1,572,153 Dec-2004 24 $1,476,167 4 .31 .08 .20 Decontamination Area/Facility for Personnel $9,000 Dec-2004 24 $8,451 4 .32 .01 Waste Steam Handling Packaging $1,243,720 Dec-2004 24 $1,167,786 4 .32 .11 Transportation by truck $1,854,400 Dec-2004 24 $1,741,181 4 .33 .08 Off-site Commerical Disposal Costs, Fees and T $3,231,217 Dec-2004 24 $3,033,938 5 .02 .01 Project Management/Support/Administration $94,568 Aug-2005 32 $86,949 5 .02 .01 Project Management/Support/Administration $85,318 Aug-2006 44 $76,012 5 .02 .01 Project Management/Support/Administration $74,682 Aug-2007 56 $64,473 5 .02 .04 .03 Fencing/Barriers $840 Aug-2005 32 $772 5 .02 .04 .03 Fencing/Barriers $840 Aug-2006 44 $748 5 .02 .04 .03 Fencing/Barriers $990 Aug-2007 56 $855 5 .07 .08 Air Monitoring and Sampling $7,040 Aug-2005 32 $6,473 5 .07 .08 Air Monitoring and Sampling $7,040 Aug-2006 44 $6,272 5 .07 .08 Air Monitoring and Sampling $5,632 Aug-2007 56 $4,862
Guide to Computing and Reporting the LCC of EM Projects 44
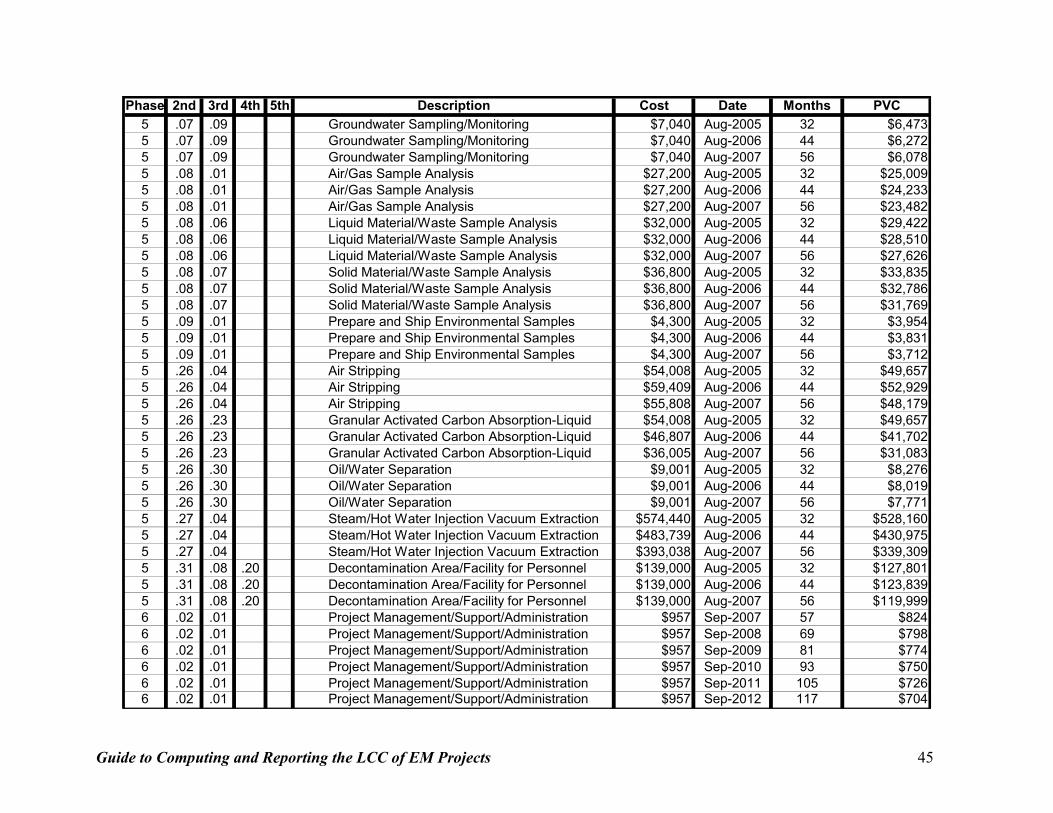
Phase 2nd 3rd 4th 5th Description Cost Date Months PVC 5 .07 .09 Groundwater Sampling/Monitoring $7,040 Aug-2005 32 $6,473 5 .07 .09 Groundwater Sampling/Monitoring $7,040 Aug-2006 44 $6,272 5 .07 .09 Groundwater Sampling/Monitoring $7,040 Aug-2007 56 $6,078 5 .08 .01 Air/Gas Sample Analysis $27,200 Aug-2005 32 $25,009 5 .08 .01 Air/Gas Sample Analysis $27,200 Aug-2006 44 $24,233 5 .08 .01 Air/Gas Sample Analysis $27,200 Aug-2007 56 $23,482 5 .08 .06 Liquid Material/Waste Sample Analysis $32,000 Aug-2005 32 $29,422 5 .08 .06 Liquid Material/Waste Sample Analysis $32,000 Aug-2006 44 $28,510 5 .08 .06 Liquid Material/Waste Sample Analysis $32,000 Aug-2007 56 $27,626 5 .08 .07 Solid Material/Waste Sample Analysis $36,800 Aug-2005 32 $33,835 5 .08 .07 Solid Material/Waste Sample Analysis $36,800 Aug-2006 44 $32,786 5 .08 .07 Solid Material/Waste Sample Analysis $36,800 Aug-2007 56 $31,769 5 .09 .01 Prepare and Ship Environmental Samples $4,300 Aug-2005 32 $3,954 5 .09 .01 Prepare and Ship Environmental Samples $4,300 Aug-2006 44 $3,831 5 .09 .01 Prepare and Ship Environmental Samples $4,300 Aug-2007 56 $3,712 5 .26 .04 Air Stripping $54,008 Aug-2005 32 $49,657 5 .26 .04 Air Stripping $59,409 Aug-2006 44 $52,929 5 .26 .04 Air Stripping $55,808 Aug-2007 56 $48,179 5 .26 .23 Granular Activated Carbon Absorption-Liquid $54,008 Aug-2005 32 $49,657 5 .26 .23 Granular Activated Carbon Absorption-Liquid $46,807 Aug-2006 44 $41,702 5 .26 .23 Granular Activated Carbon Absorption-Liquid $36,005 Aug-2007 56 $31,083 5 .26 .30 Oil/Water Separation $9,001 Aug-2005 32 $8,276 5 .26 .30 Oil/Water Separation $9,001 Aug-2006 44 $8,019 5 .26 .30 Oil/Water Separation $9,001 Aug-2007 56 $7,771 5 .27 .04 Steam/Hot Water Injection Vacuum Extraction $574,440 Aug-2005 32 $528,160 5 .27 .04 Steam/Hot Water Injection Vacuum Extraction $483,739 Aug-2006 44 $430,975 5 .27 .04 Steam/Hot Water Injection Vacuum Extraction $393,038 Aug-2007 56 $339,309 5 .31 .08 .20 Decontamination Area/Facility for Personnel $139,000 Aug-2005 32 $127,801 5 .31 .08 .20 Decontamination Area/Facility for Personnel $139,000 Aug-2006 44 $123,839 5 .31 .08 .20 Decontamination Area/Facility for Personnel $139,000 Aug-2007 56 $119,999 6 .02 .01 Project Management/Support/Administration $957 Sep-2007 57 $824 6 .02 .01 Project Management/Support/Administration $957 Sep-2008 69 $798 6 .02 .01 Project Management/Support/Administration $957 Sep-2009 81 $774 6 .02 .01 Project Management/Support/Administration $957 Sep-2010 93 $750 6 .02 .01 Project Management/Support/Administration $957 Sep-2011 105 $726 6 .02 .01 Project Management/Support/Administration $957 Sep-2012 117 $704
Guide to Computing and Reporting the LCC of EM Projects 45

Phase 2nd 3rd 4th 5th Description Cost Date Months PVC 6 .02 .01 Project Management/Support/Administration $957 Sep-2013 129 $682 6 .02 .01 Project Management/Support/Administration $957 Sep-2014 141 $661 6 .02 .01 Project Management/Support/Administration $957 Sep-2015 153 $640 6 .02 .01 Project Management/Support/Administration $957 Sep-2016 165 $621 6 .02 .04 .04 Land Record Management $1,650 Sep-2007 57 $1,421 6 .02 .04 .04 Land Record Management $1,650 Sep-2008 69 $1,377 6 .02 .04 .04 Land Record Management $1,650 Sep-2009 81 $1,334 6 .02 .04 .04 Land Record Management $1,650 Sep-2010 93 $1,293 6 .02 .04 .04 Land Record Management $1,650 Sep-2011 105 $1,253 6 .02 .04 .04 Land Record Management $1,650 Sep-2012 117 $1,214 6 .02 .04 .04 Land Record Management $1,650 Sep-2013 129 $1,176 6 .02 .04 .04 Land Record Management $1,650 Sep-2014 141 $1,140 6 .02 .04 .04 Land Record Management $1,650 Sep-2015 153 $1,104 6 .02 .04 .04 Land Record Management $1,650 Sep-2016 165 $1,070 6 .02 .04 .05 Transferred Property Restriction $1,584 Sep-2007 57 $1,364 6 .02 .04 .05 Transferred Property Restriction $1,584 Sep-2008 69 $1,322 6 .02 .04 .05 Transferred Property Restriction $1,584 Sep-2009 81 $1,281 6 .02 .04 .05 Transferred Property Restriction $1,584 Sep-2010 93 $1,241 6 .02 .04 .05 Transferred Property Restriction $1,584 Sep-2011 105 $1,202 6 .02 .04 .05 Transferred Property Restriction $1,584 Sep-2012 117 $1,165 6 .02 .04 .05 Transferred Property Restriction $1,584 Sep-2013 129 $1,129 6 .02 .04 .05 Transferred Property Restriction $1,584 Sep-2014 141 $1,094 6 .02 .04 .05 Transferred Property Restriction $1,584 Sep-2015 153 $1,060 6 .02 .04 .05 Transferred Property Restriction $1,584 Sep-2016 165 $1,027 6 .07 .08 Air Monitoring and Sampling $6,336 Sep-2007 57 $5,456 6 .07 .08 Air Monitoring and Sampling $6,336 Sep-2008 69 $5,286 6 .07 .08 Air Monitoring and Sampling $6,336 Sep-2009 81 $5,122 6 .07 .08 Air Monitoring and Sampling $6,336 Sep-2010 93 $4,964 6 .07 .08 Air Monitoring and Sampling $6,336 Sep-2011 105 $4,810 6 .07 .08 Air Monitoring and Sampling $6,336 Sep-2012 117 $4,661 6 .07 .08 Air Monitoring and Sampling $6,336 Sep-2013 129 $4,516 6 .07 .08 Air Monitoring and Sampling $6,336 Sep-2014 141 $4,376 6 .07 .08 Air Monitoring and Sampling $6,336 Sep-2015 153 $4,240 6 .07 .08 Air Monitoring and Sampling $6,336 Sep-2016 165 $4,109
Total LCC: $15,188,090
Guide to Computing and Reporting the LCC of EM Projects 46

Appendix C: Data for Case Study with Two Alternatives—Natural Attenuation
Sample Project: Gasoline Spill Clean-Up Alternative B : Natural Attenuation Location: Sacramento, CA Base Date: January 2003 Study Period: 40 Years, 8 Months Discount Rate: 3.2%
Phase 2nd 3rd 4th 5th Description Cost Date Month PVC 1 .02 .01 .01 Project Management $16,760 Jan-2004 13 $16,198 1 .02 .01 .02 Support Subcontracting Activities $6,080 Jan-2004 13 $5,876 1 .07 .01 .07 .01 Collection and review of existing documents $50,400 Jan-2004 13 $48,709 1 .07 .08 Air Monitoring and Sampling $10,560 Jan-2004 13 $10,206 2 .02 .01 Project Management/Support/Administration $322,437 Mar-2004 15 $309,988 2 .02 .03 .05 Regulatory Permitting (e.g., RCRA Part B Permit $639,377 Mar-2004 15 $614,692 2 .03 .03 Sampling and Analysis Plan $3,520 Mar-2004 15 $3,384 2 .03 .10 Risk Assessment Plan $1,760 Mar-2004 15 $1,692 2 .03 .11 Technical Project Goals and Objectives $2,112 Mar-2004 15 $2,030 2 .04 .02 Human Health Risk Assessment $27,600 Mar-2004 15 $26,534 2 .04 .03 Ecological Risk Assessment $18,000 Mar-2004 15 $17,305 2 .04 .04 Risk Assessment Documentation $19,320 Mar-2004 15 $18,574 2 .04 .05 Environmental Investigation Report $14,520 Mar-2004 15 $13,959 2 .04 .06 Develop Environmental Alternatives $9,600 Mar-2004 15 $9,229 2 .04 .07 Screen Environmental Alternatives $5,632 Mar-2004 15 $5,415 2 .04 .08 Evaluate Alternatives $4,200 Mar-2004 15 $4,038 2 .04 .09 Refinement of Alternatives $4,224 Mar-2004 15 $4,061 2 .04 .10 Document FS (CMS) $12,060 Mar-2004 15 $11,594 2 .04 .16 Engineering Evaluation/Cost Analysis $2,112 Mar-2004 15 $2,030 2 .04 .17 Record of Decision $5,040 Mar-2004 15 $4,845 2 .07 .03 Site Contaminant Surveys/Radiation Monitoring $21,120 Mar-2004 15 $20,305 2 .07 .08 Air Monitoring and Sampling $12,672 Mar-2004 15 $12,183 2 .07 .11 .02 Subsurface Soil Sample Collection $460,000 Mar-2004 15 $442,240 2 .07 .09 Groundwater Sampling/Monitoring $354,500 Mar-2004 15 $340,813 2 .08 .04 Soil/Sediment Sample Analysis $1,155,000 Mar-2004 15 $1,110,407 2 .08 .06 Liquid Material/Waste Sample Analysis $503,220 Mar-2004 15 $483,792 2 .09 .01 Prepare and Ship Environmental Samples $5,000 Mar-2004 15 $4,807 2 .09 .04 Provide Sample Management $17,600 Mar-2004 15 $16,920
Guide to Computing and Reporting the LCC of EM Projects 47

Phase 2nd 3rd 4th 5th Description Cost Date Month PVC 2 .09 .08 Data Reduction, Tabulation and Evaluation $28,160 Mar-2004 15 $27,073 3 .04 .01 Project Management/Support/Administration $962 Sep-2004 21 $910 3 .04 .12 .01 Preliminary Design $1,055 Sep-2004 21 $998 3 .04 .12 .02 Intermediate Design $1,938 Sep-2004 21 $1,834 3 .04 .12 .03 Pre-final/Final Design $2,254 Sep-2004 21 $2,133 3 .02 .05 .02 .01 Support preparation of solicitation package $569 Sep-2004 21 $538 3 .02 .05 .02 .03 Advertising/soliciting of bids $625 Sep-2004 21 $591 3 .02 .05 .02 .05 Pre-bid (pre-solicitation) meetings $521 Sep-2004 21 $493 3 .02 .05 .03 Perform Pre-Award Activities $1,057 Sep-2004 21 $1,000 4 .02 .01 Project Management/Support/Administration $48,471 Dec-2004 24 $45,512 4 .02 .01 Project Management/Support/Administration $21,206 Dec-2005 36 $19,294 4 .02 .01 Project Management/Support/Administration $21,206 Dec-2006 48 $18,696 4 .02 .01 Project Management/Support/Administration $21,206 Dec-2007 60 $18,116 4 .02 .01 Project Management/Support/Administration $21,206 Dec-2008 72 $17,554 4 .02 .01 Project Management/Support/Administration $21,206 Dec-2009 84 $17,010 4 .02 .01 Project Management/Support/Administration $21,206 Dec-2010 96 $16,482 4 .02 .01 Project Management/Support/Administration $21,206 Dec-2011 108 $15,971 4 .02 .01 Project Management/Support/Administration $21,206 Dec-2012 120 $15,476 4 .02 .01 Project Management/Support/Administration $21,206 Dec-2013 132 $14,996 4 .02 .01 Project Management/Support/Administration $21,206 Dec-2014 144 $14,531 4 .02 .01 Project Management/Support/Administration $21,206 Dec-2015 156 $14,081 4 .02 .01 Project Management/Support/Administration $21,206 Dec-2016 168 $13,644 4 .02 .01 Project Management/Support/Administration $21,206 Dec-2017 180 $13,221 4 .02 .01 Project Management/Support/Administration $21,206 Dec-2018 192 $12,811 4 .02 .01 Project Management/Support/Administration $21,206 Dec-2019 204 $12,414 4 .02 .01 Project Management/Support/Administration $21,206 Dec-2020 216 $12,029 4 .02 .01 Project Management/Support/Administration $21,206 Dec-2021 228 $11,656 4 .02 .01 Project Management/Support/Administration $21,206 Dec-2022 240 $11,294 4 .02 .01 Project Management/Support/Administration $21,206 Dec-2023 252 $10,944 4 .02 .01 Project Management/Support/Administration $21,206 Dec-2024 264 $10,605 4 .02 .01 Project Management/Support/Administration $21,206 Dec-2025 276 $10,276 4 .02 .01 Project Management/Support/Administration $21,206 Dec-2026 288 $9,957 4 .02 .01 Project Management/Support/Administration $21,206 Dec-2027 300 $9,649 4 .02 .01 Project Management/Support/Administration $21,206 Dec-2028 312 $9,349 4 .02 .01 Project Management/Support/Administration $21,206 Dec-2029 324 $9,060 4 .02 .01 Project Management/Support/Administration $21,206 Dec-2030 336 $8,779
Guide to Computing and Reporting the LCC of EM Projects 48

Phase 2nd 3rd 4th 5th Description Cost Date Month PVC 4 .02 .01 Project Management/Support/Administration $21,206 Dec-2031 348 $8,506 4 .02 .01 Project Management/Support/Administration $23,776 Dec-2032 360 $9,242 4 .02 .01 Project Management/Support/Administration $26,903 Dec-2033 372 $10,133 4 .02 .01 Project Management/Support/Administration $27,977 Dec-2034 384 $10,211 4 .02 .04 .03 Fencing/Barriers $132,361 Dec-2004 24 $124,280 4 .02 .04 .03 Fencing/Barriers $840 Dec-2005 36 $764 4 .02 .04 .03 Fencing/Barriers $840 Dec-2006 48 $741 4 .02 .04 .03 Fencing/Barriers $840 Dec-2007 60 $718 4 .02 .04 .03 Fencing/Barriers $840 Dec-2008 72 $695 4 .02 .04 .03 Fencing/Barriers $840 Dec-2009 84 $674 4 .02 .04 .03 Fencing/Barriers $840 Dec-2010 96 $653 4 .02 .04 .03 Fencing/Barriers $840 Dec-2011 108 $633 4 .02 .04 .03 Fencing/Barriers $840 Dec-2012 120 $613 4 .02 .04 .03 Fencing/Barriers $840 Dec-2013 132 $594 4 .02 .04 .03 Fencing/Barriers $840 Dec-2014 144 $576 4 .02 .04 .03 Fencing/Barriers $840 Dec-2015 156 $558 4 .02 .04 .03 Fencing/Barriers $840 Dec-2016 168 $540 4 .02 .04 .03 Fencing/Barriers $840 Dec-2017 180 $524 4 .02 .04 .03 Fencing/Barriers $840 Dec-2018 192 $507 4 .02 .04 .03 Fencing/Barriers $840 Dec-2019 204 $492 4 .02 .04 .03 Fencing/Barriers $840 Dec-2020 216 $476 4 .02 .04 .03 Fencing/Barriers $840 Dec-2021 228 $462 4 .02 .04 .03 Fencing/Barriers $840 Dec-2022 240 $447 4 .02 .04 .03 Fencing/Barriers $840 Dec-2023 252 $434 4 .02 .04 .03 Fencing/Barriers $840 Dec-2024 264 $420 4 .02 .04 .03 Fencing/Barriers $840 Dec-2025 276 $407 4 .02 .04 .03 Fencing/Barriers $840 Dec-2026 288 $394 4 .02 .04 .03 Fencing/Barriers $840 Dec-2027 300 $382 4 .02 .04 .03 Fencing/Barriers $840 Dec-2028 312 $370 4 .02 .04 .03 Fencing/Barriers $840 Dec-2029 324 $359 4 .02 .04 .03 Fencing/Barriers $840 Dec-2030 336 $348 4 .02 .04 .03 Fencing/Barriers $840 Dec-2031 348 $337 4 .02 .04 .03 Fencing/Barriers $840 Dec-2032 360 $327 4 .02 .04 .03 Fencing/Barriers $840 Dec-2033 372 $316 4 .02 .04 .03 Fencing/Barriers $840 Dec-2034 384 $307 4 .21 .08 Natural Attenuation $271,562 Dec-2004 24 $254,982
Guide to Computing and Reporting the LCC of EM Projects 49

Phase 2nd 3rd 4th 5th Description Cost Date Month PVC 4 .21 .08 Natural Attenuation $211,217 Dec-2005 36 $192,172 4 .21 .08 Natural Attenuation $211,217 Dec-2006 48 $186,213 4 .21 .08 Natural Attenuation $211,217 Dec-2007 60 $180,439 4 .21 .08 Natural Attenuation $211,217 Dec-2008 72 $174,844 4 .21 .08 Natural Attenuation $211,217 Dec-2009 84 $169,422 4 .21 .08 Natural Attenuation $211,217 Dec-2010 96 $164,169 4 .21 .08 Natural Attenuation $211,217 Dec-2011 108 $159,079 4 .21 .08 Natural Attenuation $211,217 Dec-2012 120 $154,146 4 .21 .08 Natural Attenuation $211,217 Dec-2013 132 $149,366 4 .21 .08 Natural Attenuation $211,217 Dec-2014 144 $144,735 4 .21 .08 Natural Attenuation $211,217 Dec-2015 156 $140,247 4 .21 .08 Natural Attenuation $211,217 Dec-2016 168 $135,898 4 .21 .08 Natural Attenuation $211,217 Dec-2017 180 $131,684 4 .21 .08 Natural Attenuation $211,217 Dec-2018 192 $127,601 4 .21 .08 Natural Attenuation $211,217 Dec-2019 204 $123,644 4 .21 .08 Natural Attenuation $211,217 Dec-2020 216 $119,810 4 .21 .08 Natural Attenuation $211,217 Dec-2021 228 $116,095 4 .21 .08 Natural Attenuation $211,217 Dec-2022 240 $112,495 4 .21 .08 Natural Attenuation $211,217 Dec-2023 252 $109,007 4 .21 .08 Natural Attenuation $211,217 Dec-2024 264 $105,627 4 .21 .08 Natural Attenuation $211,217 Dec-2025 276 $102,352 4 .21 .08 Natural Attenuation $211,217 Dec-2026 288 $99,178 4 .21 .08 Natural Attenuation $211,217 Dec-2027 300 $96,103 4 .21 .08 Natural Attenuation $211,217 Dec-2028 312 $93,123 4 .21 .08 Natural Attenuation $211,217 Dec-2029 324 $90,235 4 .21 .08 Natural Attenuation $211,217 Dec-2030 336 $87,437 4 .21 .08 Natural Attenuation $211,217 Dec-2031 348 $84,726 4 .21 .08 Natural Attenuation $236,917 Dec-2032 360 $92,088 4 .21 .08 Natural Attenuation $268,219 Dec-2033 372 $101,023 4 .21 .08 Natural Attenuation $278,926 Dec-2034 384 $101,798 6 .02 .01 Project Management/Support/Administration $1,424 Aug-2034 380 $525 6 .02 .01 Project Management/Support/Administration $1,424 Aug-2035 392 $509 6 .02 .01 Project Management/Support/Administration $1,424 Aug-2036 404 $493 6 .02 .01 Project Management/Support/Administration $1,424 Aug-2037 416 $478 6 .02 .01 Project Management/Support/Administration $1,424 Aug-2038 428 $463 6 .02 .01 Project Management/Support/Administration $1,424 Aug-2039 440 $449
Guide to Computing and Reporting the LCC of EM Projects 50

Phase 2nd 3rd 4th 5th Description Cost Date Month PVC 6 .02 .01 Project Management/Support/Administration $1,424 Aug-2040 452 $435 6 .02 .01 Project Management/Support/Administration $1,424 Aug-2041 464 $421 6 .02 .01 Project Management/Support/Administration $1,424 Aug-2042 476 $408 6 .02 .01 Project Management/Support/Administration $1,424 Aug-2043 488 $396 6 .02 .04 .04 Land Record Management $1,650 Aug-2034 380 $609 6 .02 .04 .04 Land Record Management $1,650 Aug-2035 392 $590 6 .02 .04 .04 Land Record Management $1,650 Aug-2036 404 $571 6 .02 .04 .04 Land Record Management $1,650 Aug-2037 416 $554 6 .02 .04 .04 Land Record Management $1,650 Aug-2038 428 $537 6 .02 .04 .04 Land Record Management $1,650 Aug-2039 440 $520 6 .02 .04 .04 Land Record Management $1,650 Aug-2040 452 $504 6 .02 .04 .04 Land Record Management $1,650 Aug-2041 464 $488 6 .02 .04 .04 Land Record Management $1,650 Aug-2042 476 $473 6 .02 .04 .04 Land Record Management $1,650 Aug-2043 488 $458 6 .02 .04 .05 Transferred Property Restriction $1,584 Aug-2034 380 $584 6 .02 .04 .05 Transferred Property Restriction $1,584 Aug-2035 392 $566 6 .02 .04 .05 Transferred Property Restriction $1,584 Aug-2036 404 $549 6 .02 .04 .05 Transferred Property Restriction $1,584 Aug-2037 416 $532 6 .02 .04 .05 Transferred Property Restriction $1,584 Aug-2038 428 $515 6 .02 .04 .05 Transferred Property Restriction $1,584 Aug-2039 440 $499 6 .02 .04 .05 Transferred Property Restriction $1,584 Aug-2040 452 $484 6 .02 .04 .05 Transferred Property Restriction $1,584 Aug-2041 464 $469 6 .02 .04 .05 Transferred Property Restriction $1,584 Aug-2042 476 $454 6 .02 .04 .05 Transferred Property Restriction $1,584 Aug-2043 488 $440 6 .02 .18 .03 Electronic Records Management $6,258 Aug-2034 380 $2,308 6 .02 .18 .03 Electronic Records Management $6,258 Aug-2035 392 $2,236 6 .02 .18 .03 Electronic Records Management $6,258 Aug-2036 404 $2,167 6 .02 .18 .03 Electronic Records Management $6,258 Aug-2037 416 $2,100 6 .02 .18 .03 Electronic Records Management $6,258 Aug-2038 428 $2,035 6 .02 .18 .03 Electronic Records Management $6,258 Aug-2039 440 $1,972 6 .02 .18 .03 Electronic Records Management $6,258 Aug-2040 452 $1,911 6 .02 .18 .03 Electronic Records Management $6,258 Aug-2041 464 $1,851 6 .02 .18 .03 Electronic Records Management $6,258 Aug-2042 476 $1,794 6 .02 .18 .03 Electronic Records Management $6,258 Aug-2043 488 $1,738 6 .07 .08 Air Monitoring and Sampling $4,752 Aug-2034 380 $1,753 6 .07 .08 Air Monitoring and Sampling $4,752 Aug-2035 392 $1,698
Guide to Computing and Reporting the LCC of EM Projects 51

Phase 2nd 3rd 4th 5th Description Cost Date Month PVC 6 .07 .08 Air Monitoring and Sampling $4,752 Aug-2036 404 $1,646 6 .07 .08 Air Monitoring and Sampling $4,752 Aug-2037 416 $1,595 6 .07 .08 Air Monitoring and Sampling $4,752 Aug-2038 428 $1,545 6 .07 .08 Air Monitoring and Sampling $4,752 Aug-2039 440 $1,497 6 .07 .08 Air Monitoring and Sampling $4,752 Aug-2040 452 $1,451 6 .07 .08 Air Monitoring and Sampling $4,752 Aug-2041 464 $1,406 6 .07 .08 Air Monitoring and Sampling $4,752 Aug-2042 476 $1,362 6 .07 .08 Air Monitoring and Sampling $4,752 Aug-2043 488 $1,320
Total LCC: $8,318,341
Guide to Computing and Reporting the LCC of EM Projects 52

Appendix D: Derivation of the Equation for Discounting Monthly Costs
The monthly discounting method allows for more accurate timing of expenditures.
However, the method assumes that interest is compounded monthly. The discount rates
calculated by the OMB and DOE represent annual rates of return on investment and
cannot be directly used for monthly discounting. The standard equation for finding the
present value of a future expenditure using monthly discounting is:
1=P F * (1 + i /12)mon (1)
The monthly compounding of interest in this equation has the consequence of substituting
a higher effective discount rate than the annual discount rates published by OMB and
DOE.
For example, assume the interest rate is 6 %. With the monthly discounting method, the
monthly interest rate will be 6 %/12, or .5 %. The return on the investment at the end of
the year includes the compounding of interest and is calculated by (1.005)12=1.0617. The
6.17 % rate of return is higher than the annual interest rate of 6 %. Using this monthly
discount rate will underestimate the present value of expenditures.
Because the discount rates used are intended for annual calculations, the monthly
compounding of interest will calculate an inaccurate present value. To take advantage of
the improved timing accuracy of monthly discounting, an alternative method must be
used. The correct monthly interest rate to use is the rate that, when compounded, will
result in the annual discount rate. Assume that moni is the monthly discount rate:
(1 + moni)12 = (1 + i) (1moni = + i)1/12 − 1 (2)
Guide to Computing and Reporting the LCC of EM Projects 53

Using the example above, where the annual interest rate is 6 %, the equivalent monthly
discount rate will be 0.00487. This is lower than the 0.005 monthly rate calculated in
Equation (1) by simply dividing the annual rate by 12.
Equation (2) can be entered into the present value formula in place of the traditional
monthly discount rate, i/12.
1P = * Fmon(1 (1+ + i)1/12 − 1) (3)
1P =(1 + i )mon /12 * F
Equation (3) here, is identical to Equation (3) in Section 5. This version of the present
value equation allows for monthly timing, without incorrectly compounding interest.
Thus, we have the benefit of more accurate monthly timing, while preserving the annual
compounding appropriate to the OMB and DOE annual discount rates.
Guide to Computing and Reporting the LCC of EM Projects 54

Appendix E: Blank Report Forms
2.
Study Period (Years): Discount Rate:
Date of Study: Base Date:
1.
Project Title:
Location (City / ST / Zip):
Project Type (Circle One): RCRA CERCLA X WM D&D
Record of Decision Date:
Analyst: Phone: Email:
Project Description:
Number of Alternatives:
List of Alternatives:
Short Name Description
Alternative A
Alternative B
LCC Parameters
Project Definition
Guide to Computing and Reporting the LCC of EM Projects 55

3. Life-Cycle Costs by Phase and Alternative
Phase Alternative A Alternative B Assessment Studies Design Construction O&M SLTM Total LCC
4. ycle Costs by Alternative
Alternative Total LCC Credit Adjusted Total LCC
Alternative A
Alternative B
Summary Table of Life-C
Guide to Computing and Reporting the LCC of EM Projects 56