guide - · pdf filethe slower driver in blue. ... ctrl+n clear all data ctrl-g start/finish...
TRANSCRIPT

Circuit Tools Software
Guide
Issue 3
28 February 2013

CIRCUIT TOOLS MANUAL
Page | 2 28 February 2013
This page intentionally left blank

CIRCUIT TOOLS MANUAL
Page | 3 28 February 2013
Table of Contents Circuit Tools Software ............................................................................................................................ 1
Quick start ............................................................................................................................................. 4
Ribbon menu ......................................................................................................................................... 7 Ribbon button .....................................................................................................................................................................................7 Load .....................................................................................................................................................................................................7 Load splits ...........................................................................................................................................................................................7 Load circuit overlay .............................................................................................................................................................................7 Start / Finish wizard ............................................................................................................................................................................7 Clear ....................................................................................................................................................................................................7 File transfer wizard..............................................................................................................................................................................7 Quick start ...........................................................................................................................................................................................7 Recent files ..........................................................................................................................................................................................7
Changing Speed and Distance Units ........................................................................................................ 7
Quick access toolbar .............................................................................................................................. 7
Tabbed menus ....................................................................................................................................... 7
Screen Layouts ....................................................................................................................................... 8 Resizing the layout ..............................................................................................................................................................................8
Session window ..................................................................................................................................... 9 Datum.................................................................................................................................................................................................9 Split options ........................................................................................................................................................................................9 Exporting Video (eg. YouTube) ............................................................................................................................................................9 Lap colours ..........................................................................................................................................................................................9 Multiple sessions ...............................................................................................................................................................................10 Changing the order of laps ................................................................................................................................................................10 Rename current session ....................................................................................................................................................................10 Defining Splits ...................................................................................................................................................................................10
Graph window ..................................................................................................................................... 11 Zooming and panning the Graph window ............................................................................................................................................................ 11 Delta-T (Lap-time difference) ............................................................................................................................................................................... 11 Changing the zoom mode in the Graph window .................................................................................................................................................. 11 Lap alignment - Distance Vs Position ................................................................................................................................................................... 12
Data window ....................................................................................................................................... 12 Data window options ........................................................................................................................................................................13
Current ................................................................................................................................................................................................................. 13 Minimum ............................................................................................................................................................................................................. 13 Maximum ............................................................................................................................................................................................................. 13 Range ................................................................................................................................................................................................................... 13 Delta .................................................................................................................................................................................................................... 13 Average ................................................................................................................................................................................................................ 13
Hiding unwanted channels ................................................................................................................................................................13 Available channels .............................................................................................................................................................................13 External inputs ..................................................................................................................................................................................13
Video window ...................................................................................................................................... 14 Video Hotkeys ...................................................................................................................................................................................14
Track window ...................................................................................................................................... 14 Zooming and panning in the track window .......................................................................................................................................15
Load Circuit overlay .............................................................................................................................. 15
G-G Plot window .................................................................................................................................. 15
Locating the Circuit Tools Version ......................................................................................................... 15
Troubleshooting ................................................................................................................................... 16

CIRCUIT TOOLS MANUAL
Page | 4 28 February 2013
Introduction Circuit Tools software is a data-analysis package designed for Racelogic GPS data-loggers, including VBOX, Video VBOX, VBOX Sport, DriftBox and PerformanceBox. The software is designed to automate many tasks and quickly present a driver with the crucial information required to improve lap-times. The software is designed by racing drivers, for racing drivers, with none of the complexity normally associated with analysis software which is often aimed at experienced race engineers. The software can work with or without video, but this manual will assume you are using video as this is the most effective way of analysing circuit performance.
Quick start The first operation is to copy your data files from the SD card to a folder on your computer. This is essential if you are using video, as it will speed up the operation of the software. If your video files are large, then you may want to consider using the fastest SD card you can get and a USB 3.0 reader (make sure your laptop has USB 3.0).
To make this process easier, there is a File Transfer Wizard, press F2 when the application is running or click “Copy all files from SD card” on the start up screen. The wizard will automatically detect and analyse your SD card to work out which track you are on using the pre-installed database. It will then automatically name the folder using the circuit name and create a numbered session sub-directory. At this point you can rename the session to something suitable (eg. Qualifying). Click Move (or M key) to move the files across and erase the SD card, or Copy (or C key) to leave them on the card. When the file transfer ends, the File Open screen will appear (you will also be able to bring up the File Open screen later using F3 key). In this screen you will see any stored session information, a preview of the video, the length of the file, the number of laps and the fastest lap in that file. This allows you to quickly select the files you wish to analyse. To select multiple files, hold down the CTRL key whilst selecting. You can also use this screen to rename the file to something more useful. Using this method renames both the VBO data file and the AVI Video file in the correct way so that they remain associated. Manual editing of filenames is not recommended. When the files are opened, the circuit is automatically detected from a database of ~400 worldwide tracks using the GPS position contained within the data. If there are multiple layouts, then the length of a lap is used to select the correct version. However, if the circuit does not exist in the database, then the Start / Finish Wizard will appear. To define the Start / Finish line simply click on the chosen point on the track. The splits are generated automatically either at the braking point at the end of a straight, or they can be set manually using the right hand mouse button. To continue press ‘Y’ or click Yes.
Start / Finish wizard
File Open screen with preview
File open with preview
File Transfer Wizard (F2)

CIRCUIT TOOLS MANUAL
Page | 5 28 February 2013
The screen will default to the following layout: This is the main analysis screen, which initially presents you with the fastest lap of each driver, synchronised to circuit position. The speed and lap time difference (Delta-T time) are shown on the graph. The quicker driver is shown in red, the slower driver in blue. As you move the cursor on the graph window by clicking with the mouse, the videos jump to the corresponding track position. Press the Spacebar or Enter to start and stop the video.
Important Hotkeys F2 File Transfer Wizard F3 Load new file(s) F4 Default analysis screen F5 Full screen video F11 Circuit plot (Hold shift down for quick preview) Graph Zoom In Left click and drag from left to right →
Graph Zoom out Left click and drag from right to left ←
Graph Pan Right click and drag ←→
Other useful keys Graph Up arrow ↑ Zoom in Down arrow ↓ Zoom out Left arrow ← Cursor left Right arrow → Cursor right R Toggle menu ribbon H Switch to Home tab CTRL+N Clear all data CTRL-G Start/Finish wizard F6 Graph + Data F7 All windows F8 Video + Graph F9 Full screen Graph F10 Full screen session window F12 Session + Track + Video + Data + (main keyboard) Increase video playback speed - (main keyboard) Decrease video playback speed
Main analysis screen (F4)

CIRCUIT TOOLS MANUAL
Page | 6 28 February 2013
The art of Going Faster Circuit Tools and Video VBOX exist to help you to go faster, so what is the best way to go about this? By far the most effective way is to get someone quicker to drive your car for a few laps and then compare data. There are a number of professional driver coaches who already use Video VBOX who would be more than happy to help out. There is an updated list of recommended coaches here: www.vboxmotorsport.co.uk/driverCoaches Once you have the data of the faster driver, load both files into the software using the F3 key. Then examine the Delta-T channel (in blue beneath the speed traces) and look for a big change in lap-time. When Delta-T increases, time is being lost, and when it decreases, time is being gained. Have a look at the example on the right which Is zoomed into a section of the track where there was a large change in Delta-T, which was worth around 1s in lap time. By zooming in to this section (use the mouse to click and drag a zoom box) you can analyse what is happening by comparing the speed traces: (1) The slower driver (blue trace) brakes earlier and lighter for the corner, this loses 0.15s in the braking zone. (2) Then the faster driver (red trace) uses more throttle on the exit of the corner and around the following left hander, gaining another 0.25s. (3) The faster driver brakes later and harder, gaining another 0.5s. By making these simple changes, the slower driver could have gained 0.9s in these two corners. The next stage would be to watch the videos side by side in slow motion, to watch the lines taken by each driver. It is often useful to check the position of the car relative to the kerbs on the entry, apex and exit of the corner. Move the video one GPS sample at a time by holding down the ALT key and using the right or left arrow keys. Typical areas in which to concentrate are:
Are you braking at the same place as the faster driver?
Are you braking hard enough?
Are you using the very edge of track as you turn in?
Are you using as much kerb as the faster driver?
What is your apex speed compared with the faster driver?
Are you using all of the track on the exit of the corner? We have written a comprehensive ebook with tips and tricks on going faster using Video VBOX, it is available for free here: http://www.vboxmotorsport.co.uk/ebook
Good luck!!
Quicker driver (red outline) using more kerb and more speed
Zoomed in graph showing 3 critical points

CIRCUIT TOOLS MANUAL
Page | 7 28 February 2013
Ribbon menu The main Circuit Tools interface is a ‘Ribbon’ style Menu and consists of a main Ribbon button to access the main menu, a Quick access toolbar, and the different Tabbed menu items. The visibility of the Ribbon menu can be toggled using the R key or the Quick access button on the toolbar. Hiding the menu gives you more room to analyse the data on smaller screens
Ribbon button Clicking the Ribbon button brings up a number of options:
Load Load File (F3 shortcut)
Load splits Load user defined split file
Load circuit overlay Load circuit overlay file
Start / Finish wizard Manually set the Start / Finish
Clear Clear all data (CTRL-N shortcut)
File transfer wizard Copy files and rename them (F2)
Quick start Opens Quick Start Video
Recent files Links to the last files used
Changing Speed and Distance Units To change units of Speed, Distance or Acceleration, use the Units menu in the Home tab.
Quick access toolbar This is located in the top left corner of the screen.
Tabbed menus There are different menu tabs for each of the main windows, Home, Session, Graph Video, Track, G-G Plot and Data. These will change automatically when you click on one of the windows, and will contain relevant functions and settings for that particular window.
Tip - If you hover the mouse over any buttons, a text
box showing helpful hints will appear giving more explanation about the function of that button.
CIRCUIT TOOLS MANUAL
Page | 8 28 February 2013
Screen Layouts
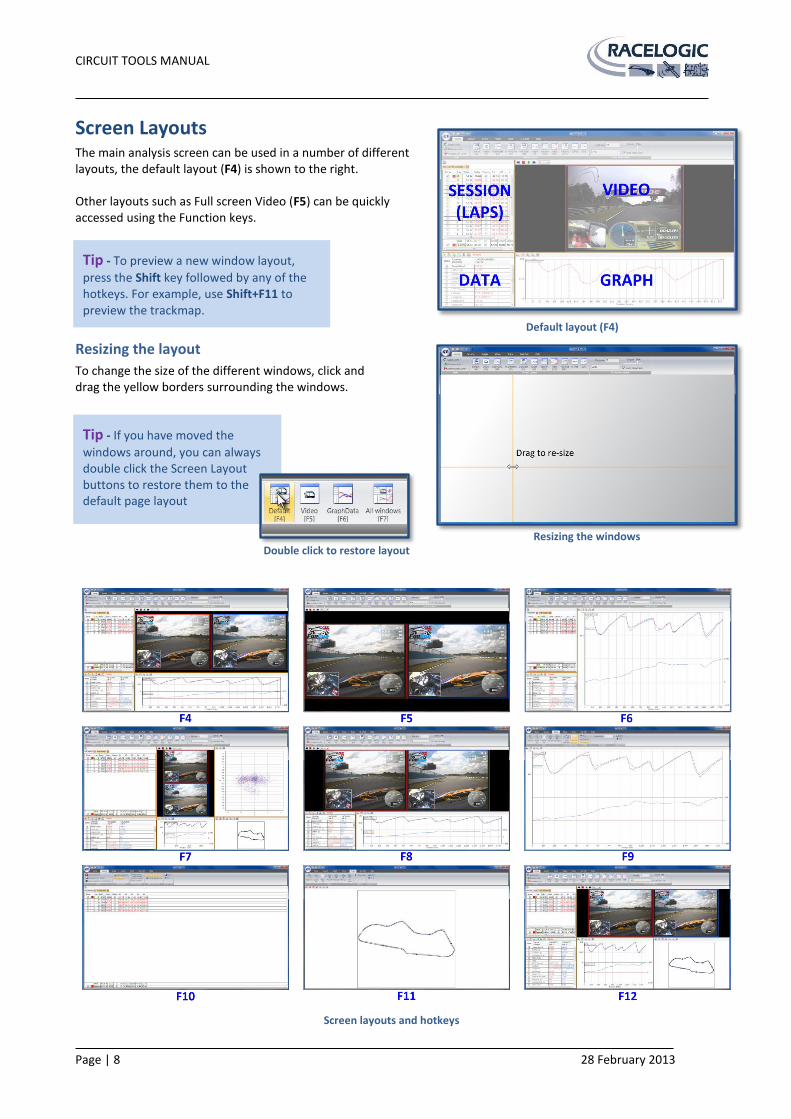
The main analysis screen can be used in a number of different layouts, the default layout (F4) is shown to the right. Other layouts such as Full screen Video (F5) can be quickly accessed using the Function keys.
Resizing the layout
To change the size of the different windows, click and drag the yellow borders surrounding the windows.
Default layout (F4)
Tip - To preview a new window layout,
press the Shift key followed by any of the hotkeys. For example, use Shift+F11 to preview the trackmap.
Tip - If you have moved the
windows around, you can always double click the Screen Layout buttons to restore them to the default page layout
Resizing the windows
Double click to restore layout
Screen layouts and hotkeys

CIRCUIT TOOLS MANUAL
Page | 9 28 February 2013
Session window The session window contains all of the laps from a single file, defined using the Start / Finish line, which was either contained in the file, or has been defined using the Start / Finish Wizard.
The Start / Finish Wizard can be opened using the Quick access button, or by using CTRL-G or from the Ribbon button.
You can toggle the visibility of laps (up to a maximum of six) using the Show tick boxes in the column on the left hand side.
Datum
The fastest lap of all sessions by default is picked as the reference or ‘Datum lap’, but this can be changed using the tick boxes in the Datum column. All splits, lap-times comparisons and Delta-T are made relative to the Datum lap.
Split options
There are two display options; Split to Split where a split time starts from the previous split, or Start to Split where each Split is measured from the Start of the lap. Splits faster than the Datum lap are coloured Green, Splits slower are coloured Red. To display just the split data split in the graph, click on the split time, to revert to the full lap, click on the lap-time.
Exporting Video (e.g. YouTube)
You can export a single lap by using the Export Video from Current Session Function which is in the Session menu tab: The video file containing the single lap is saved into the same directory as the Session data containing that lap. Video VBOX video files will play natively in YouTube, Windows Media Player and VLC.
Lap colours
If Auto Colour laps is enabled, then the fastest lap will always be displayed in red on the graph. To manually change the colour, switch off this feature and double click the coloured box alongside the Lap Number.
Exporting Video
CIRCUIT TOOLS MANUAL
Page | 10 28 February 2013
Multiple sessions
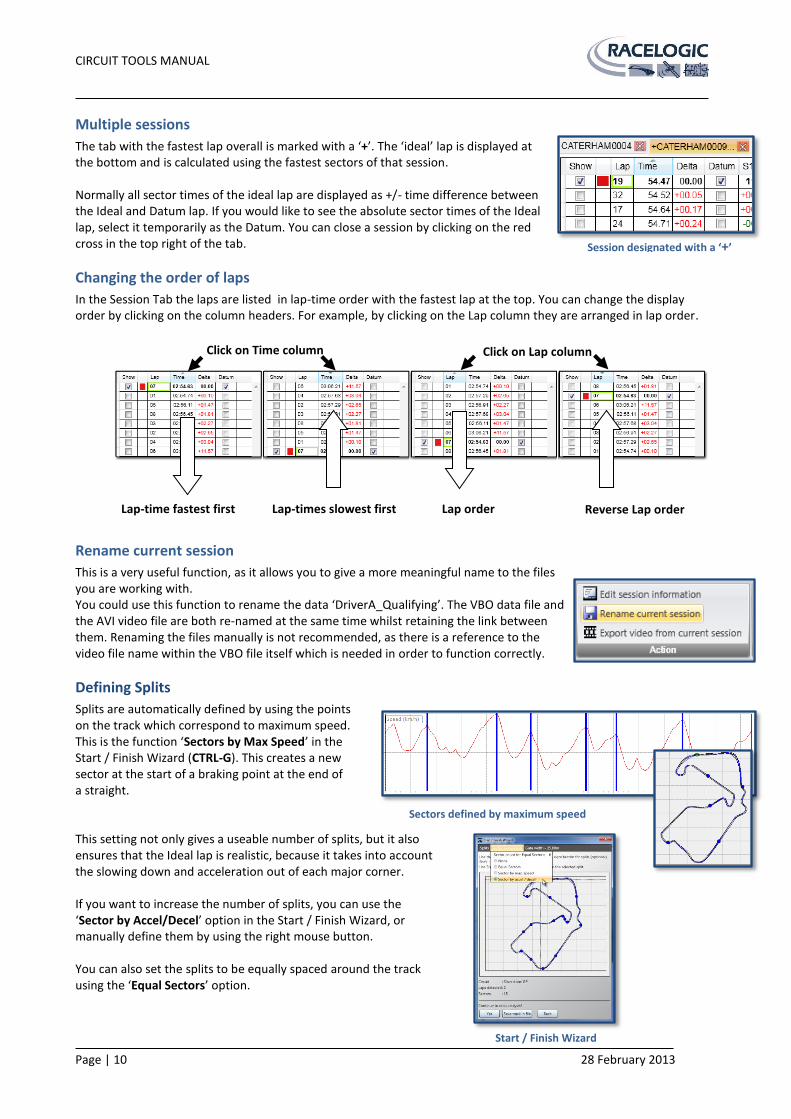
The tab with the fastest lap overall is marked with a ‘+’. The ‘ideal’ lap is displayed at the bottom and is calculated using the fastest sectors of that session. Normally all sector times of the ideal lap are displayed as +/- time difference between the Ideal and Datum lap. If you would like to see the absolute sector times of the Ideal lap, select it temporarily as the Datum. You can close a session by clicking on the red cross in the top right of the tab.
Changing the order of laps
In the Session Tab the laps are listed in lap-time order with the fastest lap at the top. You can change the display order by clicking on the column headers. For example, by clicking on the Lap column they are arranged in lap order.
Rename current session
This is a very useful function, as it allows you to give a more meaningful name to the files you are working with. You could use this function to rename the data ‘DriverA_Qualifying’. The VBO data file and the AVI video file are both re-named at the same time whilst retaining the link between them. Renaming the files manually is not recommended, as there is a reference to the video file name within the VBO file itself which is needed in order to function correctly.
Defining Splits
Splits are automatically defined by using the points on the track which correspond to maximum speed. This is the function ‘Sectors by Max Speed’ in the Start / Finish Wizard (CTRL-G). This creates a new sector at the start of a braking point at the end of a straight. This setting not only gives a useable number of splits, but it also ensures that the Ideal lap is realistic, because it takes into account the slowing down and acceleration out of each major corner. If you want to increase the number of splits, you can use the ‘Sector by Accel/Decel’ option in the Start / Finish Wizard, or manually define them by using the right mouse button. You can also set the splits to be equally spaced around the track using the ‘Equal Sectors’ option.
Click on Time column
Lap-time fastest first Lap-times slowest first Lap order
Click on Lap column
Reverse Lap order
Session designated with a ‘+’
Sectors defined by maximum speed
Start / Finish Wizard

CIRCUIT TOOLS MANUAL
Page | 11 28 February 2013
Graph window The graph window shows the logged channels in the form of a plot against distance, time or position. The speed channel is normally shown at the top. The value of the channel at the cursor position is shown in the Data window. The data traces and channel values both use the same colour. By default the faster lap has a red trace.
Zooming and panning the Graph window
The quickest way to zoom in the Graph Window is to draw a zoom box with the left hand mouse button from the left to the right. To zoom out, simply draw a box from the right to the left. You can also use the up and down arrow keys. To pan, use the right hand mouse button and drag the graph either way, or use CTRL and the cursor keys. There are also buttons on the menu tab and just above the graph.
Delta-T (Lap-time difference)
By far the most useful parameter for comparing Laps is the Delta-T channel. Delta-T is the running lap-time difference between two laps and gives a very clear indication of where time is lost or gained around the circuit. When the Delta-T is increasing, time is being lost, and when it is decreasing, time is being gained. At first, look for the largest changes in Delta-T and concentrate on these areas. Sometimes, in a corner there may be a large gain followed by a large loss. This often happens when you enter a corner faster, but exit more slowly. It is often surprising how much time you lose down the straight by exiting a corner a little bit slower than before.
Changing the zoom mode in the Graph window
By default the zoom only affects the X-axis, this can be changed by using the buttons in the Graph Ribbon menu. By allowing zoom in both axes you can magnify the graph in more detail.
Tip – By zooming into a section, the Delta-T is reset to
zero for the start of that section, making it easier for you to analyse a local area of the track.
Buttons for zooming and panning
F6 layout with Delta-T
Graph window

CIRCUIT TOOLS MANUAL
Page | 12 28 February 2013
Lap alignment - Distance vs. Position
There are three ways of aligning comparison data: Time, Distance and Position. Position is the Default X axis and this is the method recommended for comparing two different laps. Time and distance are only used in special circumstances. Traditionally, rolling distance has been used to align laps, but with the advent of GPS, it is better to use GPS position, as the distance travelled around a lap varies from lap to lap depending on the driving line. The position remains more accurate, as the error in GPS is much less than the variation in rolling distance (often >30m). A comparison of this effect can be seen below from two different professional drivers at the Nordschleife during a race. The first plot uses the rolling distance to compare the two drivers, and the second uses GPS position. In the first plot they have both travelled exactly 19785m from the Start / Finish line, but are now 186m apart! In the second plot the GPS position of each vehicle is used to align the traces, and here you can see how closely they now line up.
Using GPS Position alignment also makes the Delta-T value very accurate, which makes the values meaningful even around the Nordschleife, where a Delta-T or predictive lap-timer based on distance would only be accurate to around 1-2s after a full lap. Using Position, the Delta-T and Racelogic Predictive Lap-Timer are accurate to within 0.02s around the full length of the Nordschleife!
Note: Graphing using this method relies on good GPS position data. If you lose GPS position or you have heavy tree cover, then it is best to switch back to distance or even Time. If you leave the track, or cut out a part of the circuit, then again you will get a very poor position based comparison or you may even be unable to play the video or move the graph cursor beyond the point where you left the circuit if a poor datum is used.
Data window The Data window displays the values of the channels which have been logged at the position of the graph cursor. By default, Speed and Delta-T are displayed. Each parameter can be toggled on or off using the tick box in the Show column. Up to 12 channels can be displayed at the same time. By default the current values of the channels are displayed, but these can be changed to Minimum, Maximum, Range, Delta or Average, using the Quick buttons or the Data menu tab: As an example, if the Minimum Function is chosen, the values now show the minimum values displayed in the current graph window.
Distance alignment
Position alignment
Position alignment
Using Position to align laps
Minimum function enabled in Data Window

CIRCUIT TOOLS MANUAL
Page | 13 28 February 2013
The channels which are not enabled are shown as transparent. The transparency can be changed under Opacity in the Home tab. You can also change the size and type of Font used to display the channel values in the same place.
Data window options
Current Current value at the cursor
Minimum Lowest value on the displayed graph
Maximum Highest value on the displayed graph
Range Difference between the maximum and minimum on the displayed graph
Delta Difference between the first point and last point on the displayed graph
Average Average of all points on the graph (at current zoom level)
Hiding unwanted channels
All channels are shown in the grid by default, but the ones currently not displayed in the Graph window are shown in a light colour. You can choose to show just the displayed channels, hiding the non-displayed items, using the Selected channels only button in the Display section of the Data tabbed menu.
Available channels
Speed (km/h) GPS Speed over ground LatAcc (g) Lateral acceleration (cornering g-force) LongAcc (g) Longitudinal acceleration (accel/braking g-force) Delta-T (s) Lap-time difference between two laps Sats Number of satellites being tracked UTC time (s) Co-ordinated Universal Time Latitude Latitude position in degrees and minutes Longitude Longitude position in degrees and minutes Heading (°) Vehicle heading in degrees Height (m) Height Vertical vel (km/h) Vertical velocity Distance (m) Rolling distance travelled since start of lap Elapsed time (s) Elapsed time since start of lap
External inputs
Most VBOXs are capable of logging additional channels; there are a number of different options available, the Mini-Input Module (8 analogue, 2 digital, 1 rpm), the Micro-input Module (4 analogue 1 rpm), or you can log vehicle parameters directly from the CAN bus (depending on Make, Model and Year). If logged, these additional channels will then appear in the Data window automatically, and can be displayed on the graph in the same way as all of the other channels.
Mini Input Module
Micro Input Module
CIRCUIT TOOLS MANUAL
Page | 14 28 February 2013
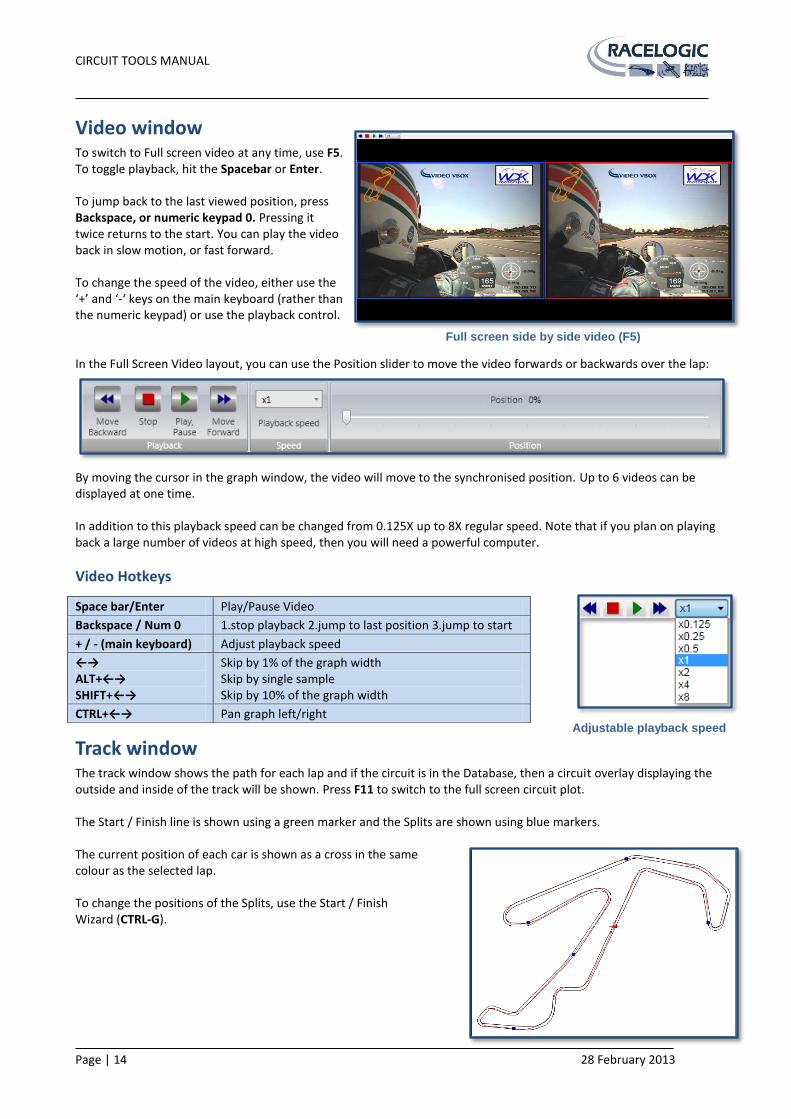
Video window To switch to Full screen video at any time, use F5. To toggle playback, hit the Spacebar or Enter. To jump back to the last viewed position, press Backspace, or numeric keypad 0. Pressing it twice returns to the start. You can play the video back in slow motion, or fast forward. To change the speed of the video, either use the ‘+’ and ‘-‘ keys on the main keyboard (rather than the numeric keypad) or use the playback control. In the Full Screen Video layout, you can use the Position slider to move the video forwards or backwards over the lap: By moving the cursor in the graph window, the video will move to the synchronised position. Up to 6 videos can be displayed at one time. In addition to this playback speed can be changed from 0.125X up to 8X regular speed. Note that if you plan on playing back a large number of videos at high speed, then you will need a powerful computer.
Video Hotkeys
Track window The track window shows the path for each lap and if the circuit is in the Database, then a circuit overlay displaying the outside and inside of the track will be shown. Press F11 to switch to the full screen circuit plot. The Start / Finish line is shown using a green marker and the Splits are shown using blue markers. The current position of each car is shown as a cross in the same colour as the selected lap. To change the positions of the Splits, use the Start / Finish Wizard (CTRL-G).
Space bar/Enter Play/Pause Video
Backspace / Num 0 1.stop playback 2.jump to last position 3.jump to start
+ / - (main keyboard) Adjust playback speed
←→ ALT+←→ SHIFT+←→
Skip by 1% of the graph width Skip by single sample Skip by 10% of the graph width
CTRL+←→ Pan graph left/right
Full screen side by side video (F5)
Adjustable playback speed
CIRCUIT TOOLS MANUAL
Page | 15 28 February 2013
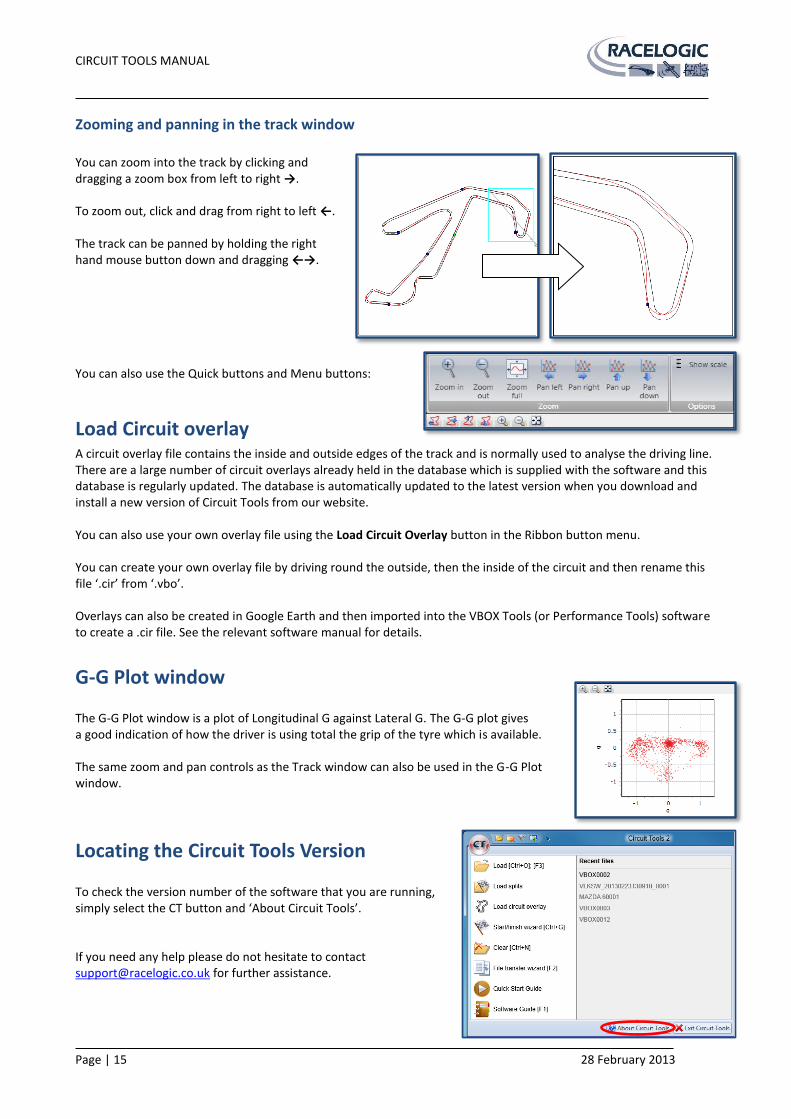
Zooming and panning in the track window
You can zoom into the track by clicking and dragging a zoom box from left to right →. To zoom out, click and drag from right to left ←. The track can be panned by holding the right hand mouse button down and dragging ←→. You can also use the Quick buttons and Menu buttons:
Load Circuit overlay A circuit overlay file contains the inside and outside edges of the track and is normally used to analyse the driving line. There are a large number of circuit overlays already held in the database which is supplied with the software and this database is regularly updated. The database is automatically updated to the latest version when you download and install a new version of Circuit Tools from our website. You can also use your own overlay file using the Load Circuit Overlay button in the Ribbon button menu. You can create your own overlay file by driving round the outside, then the inside of the circuit and then rename this file ‘.cir’ from ‘.vbo’. Overlays can also be created in Google Earth and then imported into the VBOX Tools (or Performance Tools) software to create a .cir file. See the relevant software manual for details.
G-G Plot window The G-G Plot window is a plot of Longitudinal G against Lateral G. The G-G plot gives a good indication of how the driver is using total the grip of the tyre which is available. The same zoom and pan controls as the Track window can also be used in the G-G Plot window.
Locating the Circuit Tools Version To check the version number of the software that you are running, simply select the CT button and ‘About Circuit Tools’. If you need any help please do not hesitate to contact [email protected] for further assistance.

CIRCUIT TOOLS MANUAL
Page | 16 28 February 2013
Troubleshooting The video can't be played and the graph cursor can't be moved: - If changing the X axis mode to ‘Time’ allows the video to play correctly, but when setting it to ‘Distance’ it does
not, this indicates there may be no valid GPS data in the file, or the vehicle was only stationary while logging. - If the driver left the track while the unit was recording (e.g. drove through the pit lanes, spun off the circuit),
make sure that a lap containing this extra data is not selected as the datum, or, switch the X axis mode to Distance or Time.
- If the video will play when ‘Show whole file’ is selected, but doesn't in ‘Show laps’ mode, open the Start/Finish
Wizard and make sure a correct start/finish line is selected. Also, try selecting a different datum lap in case of any data error in the currently selected one.
The whole file is displayed, but not the list of individual laps: - Open the Start/Finish Wizard and make sure a Start/Finish line is present (this is displayed as a green dot on the
track). - Make sure the Start/Finish line is defined within the width of the circuit, not outside, in the pit lane, for example.
Zoom in around the Start/Finish line using the left hand mouse button, to see the area in more detail.
Sector times in the Session window are wrong: - Go to the Session tab in the Ribbon menu and make sure the correct split format is selected: ‘Split to split format’
or ‘Start to split format’.
Values displayed in the Data window are wrong: - Go to the Data tab of the Ribbon and select ‘Current’ as the data format. - Go to the Home tab and make sure the correct units are used.