guidance on evaluating the impact of interventions on business · pdf filegeneralisability of...
TRANSCRIPT

GUIDANCE ON EVALUATING THE IMPACT OF INTERVENTIONS ON BUSINESS
AUGUST 2011

Acknowledgements
This guidance has been prepared by Natalia Chivite-Matthews, Statistical Analysis (BIS), in collaboration with Phil Thornton from Clarity Economics. We would also like to thank the members of the advisory group in BIS who contributed their knowledge and expertise to this project and Helen Bewley, John Forth and Alex Bryson from The National Institute of Economic and Social Research (NIESR) who provided comments on the draft report.
i

Issues for a successful impact evaluation
Establish to what extent the outcomes observed are the result of (caused by) an intervention, or would have happened anyway.
Aim of impact evaluation
Define these elements as thoroughly as possible:
1. Aims and objectives of the intervention
2. Group or population to be targeted
3. Mechanism through which the objectives will be achieved
4. Feasible impact evaluation models
5. Final assessment including budget, timetable, ethical considerations and likely impact of the evaluation
Five stages for selecting an evaluation
design
An essential device to develop an evaluation design for an intervention by dividing the process into:
Inputs – Activities – Outputs - Interim outcomes - Final outcomes/impact
Logic models
Principle #1: Measurement of the counterfactual and capability of proving causality. The counterfactual is the most likely outcome in the absence of the intervention. Successful impact evaluations will be judged by their capability of proving causality, measuring the counterfactual and therefore estimate impact. Analysts need to understand difference between causation and association (see section 1.4.)
Principle #2: Evaluation results must be ‘robust’:
They must be valid - measuring what was intended to be measured; and,
They must be reliable - repeated measures produce consistent results.
Two essential principles behind a
successful impact
evaluation
ii

Randomised control trial or experimental design: most capable of estimating impact. This uses before and after measures; a treatment group and control group; and, random assignment for the treatment and control groups.
Stronger quasi-experimental models are also capable of measuring impact.
Weaker models: These make it harder to be certain of the causal link between the intervention and the outcome. Models able to measure outcomes but not necessarily impact. Some are able to establish association and correlation between the intervention and the outcome but not causation.
Choice of evaluation
model
Sources of data
Good administrative data is key to a successful evaluation.
Survey methodology is highly technical so an experienced analyst on all stages of survey methodology should be consulted throughout the whole survey process, from inception to reporting.
The report should contain a clear and transparent methodology section. An audit trail of the methodologies used and assessment of their validity and reliability.
Writing and disseminating the report on the evaluation are vital parts of the process of ensuring that lessons are learned from past interventions to inform future decision-making.
The report
Transparency and clarity over how the costs and benefits of an intervention are calculated are key to ensure that comparisons can be made over time and in some cases across interventions.
Cost Benefit Analysis
These include: spurious accuracy; claims of causality when only associations are observed; challenges to validity and reliability. Threats are often related to budget, timetable, ethical and practical considerations.
Evaluators must be open at all times to the possible weaknesses of the methodology used from the outset.
Threats
iii

Outcome based evaluations: Relationships among evaluation model, validity, assumptions regarding comparability and generalisability of results and whether capable of impact or just outcome measurement Certainty/ validity
Precision/ validity
Evaluation Model
Comparability/ reliability
Generalisability/ reliability
Impact or just outcome
High High Randomised Control Trial (experimental/control) Few assumptions
High Impact
Non-equivalent match comparison group design
Non-equivalent comparison group design: Hypothetical comparison group
Multiple time series design: longitudinal comparisons
Separate-sample pre-test/ post-test design
Just outcome
Post-test-only control group design
Static group comparison
Low Low Pre-experimental designs
Many assumptions
Low
Source: adapted from Schalock R (1995) Outcome-based Evaluat ion Note: Simplif ied version of basic characterist ics of the models. A fuller list of the challenges to validity and reliability and how these can enter the evaluat ion at each stage of the evaluat ion process can be found in Chapter 6.
iv

Table of contents
Issues for a successful impact evaluation ................................................................. ii
Table of contents..................................................................................................... v
Overview................................................................................................................. 1
Chapter 1. Evaluation: a quick overview................................................................... 2 1.1 Learning objectives ..................................................................................................... 2 1.2 Introduction ................................................................................................................ 2 1.3 What is impact evaluation? ........................................................................................ 3 1.4 Establishing the counterfactual ........................................................................... 3 1.5 Business as the unit of evaluation ....................................................................... 4 1.6 Distinction between evaluation and appraisal and monitoring ................................. 5 1.7 Distinction between outcome, impact and process evaluation ................................. 6 1.8 Key messages from this chapter ................................................................................. 7
Chapter 2. Initial steps before selecting evaluation methods .................................... 8 2.1 Learning objectives .............................................................................................. 8 2.2 Making aims and objectives of a policy or programme measurable.......................... 8 2.3 Logic models ............................................................................................................... 9 2.4 The distinction between output, outcome and impact............................................ 10 2.5 Five‐stage process to scope the feasible evaluation models.................................... 10 2.6 Anticipating a large number of outcomes ................................................................ 13 2.7 Links with the BIS Economic Appraisal Checklist ...................................................... 13 2.8 Key messages from this chapter ............................................................................... 14
Chapter 3. Core principles behind evaluation ......................................................... 15 3.1 Learning objectives ................................................................................................... 15 3.2 Introduction .............................................................................................................. 15 3.3 Core policy elements to enable an impact evaluation ............................................. 15 3.4 Other key considerations on the decision to evaluate............................................. 18 3.5 Two essential principles behind a successful impact evaluation.............................. 21 3.6 Principle 1: The counterfactual: the greatest challenge to impact evaluation ...... 21 3.8 Key messages from this chapter ............................................................................... 23
Chapter 4. Selecting the most suitable evaluation design ....................................... 24 4.1 Learning objectives ................................................................................................... 24 4.2 Introduction .............................................................................................................. 24 4.3 First steps in identifying an evaluation model that is feasible in a given policy context ............................................................................................................................ 25 4.4 Randomised Control Trial (RCT) or true experimental design: the gold standard for measuring causality and the counterfactual .................................................................. 26 4.5 Quasi‐experimental designs ..................................................................................... 29 4.6 Weaker quasi‐experimental designs ........................................................................ 33 4.7 Pre‐experimental designs ......................................................................................... 36 4.8 Note on statistical techniques .................................................................................. 38 For matching treatment and control group can use: propensity score matching, nearest neighbour, matching by profile characteristics. ............................................................. 38 4.9 Key lessons from this chapter................................................................................... 39
v

Chapter 5. Primary data collection methods and ‘business’ as the unit of analysis .. 40 5.1 Learning objectives ................................................................................................... 40 5.2 Introduction .............................................................................................................. 40 5.3 Use of existing data................................................................................................... 41 5.4 Data collection .......................................................................................................... 41 5.5 Available administrative data ................................................................................... 43 5.6 Matching and linking ................................................................................................ 45 5.7 Business as the unit of analysis in surveys: areas that make business particularly hard to survey................................................................................................................. 45 5.8 Self assessment studies ............................................................................................ 49 5.9 Key messages from this chapter ............................................................................... 51
Chapter 6. Risks to a successful impact evaluation ................................................. 52 6.1 Learning objectives ................................................................................................... 52 6.2 Introduction .............................................................................................................. 52 6.3 Principle #1: Capability of proving causality ............................................................. 53 6.4 Principle # 2: Robustness and threats to validity and reliability............................... 53 6.5 Errors and biases relating to data collection ............................................................ 58 6.6 Direct, indirect or secondary outcomes ................................................................... 59 6.7 Unit of analysis.......................................................................................................... 60 6.8 Time period............................................................................................................... 61 6.9 Spurious accuracy: the biggest challenge to any evaluation.................................... 61 6.10 Triangulation........................................................................................................... 63 6.11 Key messages from this chapter ............................................................................. 63
Chapter 7. Cost benefit analysis and the green book .............................................. 64 7.1 Learning objectives ................................................................................................... 64 7.2 Introduction .............................................................................................................. 64 7.3 Definition of Costs and Benefits ............................................................................... 65 7.5 Estimating additionality, deadweight, displacement and spillovers ........................ 66 7.6 Identifying transfers and assessing distributional impacts ............................... 68 7.7 Calculating costs and benefits in case of foreign ownership.................................... 68 7.9 Comparability across policies and the language of ‘benefits’ .................................. 69 7.10 Key messages from this chapter ............................................................................. 70
Chapter 8. Report writing and dissemination ......................................................... 71 8.1 Learning objectives ................................................................................................... 71 8.2 Introduction .............................................................................................................. 71 8.3 Analysis of evaluation exercise ................................................................................. 72 8.4 Contents of evaluation report .................................................................................. 72 8.5 Need for a transparent and clear methodology section .......................................... 73 8.6 Dissemination ........................................................................................................... 74 8.7 Key messages from this chapter ............................................................................... 75
Further reading ..................................................................................................... 80 1. Key government documents to complement this guidance....................................... 80 2. Evaluation methodology and difference between causation and association........... 80 3. Survey methodology................................................................................................... 81 4. Introduction to basic statistics correlations and measures of difference .................. 81 5. Beneficiaries self‐assessment to measure economic impact ..................................... 82 6. Quasi ‐experiment ...................................................................................................... 82 7. Statistical approaches used for matching treatment and comparison groups .......... 82 8. Statistical approaches used to measure before and after differences and impact.... 83
vi

vii
9. Error: Reliability and Validity issues............................................................................ 85 10. Measuring cost effectiveness of interventions and economic impact..................... 85 11. Other references in the text ..................................................................................... 86

Overview This report provides a practical guide to impact evaluation. It complements the HM Treasury Green Book, which provides a detailed guide to the use of appraisal to inform policy design and the Magenta Book, which focuses mostly on evaluation methods for policies and programmes that affect individuals and provides detailed information on specific evaluation methods.
The unit of analysis in this publication is primarily ‘the business’ or ‘firm’ level rather than the ‘individual’ level. It is therefore particularly relevant to readers seeking to learn about evaluations of policies and programmes where the business community is the target group or beneficiary.
Although the target audience can be anyone interested in impact evaluation, it was primarily developed as an internal guide for those in the Department that have little or no knowledge of evaluation methodologies and are given the task of setting up an evaluation strategy for a policy or programme.
The report aims to take evaluators through the main concepts they need to consider when deciding whether and then how to carry out an evaluation and which methods to use. These areas are:
The rationale for evaluation
Ensuring that aims and objectives are measurable
Understanding ‘robustness’
Selection of evaluation design
The risks to a successful evaluation
Data collection
Ensuring consistency with government-wide evaluation guidance in the Treasury Green Book
1

Chapter 1. Evaluation: a quick overview
1.1 Learning objectives
Upon completing this chapter, you should be able to understand the following:
The aims of BIS interventions
The definition and purpose of evaluation
The importance of cause and effect and the definition of causality
The concept of the counterfactual
The distinction between outcome, impact and process evaluations
The distinction between appraisal and evaluation
1.2 Introduction
A large number of the interventions by the Department for Business, Innovation and Skills (BIS) have a direct impact on businesses. For example, regulations can further the public interest while business support can help to achieve outcomes that the market would not achieve on its own.
BIS interventions (including programmes, policies and projects) aim to have a net positive impact on productivity and the economy by addressing systematic market failures or achieving more equitable solutions. The Department has a rolling programme of monitoring and evaluation in place to establish whether interventions are successful in addressing market failures or whether the supposed effect would have happened anyway, with the ultimate objective of improving subsequent policy decisions.
This guide will help evaluators through the five key stages in an evaluation:
Decision to undertake an evaluation
Production of an evaluation plan
Setting out the business case for an evaluation and gaining approval
Implementation of the evaluation
Analysis and dissemination of the results
2

1.3 What is impact evaluation?
According to the Magenta Book, evaluation is an objective process of understanding how a policy or other intervention was implemented, what effects it had, for whom, how and why. Impact evaluation is a specific type of evaluation structured or designed to answer the question of whether the outcomes observed were the result of the intervention or whether the observed outcomes would have happened anyway. It measures the degree by which the change in the outcome is attributable to the intervention. It aims to understand the impact of an intervention or “treatment” - a policy, programme, or initiative - on the treated population. In its most basic form an evaluation aims to answer just one question: did an intervention have the desired impact on the target business population?
Undertaking the impact evaluations helps BIS to determine overall impact, but evaluations more broadly also help to understand how the intervention worked for whom and why, and whether there were any unexpected benefits or problems. This is distinct from an assessment of the merit or worth of the intervention, which is an issue for policymakers. However evaluations can help policymakers see whether the intervention was worthwhile and delivered value for money. This then enables policymakers to decide whether to continue, expand or withdraw an intervention.
1.4 Establishing the counterfactual
In Government, the main reason for doing an impact evaluation is to test a hypothesis that one policy, programme or initiative causes the desired change or aim. Thus all evaluations possess certain requirements that permit inferences about cause and effect, or causation. These inferences about cause vary in their strength depending on the evaluation methodology used.
Box 1: Causation and correlation
An important distinction to keep in mind is between causation and correlation. An action that can cause another (such as smoking causes lung cancer) is seen as causation because one has been proved to cause another by using epidemiological research or controlled trials. On the other hand two actions or occurrences that are commonly seen together (people who suffer from alcoholism are often smokers) are said to be correlated. While smoking and drinking are correlated, this does not mean that one causes the other. Within the context of this report, evaluations are looking to establish causation. In general it is extremely difficult to establish causality between two correlated events. The most effective way of doing this is through a controlled study as set out in section 4.4. For more detail please read this academic explanatory note1.
1 What is the difference between causation and correlation? STATS at George Mason University. http://stats.org/in_depth/faq/causation_correlation.htm
3

It allows us to compare outcomes against an estimate of what would have happened had the policy not been implemented. This is known as the counterfactual. This raises the challenge of whether and how to attribute observed outcomes to the intervention or specific aspects of it. A successful evaluation enables policymakers to assess the actual outcomes against what the policy was intended to achieve.
Different evaluation techniques can be put in place to establish whether the policy achieved the desired outcome or whether that would have occurred anyway. This report will outline some the more common evaluation models alongside the key issues that needed to be considered when selecting a method. Evaluations will be stronger or weaker at estimating impact depending on how close or far they reach in proving causation.
Policy interventions can vary enormously. For example, in terms of their implementation mechanisms, some are very straightforward but some are very complex involving many delivery organisations and models of delivery. There will also be wide variations in the ability to track the targeted group due to changes among businesses and other interventions or extraneous events affecting the same population at the same time. This has important implications for methods and quality of the evaluation in terms of its capability to give a clear indication that the policy achieved the desired outcome.
1.5 Business as the unit of evaluation
Evaluation is a widely accepted concept across Government and there are several important documents that evaluators can refer to, such as the Magenta Book and the Green Book, both published by the Treasury (see Bibliography for links). This report is important for BIS evaluators because often for them the “unit” of analysis is a business rather than an individual.
It is important to understand that the evaluation of impacts on businesses throws up different issues from the evaluation of impacts on individuals. There are several reasons for this. Business interventions often have universal application. Business can operate in many regions and countries and it is not easy to separate out the activities of one unit from those of another. The outcomes to be considered - productivity, profit, innovation etc - are different. There are very often spillovers on other businesses, because all businesses compete in markets with others.
4

1.6 Distinction between evaluation and appraisal and monitoring
It is important to distinguish evaluation from appraisal and monitoring. The Treasury’s Green Book states the purpose of appraisal is to ensure that no programme, project, policy or regulation is adopted without first having to answer:
Are there better ways to achieve this objective?
Are there better uses for these resources?
Appraisal should happen before the implementation of any new programme or policy. The Green Book states that all interventions should be subject to “comprehensive, but proportionate assessment wherever…practicable”2. The effort applied to an appraisal should be proportionate to the funds involved, likely outcomes and the time available. More information on appraisal can be found from the BIS Appraisal and Evaluation Guidance. Monitoring provides timely information on how a policy is being executed, whether it is on target to meet the objectives, and whether changes to delivery are required3.
Evaluation, appraisal and monitoring often form stages of a broad policy cycle that some departments and agencies formalise in the acronym ROAMEF (Rationale, Objectives, Appraisal, Monitoring, Evaluation and Feedback). This is shown in Figure 1 below:
Figure 1: The ROAMEF Appraisal & Evaluation Cycle
Start drawing up the evaluation strategy
At this point of the policy cycle, need to start thinking about evaluation:
- How will this initiative be evaluated?
- Will the objectives be measurable?
- Do we have a good monitoring system in place?
- Need input from analysts at this stage
Source: The Green Book. HM Treasury (TSO) Para 2.2
2 The Green Book. HM Treasury (TSO). Para 1.1
3 http://bisintranet/services/policymethodology/PolicyFramework/Documents/Box 5 BIS Appraisal and Evaluation Guidance.doc
5

Evaluation is often seen as retrospective analysis of a project, programme, or policy to assess how successful or otherwise it has been, and what lessons can be learnt for the future, something that should happen after a programme has been implemented. In this report we argue that although post-implementation assessment is the ultimate goal of evaluation, for an evaluation to be most robust, the evaluation design element should be part of the policy programme from the outset of any new initiative and carefully designed alongside the monitoring system.
1.7 Distinction between outcome, impact and process evaluation
There are broadly two main types of policy evaluations:
Outcome or summative evaluations seek to measure whether the policy outcomes or targets were achieved. Impact evaluation goes a step further and is structured to answer the question of whether the outcomes observed were the result of the policy or the observed outcomes would have happened anyway; and
Process or formative evaluations look at the process of the implementation of the policy and are mostly concerned with how the programmes are actually being implemented, and what the intended and unintended effects are.
Often evaluations contain both elements, with the process evaluation element seeking to understand what is working and what is not working as well, and the impact evaluation to assess the overall effects of the policy. This report only covers a discussion of outcome-based evaluations with an emphasis on impact evaluations although it recognises that process evaluation can form an important part of the evidence contributing to the overall impact evaluation and there are elements that are common to outcome, impact and process evaluations.
6

1.8 Key messages from this chapter
BIS carries out interventions that include regulations designed to further the public interest and support measures to achieve objectives that the market would not otherwise deliver.
The Government believes it is important to evaluate the impact that these interventions – policies, programmes or projects – have on the businesses they target.
Evaluation is important because it helps ensure that resources are not wasted and that government activities are of benefit to the economy and society, rather than a hindrance.
Impact evaluation aims to establish whether the intervention had the desired impact on the target business population. This is known as cause and effect.
The question of whether the intervention had the desired effect cannot be answered without proving the counterfactual: that the effect would not have happened anyway.
Different evaluation techniques can be used to address the question but some will provide stronger or weaker findings depending of how close they can get to establishing cause and effect.
It is important to distinguish between appraisal, which takes place before the intervention is implemented, monitoring that occurs during implementation, and evaluation, which is normally retrospective analysis.
7

Chapter 2. Initial steps before selecting evaluation methods
2.1 Learning objectives
Upon completing this chapter, you should be able to:
Identify the aims and objectives of a policy or programme
Understand the distinction between impact and outcome
Ensure objectives are measurable
Draw up and use a logic model
Define the five stages for selecting an evaluation method:
o Aims and desired outcomes
o Target population, treatment and those treated
o Treatment mechanism
o Feasible impact evaluation models
o Final assessment
2.2 Making aims and objectives of a policy or programme measurable
Many policy initiatives will have clear aims and objectives with a specified target population to be affected by the measure whose identities will be known. However the reality is that others will be more complex; may have unexpected consequences; may have a lack of clarity over the target population; or doubts over the exact identities of the businesses in the group that policymakers are seeking to target.
8

The first step when looking to set up an evaluation is to identify and define three core policy elements as closely and as fully as possible. The three areas are:
1. The aims and objectives of the intervention
2. Identification of the group or population to be targeted
3. The mechanism through which the objectives will be achieved
Where they cannot be defined well, this will present challenges for a comprehensive evaluation. If one doesn’t understand the nature of the treatment and how it might generate the intended outcomes, for example, one is likely to miss any unintended outcomes.
2.3 Logic models
Logic models provide a useful framework in defining what the aims and objectives are and how they will be met. They break the process down into five steps: inputs, activities, outputs, interim outcomes and outcomes. Table 1 defines each of the elements for a business support programme (a logic model for a legislative intervention would have different outputs and outcomes.)
Table 1 Typical Logic Model
Logic Model Inputs Activities Outputs Interim
outcomes Outcomes/ Impacts
Staff or physical resources used to implement the policy or programme.
What has been done with the resources and how has it been done.
The immediate result of the activities of Government or its agents. The value of equipment bought and/or number of jobs created/safe guarded
The short-term results the government seeks to achieve from its activities and the activities of those it influences in order to meet its objectives eg. value to the wider economy of those that have benefited from the intervention.
The ultimate result the government seeks to achieve from its activities, and the activities of those it influences, in order to meet its objectives eg. Value to the wider economy, better business conditions, Improved open markets across Europe.
9

2.4 The distinction between output, outcome and impact
Impact evaluations seek to prove that the intervention had an effect (outcomes) that would not otherwise have been achieved without the intervention. Some studies, given methodological or data constraints, are able to measure outcomes and are not able to estimate impact, i.e. they are not able to show whether the measured outcomes would have happened anyway without the intervention or not. Although the definition of outcome and impact is different, much of the literature uses them as synonymous.
To give a non-business example, the Government might decide that it wants to achieve a reduction in hunger among the street homeless.
The activity is to set up a soup kitchen.
The output is the number of meals that the kitchen serves and the number of people who receive the food.
The outcome would be the degree by which hunger in the population served by the soup kitchen has declined.
The impact is the degree by which a reduction of hunger in the population they serve is attributable to, or caused by, meals served by the soup kitchen.
The reason for having a counterfactual is to show that reduction in hunger was not attributable to other factors such as an improving economy, a new school lunch program or another activity unconnected to the soup kitchen’s efforts.
The analysis used in the logic models helps to distinguish between the cost efficiency and cost effectiveness of a project. Cost efficiency maximises activity or output for a given level of cost while effectiveness maximises the positive impacts – which should be the ultimate objectives of any policy – for a given cost. In other words cost effectiveness addresses the quality of the services provided as well as the efficiency of their delivery. In essence cost effectiveness is another expression for Value for Money, bringing together the concepts of economy, efficiency and effectiveness.
2.5 Five-stage process to scope the feasible evaluation models
Logic models can be further developed and used to start thinking about the possible evaluation strategies available. The table in Annex A shows how a logic model was applied to the Small Loans for Business Initiative.
Using a logic model will enable an evaluator to define and set out the three core elements listed in Section 2.2 into a more ordered process to assist in the scoping of the feasible evaluation models. This can be done using a five-stage process (see also Annex B for an example of the five-stage process based on the Small Loans for Business Initiative):
10

1. Aims and desired outcomes
What are the outcomes that the policy or programme is seeking to achieve? This should include a list of all possible outcomes (see section 2.4 for more detailed analysis)
Check that these outcomes are measurable.
Try to measure some outcomes in monetary terms if possible. If they cannot be measured in monetary terms, look at alternative ways in which they may be expressed using alternative specific measurable indicators (see Annex C of this report and Annex 2 of The Green Book for further detail).
2. Target population, treatment and treated
Define the population to be affected by policy or programme
Will the programme or policy be applicable to the whole business population?
Identify the reach of the treatment: is the treatment equal to all target group or target groups? If not what are the ramifications? Do we want to evaluate all the ramifications or just some key ones?
3. Mechanism
Are there identifiable mechanisms through which the aims can be achieved?
If flexibility has been given to delivery organisations, do we know how these delivery mechanisms are intended to work?
11

4. Feasible impact evaluation models
Interventions may have a number of specific outcomes. In broad terms there will be two main ways of measuring these outcomes:
o Using existing data, which could be data monitoring or from available datasets, for example national or administrative datasets.
o Deriving new data – i.e. putting in place mechanisms to collect data before and after the initiative (treatment). This can take the form of monitoring systems (mostly databases) and/or primary data collection methods (most commonly surveys).
In discussing each outcome, evaluators need to bear in mind two important issues that will be discussed in later chapters:
o What are the data requirements and what would be the ideal collection method? (see Chapter 5 for closer analysis)
o Assessment of the validity and reliability of the data collection and evaluation strategy (see next chapter for definition and explanation).
To decide on the possible evaluation models (forthcoming in Chapter 4) that can capture the outcome desired, it is important to consider at this stage:
o Can the policy or programme be delivered to any set of businesses at random in order to establish the counterfactual without disadvantaging another group? If not, how can one identify groups of businesses users that can serve as a comparison group? How good will this comparison group be?
o What monitoring data is currently available and how can this be used?
o Will there be pre-treatment and post-treatment data available?
By answering these questions at this stage, evaluators will then find it easier to see which models will be most cost-effective in terms of delivering the required evaluation results.
12
Final assessment
After the four issues above have been set out and evaluation options scoped it is important to discuss the evaluation strategies available in the context of: budget, timetable, ethical considerations and likely impact of the evaluation. Many of these questions will be analysed in depth later in this book. For an example of how the questions above would help set out the possible evaluation models and areas where the evaluation may be challenging, see the table in Annex B.
2.6 Anticipating a large number of outcomes
Drawing up a comprehensive list of possible outcomes from an intervention is a necessary starting point if the evaluation is to give a complete picture of intended and unintended consequences. However, there are practical barriers to exploring every aspect of an intervention’s impact:
The costs of collecting and analysing data on a large number of outcomes, or those that are difficult to capture, mean that most evaluations focus on a few key measures.
It may be possible to rationalise the number of outcomes if previous evidence has suggested some are highly inter-related. However, including more than one indicator of the important outcomes shows whether the results are sensitive to changes in definition.
Focusing on a wide-ranging, but select, set of outcome variables can mean that it is easier to interpret results compared to examining impacts on a large number of outcomes, some of which may be of limited importance or poorly captured in the available data.
Whilst it may be prudent to concentrate the analysis on a small number of outcomes, it is necessary to avoid making the choice of measures so narrow that important impacts are missed.
2.7 Links with the BIS Economic Appraisal Checklist
Another useful reference source that outlines the importance of development of measurable objectives from the outset of policy development is the Economic Appraisal Checklist. This is used when setting up the business case for a policy intervention. The full checklist, which sets out around 30 questions, is contained in Annex C. However the six overarching questions that it asks are:
1. Does the business case set out a compelling case for Government intervention?
2. Have SMART Objectives been set?
3. Does the business case set out a range of options?
13

4. Have the various options been appraised?
5. Have suitable performance measures been identified?
6. Are monitoring and evaluation arrangements in place?
It is useful to refer to this checklist, as it may have been used by policymakers when deciding on, and designing the intervention. In particular item 4 provides a useful guide to the cost considerations that impact evaluations should ideally cover.
2.8 Key messages from this chapter
The first step when looking to set up an evaluation is to define three core elements: the aims and objectives of the intervention; the group to which it will be applied; and the mechanism through which the policy is expected to have an effect.
Logic models assist this process by dividing it into inputs, activities outputs, interim outcomes and final outcomes.
Impact is not the same as outcome. The impact is the degree by which outcomes are attributable or caused by the intervention rather than any other factor.
Within the five headings in the logic models are a number of further questions. Answering these will help decide which precise method of evaluation to use.
Use the five-step process to scope the possible evaluation models and always set any initial assessment of the feasible evaluation models and their limitations against background issues of budget, timetable, ethical considerations and likely impact of the evaluation.
Bear in mind that one intervention may result in a number of possible outcomes.
The BIS Economic Appraisal Checklist is a useful tool to help evaluators at this stage.
14
Chapter 3. Core principles behind evaluation 3.1 Learning objectives
Upon completing this chapter, you should be able to do the following:
Gain more detail on the core policy elements to enable an impact evaluation
Understand the other elements to consider when setting up an impact evaluation: budget, timetable, feasible impact evaluation models, ethical considerations and likely impact of the evaluation
Understand the essential principles behind a successful impact evaluation:
o Impact and the counterfactual
o Robustness: validity and reliability
3.2 Introduction
In the previous chapters we considered the types of intervention that BIS tends to make and the fact that these are often targeted at businesses rather than individuals. We stressed the importance of integrating evaluation at the outset of policy development. We set out principles for deciding whether an evaluation is needed and key questions to be answered using a logic model and the BIS Appraisal Checklist.
3.3 Core policy elements to enable an impact evaluation
Having decided that an intervention is needed and given some thought to the need for evaluation, advice should be sought from analysts on whether an evaluation is likely to be viable. In Chapter 2 we listed the three core policy elements that would enable the impact evaluation to be more robust, namely: clear aims and desired outcomes; the identity of the treated or target population; and the mechanism.
Table 2 indicates the kinds of questions that you will need to answer under each heading. Also see Annex B for a worked out example of the questions using a logic model.
15

16
Table 2 – Core policy elements to enable an impact evaluation – check list
Aims and desired outcomes Yes No To some extent
Does the intervention have clear objectives/outcomes it aims to achieve?
Are these aims – or at least some key ones –measurable?
Target population
Do we know what is the target population/s is/are?
Can we identify the population being treated?
Can we identify untreated businesses that may be affected by spillovers from the treatment?
Treatment
Do we know what the treatment is?
Are there identifiable mechanisms through which the aims are expected to be attained?
Is the treatment uniform in relevant respects for all participants?
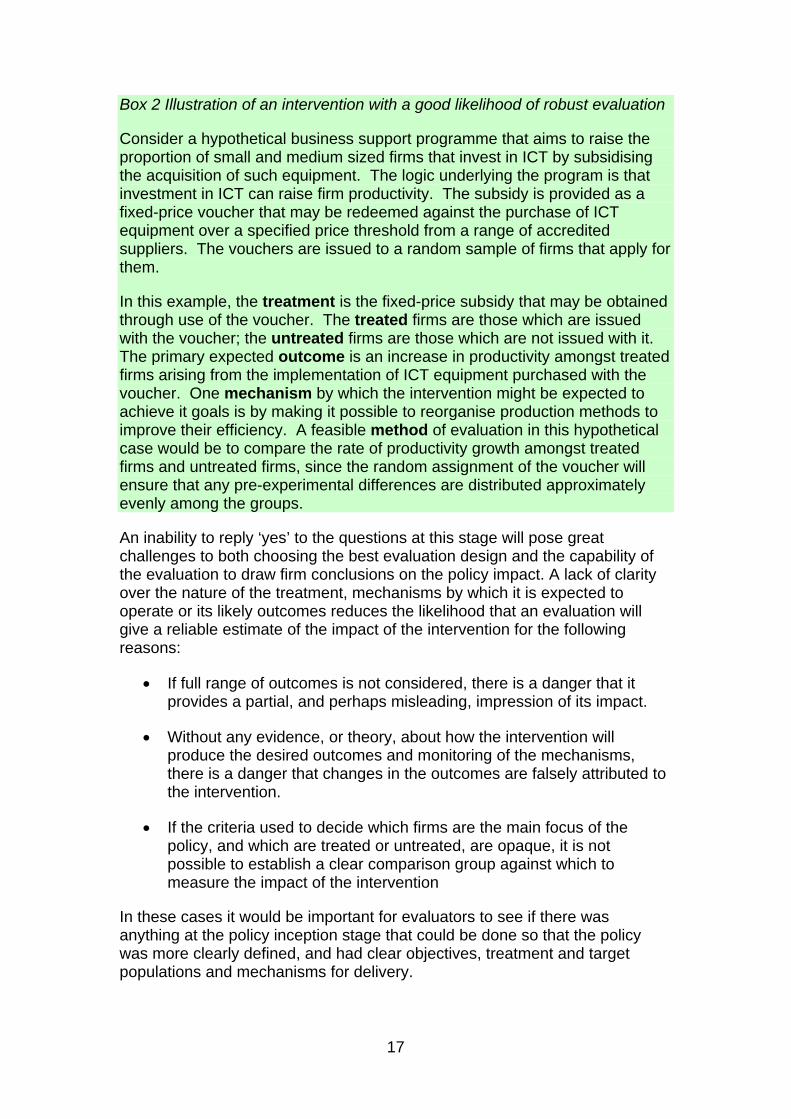
Box 2 Illustration of an intervention with a good likelihood of robust evaluation
Consider a hypothetical business support programme that aims to raise the proportion of small and medium sized firms that invest in ICT by subsidising the acquisition of such equipment. The logic underlying the program is that investment in ICT can raise firm productivity. The subsidy is provided as a fixed-price voucher that may be redeemed against the purchase of ICT equipment over a specified price threshold from a range of accredited suppliers. The vouchers are issued to a random sample of firms that apply for them.
In this example, the treatment is the fixed-price subsidy that may be obtained through use of the voucher. The treated firms are those which are issued with the voucher; the untreated firms are those which are not issued with it. The primary expected outcome is an increase in productivity amongst treated firms arising from the implementation of ICT equipment purchased with the voucher. One mechanism by which the intervention might be expected to achieve it goals is by making it possible to reorganise production methods to improve their efficiency. A feasible method of evaluation in this hypothetical case would be to compare the rate of productivity growth amongst treated firms and untreated firms, since the random assignment of the voucher will ensure that any pre-experimental differences are distributed approximately evenly among the groups.
An inability to reply ‘yes’ to the questions at this stage will pose great challenges to both choosing the best evaluation design and the capability of the evaluation to draw firm conclusions on the policy impact. A lack of clarity over the nature of the treatment, mechanisms by which it is expected to operate or its likely outcomes reduces the likelihood that an evaluation will give a reliable estimate of the impact of the intervention for the following reasons:
If full range of outcomes is not considered, there is a danger that it provides a partial, and perhaps misleading, impression of its impact.
Without any evidence, or theory, about how the intervention will produce the desired outcomes and monitoring of the mechanisms, there is a danger that changes in the outcomes are falsely attributed to the intervention.
If the criteria used to decide which firms are the main focus of the policy, and which are treated or untreated, are opaque, it is not possible to establish a clear comparison group against which to measure the impact of the intervention
In these cases it would be important for evaluators to see if there was anything at the policy inception stage that could be done so that the policy was more clearly defined, and had clear objectives, treatment and target populations and mechanisms for delivery.
17

Box 3 An illustration of the pitfalls of evaluation
Returning to the hypothetical example provided in Box 2, a potential problem arises if vouchers were issued arbitrarily, based upon a subjective assessment of whether the recipient firm would be likely to benefit from further investment in ICT. Another pitfall would arise if it were not possible to determine which recipient firms had used the voucher and which had not, or which of the untreated firms had invested in ICT, despite not receiving any assistance. The impact estimate could also be biased if the evaluation considered only the impact of ICT investment upon the productivity of the department in which the equipment was deployed, without considering the potential for other departments to learn from the implementation or for it to stimulate ICT investments elsewhere in the firm.
3.4 Other key considerations on the decision to evaluate
In the previous section we discussed the core policy elements that enable an impact evaluation. However, even when those elements are well covered there are many other interrelated factors that need to be considered before a decision can be made as to which would be the best suited evaluation methodology.
3.4.1 Budget
It is not necessarily the case that having a large budget to spend on evaluation will ensure that the results will be more robust. The cost of an evaluation should be proportionate to the cost of the planned intervention and the likely outcomes. Evaluation methods vary in terms of costs. Some Departments have a rule of thumb in terms of money available for evaluation that is a percentage of the ‘policy implementation cost’. The amount of time and resource invested in an evaluation should be greater or lesser depending on the following factors:
The estimated costs and benefits of the policy or the level of spend if it is a programme. Small or routine treatments may only require less expensive evaluations.
The level of risk to the public interest or the target population. A more risky project is likely to require a fuller evaluation.
The innovativeness of the policy. A more innovative treatment may require a fuller evaluation to understand whether it had the desired effect and why.
Whether it is a pilot or will shape other policies. It may be appropriate to allocate a disproportionate amount of resources for the evaluation of a pilot policy.
18
Value-for-money is central to all of these considerations. Where there are doubts over the feasibility of establishing the impact of an intervention within a reasonable budget, or over the usefulness of the findings, it may be preferable to consider the balance between the likely strength of the evaluation and the cost of the exercise. There are outcome based evaluation models – which are discussed fully in chapter 4 – that are less rigorous, but can give some indication of whether the policy or programme is going in the right direction (i.e. whether the policy outcomes or targets were achieved), however they might not be able to explain whether these outcomes where the result of the policy or not. These methods are to be considered when more stringent impact evaluation methods are not viable or not deemed as cost effective. However it must be borne in mind at this stage that less costly evaluation methods may be able to provide some pointers to correlations and relationships but will not be able to prove causality and thus impact of the intervention.
3.4.2 Timetable
The timetable is sometimes driven by policymakers rather than evaluators. Two issues are important when looking at the timetable. The first is to establish when the impacts are likely to be visible or measurable. Secondly, research tools take time to set up, develop, and pilot, so there will be trade-offs between validity of method (based on best practice and the time that it takes to develop strong research tools) and time available. Once this has been considered it is necessary to use the information to decide on the appropriate observation period. Time often has a big effect on the choice of methodology. However it is helpful to give some thought to the evaluation whilst there is still a possibility of influencing the policy timetable in order to ensure that the evaluation can be robust.
3.4.3 Ethical considerations
As we will see in Chapter 4 the most robust way to form an estimate of the counterfactual is through allocation of the treatment to some randomly selected firms and withholding the treatment from other randomly selected firms. If the intervention is effective, this involves giving some firms an advantage over others. The following factors affect whether this is ethically sound:
The cost to the Exchequer of making an intervention that is ineffective. There is a moral duty to ensure public money is spent wisely. If decision-making is based on robust evidence, it is less likely public money will be wasted on interventions that do not produce a net benefit.
The potential impact of withholding the treatment, or imposing it on some but not others. There is a difference between placing firms at a slight, temporary disadvantage (perhaps for longer term benefit for them, or society) and threatening their survival.
19

The likelihood of obtaining a reliable estimate of the impact of an intervention. There would be less justification for withholding a potentially beneficial treatment if there was little prospect of being able to evaluate its impact than if there was a good chance of producing a robust impact estimate.
The degree of uncertainty about whether the intervention is likely to be effective. If there is already strong evidence to suggest that an intervention will have a beneficial impact, denying it to some firms is less likely to be acceptable.
3.4.4 Likely impact of evaluation
It is a good idea to consider the likely impact of an evaluation on the policymaking process. You should ask what the results would be used for and how important they would be in future policymaking processes. These can be also important in considering an appropriate method and budget.
Table 3: Summary of core elements to consider when setting up an impact evaluation
Core policy elements
1. Aims and desired outcomes
2. Target population, treatment and treated
3. Mechanism
Feasible impact evaluation models (discussed in detail in Chapter 4)
Data requirements and method of data collection
Assessment of validity and reliability of model
Budget
Timetable
Ethical considerations
Likely impact of the evaluation
20

3.5 Two essential principles behind a successful impact evaluation
By this point the evaluator has understood the intervention that is being undertaken and its main aims and objectives. He or she has also used the logic model to gain a diagrammatic understanding of the inputs, activities, outputs and outcomes that are included in the evaluation and made an early assessment of the feasibility of carrying out an evaluation.
Having presented in broad terms what impact evaluations attempt to capture, and before we start looking at different evaluation design types, it is important to understand where evaluation sits in relation to the policy design and what are the core elements to be considered when thinking about an appropriate evaluation design. So before moving to the technical issue of the selection of an evaluation methodology, we will consider the principles that stand behind evaluation and the standards that a successful evaluation must meet.
3.6 Principle 1: Measurement of the counterfactual and capability of proving causality
To measure impact is to be able to estimate the degree by which the intervention has caused the outcomes measured over, above or in difference to what would have happened anyway.
Evaluating the impact of an intervention is difficult because it is not possible to observe directly what would have happened if the intervention had not been made. This is known as the counterfactual. It can be defined as the most likely outcome in the absence of the intervention. Since the counterfactual is never observed in practice, it is not easy to estimate. Nevertheless, a robust counterfactual is an essential part of a strong evaluation.
Successful impact evaluations will be judged by their capability of proving causality, measuring the counterfactual and therefore estimate impact. The evaluation model applied will already dictate whether estimates of causality are possible or whether they are just measures or correlation, association or difference.
3.7 Principle 2: Evaluation results must be ‘robust’
Robustness is a widely used word in the context of evaluation and evaluation methodology. Was the evaluation really capable of measuring cause and effect - that policy X caused effect Y in the target population - and would the outcome have been the same without the intervention?
For our purposes we will understand a robust study to be one where the methods applied are as valid and reliable as possible.
A robust evaluation is one where stringent research and/or statistical techniques have been followed to arrive at valid and reliable results or conclusions. Validity and reliability appear in all evaluation and research documents. Valid and reliable findings are words that have a very specific meaning in research and indeed evaluation methodology terminology.
21

3.7.1 Results of evaluation must be ‘valid’
A study is said to be valid when it can be shown that it has measured what it was intended to measure. Validity refers to the extent of the ‘goodness of fit’ between an operational definition and the concept it is purported to measure.
For example a survey that asks the business community simply: ‘what is your turnover?’ will come up with a figure that is not valid. Why? Because the respondents may have used different financial years in their answer. For example some firms use January to December and others April to March. Some respondents may have given a figure before tax and others after tax; some may have replied for their outlet and others for the organisation as a whole covering all the UK. See Annex D for an illustration of the difficulties surrounding the construction of a valid turnover question.
One way of understanding this concept is to think of a photograph. You can take a picture of anything; however, with the wrong light or the wrong aperture you will get an image. Just because you have an image, it does not mean that your image is an accurate – or valid - reflection of what you intended to take an image of. In evaluation, the same principle applies: the wrong tool will deliver a measurement of impact but one that may not measure exactly what was being sought.
There are two other ways in which validity is commonly used in terms of evaluation: internal and external validity. Internal validity concerns the validity of the findings of the study in relation to the actual subjects of the study. Are you measuring what you intend to measure with this operational definition? Does the study do what it set out to do? External validity is about applicability outside the group studied. Is it applicable to other places, times, and situations? Are the findings generalisable? Will the intervention or policy have the same effect if applied to a different business in the same target population?
3.7.2 The results of an evaluation must be ‘reliable’
Reliability is concerned with questions of stability and consistency. Another way of expressing this is repeatability: if the study were carried out again, would it produce the same findings? Do repeated applications of the operational definition under similar conditions yield consistent results?
It is possible to derive measures that are reliable and non-valid. Using the example above, it is quite possible that the measure of ‘turnover’ is reliable and repeatable: if we asked another random sample of the same population ‘what is your turnover?’ we could come up with the same result. The problem is that for the reasons discussed, on each occasion the findings would lack validity. In this case we would have arrived at a non-valid reliable measure.
A metaphor for reliability is that of a tape measure. The way in which the whole evaluation and research instruments have been set up have to be as
22

reliable as a tape measure is. Every time you measure with it, it does so consistently, if you use it in the same way.
3.8 Key messages from this chapter
There are policy design questions that must be answered before moving on to the selection of an evaluation methodology. An inability to answer the questions may undermine the effectiveness of the evaluation.
It is important to make an assessment, which includes all of the core elements discussed in this chapter, before setting up an impact evaluation.
There are two essential principles behind a successful impact evaluation:
- Its capability to show causality and therefore measure the counterfactual and impact
- Robustness of the findings, these must be valid and reliable
Validity: Has the evaluation measured what it intended to measure? This highlights the importance of defining as precisely as possible what one wants to achieve from an evaluation.
Reliability: If the evaluation methodology were to be repeated would it come up with the same results?
23

Chapter 4. Selecting the most suitable evaluation design
4.1 Learning objectives
Upon completing this chapter, you should be able to do the following:
Identify the difference between experimental and quasi-experimental design
Know the different evaluation models, their names and relative strengths and weaknesses
Understand which impact evaluation models can be used to estimate the impact of a particular policy or intervention and which would just provide an idea of direction of the intervention.
4.2 Introduction
The goal of an evaluation is to provide a robust impact estimate of a treatment, as that will be of great value to both current and future policymakers. It will enable policymakers to know how to use resources in the most effective way in the future. While the aim of the evaluator is to produce a sound impact evaluation, this will sometimes be challenging. The extent to which something can be evaluated will vary. This in turns means different methodologies or combinations of methodologies will be suitable for different interventions. It is therefore necessary to take the decision on how to evaluate on a case-by-case basis.
An evaluation involves seeking to apply a theoretical model that seems most appropriate and adapting it to the particular circumstances. However, the models help to understand what kind of evaluation is possible and why. It is important to have the models in mind as they all have their assumptions and weaknesses and challenges to validity and reliability.
24

4.3 First steps in identifying an evaluation model that is feasible in a given policy context
There are a few basic elements that will allow an evaluator to assess which evaluation model is feasible to use in a given policy context. These are mostly to do with how the initiative, project or policy is implemented; the data that are available; and the resource budget.
We have seen that a key concept in being able to evaluate the cause and effect of an intervention is to establish the counterfactual: what would have happened if the intervention had not been made. In order to do this one has to be able to identify the outcomes for a group of businesses to which the policy was applied compared with outcomes for another group that was not subject to the intervention. There are a number of different ways of achieving this. These vary in terms of the likely reliability of the findings, the time the evaluation is likely to take and the costs involved.
There are many factors that influence what is feasible to do. The ability to produce conclusive evidence depends on the size of the impact, the number of research participants, the quality of data available to assess impact, and the ability to identify accurately the treatment and comparison groups. Not all of these are in the control of the evaluator.
The time horizon is also an issue. An evaluation might look at both short-term and long-term effects because focusing on the short-term might lead to mistaken conclusions about the impact of the policy. However in some cases policymakers will require evidence based on assessment of the short-term impact alone in order to decide whether to extend the scope of an intervention.
Some evaluation models will produce excellent results but may take too long or be extremely expensive. Others might focus on the general direction of the policy or programme outcomes and will produce less strong conclusions about the specific causality and impact of the intervention but will be deliverable within a timeframe and budget that is more useful to policymakers. Different methodologies will require different volumes and quality of data, which will also feed into the issues of timetable and budget.
The aim at this stage is to assess the likelihood that the evaluation will produce conclusive evidence. In some circumstances it is clear from the outset that this is unlikely to be achieved, in which case it may be prudent to focus on low-cost options to give a general indication of how the policy or intervention is going, whilst noting that these will not be able to prove impact, i.e. the causal link between the intervention and the outcome. As will be shown in the following sections, evaluation models get weaker as they are less able to prove causation and they move towards just showing association or correlation.
25
4.4 Randomised Control Trial (RCT) or true experimental design: the gold standard for measuring causality and the counterfactual
The gold standard for carrying out an evaluation is often seen as one that uses an ‘experimental design’ which is sometimes referred to as randomised controlled trial (RCT). As its name implies it involves running a laboratory-style trial to see whether an intervention has the desired impact. In an experimental design, the evaluator identifies two groups of subjects at random: one of which will receive the treatment and other that will not. The experiment needs to be constructed in a way that eliminates other factors that might have an impact on those taking part – known as extraneous variables – that would offer alternative interpretations of research findings. Experimental studies long have been regarded as the optimal way to test causal hypotheses and therefore impact.
However, while experimental methods might be the first choice of the evaluator, it is essential to consider whether any difficulties implementing them in a given situation will undermine their ability to provide a robust estimate of impact.
The main features of an experimental design are as follows:
A hypothesis that the proposed policy or treatment will have certain effects
The hypothesis is tested in a real population or sample of the target population
The population or sample of population is randomly divided into two groups to ensure any pre-experimental differences are distributed approximately evenly among the groups
Random assignment (by tossing a coin) means each subject has an equal chance or being in either group, so individual characteristics or experiences that might affect the results should be evenly distributed between the two groups
One group will receive a treatment (the test group) and the other will not (the control group)
Control: the test group and the control group should be treated exactly alike, except for the treatment to avoid extraneous variables or confounding reasons for the effects. In this way we can be confident in inferring that the treatment produced the effects set out in the hypothesis.
26

Box 4 Paracetamol and headaches: a true experimental design
We are all very familiar with medical experiments to test new medicines. People are chosen at random, some are given the treatment (the medicine) and some are given a ‘placebo’, which looks like the treatment but contains no medicine. None of the participants know if they are given the treatment or not. Then measures are taken before and after the treatment:
Experimental design in its most simple form example
Target population or target group for intervention: people with a headache
Time
Time A Time B Time C
R1=
Random group 1 or treatment group
O1 = Observation 1: Measure of headache before the intervention
X =Treatment: Introduction of paracetamol
O2 = Observation 2: Measured improved headache or lack of headache
R2 = Random group 2 or control group
O3 = Observation 3: Measure of headache before the intervention
No treatment or introduction of placebo
O4 = Observation 4: Measured headache or lack of headache
The fact that the treatment group reports fewer headaches at observation point O2 compared to observation point O1 does not of itself prove causation between paracetamol and reducing headaches. As we have seen, one key issue is the counterfactual: could this ‘change’ in the form of fewer headache symptoms have happened anyway without the paracetamol? This can be tested by looking at the control group. If the treatment works, then tests at the O4 observation point should show that the control group is still reporting a headache. However the observed change might have happened anyway if there was a placebo effect from the control group mistakenly believing they were receiving the treatment and that belief affected whether they felt that the headache had cleared.
In order for the experiment to work well the evaluators need to make sure they control the two random groups. For example no one is going to receive alternative treatments between time A and time C unless the extra treatment is applied to those in both groups. On the example above, except for some receiving paracetamol and some not, the two groups need to be treated exactly alike to avoid introducing other possible reasons for the observed effect at time C.
27

In true experimental designs there are two groups, and the subjects are assigned to the groups randomly to ensure approximate equivalence of the groups. Reduced to its most simple diagrammatic form, a true experimental design is shown in Figure 3. This is known the pre-test post-test control group design. We will use this template, which is based on academic work into experimental design, for all subsequent illustrations.
Treatment group RO1 X O2
Control group RO3 O4
Where:
R = the subjects are randomly assigned
to the groups
O = the observation or measurement
X = the treatment
Time moves from left to right
The first column refers to the groups at pre-treatment stage where an observation of the treatment group is taken at O1 and of the control group at O3. The treatment is then applied. A post-treatment observation is made of the treatment group (O2) and of the control group (O4)
Random assignment of policies or programmes can be criticised, in some policy areas, for being unethical (see Section 3.4.3). Random assignment into two groups ensures that pre-experimental differences will be distributed approximately evenly among the groups. One group will receive a treatment or policy ‘the test group’ and the other will not receive the treatment or policy ‘the controlled group’.
From an ethical standpoint, critics believe that the use of objective criteria to ration the treatment is preferable to random assignment. However, it is debateable whether limiting the treatment to a defined subset of firms differs much from random allocation. Since firms are able to choose to take part and are allocated to the treatment group at random, it could be a fairer way of rationing the treatment than other methods.
28

The ability to implement the policy or initiative at random or not raises some important issues. If firms are allowed to self-select for treatment, there is a danger that those that take part are likely to be ones that expect to benefit from the intervention and will choose to participate - thus already being different from the ones that did not get the treatment. The willingness to receive the treatment could also shape the effectiveness of the intervention.
There may also be practical constraints with random assignment. It is difficult to capture the full impact of an intervention if it is felt beyond the treatment group, such as the imposition of a carbon tax or a universal legislative requirement. Finally evaluators can exploit naturally occurring randomness in the allocation of firms to each group, rather than ensuring that the groups are the product of a concerted effort to ensure that the assignment is random. As natural experiments depend on circumstances arising where the allocation to the treatment is at random, they tend to be used to supplement other methods, or where an evaluation would not otherwise be possible, rather than as a matter of routine (see Criscuolo et al (2007) for an example of a natural experiment in the business context).
4.5 Quasi-experimental designs
It is not always possible to apply a true experimental design in impact evaluations. For instance it may not be possible to fully control the environment of a target group, or may be difficult to randomly allocate a treatment such as a business support product or a change in regulation. There may also be overwhelming ethical reasons as discussed in the previous section. Finally there may simply be no pre-intervention data on the desired measures.
In these cases, quasi-experimental designs can be used, where the design is trying to approximate itself as much as possible to an experimental approach but without having full experimental characteristics. There are many types of quasi-experimental designs, of which we can see some examples in the following sections.
4.5.1 Stronger quasi-experimental designs
The stronger quasi-experimental methods to measure impact or causality tend to be characterised by having before and after measures and a robust comparison group.
29

Non-equivalent match or comparison group design
The second strongest way to evaluate where random assignment is not possible is to match the treatment group with another similar group. This ‘matched group’ contains members that have similar characteristics to the treatment group. In order to find a matched group, the analyst will need to measure some characteristics of each of the treatment group businesses, for example, business size, sector, region, and turnover and find the same characteristics on the population of businesses for the matched comparison group. These would then form the matched group.
Treatment group O1 X O2
Matched comparison group
O3 O4
Where:
X = the treatment
O = the observation or measurement
Time moves from left to right
The biggest challenge to this design is that it relies heavily on the quality of the matching, which is a highly technical issue. The aim of matching is to identify a comparison group that would be likely to attain the same outcomes as the treatment group in the absence of the intervention.
Matching can be done just by identifying similar important profiling characteristics on a one to one basis. A common way of matching is to use propensity score matching, which matches treatment and matched groups by scoring businesses against objective criteria, which affect the propensity of the firm to achieve the outcomes that the intervention is designed to affect (see Rosenbaum and Rubin, 1983, for precise definitions), see also Greenaway and Kneller (2007) for an example of nearest neighbour matching. However, researchers need very comprehensive data on the treated businesses and the non-treated businesses to be able to get a good match. Often researchers are left with very little data to match as some key important details are not measured (see the case example in Box 6, below).
30

Box 5: Key questions to ask when matching
Successful matching is measured by the percentage of treated businesses that can be matched (the match rate). The quality of the match is represented by choosing characteristics that affect the propensity to attain the outcome. However, this will again have an effect on the match rate and a careful balance needs to be struck.
In a report for BIS aimed at assisting efforts to evaluate the impact of government interventions on the business community, the National Institute of Economic and Social Research (Bewley et al., 2010) identified the key drivers of business success and failure. Evaluations rely on analysts’ ability to take adequate account of any differences between participants and non-participants that may explain any observed variation in their performance (other than the fact of being subject to the intervention). The report identified those performance-related characteristics that provided the strongest basis on which to compare participants and non-participants. The aim was to help identify a set of business characteristics that would ideally be employed as matching variables or control variables in evaluations. A diagram containing the factors reviewed in the report can be found in Annex E. Some questions emerge for any analysts thinking about forming a matched comparison group: Do we have good data on which to base the matching process?
If we only have business attributes on which to match, how valid will the matching be? How does ignoring internal management factors, product strategy factors and external factors affect the validity of the results?
Which of these business characteristics are available for matching purposes in my study?
How does this lack of availability of variables to match affect the reliability and validity of the results?
A low match rate creates questions about outliers or less common businesses. In general those that are less common are more difficult to match. However it could be the case that a policy or programme could have different effects on atypical firms. The issue is whether an inability to match all of the businesses, leaving some out of the scope of the study, challenges the validity of the findings.
31

4.5.2 Multiple time series design
Time series is another useful model. Different versions can have matched or comparison groups and it can cope with situations where the policy or initiative cannot be randomly allocated, matched. It uses many measures of before- and after-treatment and has data on the whole target population or random samples of it at each observation point. Using a large number of measures in order to build up a more comprehensive picture strengthens the model.
The comparison group in the illustration might not be matched, to strengthen the model it could be run with time series of a match comparison group. When selecting comparison groups it is important to make sure that the treatment group and the comparison group do not differ from each other systematically in important characteristics from the outset.
Treatment group O1 O2 O3 O4 X O5 O6 O7 O8
Comparison group O9 O10 O11 O12 O13 O14 O15 O16
Where:
X = the treatment
O = the observation or measurement
Time moves from left to right
Multiple time series can often be run on good administrative data and it is a useful tool for identifying impact. If data are being collected in order to administer support, it may then be possible to link them to other datasets containing outcome measures. This is a good model to build in when there is a possibility of designing a monitoring system that tracks the policy over time. However it is essential to have pre- and post-treatment observations. It is worth pointing out at this juncture that one of the key issues with monitoring data in the business community is keeping them up-to-date, while not overburdening firms.
Because this design uses a treatment group and a comparison, the evaluation will produce more robust results if it is able to account for extraneous variables or confounding reasons for the effects that may affect either of the groups between the initial observation points (O1 and O9) and their respective end points (O8 and O16).
The idea of making data businesses comply with data provision for monitoring purposes as a pre-requisite for receipt of benefit or support is often rejected, as the business community already has to comply with a large amount of
32

regulation. However, where the support is intense or substantial, it may be possible to argue for evaluation and monitoring to be a condition to which businesses must adhere.
4.6 Weaker quasi-experimental designs
We now move on to other outcome based models that cannot robustly measure impact/causality but look at strong correlations and associations (see Chapter 1 for a reminder of the difference between causation and correlation).
They are used where: stronger data are not available; there are tight budgets for evaluation; or a ‘finger in the air’ assessment is deemed a better option than not evaluating at all. In these cases it may nevertheless be possible to form some impression of how the intervention is going but it is important to remember that these will not give robust results of impact and will only given an indication of direction. Estimates of impact derived from such models will not be very robust as causality cannot be proven by them.
4.6.1 Separate-Sample Pre-test/ post-test design
In cases where the intervention is going to be applied to every business, for example, a new employment law initiative, it is possible to take a measurement of a random sample of businesses before the intervention and then draw another sample after the policy or initiative has been implemented to assess if any change can be measured:
Treatment group (sample 1)
RO1 X
Treatment group (sample 2)
X RO2
Where:
X = the treatment
O = the observation or measurement
R = the subjects are randomly assigned
to the groups
Time moves from left to right
This would allow evaluators to make broad-based inferences but would not give confidence that the change measured was a direct result of the policy or programme as it would not be possible to establish a counterfactual.
33

4.6.2 Post-test-only control group design
This is ideal for cases where it is not possible to take a pre-intervention measure but is possible to assign the businesses that receive the treatment and those in the comparison group at random. This would produce a measure of difference between the two groups, limited to the difference in outcome after the treatment for the treated and un-treated groups.
Very little can be said about the pre-treatment differences and whether they were distributed evenly among the groups. This model cannot fully explain that any measured difference between the groups is due to the intervention as this would imply an assumption that they both had the same starting point, were equally distributed, before the intervention that cannot be proven.
Treatment group R X O1
Comparison group R O2
Where:
X = the treatment
O = the observation or measurement
R = the subjects are randomly assigned
to the groups
Time moves from left to right
4.6.3 Static-group comparison
Following on from the post-test only control group design, the static-group comparison can be used where the treatment is not at random but a comparison group is chosen, ideally a matched group.
Very little can be said about the pre-treatment differences and whether they were distributed evenly among the groups. Again this model cannot fully explain that any measured difference between the groups is due to the intervention as this would imply an assumption that they both had the same starting point, were equally distributed, before the intervention that cannot be proven.
34

It is important to make a note of how this comparison group is selected and to what extent it can be said to be a ‘good’ comparison group. One hazard to watch out for is that the comparison group contains very different features from the treated group from the outset as this could undermine the validity of the findings particularly if the starting point differences are related to the outcomes that either group attains. It is difficult to establish how good the match between the treatment and comparison groups is without pre-intervention data.
Treatment group X O1
Comparison group
O2
Where:
X = the treatment
O = the observation or measurement
This type of study is often used where beneficiaries of a business product are compared with businesses that did not get the product for some reason. These applicants would not represent a ‘good’ comparison group, as there is a strong likelihood that the reason they have not been selected for the treatment implies they are different from the other group in a way that is separate from the treatment. There are many questions that would challenge the validity of such a comparison group as an appropriate one to infer causality from the product, treatment or policy:
If they have not been chosen to get the business support product could it be because their business plan was not good?
Did the business not get the product because they were not the type of business that the policy or initiative was targeted to?
If using this model for evaluation, careful thought has to be given to the comparison group and how comparable it really is.
35
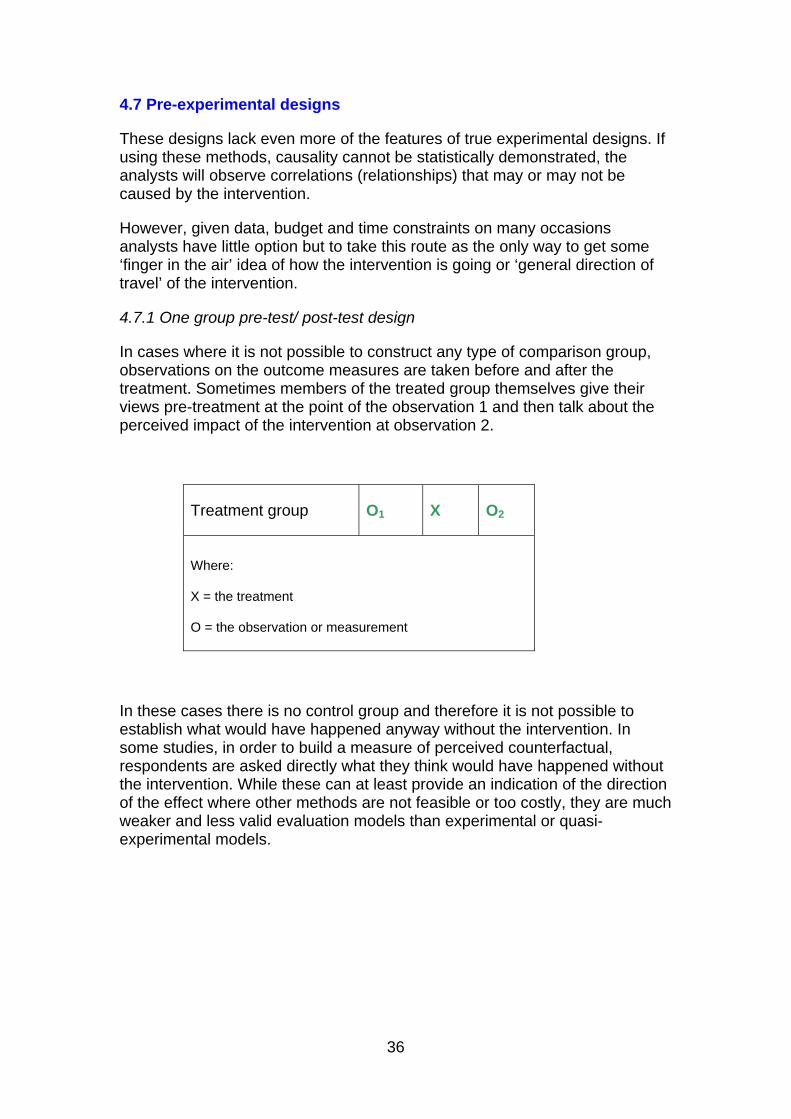
4.7 Pre-experimental designs
These designs lack even more of the features of true experimental designs. If using these methods, causality cannot be statistically demonstrated, the analysts will observe correlations (relationships) that may or may not be caused by the intervention.
However, given data, budget and time constraints on many occasions analysts have little option but to take this route as the only way to get some ‘finger in the air’ idea of how the intervention is going or ‘general direction of travel’ of the intervention.
4.7.1 One group pre-test/ post-test design
In cases where it is not possible to construct any type of comparison group, observations on the outcome measures are taken before and after the treatment. Sometimes members of the treated group themselves give their views pre-treatment at the point of the observation 1 and then talk about the perceived impact of the intervention at observation 2.
Treatment group O1 X O2
Where:
X = the treatment
O = the observation or measurement
In these cases there is no control group and therefore it is not possible to establish what would have happened anyway without the intervention. In some studies, in order to build a measure of perceived counterfactual, respondents are asked directly what they think would have happened without the intervention. While these can at least provide an indication of the direction of the effect where other methods are not feasible or too costly, they are much weaker and less valid evaluation models than experimental or quasi-experimental models.
36

These methods only demonstrate that between two points in time, there has been a change in the outcome variable. One would need a detailed understanding of the environment in which this change had occurred to form any assessment of whether this might be due to the policy. This would also be costly, which in turn would make it less justifiable on a value-for-money basis as it would never be possible to establish cause and effect.
4.7.2 Time Series
Time series is another useful model where: the policy or initiative cannot be randomly allocated; it is not feasible or practical to have a match group; or the policy has been applied to the whole population.
Treatment group O1 O2 O3 O4 X O5 O6 O7 O8
Where:
X = the treatment
O = the observation or measurement
Time moves from left to right
However this design is much weaker than a multiple time series as without a comparison group there is no way of knowing that the observed outcomes would not have happened anyway without the intervention. However it is a very useful monitoring tool and although it cannot totally infer causality, a big change in the data after the policy or treatment has been introduced does give an indication of impact.
37

4.7.3 One shot case study
This is probably the weakest evaluation method to provide a sense of impact as it is not even able to provide measures of association let alone causality of the outcomes observed. It is more often used to study the process of implementation rather than impact. Questions surrounding what worked and how it worked, and what did not work as perceived by the participants and administrators of the intervention.
Treatment group X O1
Where:
X = the treatment
O = the observation or
measurement
4.8 Note on statistical techniques
Although specific statistical techniques to explore and analyse the data are out of the scope of this publication, the further reading section covers publications on statistical techniques and their application in different settings. Statistical techniques are a highly specialised area and should be undertaken by analysts trained in basic and advanced statistical analysis. The following summary outlines some commonly used techniques in impact evaluations:
Sampling for experiments: Probability sampling (random assignment)
For matching treatment and control group can use: propensity score matching, nearest neighbour, matching by profile characteristics.
For exploring data, pre-treatment characteristics, profile analysis and cleaning data: normal curve; scattergrams; frequency counts; crosstabulations.
For looking at simple before and after differences and associations standard statistical techniques can be used in most models, to name a few: simple correlation coefficients and multiple regression analysis; t-tests; ANOVA; MANOVA.
For modelling programme or intervention effect often use: difference-in-differences; regression discontinuity design; instrumental variables; longitudinal or time-series analysis.
38

4.9 Key lessons from this chapter
The strongest evaluation models:
Combine before and after measures within ‘controlled’ conditions.
Use two groups: the treatment group (that receive the intervention) and the control group (which does not).
Random assignment to the treatment and control group is the best way to ensure control conditions.
Where random assignment and control is not fully feasible, methodologies tend to concentrate on before and after measures with matched groups – quasi-experimentation.
Other models are much weaker as it is harder to be certain of the causal link between the intervention and the outcome. If using these models, causality is mostly inferred rather than statistically demonstrated.
Weaker designs are able to look at association and correlations but not causation.
Studies will mostly be challenged by not having proper ‘control’ therefore not being able to measure ‘what would have happened without the intervention’, having poorly matched groups and not having before and after measures.
A table listing the models, their characteristics, strengths, weaknesses and commonly used statistical methodologies under each model listed in this chapter can be found in Annex F.
39

Chapter 5. Primary data collection methods and ‘business’ as the unit of analysis
5.1 Learning objectives
Upon completing this chapter, you should be able to do the following:
Understand that the data available for the study will determine which evaluation models are feasible
Understand the various potential sources of data available to evaluators and the distinction between existing administrative data and survey data collected specifically to evaluate an intervention
Identify the public and private datasets that can be used for matching businesses
Understand the kinds of systematic errors that cause biases in primary surveys
Understand the weakness and risks of using self-assessment surveys
Identify the specific issues and risks related to surveys of businesses
5.2 Introduction
When the evaluation approach has been decided, the evaluator should establish what data collection needs be undertaken and when, building on the monitoring and evaluation framework. The ability to monitor these outcomes and the characteristics that influence those outcomes must then be assessed. If there is no prospect of being able to observe key outcomes, an evaluation may not be feasible.
The importance of having high quality data cannot be overstated. This is because carrying out a robust impact evaluation rests on meeting stringent data requirements. It is vital to put in place the measures needed to collect
40

the relevant data at the earliest opportunity (and preferably well in advance of the intervention being made).
This chapter does not replace a good textbook or guidance on survey methods or collection of administrative data, and it assumes a reasonable level of understanding of survey methodology (please see De Vaus, 1996 in further reading). Its primary aim is to highlight key issues that need to be considered when the ‘business’ is the unit of analysis. It will look at the most common issues relating to data collection:
The use of existing data sources, particularly administrative data
Primary data collection methods such as surveys
The difficulty in measuring outcomes through surveys
The advantages and disadvantages of using self-assessment
5.3 Use of existing data
The first step in terms of data collection is to explore whether existing data sources provide information on the chosen outcomes and to consider measures needed to control for differences in the characteristics of treated and untreated groups. If the available data are thought to be comparable for both groups, and of sufficient quality, the next step is to establish whether it is possible to access the dataset and whether it is large enough to detect any impacts from the intervention. (See Chapter 6 of the Magenta Book for further details).
Where secondary analysis of existing data is possible, this can greatly reduce the costs of evaluating the impact of an intervention. The other advantage is that if the data are longitudinal, they can be used to establish outcomes in the pre-intervention period, which improves the likelihood of being able to identify a well-matched comparison group and estimate a robust counterfactual (see Section 5.6 for description of matching).
5.4 Data collection
If existing data are unavailable or inadequate, it may be necessary to collect new primary data specifically for the purpose of evaluating the intervention. Businesses to whom the intervention is targeted can often become a key source of evidence on the effectiveness of BIS policies and are often used in quasi-experimental and in pre-experimental type approaches.
41

However there are difficulties with gathering primary data from the business community. As primary data collection can be costly, it should only be undertaken where there is a good prospect of producing a robust impact estimate. The following factors affect whether this is the case:
The availability of sampling frames - detailed lists of businesses from the group being treated that include some contact details – for both firms in the treatment and comparison groups.
The ability to collect data in the pre-intervention period as any an inability to do this here will undermine the robustness of the counterfactual.
The reliability of the data collected. If the subject matter is sensitive (for example, asking firms if they have engaged in unlawful activity), the responses may be less truthful, or the response rates lower. Data may also be less reliable if they are unlikely to be routinely compiled by the firm.
The quality of the data collected also depends on the skill of the interviewer and on selecting a respondent able to provide the information sought.
Evaluators will have to weigh up the pros and cons of different interview methods. For example telephone interviews are less costly than face-to-face interviews but may not produce the desired information (please see Table 7 for more analysis of this issue).
The time-burden on respondents in terms of the length of the interview needed to collect the required information and research ‘fatigue’. If response rates are likely to be low because of either of these factors, then ways of mitigating these problems should be considered. These might include focusing the survey on a more limited range of outcomes or combining it with a survey collecting data on similar items, thus reducing duplication.
The number of survey responses needed to detect an impact from the intervention. A low rate of response to a survey required to collect information on outcomes would reduce the likelihood of being able to detect an impact from the programme. A small sample would result in a similar problem (unless it represented a large fraction of the population)
The feasibility of collecting data on untreated groups, whose absence would distort the evaluation. Firms may be unwilling to co-operate with data collection if they do not expect to benefit from an intervention. Therefore ways of encouraging untreated firms to participate in the survey should be considered from the outset.
42

A report for BIS by the National Centre for Social Research (McGee et al, 2009) provide a list of evaluative criteria to be considered when carrying out surveys. This is a useful reference source to be considered when contemplating setting up surveys (see Annex G).
When collecting primary survey data there is a risk that a bias may creep in. There are many kinds of systematic errors that can cause biases that can affect the validity and reliability of the results of a survey. These are discussed in more detail in Section 5.7 and a full list can be found in Annex H.
5.5 Available administrative data
Administrative data – information collected by government agencies for various reasons - can be a useful source of information in carrying out an evaluation, both as a sampling frame from which to run a survey and as a way of verifying the findings of survey data analysis. It might also be possible to use administrative data instead of survey data, depending on whether they contain suitable outcome measures as well as characteristics related to outcomes.
They can be a useful source of information in carrying out an evaluation, both as a sampling frame from which to run a survey and as monitoring data on input, activity, output and outcome measures. They can be used to identify response bias, by comparing the characteristics of survey respondents against those of the wider population of firms. Where biases are apparent, the data can be used to weight responses to be representative of the population as a whole.
Pre-programme tests, based on administrative data, can be used to assess the robustness of the counterfactual. The larger sample sizes that administrative data provide increase the likelihood of detecting statistically significant impacts on sub-groups, making it possible to explore whether the intervention is more effective for particular types of firms without the costs of conducting a large survey. Reporting requirements also reduce the likelihood that data are missing on individual items in some administrative datasets – a problem that can arise with survey data.
If information on outcomes is available in both administrative and survey data, this opens up the possibility of triangulating - comparing outcomes observed for survey respondents against outcomes for the wider population (see section 6.7 for further detail). If both data sources suggest similar outcomes this would increase confidence in the findings. Likewise, if there were significant differences in the outcomes observed from administrative and survey data sources, this would highlight the need for further analysis to reconcile the two estimates.
It is important to assess the quality of administrative data before using them to evaluate the impact of an intervention, as this is likely to bias impact estimates particularly where the quality differs between treated and untreated groups. However, the size of the impact observed may be affected if there is measurement error. The type of administrative data available will often define
43

what kind of evaluation study is possible: experimental, quasi-experimental, or pre-experimental. To use administrative data in an experiment it would be necessary to have: pre-treatment and post-treatment data; random allocation of treatment; and, observations for treated and un-treated groups.
5.5.1 Which administrative data are useful for evaluation?
A good administrative system should ideally have sufficient fields available for linking or matching with existing databases of businesses such as Fame, Companies House, HM Revenue & Customs, the Inter Departmental Business Register and other commercially available databases. Evaluators need to consider the key fields that should be ideally captured by an administrative/monitoring system (see Table 4), as they are useful for basic monitoring, running surveys of the businesses and/or matching. These fields should ideally be accurately filled in for all participants. Administrative data may or may not be pre-existing, and it may or may not be used for monitoring. It is also worth remembering that the evaluator will not have any control over the fields available in pre-existing data.
Table 4: Key fields for administrative data
Basic details for profiling
What are these fields useful for other than basic monitoring?
Title Basic monitoring
Name Basic monitoring
Surname Basic monitoring
Company name Matching with national databases
Trading name if different Matching with national databases
Address 1 Basic monitoring
Address 2 Basic monitoring
Address 3 Basic monitoring
Address 4 Basic monitoring
Address 5 Basic monitoring
Post code Matching with national databases
Phone number Basic monitoring
Mobile Important if business phone number no-longer working
e-mail address Important if business phone number no-longer working, also useful for on-line surveys
Pre-start Basic monitoring
Start-up Basic monitoring
Established business Basic monitoring
How old? (Trading since?) Basic monitoring
Sector (SIC code) Basic monitoring
Turn over Basic monitoring
Number of employees Basic monitoring
Companies House reference number (CRN)
Linking with national databases
VAT Linking with national databases
PAYE Linking with national databases
44

Standard fields and definitions are of paramount importance if the results of the evaluation are to be compared with other studies. Annex I outlines some of the most commonly used definitions and classifications and it is strongly recommended to follow these to improve the comparability of the results.
5.6 Matching and linking
In addition to the more known datasets for matching business such as the IDBR and Companies House, the Virtual Microdata Laboratory (VML) is an ONS facility for accessing restricted data sets for the purposes of data linking and economic and statistical modelling (See Annex J for a list of available datasets; and Bewley et al, 2010 for a literature review and Annex E). Currently the only VML terminals are in ONS offices, BIS is in the process of arranging for terminals to be located in London and Sheffield. In the past VML has been used for such research as an evaluation of the Welsh Assembly Government’s Communities First Programme, Pay in London and assessing barriers to UK innovation with reference to the 2009 Community Innovation Survey.
5.7 Business as the unit of analysis in surveys: areas that make business particularly hard to survey
As was noted at the outset of this report, businesses present extra challenges for an evaluation that individuals do not. There are many kinds of systematic errors that cause survey biases, which affect the validity and reliability of the results of a survey. For this reason the design of the questionnaire, choice of survey mode, and the sampling and management of fieldwork are critical elements of surveys and need careful consideration, taking account of both conceptual issues as well as practical implications. Technical assistance from an experienced statistician or social researcher in survey methodology should be sought when setting up a survey or thinking about commissioning one (see De Vaus 1996 for further information).
The validity and reliability of these studies is likely to depend on a number of factors that are particularly salient in the studies of impact of business support product interventions. Failure to address the issues below can lead to systematic errors on the data provided by respondents and biased or even wrong data being collected. A diagrammatic explanation of all the dangers to conducting a survey can be found in Annex H, but the most salient can be found in the checklist in Table 5 with key problems with surveys to determine impact when businesses the unit of analysis in Table 6.
45
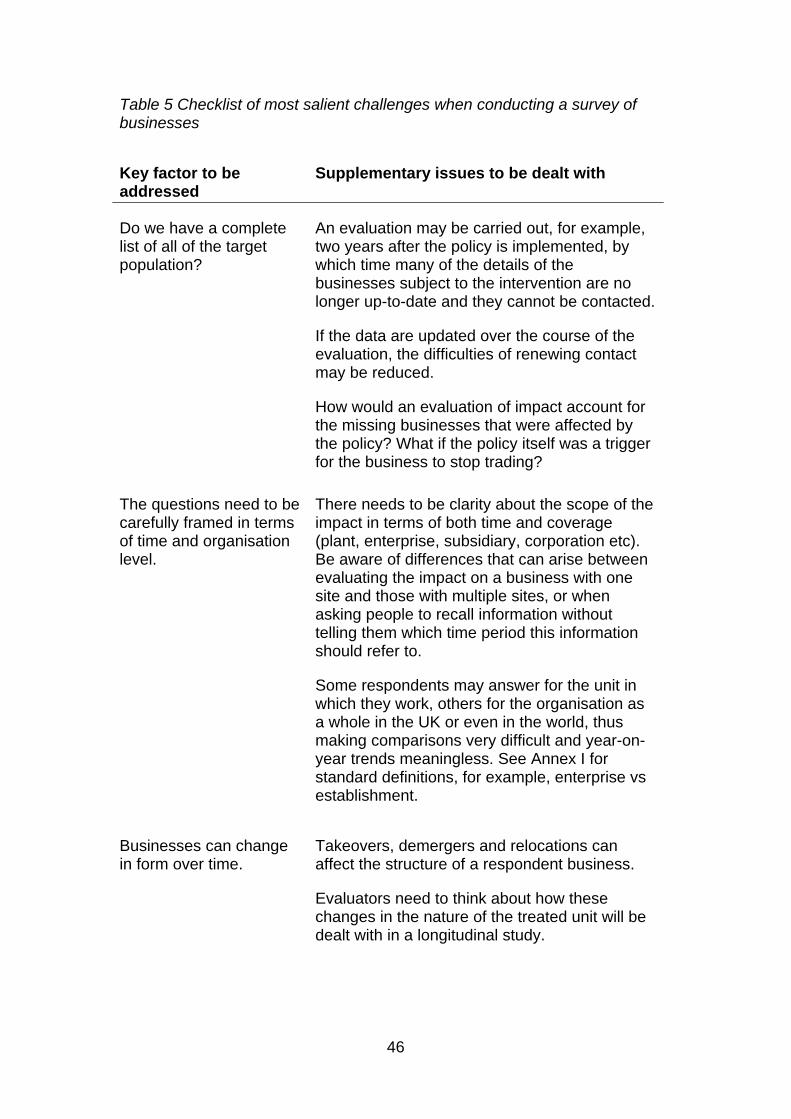
Table 5 Checklist of most salient challenges when conducting a survey of businesses
Key factor to be addressed
Supplementary issues to be dealt with
Do we have a complete list of all of the target population?
An evaluation may be carried out, for example, two years after the policy is implemented, by which time many of the details of the businesses subject to the intervention are no longer up-to-date and they cannot be contacted.
If the data are updated over the course of the evaluation, the difficulties of renewing contact may be reduced.
How would an evaluation of impact account for the missing businesses that were affected by the policy? What if the policy itself was a trigger for the business to stop trading?
The questions need to be carefully framed in terms of time and organisation level.
There needs to be clarity about the scope of the impact in terms of both time and coverage (plant, enterprise, subsidiary, corporation etc). Be aware of differences that can arise between evaluating the impact on a business with one site and those with multiple sites, or when asking people to recall information without telling them which time period this information should refer to.
Some respondents may answer for the unit in which they work, others for the organisation as a whole in the UK or even in the world, thus making comparisons very difficult and year-on-year trends meaningless. See Annex I for standard definitions, for example, enterprise vs establishment.
Businesses can change in form over time.
Takeovers, demergers and relocations can affect the structure of a respondent business.
Evaluators need to think about how these changes in the nature of the treated unit will be dealt with in a longitudinal study.
46

Key factor to be addressed
Supplementary issues to be dealt with
The respondent should be the person best placed to answer the question.
The respondent selected may not be the most appropriate for addressing specific questions.
The respondent may only have partial knowledge of the business and may give responses in areas where they do not have full knowledge.
Even if the respondent is the right person to ask, questions may relate to past performance that is hard to recall, or refer to a period when they were not at the firm.
In large organisations there may be many possible respondents who between them can give the constituent parts of the whole picture – how can this be addressed in a study?
The respondent needs to understand the question.
The terminology used needs to be understood by the respondent and have the same meaning for everyone. See Annex D on the difficulties of asking a question to measure turnover.
Business terminology is technical and often we have no clear assessment of whether respondents understand what is being asked and whether they go through the same mental processes to arrive to the answer.
If the survey seeks to get a measure of ‘what would have happen otherwise’ the respondent may need support to construct the counterfactual relevant to the impact question asked.
Respondents may have difficulty in putting a figure on the perceived benefits even if they have all other financial information.
The respondent needs the right encouragement to provide an accurate respond or even to participate.
Business not subject to the intervention may refuse to participate in a survey or provide data. Low response or data completion will seriously undermine the validity of the measure of impact.
47

Key factor to be addressed
Supplementary issues to be dealt with
Beneficiaries Need to understand that beneficiaries of a BIS product like a grant may be inclined to inflate estimates of impact if they believe this might benefit them in the future.
Responses need to be comparable across the full range of interviewees.
Firms may be in receipt of a range of different treatments in addition to the one being evaluated.
Biases can affect different sectors of the population differently.
Different sub groups can understand questions differently.
The survey mode has to be suitable for the objectives of the study.
The respondent needs to be happy to provide information using the interview mode chosen.
Questions asked over the telephone without prior warning may induce a respondent to guess the answer and so not necessarily provide accurate information.
Telephone interviewing may not be the best way to identify the respondent with the required information.
Face-to-face interviews may be the most effective method of obtaining the desired information but they are more costly.
Postal and web-based surveys tend to yield very low response rates.
48

Table 6: Key problems with surveys to determine impact when business is the unit of analysis
Comprehensiveness of sampling frame
*Limitation to respondent’s knowledge about programme participation
*Ability to quantify outcomes and impact of programme participation
*Difficulty in estimating counterfactual outcomes
*Biasing effects of asking beneficiaries satisfaction/views/impact of a ‘free service’
*Ability to talk to the ‘right respondent’ the one with the knowledge
*Ability of the respondent to recall the information
Coverage of failed businesses
*Low response rates
Time in which impact is supposed to be realised
Intervening schemes/programmes/ the wider economic background
Note: those with an * are particularly salient to self-assessment surveys (see next section for further details)
5.8 Self assessment studies
When other options available are too expensive or unlikely to yield a robust impact assessment, evaluators may opt for self-assessment studies where the target population of a programme assess the impact it has had on their business. These are seen as light-touch exercises that often combine customers’ experiences with a measure of impact. These have been widely used across the Department, Solutions for Business, Enterprise Directorate, UKTI and former RDAs. A self-assessment study on its own is a pre-experimental design, as observations are possible only on one group, there is normally no pre-intervention measure and the respondent is often asked to construct the counterfactual. Self-assessment is deemed to provide:
A ‘finger in the air’ idea of what is/may be happening.
Can provide a ratio between the evaluation cost and policy implementation cost.
49
However surveys that rely on self-assessment by businesses raise important issues about the reliance on the target population for the evidence on the impact of policies and support products and the applicability of the surveys findings to experimental methods. The key questions evaluators should ask are:
Can we rely on what ‘the target population’ say about the intervention? Particularly where the target population is a ‘beneficiary’ of a grant or support.
What is their ability to provide us with an accurate description of the economic impact of the support received?
How do we ensure that a grant recipient does not inflate estimates of impact if they believe this might benefit them in the future.
If so, which would be the best way of gaining this information from them?
How can we best use that information to inform an assessment of the policy that generates the support?
There are many ways of eliciting impact information from businesses that are targeted by a policy. BIS frequently uses telephone surveys to elicit companies’ views on the impact of the support they have received. However to ensure the respondents provide the correct information, the interviewers have to ask a number of relatively complicated and detailed questions on profits, overall cost and economic benefits.
The National Centre for Social Research reviewed self-assessment (McGee at al, 2009) as a methodology to measure impact. It concluded that although it provided a perspective on the possible impact of the intervention, the weaknesses of such an approach meant these studies should, whenever possible, be set along side other approaches or data sources on impact and then the results should be triangulated.
50

5.9 Key messages from this chapter
Good administrative data are key to a successful evaluation; if the administrative system is being built alongside the policy development a careful definition of the fields that the administrative dataset should contain should be agreed at the outset of any policy or initiative.
Primary data collection can be expensive so the evaluator needs to assess the likelihood of gaining robust findings before going ahead. For this reason three tools should be used at the scoping stage of a survey:
Use the resources in McGee et al. (2009) (see Annex G) list of ‘Evaluative Criteria’ that should be considered when carrying out surveys as a useful reference source.
Annex H and the checklist in this chapter to understand the likelihood of error.
Self-assessment may offer a lower cost alternative to primary or secondary data analysis but it carries with it its own disadvantages that have to be acknowledged.
The evaluator has to be open and transparent about the strengths and weaknesses of the data collection methods selected. Reports should contain a methodology section where these are discussed again using the three tools above as templates.
Survey methodology is highly technical. An experienced statistician or social researcher on survey methodology should be consulted throughout the whole survey process, from inception to reporting.
51
Chapter 6. Risks to a successful impact evaluation 6.1 Learning objectives
Upon completing this chapter, you should be able to do the following:
Know the threats to producing a valid and reliable impact evaluation.
Understand the importance of identifying indirect outcomes – both positive and negative – that are likely to arise
Understand the concepts of displacement and spillover and how they can distort the evaluation
Appreciate the different timeframes over which the impact of a project may have to be measured.
6.2 Introduction
Because of the number of decisions that need to be taken when selecting a methodology and because of the long time period over which it is run, the evaluator faces many challenges to achieving a successful impact evaluation. It is therefore important to keep in mind the potential risks at all times during the construction of the evaluation. While there are many risks to be borne in mind the main, albeit interrelated, categories of risk are:
Those related to the core principles behind a successful evaluation (see Chapter 3):
o Capability of proving causality, therefore impact
o Threats to robustness; validity and reliability
Accounting for other sometimes un-planned outcomes
Spurious accuracy
Issues with time in which an outcome may be apparent and therefore measurable
52

6.3 Principle #1: measurement of the counterfactual and capability of proving causality
Successful impact evaluations will be judged by their capability of proving causality, measuring the counterfactual and therefore estimate impact. The evaluation model applied will already dictate whether estimates of causality are possible or whether they are just measures or correlation, association or difference. A reminder of the key elements to prove causality, approximation to these will strengthen the causal conclusions:
before and after measures of outcomes
random allocation of treatment and control group
control (see also Chapter 4 on evaluation models)
6.4 Principle # 2: Robustness and threats to validity and reliability
The evaluator needs to keep in mind all the possible challenges to the validity and reliability of the study. As we have seen these can come in through many of the stages of evaluation process, from the design to the analysis and presentation of findings stages.
This report has covered the key areas that an evaluator needs to pay particular attention to in order to ensure robustness of estimates of impact:
- Making aims and objectives of a policy or programme measurable; definition of target population and treatment: capability of measurement of input, output and outcomes that underpins the evaluation model and its capability of capturing them (see Chapter 2, Annexes A, B and C)
- Feasible evaluation models and their ability to measure a causality or just association: capability of capturing before and after measures; having a control group and control (see Chapter 4 and Annex F)
- Issues surrounding administrative data and the primary data collection methods applied (see Chapter 5 and Annexes G, H, I,)
- There are further issues to consider with statistical analysis techniques applied and the strength of the association found in impact studies. These are out of the remit of this publication. Annex F touches upon statistical techniques used in evaluations to derive measures of association and difference. The ‘Further Reading’ section provides some examples of statistical approaches used to derive impact measures.
53

The evaluation model chosen in the setting up stages may already suffer from weaknesses or threats. It is important to outline these at the outset as part of the assessment of potential risks and look at them in relationship to the costs of the project and look for ways in which the impact of these will be minimised, controlled or, at the very least, observed. The next section provides a summary of issues that are particularly salient in impact evaluation studies.
6.4.1 Threats to validity: Is the study measuring what it was intended to measure?
The ideal research design effectively controls for alternative reasons - other than the actual treatment - that could have an effect on the desired outcome. These alternative reasons are called extraneous variables. Uncontrolled extraneous variables can threaten the internal validity of a study, because they may actually be the factors that explain the observed results, rather than the treatment.
Table 7: Threats to internal validity an experimental/quasi-experimental research study might come across.
History Events in the subjects’ environment, other than the treatment that occur between the pre-intervention and post-intervention observation measurement.
For example, currently the most challenging event is the economic downturn that affects all businesses. How to account for it in evaluations of impact of interventions on businesses needs to be taken into consideration.
Maturation Any physical or psychological changes taking place within subjects that occur with the passing of time - separate from the experimental manipulation.
Maturation in a business setting could include leaders gaining knowledge, getting better at management practices, becoming tired and so on. Staff members can change and those staying become more or less tolerant.
Within a business context the products can also mature and so an evaluation may identify effects (such as profits) that are in fact due to different product life cycles.
54

Testing effects Changes that occur in what is being measured because of reactions to the process of measurement. The subjects of the experiment might be more aware of the aim of the study the second time questions are posed to them.
For instance, in an attitudinal study the subjects might have to answer questions they had never thought about and the second time these questions are asked the subjects might have re-examined their responses.
Furthermore it is difficult within a business context to offer a placebo that is not obvious as such to the business concerned (unlike the medical one in Section 4.4). Responses may be affected by an awareness of whether the firm is in the treatment or control group.
Construct validity The extent to which the objectives of a policy or intervention are measurable; how well the objectives fit together and how these are measured.
Instrumentation Changes in the calibration of the measurement – the way questions are phrased or answers measured - may produce changes in the measurements. For example a change in the definition of the number of employees at a firm from full-time only at the pre-intervention stage to full- and part-time after the intervention would have an effect on the results that would be due to the calibration rather than the intervention.
This also applies to changes in the personnel involved in the measuring or to any subjective changes in scorers’ opinions that lead to different scores.
Statistical regression The tendency of respondents to give answers that move closer to the mean or average score (regress) on a second administration of the test.
55

Selection Biases resulting in systematic differences in the selection (composition) of the treatment and control groups. This is of particular relevance when a matched group or comparison group is sought.
In a business setting observable variables are often used for matching, such as business size, region and sector. However normally unmeasured variables may make for a more robust matching strategy. These include the calibre of the leaders, management structures, the quality of product and the firm’s financial structure.
Experimental mortality or differential attrition
Where businesses fail, get transformed or re-named after the intervention.
Cumulative effect of interaction of factors
The cumulative effect of two or more of the above mentioned factors would obviously pose an incremental threat to internal validity.
Based on Campbell and Stanley (1963) and Singleton (1988).
As discussed in chapter 3 external validity looks at whether the results of a study can be applied to other places, time and/or situations to see if the treatment would have the same effect if applied to other business in the same target population.
56

Table 8: Threats to the external validity of an evaluation study
The reactive or interaction effect of testing
The experiment might increase or decrease respondents’ sensitivity to the treatment. Differences in the observations of the treated and non-treated groups may therefore be caused by a reaction of the treated group to the idea of being subject to an intervention as well as a response the measures in the intervention.
Sample selection biases interacting with the experimental variable
Extreme caution must be used in generalising any effect of the independent variable to dissimilar groups.
Reactive effects of experimental arrangements
The effect of a treatment might differ between the experimental setting and the non-experimental setting.
Multiple-treatment interference This is likely to occur whenever multiple treatments are applied to the same respondents, because the effects of prior or concurrent treatments are not always measurable.
Historical circumstances surrounding the experiment
The treatment might work only because of the specific historical circumstances in place during the experiment.
. Based on Campbell and Stanley 1963 and Singleton 1988.
6.4.2 Factors relevant to reliability
As we also saw in chapter 3, reliability is concerned with questions of stability and consistency or repeatability. If the study were carried out again, would it produce the same findings? One factor to bear in mind is that the level of interest in the programme may change over time and the resources devoted to it may increase or decrease. Many of the issues that affect validity covered in the previous section also affect the reliability of a study.
Often the most cited issue surrounding reliability is the comprehensiveness of the coverage of the target population. If all of the target population take part in the study, or if a random sample is drawn based on statistical theory, the reliability of the study will be much greater. On the other hand if only a certain subset of the target population is subject to the intervention the findings will be less reliable if the findings of the study were repeated with a different subset.
57

If the sample is not random the findings are likely to be biased and not reliable.
6.5 Errors and biases relating to data collection
As was discussed in detail in Chapter 5 and Annexes G, H, I, there are many kinds of systematic errors relating to primary data collection that can cause biases. While these will not exist in every survey the priority at this stage should be to minimise the risk of bias. Some of the issues highlighted can also affect administrative data. In summary the main ones are:
Coverage error Population list is not full
Sampling bias Due to non-random sampling
Non-response error Views of non-respondents missed
Adjustment error Weighting not applied properly
Construct error Questions are badly phrased
Measurement error Inaccurate measures are used
Strategic bias Respondents answer for their own benefit
Cognitive bias Respondent not knowing the answer
Interviewer bias Interviewer systematically asking the question the wrong way
Social desirability bias
Respondent aims to give the socially acceptable answer
Scope bias Respondent fails to capture whole picture
Property right bias Respondent feels entitled to the benefit and so does not value it (not relevant where the treatment is a regulation)
Processing error Coders make systematic errors in filing answers
58

6.6 Direct, indirect or secondary outcomes
An intervention is usually made to tackle an observed problem and so the stated policy objectives identify the direct, intended outcomes. However, an intervention may also have indirect effects. These are impacts beyond those that the intervention is principally designed to bring about. For example, if an intervention has the expressed aim of increasing workforce skills and labour productivity, changes in training received and in labour productivity would be direct indicators of the impact of the intervention. They could be supplemented by measures of indirect impact, such as changes in employee commitment, job satisfaction and the cost of training, which give a more detailed understanding of the effect of the intervention. Another measure might be profits, which would decline if the training did not raise productivity sufficiently to cover costs. The main indirect impacts on firms outside of the treatment group come through displacement and spillover. Explanations are covered in the following two sub-sections while issues relating to valuing those effects are discussed in section 7.9.
6.6.1 Displacement
Displacement occurs when an intervention targeted at a particular group of firms and intended to have positive consequences for them, has an offsetting negative impact on firms outside of the treatment group. The overall result is that any positive impact from the intervention is reduced or outweighed by these negative effects. Thus, the intervention redistributes outcomes from one set of firms to another. This can be the case when an intervention places treated firms at a competitive advantage, whilst weakening the trading position of their competitors. For example, a grant to allow otherwise uncompetitive firms to continue to operate could place their more commercially viable rivals at a disadvantage and increase the likelihood that they fail.
The issue with displacement is that if untreated firms are disadvantaged by assistance offered to treated firms, this makes any positive impact of the intervention appear relatively stronger relative to the counterfactual. Evaluators can minimise the risk that displacement leads to misleading finding:
Assess the likelihood that a given intervention will result in displacement. For example, if some firms within a sector are offered assistance whilst their competitors are not, it is likely that some displacement will occur.
Consider how far any displacement might extend for example, to all firms, or just those within a particular sector. It may then be possible to identify an untreated group that is less likely to be affected by displacement. For example, if the intervention is targeted at a subset of firms within a given sector, firms from outside that sector, which are not competitors but operating in a sector with similar characteristics, may offer the best counterfactual.
59

Use a descriptive analysis of the outcomes under consideration, before and after the intervention for treated and untreated groups, might detect patterns in the outcome variables consistent with displacement. For example, a marked worsening in outcomes for the untreated group in the post-intervention period might be indicative of displacement.
6.6.2 Spillover
Like displacement, spillover arises when an intervention has impacts on firms that are not the direct targets. However, with spillover any positive impacts on firms in the treated group are accompanied by positive impacts on firms outside of the treated group, resulting in a net benefit which is greater than that captured by the impact estimate. Spillover is particularly likely in a business context as the networks that exist between firms (for example, relationships with customers and suppliers) can affect the estimate of the counterfactual. For example, an intervention that induces firms to innovate may overcome a problem of sub-optimal investment. Network effects may then result in firms outside of the treatment group innovating.
If untreated firms become aware of the treatment and modify their behaviour as a result, or indirectly benefit from the treatment, the counterfactual provides a less accurate indication of what would have happened if the intervention had not been made. Evaluators can take steps to design an evaluation that accounts for the presence of spillover effects:
Assess the likelihood that the intervention will have spillover effects and develop a theory of what might causes those effects, who would be affected and how.
To measure spillover effects accurately, one should take account of them in the evaluation design from the start. Evaluations that do not take those into account from the beginning will not be able to measure spillover effects.
Select a control group that will not be indirectly affected by the intervention.
6.7 Unit of analysis
In drawing up a list of outcomes likely to be affected by the intervention, it is important to consider the level at which they should ideally be measured i.e. the workplace, organisation, sector, industry, region or country. Measuring outcomes at the level at which the unit is treated (the unit of treatment) maximises the likelihood of observing the impact of the intervention on treated firms. Observing impacts at multiple levels may be a useful approach if displacement or spillover is suspected. However, data on outcomes may not be available at the level at which the treatment is administered. Also, multiple levels of observation may be possible, or the available unit of observation may vary depending on the outcome under consideration.
60

It is feasible for the unit of analysis to differ from the unit of treatment, provided there are grounds for expecting the impact of the intervention to be manifest at that level. If only a small proportion of firms within a sector are eligible for an intervention, it might be impossible to detect an impact on outcomes for the sector as a whole. Expectations about the likely size of the impact and the proportion of units affected should inform the decision about the prospects of capturing the impact of the intervention in the available data.
Having a different unit of analysis and unit of treatment may help identify displacement and spillover effects. Using a larger unit of analysis – for example, a firm rather than just a single workplace – it may be easier to see indirect outcomes that might not be visible within the unit of treatment alone. If data are available at multiple levels of aggregation, they could also be used to explore displacement and spillover effects.
6.8 Time period
An intervention may have short-, medium- or long-term objectives, or all three, so it is necessary to design the evaluation in a way that captures impacts over any periods across which they are likely to be observed. Some outcomes may be most likely to occur in the short-term, whereas others would only be expected to emerge over time. For example, a short-term objective of offering firms a training subsidy might be to increase the proportion of the workforce undertaking training. Any impact that the intervention had in raising training activity might be apparent within a few months of its introduction. A medium-term goal might be to increase labour productivity, but this might only emerge after staff had completed their course of training. A further objective might be to sustain any increase in productivity over the longer-term.
It may be useful to incorporate both short-term and long-term impact evaluations into the timetable, particularly when there is a need for early evidence to make policy decisions: for example, whether to extend pilots nationwide. However, impacts that occur in the short term are not always sustained, so a degree of caution is needed in reporting these. On the other hand, the value of observing longer-term impacts has to be assessed against the potential problems of making contact with respondents a long time after sampling.
It is also important to allow time for outcomes to feed through into the data used to assess the impact of the intervention. It may be many months before administrative data are released or survey data are collected.
6.9 Spurious accuracy: the biggest challenge to any evaluation
Spurious accuracy occurs when the results could be misinterpreted as implying a degree of accuracy that is not warranted because of the limitations of the evaluation model and methodologies applied.
61

Many of these limitations will be dependent on how the evaluation method is applied. Often these limitations are very clear from the outset:
Incomplete list of businesses subject to the treatment (population list) that means only those for which evaluators have details end up being studied.
Poor sampling: for example the use of quota samples, where evaluators can use their discretion to select the group, means biases may creep in due to the biased distribution of those selected for study.
Poor monitoring data that mean those that are more difficult to contact or get the monitoring data up-dated are out of the scope of the evaluation. This is only important for evaluations that require monitoring data.
Monitoring data that may be complete but which are only available for some recipients of the products.
Low response rates if running surveys for the evaluation. If the response rate is 20%, on what basis can we infer the findings from the 20% to the remaining 80%? (See Box 6 section 4.5.1)
It may be difficult to account for businesses that have failed during the course of the evaluation although the degree to which this is important will depend on the nature of the intervention and the datasets available.
Where there is a limited number of variables available for use for matching to build comparison group.
If the estimate is based on a small sample, the confidence intervals will be wide.
The presentation of statistical correlations and measures of difference in reports as proving causality when the impact evaluation model applied could not measure the causal link.
These issues all imply a risk that the results will be of spurious accuracy. This possibility needs to be assessed before the evaluation strategy is firmed up. Often the problem is not that evaluations suffer from spurious accuracy but that the reporting of the evaluation is not sufficiently open, clear and transparent, leading to the wrong conclusions and policy recommendations being made. To stop this from happening evaluations should contain a very open and transparent methodology section that fully covers issues surrounding validity and reliability of the methods used and enables challenges to the causal conclusions about the intervention.
62
6.10 Triangulation
One means of establishing the degree of measurement error or bias in the evaluation method chosen is to seek to corroborate the estimates by using multiple sources to verify the results. Triangulation means policy advisers can use different sources and methods in order to look at a single outcome or set of outcomes, and establish whether estimates appear plausible when set alongside estimates obtained using other methodologies.
The advantage is that this can provide external validation for estimates of costs, benefits and impact and can also prevent fixation on a single number that may emanate from one methodology, thus avoiding the pitfall of what the Green Book calls ‘spurious accuracy’ (see 6.9 above). The disadvantage of triangulation is that evaluation via multiple methods is potentially more costly. Wherever possible it is recommended that multiple methods be applied in a way that complement each other and findings can be cross-checked as this would make for more valid findings.
6.11 Key messages from this chapter
The importance of establishing the evaluation method feasibility at the outset in the context of possible spurious accuracy, budget, timetable, ethical considerations and likely impact of the evaluation cannot be stressed enough.
Evaluators must be open at all times to the possible weaknesses of the methodology used. Always have a methodological section that discusses the possible challenges to inferences made on causality and measurement of outcomes and explains how they have responded to the challenges.
The risks to validity and reliability should be borne in mind throughout the evaluation project. Section 6.4 provides a useful reminder of risks to robust impact evaluation estimates.
Researchers should think about indirect outcomes as well as direct ones, as these can affect both the outcomes that need to be measured and the robustness of the counterfactual case being used.
Triangulation is a useful tool for evaluators.
63

Chapter 7. Cost benefit analysis and the green book 7.1 Learning objectives
Upon completing this chapter, you should be able to do the following:
Understand the importance of conducting a Cost Benefit Analysis, and the factors which affect it.
Understand the Benefit Cost Ratio and in particular that its robustness is highly dependent on the evaluation model used and validity and reliability of the methodologies applied.
See the importance of having clear and transparent methodology sections when discussing the Benefit Cost Ratio that clearly outline what is in, what is out and what assumptions have been made
7.2 Introduction
Cost Benefit Analysis is primarily used in impact evaluations, which estimate costs and benefits. It attempts to quantify in monetary terms as many of the costs and benefits of a policy as feasible, including items for which the market does not provide a satisfactory measure of economic value.
The first step in producing the Cost Benefit Analysis is to estimate the relevant costs and benefits on society of the policy being evaluated. The evaluation should also seek to bring in wider social costs and benefits (where possible) and consider any unintended consequences.
A robust Cost Benefit Analysis will consider a number of factors. These are:
Definition of costs and benefits
Discounting costs and benefits
Estimating additionality, deadweight, displacement and spillovers
Identifying transfers and assessing distributional impacts
Calculating costs and benefits in cases of foreign ownership
64

7.3 Definition of Costs and Benefits
Evaluations should adopt a standardised treatment of costs. It is recommended that an evaluation should include administrative costs, and an allowance for overhead costs, grant expenditures, and the direct costs of subsidised services.
Costs should be calculated in terms of relevant opportunity costs. This means identifying the alternative use for the resources employed. For an investment this may mean that you do not use the actual cost of the investment, rather you use the return that would have occurred had the resources been used for another purpose.
Any BIS evaluations should specify the benefits, which should be given monetary values, which are comparable. For instance, where Gross Value Added (GVA) is used as a measure of monetary benefit, this should be done according to an agreed definition of method, taking into account data/ cost constraints.4 If GVA cannot be directly estimated, then the basis for deriving GVA should be clearly stated.
All costs and benefits should be assessed at market prices. Differences in tax treatment may create differences between options. In this case prices should be adjusted to ensure that all costs and benefits reflect their true opportunity cost. Before doing this, it is worth considering whether such an adjustment would make a material difference.
The Cost Benefit Analysis should not include transfers, such as taxes or subsidies, since they may change the overall distribution of income but will not change the amount of income generated by the economy.
Policy development appraisals have often been subject to optimism bias. That is the systematic tendency for appraisers to be over-optimistic about key project parameters. Evaluators tend to overstate benefits, and understate timings and costs, both capital and operational. Appraisers should adjust for optimism bias by using relevant empirical evidence such as previous experience of cost overruns and project delays. This will help them to increase estimates of costs and decrease estimated benefits. Both cost estimates and adjustments for optimism should be independently reviewed before decisions are taken. Annex 4 of the Green Book provides more details.
7.3.1 Considering unvalued costs and benefits
Costs and benefits that have not been valued should also be clearly described in evaluations or appraisals. They should not be ignored simply because they cannot easily be valued. Non-monetary measures should be considered, such as time saved or carbon abated. The most common technique to put a value on costs and benefits that have no monetary valuation is weighting and scoring (also known as multi-criteria analysis). The basic approach to 4 The Office for National Statistics outlines the three key methods to calculate GVA. One of the commonly accepted methods is to calculate sales less cost of sales.
65
weighting and scoring involves assigning weights to criteria, and then scoring options in terms of how well they perform against those weighted criteria.
7.4 Discounting costs and benefits
Discounting is a technique used in Cost Benefit Analysis to compare costs and benefits, which occur in different time periods. It is a separate concept from inflation, and is based on the principle that, generally, people prefer to receive goods and services now rather than later and to defer costs to future generations. This is known as ‘social time preference’.
The ‘social time preference rate’ (STPR) provides an estimate of the Government’s preference for outcomes sooner rather than later. It can be thought as the rate at which society values the present compared to the future.
The Green Book states that the Government should use 3.5 per cent as the discount rate (or STPR) when discounting costs and benefits.5 For example a benefit of £1000, which would be accrued the following year, is estimated at £966 in present value (PV) terms now.6
7.5 Estimating additionality, deadweight, displacement and spillovers
Estimation of additionality, deadweight, displacement and spillovers are important aspects in estimating the true impact of a policy and are key in any cost benefit analysis.
7.5.1 Additionality
Additionality tries to ascertain what was actually achieved as a result of the policy, compared to what would have happened anyway.7 However, pure additionality may be difficult to achieve. Evaluations show that Government interventions make activities happen more quickly, on a larger scale or better than they would have otherwise occurred. Therefore, evaluations may need to make arbitrary adjustments to estimate partial additionality.8 Beneficiaries of business support often argue that support enables speedier completion of a project or an increase in its scale. It is common to refer to support in these cases as being partially additional. Evaluations tend to make arbitrary adjustments to estimate partial additionality – for example outcomes are typically reduced by 50 per cent.
5 Calculated as 1-(1/(1+r)^T) where r=discount rate
6 For costs and benefits accruing more than 30 years into the future, appraisers should use the schedule of discount rates provided in the Green Book. See the link at the Green Book Annex 6 for a discussion of the STPR.
7 For example, if the Government provided £200 to a firm to invest, but without Government support the firm would have invested £80 anyway, then the additionality would be £120.
8 The Green Book provides a discount rate to value the early delivery of outcomes more accurately.
66
7.5.2 Deadweight
Evaluations also should estimate that part of the policy, referred to as deadweight, which was not necessary to achieve the desired policy objective. There is also outcome deadweight i.e. the activity may be additional but still not change the outcome. In addition, it is desirable to estimate displacement and spillovers, which are often very high, though it should be noted these are difficult to calculate.
7.5.3 Displacement
Displacement occurs when an activity subsidised by Government displaces another activity within the UK (or England and Wales in the case of BIS interventions) because it reduces the amount of funding going towards it or competes for scarce resources, bidding up their price and making the alternative activity less profitable. A project may attract scarce skills, or investment, which would otherwise have gone to other parts of the country; or, if the policy involves support for local businesses, these may compete for resources and /or market share with non-assisted businesses. All these factors need to be quantified in monetary terms as much as possible.
7.5.4 Spillovers
In some cases policies may be expected to have a positive impact on parties other than the direct target population of any support. These impacts, known as spillovers, are often difficult to measure for the following reasons:
It is difficult to assess who those third parties are and how they can be traced at a reasonable cost.
They are difficult to quantify.
Capturing spillovers in an evaluation requires:
A thorough understanding of the markets, innovations, and linkages
A careful evaluation design, in particular:
o If survey methods are used, it should include businesses affected indirectly by the intervention as well as treated firms if one is measuring economic impact
o If econometric methods are used, data should be collected from a wide set of businesses (this may require collecting data at a higher level; see section 6.6); and a link should be established between the firms that produce the spillovers and those that receive them.
67

Use of complementary research evidence, to put a value on the additional spillovers that the target population generate relative to the counterfactual.
7.6 Identifying transfers and assessing distributional impacts
As discussed earlier, the Cost Benefit Analysis should identify transfers, which will be excluded from the analysis. Transfers may change the overall distribution of income but will not change the amount of income generated by the UK economy.
However, in cases where it is an explicit objective of the policy to change the distribution of income, the Green Book states that all distributional impacts should be explicitly stated and quantified. This analysis should give greater weight to benefits that accrue to poorer sections of society.9
7.7 Calculating costs and benefits in case of foreign ownership
The Green Book requires that appraisals should consider the costs and benefits to the UK. In some cases this may not be appropriate (e.g. in appraisals of foreign aid projects) but it is the default position for appraising BIS policies and programmes.
Often BIS will provide funds to companies to carry out an activity in the UK. The profits from the activity, together with net labour income10, constitute a benefit to be set against the cost. However business recipient of BIS support or interventions may be partly owned by foreigners residing abroad who may be entitled to a share in the profits. Their share of the profits should be deducted from the total benefit since they do not boost UK income.
In some cases, UK-based businesses may argue that without UK government support an activity will go overseas. However it may be possible to show that the UK could be better off if a foreign government provided a subsidy to a UK-owned business to locate part of its business abroad. This is because the subsidy flows back to UK shareholders in proportion to their ownership.
This suggests that the economic argument for retaining an activity in the UK has to revolve around the spillover benefits that the activity may, or may not, generate for other UK based firms and UK-based individuals such as employees and shareholders.
9 Annex 5 of the Green Book provides more information on assessing distributional impacts.
10 To the extent that the labour would not have had an alternate use in the absence of support.
68

7.8 Benefit Cost Ratios
Best practice impact evaluations attempt to derive a figure for the Benefit Cost Ratio (BCR). This is one of the key outcomes by which policies are assessed. It is increasingly important for BIS programme evaluations to report benefit-cost ratios, that is, how much in £ benefits did the policy generate from £1 of BIS expenditure.
The BCR is a measure of the monetary value of the benefits as a ratio of the costs. In this chapter we discuss some of the more technical issues surrounding the measurement of BCR. When thinking about the ratio it is worth considering the following:
High ratios in some cases result from using the wrong measure of benefit. For example, value added from the increase in sales due to the policy should be used rather than the value added of sales (around a third of turnover).
High benefit-cost ratios also occur if costs have been omitted. As a general rule all costs should be included where they were necessary to deliver the good or service that generates the benefits.
High ratios also imply high rates of return. For programmes if the benefits are likely to primarily accrue to the beneficiaries of support it is worth considering if it is necessary for BIS to continue to support this.
7.9 Comparability across policies and the language of ‘benefits’
Even when there are strong methodological approaches underpinning evaluation findings there are still issues about comparability that needed to be analysed when using the same language and methods of calculating cost, benefits across different policy areas and timeframes.
Transparency and clarity surrounding the calculations of cost and benefit are key for comparability. It is strongly recommended that any evaluation of economic impact should have a very clear methodological section that outlines what is included in the BCR calculations and the assumptions that have been made.
It is worth remembering that the risks to the internal validity of an evaluation will also affect the calculation of a BCR. For example instrumentation risk – changes in the way in which the outcomes of a policy are measured and calculated at the pre- and post-intervention stages - will have an effect on the overall evaluation conclusions. A simple instrumentation change would be very likely to produce different BCRs and would undermine the robustness of the evaluation conclusions. All evaluations should therefore have clear and transparent sections outlining the methodology used for data collection and how the cost benefit calculations are derived.
69

7.10 Key messages from this chapter
Transparency and clarity over how the cost and benefit of an intervention are calculated are key to ensure that comparisons can be made over time and, in some cases, across interventions.
Clarity and transparency also allows policy makers to understand the strength of the BCR estimates.
It is therefore important that any evaluation should include a methodology section outlining how the BCR calculations have been derived, what has been included and the assumptions that have been made.
The Green Book provides information for ensuring a successful calculation of the BCR, particularly in the areas of additionality and deadweight, displacement and spillovers and in the use of discount rates for long-term programmes.
It is important to bear in mind that interventions that have a cross-border element, such as foreign ownership of businesses and subsidies placed by overseas governments need to be correctly accounted for.
70
Chapter 8. Report writing and dissemination
8.1 Learning objectives
Upon completing this chapter, you should be able to do the following:
Understand the key elements that need to go into an evaluation report
Ensure that the report contains a methodology section that clearly outlines:
o A description of the evaluation model and methodologies used at each step
o Assessment of the robustness of the evaluation model applied: Whether a measure of ‘impact’ has been arrived at or the study can only observe associations not causality; and the strength of the associations
o Assessment of methodologies and statistical techniques applied: robustness, validity and reliability of the findings
o If a measure of cost-benefit is possible, outline benefit analysis calculations assumptions made on the cost-benefit
See the importance of successful dissemination of the report in line with Government guidelines.
8.2 Introduction
Once the evaluation process has been completed, the evaluator will need to assess the evidence and set the findings in a broader context. The findings must then be used to build the evidence base. This section discusses how to formulate the report and how to disseminate findings to ensure they have an impact on future decisions or contribute to a decision on whether or not to roll out or scale up the project, where appropriate.
71

8.3 Analysis of evaluation exercise
A key task is often to bring together evidence from different parts of the evaluation to tell an overall story. The primary aim is to show whether the original aims and objectives of the programme or treatment were achieved. The time required to analyse an evaluation’s results may be significant depending on the size and complexity of the evaluation. Key tasks in analysing an evaluation may include:
Reconciling: It may be necessary to reconcile different assessments of the impact that arise because of differences in:
o Data sources
o Groups of affected firms
o Statistical approaches and assumptions.
If there are a number of valid and reliable estimates, it may be more appropriate to report the impact as a range rather than as an exact figure.
Checking validity and reliability: Not all the estimates will be equally valid and reliable. The estimates that measure most closely the relevant outcomes should be identified and prioritised.
Reviewing and checking with broader evidence and sources.
o Checking whether related evaluations or relevant findings from evaluation literature reinforce or contradict evaluation evidence. Evaluation findings will be strengthened when they are in line with earlier research as long as the previous research was of good quality and a literature review was used to assess this at an early stage in the policy design.
o It is also necessary to consider whether the findings are in line with theoretical expectations, and if not, why the theory does not hold true in this particular application. The extent to which the findings are in line with theoretical expectations may also affect confidence in them.
8.4 Contents of evaluation report
The Green Book makes it clear that an evaluation should include an assessment of what happened including direct and indirect outcomes; a comparison with the aims and objectives; and a comparative assessment of the counterfactual scenario (what would have happened without the intervention). The evaluation should assess the success of the project, programme or policy in achieving its objectives, and also how this achievement has contributed to the wider outcomes.
72

If the objectives were not achieved, the evaluation should establish why that was the case. Finally an evaluation should include details on the methodology and how the data were gathered. This will include the selection of the treatment, the identification of the treatment and control or comparison groups, the modes of delivery of the treatment, the measures used, the units of analysis and sources for data and, if relevant, the response rates to the surveys.
The results obtained should generally lead to recommendations for the future. These may include, for example, changes in procurement practice, delivery, or the continuation, modification, or replacement of a programme. An action plan should be developed and executed so that the evaluation’s recommendations are put into practice.
The evaluation should address a number of points that require a process study as well as an impact assessment:
Why the outcome differed from that foreseen in the appraisal
Whether the activity has been more beneficial for some groups than others, and why
How effective the activity was in achieving its objectives, and why
The cost effectiveness of the activity
What the results imply for future management or policy decisions
Suggestions for how the policy could be improved to make it more effective.
8.5 Need for a transparent and clear methodology section
The impact evaluation report should have a clear and transparent audit trail of all of the methodologies used and the extent to which valid and reliable estimates of impact have been arrived at. In order to ensure clarity, the methodology section should be written as far as possible in a way that not very technical people should be able to understand it. By transparent it is meant that no important methodological information is omitted so that anyone wanting to re-run or repeat the study should be able to do so by following the steps outlined in the methodology section.
73

Ideally the following issues should be covered in the methodology section (note that previous chapters provide detail on each of them and the issues that should be discussed under each):
Description of the evaluation model and methodologies used at each step
Causation or correlation: whether a measure of ‘impact’ has been arrived at or the study can only observe associations not causality, also strength of associations.
Assessment of the robustness of the evaluation model applied.
Assessment of methodologies and statistical techniques applied: robustness, validity and reliability of the findings
If a measure of cost-benefit is possible, assumptions made on the cost-benefit analysis calculations including any benefit to cost ratios.
8.6 Dissemination
Good dissemination is important if evaluators are to ensure that important findings feed into policy. In order for evaluations to influence and add value to policymaking, the findings need to be effectively disseminated to stakeholders within and outside BIS. Policymakers should identify the stakeholders who would be interested in the evaluation and identify the best way of communicating the findings.
Efforts should be made to disseminate the results widely. For this purpose, it may be helpful to use summaries of the main points, and ensure the report synthesises the results from a number of evaluations with common features. Publication should follow the GSR Code as set out in the professional guidance from Government Social Research (GSR, 2010).
Given the wide range of possibilities for publishing and disseminating lessons from the evaluation, the evaluator should consider the most appropriate media to use. Ideally these should be factored into the evaluation costs, since they can be significant.
74

Those commissioning major evaluations should spend some time considering how to ensure that an evaluation’s findings are influential. Common mistakes to avoid are:
Stakeholders do not feel sufficiently involved because the questions they want answered are not built into the evaluation design. However that should not encourage evaluators to include too many questions as a failure by respondents to answer all of them may make the data collected invalid or unreliable.
If a timetable is set without any regard to when robust evidence is likely to be available then evaluators may not be able to produce evidence within that timeframe.
Reports lack a clear summary of the findings or are too difficult to digest
Implementers only want to hear about success and do not want to devote time to learning from mistakes.
It is the presumption that evaluations are published within three months of the evaluation report being finalised unless there are good reasons for not doing so. These include commercial confidentiality, threat to national security, risk of destabilising the economy, or publication not being in the public interest.
8.7 Key messages from this chapter
The writing and disseminating of the report on the evaluation are vital parts of the process of ensuring that lessons are learned from past interventions to inform future decision-making.
The evaluator must ensure that no biases creep into the report by ensuring that any contradictions are reconciled and that there are no issues with validity and reliability.
The report should be aimed at policymakers who need to understand the lessons for future policy. If there has been a process study, then the report can include clear recommendations for the future.
The impact evaluation report should have a clear and transparent audit trail of the evaluation model and all of the methodologies used and the extent to which valid and reliable estimates of impact have been arrived at.
Findings need to be effectively disseminated to stakeholders within and outside BIS.
Dissemination should follow government guidelines in the GSR code.
75

Glossary
Additionality: An outcome arising from an intervention is additional if it would not have occurred in the absence of the intervention.
Appraisal: The process of defining objectives, examining options and weighing up the cost benefits, risks and uncertainties of those options before a decision is made.
Association or correlation: the strength of the observed relationship between two variables (not to be confused with causal relationships).
Benefit Cost Ratio: The BCR is an estimate of the monetary value of the benefits as a ratio of the costs. This is one of the key outcomes by which policies can be assessed. It is increasingly important for BIS programme evaluations to report benefit-cost ratios, that is, how much in £ benefits did the policy generate from £1 of BIS expenditure.
Bias: systematic error that tends to go in one direction more than another.
Causal relationship: a theoretical notion that change in one variable forces, produces, or bring about change in another. The primary aim of an impact evaluation is to test a hypothesis that one policy, programme or initiative causes the desired change or aim. Causality can only be measured if the counterfactual can be measured. A causal relationship is not to be confused with association (see also association or correlation and counterfactual).
Comparison group: used in quasi-experimental designs that aim to resemble some of the characteristics of a true experiment (Random Control Trial), except that random assignment of subjects to treatment and control groups is lacking and a matched comparison group was also not possible. The comparison group is formed by members that are hypothesised to be useful comparators of the treatment group, often, users and non-users of a service may be compared. Careful thought needs to be given to the formation of these comparison groups as systematic differences may be present in the treatment and comparison group before the intervention.
Control group: Organisations (or individuals) who do not receive the treatment or intervention. Control groups appear in Randomised Control Trials (see chapter 4). The control group and treatment group should be selected from the target population at random to ensure any pre-experimental differences are distributed approximately evenly among the groups. The control and treatment group should be treated exactly alike except for the treatment to avoid confounding reasons for the observed outcomes. A control group is not to be confused with a comparison group or matched group.
Cost Benefit Analysis: Analysis which quantifies in monetary terms as many of the costs and benefits of a proposal or intervention as feasible, including
76

items for which the market does not provide a satisfactory measure of economic value.
Counterfactual: The most likely situation, development and outcomes in the absence of the intervention. Often referred to as “What would have happen anyway”.
Crowding out: The extent to which an increase in demand due to a Government policy being offset by a decrease in private sector demand.
Deadweight: This is that part of the policy, which promoted a desired activity that would in fact have occurred without it (activity deadweight). There is also outcome deadweight i.e. the activity may be additional but still not change the outcome. Also can be expressed in terms of expenditure, expenditure to promote a desired activity that would in fact have occurred without the expenditure.
Discount rate: the annual percentage rate at which the present value of a future pound, or other unit of account, is assumed to fall away through time.
Displacement: the degree to which an increase in productive capacity promoted by government policy is offset by reduction in productive capacity elsewhere.
Evaluation: An objective process of understanding how a policy or other intervention was implemented, what effects it had, for whom, how and why. Analysis of an intervention to assess how successful or otherwise it has been to achieve particular effects, and what lessons can be learnt for the future. See also Summative or outcome based evaluations and Formative or process evaluations.
Gross Value Added (GVA): A measure of additional value. In its most simple form GVA of an organisation can be described as output minus the cost of inputs.
Impact evaluation: is an outcome based evaluation structured or designed to answer the question of whether the outcomes observed were the result of the intervention or the observed outcomes would have happened anyway. It measures the degree by which the change in the outcome is attributable to the intervention.
Market failure: An imperfection in the market mechanism that prevents the achievement of economic efficiency.
Matched comparison group: used in quasi-experimental designs that resemble a true experiment (Random Control Trial), except that random assignment of subjects to treatment and control groups is lacking. Where random assignment to form a control group is not possible the treatment group is matched with another similar group. This ‘matched group’ contains members that have similar characteristics to the treatment group. In order to find a matched group, the analyst will need to measure some characteristics
77
of each of the treatment group businesses, for example, business size, sector, region, and turnover and find the same characteristics on the population of businesses for the matched comparison group. These would then form the matched group. Note that a matched group (note this is different from control group or comparison group).
Operational definition: the definition of something (e.g. a variable, term, or object) in terms of the specific process or set of validation tests used to determine its presence and quantity. That is, one defines something in terms of the operations that count as measuring it. For example ‘size of business’ might be operationalised asking businesses questions about employee numbers. The complete operational definition would consist of the specific questions asked, together with response categories and instructions for gathering the data and assigning cases to categories. Many operational definitions are possible.
Opportunity cost (or Economic cost): The value of the most valuable of alternative uses.
Optimism bias: The demonstrated systematic tendency for appraisers to be over-optimistic about key project parameters, including capital costs, operating costs, works duration and benefits delivery.
Primary data: Data observed or collected directly from first hand experience or source.
Process or formative evaluations: look at the process of the implementation of the policy and are mostly concerned with how the programmes are actually being implemented, and what the intended and unintended effects are.
Probability sample: a form of sampling in which some form of random selection is used to select sample elements. Accordingly, every element in the population has a known probability of being included in the final sample (see also random sample selection).
Quota sample: a form of non-probability sampling in which elements are selected to fill quotas of elements with particular characteristics. The quotas are established so as to reflect the population in relation to the quota characteristics.
Random sample selection: a process that gives each case in the population an equal chance of being included in the sample.
Reliability: is the stability or consistency of an operational definition. Reliability is concerned with questions of stability and consistency. Another way of expressing this is repeatability: if the study were carried out again, would it produce the same findings? Do repeated applications of the operational definition under similar conditions yield consistent results?
78

Robustness: A robust evaluation is one where stringent research and/or statistical techniques have been followed to arrive at valid and reliable results or conclusions.
Sampling frame: The complete list of elements of the population from which a sample will be drawn.
Secondary analysis or secondary data analysis: analysis of data originally collected by another researcher or study.
Spillover: A spillover is a cost or benefit on those that were not directly affected by a policy. Spurious relationship: a relationship in which tow variables co-vary and may therefore appear to be causally related by in fact co-vary because they are both consequences of a third variable that has not been measured in the calculations, a extraneous variable. Spurious accuracy: Spurious accuracy occurs when the results could be misinterpreted as implying a degree of accuracy that is not warranted because of the limitations of the evaluation model and methodologies applied.
Substitution: The situation in which a firm substitutes one activity for a similar activity (such as recruiting a different job applicant) to take advantage of Government assistance.
Summative or outcome based evaluations: seek to measure whether the policy outcomes or targets were achieved. Impact evaluation goes a step further and is structured to answer the question of whether the outcomes observed were the result of the policy or the observed outcomes would have happened anyway.
Target population: the population to which the intervention is targeted or aimed to.
Treatment group or experimental group: Organisations (or individuals) who receive the treatment or intervention.
Triangulation: The addressing of a social research question with multiple methods or measures that do not share the same methodological weaknesses; if different approaches produce similar findings, confidence in the results increases.
Unit of analysis: the entity about whom or which the evaluator gathers information; the unit may be people, social roles and relationships, groups, organisations, communities, businesses, nations and so on.
Validity: the congruence or ‘goodness of fit’ between an operational definition and the concept it is purported to measure. A study is said to be valid when it can be shown that it has measured what it was intended to measure.
79

Further reading
The publications suggested below are by no-means an exhaustive list of all of the literature available on impact evaluation; however, they provide a useful starting point for anyone wanting to read more on specific topics covered in this publication.
1. Key government documents to complement this guidance
BIS evaluation guidance
This is an internal document that outlines the key stages in the evaluation process: available in the Economic and Policy Analysis pages of BIS Intranet.
The Magenta Book:
http://www.hm-treasury.gov.uk/magentabook
http://www.nationalschool.gov.uk/policyhub/magenta_book/index.asp
The Green Book, GSR (Government Social Research). Publishing Research in Government. January 2010. HM Treasury
http://www.hm-treasury.gov.uk/data_greenbook_index.htm
GSR code: Government Social Research Code
http://www.civilservice.gov.uk/my-civil-service/networks/professional/gsr/professional-guidance/gsr-code-main-page.aspx
2. Evaluation methodology and difference between causation and association
Campbell D & Stanley J (1963) Experimental and Quasi Experimental Designs for Research. Rand McNally & Company Chicago
This is a basic text book on experimental and quasi-experimental designs which is widely quoted in all subsequent literature on the topic. Contains very useful research designs, examples of statistical techniques that can be applied and ample explanations of the difference between causation and association (correlation).
Singleton R et al. (1988) Approaches to Social Research Oxford University Press.
80

Chapter 8 provides a very good introduction to experimental and quasi-experimental designs, it summarises Campbell and Stanley (1963). It also provides a good discussion of causation and association.
Pawson R and Tilley N (1997) Realistic Evaluation. Sage Publications
Good discussion of evaluation, impact and causality.
3. Survey methodology
De Vaus (1996) Surveys in Social Research, UCL press
This publication offers a comprehensive handbook of the process of survey research, from formulating and clarifying research questions to collecting and analysing the data.
DETR (2000), User Satisfaction Performance Indicators: Guidance on Methods of Data Collection
http://www.communities.gov.uk/archived/general-content/localgovernment/usersatisfaction/
This provides first principles on survey methods. It is a very practical guide to each step in the survey administration process which was primarily devised for Local Authorities to follow when running surveys of citizens. It is aimed to an audience that has no experience of running surveys. It discusses different interview modes, face-to-face, telephone, postal, runs through sampling issues such as sample selection and questionnaire development and data coding and analysis.
4. Introduction to basic statistics correlations and measures of difference
Hinton PR (2004) Statistics Explained. Routledge
Shalock RL (1995) Outcome Based Evaluation: Second Edition. Kluwer Academic. Plenum Publishers
It covers various outcome based evaluations. Discusses the difference between outcome and impact (Chapter 4). Chapter 8 guides the reader through some basic statistical techniques for analysing and interpreting outcomes.
81

5. Beneficiaries self-assessment to measure economic impact
McGee, A., Collins, D. and Legard, R. (2008) Assessing the economic impact of BERR policies – a best practice guide. Final report. London: National Centre for Social Research.
http://www.bis.gov.uk/policies/economics-statistics/economics/evaluation
http://www.bis.gov.uk/files/file52693.pdf BIS (2009) RDA Evaluation: Practical Guidance on Implementing the Impact Evaluation Framework: Appendix 1 – Beneficiary survey methodology and questionnaires
http://www.bis.gov.uk/assets/biscore/economics-and-statistics/docs/09-1560-rda-evaluation-practical-guidance-appendix1
This document is part of a wider guidance to RDAs on evaluating impact of interventions. Appendix 1 provides guidance of beneficiaries surveys where beneficiaries self assessment is used to measure impact. Contains suggested questions for a telephone questionnaire to measure GVA based on McGee et al (2008).
6. Quasi -experiment
Bohm P and Lind H (1993) Policy evaluation quality: A quasi-experimental study of regional employment subsidies in Sweden. Regional Science and Urban Economics, 23 (51-65).
An example of a quasi-experiment, although perhaps not sufficient methodological information is given.
7. Statistical approaches used for matching treatment and comparison groups
Bryson, A. Dorsett, R. and Purdon, S. (2002) The use of propensity score matching in the evaluation of active labour market policies. DWP Working Paper No. 4. London: Department for Work and Pensions.
The paper discusses the use the strengths and weaknesses of propensity score matching for the identification of a matched comparison group.
Greenaway D and Kneller R (2007) Exporting, productivity and agglomeration. European Economic Review, 52, 5: 919-939.
82

An example of nearest neighbour matching.
Bewley H, Forth J and Robinson C (2010) Evaluation methodology: measurement of drivers of business success and failure. BIS
http://www.bis.gov.uk/assets/biscore/economics-and-statistics/docs/e/10-1118-evaluation-methodology-business-drivers
For a useful discussion of all of the possible variables that could be used for matching businesses. This report seeks to identify the key drivers of business success and failure through a review of existing literature. The review aims to identify those performance-related business characteristics which provide the strong basis on which to compare participants and non-participants within the context of an impact evaluation. It also comments on their ease of observation or measurement. The overall aim is to assist in the identification of a set of business characteristics that would ideally be employed as matching variables or control variables within future evaluations commissioned by BIS.
8. Statistical approaches used to measure before and after differences and impact
Khandker S, Koolwal G and Samad H (2009) Handbook on Impact Evaluation: Quantitative Methods and Practices. The World Bank
This is a brilliant book for those that want to understand about the statistical techniques used in Impact Evaluations including STATA exercises to practice with:
Randomized evaluations Matching methods including (PSM) Double-difference methods Instrumental variable methods Regression discontinuity design and pipeline methods Distributional impacts Structural and other modelling approaches
Berk, R.A. (1981) Educational Evaluation Methodology: the state of the art. Baltimore: Johns Hopkins University Press
Although perhaps a little bit dated it provides very good background to statistical techniques, particularly measuring pre-treatment and post-treatment observations and selecting an appropriate technique to measure differences (Chapters 4 and 5)
83

Blundell R, Dearden L and Sianesi B. (2004) Evaluating the Impact of Education on Earnings in the UK; Models, Methods and Results. Journal of the Royal Statistical Society, Series A, vol. 168, no.3, pp. 473-512.
http://eprints.lse.ac.uk/19451/1/Evaluating_the_Impact_of_Education_on_Earnings_in_the_UK_Models%2C_Methods_and_Results_from_the_NCDS.pdf
Very nice article which triangulates different statistical techniques to look at impact. It contains very valuable discussion of the strengths and weaknesses of the techniques.
Ravallion M (2000) The Mystery of the Vanishing Benefits: Ms Speedy Analyst’s Introduction to Evaluation. World Bank
http://www-wds.worldbank.org/external/default/WDSContentServer/WDSP/IB/1999/09/10/000094946_99082005390028/additional/111511322_20041117150026.pdf
Quite technical it takes the reader through the evaluation stages in an entertaining way. Very original.
Blundell R and Costa Dias M (2002) Alternative approaches to evaluation in empirical microeconomics The Institute for Fiscal Studies, Cemmap working paper CWP10/02
http://www.cemmap.ac.uk/wps/cwp1002.pdf
Technical paper on statistical techniques.
Simple and multiple regression analysis
Cornet M, Vroomen B and van der Steeg M (2006) Do innovation vouchers help SMEs to cross the bridge towards science?, Discussion Paper No. 58, CBP (Netherlands Bureau for Economic Policy Analysis).
http://econpapers.repec.org/paper/cpbdiscus/58.htm
Post-test only control group design. Random assignment of vouchers and use of regression estimates to compare outcomes for recipients and non-recipients of vouchers.
84

Regression discontinuity design
Imbens and Lemieux (2008) Regression discontinuity designs: A guide to practice, Journal of Econometrics. 142: 615-635.
Very technical papers on the use of regression discontinuity designs to measure impact.
Instrumental variables
Criscuolo, C. Martin, R., Overman, H. and Van Reenan, J. (2007) The effect of industrial policy on corporate performance: Evidence from panel data. Centre for Economic Performance Working Paper. London School of Economics.
https://editorialexpress.com/cgi-bin/conference/download.cgi?db_name=IIOC2008&paper_id=445
The study matched over 20 years of administrative panel data on programme participation and firm performance from the Census Bureau to investigate the causal impact of the policy on employment, investment, productivity and entry/exit. Uses an instrumental variable approach.
9. Error: Reliability and Validity issues
Isaac S and Michael W (1997) Handbook in Research and evaluation for Education and the behavioural sciences (Third edition). Edits
As well as providing a very good guide to research designs, methods and strategies (Chapter 4), Chapter 3 provides a very good review of common evaluation methodology errors that ultimately challenge the validity and reliability of evaluations.
10. Measuring cost effectiveness of interventions and economic impact
Greenberg D and Knight G (2007) Review of the DWP Cost Benefit Framework and how it has been applied Department for Work and Pensions Working Paper No 40
http://research.dwp.gov.uk/asd/asd5/WP40.pdf
Following the experience of trying to apply the Cost Benefit Framework for the first time in DWP, the report is a critical assessment of the CBF used and discusses a number of steps that might be taken to improve the CBF guidance and the underlying Cost Benefit Assessments. This is a good document to look at for anyone thinking about the implications of translating the theory as per the Green Book into a real policy area.
85

86
BIS (2009) RDA Evaluation: Practical Guidance on Implementing the Impact Evaluation Framework
http://www.eeda.org.uk/files/Practical_Guidance_on_Implementing_the_Impact_Evaluation_Framework.pdf
Primarily developed for RDAs it provides high level detail on methodology for conducting evaluations as well as some high level requirements on the submission and approval process for impact evaluation plans.
ONS (2010) Measuring the economic impact of an intervention or investment: Paper One: Context & rationale
ONS (2010) Measuring the economic impact of an intervention or investment: Paper Two: Existing sources and methods
http://www.statistics.gov.uk/statbase/Product.asp?vlnk=607
The two papers aim to complement the RDA Evaluation: Practical Guidance on Implementing the Impact Evaluation Framework (Impact Evaluation Framework+ and other guidance) by examining the sources, existing methods and concepts which surround the measurement of the impact of Interventions or Investments consistent with methods used to produce official Gross Value Added (GVA) estimates including questions used in the Annual Business Survey and Business Register and Employment Survey.
11. Other references in the text
Groves RM, Fowler FJ, Couper MP, Lepkowski JM, Singer E, Tourangeau R (2004) Survey Methodology. Hoboken, New Jersey: Wiley.
McGee, Alice, Collins, Debbie and Legard, Robin. September 2009. Self-assessment as a tool to measure the economic impact of BERR policies; a best practice guide. BIS
London Economics. Evaluation of UK Trade & Investment’s Tradeshow Access Programme. Final Report to UK Trade & Investment. September 2008.
OECD Framework for the Evaluation of SME and Entrepreneurship Policies and Programmes. February 2008. Paris: OECD
Papaconstantinou G. & Polt, W. 1997. Policy Evaluation in Innovation and Technology: An Overview. In OECD Proceedings, Policy Evaluation in Innovation and Technology: Towards Best Practices. Paris: OECD.
Rosenbaum, Paul R. and Rubin, Donald B. 1983. The Central Role of the Propensity Score in Observational Studies for Causal Effects. Biometrika 70(1): 41[55].

© Crown copyright 2011
You may re-use this information (not including logos) free of charge in any format or medium, under the terms of the Open Government Licence. Visit www.nationalarchives.gov.uk/doc/open-government-licence, write to the Information Policy Team, The National Archives, Kew, London TW9 4DU, or email: [email protected]. This publication is also available on our website at www.bis.gov.uk Any enquiries regarding this publication should be sent to: Department for Business, Innovation and Skills 1 Victoria Street London SW1H 0ET Tel: 020 7215 5000 If you require this publication in an alternative format, email [email protected], or call 020 7215 5000. URN 11/1085
87