guidance note for traffic consultants employed on highways agency …€¦ · ·...
TRANSCRIPT

Interim Advice Note 106/08 Guidance Note for Traffic Consultants Employed on Highways Agency Schemes
IAN 106/08 1 of 40 January 2008
INTERIM ADVICE NOTE 106/08
Guidance Note for Traffic Consultants Employed on Highways Agency Schemes
Summary This Interim Advice Note provides guidance for the use of DMRB, WebTAG, CHE Memos and IAN’s in the delivery of traffic and economic assessment of schemes in the Highway Agency’s promoted schemes in the Programme of Major Schemes
Instructions for Use This IAN provides guidance and information for immediate use.

Interim Advice Note 106/08 Guidance Note for Traffic Consultants Employed on Highways Agency Schemes
IAN 106/08 2 of 40 January 2008
CONTENTS
1 Introduction 3
1.1 Background 3 1.2 Documents 3 1.3 HA Scheme Overview 5 1.4 Scheme Reporting 6 1.5 Economic Assessment Software 7
2 CONTENTS GUIDES 7
2.1 – Work Programme Report 8 2.2 – Traffic Survey Report 12 2.3 – Local Model Validation Report 18 2.4 – Forecasting Report 28 2.5 – Economics Assessment Report 36
3 Contacts 40

Interim Advice Note 106/08 Guidance Note for Traffic Consultants Employed on Highways Agency Schemes
IAN 106/08 3 of 40 January 2008
1 Introduction
1.1 Background This document is intended as a guide to consultants undertaking traffic modelling and economic assessment of Highways Agency (HA) promoted highway schemes within the Programme of Major Schemes (PMS), normally costing more than £5M. It will act as a reference tool to aid consultants in the delivery of reports used in the assessment and decision making of Highway Agency schemes. It will also be used by Highways Agency staff, normally from within the HA’s Traffic Appraisal, Modelling and Economics (TAME) team in their roles as Appraisal Certification Officers for the schemes.
Traffic models provide a key role in the process of appraising projects in accordance with Treasury Guidance (The Green Book), and are used to inform several elements in the delivery of transport schemes, including the following:
♦ Scheme identification and option selection;
♦ Scheme development: route standards, junction layouts, weaving lengths;
♦ Scheme design: merge and diverge type, junction capacity, pavement design;
♦ Economic assessment; and
♦ Environmental Assessment: air, noise and water quality calculations.
The requirement to produce data for different audiences underlines why a robust traffic model is critical to the delivery of a successful scheme. This responsibility calls for a schemes traffic team to undertake traffic analysis in accordance with the guidance as specified by both the Department for Transport and the Highways Agency.
The objective of this note is to provide guidance that will identify the stages required in the modelling and appraisal of an individual scheme and provide references to the published documentation.
This note is in the form of guidance only. It is intended to assist consultants in carrying out their contractual obligations effectively rather than imposing additional requirements. Any conflicts between this note and contractual documents should be discussed with the HA Project Leader.
1.2 Documents The traffic modelling and economic appraisal of roads is a complex process which is detailed in a number of key documents published by the Highways Agency and Department for Transport, as follows:
Highways Agency Published Documents Current guidance on the assessment of HA road schemes is based on the Design Manual for Roads and Bridges (DMRB) documentation that was first compiled in the 1980s. The section relating to traffic appraisal is DMRB Volume 12, and is split into two sections as follows:
♦ DMRB – Volume 12 Traffic Appraisal of Road Schemes Section 1 Traffic Appraisal Manual – Part 1 The Application of Traffic Appraisal to Trunk Roads Schemes.
This section was first published in 1981 as the Traffic Appraisal Manual it has subsequently been updated in August 1991 and then again in November 1997. The 1997 update incorporated guidance on induced traffic arising from the Standing Advisory Committee for Trunk Road Assessment (SACTRA) 1994 report ‘Trunk Roads and the Generation of Traffic’.
Interim Advice Note 106/08 Guidance Note for Traffic Consultants Employed on Highways Agency Schemes
IAN 106/08 4 of 40 January 2008
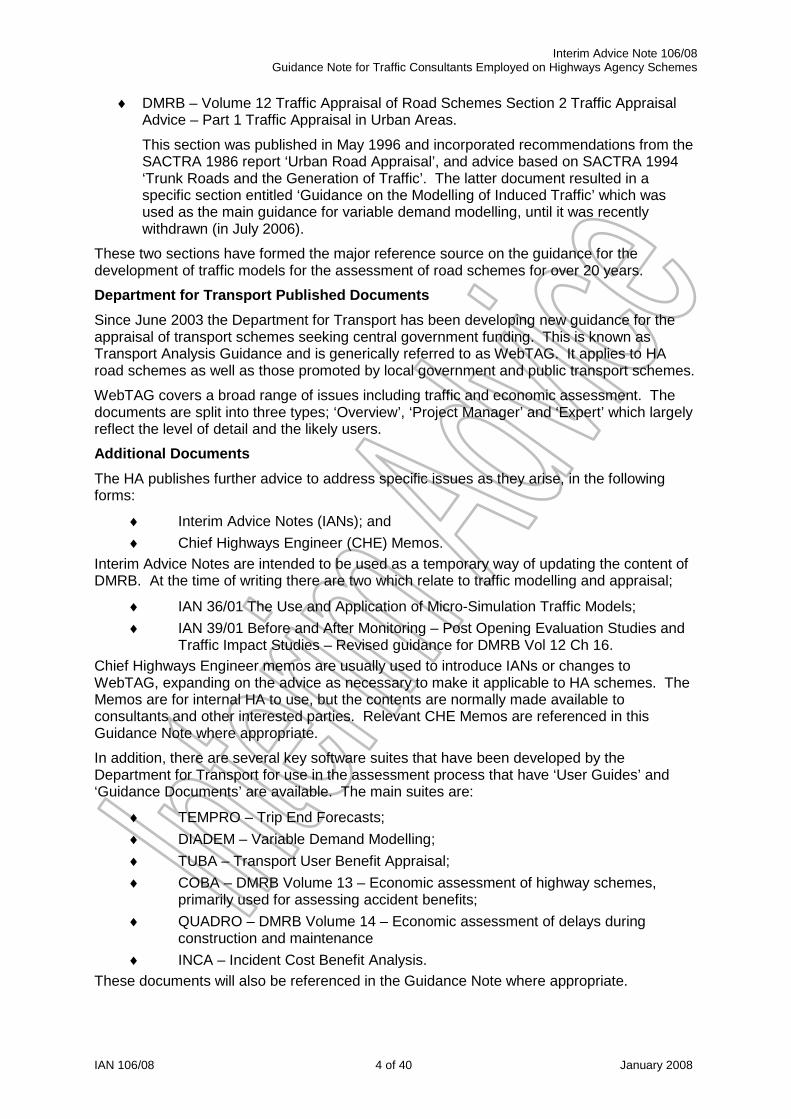
♦ DMRB – Volume 12 Traffic Appraisal of Road Schemes Section 2 Traffic Appraisal Advice – Part 1 Traffic Appraisal in Urban Areas.
This section was published in May 1996 and incorporated recommendations from the SACTRA 1986 report ‘Urban Road Appraisal’, and advice based on SACTRA 1994 ‘Trunk Roads and the Generation of Traffic’. The latter document resulted in a specific section entitled ‘Guidance on the Modelling of Induced Traffic’ which was used as the main guidance for variable demand modelling, until it was recently withdrawn (in July 2006).
These two sections have formed the major reference source on the guidance for the development of traffic models for the assessment of road schemes for over 20 years.
Department for Transport Published Documents Since June 2003 the Department for Transport has been developing new guidance for the appraisal of transport schemes seeking central government funding. This is known as Transport Analysis Guidance and is generically referred to as WebTAG. It applies to HA road schemes as well as those promoted by local government and public transport schemes.
WebTAG covers a broad range of issues including traffic and economic assessment. The documents are split into three types; ‘Overview’, ‘Project Manager’ and ‘Expert’ which largely reflect the level of detail and the likely users.
Additional Documents The HA publishes further advice to address specific issues as they arise, in the following forms:
♦ Interim Advice Notes (IANs); and ♦ Chief Highways Engineer (CHE) Memos.
Interim Advice Notes are intended to be used as a temporary way of updating the content of DMRB. At the time of writing there are two which relate to traffic modelling and appraisal;
♦ IAN 36/01 The Use and Application of Micro-Simulation Traffic Models; ♦ IAN 39/01 Before and After Monitoring – Post Opening Evaluation Studies and
Traffic Impact Studies – Revised guidance for DMRB Vol 12 Ch 16. Chief Highways Engineer memos are usually used to introduce IANs or changes to WebTAG, expanding on the advice as necessary to make it applicable to HA schemes. The Memos are for internal HA to use, but the contents are normally made available to consultants and other interested parties. Relevant CHE Memos are referenced in this Guidance Note where appropriate.
In addition, there are several key software suites that have been developed by the Department for Transport for use in the assessment process that have ‘User Guides’ and ‘Guidance Documents’ are available. The main suites are:
♦ TEMPRO – Trip End Forecasts; ♦ DIADEM – Variable Demand Modelling; ♦ TUBA – Transport User Benefit Appraisal; ♦ COBA – DMRB Volume 13 – Economic assessment of highway schemes,
primarily used for assessing accident benefits; ♦ QUADRO – DMRB Volume 14 – Economic assessment of delays during
construction and maintenance ♦ INCA – Incident Cost Benefit Analysis.
These documents will also be referenced in the Guidance Note where appropriate.

Interim Advice Note 106/08 Guidance Note for Traffic Consultants Employed on Highways Agency Schemes
IAN 106/08 5 of 40 January 2008
1.3 HA Scheme Overview Note: This section may need some amendment to fully reflect the post-Nichols situation. Documentation of the traffic assessment, modelling and economic appraisal undertaken in the course of developing a HA road scheme is a key requirement for ensuring decisions are supported by robust assessment and data. The life of a major highway scheme passes through several decision stages where specific documentation is required. These stages are as follows:
♦ Public Consultation (PC);
♦ Preferred Route Announcement (PRA), usually concurrent with entry to the Programme of Major Schemes;
♦ Order Publication Report (OPR);
♦ Ministerial Decision to make orders (often following a Public Inquiry); and
♦ Commitment to works expenditure stage.
The PC and PRA stages historically occurred after Programme Entry but now PC usually precedes Programme Entry and PRA occurs concurrently with Programme Entry. The assessment reporting requirements are outlined in DMRB Volume 5 Section 1 Part 2 TD37/9 and are summarised as follows:
♦ Stage 1 – identify the environmental, engineering, economics and traffic advantages, disadvantages and constraints associated with broadly defined improvement strategies;
♦ Stage 2 – identify the factors to be taken into account in choosing alternative routes or improvement schemes and to identify the environmental, engineering, economic and traffic advantages, disadvantages and constraints associated with those routes or schemes; and
♦ Stage 3 – identify the advantages and disadvantages, in environmental engineering, economic and traffic terms, of the overseeing department’s preferred route or scheme option.
These three stages historically generally corresponded to the following periods in the decision process.
♦ Stage 1 prior to TPI Entry;
♦ Stage 2 prior to Public Consultation; and
♦ Stage 3 prior to publication of orders, but after the selection of a preferred route. As a result of the post Nichols changes, further guidance will be needed on the various Stages.
One aim of the staged assessment reporting process is to convey to the public and statutory bodies the likely impacts of the scheme to enable comments on the proposals. The desired content of the five traffic and economics reports should be expressed without bias and as far as practical in non-technical terms. The reports must be capable of being understood by a lay reader and yet at the same time be capable of withstanding rigorous examination and challenge in a public arena (such as a Public Inquiry or even in the High Court). They should be set out clearly and logically. In particular, all abbreviations and acronyms should be explained in a glossary of terms and adequate references to other quoted documents should be provided.
Guidance in WebTAG Unit 1.3 – Trunk Roads, discusses the staged process used in DMRB and states that the approach is compatible with the New Approach To Appraisal (NATA)

Interim Advice Note 106/08 Guidance Note for Traffic Consultants Employed on Highways Agency Schemes
IAN 106/08 6 of 40 January 2008
adopted in WebTAG. The WebTAG guidance is concerned with the way in which solutions are identified as well as the way in which they are appraised. In essence, the WebTAG process includes:
♦ Identification of the problems to be addressed (and/or the identification of local or project- specific objectives to be met);
♦ Identification of a wide range of solutions to be considered; and
♦ Distillation of the solutions to identify the preferred solution.
WebTAG Unit 1.3 then outlines the compatibility between the three stages of highway appraisal and WebTAG to be as follows:
♦ Problem identification will usually have been completed at Stage 1;
♦ Identification of potential solutions will generally span Stages 1 and 2; and
♦ Selection and refinement of the preferred solution will be carried out in Stages 2 and 3.
The above may be subject to some revision in the post-Nichols situation.
1.4 Scheme Reporting The reporting used to convey the traffic and economic appraisal of a scheme should comprise the following five reports:
♦ Work Programme Report
♦ Traffic Survey Report;
♦ Local Model Validation Report;
♦ Forecasting Report; and
♦ Economic Assessment Report.
The Work Programme Report outlines the traffic assessment requirements while the four subsequent reports detail the process supporting the traffic and economic assessment. The level of detail in the traffic and economics reports will be revised as the scheme progresses. At Stage 1 traffic modelling and economics may be based on a strategic model or an initial ‘Local Area Model’. At the later stages a comprehensive Local Area Model is likely to be developed that incorporates more detailed data, resulting in more refined modelling and economics. Models are also revised in relation to changes in the status of input assumptions, particularly where land use strategies are adopted or new guidance is published affecting the key modelling assumptions. After the Order Publication Report (OPR) stage, there is usually little change in the traffic and economic appraisals, other than updating of the scheme costs, unless the scheme is changed as a result of the Public Inquiry process or because the appraisal methods and/or parameters change.
It is inevitable that during the development of a scheme changes to the model structure, input data or parameters will occur. When such changes are made, it is necessary to consider whether a new edition of the report is necessary. This would ensure that the original details are kept in the first edition, whilst subsequent editions contain the relevant amendments. Following this procedure will allow all parties involved to track changes as the project progresses. The planning stage may span a long time period so having multiple editions of each report to refer to will be a useful tool for those involved in the project.
Interim Advice Note 106/08 Guidance Note for Traffic Consultants Employed on Highways Agency Schemes
IAN 106/08 7 of 40 January 2008
The traffic and economic reports also inform other reports, including the Environmental Statement, Technical Appraisal Report, Scheme Assessment Report and the Appraisal Summary Tables.
The reporting requirements for four reports detailing the development of the traffic models are outlined in DMRB Volume 12 in terms of general content. However, aspects of the process need to conform to WebTAG guidance.
1.5 Economic Assessment Software The economic assessment process uses several software suites that have been written specifically for this purpose which use, as input data, output from traffic models. The output from these software suites provide important contributions to the Appraisal Summary Table (AST) and decision concerning scheme progression. Consequently, the outputs require rigorous review. To aid this process, guidance has been developed as follows:
♦ TUBA Guidance on checking TUBA Outputs – Feb 2006 – HA by Mott MacDonald;
♦ COBA – DMRB Volume 13 Section 1, Part 7 How to Use the COBA Program, Chapter 5 Some Notes on the COBA Output;
♦ QUADRO – DMRB Volume 14 Section 1 Part 3 The Application of QUADRO, Chapter 7 Notes on How to Validate a QUADRO Appraisal;
♦ DIADEM – Still to be written; and
♦ INCA – Still to be written.
The above guidance should be used by the Project Team when compiling results for inclusion in the ‘Economic Assessment Report’ and its use and any other checks should be evidenced to demonstrate that the results reported are reasonable.
2 CONTENTS GUIDES
A key feature of any guidance note is transparency. However, with the creation of WebTAG alongside DMRB, the assessment process has become less clear and can appear to be more complicated. To improve this situation, this guidance note will focus on the delivery process as defined by the reporting requirements. ‘Contents Guides’ are therefore provided for each of the five reports that relate the existing guidance to the information required for the reports. Each section of the report is cross referred to DMRB, WebTAG and other guidance sources commonly used in the traffic and economic assessment process.
The use of ‘Contents Guides’ therefore helps to ensure that the relevant technical guidance has been consulted when preparing each section in the documentation of a scheme’s traffic and economic results.
The ‘Contents Guides’ for each of the five reports are given in tabular form in sections 2.1 to 2.5. Specific references to DMRB Volume 12 and WebTAG are set out in columns 2, 3 and 4 with references to other documents and other freestanding advice being included in the comments column.

Interim Advice Note 106/08Guidance Note for Traffic Consultants Employed on Highways Agency Schemes
IAN 106/08 8 of 40 January 08
2.1 – Work Programme Report
Guidance ReferenceContent
DMRBVolume 12.1.1
DMRBVolume 12.2.1
WebTAGComments
Study Overview Unit 1.2.1,Unit 1.2.2
Statement of scheme objectives. 2.3.1 to 2.3.5 2.1.1 to 2.1.4
Unit 1.1,Unit 1.2.1,Unit 1.2.2,Unit 1.3,Unit 2.1,Unit 2.2
Statement of why model is required.Chapter 2,11.4.1 and11.4.4
4.1.1B1,B2
Unit 3.1.2 Para 3.7
History of the scheme, usually limit to no more than last 10 years.Discussion of how the traffic modelling contributes to the ‘SchemeAssessment Reporting’ and provide information on what stage theproject as reached
DMRB Vol 5 Section 1 Part 2 TD36/93 ‘Scheme AssessmentReporting’
Discussion of how the scheme fits in with the HA objectives, routestrategies etc.Discussion of how the scheme fits in with ‘Regional TransportStrategy’.
Reason for Traffic Model
Discussion of problems the traffic model will investigate. 1.1.4 to 1.1.7 1.26 to 1.2.9
Unit 1.3 Para 1.1,Unit 1.3 Para 1.2,Unit 1.3 Para 2.1,Unit 1.3 Para 2.2
Discussion of how the traffic model will aid in the identification ofsolutions.
Unit 1.3 Para 2.1,Unit 1.3 Para 2.2,Unit 1.3 Para 3.1,Unit 1.3 Para 3.2
Discussion of the stage the scheme is at in the HA processes fromTPI entry to construction. Unit 1.3 Para 2.2 See discussion in DMRB Vol 5
Section 1 Part 2 TD37/9

Interim Advice Note 106/08Guidance Note for Traffic Consultants Employed on Highways Agency Schemes
IAN 106/08 9 of 40 January 08
2.1 (continued) – Work Programme Report
Guidance ReferenceContent
DMRBVolume 12.1.1
DMRBVolume 12.2.1
WebTAGComments
Planning /Policy Issues Unit 1.3 Para 2.2Review of Regional Planning Issues.Review of Policy Issue and Instruments that may influence thescheme Unit 2.3
Review of Developments that may impact on the scheme.Review of Regional Funding Allocation See draft WebTAG Unit 3.15.1
Model Development Approach
Review of existing models, including Multi-Model Models, RegionalModels, and Local Area Traffic models developed by HA and byother parties such as Local Authorities.
Unit 1.2.2
Discussions with relevant LocalAuthorities may reveal existingmodels that could be utilised orenhanced
Identify how existing models can be utilised in the development ofthe scheme related model. Unit 1.2.2
Discussion of the Traffic Model Structure, summarising usage ofLand Use Models, Mode choice, Time of Day choice. Unit 3.11 Unit 3.11 gives various model
structures.
Discussion on the choice of software used with reference to howrobust it is at representing issues relevant to the traffic modellingrequirements
Choice of software can influencethe ease of use and the facilitiesavailable to investigate trafficproblems
Discussion of modelling assumptions including statement on theirrobust within the context of the study.Overview of approach used to represent the supply network,making reference to use of existing models, requirements for datacollection.
Chapter 3 Chapter 2, 3,and 4

Interim Advice Note 106/08Guidance Note for Traffic Consultants Employed on Highways Agency Schemes
IAN 106/08 10 of 40 January 08
2.1 (continued) – Work Programme Report
Guidance ReferenceContent
DMRBVolume 12.1.1
DMRBVolume 12.2.1
WebTAGComments
Overview of approach used to represent the demand for travel,making reference to use of existing models and requirements fordata collection.
Chapter 6 4.3.1 to 4.3.41
Overview of calibration process used to developing travel demand,network integrate and assignment routing Chapter 8
Overview of assignment process to be used, with discussion of thealgorithms and parameters to be employed
Chapter 9 and10
Overview of validation including definition of validation criteria to beadopted by study. Chapter 11 4.3.42 to
4.3.47Overview of forecasting approach, with reference to choice ofopening and design year
12.3.6 to12.3.10 5.2.1 to 5.2.3 Unit 3.5.4 Para 4.2
Overview of the Variable Demand assessment requirements andhow this has been given full consideration in the development ofthe base year and forecast traffic models.
Chapter 5Chapter 12 Chapter 5 Unit 3.10
Description of assessment requirements including reference toeconomic, environmental and operational.
Chapter 13,14, 15
Unit 3.5.1,Unit 3.5.2,Unit 3.5.3,Unit 3.5.4,Unit 3.5.6,Unit 3.5.8,Unit 3.5.9
Review requirements as specifiedin DMRB Vol 13 – COBA, DMRBVol 14 – QUADRO, and TUBAmanual.
Description of Risks in the modelling process specific to thisscheme. Unit 3.5.9 Para 3.1 to 3.7
Description of approach to be adopted for ‘Before and AfterMonitoring’.
Chapter 161.1.3
See CHE 102/2001, andInterim Advice Note 39/01
Interim Advice Note 106/08Guidance Note for Traffic Consultants Employed on Highways Agency Schemes
IAN 106/08 11 of 40 January 08
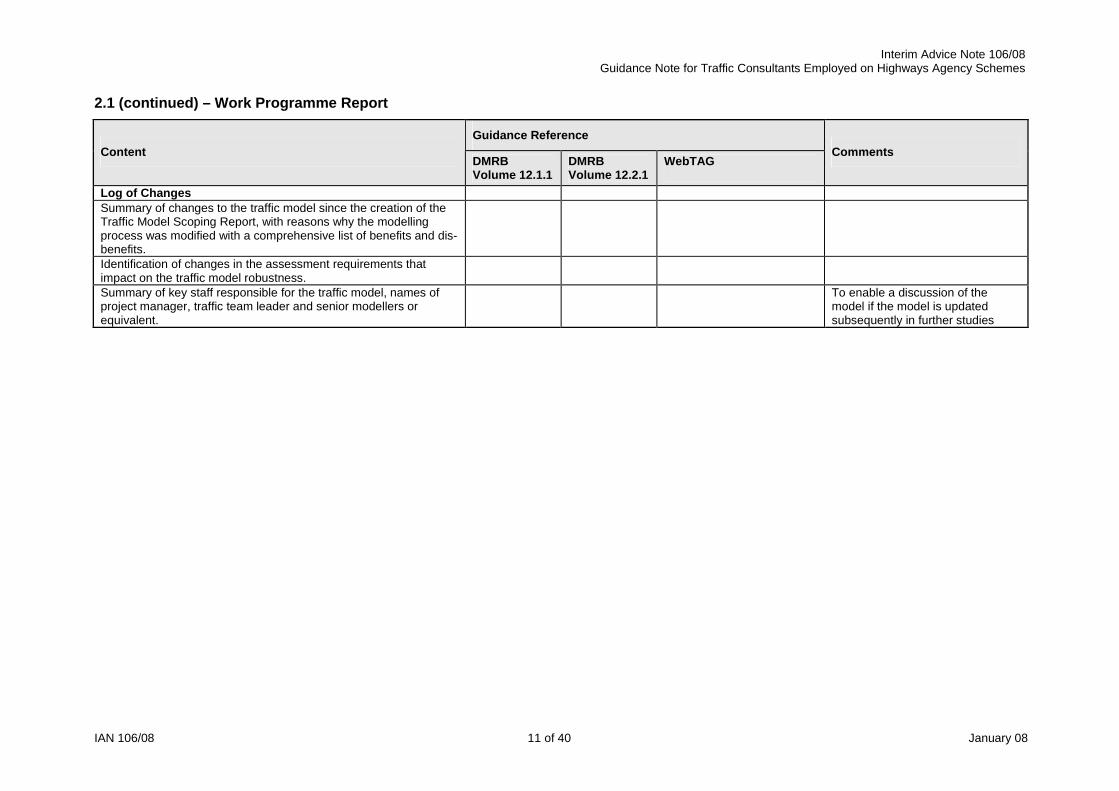
2.1 (continued) – Work Programme Report
Guidance ReferenceContent
DMRBVolume 12.1.1
DMRBVolume 12.2.1
WebTAGComments
Log of ChangesSummary of changes to the traffic model since the creation of theTraffic Model Scoping Report, with reasons why the modellingprocess was modified with a comprehensive list of benefits and dis-benefits.Identification of changes in the assessment requirements thatimpact on the traffic model robustness.Summary of key staff responsible for the traffic model, names ofproject manager, traffic team leader and senior modellers orequivalent.
To enable a discussion of themodel if the model is updatedsubsequently in further studies

Interim Advice Note 106/08Guidance Note for Traffic Consultants Employed on Highways Agency Schemes
IAN 106/08 12 of 40 January 08
2.2 – Traffic Survey Report
Guidance Reference
ContentDMRBVolume 12.1.1
DMRBVolume 12.2.1
WebTAGComments
Study Overview Unit 1.2.1,Unit 1.2.2
Statement of scheme objectives. 2.3.1 to 2.3.5 2.1.1 to 2.1.4
Unit 1.1,Unit 1.2.1,Unit 1.2.2,Unit 1.3,Unit 2.1,Unit 2.2
WebTAG sets the currentframework as defined by the DfT.
Statement of why data are required. 6.1.1 to 6.1.5 2.10.1,3.1 Unit 3.1.2 Para 3.7
Definition of Data Requirements 3.2 Unit 3.1.5
Statement of context and justification of why the data is required bythe study.
5.1.1 to 5.1.6,6.1.11 to6.1.14
3.1.1 Unit 2.1 Fig. 2.1,Unit 2.1 Para 1.3.8 to 1.3.9
WebTAG refers to DMRB Volume12 for general advice on traveldemand surveys
Review of existing data sources, with reference to whether the datawill be used in the study. 2.4.3
2.10.2 to2.10.3,3.1.4,3.3.1 to 3.3.6,
Unit 3.1.1 Para 1.2.3,Unit 3.11.1 Para 10.1 to 10.3
Existing models need to bereviewed, and travel demandsources identified.
Details of existing location, type and date of surveys, shown on aplan or map.
2.10.2,A6.1
Summary of why the data is being collected, with reference tousage later in the study.
6.1.12 to6.1.14
3.1.1,A1.1 Unit 3.1.2 Para 3.7.3
Details of survey programme highlighting the types of data to becollected.
6.1.15 to6.1.24
2.10.1,3.1.4,A1
Unit 3.10.2 Para 1.6.1 to1.6.27
Details of any ‘Pilot Surveys’, including information on how the pilotinformed the main surveys. 6.1.25 A6.1
If a large scale survey programme, a summary description of thetypes of survey undertaken with supporting plans illustrating thedifferent survey types on a common plan.
6.1.15 to6.1.16
A1,A6.1 Unit 3.11.2 Para 11

Interim Advice Note 106/08Guidance Note for Traffic Consultants Employed on Highways Agency Schemes
IAN 106/08 13 of 40 January 08
2.2 (continued) – Traffic Survey Report
Guidance Reference
ContentDMRBVolume 12.1.1
DMRBVolume 12.2.1
WebTAGComments
General Details for Each Survey 6.1 A1 See also IAN 30/01
Plan of survey locations. 6.1.15 to6.1.16
A1.3,A6.1
Tabulation of surveys giving date, day of week, duration of surveyand location including OSGR.
6.1.16,6.1.19 to6.1.20
A1.3,A6.1
Commentary on survey process. 6.1.23 3.1.4,A1.2 Unit 3.11.2 Para 11
Commentary on conditions, weather, known accidents, roadclosures, maintenance works, variable speed limits.
Statement on accuracy of the data (qualitative and quantitative).
6.1.23, 6.1.27,6.2.3,6.2.5,6.3.6 to 6.3.7,6.5.3,6.5.8,6.6.5,Chapter 10,Appendix D13
3.3.2,A1.2
Presentation of summary data for each survey type listed as listedbelow. A1.2
Details of any factoring or adjustments applied to data set. 6.10.1 to6.10.10 A1.3
Details of data format, file formats, file names, for each survey typeas listed below.
Documentation of the data toensure that it is easily accessible inthe future

Interim Advice Note 106/08Guidance Note for Traffic Consultants Employed on Highways Agency Schemes
IAN 106/08 14 of 40 January 08
2.2 (continued) – Traffic Survey Report
Guidance Reference
ContentDMRBVolume 12.1.1
DMRBVolume 12.2.1
WebTAGComments
Traffic Flow Data 6.2 and 6.3 3.2.19 Unit 3.1.5 Para 2.5.1
Details for each survey the count method, ATC, MCC, Video etc. 6.2 and 6.3 3.2.19 to3.2.23
Include statement of use made ofHATRIS data.See www.trads2.co.ukwww.transportdirect.infowww.highways.gov.uk/trafficinfoEnsure MCC data collected isdeposited in HATRIS
Graphical presentation showing daily flow variation by vehicle type(split by weekday, weekend or average day) for specific surveylocations or across cordons / screenlines.
A2.1/Fig.D.1,A6.1
Graphical presentation of monthly flow variation by vehicle type,either for a specific hour, period or daily (split by weekday,weekend or average day) for specific survey locations or acrosscordons / screenlines, or along corridors.
A2.1/Fig.D.1,A6.1
Graphical presentation of yearly flow variation by vehicle type,either for a specific hour, period or daily or month (split byweekday, weekend or average day) for specific survey locations oracross cordons / screenlines.
A2.1/Fig.D.1,A6.1
Diagrams showing turn count data by time period and vehicle type. Fig.13.7 A2.2/Fig.A.1,A6.1
Tabulations for multiple surveys showing traffic flows for keyhours/periods, suitably grouped into cordons, screenlines orcorridors.
A2.1 to A2.2,A6.1
Plan showing traffic flows at survey locations by key hours/periods. A2.1Details of any factoring to expand data from say 12 hours to 16hours.
6.10.5 to6.10.6

Interim Advice Note 106/08Guidance Note for Traffic Consultants Employed on Highways Agency Schemes
IAN 106/08 15 of 40 January 08
2.2 (continued) – Traffic Survey Report
Guidance Reference
ContentDMRBVolume 12.1.1
DMRBVolume 12.2.1
WebTAGComments
Roadside Interview Data 6.5 3.2.4 Unit 3.1.5 Para 3.1.1 to 3.1.2
Overview of process including a sample of the questionnaire used.
6.1.6 to 6.1.10,6.1.17 to 6.1.24,6.5.1 to 6.5.12,Fig.6.3,
3.2.6,3.2.8 to 3.2.16,3.2.20
Unit 3.1.5 Para 2.4.1,Unit 3.1.5 Para 3.1.1 to Para3.1.2,Unit 3.11.1 Para 10.3
Detailed information on undertakingRoadside Interview surveys iscontained in DMRB Volume 5Section 1 TA11/81 ‘Traffic Surveysby Roadside Interview’
Plan/Map showing location of Roadside Interview Sites. 6.5.1Presentation of sector-to-sector movements (using tabular formatand/or desire-line figures, by time of day, vehicle type and journeypurpose, if relevant.
Fig.8.1A3.1/Fig.A.2/Fig.B.1,A6.1
Plan of sectors used, on a map base. A3.1,A6.1
Tabulations indicating sample sizes and sample factors by eachvehicle type and time period at each survey site. 6.11.2 A3.1
Supporting tables of the codes used to represent vehicle types,purpose codes, time of day (start or end time), occupancy, O/Dlocation - Postcodes/OSGR's.
6.5.4 to 6.5.9,6.11.2 to6.11.3
3.4.2,A3.1,A6.1
Interim Advice Note 106/08Guidance Note for Traffic Consultants Employed on Highways Agency Schemes
IAN 106/08 16 of 40 January 08
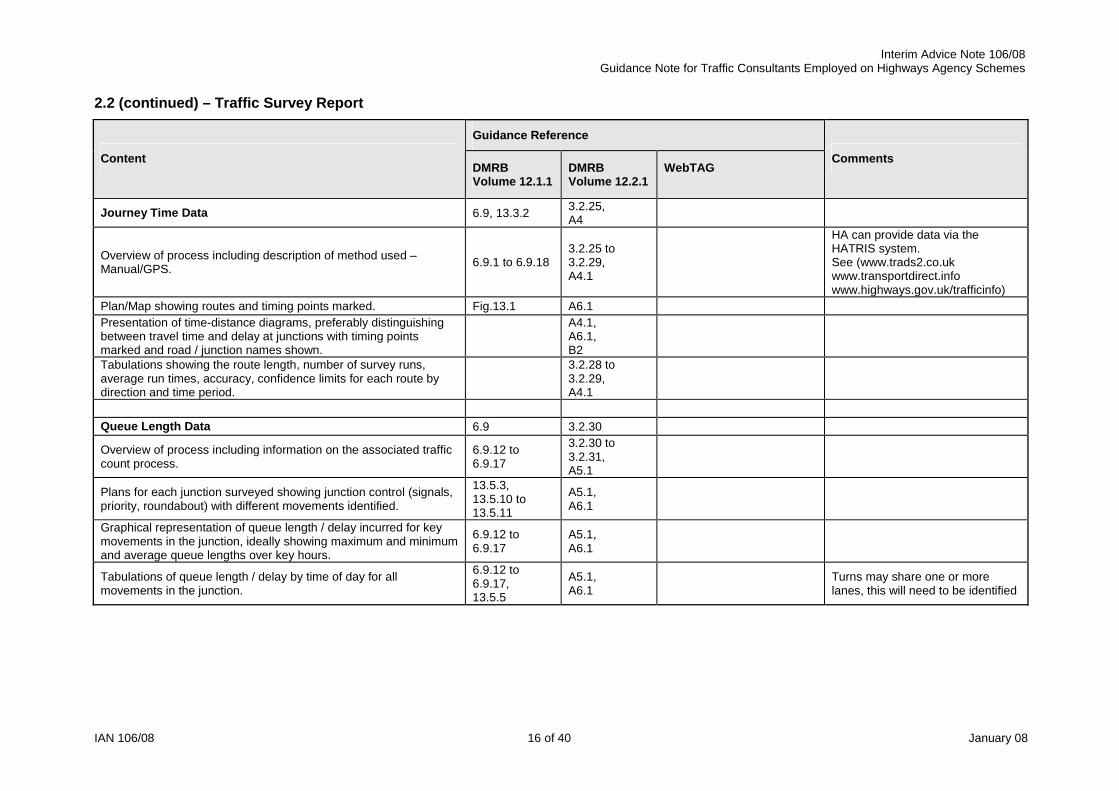
2.2 (continued) – Traffic Survey Report
Guidance Reference
ContentDMRBVolume 12.1.1
DMRBVolume 12.2.1
WebTAGComments
Journey Time Data 6.9, 13.3.2 3.2.25,A4
Overview of process including description of method used –Manual/GPS. 6.9.1 to 6.9.18
3.2.25 to3.2.29,A4.1
HA can provide data via theHATRIS system.See (www.trads2.co.ukwww.transportdirect.infowww.highways.gov.uk/trafficinfo)
Plan/Map showing routes and timing points marked. Fig.13.1 A6.1Presentation of time-distance diagrams, preferably distinguishingbetween travel time and delay at junctions with timing pointsmarked and road / junction names shown.
A4.1,A6.1,B2
Tabulations showing the route length, number of survey runs,average run times, accuracy, confidence limits for each route bydirection and time period.
3.2.28 to3.2.29,A4.1
Queue Length Data 6.9 3.2.30
Overview of process including information on the associated trafficcount process.
6.9.12 to6.9.17
3.2.30 to3.2.31,A5.1
Plans for each junction surveyed showing junction control (signals,priority, roundabout) with different movements identified.
13.5.3,13.5.10 to13.5.11
A5.1,A6.1
Graphical representation of queue length / delay incurred for keymovements in the junction, ideally showing maximum and minimumand average queue lengths over key hours.
6.9.12 to6.9.17
A5.1,A6.1
Tabulations of queue length / delay by time of day for allmovements in the junction.
6.9.12 to6.9.17,13.5.5
A5.1,A6.1
Turns may share one or morelanes, this will need to be identified

Interim Advice Note 106/08Guidance Note for Traffic Consultants Employed on Highways Agency Schemes
IAN 106/08 17 of 40 January 08
2.2 (continued) – Traffic Survey Report
Guidance Reference
ContentDMRBVolume 12.1.1
DMRBVolume 12.2.1
WebTAGComments
Registration Plate Survey 6.8 3.2.17 to3.2.18
Overview of process including information on associated trafficcounts.
6.8.1 to 6.8.3,6.8.12,6.9.10
3.2.6,3.2.17 to3.2.18
Plan/Map showing location of survey locations on a cordon,highlighting the locations where traffic may enter/leave the cordonun-surveyed or locations where vehicles may park/stop.
13.4? A6.1
Details of the sampling process. 6.8.4 to 6.8.12 A1.3Details of analysis, including matching criteria and factoringprocess.
6.8.13 to6.8.15
3.2.17 to3.2.18
Summary travel patterns, including matrices. 3.2.18Summary travel times obtained from matching process, to assessdelay through the survey area.
6.9.10 to6.9.11
3.2.17 to3.2.18
Household Surveys 6.6 3.2.4 Unit 3.1.5 Para 3.4
Overview of process including a sample of the questionnaire used.6.1.17 to6.1.24,6.6.1 to 6.6.6
3.2.6Unit 3.1.5 Para 3.4.1 to3.4.2,Unit 3.11.1 Para 10.3
Plan/Map showing location of surveys by zone/sector, aggregatedsuch that no single survey can be traced to specific zone/sector.
A1.3,A6.1
Presentation by zone / sector of survey findings, eg mode split, triprates etc.
A1.2,A6.1
Plan of zones/sectors used, on a map base. A1.3,A6.1
Supporting tabulations indicating sample sizes, with reference torelevant demographic parameter such as population, employmentrates, deprivation indices etc.
6.6.13 to6.6.18
3.2.6,A3.1
Supporting tables of odes used to represent question responses. 6.6.19 3.4.2,A3.1

Interim Advice Note 106/08Guidance Note for Traffic Consultants Employed on Highways Agency Schemes
IAN 106/08 18 of 40 January 08
2.3 – Local Model Validation Report
Guidance Reference
ContentDMRBVolume 12.1.1
DMRBVolume 12.2.1
WebTAGComments
Study Overview
Statement of scheme objectives. 2.3.1 to 2.3.5 2.1.2
Unit 1.1,Unit 1.2.1,Unit 1.2.2,Unit 1.3,Unit 2.1,Unit 2.2
Explanation of the purpose of the model and the schemes likely tobe assessed using the model.
Chapter 2,11.4.1,11.4.4.
4.1.1,B1,B2.
Unit 3.1.2 Para 3.7
Model Description / Specification Chapter 5 B3.1Unit 2.4 Para 1.4,Unit 3.1.1,Unit 3.1.2
Description of the wider modelling system should one exist - e.g.reference to Strategic Models or Multi-Modal Study.
17.1.Fig.17.1,17.4
B8.1 Unit 2.4 Para 1.1 to 1.3
Explanation of how the highway model relates to other componentsof any wider model - Flow chart of key process identifying inputs,outputs and any feedback loops with a description of theconvergence criteria.
8.4.1 to 8.4.20,18.2. B8.1
Description of any land use transport interaction models used. Unit 3.1.3,Unit 3.7.2
Description of type of highway model (e.g. link or link/junction-based). B2.1, B3.1 Unit 3.1.2 Para 2.1 to 2.12
Justification of type of highway model 5.1.1 to 5.1.5 B3.1 Unit 2.4 Para 1.4,Unit 3.1.2 Para 2.6 to 2.9

Interim Advice Note 106/08Guidance Note for Traffic Consultants Employed on Highways Agency Schemes
IAN 106/08 19 of 40 January 08
2.3 (continued) – Local Model Validation Report
Guidance Reference
ContentDMRBVolume 12.1.1
DMRBVolume 12.2.1
WebTAGComments
Description and plan of geographical model coverage includingidentification of areas of differing model type (e.g. highlightingareas of junction modelling). Plan should identify road names, roadnumbers and junction names.
2.4.1,4.1.13,B3.1,B4.1,B10.1
Unit 2.4 Para 1.4,Unit 3.1.1 Para 1.2,Unit 3.1.2 Para 2,Unit 3.10.2 Para 1.2
Justification of geographical model coverage. 3.1.1 to 3.1.52.4.2 to 2.4.7,4.1.2,B3.1
Unit 2.4 Para 1.4,Unit 3.1.1 Para 1.2,Unit 3.10.2 Para 1.2,Unit 3.11.1 Para 3.1 to 3.2
Unit 3.11 refer to PT, which mayneed to be considered
Specification and justification of any demand segmentation withinthe traffic model (time period, journey purpose, vehicle types, etc.).
2.2.22 to2.2.24,8.1.7 to 8.1.15,A17.20
2.5 to 2.7,4.1.4,B3.1
Unit 2.9.1,Unit 2.9.2,Unit 3.1.2 Para 2,Unit 3.1.1 Para 1.2.6,Unit 3.1.1 Para 1.2.34 toPara 1.2.44,Unit 3.10.2 Para 1.7
Statement of any software package and version used. 6.11,Appendix 20
2.11,4.1.8 to 4.1.12,B3.1
Unit 3.1.1 Para 1.3.30 toPara 1.3.33,Unit 3.1.2 Para 2

Interim Advice Note 106/08Guidance Note for Traffic Consultants Employed on Highways Agency Schemes
IAN 106/08 20 of 40 January 08
2.3 (continued) – Local Model Validation Report
Guidance Reference
ContentDMRBVolume 12.1.1
DMRBVolume 12.2.1
WebTAGComments
Summary of Data Collection Chapter 6 Unit 3.10.2 Para 1.6
Outline description of data sources and units - surveys, existingmodels, national databases, etc.…. A20.1 to A20.6 2.10,
A1Unit 3.1.1 Para 1.3.20 to Para1.3.29
References to any relevant Survey Report(s). B4.1
Definition of calibration data - type, location, day of week, time ofday, duration, age, accuracy. Chapter 10 3.1, B4.1
Definition of validation data - type, location, day of week, time ofday, duration, age, accuracy. Chapter 10 3.1, B4.1
Comparison of comparable data from different sources, whererelevant. A20.1 to A20.6 B4.1
Model Development – Network 5.4 4.2 Unit 2.4
Description of network structure, providing information on theextent of the 'Detailed Study Area' and 'Feeder' network, includinga plan/map.
9.4 B5.1 to B5.4,B10.1
Unit 3.1.1 Para 1.1 to 1.2,Unit 3.11.2 Para 5.4
Description of coding process used to determine link length andnode locations - Including usage of GIS systems. B5.2 to B5.3
Evidence for assessment of speed limits / road types for use indetermining network speeds. B5.4
Location, value and justification of fixed speeds and/or speed-flowcurves used on links, including plans and tables as necessary. 9.3
4.4.14 to4.4.18,B5.2
Unit 3.1.2 Para 2.8,Unit 3.1.2 Para 4.5.1 COBA

Interim Advice Note 106/08Guidance Note for Traffic Consultants Employed on Highways Agency Schemes
IAN 106/08 21 of 40 January 08
2.3 (continued) – Local Model Validation Report
Guidance Reference
ContentDMRBVolume 12.1.1
DMRBVolume 12.2.1
WebTAGComments
Description of calculation and assumptions behind junctionsaturation capacities.
13.5.4 to13.5.5
ARCADY/TRANSYT/PICADYbased calculations
Description of any network inventory undertaken, with a plan/list ofjunction/links surveyed. Can including junction layout survey andlink speed limit surveys to identify roads with 30/40/50/60/70 mphspeed limits.
B5.2 to B5.3 Unit 3.1.2 Para 2.9
Description of any junction operation data collected such as signaltimes (and if daily variation is modelled) and estimates of gaps atroundabouts and priorities.Description of modelling assumptions such as values used forqueue length per pcu, conversion factors between pcus andvehicles.
Description of modelling of PT services and bus priorities measuresinclusion in the network. 17.2 4.2.1
Unit 3.1.2 Para 2.10,Unit 3.1.2 Para 3.4,Unit 3.11
WebTAG Units for PT Modelling
Description of treatment of Freight Transport Unit 3.1.4
Description of network assumptions relating to representation ofTolls, High Occupancy Vehicles Lanes, Active Traffic Management,Variable Speed Limits, etc.
4.2.1

Interim Advice Note 106/08Guidance Note for Traffic Consultants Employed on Highways Agency Schemes
IAN 106/08 22 of 40 January 08
2.3 (continued) – Local Model Validation Report
Guidance ReferenceContent
DMRBVolume 12.1.1
DMRBVolume 12.2.1
WebTAGComments
Model Development – Matrices 4.3,D2 Unit 3.10.2
Description of zone structure, relating to historical zoning systemsand other zones such as wards and district boundaries, including alist of zones with appropriate names and correspondence to otherzones/wards/districts systems.
A17.5 B6.2,B10
Unit 3.1.1 Para 1.2.8,Unit 3.1.1 Para 1.2.11 to1.2.33,Unit 3.1.2 Para 3.1.5 to 3.1.7,Unit 3.11.1 Para 4.1 to 4.3
TEMPRO – Zoning structure
Description of data sources including previous study matrices, newRSI data, synthetic matrices. A17.6 to A17.7 B6.1
Unit 3.1.1 Para 1.3.20 to1.3.29,Unit 3.1.2 Para 3.1.9
Description of any matrix infilling process including the use ofsynthetic trip matrices / gravity models.
5.6.5,8.1.4 to 8.1.6,8.1.15 to 8.2.5,8.3,10.4
2.4.6,4.1.15,4.3.17,B6.1
Unit 3.1.2 Para 3.1.12 to3.1.17
Description of matrix building process including reference todealing with double counting and substitution of old data withnew/more reliable data.
5.5.5 to 5.5.6,8.1.7 to 8.1.15,10.4
D2
Unit 3.1.2 Para 3.1,Unit 3.1.2 Para 4.1,Unit 3.11.2 Para 12.2 toPara 12.4
Description of the matrix estimation process (if used), identifyinglocations of counts, matrix constraints such as 'frozen cells' ororigin and destination constraints.
8.2
Unit 3.1.2 Para 3.1.12,Unit 3.1.2 Para 3.1.19,Unit 3.10.2 Para 1.3,Unit 3.10.3 Para 1.7

Interim Advice Note 106/08Guidance Note for Traffic Consultants Employed on Highways Agency Schemes
IAN 106/08 23 of 40 January 08
2.3 (continued) – Local Model Validation Report
Guidance Reference
ContentDMRBVolume 12.1.1
DMRBVolume 12.2.1
WebTAGComments
Matrix estimation monitoring - Comparison of before and after: linkflows against counts, sector matrices, trip length distributions. 10.4
Model Development – Assignment Process5.6.9,Chapter 9,12.3
4.4
Unit 3.10.2,Unit 3.10.2 Para 1.8,Unit 3.11.2 Para 3,Unit 3.11.2 Para 4
Description of approach used (all-or-nothing/congestion-restrained,deterministic/stochastic).
5.6.9,9.5
4.4.1 to 4.4.5,Fig.4.2.
Unit 3.11.2 Para 5.1 to Para5.3,Unit 3.11.2 Para 5.5,Unit 3.11.2 Para 7
Description of time slices used and the interaction between timeslices.
13.4.4 to13.4.5
2.5.4 to 2.5.5,4.4.6 to 4.4.8,D1 to D5
Unit 3.10.2 Para 1.9
Definition of assignment costs calculation reference to generalisedcost and the VOT and VOC including sensitivity test results,including the treatment of different vehicle types and trip purposes.
9.2.4 to 9.2.6,10.6.4 to10.6.5
4.4.11 to4.4.13
Unit 3.5.6,Unit 3.10.2 Para 1.4,Unit 3.10.4 Para 1.7,Unit 3.10.2 Para 1.7.14 toPara 1.7.16,Unit 3.10.2 Para 1.10,Unit 3.11.2 Para 6,Unit 3.11.2 Para 9

Interim Advice Note 106/08Guidance Note for Traffic Consultants Employed on Highways Agency Schemes
IAN 106/08 24 of 40 January 08
2.3 (continued) – Local Model Validation Report
Guidance Reference
ContentDMRBVolume 12.1.1
DMRBVolume 12.2.1
WebTAGComments
Assignment convergence criteria used including summary ofconvergence levels set. 9.6 4.4.19 to
4.4.24Unit 3.10.4 Para 1.4.9,Unit 3.10.4 Para 1.5
Summary of assignment parameters used by the software,including convergence stopping criteria, level of variation fromminimum cost routes is stochastic assignments.
9.6 4.4.1 to 4.4.5 Unit 3.10.4 Para 1.3
Calibration 11.1 4.4.29,B4.1
Unit 3.10.3 Para 1.10,Unit 3.11.2 Para 10.1.9
Evidence of checks of network structure to include:• Graphical review of network structure to identify missing links;• Checks of modelled link lengths vs crow-fly distance (requires
accurate use of coordinate system);• Check model links are two way where appropriate and one-
way links are accurately represented including slip roads• Check HGV access restriction are represented
Review of the network codingshould be undertaken throughoutthe modelling process to identifycoding errors.
Evidence of checking that link speeds on the network are realistic. Unit 3.1.2 Para 2.8
Evidence of checks to ensure delay calculations at junctions ofoperating realistically. Unit 3.1.2 Para 2.9
Scope of use of matrix estimation - identification of counts used inthe process, before and after comparisons of the number of trips(at matrix and sector to sector level) and trip length distribution.
B6.1 to B6.2

Interim Advice Note 106/08Guidance Note for Traffic Consultants Employed on Highways Agency Schemes
IAN 106/08 25 of 40 January 08
2.3 (continued) – Local Model Validation Report
Guidance Reference
ContentDMRBVolume 12.1.1
DMRBVolume 12.2.1
WebTAGComments
Validation – NetworkUnit 3.1.2 Para 3.3,Unit 3.11.2 Para 10,Unit 3.11.2 Para 12
Analysis of Paths 11.4.6 to11.4.7 B5.2 Unit 3.11.2 Para 7
Justification and description of speed flow curves used in. 'postcapacity' formulation.
9.3.2,13.4.8 Fig.B2
Description of junction coding approach where appropriate. B5.1
Description of the coding of other network characteristics whereappropriate. 11.4.6 B5.2 to B5.3
Examination and justification of paths used on preliminaryassignments.
11.4.6 to11.4.9 B5.4 Unit 3.11.2 Para 7
Evidence of ad-hoc network validation checks. 11.4.7 B5.4,B8.1
Validation – Matrix Chapter 8,11.4.10
4.3.42,B6.1 to B6.3
Unit 3.1.2 Para 3.3,Unit 3.1.2 Para 4.2,Unit 3.10.2 Para 1.6.27,Unit 3.11.2 Para 10
Zone plan, preferably on a map base. B6.3,B10.1
Distinction between those movements observed and thosesynthesised.
Fig B1,B6 Unit 3.10.2 Para 1.3
Comparison of modelled zonal demand for key movements againstindependent data if available. B6.2

Interim Advice Note 106/08Guidance Note for Traffic Consultants Employed on Highways Agency Schemes
IAN 106/08 26 of 40 January 08
2.3 (continued) – Local Model Validation Report
Guidance Reference
ContentDMRBVolume 12.1.1
DMRBVolume 12.2.1
WebTAGComments
Comparison of modelled sector to sector demand with anyindependent screenline counts.
B6.2,Table 4.2
Plans of zones, sectors and screenlines used in the abovecomparisons.
Fig B1,B6.3,B10.1
Validation – Assignment 11.4.21 to11.4.23
4.4.34,B7.1 to B7.5
Unit 3.1.2 Para 3.3,Unit 3.11.2 Para 10
List of, and justification for, deviations from any default parametersused in the assignment software. None Unit 3.1.2 Para 3.5.6
Statement/explanation regarding independence of validation data. 11.4.21 to11.4.22
4.1.7,B8.1
Tabular comparison of modelled flows with observed site andscreenline counts.
11.4.23,15.2.6 to15.2.7
B7.2,B10,Table 4.2
Map-based comparison of modelled flows with observed site andscreenline counts.
15.2.2,15.2.6 to15.2.7
Fig B4 to B6,B7.2,B10.1
Tabular comparison of modelled and observed journey times.
11.4.23,15.2.2,15.2.6 to15.2.7
3.2.25,B7.2,B10,Table 4.2
Diagrammatic comparison of modelled and observed journeytimes.
Example 11.1,15.2.6 to15.2.7
Fig B2 to FigB3,B7.2,B10.1
For modelling of multiple (linked) time slices, presentation of theabove for the whole time period.
B7.4,D1

Interim Advice Note 106/08Guidance Note for Traffic Consultants Employed on Highways Agency Schemes
IAN 106/08 27 of 40 January 08
2.3 (continued) – Local Model Validation Report
Guidance Reference
ContentDMRBVolume 12.1.1
DMRBVolume 12.2.1
WebTAGComments
Statement of convergence stability (usually P>90% for 4consecutive iterations where P = percentage of links with flowchange <5%).
B7.5,C5.4,Table 4.1,Appendix H
Unit 3.10.4 Para 1.4.9,Unit 3.10.4 Para 1.5.6
Statement of convergence proximity (usually δ<1%).
B7.5,C5.4,Table 4.1,Appendix H
Unit 3.10.4 Para 1.4.9
Discussion of model validation if in the context of a wider modellingsystem. B8.1
Realism testing to establish robustness of base model in relation toits use as the ‘reference pivot’ for subsequent variable demandmodelling.
Unit 3.10.4 Para 1.6
Conclusion
Conclusion on the robustness of the model to be used forforecasting.
4.5.1 to 4.5.2and B10.1
Discussion of where the model is less robust with statement onhow this impacts on the models performance
Discussion of where the models representation of traffic and travelcould be further improved in the future.

Interim Advice Note 106/08Guidance Note for Traffic Consultants Employed on Highways Agency Schemes
IAN 106/08 28 of 40 January 08
2.4 – Forecasting Report
Guidance Reference
ContentDMRBVolume 12.1.1
DMRBVolume 12.2.1
WebTAGComments
Study Overview Chapter 5 Unit 3.1.2,Unit 3.11.1
This section will be updated whennew WebTAG unit 3.15.5, ‘TheTreatment of Uncertainty in ModelForecasting’, is finalised. (?)
Statement of scheme objectives. 2.3.1 to 2.3.5 2.1.2 Unit 2.2 Para 1 to Para 2,Unit 1.1 Para 1
Explanation of the purpose of the model and the schemes likely tobe assessed using the model.
Chapter 2,12.1,12.3.
5.1,C1,C2.
Unit 2.4 Para 1.4
Forecasting Approach 12.5Overview of forecasting approach, with reference to choice ofopening and design year
12.3.6 to12.3.10 5.2.1 to 5.2.3 Unit 3.5.4 Para 4.2
Overview of approach with respect to the treatment of variabledemand.
5.1 to 5.3,C1 to C2
Unit 3.1.2 Para 2 to Para 5,Unit 3.10.1,Unit 3.11.1
See CHE 174/2006
Flowchart of process, identifying key inputs and outputs.
Description of model form highlighting links to trip generation, tripdistribution, mode choice, time of day model components.
12.3.16 to12.3.21
Unit 3.11.1 Para 2.1 to Para2.5,Unit 3.11.1 Para 5

Interim Advice Note 106/08Guidance Note for Traffic Consultants Employed on Highways Agency Schemes
IAN 106/08 29 of 40 January 08
2.4 (continued) – Forecasting Report
Guidance Reference
ContentDMRBVolume 12.1.1
DMRBVolume 12.2.1
WebTAGComments
Forecast Network Development
Overview of network development process, including discussion ofchoice of opening and design year.
12.3.6 to12.3.10
5.3.3,C4.1 to C4.2,C6.1
This section will be updated whennew WebTAG unit 3.15.5, ‘TheTreatment of Uncertainty in ModelForecasting’, is finalised. (?)
Description of Do-Minimum (DM) schemes - plans showing routeswith information of road standard and junction forms.
2.4.5,C2.1,C4.1 to C4.2,C5,C6.1
Justification for inclusion of DM schemes, including reference tosources - HA Committed / Local Plan / Developer schemes withanticipated scheme opening dates.
2.4.5,C3.1,C4.1
Unit 3.10.1 Para 1.2 to Para1.3
Description of Do-Something schemes - plans showing routes withinformation of road standard and junction forms. AlternativeOptions to be modelled to be discussed and clearly identified.
13.3, 13.5
5.3.6,C2.1,C4.2,C5,C6.1
Assessment of the effect on base year model validation of anyforecast network changes which is not part of the scheme itself butwhich have been introduced to ensure meaningful modelling of thescheme (e.g. addition of minor side roads in the forecast year tomodel the impact of junction improvements).
C3,C4.1 Unit 3.1.2 Para 2.12
Explanation of any sensitivity tests to investigate the impact ofcertain schemes.
12.3.15,12.4.11,12.5.13
C4.1 Unit 3.10.4 Para 1.7
Description of any changes in routing parameters, based onchanges in ‘Value of Time’ and ‘Value of Operating Costs’, etc.
12.4.8 to12.4.10,12.5.9,12.5.11
C5.1Unit 3.5.6 Para 1,Unit 3.1.2 Para 2.12.7 toPara 2.12.14
Description of how additional costs (such as Tolls and Road UserCharging) are applied to the calculation of route costs. 12.5.11 Unit 3.1.2 Para 2.2.2,
Unit 3.11.1 Para 7

Interim Advice Note 106/08Guidance Note for Traffic Consultants Employed on Highways Agency Schemes
IAN 106/08 30 of 40 January 08
2.4 (continued) – Forecasting Report
Guidance Reference
ContentDMRBVolume 12.1.1
DMRBVolume 12.2.1
WebTAGComments
Forecast Network Development - CalibrationUndertake checks of network structure to include:• Graphical review of network structure to identify missing links;• Checks of modelled link lengths vs crow-fly distance (requires
accurate use of coordinate system);• Check model links are two way where appropriate and one-
way links are accurately represented including slip roads• Check HGV access restriction are represented
Review of the network codingshould be undertaken throughoutthe modelling process to identifycoding errors.
Undertake checks that link speeds on the network are realistic.
Identify links where dramaticchanges in speed occur andconfirm validated of change orcorrect
Undertake checks to ensure delay calculations at junctions ofoperating realistically.
Identify junctions where excessivedelay is being forecast. Considerthe implications on the schemeespecially on routeing and travelcosts.
Undertake checks that compare network structure betweendiffering scenarios• Base Year and Do Minimum• Base Year and Do Something• Do Minimum and Do Something
Assigned flows, traffic speeds androuteing can all be used to identifycoding errors introduced in theforecasting. Eg: comparison ofdistance matrix i-j pairs can revealdramatic changes in distance.

Interim Advice Note 106/08Guidance Note for Traffic Consultants Employed on Highways Agency Schemes
IAN 106/08 31 of 40 January 08
2.4 (continued) – Forecasting Report
Guidance Reference
ContentDMRBVolume 12.1.1
DMRBVolume 12.2.1
WebTAGComments
Forecast Matrix DevelopmentOverview of matrix development process, including justification ofchosen forecast years.
12.3.6 to12.3.10 Unit 3.1.2 Para 2.3
Overview of forecast matrix development, clearly demonstrating theprocess involved in moving the base year matrix to forecast yearmatrix, ideally with flowchart.
12.3.16 to12.3.21
Description of how official national/local growth rates are used (i.e.NRTF and TEMPRO).
5.2,12.3.16 to12.3.24,12.4.7,12.5.4,12.5.8,Table 1
2.9,5.4.8,5.4.10,C3.1
Unit 3.1.2 Para 3.6.2,Unit 3.1.2 Para 5.1.4 to Para5.1.7,Unit 3.1.5 Para 2
Comparison of growth rates based on other sources such as a ‘TripGeneration Model’ to NRTF and TEMPRO.
12.4.7,12.5.4 to12.5.8
2.9,C3.1
Explanation of how highway growth rates relate to othercomponents of the model system, such as public transport trips 12.3.21
See CHE 84/2000NRTF 1997 – Published 25 Nov2005http://www.dft.gov.uk/pgr/economics/datasources/nrtf1997/nationalroadtrafficforecasts3014TEMPRO – Guidance can bedownloaded from:http://www.tempro.org.uk/Download.aspx
Explanation of any other growth rates used; such as those resultingfrom any ‘Trip Generation-Distribution’ modelling used.
12.5.4 to12.5.8 C3.1 Unit 3.10.3 Para 1.4
Description of how specific developments are reflected in the tripmatrix, with information of any control methods used to change triplevels for existing trips.
C3.1
Explanation of how the various sources of growth are reconciled. 12.5 C3.1Tabulation of growth rates used C3.1Derivation of daily flow levels, for AADT, AAWT for 12 / 16 / 18 / 24hours from traffic model flows. E.g. 12 Hour AAWT = (2 * AM Peak)+ (8 * Inter Peak) +(2 * PM Peak).
8.1.10 to8.1.15Appendix D13
None

Interim Advice Note 106/08Guidance Note for Traffic Consultants Employed on Highways Agency Schemes
IAN 106/08 32 of 40 January 08
2.4 (continued) – Forecasting Report
Guidance Reference
ContentDMRBVolume 12.1.1
DMRBVolume 12.2.1
WebTAGComments
Forecast Assignments CalibrationUndertake initial checks of the assignments to confirm robustnessof the traffic model prior to main assignments:• Undertake fixed demand assignments;• Compare traffic flows, traffic speeds and travel distances at
global level;• Compare traffic routing for key movements likely to be of
scheme interest, compare travel times and distances;
Review of the network performanceshould be undertaken to ensurecoding errors are identified.
Forecast Assignments
Description of Forecasting Approach – including details ofapproach to Variable Demand Assessment using Elasticities and/orFull VADMA.
D1,G4
Unit 2.9.1,Unit 3.10 (all sections),Unit 3.1.2 Para 2.3,Unit 3.11.1 Para 6.1 to Para6.3,Unit 3.11.1 Para 9.1 to Para9.2
See CHE 174/2006
Confirmation that elastic assignment approach used is compatiblewith base year. G4.5 Unit 3.10.3
Overview of Elastic Forecasting Parameters – including anychanges to the generalised cost parameters.
Unit 3.10.3 Para 1.11,Unit 3.10.3 Appendix 1,Unit 3.1.2 Para 2.2 to 2.3
Details of 'Initial Assessment using Elasticities', includinginformation elastic assignment method used and elasticity valuesassumed.
Unit 3.10.3 Appendix 1
Initial results on the number of trips suppressed/induced for eachoption compared to input demand from elastic process. Unit 3.10.3 Para 1.7

Interim Advice Note 106/08Guidance Note for Traffic Consultants Employed on Highways Agency Schemes
IAN 106/08 33 of 40 January 08
2.4 (continued) – Forecasting Report
Guidance Reference
ContentDMRBVolume 12.1.1
DMRBVolume 12.2.1 WebTAG
Comments
Initial results of elastic approach on the economic benefit of thescheme based on 'TUBA' analysis of elastic process. Unit 3.10.3
Details of the justification to either undertake VADMA or notundertake VADMA.
Unit 2.9.1,Unit 3.10.3 See CHE 174/2006
Overview of VADMA approach if adopted.
Unit 2.9.1,Unit 3.10.2,Unit 3.10.3,Unit 3.10.4
Confirmation that VADMA approach used is compatible with baseyear. Unit 3.10.3
Overview of VADMA forecasting parameters - including anychanges to the generalised cost parameters.
12.4.9,12.5.9
Unit 3.10.3 Para 1.11,Unit 3.1.2 Para 2.12
Results on impact of VADMA on the number of tripssuppressed/induced for each option compared to input demand. Unit 3.10.3
Results on impact of VADMA on the trip patterns compared to inputdemand. Unit 3.10.3
Results of VADMA on the economic benefit of the scheme basedon 'TUBA' analysis Unit 3.10.3
List of deviations from any default parameters used in theassignment software. Refer to DIADEM Manual
Justification of deviations from any default parameters used in theassignment software. Refer to DIADEM Manual
Comprehensive list of assignments undertaken.
Interim Advice Note 106/08Guidance Note for Traffic Consultants Employed on Highways Agency Schemes
IAN 106/08 34 of 40 January 08
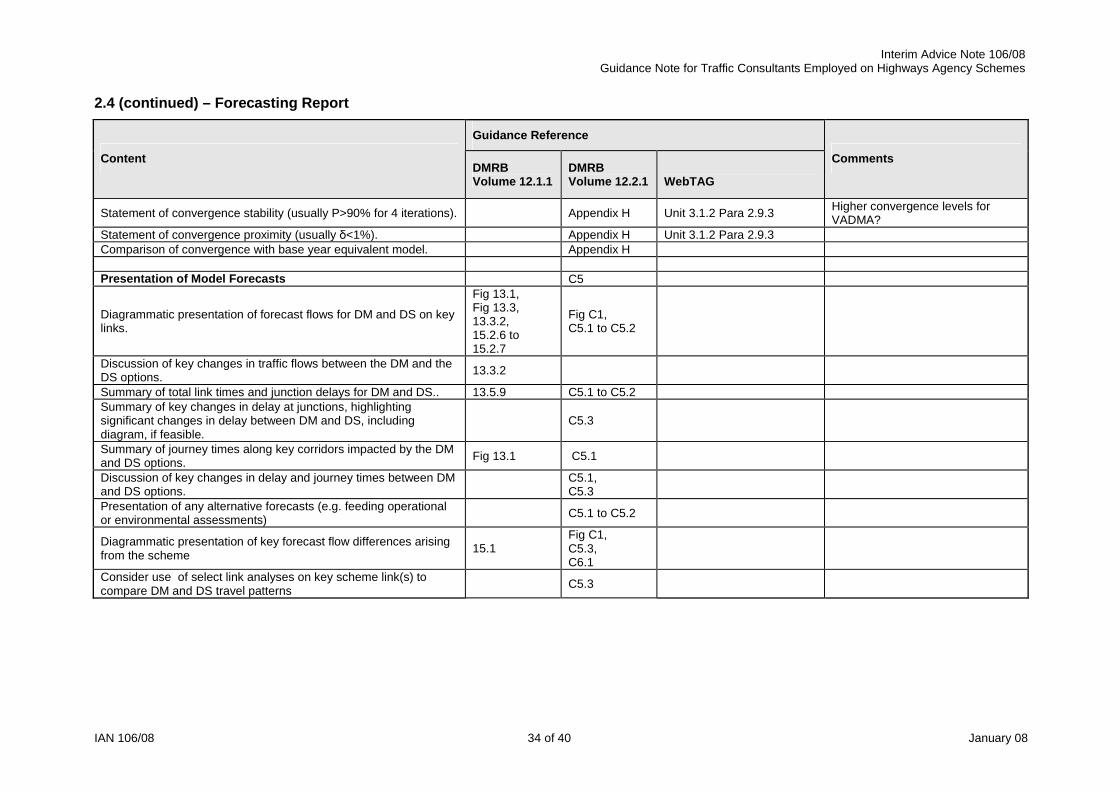
2.4 (continued) – Forecasting Report
Guidance Reference
ContentDMRBVolume 12.1.1
DMRBVolume 12.2.1 WebTAG
Comments
Statement of convergence stability (usually P>90% for 4 iterations). Appendix H Unit 3.1.2 Para 2.9.3 Higher convergence levels forVADMA?
Statement of convergence proximity (usually δ<1%). Appendix H Unit 3.1.2 Para 2.9.3Comparison of convergence with base year equivalent model. Appendix H
Presentation of Model Forecasts C5
Diagrammatic presentation of forecast flows for DM and DS on keylinks.
Fig 13.1,Fig 13.3,13.3.2,15.2.6 to15.2.7
Fig C1,C5.1 to C5.2
Discussion of key changes in traffic flows between the DM and theDS options. 13.3.2
Summary of total link times and junction delays for DM and DS.. 13.5.9 C5.1 to C5.2Summary of key changes in delay at junctions, highlightingsignificant changes in delay between DM and DS, includingdiagram, if feasible.
C5.3
Summary of journey times along key corridors impacted by the DMand DS options. Fig 13.1 C5.1
Discussion of key changes in delay and journey times between DMand DS options.
C5.1,C5.3
Presentation of any alternative forecasts (e.g. feeding operationalor environmental assessments) C5.1 to C5.2
Diagrammatic presentation of key forecast flow differences arisingfrom the scheme 15.1
Fig C1,C5.3,C6.1
Consider use of select link analyses on key scheme link(s) tocompare DM and DS travel patterns C5.3

Interim Advice Note 106/08Guidance Note for Traffic Consultants Employed on Highways Agency Schemes
IAN 106/08 35 of 40 January 08
2.4 (continued) – Forecasting Report
Guidance Reference
ContentDMRBVolume 12.1.1
DMRBVolume 12.2.1 WebTAG
Comments
Discussion of scheme impacts in terms of key link flows andchanges in key journey times:A) Comparing Do-Minimum conditions with forecast growth, againstbase year conditionsB) Comparing Do-Something conditions against Do-Minimumconditions
C5.3 Unit 3.8.2 Para 2.2
Presentation of key non highway changes such is results frommode-choice or time of day modelling. C5.2
Details of the provision of traffic data for use in EconomicAssessment.
6.2.1 to 6.214,6.3.1 to 6.3.7
Details of the provision of traffic data for use in EnvironmentalAssessment. 6.4.1 to 6.4.7 Unit 2.11
Details of the provision of data for the Operational Appraisal of thescheme design. 6.5.1 to 6.5.6
SummarySummarise key traffic flow changes for comparison between DMand alternative DS schemes C5.1 to C5.3
Summarise travel time and travel distance changes between DMand alternative DS schemes C5.1 to C5.3
Summarise non-highway impacts, primarily those on publictransport, but may include findings from other elements of themodelling process.Summaries any key assumptions that may influencerecommendations, with where possible indications of significance.
Interim Advice Note 106/08Guidance Note for Traffic Consultants Employed on Highways Agency Schemes
IAN 106/08 36 of 40 January 08
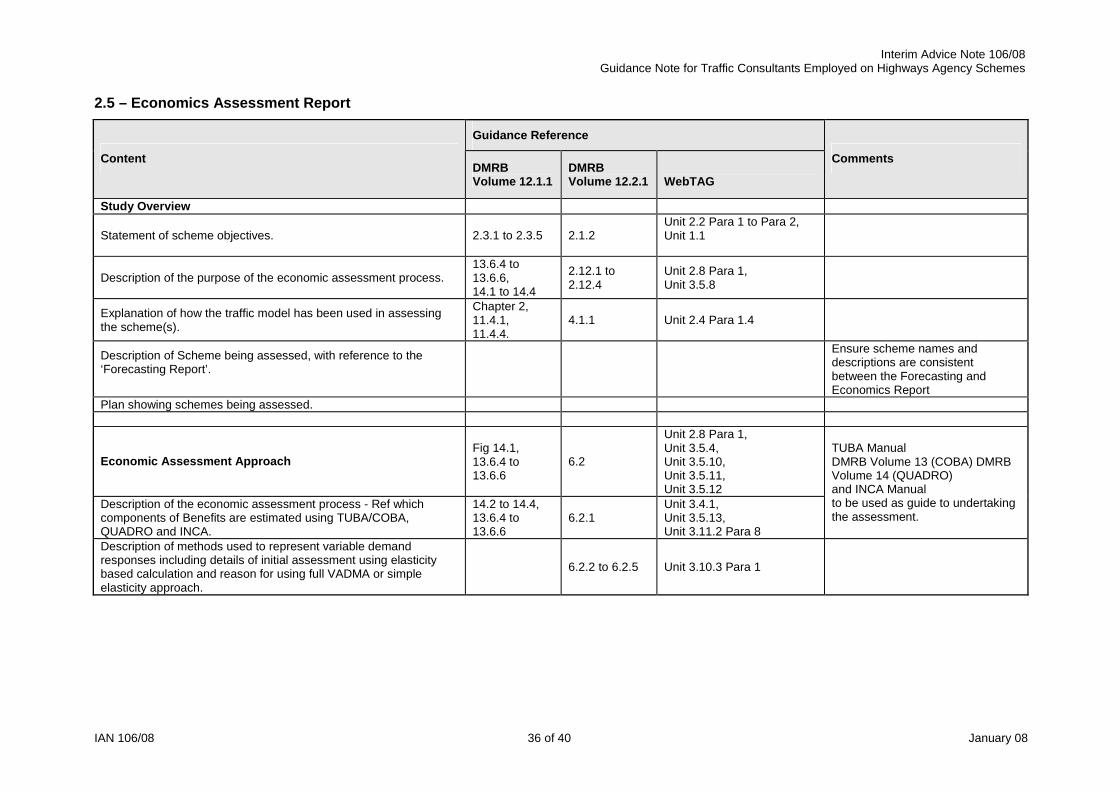
2.5 – Economics Assessment Report
Guidance Reference
ContentDMRBVolume 12.1.1
DMRBVolume 12.2.1 WebTAG
Comments
Study Overview
Statement of scheme objectives. 2.3.1 to 2.3.5 2.1.2Unit 2.2 Para 1 to Para 2,Unit 1.1
Description of the purpose of the economic assessment process.13.6.4 to13.6.6,14.1 to 14.4
2.12.1 to2.12.4
Unit 2.8 Para 1,Unit 3.5.8
Explanation of how the traffic model has been used in assessingthe scheme(s).
Chapter 2,11.4.1,11.4.4.
4.1.1 Unit 2.4 Para 1.4
Description of Scheme being assessed, with reference to the‘Forecasting Report’.
Ensure scheme names anddescriptions are consistentbetween the Forecasting andEconomics Report
Plan showing schemes being assessed.
Economic Assessment ApproachFig 14.1,13.6.4 to13.6.6
6.2
Unit 2.8 Para 1,Unit 3.5.4,Unit 3.5.10,Unit 3.5.11,Unit 3.5.12
Description of the economic assessment process - Ref whichcomponents of Benefits are estimated using TUBA/COBA,QUADRO and INCA.
14.2 to 14.4,13.6.4 to13.6.6
6.2.1Unit 3.4.1,Unit 3.5.13,Unit 3.11.2 Para 8
TUBA ManualDMRB Volume 13 (COBA) DMRBVolume 14 (QUADRO)and INCA Manualto be used as guide to undertakingthe assessment.
Description of methods used to represent variable demandresponses including details of initial assessment using elasticitybased calculation and reason for using full VADMA or simpleelasticity approach.
6.2.2 to 6.2.5 Unit 3.10.3 Para 1
Interim Advice Note 106/08Guidance Note for Traffic Consultants Employed on Highways Agency Schemes
IAN 106/08 37 of 40 January 08
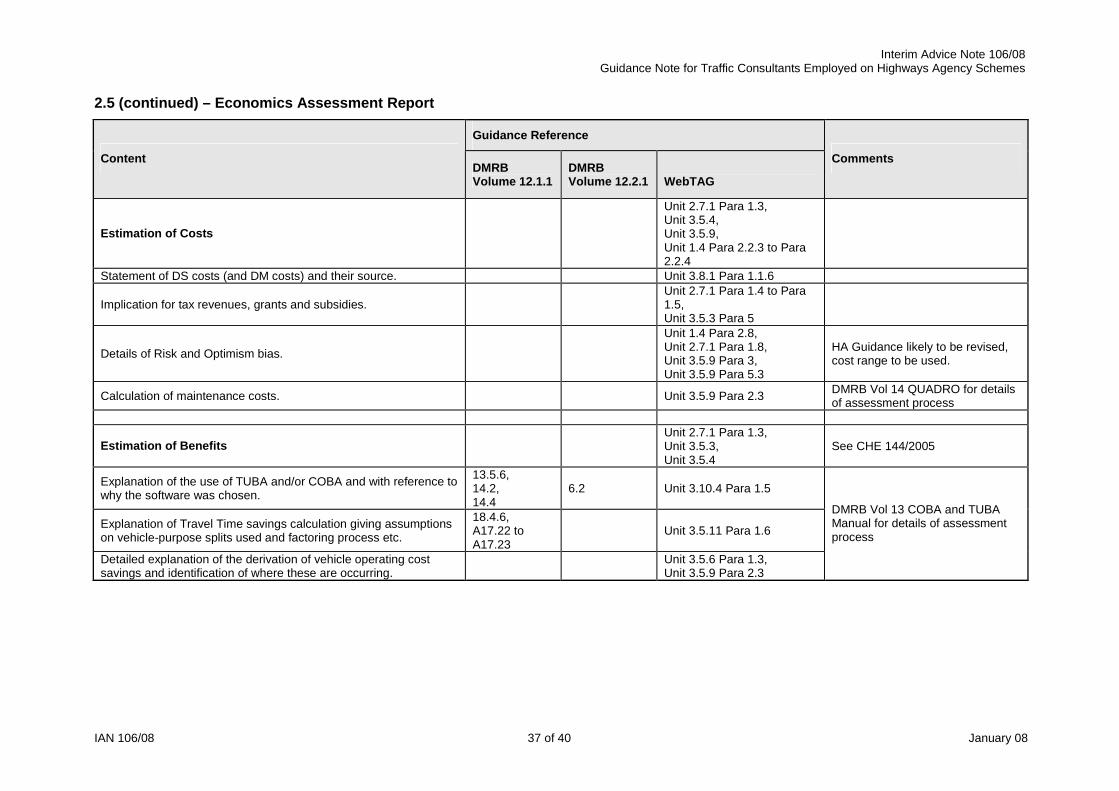
2.5 (continued) – Economics Assessment Report
Guidance Reference
ContentDMRBVolume 12.1.1
DMRBVolume 12.2.1 WebTAG
Comments
Estimation of Costs
Unit 2.7.1 Para 1.3,Unit 3.5.4,Unit 3.5.9,Unit 1.4 Para 2.2.3 to Para2.2.4
Statement of DS costs (and DM costs) and their source. Unit 3.8.1 Para 1.1.6
Implication for tax revenues, grants and subsidies.Unit 2.7.1 Para 1.4 to Para1.5,Unit 3.5.3 Para 5
Details of Risk and Optimism bias.
Unit 1.4 Para 2.8,Unit 2.7.1 Para 1.8,Unit 3.5.9 Para 3,Unit 3.5.9 Para 5.3
HA Guidance likely to be revised,cost range to be used.
Calculation of maintenance costs. Unit 3.5.9 Para 2.3 DMRB Vol 14 QUADRO for detailsof assessment process
Estimation of BenefitsUnit 2.7.1 Para 1.3,Unit 3.5.3,Unit 3.5.4
See CHE 144/2005
Explanation of the use of TUBA and/or COBA and with reference towhy the software was chosen.
13.5.6,14.2,14.4
6.2 Unit 3.10.4 Para 1.5
Explanation of Travel Time savings calculation giving assumptionson vehicle-purpose splits used and factoring process etc.
18.4.6,A17.22 toA17.23
Unit 3.5.11 Para 1.6
Detailed explanation of the derivation of vehicle operating costsavings and identification of where these are occurring.
Unit 3.5.6 Para 1.3,Unit 3.5.9 Para 2.3
DMRB Vol 13 COBA and TUBAManual for details of assessmentprocess

Interim Advice Note 106/08Guidance Note for Traffic Consultants Employed on Highways Agency Schemes
IAN 106/08 38 of 40 January 08
2.5 (continued) – Economics Assessment Report
Guidance Reference
ContentDMRBVolume 12.1.1
DMRBVolume 12.2.1 WebTAG
Comments
Detailed explanation of the derivation of accident cost savingsincluding description of source and extent of existing accident data,methodology for calculation of local accident rates and location ofaccident benefits.
Unit 3.4.1,Unit 3.8.2 Para 2.6
DMRB Vol 13 COBA for details ofassessment process.
Detailed explanation of the incident savings INCA Manual for details ofassessment process.
Detailed explanation of the derivation of construction andmaintenance benefits. 6.3 DMRB Vol 14 QUADRO for details
of assessment process.
Economic Assessment ResultsDefinition of price base and year to which costs and benefits arediscounted.
Unit 2.7.1 Para 1.7,Unit 3.5.4 Para 4.1
Profile of benefits over the 60 years, to highlight whether thebenefits occur earlier in the schemes life. See CHE 144/2005
Profiles of benefits split by time period to highlight whether thebenefits are from the peaks or inter-peak periods.Presentation of travel time and vehicle operating results. DMRB Vol 13 COBA and TUBAPresentation of accident results including numbers, severity andcost in worksheet.
Unit 3.4.1,Unit 3.8.2 Para 2.6 DMRB Vol 13 COBA
Presentation of delay due to construction and maintenance results. DMRB Vol 14 QUADROPresentation of Incident results INCA Manual
Interim Advice Note 106/08Guidance Note for Traffic Consultants Employed on Highways Agency Schemes
IAN 106/08 39 of 40 January 08
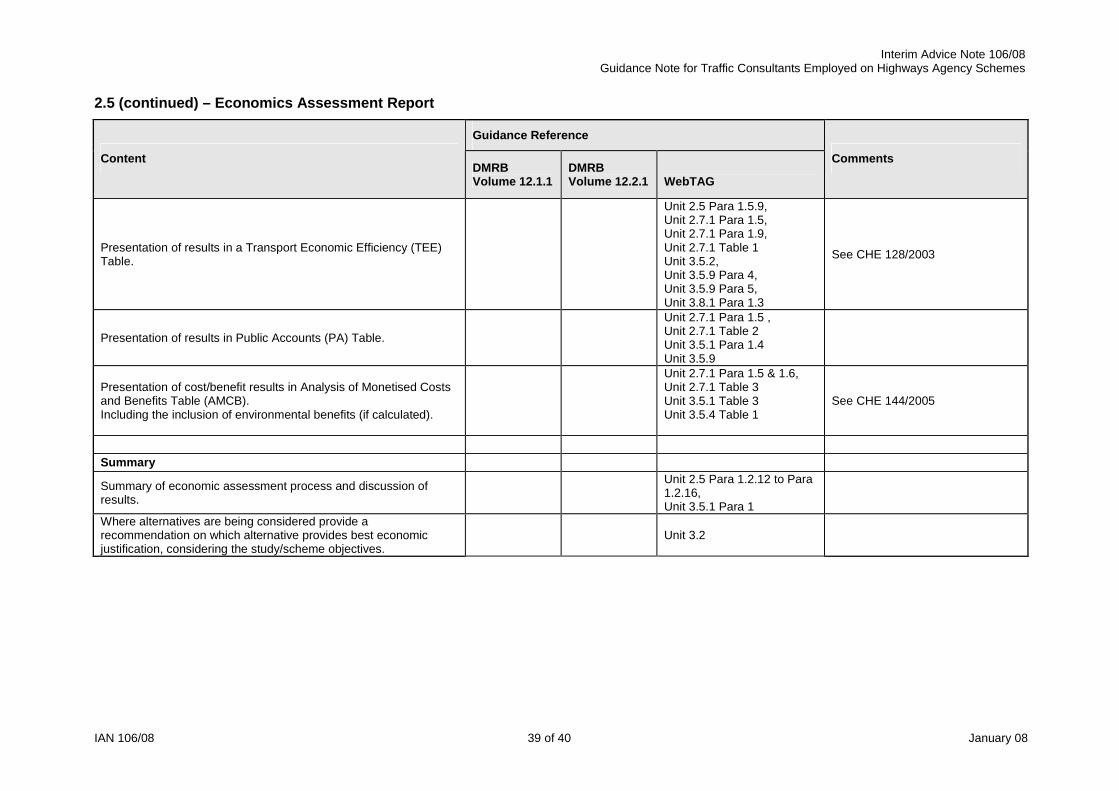
2.5 (continued) – Economics Assessment Report
Guidance Reference
ContentDMRBVolume 12.1.1
DMRBVolume 12.2.1 WebTAG
Comments
Presentation of results in a Transport Economic Efficiency (TEE)Table.
Unit 2.5 Para 1.5.9,Unit 2.7.1 Para 1.5,Unit 2.7.1 Para 1.9,Unit 2.7.1 Table 1Unit 3.5.2,Unit 3.5.9 Para 4,Unit 3.5.9 Para 5,Unit 3.8.1 Para 1.3
See CHE 128/2003
Presentation of results in Public Accounts (PA) Table.
Unit 2.7.1 Para 1.5 ,Unit 2.7.1 Table 2Unit 3.5.1 Para 1.4Unit 3.5.9
Presentation of cost/benefit results in Analysis of Monetised Costsand Benefits Table (AMCB).Including the inclusion of environmental benefits (if calculated).
Unit 2.7.1 Para 1.5 & 1.6,Unit 2.7.1 Table 3Unit 3.5.1 Table 3Unit 3.5.4 Table 1
See CHE 144/2005
Summary
Summary of economic assessment process and discussion ofresults.
Unit 2.5 Para 1.2.12 to Para1.2.16,Unit 3.5.1 Para 1
Where alternatives are being considered provide arecommendation on which alternative provides best economicjustification, considering the study/scheme objectives.
Unit 3.2

Interim Advice Note 106/08 Guidance Note for Traffic Consultants Employed on Highways Agency Schemes
IAN 106/08 40 of 40 January 08
3 Contacts Queries on this document should be made to :
Malcolm Walker SSR Traffic Appraisal, Modelling and Economics Tel 0161 930 5634 GTN 4315 5634 Email [email protected] or to your local SSR TAME representative.