guidance for improving pedestrian safety at uncontrolled ... · checklist safety issues checklist...
TRANSCRIPT

Guidance for Improving Pedestrian Safety at Uncontrolled Crossings
Safe Transportation for Every PedestrianSTEP


72% of pedestrian fatalities occur at non-intersection locations
16% of traffic fatalities are pedestrians

Pedestrian NetworksInterconnected
pedestrian transportation facilities that allow people of all
ages and abilities to safely and
conveniently get where they want to go.


Common Crosswalk Myths MYTH: There is an MUTCD pedestrian volume warrant for marked crosswalks.REALITY: There is no pedestrian volume requirement to mark a crosswalk in the MUTCD.
MYTH: Research supports the removal of crosswalks. REALITY: Marked crosswalks should not be removed without a plan for improving safety.
MYTH: Not marking a crosswalk is safer than marking a crosswalk. REALITY: Pedestrians can be expected to cross most types of roadways, with or without marked crosswalks. Research demonstrates that marked crosswalks alone along high-volume or high-speed roadways are generally not sufficient to improve pedestrian safety.

The Spectacular Six
Crosswalk Visibility EnhancementsRaised CrosswalksPedestrian Refuge IslandRRFBPHBRoad Diets

Crosswalk Visibility Enhancements

Raised Crosswalks

Pedestrian Refuge Islands

Rectangular Rapid Flashing Beacon

Pedestrian Hybrid Beacons (PHB)
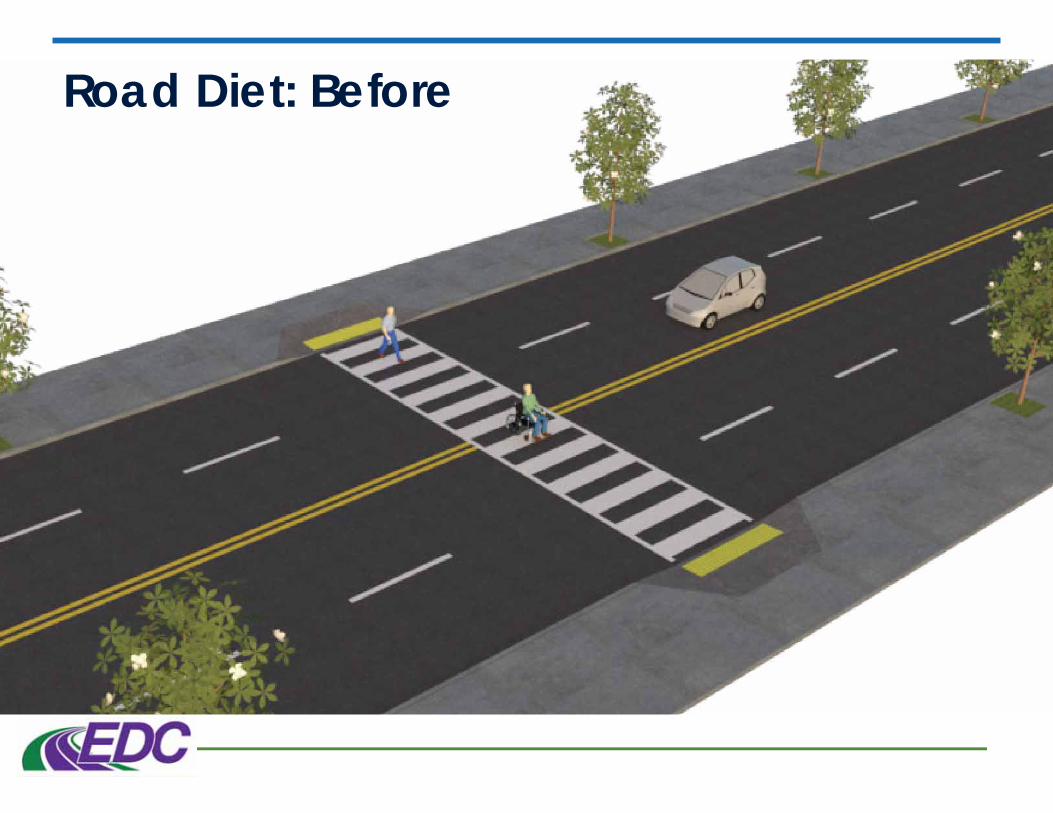
Road Diet: Before

Road Diet: After

Guide for Improving Pedestrian Safety at Uncontrolled Crossing Locations
Follows a 6-step process
Guides the selection of countermeasures to improve pedestrian safety
Supported by a “Field Guide for Selecting Countermeasures at Uncontrolled Pedestrian Crossing Locations”


Collect pedestrian crash and safety data
Evaluate pedestrian accommodation policies
Initiate a Pedestrian Safety Action Plan
Review pedestrian and traffic safety plans
Conduct a walkability audit

Inventory pedestrian crossings and observed traffic behavior
Classify pedestrian crossings: controlled vs uncontrolled
Inventory roadway characteristics
Screen the network for high-crash or high-risk locations

2005 Zegeer StudySafety Effects of Marked Versus Unmarked Crosswalks at
Uncontrolled Locations: Final Report and Recommended Guidelines
https://www.fhwa.dot.gov/publications/research/safety/04100/04100.pdf

Diagram crash reports
Identify crash factors
Lead an informal site visit
Conduct an Road Safety Audit

July 2018 version includes RRFB
Highlights situations where a marked crosswalkalone is not sufficient
Presents options for countermeasure selection
Does not substitute MUTCD requirements or guidance

Considers additional observed behaviors or crash trends
Further focuses options for countermeasure selection
Consult crash types and field data

Manual on Uniform Traffic Control Devices (MUTCD)
AASHTO Guide for the Design of Pedestrian Facilities
Local design guidance and selection criteria

Construct improvements
Monitor results of implementation
Consider funding options
Identify implementation opportunities

CRF and CMF Summary Table

Field Guide
Sample Inventory Form
Worksheets for each countermeasure:
DefinitionRoadway conditions checklistSafety issues checklistInstallation guidelines and MUTCD references

Local Success Story: Austin, TX PHBsThe city has installed 55 PHBs since 2009, and evaluates up to 10 locations a year.
The public can submit requests on the Signal Request Dashboard, City staff then evaluate and prioritize each request.
Evaluation criteria include:Speed limitNumber of lanesDistance to nearest controlled crossingPed crash history
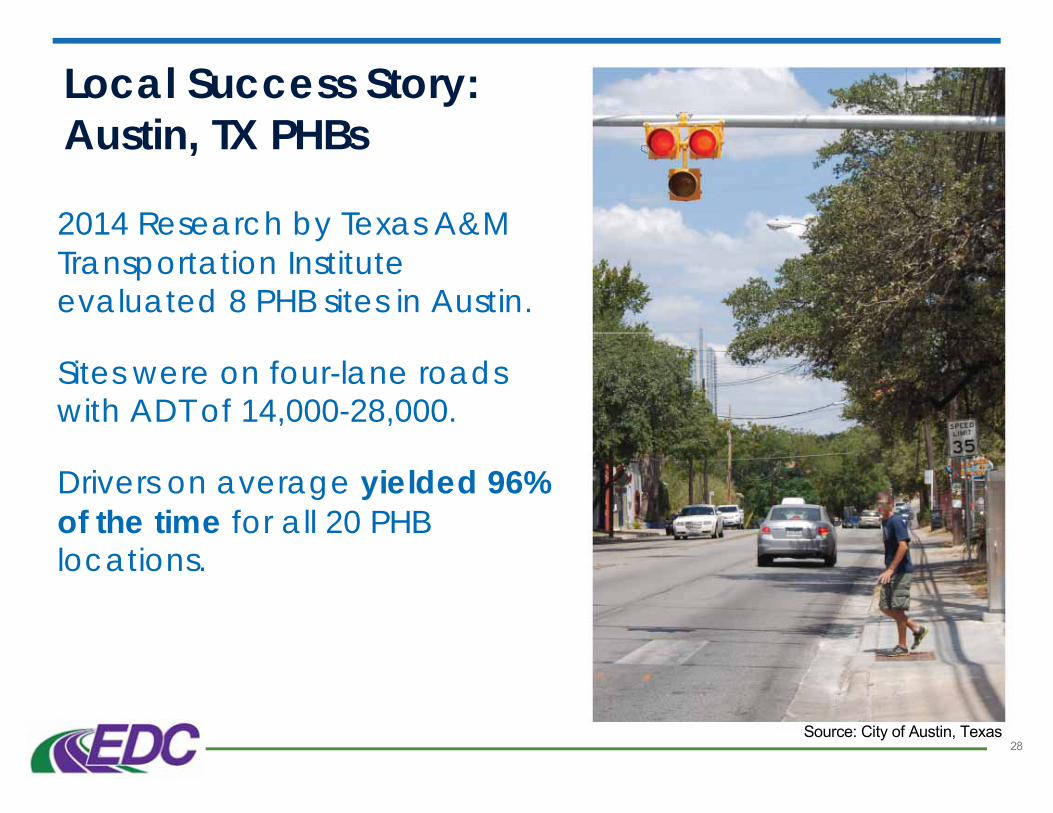
Local Success Story: Austin, TX PHBs
2014 Research by Texas A&M Transportation Institute evaluated 8 PHB sites in Austin.
Sites were on four-lane roads with ADT of 14,000-28,000.
Drivers on average yielded 96% of the time for all 20 PHB locations.

