guidance document for the testing of dissolution and
TRANSCRIPT

Organisation for Economic Co-operation and Development
ENVJMMONO(2020)9
Unclassified English - Or English
28 July 2021
ENVIRONMENT DIRECTORATE JOINT MEETING OF THE CHEMICALS COMMITTEE AND THE WORKING PARTY ON CHEMICALS PESTICIDES AND BIOTECHNOLOGY
Cancels amp replaces the same document of 20 July 2020
GUIDANCE DOCUMENT FOR THE TESTING OF DISSOLUTION AND DISPERSION STABILITY OF NANOMATERIALS AND THE USE OF THE DATA FOR FURTHER ENVIRONMENTAL TESTING AND ASSESSMENT STRATEGIES
Series on Testing and Assessment No 318
JT03479778 OFDE
This document as well as any data and map included herein are without prejudice to the status of or sovereignty over any territory to the
delimitation of international frontiers and boundaries and to the name of any territory city or area
2 ENVJMMONO(2020)9
Unclassified
SERIES ON TESTING AND ASSESSMENT
NO 318
GUIDANCE DOCUMENT FOR THE TESTING OF DISSOLUTION AND DISPERSION STABILITY OF NANOMATERIALS AND THE USE OF THE DATA FOR FURTHER
ENVIRONMENTAL TESTING AND ASSESSMENT STRATEGIES
Environment Directorate
ORGANISATION FOR ECONOMIC COOPERATION AND DEVELOPMENT
Paris 2020
ENVJMMONO(2020)9 3
Unclassified
About the OECD
The Organisation for Economic Co-operation and Development (OECD) is an intergovernmental organisation in which representatives of 36 industrialised countries in North and South America Europe and the Asia and Pacific region as well as the European Commission meet to co-ordinate and harmonise policies discuss issues of mutual concern and work together to respond to international problems Most of the OECDrsquos work is carried out by more than 200 specialised committees and working groups composed of member country delegates Observers from several countries with special status at the OECD and from interested international organisations attend many of the OECDrsquos workshops and other meetings Committees and working groups are served by the OECD Secretariat located in Paris France which is organised into directorates and divisions The Environment Health and Safety Division publishes free-of-charge documents in eleven different series Testing and Assessment Good Laboratory Practice and Compliance Monitoring Pesticides Biocides Risk Management Harmonisation of Regulatory Oversight in Biotechnology Safety of Novel Foods and Feeds Chemical Accidents Pollutant Release and Transfer Registers Emission Scenario Documents and Safety of Manufactured Nanomaterials More information about the Environment Health and Safety Programme and EHS publications is available on the OECDrsquos World Wide Web site (wwwoecdorgchemicalsafety)
This publication was developed in the IOMC context The contents do not necessarily reflect the views or stated policies of individual IOMC Participating Organizations The Inter-Organisation Programme for the Sound Management of Chemicals (IOMC) was established in 1995 following recommendations made by the 1992 UN Conference on Environment and Development to strengthen co-operation and increase international co-ordination in the field of chemical safety The Participating Organisations are FAO ILO UNDP UNEP UNIDO UNITAR WHO World Bank and OECD The purpose of the IOMC is to promote co-ordination of the policies and activities pursued by the Participating Organisations jointly or separately to achieve the sound management of chemicals in relation to human health and the environment
4 ENVJMMONO(2020)9
Unclassified
This publication is available electronically at no charge
Also published in the Testing and Assessment link
For this and many other Environment Health and Safety publications consult the OECDrsquos
World Wide Web site (wwwoecdorgchemicalsafety)
or contact
OECD Environment Directorate Environment Health and Safety Division
2 rue Andreacute-Pascal 75775 Paris Cedex 16
France
Fax (33-1) 44 30 61 80
E-mail ehscontoecdorg
copy OECD 2020 Applications for permission to reproduce or translate all or part of this material should be made to Head of Publications Service RIGHTSoecdorg OECD 2 rue Andreacute-Pascal 75775 Paris Cedex 16 France OECD Environment Health and Safety Publications
ENVJMMONO(2020)9 5
Unclassified
Foreword
Following a number of discussions within the OECD Working Party on Manufactured Nanomaterials (WPMN) (OECD 2014a) dissolution rate and dispersion stability in the environment where recognised as important parameters in understanding the environmental fate of nanomaterials and nanomaterials (bio)availability Both parameters are important in environmental risk assessment of nanomaterials The OECD decides to develop Test Guidelines for these parameters As a first step the OECD developed the Test Guideline 318 on dispersion stability of manufactured nanomaterials in simulated environmental media (OECD TG 318 2017) Another Test Guideline under development will address dissolution Nevertheless it was acknowledged that these parameters are often interlinked and thus the need to develop a document that could provide an overarching guidance Accordingly this GD focus on the dissolution and dispersion stability of nanomaterials and the use of the data for further environmental testing and assessment strategies It includes an excel spreadsheet as an accompanying document This document was led by Germany and benefited from the inputs of the Joint WNTWPMN Expert Group on Fate and Ecotoxicity of Manufactured Nanomaterials
6 ENVJMMONO(2020)9
Unclassified
Foreword 5
1 Introduction 7
2 Testing of solubility and dissolution rate 9
21 Static Batch Test 9
22 Dynamic testing of dissolution rates 12
23 Data evaluation and reporting from dissolution testing 14
3 Testing of dispersion stability with TG 318 16
31 Data presentation and evaluation for TG 318 19
32 Alternative test conditions 23
33 Testing of heteroagglomeration 24
34 Data evaluation and derivation of attachment efficiency 29
4 Use of data on dissolution and dispersion stability for further testing and assessment strategies 34
41 Purpose 34
42 Testing strategy 35
43 Points to consider when applying information on dispersion stability and dissolution for
potential further testing 37
5 Use of data on dispersion stability solubility and dissolution rate in exposure modelling 40
51 Use of data on dissolution rate in exposure modelling 40
6 Links to other relevant TGs and GDs 42
61 OECD TG 105 - Dissolution in water 42
62 OECD TG 106 - Adsorption - Desorption Using a Batch Equilibrium Method 42
63 OECD GD 23 - Guidance Document on Aquatic Toxicity Testing of Difficult Substances and
Mixtures 43
64 OECD GD 29 - Guidance Document on TransformationDissolution of Metals and Metal
Compounds in Aqueous Media 43
65 OECD GD 317 - Aquatic and Sediment Toxicological Testing of Nanomaterials 43
66 OECD TG for Nanomaterial Removal in Wastewater 44
67 OECD GD to Assess the Apparent Accumulation Potential of Nanomaterials during Fish
Bioaccumulation Studies 45
68 OECD GD to support the Use of TG 312 (Leaching in Soil Columns) for Nanomaterial Safety
Testing 45
7 References 46
8 Terminology definitions and abbreviations 52
ENVJMMONO(2020)9 7
Unclassified
In the OECD Expert Meeting in Berlin 2013 (OECD 2014a) it was identified that dissolution rate
and dispersion stability in the environment are important parameters for nanomaterials ie these
parameters are main drivers in environmental fate of nanomaterials and nanomaterials (bio)availability
and as such important in environmental risk assessment of nanomaterials It was concluded that Test
Guidelines (TGs) should be developed for these parameters As these parameters are often interlinked it
was acknowledged that an overarching guidance document (GD) would be beneficial as well
A Test Guideline (TG 318 OECD 2017) on dispersion stability of manufactured nanomaterials in
simulated environmental media is already available since 2017
A number of projects are being developed simultaneously at OECD to address different
environmental parameters For example a TG on dissolution rate in environmental media which purpose
is to develop and adequately validate a robust method in standardised conditions for dissolution of
nanomaterials Meanwhile also other relevant methods for dissolution rate testing in water and biological
fluids as well as transformation in the environment will be included in upcoming TG and GD for
nanomaterials In view of the current lack of harmonised methods this GD includes dissolution relevant
content based on available information in scientific literature and GD 29 (OECD 2001) also takes into
account the current draft document on dissolution rate in environmental media In doing so the GD
provides interim guidance on experimental steps and procedures of batch and dynamic flow-through
methods and decision support when to use them for nanomaterials (Chapter 2) until new TGs and GDs
become available When these OECD projects are finalised and TGs available an update of this GD might
be needed
This document provides guidance for the methods to address dissolution rate and dispersion
stability for nanomaterials with focus on environmental aqueous media The definition of nanomaterials as
having one dimension between 1 and 100 nm is generally accepted (ISO 2017a EU 2011) The guidance
provided here is relevant for solids in the nanoscale as well as their aggregates and agglomerates and it
focuses on their fate and behaviour in aqueous media In particular it presents the influence of various
experimental conditions on the performance and outcomes of the discussed methods In addition this GD
addresses modifications or additions to the methods and aims to give support for the interpretation of the
test results
Chapter 2 provides guidance for the determination of solubility and dissolution rate based on batch
test and flow-through methods as well as on how to evaluate and report the gained test results
Specific guidance on TG 318 is given in Chapter 3 including further experimental conditions than
described in the TG guidance to account for heteroagglomeration (section 33) and deriving attachment
coefficient(s) (section 34) In order to address the latter issues the state of the knowledge was included
from available scientific literature Furthermore guidance is provided on the interpretation and presentation
of data addressing the endpoint
The use of data generated by dissolution testing and testing of dispersion stability using TG 318
for possible further nano-specific fate and effect testing and assessment strategies is presented in Chapter
4 A testing strategy is presented in section 42 Furthermore influence of the two endpoints to each other
is discussed ie dispersion stability will influence dissolution rate and vice versa
1 Introduction
8 ENVJMMONO(2020)9
Unclassified
In Chapter 5 this GD provides recommendations on the use of output data from dissolution rate
and dispersion stability tests to derive input parameters for exposure models
Chapter 6 provides information on the use of this GD in relation to other OECD TGs and GDs
including the foreseen GD on aquatic and sediment toxicity testing (see section 65) and the foreseen GD
on the apparent accumulation potential of nanomaterials in fish (see section 67) As fate estimations of
nanomaterials in soil and sediment are challenging to conduct the GD also gives advice on screening
possibilities for dispersion stability and dissolution rates by varying the environmental conditions to mimic
those in soil and sediment (see section 68) and this is linked to the foreseen nano-specific GD to support
the implementation on the OECD TG 312 for nanomaterials safety
ENVJMMONO(2020)9 9
Unclassified
It is important to clearly distinguish between the terms solubility (the ability of a substance to
dissolve in a solvent) dissolution (the process under which a substance dissolves over time) and
dissolution rate (the amount of dissolved substance versus time) Solubility and dissolution rate of
nanomaterials are important to predict their fate and behaviour in the environment and for understanding
the changes in their bioavailability reactivity fate and toxicity Dissolution rates from nanomaterials are
particularly important in determining riskhazard since the rate of release of ionsmolecules prior to
interactioncomplexation with ligands may be more important than equilibrium concentrations
General methods for the determination of solubility and dissolution rate are available eg OECD
TG 105 (OECD 1995) Misra et al 2012 and ISO 19057 (ISO 2017b) All these methods feature different
advantages and disadvantages for nanomaterial testing So far no specific OECD TG is available for
determination of solubility and dissolution rate for nanomaterials However there are two WNT projects
underway one addressing Dissolution Rate of Nanomaterials in Aquatic Environment and a second on the
Determination of Solubility and Dissolution Rate of Nanomaterials in Water and Relevant Synthetic
Biological Media aiming to provide harmonised approaches for testing solubility and dissolution rate of
nanomaterials via static batch testing and dynamic flow-through methods respectively
In the existing OECD TG 105 (OECD 1995) two methods are described for the determination of
solubility of substances a static batch test and a dynamic test For determining dissolution (rate) of
nanomaterials the same set-up may be used with some modifications In addition the existing OECD GD
29 (OECD 2001) for metals and metal compounds may be applicable to some nanomaterials Scientific
basis for the flow-through method can be found in literature eg in Koltermann-Juelly et al 2018
21 Static Batch Test
Currently a draft TG is in preparation on Dissolution Rate of Nanomaterials in Aquatic Environment
This TG is based on OECD GD 29 (OECD 2001 Guidance Document on TransformationDissolution of
Metals and Metal Compounds in Aqueous Media) while making some nanospecific amendments Care
should be taken regarding the applicability of OECD GD 29 when considering the purpose of testing
solubility and dissolution rate of nanomaterials OECD GD 29 aims to provide supplemental information
for aquatic ecotoxicity testing of metal and metal compounds As indicated in OECD GD 29 ldquoThe intent of
the screening test performed at a single loading is to identify those compounds which undergo either
dissolution or rapid transformation such that their ecotoxicity potential is indistinguishable from soluble
formsrdquo As such the original purpose of OECD GD 29 is not to provide a harmonised approach to determine
solubility or dissolution rate to provide information on environmental fate Some of the pros and cons of a
static batch test as described in GD 29 are discussed in this section
The testing of nanomaterialsrsquo solubility and dissolution rate often goes beyond the scope of GD
29 For example GD 29 asks for testing the smallest available particle of a metal or metal compounds to
achieve maximum concentration of the dissolved ion of an investigated metal Inversely for nanomaterial
the solubility or dissolution rate of a specific nanomaterial under investigation is of interest which can differ
by eg available surface area or surface modification As another example the screening test in GD 29
requires test conditions where a metalmetal compound shows highest solubility For nanomaterials the
2 Testing of solubility and dissolution rate
10 ENVJMMONO(2020)9
Unclassified
testing of solubilitydissolution rate often relates to the question about the nanomaterialrsquos fate under certain
conditions (ie not necessarily the highest solubility)
For testing of solubility and dissolution rate the use of the 24 h screening test of GD 29 can still be
of interest for these questions and can be in principle applied depending on the nanomaterial properties
This seems to work at least for silver nanomaterials (Wasmuth et al 2016) For instance the screening
test can provide solubility limits (maximum amount of a solute that can dissolve in a solvent at a specified
temperature) for all nanomaterials and estimation of dissolution rate for sparingly soluble and slowly
dissolving nanomaterials However for determining dissolution rate the concentration of dissolved ions
needs to be measured over the time with short measuring intervals as long as steady state concentration
is not reached This is of particular importance for such nanomaterials that dissolves very fast ie within
a few hours
GD 29 prescribes a 020 microm filtration method for separating dissolved and non-dissolved
compounds This is not appropriate for nanomaterials that have individual particles or aggregates that are
usually smaller than this size cut-off so further separation is needed ISO 19057 (ISO 2017b) reviews
separation techniques that are applicable for nanomaterials related to in vitro biodurability testing
For the screening test the OECD GD 29 proposes the use of reconstituted standard water with pH
range between 6 to 85 (ie water of known composition for details on media composition see OECD GD
29) However in principle and based on the purpose of the testing the 24 h screening test can be also
performed under different media conditions (eg ecotoxicity media natural water simulated media
according to TG 318) Anyway it is essential to characterise and report test media characteristics as
detailed as possible as media composition influences nanomaterialrsquos dissolution (Misra et al 2012)
Reporting should include at least pH at start after equilibrium time and the end of testing ionic strength if
possible the presence and the concentration of polyvalent ions and the composition and concentration of
DOC (Dissolved Organic Matter eg NOM (Natural Organic Matter)
If the nanomaterial fully dissolves during the test duration the solubility limit of the nanomaterial is
equal or higher than the applied starting concentration Therefore starting concentration of the investigated
nanomaterial has to be high enough to determine the solubility limit If the solubility limit is not reached
within 24h the test duration can be prolonged in principle However this will not change the general
statement about the solubility of a nanomaterial (eg poorly or highly soluble) When performing the batch
test for determination of dissolution rate the following aspects should be considered The ion concentration
in the test media may increase to such an extent that the apparent dissolution rate will reduce This is
caused by a too long observation period (as measuring points will become too far apart and result in a
slow increase of the straight that represents the dissolution rate) Here shorter measurement intervals can
provide a corrective Derivation of dissolution rate is not possible for those nanomaterials that show such
a rapid concentration increase of the dissolved fraction during testing which cannot be resolved by
measurement
Speciation calculations can be useful for the investigated nanomaterial to estimate its general
tendency of dissolution in the used test media eg using the freely available software Phreeqc (The
software PHREEQC (ver 3 from the United States Geological Survey
httpswwwusgsgovsoftwarephreeqc-version-3 or VMinteq (httpsvminteqlwrkthse) When
dissolution tendency is calculated by such software the full characteristic of the test media should be used
As the various existing databases which exhibit data on substance properties specifications and on media
characteristics for calculation have different level of information it should be verified that the chosen
database contains relevant information for the case under consideration However not all nanomaterials
are covered by existing data base entries
Three main methods exist in the literature to separate nanomaterials and their aggregates from
their dissolved fraction ultra-centrifugation dialysis and centrifugal ultrafiltration Research has shown that
filter pore sizes of 01 to 002 μm could be suitable for separation of some nanomaterials from dissolved
ENVJMMONO(2020)9 11
Unclassified
species (Juumlnemann and Dressman 2012) by filtration As retention depends also on the filter material this
should be reported together with filter pores size in case filtering was used for nanomaterial separation To
reveal possible artefacts (eg nanomaterials sticking to filter membranes) mass balance between the
amount of nanomaterial initially introduced the retained and passed fraction can be useful
Ultra-centrifugation is not recommended for several reasons Firstly it is difficult to calculate the
optimal centrifugal settings (speed and time) to guarantee complete centrifugation of nanomaterials
especially for the case of non-spherical particles and when the rotor has no swing-bucket design but is eg
a fixed angle rotor Secondly theoretical optimal centrifugal times are often long relative to the dissolution
rate especially in the case of relatively small nanomaterials or nanomaterials with low density For those
nanomaterials proportionally long centrifugation times are needed to be separated them from their
dissolved ions At the same time they might dissolve faster compared to larger nanomaterials of the same
composition A too slow separation technique thus hampers the determination of relatively fast dissolution
rates Also often the accurate density of the investigated nanomaterial (eg nanomaterials with
coatingligands) is not known and it is difficult to calculate the correct speed settings Finally back-diffusion
of centrifuged nanomaterials into the centrifuge vial during sampling is likely and may cause artefacts of
overestimating dissolution To minimise sampling of back-diffused nanomaterials it is therefore
recommended to sample just below the surface
Dialysis is also not recommended for separating nanomaterials and their dissolved substances In
this technique nanomaterials are suspended in a medium within a dialysis bag Dissolved substances thus
need to diffuse through the dialysis membrane into a second compartment where they can be sampled for
quantification of the dissolution rate This process may again be too slow compared to the dissolution
process itself (see eg Franklin et al 2007) Furthermore it is difficult to determine if any sample gets
stuck to the tubes Thus the sample that finally reaches the dialysis bag might not be the same as
introduced
Centrifugal ultrafiltration is the recommend method for separating nanomaterials and their
dissolved substances taking into consideration specific measures (see paragraph 24) Here a mixture of
nanomaterials and their dissolved substances are injected in centrifugal ultrafiltration devices During
centrifugation nanomaterials and dissolved substances and the test medium are transported towards an
ultrafiltration membrane through which nanomaterials cannot pass while their dissolved substances can
The dissolved substances can then be measured in the filtered media
The pore diameter of ultrafiltration is expressed in terms of molecular weight cut-off (MWCO) ie
the molecular weight of different molecules in the filtration process (usually dextran or polyethylene glycol)
that are retained for 90 by the membrane (Ren et al 2006) There is also a pore size distribution rather
than a single pore size For separation a MWCO between 3-10 kDa is recommended This MWCO value
corresponds with pore sizes between 2-3nm (Ladner et al 2012) However care should be taken as the
use of low MWCO filter membranes can lead to a built up of ions in front of the filter This results into a
measurement of a lower dissolution rate Depending on the properties of the nanomaterials their ions and
the membrane properties adsorption of the nanomaterial andor the ions to the filtering membrane can
occur Furthermore media compounds like NOM can block the membrane In such a case filter with
MWCO values above 10 kDa may be useful considering that individual nanomaterials can pass the
membrane too
The centrifugal speed and time required to drive a sufficient amount of aqueous solution containing
dissolved species to cross the membrane depends on the MWCO and hydrophobicity of the membrane
as well as the chemistry of the medium The centrifugal settings should be optimized to achieve a filtrate
volume sufficient for subsequent measurement Prewashing of the filter membrane by centrifuging
ultrapure water through the membrane is prerequisite for any filtration step to remove dissolved chemicals
that could influence the dissolution process Modifying or pre-treating the membranes can be used if
significant issues are observed eg binding to the membrane (Cornelis et al 2010 Hedberg et al 2011)
12 ENVJMMONO(2020)9
Unclassified
Prior to use a centrifugal filtration device should be evaluated concerning the interaction with the
investigated nanomaterial This can help to assess possible loss of ions and to avoid an underestimation
of dissolution rate (Kennedy et al 2010)
In principle the batch test procedure may also be applicable for testing non-metal nanomaterials
but the current analytical possibilities still limit these options The selection of an analytic method needs to
include considerations of eg the detection limit of the method in relation to the investigated nanomaterial
or the necessary effort to distinguish between the investigated nanomaterial and the media compound
(eg NOM and carbon-based nanomaterials) Therefore the decision on an appropriate analytic method
currently can only be done case-by-case
22 Dynamic testing of dissolution rates
An OECD project under development on the determination of solubility and dissolution rate of
nanomaterials in water and relevant biological media aims to include two different methods both a static
batch test and dynamic dissolution testing by a flow-through system The method applied for a flow-
through dissolution test is based on the amended Continuous Flow System mentioned in ISO TR 19057
(ISO 2017) Here simulated media is continuously pumped from a reservoir through a cell containing a
nanomaterial samples After the media has passed the nanomaterial sample the solute concentration in
the fluid can be measured The method was applied in the past to determine the bio-durability for mineral
fibre and its applicability to nanomaterials was presented by Koltermann-Juelly (2018) for the dissolution
of 24 (nano)forms of 6 substances (Figure 1 below) for various human lung fluids and by Bove et al (2018)
for various gastro fluids
Figure 1 Possible experimental setup for flow-through testing (from Koltermann-Juelly et al (2018))
(UHMWPE = Ultra High Molecular Weight Polyethylene)
In principle the dynamic method can be adapted to measure dissolution rate in environmental
media However depending on the purpose test conditions might need to be adapted for differences in
environmental compared to biological media Apart from differences in test media composition (eg pH
ionic or organic compounds) considerations for adaptation include applied test concentration flow rates
and test duration For instance for the determination of dissolution rate under environmental relevant
ENVJMMONO(2020)9 13
Unclassified
conditions considerably different concentrations (eg media composition temperature) and flow rates (first
suggestion microg and 1 mlmin) should be used compared to those used for the dissolution testing in biological
media (mg and 2 mlh) thus saturation effects are unlikely to occur
The dynamic dissolution test should mimic the condition in a natural water where the nanomaterial
is highly diluted and freely diffusing The dissolution rate of intermediate and highly soluble materials is
among other parameters controlled by the thickness of the boundary layer surrounding the nanomaterial
and the concentration gradient of dissolved ions in the boundary layer For those nanomaterials the
transport of ions away from the particle surface is a limiting factor The flow rate in the experiment should
ideally mimic those conditions With 2 mlh saturation effects have been observed with BaSO4 at 1 mLmin
these effects are reduced but not totally prevented Flow rate and test conditions can be in principle
modified to mimic other specific environmental relevant conditions For comparing the dissolution rate of
different nanomaterials the chosen test conditions for those nanomaterials should be the same
With current scientific knowledge and the co-dependence of the dissolution rate on solubility
thickness of the nanomaterialrsquos boundary layer and specific surface areaparticle size exact cut-off values
for applying a dynamic dissolution test cannot be given From current experiences the dynamic test would
be suggested if the solubility of the nanomaterial is between 01 and 10 mgL For most of these
nanomaterials constant values for dissolution rate were achieved within less than 12 hours Values for
dissolution rate should be determined with sufficient narrow measurement intervals until constant values
are achieved The investigation of nanomaterials with lower solubility is currently limited by the ability to
detect the low concentration of released ions The applicability range of the method may be broadened
when test conditions such as flow rate and amount of material in the test are adapted to the solubility of
the material
In addition the test procedure can be adapted in such a way that the application of the investigated
nanomaterial can be injected directly as a dispersion into the system at a location between the pump and
the filter membrane (MWCO between 3-10 kDa) A schematic overview of the dynamic test system is
presented in Figure 2 Filter membranes with low MWCO can help to avoid the passage of small particles
However care should be taken as the use of low MWCO filter membranes can lead to a built up of ions in
front of the filter This results into a measurement of a lower a dissolution rate (see also paragraph 20 and
24)
Similar to the batch test in principle the flow-through test procedure may also be applicable for
testing of non-metal nanomaterials but the analytical possibilities still limit these options In consequence
the selection of an analytic method also needs to include considerations of eg the detection limit of the
method in relation to the investigated nanomaterial or the necessary effort to distinguish between the
investigated nanomaterial and the media compound (eg NOM and carbon-based nanomaterials) Thus
as for the batch test the decision on an appropriate analytic method currently can only be done case-by-
case
14 ENVJMMONO(2020)9
Unclassified
Figure 2 A draft scheme for dynamic testing of dissolution rate (von der Kammer 2018 personal
communication Stetten et al in preparation) (P = pump IV = Injection Valve)
23 Data evaluation and reporting from dissolution testing
The mass concentration of the dissolved fraction should be measured during the test and plotted
versus time The result of the solubility test has to be expressed as mgL of the ions formed as a
consequence of dissolution Expression of solubility in alone (without also providing results in mgL) is
discouraged as this is difficult to interpret and to compare with other data
For most existing nanomaterials dissolution follows (pseudo-)first order kinetics In a given
medium the determined dissolution rate expressed initially as increase of dissolved ions concentration
per time (mg L-1s-1) will depend on the initial mass of nanomaterial in the test the specific surface area
of the nanomaterial the solubility of the nanomaterial and the test conditions (shaken stirred or not
agitated at all) This can be calculated to the loss of solid nanomaterial over time and expressed as
Equation 1
Dissolution rate =119889m
119889t= minus119896diss ∙ m
where m is mass of the nanomaterial t is time and kdiss is dissolution rate constant The dissolution rate
is of interest in most cases However a value given as mg L-1s-1 is of little use because this value will
depend largely on the initial mass of the nanomaterial in the test system Hence the dissolution rate should
be normalised to either the mass or the surface area of investigated nanomaterial Both have different
characteristics Results normalised to mass would only be valid for the investigated nanomaterial
Dissolution rates normalised to mass cannot be transferred to other forms of the same substance (eg of
different specific surface area or different particle size) For this purpose dissolution rate normalised to
surface area will provide a remedy The dissolution rate should be expressed as mg kg-1s-1 or preferably
when specific surface area of the material is available as mg m-2s-1 Since the dissolution rate is depending
ENVJMMONO(2020)9 15
Unclassified
on the solubility of the nanomaterial the available surface area of the nanomaterial in the test system and
the countering concentration of surrounding dissolved ions of the nanomaterial the rate can be derived by
using the Noyes-Whitney equation
Equation 2
Dissolution rate =119889m
119889t= (D ∙
A
h) ∙ (cS minus c)
where D is the diffusion coefficient of the dissolved species in the medium A is the surface area of the
nanomaterial h is the thickness of the diffusion layer cS is the saturation concentration (solubility limit)
and c is the concentration of dissolved ions in the test medium The thickness of the diffusion layer will be
dependent on the test condition eg the composition of test media or potential agitation of the nanomaterial
during the test performance and can only be estimated what limits the applicability of the approach
It should be noted that there are nanomaterials that might follow zero or second order dissolution
kinetics and thus it has to be reviewed how models relate to nanomaterials of different shape and surface
area Care should be also taken for nanomaterials with broad size distribution as the smaller particles tend
to dissolve faster than the larger ones This could lead to an incorrect choice of fitting models or impede
the application of a correct reaction order at all
Based on the dissolution rate constant halftime (when half of the nanomaterial is left and half is
dissolved) can be estimated (for information on calculation model see eg chapter 115 of ISO 2017b)
Results on solubility and dissolution rate have to be reported together with test conditions like
media composition temperature test duration and characteristics of the investigated nanomaterial (eg
size distribution shape and composition including information on surface coatingmodification) Regarding
environmental exposure modelling one of the important nanomaterial characteristics required is the
dissolution rate constant (kdiss) and not the dissolution rate itself The use of kdiss for exposure modelling is
discussed in Chapter 5
16 ENVJMMONO(2020)9
Unclassified
OECD TG 318 (OECD 2017) describes a method for determining the dispersibility and dispersion
stability of nanomaterials in aqueous media of different yet environmentally relevant hydrochemistry A
prerequisite for the experimental approach was to enable the investigation of the dispersion behaviour in
a small number of relatively simple tests within a time frame suitable for standard laboratory routine The
hydrochemical conditions in the tests cover those parameters and parameter ranges which are (a)
representative for natural waters and (b) are recognized drivers for agglomeration of nanomaterials within
the concentration range of the TG (Monikh et al 2018) Hence the composition of the test media reflects
only those compounds in surface water that are relevant for the agglomeration process and in a
concentration range where they can become relevant
Dispersion stability as measured using TG 318 actually determines homoagglomeration
(attachment of nanomaterial to each other) under consideration of environmental parameters which have
a major influence on the dispersion stability of nanomaterials over a fixed time-span of 6 hours This
enables a direct comparison of nanomaterials with each other and how they will behave in test systems
For comparison with media which differ in composition from the test media in TG 318 the agglomeration-
relevant compounds in the media should be compared These are the concentrations of divalent cations
and anions the pH and the concentration of natural organic matter
The kinetics of the homoagglomeration processes are depending on the number concentration of
the nanomaterials and the progression of agglomeration To be able to directly compare results among
different nanomaterials and also to finish the test over a period of 6 hours the starting concentration must
be set to a fixed particle number concentration In this way the agglomeration process is almost
independent of particle size and density Comparisons have shown that the starting concentration in
particle number of 1012 particlesL should not vary more than one order of magnitude between different
nanomaterials (ie roughly plus or minus half an order of magnitude) To obtain the required mass
concentration of the nanomaterial the mass concentration of the nanomaterial in the stock dispersion has
to be converted into particle number concentration by using the average particle diameter and material
density as described in TG 318 It is acknowledged that especially for nanomaterials with a broad size
distribution the average particle size will not convert correctly into the particle number concentration
However the influence on the test outcome appears to be small (order of magnitude accuracy required)
so that the additional effort for precisely determining the particle size distribution and considering it in the
number calculation appears not necessary However if precise data on the particle size distribution are
available it is advised to use this information For an example see Figure 3
3 Testing of dispersion stability with TG 318
ENVJMMONO(2020)9 17
Unclassified
Figure 3 Example of experimental data over the test period of 6 h for TiO2 NM-105 nanomaterials
under stable (0 mM Ca(NO3)2 open squares) and destabilizing (5 mM Ca(NO3)2 filled circles)
conditions and two different starting particle number concentrations (1010 and 1012 particlesL)
affecting agglomeration kinetics (Monikh et al 2018)
With progressing agglomeration and sedimentation of the agglomerates the concentration in the
supernatant will decrease over time The sedimentation velocity and thus also the removal of nanomaterial
from the supernatant by sedimentation is depending on many factors eg the density of the primary
particles the apparent density of the formed agglomerate the structure of the agglomerate the surface
chemistry and how the water flows around or through the agglomerate To eliminate at least the effect of
density the last step after 6 hours is a centrifugation step where the run conditions of the centrifugation
are set to achieve a size cut-off at gt 1 microm TG 318 describes how to calculate the centrifugation conditions
and an Excel spreadsheet-tool is accompanying TG 318 for those calculations After the centrifugation
step the remaining concentration of the nanomaterials in the supernatant of the dispersion is analysed
The centrifugation step after 6 hours is best suited to compare different materials with each other while
the hourly measurements between 1 to 5 h show the behaviour of the material in a water column
Apart from the intrinsic properties of the nanomaterial the composition of the medium is the driver
for the stabilisation or destabilisation of the dispersions Therefore the test considers the concentration
ranges of the composition of natural waters that are dominating this process and are sufficiently abundant
in natural waters to become relevant in the process ie divalent ions natural dissolved organic matter and
pH (Ottofuelling et al 2011) The concentration ranges of these compounds were set to represent about
95 of the conditions found in natural waters The various effects of different media components on
dispersion stability are listed in Table 1
18 ENVJMMONO(2020)9
Unclassified
Table 1 Role and effect of the selected components in the synthetic water The Table shows representative compounds in natural water that mainly influence nanomaterialrsquos stability in aqueous media Furthermore it highlights the effects of these compounds on the stability of nanomaterials and the strength of these effects as well as the abundance of the compounds in natural water
compound represents effect effect
strength
abundance
Na+ monovalent
cations not
included
destabilisation low medium
Ca2+ divalent cations destabilisation
stabilisation when adsorbing to surfaces of
positively charged materials
medium high
Mg2+ divalent cations
less complexed
by NOM
destabilisation
relevant when NOM is high and complexes
Ca2+
low low
NO3- monovalent
anions
destabilisation
non-adsorbing
non-complexing
low low
SO42- divalent anions destabilisation especially positively charged
particles
medium medium
Al3+ trivalent cations
not included
destabilisation high very low
SR-NOM dissolved organic
matter
stabilisation through surface adsorption with
electrostatic (negative) and steric effect charge
reversal (positive to negative) through
complexation of destabilising cations
destabilising when adsorption to positive
surfaces reduces net charge of surfaces
high medium
A decision tree is presented in the TG 318 to determine whether the nanomaterial of interest
requires only a screening procedure or if an in-depth testing has to be performed The decision tree allows
nanomaterials to be categorised as generally stable in dispersion under all test conditions non-dispersible
or dispersible depending on the hydrochemical conditions The screening test is performed in the presence
of natural organic matter which will generally stabilise most nanomaterials against agglomeration This
will put many nanomaterials into the category ldquodispersible no detailed testing in TG 318 necessaryrdquo
The NOM added to the test vial has three roles in the test (a) it acts as a pH buffer stabilizing the
adjusted pH especially at pH 9 (b) it complexes Ca2+ and reduces thereby the activity of the destabilising
Ca2+ ion (c) it adsorbs to the surface of the nanomaterial and adds to the negative charge density thereby
reducing the net positive charge that can lead to destabilisation If present in sufficient amounts it
eventually may reverse the charge to negative and can increase the magnitude of the negative charge
density The amount of NOM to be used is standardised to 10 mgL DOC in 40 ml (400 microg DOC) and a
calculation tool for the required minimum DOC is provided in the TG 318 It should be considered that
under certain conditions (eg NOM composition) NOM can lead to a destabilisation In addition some
nanomaterials may not adsorb to NOM under surface-water like conditions (Hedberg et al 2017a Hedberg
et al 2017b Pradhan et al 2017)
Applicability of TG 318 for different nanomaterial types should be considered based on the
available data on similar nanomaterials eg based on their size and shape (spherical rod platelets fibre-
like) Three considerations are important to judge a priori if the test can be applied to a nanomaterial (a)
ENVJMMONO(2020)9 19
Unclassified
the nanomaterials density must be gt 1 gcmsup3 (b) the mass concentration calculated for the required particle
number concentration must be at least 10 times above the quantification limit of the analytical method (c)
an analytical method with sufficient sensitivity for the nanomaterial or an equally distributed component is
required The requirement (b) stems from the consideration that even with 90 removal from the water
column the nanomaterial should still be quantifiable in the supernatant Especially for small low density
particles the mass concentration originating from the recommended number concentration might
challenge the ICP-OES based methods and at some point also routinely operated ICP-MS methods The
required quantification limit (10 of initial concentration) for a SiO2-NP of 15 nm would be ~02 microgL (Si)
Regarding the analytical approach to quantify the nanomaterials in the supernatant in principle any
methodinstrument (eg ICP-MS GFAAS polarography) can be applied which offers the required
detection limits for the nanomaterial or a relevant component of it Besides a dispersion stability
measurement zeta potential as calculated from electrophoretic mobility can provide an indicator for
nanomaterial stability Measurement of zeta potential over time could provide indications for heterogenous
nanomaterials (like Figure 7c) However this method will not provide information on the amount and
behaviour of the (un-) stable fraction
As an alternative method to determine dispersion stability TG 318 provides information on the
measurement using UVVIS photometry The continuous monitoring of the agglomerationsettling process
in a UVVIS photometer will yield to quantitative different results compared to the standard test procedure
of TG 318 This is due to a different detection principle a different location of analysis (close to the bottom
of the vial and not at the top of the supernatant) and different test vessel size and geometry Also the
centrifugation step is missing and therefore low-density nanomaterials could agglomerate without being
settled out A direct comparison of quantitative results obtained from both methods is therefore impeded
Changing cuvettes could multiplex the experiment giving the opportunity of several parallel tests
in cuvettes and placing them in the spectrometer one after the other for absorbance determination
However moving the cuvettes can disturb the settling process and introduce errors
The wavelength of the UVVIS signal needs to be in correlation with the properties of the
investigated nanomaterial It should be noted that the change of absorbance can be caused by processes
other than settling-out of agglomerates When the nanomaterial agglomerates the change in size
distribution also changes the optical density and hence the absorbance reading even before settling starts
Dissolution would reduce the absorbance without agglomeration taking place This would underestimate
the stability contrary to the standard test with determination of the remaining fraction in the supernatant
where dissolved ions would lead to an overestimation of stability in case the dissolved fraction is not
quantified Transformation of the nanomaterial might reduce eg the plasmon resonance of metallic
nanomaterials and incorrectly decrease the absorbance reading Therefore it should be evaluated with
care if measuring dispersion stability using UVVIS spectroscopy is an appropriate approach for the
investigated nanomaterial
31 Data presentation and evaluation for TG 318
When the dispersion stability of a nanomaterial is tested according to TG 318 either the screening
test is already sufficient or a full testing is required
There are various ways to present the outcomes of the screening test or to visualize the influence
of electrolyte concentration pH and presence of NOM Examples of data presentation from dispersion
20 ENVJMMONO(2020)9
Unclassified
stability studies using TG 318 are shown in Figure 4 5 and 6 A spreadsheet tool1 is accompanying this
GD to facilitate such a harmonized presentation of the data
Figure 4 shows a schematic example on dispersion stability for results of the screening test with
the three possible outcomes according to the TG 318 decision tree
In Figure 5 the output of the tool for illustrating the full testsrsquo results (following Monikh et al 2018)
is presented Here the results are presented in a three-dimensional matrix considering various
hydrochemical conditions and the resulting dispersion stability Higher colloidal stability (less
agglomerationsedimentation) is reflected by a higher remaining concentration (brighter shade in the plots)
in the dispersion relative to the starting concentration (0-100)
The full test provides information on dispersion stability and the underlying processes leading to
the removal from the water column can be elucidated Figure 6 presents an example of a dispersion
stability plot of the full test for one test condition where the dispersion stability measured at each hour is
plotted over the time Possible interpretations of removal processes based on the removal function are
shown in Figure 7 The interpretations shown here may also help designing testing strategies (Section 4
of this GD)
Besides usual information on test material and test media data reporting from the UVVIS method
should include details of the UVVIS method (instrument type detection wavelength in nm type of cuvette
used) the recorded absorbance over time profile and the remaining fraction after 24h given as absorbance
reading after 24h divided by the absorbance reading at the start of the test
Figure 4 Example outputs from the spreadsheet tool for the screening test at different Ca2+ concentrations (y-axis) and pH-values (x-axis) in the test medium (The numbers in the boxes indicate the of initial concentration of the test material left in the supernatant at the end of the test) Left panel all tests are completed with ge90 of the nominal (initial) concentration left in the supernatant after 6 h (indicating high stability) Middle panel some conditions lead to stable (ge90 ) some to intermediate stability (ge10 and le 90) further testing is required in a full test Right panel all conditions lead to ge 90 sedimentation from the water column (le10 stability) indicating an unstable nanomaterial under tested conditions A green tick indicates those cases where a nanomaterial is highly stable and a red cross where a nanomaterial is unstable under the respective conditions A yellow exclamation mark indicates cases were a nanomaterial shows intermediate stability
1 Link to Excel sheet tool
httpwwwoecdorgchemicalsafetytestingExcel_ENV_JM_MONO(2020)9xlsx
ENVJMMONO(2020)9 21
Unclassified
Figure 5 Dispersion stability regarding different environmental conditions (Ca2+ concentration y-axis pH-value x-axis) Higher stability (less agglomerationsedimentation) is reflected by a higher remaining concentration of test material (brighter shade in the plots) in the dispersion relative to the starting concentration (0-100) The numbers in the boxes represent the percentage of the nanomaterial remaining in the dispersion thus the dispersion stability in (from Monikh et al 2018)
22 ENVJMMONO(2020)9
Unclassified
Figure 6 An example of dispersion stability plot as percentage of nanomaterials remaining in water phase compared to initial concentration (y-axis) against time in hours (x-axis) of the full test for one (here not further specified) test condition The closed data point at 0 hours represents the nominal concentration and the open data point at 0 hours is the measured concentration at the start (evoked by eg incomplete dispersion fast sedimentation or loss to vessel see paragraph 25 of OECD TG 318) The closed data point at 6 hours represents the measured concentration before the centrifugation step while the open point represents the measured concentration after the centrifugation step Differences between the measured concentrations at point 6 hours are caused by density effects (see also Figure 7B) The values are normalised to the nominal concentration at 0 hours
ENVJMMONO(2020)9 23
Unclassified
Figure 7 Possible shapes of the removal function over time and suggested interpretations
32 Alternative test conditions
TG 318 covers only synthetic waters that resemble the bandwidth of agglomeration-relevant
components found in surface waters In principle TG 318 can also be performed with other media than
those used in TG 318 eg ecotoxicological test media When using any other test media it should be
assured that the addition of the nanomaterial to the medium does not significantly change media
conditions eg the pH A good estimate can be drawn from results of TG 318 with synthetic waters if the
agglomeration-relevant components of the test media (sum of divalent cations sulphate) are comparable
with TG 318 conditions (the full test without NOM) When using alternative test conditions compared to
TG 318 it is of utmost importance to characterise and report the test media compositions and conditions
and also to compare those with test media compositions and conditions of TG 318 for the data evaluation
and interpretation This will also enable retrospective analysis of studies compared with new data produced
in the future
TG 318 can be used with natural waters to investigate the dispersion stability and agglomeration
behaviour in these waters To prevent a situation where homo- and heteroagglomeration takes place in an
uncontrolled way the water sample should be filtered over a filter membrane with pore size equal to or
smaller than 01 microm or subjected to ultracentrifugation to remove all sorts of natural particles
microorganisms microm-sized debris colloids and nanomaterials from the sample It should also be taken into
account that the obtained result is a (very precise) descriptive value for this one sample only representing
24 ENVJMMONO(2020)9
Unclassified
a unique and constantly changing situation regarding hydrochemical composition and type and
concentration of NOM Whether it is possible to transfer this one result to the sampled surface waterbody
in general depends on the spatial and temporal variability of the waterbody If the unfiltered sample shall
be tested with TG 318 the presence of natural suspended particulate matter will make it necessary to apply
the variant of TG 318 that deals with heteroagglomeration (see section 33)
The transferability of the data from TG 318 studies to higher tier testing (eg ecotoxicological
studies) should be carefully evaluated as the used simulated environmental media differs from
ecotoxicological test media which aims to promote animal vitality rather than to mimic natural habitats
When possible it would be beneficial to test the dispersion stability with TG 318 using the test media used
in the ecotoxicological test as recommended in the OECD draft GD for Aquatic (and Sediment)
Toxicological Testing of Nanomaterials (WNT project 251) However in many ecotoxicological tests the
test organism will change the test media composition eg by algal exudates or photosynthesis in a 72
hours algae toxicity test according to TG 201 This will result in pH shift various ionic compositions and
different NOM characteristics and thereby lead to changes in dispersion stability as well as dissolution
rates
NOM has an enormous variability in structure molecular weight distribution conformation
composition and purity The type and quality of the used NOM or even NOM in natural waters or test media
with intrinsic NOM will have effects on dispersion stability This should be taken into account for data
evaluation and when choosing test conditions that represent environmental relevant conditions One has
to distinguish between processed commercial products resembling NOM or unprocessed natural NOM as
part of a natural water sample The commercial products are more or less close to reality regarding their
properties and are more likely to enable repeatability of the results In contrast natural NOM might trigger
a behaviour of the nanomaterial (eg formation of ldquoecological coronardquo) that is linked to the composition of
the NOM which might be very unique in time and space and not fully resemble the surface water the NOM
was sampled from In TG 318 2R101N Suwannee River NOM (SRNOM) is recommended as standardised
and purified material Due to differences in the composition of NOM from different sources it is difficult to
compare results obtained by the use of different types of NOM Therefore the alternatively used NOM
should be characterised as much as possible at least the minimum DOC content after properly cleaned
from ions and ash should be determined DOC content and treatment should be reported together with the
test results It is advisable to always test the nanomaterial according to the conditions presented in TG 318
in order to obtain comparative ldquobenchmarkrdquo data
There are nanomaterials that are extremely hydrophobic and thus not miscible with aqueous
media For those nanomaterials the use of a dispersion agent (eg surfactants) could help to enhance the
dispersibility in the stock dispersion However such an approach won`t deliver data on the dispersion
stability of the pristine material Depending on the scope of testing the use of a dispersion agent for the
dispersion stability testing could help to understand the fate of extremely hydrophobic nanomaterial when
entering into the aquatic environment together with a dispersion agent (eg from a product)
33 Testing of heteroagglomeration
The heteroagglomeration of nanomaterials with suspended particulate matter (SPM) which is
ubiquitous in natural surface waters is a crucial process affecting the environmental transport and fate of
nanomaterials (Praetorius et al 2014a Quik et al 2014 Therezien et al 2014 Gao and Lowry 2018)
Many studies report measurements of different endpoints reflecting heteroagglomeration
behaviour (eg agglomeration rate sedimentation attachment efficiency) with diverse nanomaterials
under various conditions (eg Praetorius et al 2014a Labille et al 2015 Velzeboer et al 2014 Huynh
et al 2012 Quik et al 2014 Geitner 2017 Barton et al 2014) However the heteroagglomeration
ENVJMMONO(2020)9 25
Unclassified
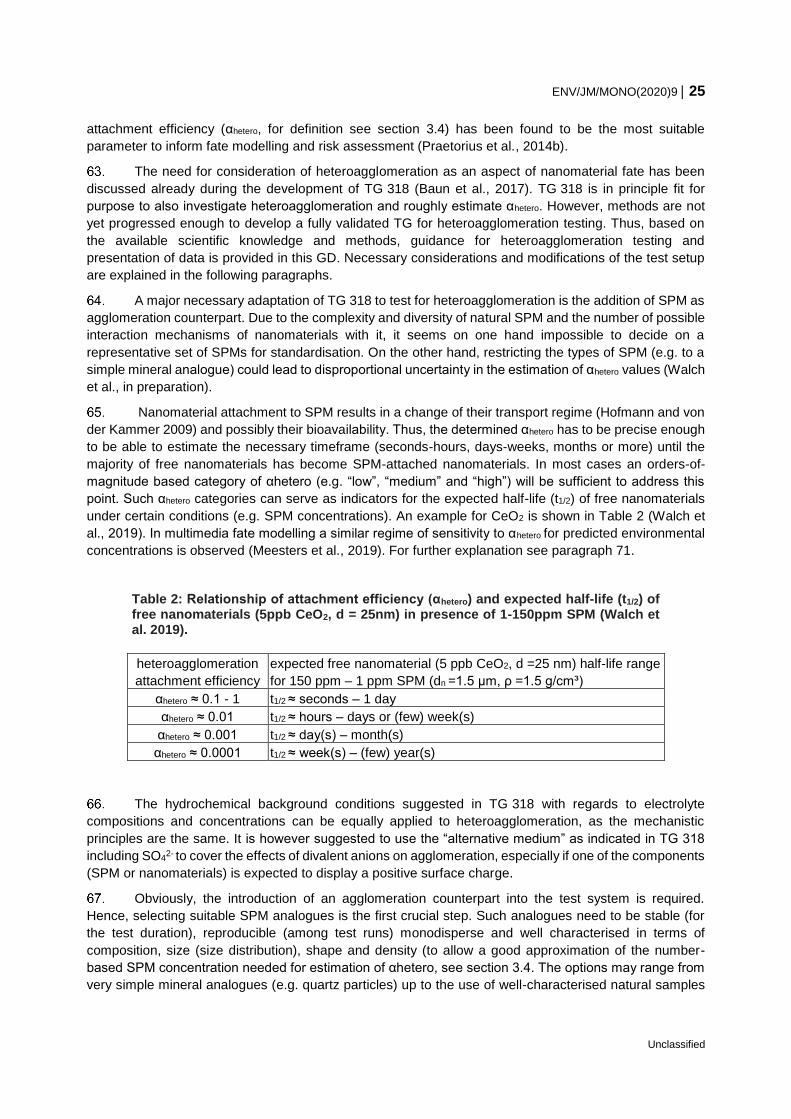
attachment efficiency (αhetero for definition see section 34) has been found to be the most suitable
parameter to inform fate modelling and risk assessment (Praetorius et al 2014b)
The need for consideration of heteroagglomeration as an aspect of nanomaterial fate has been
discussed already during the development of TG 318 (Baun et al 2017) TG 318 is in principle fit for
purpose to also investigate heteroagglomeration and roughly estimate αhetero However methods are not
yet progressed enough to develop a fully validated TG for heteroagglomeration testing Thus based on
the available scientific knowledge and methods guidance for heteroagglomeration testing and
presentation of data is provided in this GD Necessary considerations and modifications of the test setup
are explained in the following paragraphs
A major necessary adaptation of TG 318 to test for heteroagglomeration is the addition of SPM as
agglomeration counterpart Due to the complexity and diversity of natural SPM and the number of possible
interaction mechanisms of nanomaterials with it it seems on one hand impossible to decide on a
representative set of SPMs for standardisation On the other hand restricting the types of SPM (eg to a
simple mineral analogue) could lead to disproportional uncertainty in the estimation of αhetero values (Walch
et al in preparation)
Nanomaterial attachment to SPM results in a change of their transport regime (Hofmann and von
der Kammer 2009) and possibly their bioavailability Thus the determined αhetero has to be precise enough
to be able to estimate the necessary timeframe (seconds-hours days-weeks months or more) until the
majority of free nanomaterials has become SPM-attached nanomaterials In most cases an orders-of-
magnitude based category of αhetero (eg ldquolowrdquo ldquomediumrdquo and ldquohighrdquo) will be sufficient to address this
point Such αhetero categories can serve as indicators for the expected half-life (t12) of free nanomaterials
under certain conditions (eg SPM concentrations) An example for CeO2 is shown in Table 2 (Walch et
al 2019) In multimedia fate modelling a similar regime of sensitivity to αhetero for predicted environmental
concentrations is observed (Meesters et al 2019) For further explanation see paragraph 71
Table 2 Relationship of attachment efficiency (αhetero) and expected half-life (t12) of free nanomaterials (5ppb CeO2 d = 25nm) in presence of 1-150ppm SPM (Walch et al 2019)
heteroagglomeration
attachment efficiency
expected free nanomaterial (5 ppb CeO2 d =25 nm) half-life range
for 150 ppm ndash 1 ppm SPM (dn =15 microm ρ =15 gcmsup3)
αhetero asymp 01 - 1 t12 asymp seconds ndash 1 day
αhetero asymp 001 t12 asymp hours ndash days or (few) week(s)
αhetero asymp 0001 t12 asymp day(s) ndash month(s)
αhetero asymp 00001 t12 asymp week(s) ndash (few) year(s)
The hydrochemical background conditions suggested in TG 318 with regards to electrolyte
compositions and concentrations can be equally applied to heteroagglomeration as the mechanistic
principles are the same It is however suggested to use the ldquoalternative mediumrdquo as indicated in TG 318
including SO42- to cover the effects of divalent anions on agglomeration especially if one of the components
(SPM or nanomaterials) is expected to display a positive surface charge
Obviously the introduction of an agglomeration counterpart into the test system is required
Hence selecting suitable SPM analogues is the first crucial step Such analogues need to be stable (for
the test duration) reproducible (among test runs) monodisperse and well characterised in terms of
composition size (size distribution) shape and density (to allow a good approximation of the number-
based SPM concentration needed for estimation of αhetero see section 34 The options may range from
very simple mineral analogues (eg quartz particles) up to the use of well-characterised natural samples
26 ENVJMMONO(2020)9
Unclassified
(eg river waters or sewage sludge) and the choice of a relevant SPM type depends on the aim of the
study
For a general comparative assessment of nanomaterials with regards to their heteroagglomeration
behaviour in freshwaters a simple mineral analogue would be too simplistic whereas natural water
samples do not allow for generalisations Therefore in an EU project ldquoNanomaterial Fate and Speciation
in the Environmentrdquo (NanoFASE) researchers aimed to create a ldquomodel SPMrdquo (complex floc-like SPM
analogues that represent process-relevant characteristics of natural SPM) and a standard procedure for
its production These SPM flocs are composed of naturally occurring minerals selected based on a trade-
off between representing the dominant mineral mass fractions and covering a broad range of
physicochemical surface properties (eg surface charge) in realistic mixing ratios which are typically
encountered in natural freshwater SPM The mix includes quartz illite hematite and organic
macromolecules associated with microbial activity (Walch et al in preparation) This could be one
ldquostandard SPMrdquo to be used in the test with regards to the requirements for suitable SPM analogues
mentioned above
In order to assess the fraction of ldquofreerdquo not heteroagglomerated nanomaterials after a certain or
several (necessary to estimate α values) specified interaction time(s) a separation step needs to be
introduced Separation should be fast and non-intrusive to allow removal of the SPM-attached
nanomaterials from suspension while minimising artefacts on the ldquofreerdquo nanomaterial fraction That can be
achieved by centrifugation at each time interval If the analytical detection limits allow dilution before
centrifugation helps to avoid non-attached nanomaterials being removed via ldquoscreeningrdquo by the SPM during
centrifugation Gravitational separability of nanomaterials and SPM hence becomes a prerequisite
meaning that the size andor density of the SPM needs to exceed that of the tested nanomaterials to an
extent at which (at a selected centrifugation speed and time) the SPM will be removed from suspension
while free nanomaterials will not This can be ensured by employing centrifugation cut-off calculations and
verified by preliminary testing If significant sedimentation of the SPM over the test duration is likely
agitation by shaking or stirring during the reaction time might be necessary However it cannot be ruled
out that shaking and stirring affects the apparent rates of heteroagglomeration Stirring should be effected
in a controlled way to allow at least an approximate calculation of shear forces in the system (shear rate
G) which is needed for collision frequency calculations (see equation 4 in section 34 below) Principles of
stirred batch reactor design (Zlokarnik 2001) can be applied Changes in shear force from ~40-180 s-1 only
had minor impact on the size of mentioned model SPM analogue flocs (results from laboratory pre-tests)
The shear force necessary to avoid sedimentation being the dominant collision mode depends on the
diameters of the nanomaterials and SPM employed and can be calculated using equations 3 (section 34
below)
The selection of the nanomaterial mass concentration needs to be based on the analytical limits
in the matrix (as a rule of thumb the quantification of remaining ldquofreerdquo nanomaterials should be possible
down to ~10 of the initially added nanomaterials) One can quantify either the elemental mass
concentration or the particle number concentration in the supernatant by ICP-MS (after digestion) or single
particle ICP-MS respectively
Next to analytical limitations there are process-determined limitations in selecting nanomaterial
and SPM concentrations to optimise the system for selective heteroagglomeration testing Both homo-
and heteroagglomeration kinetics are driven by the particle number concentration in the system (for
heteroagglomeration more precisely the number ratio of nanomaterials and SPM (Labille et al 2015)) as
well as the collision rate constant which depends on the nanomaterial and SPM size and density and the
G in the system (see equations 3 in section 34) Shear forces are not part of the original TG 318 as
particles in the nm-size range are not affected by shear forces and diffusion is the dominant transport
mechanism (Elimelech 1995) meaning that nanomaterial homoagglomeration is independent of G In the
microm-size range typical for SPM flocs however shear forces start playing a role Since heteroagglomeration
is the process of interest the selection of the nanomaterialSPM number concentrations and shear forces
ENVJMMONO(2020)9 27
Unclassified
needs to ensure that potentially simultaneously occurring homoagglomeration2 remains negligible (in case
of unfavourable hydrochemical conditions for homoagglomeration or very low expected αhomo) or is at least
significantly dominated by heteroagglomeration (in case of homoagglomeration not being negligible) Such
an optimisation of a stirred test system for heteroagglomeration can be based on model calculations (see
equations 3 in chapter 34) depicting the interplay between SPM and nanomaterial sizes and densities
their number concentrations and applied shear forces (Figure 8) Knowing (or approximating) the size3 and
density of both nanomaterial and SPM the mass-corresponding number concentrations can be calculated
assuming (if not known) spherical shape for both To allow defining suitable conditions it is suggested to
take the necessary minimum nanomaterial number concentration determined by analytical limitations as a
starting point and modify the SPM number concentration and the G-value to ldquoworst caserdquo conditions ie
assigning the highest attachment efficiency value of unity for both αhomo and αhetero (where each collision
results in attachment) An example is shown in Figure 8 where homoagglomeration of 5 ppb 30 nm CeO2
is certainly dominated by heteroagglomeration when 45 ppm SPM (d = 6 microm ρ = 15gcmsup3) is used at
stirring which effected a G = 100s-1 Additionally the model gives a first indication of the necessary
temporal resolution
2 Even if homoagglomeration takes place homoagglomerates may be too small to be removed from suspension by
centrifugation
3 Note that eg light-scattering-based size measurements are biased towards larger sizes and applying such particle
diameters may lead to a significant underestimation of the particle number
28 ENVJMMONO(2020)9
Unclassified
In order to support the model calculation and the assumption of negligible loss of nanomaterials
other than by heteroagglomeration an additional control test should be conducted This is done using the
same concentration of nanomaterials in the same background hydrochemistry (pH electrolytes NOM) but
without any SPM Sampling and sample treatment should be performed in the same way as for the
heteroagglomeration test to measure free nanomaterial Digesting the remaining samples (after
centrifugation and sampling supernatant aliquots for free nanomaterial quantification) can serve to close
the mass balance and account for losses to the vessels or tubes
The test duration window needs to capture the nanomaterial removal over time which depends
on the expected αhetero value the nanomaterial and SPM number concentrations and collision frequency
(equations 3 in chapter 34) Hence the selected particle number concentrations test-duration and the
decision if agitation is necessary or not can be optimised Model calculations may also serve to get an
idea about the relevant reaction-time window to be investigated The more complex and heterogeneous
the chosen SPM the more likely it seems that heteroagglomeration is a very fast process Thus it is
recommended to aim for a high time-resolution of the initial agglomeration phase (eg every few minutes
during the first 30 minutes of the test) Intervals can be steadily increased up to eg 6 hours and a final
ldquostablerdquo nanomaterial fraction can be determined after eg 24 hours
Figure 8 Model calculations employing equation 3 (see section 34) to find suitable SPM concentrations at which
heteroagglomeration is dominating over homoagglomeration in case of both αhomo and αhetero being set to one CeO2
has been chosen as example for low analytical limits (ICP-MS) allowing experiments at 5 ppb (10 remaining
would still be gt 5 times limit of quantification) Number concentrations were converted from mass concentrations
assuming spherical shape for both SPM and nanomaterial and the given diameters and densities (CeO2 722
gcmsup3) In both the homo- (red line) and heteroagglomeration case (black lines) the initial nanomaterial
concentrations were 5 ppb With increasing SPM concentrations in the heteroagglomeration case the nanomaterial-
SPM number ratio changes and at 45 ppm SPM the decrease of ldquofreerdquo nanomaterials due to heteroagglomeration
will clearly dominate over homoagglomeration whereas at 15 ppm SPM homoagglomeration might have a similar
share (unless αhomo ltlt αhetero) in total removal of free nanomaterials
ENVJMMONO(2020)9 29
Unclassified
34 Data evaluation and derivation of attachment efficiency
Attachment efficiencies beside the dissolution rate constant are considered an important
parameter for exposure modelling of nanomaterials Recently scientists developed fate models for
nanomaterials that use attachment efficiencies as input parameters to predict nanomaterial concentrations
in environmental compartments (eg SimpleBox4Nano (Meesters et al 2014) models provided by EU
Horizon Project NanoFASE available at httpnanofaseeushowfate-and-exposure-modelling-of-
nanomaterials-the-nanofase-model-catalogue_1963]) These nanospecific models will provide more
reliable and relevant predicted environmental concentrations (PECs) for nanomaterials than the
conventional fate models that rely on equilibrium partitioning and will thus contribute to an improved
nanomaterials risk assessment
Based on Smoluchowskirsquos agglomeration theory (Elimelech1995) the heteroagglomeration
attachment efficiency (depicted as αhetero) can be defined as the fraction of nanomaterial-SPM collisions
resulting in nanomaterial attachment to SPM αhetero can take values from 0 to 1 to modulate the collision
rate constant between nanomaterials and SPM reflecting their physicochemical surface affinity for each
other (under the given hydrochemical conditions) Assuming irreversible attachment the rate of free
nanomaterial removal by heteroagglomeration can be calculated according to equation 1 With a constant
number of SPM particles heteroagglomeration turns out to be a pseudo first-order reaction (nSPM can be
included into khet further on denounced as khet) (Praetorius et al 2012) The collision rate constant (kcoll)
combines the three modes of transport of nanomaterials and SPM towards each other (diffusion
differential sedimentation and advection) assuming spherical nanomaterial and SPM shapes and
rectilinear collisions (Praetorius et al 2012) Transport by advection is incorporated employing the shear
rate or the velocity gradient (G) introduced by Camp and Stein (1943) for stirred vessels It is defined as
the square root of the energy (eg added by stirring) dissipated by turbulence per unit time accounting for
the volume and viscosity of the considered fluid The sensitivity of the system to changes in shear is
relatively low compared to other parameters To avoid sedimentation we suggest a value of G around 40-
100 s-1 for a stirred batch system Shear rates in rivers are typically gt 10 s-1 (Arvidsson et al 2011)
30 ENVJMMONO(2020)9
Unclassified
Equations 3 Rate of ldquofreerdquo nanomaterials removal from suspension due to heteroagglomeration
over time (based on Smoluchowski Praetorius et al 2012)
d119899NM
d119905= minus 119896het 119899NM 119899SPM
khet heteroagglomeration rate constant [msup3s]
nNM number concentration of nanomaterials [1msup3]
nSPM number concentration of SPM [1msup3]
119896het = 120572het 119896coll
αhet attachment efficiency between nanomaterials amp SPM
kcoll collision rate constant between nanomaterials amp SPM [msup3s]
Equations 4 Calculation of collision frequencies due to diffusion (perikinetic) advection
(orthokinetic) and differential sedimentation (DS) assuming spherical particles laminar flow and
straight streamlines (rectilinear collisions)
perikinetic collisions 119896collperikin
=2k119879
3micro
(119903SPM + 119903NM)sup2
119903SPM 119903NM
orthokinetic collisions
119896collorthokin=
4
3119866(119903SPM + 119903NM)sup3
with 119866 = radic120598
120584 = radic
119875
micro119881
collisions due to
differential sedimentation
119896collDS= π(119903SPM + 119903NM)2|120592SPM minus 120592NM|
with 120592SPM NM =2
9
120588SPM NMminus120588L
μg 119903SPM NM
2
summed-up to total collision frequency
119896coll =2k119879
3micro (119903SPM + 119903NM)sup2
119903SPM 119903NM+
4
3119866(119903SPM + 119903NM)3 + π(119903SPM + 119903NM)2|120592SPM minus 120592NM|
k Boltzmannrsquos constant [msup2kgssup2K]
T absolute temperature [K]
micro dynamic viscosity of dispersion medium
[Nsmsup2]
r particleaggregate radius [m]
G shear rate (velocity gradient) [s-1]
g gravity acceleration [mssup2]
ρS density of particles [kgmsup3]
ρL density of liquid [kgmsup3]
υSPM NM settling velocity of SPM or nanomaterials [ms]
ϵ power input per unit mass [Nmskg]
ν kinematic viscosity (microρL) [msup2s]
P power dissipated by liquid turbulence [W]
V volume of liquid [msup3]
These equations may on the one hand be used to design the tests (SPM and nanomaterial number
concentrations test duration and time resolution see above paragraph 73) and on the other hand to
approximate αhetero With heteroagglomeration being a pseudo first-order reaction (in the early
agglomeration phase) the natural logarithm of the particle concentration plotted over time will give a linear
relation (see example in Figure 9) The slope equals the pseudo first-order reaction rate (119896ℎ119890119905lowast =
120572ℎ119890119905 119899119878119875119872 119896119888119900119897119897) and αhetero can be calculated
As there will be many collisions between nanomaterials and SPM only nanomaterials with very
low attachment efficiencies are likely to remain ldquofreerdquo Many results (eg Praetorius et al 2012) have
shown α values (attachment efficiencies) that result in almost immediate nanomaterial-SPM associations
ENVJMMONO(2020)9 31
Unclassified
The exception is if the SPM number concentration is very low In the latter case homoagglomeration will
be dominant (see Figure 8) Assuming pseudo first-order kinetics the half-life of free nanomaterials can be calculated (11990512 = ln(2) 119896ℎ119890119905
lowast) Plotting the expected half-lives at given SPMnanomaterial
concentrations and shear rate over a range of αhetero-values employing three different SPM concentrations
(Figure 10) shows that only starting from small αhetero lt001-0001 significant numbers of free nanomaterials
will remain after just one day except for very low SPM concentrations (5 ppm and lower)
Figure 9 An example of pseudo first-order kinetics of heteroagglomeration
244
246
248
250
252
254
256
0 500 1000 1500 2000 2500 3000 3500
ln(n
NM
)
time [s]
slope (khet) = - 24410-4 s-1
kcoll = 73110-16 s-1
nSPM = 1801012
αhet = 019
32 ENVJMMONO(2020)9
Unclassified
Figure 10 Half-life time of free nanomaterials based on heteroagglomeration model
calculations with the example of 5 ppb CeO2 nanomaterial (30 nm) and three different
concentrations of SPM (5 ppm blue line 45 ppm red line 150 ppm grey line) are shown
against αhetero The number of SPM (nSPM) and kcoll were calculated with the given parameters
assuming spherical shape For half-lives longer than one day (ie those above the horizontal
green line) αhetero needs to be smaller than 01-0001
Based on the considerations above the test duration of 6 hours defined in TG 318 will likely also
work for heteroagglomeration For conditions where heteroagglomeration is the dominant process
transport-relevant αhetero values of 001 and lower are only to be expected if there is a significant fraction
eg 10-20 of nanomaterials remaining after 3 (conservative) to 6 hours With further experimental data
providing proof of principle this relationship between the order of magnitude of αhetero and the test
duration can be further refined for given nanomaterialSPM concentration ratios
If it is aimed to compare heteroagglomeration behaviour of various nanomaterials under same
conditions a tiered approach is suggested that could look as following In a first tier the nanomaterials
which are prone to quickly heteroagglomerate should be identified Those can be assumed to immediately
attach to SPM making kinetic considerations obsolete Other nanomaterials should be subjected to a
second-tier kinetic study to determine αhetero The first tier could consist of two-point measurements
where the free nanomaterial fraction left in the supernatant after centrifugation and removal of the SPM-
attached fraction at t1 is compared to the initial free nanomaterial concentration at t04 If the remaining
4 A comparison to t0 might be substituted by a comparison to a ldquohomoagglomerationrdquo control (containing the same
amount of nanomaterials with the same background hydrochemistry and DOM concentration but without SPM)
However using the t0-heteroagglomeration concentration as reference for comparison ensures that at both time
points the same fraction of free nanomaterials was removed by ldquoscreening-effectsrdquo (SPM will physically catch and
remove some nanomaterials from dispersion during centrifugation) This helps to avoid a misinterpretation of a
screening-induced removal of nanomaterials from suspension as a heteroagglomeration-induced removal However
0001
001
01
1
10
100
1000
10000
100000
0000001 000001 00001 0001 001 01 1
free N
M t
12
[d]
αhetero
5 ppm
45 ppm
150 ppm
SPM d = 6 microm (ρ 15 gcmsup3)5 ppb CeO2 d = 30 nm (ρ 713 gcmsup3)
G = 100 s-1
ENVJMMONO(2020)9 33
Unclassified
nanomaterial fraction at t1 exceeds a selected threshold value indicating a low αhetero and potential stability
of free nanomaterials a kinetic study should be conducted As shown by calculations above correlations
between αhetero t12 and the fraction of free nanomaterials left after a certain time may be used to establish
general threshold values to categorise αhetero values into ldquohighrdquo ldquomediumrdquo and ldquolowrdquo The following
example shall illustrate the principle If less than 10 of the nanomaterials is left after 2 h (meaning fast
heteroagglomeration) an αhetero larger than 01 and t12 less than 1 d is expected if more than 10 are
left after 2 h (meaning slower heteroagglomeration) a kinetic study to determine αhetero should be
conducted These relations are however strongly dependent on the chosen nanomaterialSPM number
concentrations and sizes Thus establishment of threshold values needs to be tied to robust experimental
procedures which still have to be developed and systematically validated A crucial point here is the
selection of t1 (2 h in the example) since the influence of respective nanomaterialSPM number-ratio needs
to be taken into account (see Figure 10) Furthermore setting a threshold for the requirement of a kinetic
study based on the remaining fraction of free nanomaterials (10 in the example) should be done under
careful consideration Studies found that the removal of nanomaterials can reach a plateau leaving a
stable fraction of the initially added nanomaterials (Quik et al 2012 and 2014) This can either be due to a
very stable sub-fraction present in the nanomaterial sample (ie ldquoimpuritiesrdquo exhibiting different intrinsic
surface properties from the bulk) or due to an in-situ stabilisation of a sub-fraction of nanomaterials by
compounds of the test media (eg NOM) Thus a certain remaining fraction after a defined reaction time
does not necessarily indicate slow or fast heteroagglomeration Hence another useful step is the
determination of the ldquofinalrdquo stable fraction (eg after 24 h) to avoid misinterpretation Since this fraction is
unlikely to attach to SPM in the long run it should be considered ldquofreerdquo nanomaterials when it comes to
transport regimes or bioavailability
if heteroagglomeration is very fast a homoagglomeration control might provide a more reliable initial concentration
(but only if the screening effect can be considered negligible eg when very low SPM concentrations are used)
34 ENVJMMONO(2020)9
Unclassified
Both dispersion stability and dissolution (rate) are considered to be endpoints of major importance
for describing environmental behaviour and fate of nanomaterials Thus for fate assessment as well as for
exposure assessment both endpoints need to be taken into account and they will also be key information
for ecotoxicity testing
While TG 318 for dispersion stability has been published (OECD 2017) currently no OECD TG
on solubility and dissolution rate of nanomaterials is available However existing guidance documents
such as the GD 29 (OECD 2001) may provide a basic orientation (see Chapter 2) Other TG and GDs as
well as ongoing WNT projects are also dealing with areas of dissolution (see Chapter 2 and Chapter 6)
There is not just one single optimal strategy on how to determine solubility dissolution and
dispersion stability The initial nanomaterial concentrations the media composition and timeframe that is
relevant to use will always depend on the purpose and objective of testing (see Section 41) Likewise the
testing strategy employed depends on whether the data is needed to inform consideration of what further
ecotoxicity testing is needed as input data for modelling of environmental fate or as basic data on
environmental behaviour (see Section 42)
Validity and correct interpretation of dispersion stability and dissolution rate or solubility
measurements are interdependent For instance the measurement of dissolution in a suspension where
agglomeration and sedimentation has occurred will underestimate dissolution (as
agglomeratedprecipitated material will have less surface available for dissolution) When dissolution has
occurred determination of dispersion stability based on measurement of the remaining particulate fraction
only will underestimate dispersion stability as any nanomaterial missing through dissolution will be
interpreted as precipitated Determination of dispersion stability of dissolving nanomaterial based on
remaining total concentration in the supernatant (as described in TG 318) leads to an overestimation of
dispersion stability in case the dissolved fraction is not quantified Therefore the quantification of the
dissolved fraction of the stable part is required in TG 318 when dissolving nanomaterials are investigated
Further situations where such caution must be shown when interpreting the data and where both types of
data must be viewed in concert are highlighted with some outline application examples in Section 43
41 Purpose
Dissolution (rate) and dispersion stability are relevant triggers needed for the safety assessment
of nanomaterials Regulatory information requirements for solubility dissolution rate and dispersion
stability of nanomaterials exist in some chemical legislation such as REACH (EU 2018) These parameters
are also relevant as triggers for further assessment strategies and decisions Given the current worldwide
development in chemicals regulations to manage nanomaterials it is anticipated that other chemicals
legislations (eg US EPA 2016) meet the same challenges
4 Use of data on dissolution and dispersion
stability for further testing and
assessment strategies
ENVJMMONO(2020)9 35
Unclassified
The understanding of environmental fate and behaviour of nanomaterials is one of the key aspects
for environmental exposure assessment Furthermore it supports the knowledge about uptake by
interaction with and effects on environmental organisms Therefore dissolution (hetero-) agglomeration
and sedimentation are important drivers for environmental fate behaviour and effects of nanomaterials
Furthermore given the numerous manufactured nanomaterials already on the market and many
more expected in future the effort for the individual investigation of hazard and risk would be enormous
and virtually impossible To overcome this challenge grouping and read-across approaches of
nanomaterials has been identified as one critical issue by OECD (OECD 2016) Grouping and read-across
approaches are already established for chemical substances to meet regulatory data requirements by
deviation from the requirements of performing standard tests for years (OECD 2007 2014b) The aim of
these approaches is to predict the physico-chemical toxicological and fate-related properties of chemical
substances based on structural similarities If sufficient evidence for similarity is available between two
chemical forms then it should be possible to transfer available data on the fate or hazard of one chemical
substance to another one These approaches are intended to reduce the amount of testing necessary to
determine the behaviour and effects of all individual members of a group
Grouping and read-across based on molecular structural similarity alone is not sufficient for any
chemical This is of special importance for nanomaterials as nanoforms of the same chemical composition
but deviating in physico-chemical parameters can show differences in effects and behaviour To allow an
adequate assessment of nanomaterials using grouping and read-across further parameters are necessary
to justify such an approach In that context beside chemical composition parameters like morphology
surface properties and shape as well as reactivity and fate descriptors like dissolution rate or dispersion
stability in relevant media are discussed for consideration (eg ECHA Guidance R61 (ECHA 2019))
TG 318 for dispersion stability and the available methods for solubility and dissolution rate can
address the respective endpoints and might be used to compare similarities or differences of nanomaterials
regarding these endpoints at given conditions and thus support the development of grouping and analogue
approaches for nanomaterials as part of integrated testing and assessment approaches (IATAs)
For further (hazard) testing knowledge on dispersion stability and dissolution behaviour can inform
on the test set-up and necessary measurements for exposure characterisation during the testing
Furthermore knowledge on dispersion stability and dissolution behaviour in a test system can facilitate
better interpretation of test results (eg whether effects seen can be attributed to nanomaterials or free
ions only)
42 Testing strategy
Based on the purpose of testing information from solubility dissolution rate and dispersion stability
testing can inform a further testing strategy The suggested approach to do so is outlined in Figure 11 The
approach starts with a screening batch test on dissolution followed by a dynamic dissolution test if needed
The approach furthermore includes the testing of dispersion stability for nanomaterials that do not fully
dissolve within a relevant time scale This approach also provides further information to guide on the effort
needed for appropriate analytics in further testing Before entering into the tiered approach sufficient
characterisation of the investigated nanomaterial (eg chemical composition size distribution morphology
and surface modifications) provides information to prepare the testing and interpret test results
36 ENVJMMONO(2020)9
Unclassified
Figure 11 Overview of a testing strategy building on dissolution and dispersion stability data Potential dissolved fraction is below detection limit Dagger All relevant mass of the investigated nanomaterial is in the dissolved fraction and The evidence takes relevant time scales into account The testing strategy and elements that need to be considered for the development of such a strategy is further explained in section 43 and section 44
Depending on the nanomaterial under investigation and the objective of the testing appropriate
starting concentrations and test durations need to be chosen for the initial screening dissolution batch test
ENVJMMONO(2020)9 37
Unclassified
When addressing triggers for safety assessment and decision making for further testing there might be
the need to test concentrations which are above environmentally relevant concentrations Therefore it is
advisable to test the nanomaterials with test conditions of TG 318 and the upcoming TG for dissolution
respectively to gain comparable and reliable data Furthermore it might be challenging to analytically
verify test concentrations under (mimicked) realistic environmental conditions
In case the batch test gives conclusive evidence for full dissolution (all relevant mass in dissolved
fraction) of the investigated nanomaterial in a relevant time scale (relevant refers to the actual question for
which the test strategy is set up) further dissolution testing by dynamic methods might not be needed In
this case it can also be considered to refrain from nanospecific testing For nanomaterials that show
incomplete dissolution or dissolution below detection limit it should be decided if the information from the
batch test provides sufficient evidence to enable a decision on the dissolution for the purpose defined For
example information on dissolution based on the batch test could provide sufficient supplementary
information for a subsequent ecotoxicity test In contrast information from the batch test might be
insufficient to eg inform exposure relevant testing regimes in which dissolution against an infinitive sink
is of interest Based on the question also the appropriateness of the analytic equipment (eg concerning
sensitivity) should be considered
In case information from the batch test is sufficient to conclude on the dissolution of the
investigated nanomaterial one could directly proceed with further nanospecific testing If the information
from the batch test is insufficient testing of dissolution with a dynamic method should be considered For
nanomaterials that do not fully dissolve in a dynamic dissolution test within a relevant time scale again
further nanospecific testing is needed For further nanospecific testing a first suggested step is testing of
dispersion stability
For testing dispersion stability it is recommended to use OECD TG 318 as it is described
Deviation from test conditions might be possible in order to inform higher tier testing In the latter case it is
suggested to choose appropriate test duration and concentration based on the objective Information from
dispersion stability testing can provide an indication about the analytical needs (monitoring of dissolved
fraction monitoring of dispersion stability) to be performed for or during potential further nanospecific
testing
In addition results from solubility dissolution rate and dispersion stability testing can provide
information to facilitate the choice of appropriate test performance of potential further testing (eg
frequency of water renewal rate (semi)static vs flow-through test conditions) to maintain stable conditions
43 Points to consider when applying information on dispersion stability and
dissolution for potential further testing
The methods presented in this GD will provide relevant data on solubility dissolution rate and
dispersion stability Moreover in principle these methods can also be performed with test media (eg
natural water ecotoxicological test media) that differ from the ones presented in the respective test
guideline or recommended here However as these endpoints are influenced by properties of the
nanomaterial in question as well as interactions between the nanomaterial and its surroundings results
between tests may differ depending on nanomaterial modification(s) and the test media used
Consequently the repeatability reliability and robustness should be taken into account as much
as possible when using alternative test conditions In these cases it is prerequisite to characterise and
report the test media conditions as detailed as possible to enable data evaluation and interpretation of data
(and consider simultaneous testing) This will also enable future analysis of existing studies eg to
compare existing results with new data from new studies
38 ENVJMMONO(2020)9
Unclassified
While information from these methods might be directly applicable for exposure estimation
conclusions for a further testing strategy on hazard should be considered carefully The relevance of the
information as well as the decision how to consider data generated on these endpoints for further testing
will always depend on the individual question and purpose of testing
Solubility and dissolution rate inform about in which state (particulate completely or partly
dissolved) a nanomaterial is present under respective conditions Regarding solubility and dissolution rate
the main question is when it is possible to refrain from nanospecific considerations in hazard assessment
(ie when dissolution is considered complete and fast enough compared to the duration of the
corresponding (eco)toxicity test) For an appropriate decision on the relevant hazard assessment various
aspects need to be considered like the regarded nanomaterial (eg chemical composition) endpoint under
investigation (eg long term vs acute testing) and test performance (eg media type water renewal
frequency) In the evaluation of an aquatic hazard endpoint supporting information from discrete dissolution
testing (solubility dissolution rate) in the respective aquatic test media and with respective concentrations
could help to decide if it might be possible to refrain from nanospecific testing That could be the case if
the nanomaterial under investigation fully dissolves in dissolution testing within a timeframe and for
concentrations relevant for the respective aquatic endpoint The chosen test parameter should allow to
conclude if the contribution of the particulate form to the eco-toxicological impact is insignificant and do not
very likely change the results of the ecotoxicity testing Furthermore hazard test data for the solute needs
to be available
Regarding dissolution it should be considered that the dissolution kinetic of some nanomaterials
(eg certain metals or metal oxides) is sensitive to lightdarkness with generally a greater dissolution at
visible light or UV-irradiated conditions as compared to darkness Therefore the lightdark-conditions
should be reported where relevant (Hedberg et al 2012 Li et al 2014)
OECD TG 318 provides information on how stable a nanomaterial dispersion is in aqueous media
at given conditions There is sufficient evidence that nanomaterials tend to agglomerate and settle out of
the water phase during sufficient long periods and thus sediment sludge and soil are expected to be the
main environmental components in which the nanomaterials end up (Hartmann et al 2014) Thus if
nanomaterials show low stability in the water phase inclusion of data relating to the sediment or soil
compartment into environmental risk assessment of nanomaterials may become relevant
However agglomeration and sedimentation should not be equated per se with lack of exposure in
water column For hazard testing existing data show that agglomeration and sedimentation do not
necessarily prevent availability to the organisms in aquatic test systems Due to the permanently agitated
test system used for testing algae toxicity test organisms also can be affected by nanomaterials unstable
in the test dispersion In addition unstable dispersed nanomaterials can be taken up by pelagic organisms
like daphnia (Botha et al 2016 Tan et al 2016 Hund-Rinke et al 2017) Unstable nanomaterials
furthermore can be available to benthic deposit-feeders and filtering organisms (Tella et al 2014 Kuehr
et al 2020) In case of ion releasing nanomaterials released ions might get back into the water phase
affecting test organisms while the particulate fraction remains deposited at the bottom Strictly speaking
this may not be considered nanomaterial toxicity but by constantly replenishing the ion concentration in
the water phase the particulate fraction strongly influences the outcomes of the test Also under
environmental conditions it is conceivable that deposited or heteroagglomerated nanomaterials are
consumed from biofilms ground or plant surfaces or taken up via sediment or natural suspended matter
respectively (Geitner et al 2018 Perrier et al 2018) In addition to dissolution and agglomeration
bioavailability and uptake of the various nanomaterials by aquatic organisms depends on other aspects of
the nanomaterials like size chemical composition synthesis methods or nature of coating of the
investigated nanomaterial (Lead et al 2018) However the understanding how these aspects influence
bioavailability and uptake is still far from complete
ENVJMMONO(2020)9 39
Unclassified
When using data from dispersion stability and dissolution testing for exposure assessment it has
to be taken into account that not only a single event but also a continuous entry into the environment is of
relevance This can lead to a situation that even if a nanomaterial dissolves relatively fast a mixed exposure
of particulate and dissolved forms can take place
For nanomaterials that release ions or dissolve over a sufficient long period of time it is important
to monitor in-depth the ion concentration in the test system to inform on the amounts of particulate and
dissolved forms being present Depending on the purpose of testing and investigated nanomaterial it can
be also of importance to know how the particulate form changes in surface or core composition or size
distribution Changes in composition might be relevant for eg nanomaterials that consist of various
substances (eg core-shell nanomaterials) with different dissolution behaviour and should be determined
where relevant Knowledge on changes in size distribution (eg loss of smallest particle decrease of
particle size across the distribution formation of new particles) can become relevant to decide on further
hazard and fate testing strategies
The joint consideration of the endpoints determined by the TG 318 and available methods on
solubility and dissolution rate is of expedient importance as these endpoints strongly influence each other
and interpreting one in absence of the other is difficult The dispersion state of a nanomaterial will affect
its dissolution kinetic while ion releasing of the nanomaterial will alter the outcome of dispersion stability
testing for dissolving nanomaterials
Dissolution leads to an increase of ion concentration that subsequently can lead to either an
increased or a decreased dispersion stability Furthermore readily soluble nanomaterials can show a loss
of particles during TG 318 performance Therefore care should be taken when analysing and interpreting
results from TG 318 to not mistake dissolved nanomaterials with stable fraction In TG 318 it is described
how dissolution needs to be evaluated during testing for ion releasing nanomaterials On the other hand
agglomerationsedimentation will lead to a decrease in available surface which in consequence will result
in a decrease in dissolution
Next to (hetero-) agglomeration sedimentation and dissolution potential nanomaterial
transformations (eg sulphidation oxidationreduction reactions and coating transformations) influence the
fate of nanomaterials in the environment and thus should be considered when evaluating the data An
OECD project is under development on transformation of nanomaterials in aquatic environmental media
to provide advice on ways to determine abiotic transformations of nanomaterials in the environment
40 ENVJMMONO(2020)9
Unclassified
Both data from TG 318 and the currently available methods for determining solubility and
dissolution rate may support the derivation of appropriate input parameters for exposure modelling of
nanomaterials As a starting point for environmental fate modelling basic data as collected using TG 318
and adapted test performance of GD 29 might be used as input for deriving screening level estimations of
predicted environmental concentrations (PECs) eg to compare potential exposure of various
nanomaterials This basic data can be a ranking in stable or instable nanomaterial dispersion (Figure 4)
according to TG 318 which can be linked to the degree of agglomeration expected Choosing a low or
high attachment efficiency that coincides with stable or instable conditions can be based on the PEC
sensitivity reported by Meesters et al (2019) Similarly such basic data on the dissolution or transformation
of nanomaterials (eg GD 29) can be used to choose a relevant order of magnitude of this rate constant
based on the PEC sensitivity reported by Meesters et al (2019) For refinement of such data further testing
like using dynamic test designs to determine dissolution (rate) andor alternative media (eg in order to
determine heteroagglomeration with TG 318) will help to improve the PEC estimations in various
environmental compartments
51 Use of data on dissolution rate in exposure modelling
Data on dissolution of nanomaterials is essential in environmental exposure modelling to enable
the distinction between the dissolved and the particulate fraction of a nanomaterial This distinction is
included in current environmental fate models for nanomaterials where dissolution is a process by which
nanomaterials are transformed from the particulate form to the dissolved form (Meesters et al 2019) As
noted in Chapter 2 dissolution data can be used to estimate the dissolution rate constant This is an input
parameter in environmental fate models to calculate the predicted exposure concentration Assuming first
order kinetics the dissolution rate constant can be calculated from experimental data as
Equation 5
119896diss =119897119899(
[NM0]minus([M119899+]minus[M0119899+])
[NM0])
119905
where [NM0] is the nanomaterial concentration in mgL at the start of the experiment (t = 0) [Mn+] is the
dissolved ionic metal concentration in mgL at time t [M0n+] is the dissolved ionic metal concentration in
mgL at the start of the experiment (t = 0) (kdiss) is the dissolution rate constant and t is time of
measurement The dissolved ion concentration is operationally defined as the portion passing a filter of 3
5 Use of data on dispersion stability
solubility and dissolution rate in exposure
modelling
ENVJMMONO(2020)9 41
Unclassified
5 or 10 kDa MWCO at a certain media composition If the medium contains complexing agents such as
NOM and the NOM-metal ion complex can penetrate the membrane the measured dissolved
concentration is composed of the free metal ions and the complexed metal ions In case multiple data
points (ie concentration measurements) in time are available for [Mn+] kdiss can be derived by fitting the
relationship between [Mn+]t and time by using the following equation
Equation 6
As kdiss is only derived from ions appearing in solution over time it is essential that the
measurement technique used enables a distinction of the ionic fraction from the other metal fractions It
should be considered to use the ion concentration in the untreated medium as [M0n+] to ensure that this
value is not influenced by NM0 Some caution is needed where rapid dissolution occurs at the beginning
of the experiment as this may result in artificially low kdiss when measurements do not capture this (eg
when measurements are only available for 0 24 and 48 hours)
[ M n+ ] t = [ M 0 n+ ] - [ NM 0 ] + ( [ NM 0 ] e k diss t )
42 ENVJMMONO(2020)9
Unclassified
Currently there are various OECD projects underway to develop nanospecific TGs and GDs
Solubility dissolution (rate) and dispersion stability are important parameters that need to be considered
in these activities as they influence the outcome of the respective methods (ProSafe 2017) This chapter
will give a short overview on how these parameters are interlinked with the ongoing environmental relevant
OECD projects for nanomaterials as well as existing methods for solubility and dissolution
61 OECD TG 105 - Dissolution in water
TG 105 (OECD 1995) describes a column elution method and a flask method to investigate
solubility of compounds
During the column elution method of TG 105 the solubility of a solid chemical is determined while
attached to an inert substrate in a column The solubility equals the plateau concentration of a chemical
dissolved from the test material reached in the eluate of the column
The flow-through testing for dissolution rate described in this GD is similar to the column elution
method of TG 105 in that sense that the simulated media in contact with the nanomaterials is continuously
refreshed and the concentration of dissolved substances is measured continuously However it is not clear
how nanomaterials could be attached to such a substrate In this GD the nanomaterials are therefore
attached to an ultrafiltration membrane or contained in a compartment formed by ultrafiltration membranes
that are continuously in contact with the medium
The data interpretation in this GD is fundamentally different from that in TG 105 TG 105 describes
how the solubility of compounds can be obtained whereas this GD describes how a dissolution rate can
be obtained
The flask method in TG 105 resembles the static batch test method described in this GD However
TG 105 prescribes that solution and solid material must be separated using centrifugation after 24 hours
of equilibration after which the solubility is measured This GD prescribes using ultrafiltration as a
separation technique because centrifugation does not guarantee separation of nanomaterials and
dissolved substances Moreover this GD encourages dissolved concentrations to be measured at several
time points allowing to fit a kinetic model and calculating the dissolution rate
62 OECD TG 106 - Adsorption - Desorption Using a Batch Equilibrium Method
TG 106 (OECD 2000) describes a batch method where a substrate usually a dried and
homogenised soil is equilibrated with a chemical dissolved in water for a determined time The chemical
then adsorbs to the substrate and this process is quantified in the form of a partitioning coefficient (Kd) In
general TG 106 will not provide reliable results for nanomaterials as they do not establish a thermodynamic
equilibrium with any substrate (Praetorius et al 2014b) This GD does not apply to dissolved chemicals
but to nanomaterials An attachment efficiency is deducted in this GD using a kinetic approach instead of
a partitioning coefficient (see chapter 3)
Finally SPM is recommended as a substrate in this GD whereas a soil is usually used for TG 106
6 Links to other relevant TGs and GDs
ENVJMMONO(2020)9 43
Unclassified
63 OECD GD 23 - Guidance Document on Aquatic Toxicity Testing of Difficult
Substances and Mixtures
OECD GD 23 provides guidance for the testing of chemicals that are difficult to test for the
purposes of determining their aquatic toxicity This includes guidance for the testing for instance of poorly
or sparingly water-soluble substances substances degrading in test system or hydrophobic substances
In paragraph 5 of OECD GD 23 (OECD 2019) it is stated ldquoConsistent with the guidance presented
herein this document is generally not applicable to aquatic tests which include the undissolved phase of
a test chemical except where noted in this guidance for test chemicals which form stable dispersions It
should be noted that specific OECD guidance documents are under development for aquatic toxicity tests
of test chemicals considered as nanomaterials which may include both dissolved and undissolved
fractions in the exposurerdquo
Guidance for testing of nanomaterials in aquatic ecotoxicity can be found in the GD on Aquatic
and Sediment Toxicological Testing of Nanomaterials (see also section 65) while this GD provides
guidance for the testing of the fate endpoints solubility dissolution rate and dispersion stability on basis
of homo- and heteroagglomeration
64 OECD GD 29 - Guidance Document on TransformationDissolution of Metals
and Metal Compounds in Aqueous Media
As in this GD GD 29 (OECD 2001) describes a screening level and one full
dissolutiontransformation test A high loading of a solid compound is equilibrated for 24 hours in a test
medium during the screening test followed by a single measurement
The dissolved fraction is determined in a 020 microm filtrate using GD 29 differing from this GD where
ultrafiltration is used for separation because nanomaterials may pass a 020 m filter Further indications
on adapted needs when considering nanomaterial testing can be found in chapter 2
In the full test described by GD 29 three different concentrations of a solid compound are
equilibrated at times up to 28 days where the test medium is refreshed every 24 hours Refreshing the
medium would not be possible for nanomaterials in this way because they are suspended in the medium
and would be removed during refreshing
This GD recommends continuous refreshing more in line with TG 105 and ISO TR 19057 (ISO
2017b) As in the screening test ultrafiltration is recommended in this GD
65 OECD GD 317 - Aquatic and Sediment Toxicological Testing of Nanomaterials
Information on nanomaterial dissolution and dispersion stability should be used in addition to the
guidance given in the GD on aquatic (and sediment) toxicity testing of nanomaterials in order to interpret
the determined aquatic and sediment toxicity data In the present GD (Chapter 4) a testing strategy is
suggested for solubility dissolution rate and dispersion stability to inform about in which state (particulate
completely or partly dissolved) a nanomaterial is present under conditions of an ecotoxicity study and help
to interpret test results regarding the contribution of dissolved or undissolved fraction to the toxicity
Information on dispersion stability helps to identify the main routes of exposure within the test
system (eg via water phase in case of stable dispersion via possible dietary exposure of unstable
dispersion via sediment)
44 ENVJMMONO(2020)9
Unclassified
In addition results from solubility dissolution rate and dispersion stability testing can provide
information to facilitate to decide on the analytic needs and the choice of appropriate test performance of
potential further testing (eg frequency of water renewal rate (semi)static vs flow through test conditions)
Data on heteroagglomeration obtained using this GD may also support interpretation of
ecotoxicological data of standard test results SPM of different forms are present in high enough
concentrations in some standard tests and can affect the nanomaterial that organisms are exposed to
Attachment to fish feed if it occurs determines how fish are exposed to nanomaterials via gills or via the
gut (Handy et al 2018) Extracellular polymers eg algae exudates may occur in standard aquatic tests
and heteroagglomeration of nanomaterials and such polymers affects the exposure and consequent
toxicity of nanomaterials to the organisms (Yang et al 2018)
Even though tests in soil systems are not included in the GD on aquatic and sediment tests the
recommendations mentioned above also apply to soil organisms Soil pore water is expected to be an
important exposure pathway of nanomaterials to soil organisms Heteroagglomeration and dissolution in
soil pore water is therefore also determining the toxicity to soil organisms Attachment to inorganic particles
such as clays or iron oxides is likely in standard soils (Miglietta et al 2015) and determines whether
organisms are exposed to individual nanomaterials andor to heteroagglomerated nanomaterials which
may affect toxicity (Gupta et al 2017)
To broaden the significance of data on dispersion stability or dissolution for interpretation of
nanomaterial behaviour in ecotoxicity test media the simulated environmental media used in TG 318 and
for dissolution testing may be amended to determine the dispersion and dissolution behaviour directly in
the relevant test media for ecotoxicity testing
Comparing information on dissolution (rate) and dispersion (stability) of different nanoforms of a
substance prior to ecotoxicity testing of those nanoforms can support the development of hypotheses on
expected similar behaviour and thus may guide grouping and read-across
66 OECD TG for Nanomaterial Removal in Wastewater5
This TG aims to provide a standard method for characterising the interaction between
nanomaterials and wastewater treatment sludge In this case the heteroagglomeration is specific biomass
sampled from a wastewater treatment plant
The approach prescribes mixing biomass with nanomaterials for one hour followed by gravitational
settling The test is done at different total nanomaterial concentrations and sorption isotherms are
calculated based on the nanomaterial concentration measured in the supernatant after settling In the case
of this GD we recommend separating free from heteroagglomerated nanomaterials by means of
accelerated sedimentation using centrifugation
The parameter reported from this GD in terms of heteroagglomeration is attachment efficiency
which is a dimensionless parameter that is used in kinetic models thus models that assume equilibrium
do not apply In contrast sorption isotherms reports isothermal trends of partitioning coefficients and the
underlying model of these parameters assume a continuously equilibrium or steady-state situation
Different parameters are thus determined
5 Under development
ENVJMMONO(2020)9 45
Unclassified
67 OECD GD to Assess the Apparent Accumulation Potential of Nanomaterials
during Fish Bioaccumulation Studies6
As described earlier dispersion stability and ion dissolution will affect what the organisms are
exposed to both in standard tests as well as in realistic environments Interpretation of bioaccumulation
testing therefore likewise needs information on dispersion stability heteroagglomeration and dissolution of
the nanomaterial in question as for instance proposed for fish bioaccumulation testing (Handy et al 2018)
A dissolution rate rather than solubility is needed for bioaccumulation testing given the kinetic
nature of bioaccumulation
The information from dissolution dispersion stability and heteroagglomeration could also be used
for decision making prior to testing or bioaccumulation test media could be used in an adapted protocol of
both endpoints in order to investigate dispersion andor dissolution under experimental settings relevant
for bioaccumulation tests
68 OECD GD to support the Use of TG 312 (Leaching in Soil Columns) for
Nanomaterial Safety Testing7
A GD on how to conduct column tests to determine transport of nanomaterials in porous media
based on TG 312 (OECD 2004) includes recommendations on how to calculate a global attachment
efficiency (global) for a specific nanomaterial in a specific soil This GD provides guidance on calculating
the attachment efficiency for interaction between a specific nanomaterial and specific SPM (SPM)
It has to be noted that these attachment efficiencies are not the same even if SPM material is
used that is relevant for the specific soil studied (global is a global parameter grouping many different
processes that reduce transport (and thus increase (global) in soils (Baalousha et al 2016) One of these
processes may be heteroagglomeration with natural SPM in the pore water the rate quantification of which
may occur as described in this GD
6 Under development
7 Under development
46 ENVJMMONO(2020)9
Unclassified
Arvidsson R Molander S Sandeacuten BA Hasselloumlv M 2011 Challenges in Exposure Modeling of
Nanoparticles in Aquatic Environments Human and Ecological Risk Assessment An International Journal
171 245-262
Baalousha M Cornelis G Kuhlbusch T Lynch I Nickel C Peijnenburg W van den Brink N 2016
Modeling Nanomaterial Fate and Uptake in the Environment Current Knowledge and Future Trends
Environmental Science Nano 3 323-345
Barton LE Therezien M Auffan M Bottero J-Y Wiesner MR 2014 Theory and Methodology for
Determining Nanoparticle Affinity for Heteroaggregation in Environmental Matrices Using Batch
Measurements Environmental Engineering Science 31 (7) 7
Baun A Sayre P Steinhaumluser KG Rose J 2017 Regulatory relevant and reliable methods and data
for determining the environmental fate of manufactured nanomaterials NanoImpact 8 1ndash10
Botha TL Boodhia K Wepener V 2016 Adsorption uptake and distribution of gold nanoparticles in
Daphnia magna following long term exposure Aquatic Toxicity 170 194-111
Bove P Malvindi MA Kote SS Bertorelli R Summa M SabellaS 2017 Dissolution test for risk
assessment of nanoparticles a pilot study Nanoscale 9 6315-26
Camp T R and Stein P C 1943 Velocity Gradients and Internal Work in Fluid Motion Journal of Boston
Society of Civil Engineering 30 219-237
Carlander U Midander K Hedberg YS Johanson G Bottai M Karlsson HL 2019 Macrophage-
assisted dissolution of gold nanoparticles ACS Applied Bio Materials 2 1006-1016
Cornelis G Kirby JK Beak D Chittleborough D McLaughlin MJ 2010 A method for determination
of retention of silver and cerium oxide manufactured nanoparticles in soils Environmental Chemistry 7(3)
298-308
ECHA 2019 Guidance on information requirements and chemical safety assessment Chapter R6 QSAR
and grouping of chemicals Available at
httpechaeuropaeudocuments1016213632information_requirements_r6_enpdf
Elimelech M Gregory J Jia X Williams RA 1995 Particle Deposition and Aggregation ndash
Measurement Modelling and Simulation Chapter 6 Modelling of aggregation processes ISBN 978-0-
7506-7024-1
EU 2011 Commission Recommendation on the definition of nanomaterials Available at
httpdataeuropaeuelireco2011696oj
EU 2018 Commission Regulation (EU) 20181881 of 3 December 2018 amending Regulation (EC) No
19072006 of the European Parliament and of the Council on the Registration Evaluation Authorisation
and Restriction of Chemicals (REACH) as regards Annexes I III VI VII VIII IX X XI and XII to address
nanoforms of substances O J L 308 1-20
Franklin NM Rogers NJ Apte SC Batley E Gadd GE Case PS 2007 Comparative Toxicity of
Nanoparticulate ZnO Bulk ZnO and ZnCl2 to a Freshwater Microalga (Pseudokirchneriella subcapitata)
The Importance of Particle Solubility Environmental Science and Technology 41 8484-8490
7 References
ENVJMMONO(2020)9 47
Unclassified
Gao X Lowry G V 2018 Progress towards standardized and validated characterizations for measuring
physicochemical properties of manufactured nanomaterials relevant to nano health and safety risks
NanoImpact9 January 2018 Pages 14-30
Geitner NK OrsquoBrian NJ Turner AA Cummins EJ Wiesner MR 2017 Measuring Nanoparticle
Attachment Efficiency in Complex Systems Environmental Science and Technology 51 13288minus13294
Geitner N K Cooper J L Avellan A Castellon B T Perrotta B G Bossa N Simonin M
Anderson S M Inoue S Hochella M F Jr Richardson C J Bernhardt E S Lowry G V Ferguson
P L Matson C W King R S Unrine J M Wiesner M R Hsu-Kim H 2018 Size-Based Differential
Transport Uptake and Mass Distribution of Ceria (CeO2) Nanoparticles in Wetland Mesocosms
Environmental Science and Technology 52 9768-9776
Gupta GS Senapati VA Dhawan A Shanker R 2017 Heteroagglomeration of zinc oxide
nanoparticles with clay mineral modulates the bioavailability and toxicity of nanoparticle in Tetrahymena
pyriformis Journal of Colloid Interface Science 495 9-18
Handy RD Ahtiainen J Navas JM Goss G Bleeker EAJ von der Kammer F 2018 Positional
Paper ndash Proposal for a tiered dietary bioaccumulation testing strategy for engineered nanomaterials using
fish Environmental Science Nano 5 2030-2046
Hartmann NB Skjolding LM Hansen SF Kjoholt J Gottschalck F Baun A 2014 Environmental
Fate and Behaviour of Nanomaterials New Knowledge on Important Transformation Processes
Environmental Project No 1594 Copenhagen Denmark The Danish Environmental Protection Agency
Hedberg Y Herting G Odnevall Wallinder I 2011 Risks of using membrane filtration for trace metal
analysis and assessing the dissolved metal fraction of aqueous media - A study on zinc copper and nickel
Environmental Pollution 159 1144-1150
Hedberg Y and Odnevall Wallinder I 2012 Transformationdissolution studies on the release of iron and
chromium from particles in synthetic body fluids Materials and Corrosion 63 481-491
Hedberg YS Hedberg J Isaksson S Mei N Blomberg E Wold S Odnevall Wallinder I 2017a
Nanoparticles of WC-Co WC Co and Cu of relevance for traffic wear particles - Particle stability and
reactivity in synthetic surface water and influence of humic matter Environmental Pollution 224 275ndash288
Hedberg J Ekvall M T Cedervall T Hansson L-A Odnevall Wallinder I 2017b Tungsten carbide
nanoparticles in simulated surface water with natural organic matter dissolution agglomeration
sedimentation and interaction with Daphnia magna Environmental Science Nano 4 886 ndash 894
Hofmann T and von der Kammer F 2009 Estimating the relevance of engineered carbonaceous
nanoparticle facilitated transport of hydrophobic organic contaminants in porous media Environmental
Pollution 157(4) 1117ndash1126
Hund-Rinke K Nickel C Kuumlhnel D 2017 Considerations about the relationship of nanomaterialrsquos
physical-chemical properties and aquatic toxicity for the purpose of grouping Project financed by
Environmental Research of the Federal Ministry for the Environment Nature Conservation Building and
Nuclear Safety No (FKZ) 3714 67 417 0 Report No (UBA-FB) 002572ENG
Huynh K A McCaffery JM Chen KL 2012 Heteroaggregation of Multiwalled Carbon Nanotubes and
Hematite Nanoparticles Rates and Mechanisms Environmental Science and Technology 46 5912minus5920
ISO 2010 ISO 927710 Determination of the specific surface area of solids by gas adsorption mdash BET
method
ISO 2017a ISOTR 184012017 Nanotechnologies mdash Plain language explanation of selected terms from
the ISOIEC 80004 series
48 ENVJMMONO(2020)9
Unclassified
ISO 2017b ISOTR 19057 Nanotechnologies - Use and application of acellular in vitro tests and
methodologies to assess nanomaterial biodurability International Organisation for Standardisation
Jiang J Oberdoumlrster G Biswas P 2009 Characterization of size surface charge and agglomeration
state of nanoparticle dispersions for toxicological studies Journal of Nanoparticle Research 11 77ndash89
Juumlnemann D and Dressman J 2012 Analytical methods for dissolution testing of nanosized drugs
Journal of Pharmacy and Pharmacology 64 931-943
Kennedy AK Hull MS Bendar AJ Goss JD Gunter JC Bouldin JL Vikesland PJ Steevens
JA 2010 Fractionating nanosilver Importance for determining toxicity to aquatic test organisms
Environmental Science and Technology 44 9571-9577
Koltermann-Juelly J Keller JG Vennemann A Werle K Muumlller P Ma-Hock L Landsiedel R
Wiemann M Wohlleben W 2018 Abiotic dissolution rates of 24 (nano)forms of 6 substances compared
to macrophage-assisted dissolution and in vivo pulmonary clearance Grouping by biodissolution and
transformation NanoImpact 12 29-41
Kuehr S Meisterjahn B Schroumlder N Knopf B Voumllker D Schwirn K Schlechtriem C 2020 Testing
the bioaccumulation of manufactured nanomaterials in the freshwater bivalve Corbicula fluminea using a
new test method Environmental Science Nano 7 535-553
Labille J Harns C Bottero J-Y Brant J 2015 Heteroaggregation of Titanium Dioxide Nanoparticles
with Natural Clay Colloids Environmental Science and Technology 49 6608-6616
Ladner DA Steele W Weir A Hristovski K Westerhoff P 2012 Functionalized nanoparticle
interactions with polymeric membranes Journal of Harardous Materials 211-212 288-295
Lead J R Batley G E Alvarez P J J Croteau M N Handy R D McLaughlin M J Judy J D
Schirmer K 2018 Nanomaterials in the Environment Behavior Fate Bioavailability and Effects-An
Updated Review Environmental Toxicology Chemistry 37 (8) 2029-2063
Li Y Niu J Shang E Crittenden J 2014 Photochemical Transformation and Photoinduced Toxicity
Reduction of Silver Nanoparticles in the Presence of Perfluorocarboxylic Acids under UV Irradiation (and
Supporting Information) Environmental Science and Technology 48 4946-4953
Meesters J A J Koelmans AA Quik J T K Hendriks A J van der Meent D 2014 Multimedia
Modeling of Engineered Nanoparticles with SimpleBox4nano Model Definition and Evaluation
Environmental Science and Technology 48 5726-5736
Meesters J A J Peijnenburg W J G M Hendriks A J van der Meent D Quik J T K 2019 A
Model Sensitivity Analysis to Determine the Most Important Physicochemical Properties Driving
Environmental Fate and Exposure of Engineered Nanoparticles Environmental Science Nano 6 2049-
2060
Miglietta ML Rametta G Manzo S Salluzo A Rimauro J Di Franci G 2015 Methodological issues
about techniques for the spiking of standard OECD soil with nanoparticles evidence of different
behaviours Journal of Nanoparticle Research 17(7) 312
Misra SK Dybowska A Berhanu D Luoma S N Valsami-Jones E 2012 The complexity of
nanoparticle dissolution and its importance in nanotoxicological studies Science of the Total Environment
438 225ndash232
Monikh AF Praetorius A Schmid A Kozin P Meisterjahn B Makarova E Hofmann Tvon der
Kammer F 2018 Scientific rationale for the development of an OECD test guideline on engineered
nanomaterial stability NanoImpact 11 42-50
ENVJMMONO(2020)9 49
Unclassified
OECD 1995 TG 105 Water solubility OECD Test Guideline for the testing of chemicals Organisation for
Economic Co-operation and Development (OECD) Paris France Available at
httpwwwoecdorgenvehstestingseriesontestingandassessmenttestingforenvironmentalfatehtm
OECD 2000 TG 106 Adsorption - Desorption Using a Batch Equilibrium Method Organisation for
Economic Co-operation and Development (OECD) Paris France Available at
httpwwwoecdorgenvehstestingseriesontestingandassessmenttestingforenvironmentalfatehtm
OECD 2001 OECD Series on Testing and Assessment No 29 Guidance Document on
TransformationDissolution of Metals and Metal Compounds in Aqueous Media Organisation for Economic
Co-operation and Development (OECD) Paris France Available at
httpwwwoecdorgenvehstestingseriesontestingandassessmenttestingforenvironmentalfatehtm
OECD 2004 OECD Guideline for the Testing of Chemicals 312 Leaching in Soil Columns Organisation
for Economic Co-operation and Development (OECD) Paris France OECD Guideline for the Testing of
Chemicals 312 Leaching in Soil Columns Organisation for Economic Co-operation and Development
(OECD) Paris France Available at httpdxdoiorg1017879789264070561-en
OECD 2014a OECD Series on the Safety of Manufactured Nanomaterials No 40 Ecotoxicology and
Environmental Fate of Manufactured Nanomaterials Test Guidelines Expert Meeting Report
ENVJMMONO(2014)1 OECD Paris Available at
httpwwwoecdorgofficialdocumentspublicdisplaydocumentpdfcote=ENVJMMONO(2014)1ampdoclan
guage=en
OECD 2014b Guidance on Grouping of Chemicals second edition Series on Testing amp Assessment No
194 ENVJMMONO(2014)4 Organisation for Economic Co-operation and Development (OECD) Paris
France Available at
httpwwwoecdorgchemicalsafetytestingseriesontestingandassessmentpublicationsbynumberhtm
OECD 2016 OECD Series on the Safety of Manufactured Nanomaterials No 76 Grouping and Read-
Across for the Hazard Assessment of Manufactured Nanomaterials Report from the Expert Meeting
OECD Paris Available at httpwwwoecdorgchemicalsafetynanosafetypublications-series-safety-
manufactured-nanomaterialshtm
OECD 2017 Test Guideline 318 Dispersion Stability of Nanomaterials in Simulated Environmental Media
OECD Test Guidelines for Testing Chemicals Available at httpwwwoecd-ilibraryorgenvironmenttest-
no-318-dispersion-stability-of-nanomaterials-in-simulated-environmental-media_9789264284142-en
OECD 2018 Work plan for the test guidelines programme Organisation for Economic Co-operation and
Development (OECD) Paris France Available at
httpwwwoecdorgenvehstestingENV_JM_WRPR_2019__TGP-work-planpdf
OECD 2019 OECD Series on Testing and Assessment No 23 Guidance Document on Aquatic Toxicity Testing of Difficult Substances and Mixtures Organisation for Economic Co-operation and Development (OECD) Paris France Available at httpswwwoecd-ilibraryorgenvironmentguidance-document-on-aquatic-toxicity-testing-of-difficult-substances-and-mixtures_0ed2f88e-en
OECD 2020 Guidance Document on Aquatic and Sediment Toxicological Testing of Nanomaterials Series on Testing and Assessment No 317 ENVJMMONO(2020)8
Ottofuelling S Von Der Kammer F Hofmann T 2011 Commercial titanium dioxide nanoparticles in
both natural and synthetic water comprehensive multidimensional testing and prediction of aggregation
behavior Environmental Science and Technology 45 10045ndash10052
Perrier F Baudrimont M Mornet S Mesmer-Dudons Lacomme S Etcheverria B Simon O
Feurtet-Mazel A 2018 Gold nanoparticle trophic transfer from natural biofilms to gazer fish Gold Bulletin
51 163-173
50 ENVJMMONO(2020)9
Unclassified
Pradhan S Hedberg J Rosenqvist J Joumlnsson C Wold S Blomberg E Odnevall Wallinder I 2017
Influence of humic acid and dihydroxy benzoic acid on the agglomeration sedimentation and dissolution
of copper manganese aluminum and silica nanoparticles PlosOne 13(2) e0192553
Praetorious A Scheringer M Hungerbuhler K 2012 Development of Environmental Fate Models for
Engineered Nanoparticles - A Case Study of TiO2 Nanoparticles in the Rhine River Environmental Science
and Technology 46 6705minus6713
Praetorius A Scheringer M Hungerbuumlhler K Bottero J-Y 2014a Heteroaggregation of Titanium
Dioxide Nanoparticles with Model Natural Colloids under Environmentally Relevant Conditions
Environmental Science and Technolology 48 10690ndash10698
Praetorius A Tufenkji N Goss KU Scheringer M von der Kammer F Elimelech M 2014b The
road to nowhere equilibrium partition coefficients for nanoparticles Environmental Science Nano 1 317ndash
323
ProSafe 2017 Major International Conference Final Report Available at
httpswwwrivmnlendocumentenprosafe-d5-06-dr-major-international-conference
Quik J T K Velzeboer I Wouterse M Koelmans II van de Meent D 2014 Heteroagglomeration
and sedimentation rates for nanomaterials in natural waters Water Research 48 269-279
Quik J T K Stuart M C Wouterse M Peijnenburg W Hendriks A J van de Meent D2012 Natural
colloids are the dominant factor in the sedimentation of nanoparticles Environmental Toxicology and
Chemistry 31 (5) 1019-1022
Ren J Li Z Wong FS 2006 A new method for the prediction of pore size distribution and MWCO of
ultrafiltration membranes Journal of Membrane Science 279 558-569
Stetten L Mackevica A Tepe N von der Kammer F Tracking geochemical kinetics behavior of
engineered nanomaterials in natural aquatic environments Experimental Concepts for standardization In
preparation
Tan LY Huang B Xu S Wei ZB Yang LY Miao AJ 2016 TiO2 Nanoparticle Uptake by the
Water Flea Daphnia magna via Different Routes is Calcium-Dependent Environmental Science and
Technology 50 7799minus7807
Tella M Auffan M Brousset L Issartel J Kieffer I Pailles C Morel E Santaella C Angeletti B
Artells E Rose J Thieacutery A Bottero J-Y 2014 Transfer Transformation and Impacts of Ceria
Nanomaterials in Aquatic Mesocosms Simulating a Pond Ecosystem Environmental Science and
Technology 48 9004minus9013
Therezien M Thill A Wiesner MR 2014 Importance of heterogeneous aggregation for NP fate in
natural and engineered systems Science of The Total Environment485ndash486 309-318
US EPA 2016 Toxic Substances Control Act (TSCA) US EPA US Gov Available at
httpswwwepagovchemicals-under-tsca
Velzeboer I Quik JTK van de MeentD Koelmans II 2014 Rapid settling of nanoparticles due to
heteroaggregation with suspended sediment Environmental Toxicology and Chemistry33 (8) 1766ndash1773
Walch H Praetorius A von der Kammer F Hofmann T 2019 A tale of an engineered nanoparticleacutes
affection for natural suspended particulate matter in freshwaters Poster presentation at Environmental
Nanotechnology Gordon Research Conference Newry USA available at
httpsucrisunivieacatportaldepublicationsa-tale-of-an-engineered-nanoparticles-affection-for-
natural-suspended-particulate-matter-in-freshwaters(152dfb67-cc25-4d11-9469-540eb3d38a9e)html
ENVJMMONO(2020)9 51
Unclassified
Walch H Praetorius A von der Kammer F Hofmann T A Simple Approach to a Complex (Suspended
Particulate) Matter (SPM) Conceptual Framework for Reproducible Generation of Freshwater SPM
Analogues for Fate Studies of Particulate Contaminants In preparation
Wasmuth C Rudel H During RA Klawonn T 2016 Assessing the suitability of the OECD 29 guidance
document to investigate the transformation and dissolution of silver nanoparticles in aqueous media
Chemosphere 144 2018-2023
Yang Y Hou J Wang P Wang C Wang X You G 2018 Influence of extracellular polymeric
substances on cell-NPs heteroagglomeration process and toxicity of cerium dioxide NPs to Microcystis
aeruginosa Environmental Pollution 242 1206-1216
Zlokarnik M 2001 Stirring ndash Theory and Practice Ullmanns Encyclopedia of Industrial Chemistry Wiley‐
VCH Weinheim Germany
52 ENVJMMONO(2020)9
Unclassified
One important issue is the harmonization of terminology and definitions in various TGs and
GDs for environmental fate testing of nanomaterials Currently the published OECD TG 318 (OECD 2017)
for dispersion stability already contains agreed and adopted terminology and this should be taken into
account when future TGs and GDs are developed in case applicable
Agglomeration ndash Process of contact and adhesion whereby dispersed particles are held together by weak
physical interactions ultimately leading to enhanced sedimentation by the formation of particles
(agglomerates) of larger than colloidal size In contrast to aggregation where particles held by strong bonds
like sinter bridges agglomeration is a reversible process
Attachment Efficiency ndash Fraction of nanomaterial-SPM collisions resulting in nanomaterial attachment to
SPM
BET ndash Gas-adsorption method commonly using nitrogen (N2) gas to determine the specific surface area
of powders according to the BrunauerndashEmmettndashTeller theory (ISO 2010)
Concentrations ndash Concentrations of the particles and NOM in the samples are given in grams per litre
(gL) milligrams per litre (mgL) and micrograms per litre (μgL) In case of NOM it is given in mgL of DOC
Concentrations of electrolytes (Ca(NO3)2 and NaHCO3) present in the samples are given in millimole per
litre (mML)
DOC ndash Dissolved Organic Carbon the organic bound carbon in a water sample which passes a 045 microm
filter a part of dissolved organic matter (DOM) DOM in the form of humic substances have ~50 DOC
Dispersibility ndash is the condition of particular material of being dispersible or a measure to which extent it
is dispersible in a dispersing medium or continuous phase Dispersion stability refers to the ability of a
dispersion to resist change in its properties over time
Dissolution ndash Process under which a substance dissolves
Dissolution rate ndash The amount of substance dissolved (solute) into a solvent over time
Heteroagglomeration ndash Agglomeration of particles (here nanomaterials) with other particles (synthetic or
natural)
Homoagglomeration ndash Agglomeration of particles (here nanomaterials) with each other
MWCO - pore diameter of ultrafiltration is expressed in terms of molecular weight cut-off (MWCO) ie the
molecular weight of different molecules in the filtration process that are retained for 90 by the membrane
NOM ndash Natural organic matter the organic substances present in surface or ground water NOM covers
humic and non-humic fractions as eg polysaccharides NOM is operationally divided into Dissolved
Organic Matter (DOM) and Particulate Organic Matter (POM) DOM passes a 045 microm filter POM is
retained by the same filter POM as defined herein should not be confused with purgeable organic carbon
8 Terminology definitions and
abbreviations
ENVJMMONO(2020)9 53
Unclassified
Shear rate (G) ndash The shear rate or the velocity gradient (G) was introduced by Camp and Stein (1943) for
stirred vessels It is defined as the square root of the energy (eg added by stirring) dissipated by
turbulence per unit time accounting for the volume and viscosity of the considered fluid
Size ndash Size of the particles aggregates or agglomerates is given in micrometres (μm) or nanometres (nm)
Particle size usually refers to the particle size distribution The method for particle size determination and
relevant parameters of the particle size average should be reported
Solubility - The quantity of solute that dissolves in a given quantity of solvent to form a saturated solution
SPM ndash Suspended particulate matter finely divided solids dispersed in an aqueous environment
SRNOM ndash Suwannee River NOM a standard surface water NOM material of the International Humic
Substance Society (IHSS) isolated from the Suwannee River (US) by reverse osmosis and purified
according to the procedures of the IHSS The material can be purchased from the IHSS
- Foreword
- 1 Introduction
- 2 Testing of solubility and dissolution rate
-
- 21 Static Batch Test
- 22 Dynamic testing of dissolution rates
- 23 Data evaluation and reporting from dissolution testing
-
- 3 Testing of dispersion stability with TG 318
-
- 31 Data presentation and evaluation for TG 318
- 32 Alternative test conditions
- 33 Testing of heteroagglomeration
- 34 Data evaluation and derivation of attachment efficiency
-
- 4 Use of data on dissolution and dispersion stability for further testing and assessment strategies
-
- 41 Purpose
- 42 Testing strategy
- 43 Points to consider when applying information on dispersion stability and dissolution for potential further testing
-
- 5 Use of data on dispersion stability solubility and dissolution rate in exposure modelling
-
- 51 Use of data on dissolution rate in exposure modelling
-
- 6 Links to other relevant TGs and GDs
-
- 61 OECD TG 105 - Dissolution in water
- 62 OECD TG 106 - Adsorption - Desorption Using a Batch Equilibrium Method
- 63 OECD GD 23 - Guidance Document on Aquatic Toxicity Testing of Difficult Substances and Mixtures
- 64 OECD GD 29 - Guidance Document on TransformationDissolution of Metals and Metal Compounds in Aqueous Media
- 65 OECD GD 317 - Aquatic and Sediment Toxicological Testing of Nanomaterials
- 66 OECD TG for Nanomaterial Removal in Wastewater
- 67 OECD GD to Assess the Apparent Accumulation Potential of Nanomaterials during Fish Bioaccumulation Studies
- 68 OECD GD to support the Use of TG 312 (Leaching in Soil Columns) for Nanomaterial Safety Testing
-
- 7 References
- 8 Terminology definitions and abbreviations
-
2 ENVJMMONO(2020)9
Unclassified
SERIES ON TESTING AND ASSESSMENT
NO 318
GUIDANCE DOCUMENT FOR THE TESTING OF DISSOLUTION AND DISPERSION STABILITY OF NANOMATERIALS AND THE USE OF THE DATA FOR FURTHER
ENVIRONMENTAL TESTING AND ASSESSMENT STRATEGIES
Environment Directorate
ORGANISATION FOR ECONOMIC COOPERATION AND DEVELOPMENT
Paris 2020
ENVJMMONO(2020)9 3
Unclassified
About the OECD
The Organisation for Economic Co-operation and Development (OECD) is an intergovernmental organisation in which representatives of 36 industrialised countries in North and South America Europe and the Asia and Pacific region as well as the European Commission meet to co-ordinate and harmonise policies discuss issues of mutual concern and work together to respond to international problems Most of the OECDrsquos work is carried out by more than 200 specialised committees and working groups composed of member country delegates Observers from several countries with special status at the OECD and from interested international organisations attend many of the OECDrsquos workshops and other meetings Committees and working groups are served by the OECD Secretariat located in Paris France which is organised into directorates and divisions The Environment Health and Safety Division publishes free-of-charge documents in eleven different series Testing and Assessment Good Laboratory Practice and Compliance Monitoring Pesticides Biocides Risk Management Harmonisation of Regulatory Oversight in Biotechnology Safety of Novel Foods and Feeds Chemical Accidents Pollutant Release and Transfer Registers Emission Scenario Documents and Safety of Manufactured Nanomaterials More information about the Environment Health and Safety Programme and EHS publications is available on the OECDrsquos World Wide Web site (wwwoecdorgchemicalsafety)
This publication was developed in the IOMC context The contents do not necessarily reflect the views or stated policies of individual IOMC Participating Organizations The Inter-Organisation Programme for the Sound Management of Chemicals (IOMC) was established in 1995 following recommendations made by the 1992 UN Conference on Environment and Development to strengthen co-operation and increase international co-ordination in the field of chemical safety The Participating Organisations are FAO ILO UNDP UNEP UNIDO UNITAR WHO World Bank and OECD The purpose of the IOMC is to promote co-ordination of the policies and activities pursued by the Participating Organisations jointly or separately to achieve the sound management of chemicals in relation to human health and the environment
4 ENVJMMONO(2020)9
Unclassified
This publication is available electronically at no charge
Also published in the Testing and Assessment link
For this and many other Environment Health and Safety publications consult the OECDrsquos
World Wide Web site (wwwoecdorgchemicalsafety)
or contact
OECD Environment Directorate Environment Health and Safety Division
2 rue Andreacute-Pascal 75775 Paris Cedex 16
France
Fax (33-1) 44 30 61 80
E-mail ehscontoecdorg
copy OECD 2020 Applications for permission to reproduce or translate all or part of this material should be made to Head of Publications Service RIGHTSoecdorg OECD 2 rue Andreacute-Pascal 75775 Paris Cedex 16 France OECD Environment Health and Safety Publications
ENVJMMONO(2020)9 5
Unclassified
Foreword
Following a number of discussions within the OECD Working Party on Manufactured Nanomaterials (WPMN) (OECD 2014a) dissolution rate and dispersion stability in the environment where recognised as important parameters in understanding the environmental fate of nanomaterials and nanomaterials (bio)availability Both parameters are important in environmental risk assessment of nanomaterials The OECD decides to develop Test Guidelines for these parameters As a first step the OECD developed the Test Guideline 318 on dispersion stability of manufactured nanomaterials in simulated environmental media (OECD TG 318 2017) Another Test Guideline under development will address dissolution Nevertheless it was acknowledged that these parameters are often interlinked and thus the need to develop a document that could provide an overarching guidance Accordingly this GD focus on the dissolution and dispersion stability of nanomaterials and the use of the data for further environmental testing and assessment strategies It includes an excel spreadsheet as an accompanying document This document was led by Germany and benefited from the inputs of the Joint WNTWPMN Expert Group on Fate and Ecotoxicity of Manufactured Nanomaterials
6 ENVJMMONO(2020)9
Unclassified
Foreword 5
1 Introduction 7
2 Testing of solubility and dissolution rate 9
21 Static Batch Test 9
22 Dynamic testing of dissolution rates 12
23 Data evaluation and reporting from dissolution testing 14
3 Testing of dispersion stability with TG 318 16
31 Data presentation and evaluation for TG 318 19
32 Alternative test conditions 23
33 Testing of heteroagglomeration 24
34 Data evaluation and derivation of attachment efficiency 29
4 Use of data on dissolution and dispersion stability for further testing and assessment strategies 34
41 Purpose 34
42 Testing strategy 35
43 Points to consider when applying information on dispersion stability and dissolution for
potential further testing 37
5 Use of data on dispersion stability solubility and dissolution rate in exposure modelling 40
51 Use of data on dissolution rate in exposure modelling 40
6 Links to other relevant TGs and GDs 42
61 OECD TG 105 - Dissolution in water 42
62 OECD TG 106 - Adsorption - Desorption Using a Batch Equilibrium Method 42
63 OECD GD 23 - Guidance Document on Aquatic Toxicity Testing of Difficult Substances and
Mixtures 43
64 OECD GD 29 - Guidance Document on TransformationDissolution of Metals and Metal
Compounds in Aqueous Media 43
65 OECD GD 317 - Aquatic and Sediment Toxicological Testing of Nanomaterials 43
66 OECD TG for Nanomaterial Removal in Wastewater 44
67 OECD GD to Assess the Apparent Accumulation Potential of Nanomaterials during Fish
Bioaccumulation Studies 45
68 OECD GD to support the Use of TG 312 (Leaching in Soil Columns) for Nanomaterial Safety
Testing 45
7 References 46
8 Terminology definitions and abbreviations 52
ENVJMMONO(2020)9 7
Unclassified
In the OECD Expert Meeting in Berlin 2013 (OECD 2014a) it was identified that dissolution rate
and dispersion stability in the environment are important parameters for nanomaterials ie these
parameters are main drivers in environmental fate of nanomaterials and nanomaterials (bio)availability
and as such important in environmental risk assessment of nanomaterials It was concluded that Test
Guidelines (TGs) should be developed for these parameters As these parameters are often interlinked it
was acknowledged that an overarching guidance document (GD) would be beneficial as well
A Test Guideline (TG 318 OECD 2017) on dispersion stability of manufactured nanomaterials in
simulated environmental media is already available since 2017
A number of projects are being developed simultaneously at OECD to address different
environmental parameters For example a TG on dissolution rate in environmental media which purpose
is to develop and adequately validate a robust method in standardised conditions for dissolution of
nanomaterials Meanwhile also other relevant methods for dissolution rate testing in water and biological
fluids as well as transformation in the environment will be included in upcoming TG and GD for
nanomaterials In view of the current lack of harmonised methods this GD includes dissolution relevant
content based on available information in scientific literature and GD 29 (OECD 2001) also takes into
account the current draft document on dissolution rate in environmental media In doing so the GD
provides interim guidance on experimental steps and procedures of batch and dynamic flow-through
methods and decision support when to use them for nanomaterials (Chapter 2) until new TGs and GDs
become available When these OECD projects are finalised and TGs available an update of this GD might
be needed
This document provides guidance for the methods to address dissolution rate and dispersion
stability for nanomaterials with focus on environmental aqueous media The definition of nanomaterials as
having one dimension between 1 and 100 nm is generally accepted (ISO 2017a EU 2011) The guidance
provided here is relevant for solids in the nanoscale as well as their aggregates and agglomerates and it
focuses on their fate and behaviour in aqueous media In particular it presents the influence of various
experimental conditions on the performance and outcomes of the discussed methods In addition this GD
addresses modifications or additions to the methods and aims to give support for the interpretation of the
test results
Chapter 2 provides guidance for the determination of solubility and dissolution rate based on batch
test and flow-through methods as well as on how to evaluate and report the gained test results
Specific guidance on TG 318 is given in Chapter 3 including further experimental conditions than
described in the TG guidance to account for heteroagglomeration (section 33) and deriving attachment
coefficient(s) (section 34) In order to address the latter issues the state of the knowledge was included
from available scientific literature Furthermore guidance is provided on the interpretation and presentation
of data addressing the endpoint
The use of data generated by dissolution testing and testing of dispersion stability using TG 318
for possible further nano-specific fate and effect testing and assessment strategies is presented in Chapter
4 A testing strategy is presented in section 42 Furthermore influence of the two endpoints to each other
is discussed ie dispersion stability will influence dissolution rate and vice versa
1 Introduction
8 ENVJMMONO(2020)9
Unclassified
In Chapter 5 this GD provides recommendations on the use of output data from dissolution rate
and dispersion stability tests to derive input parameters for exposure models
Chapter 6 provides information on the use of this GD in relation to other OECD TGs and GDs
including the foreseen GD on aquatic and sediment toxicity testing (see section 65) and the foreseen GD
on the apparent accumulation potential of nanomaterials in fish (see section 67) As fate estimations of
nanomaterials in soil and sediment are challenging to conduct the GD also gives advice on screening
possibilities for dispersion stability and dissolution rates by varying the environmental conditions to mimic
those in soil and sediment (see section 68) and this is linked to the foreseen nano-specific GD to support
the implementation on the OECD TG 312 for nanomaterials safety
ENVJMMONO(2020)9 9
Unclassified
It is important to clearly distinguish between the terms solubility (the ability of a substance to
dissolve in a solvent) dissolution (the process under which a substance dissolves over time) and
dissolution rate (the amount of dissolved substance versus time) Solubility and dissolution rate of
nanomaterials are important to predict their fate and behaviour in the environment and for understanding
the changes in their bioavailability reactivity fate and toxicity Dissolution rates from nanomaterials are
particularly important in determining riskhazard since the rate of release of ionsmolecules prior to
interactioncomplexation with ligands may be more important than equilibrium concentrations
General methods for the determination of solubility and dissolution rate are available eg OECD
TG 105 (OECD 1995) Misra et al 2012 and ISO 19057 (ISO 2017b) All these methods feature different
advantages and disadvantages for nanomaterial testing So far no specific OECD TG is available for
determination of solubility and dissolution rate for nanomaterials However there are two WNT projects
underway one addressing Dissolution Rate of Nanomaterials in Aquatic Environment and a second on the
Determination of Solubility and Dissolution Rate of Nanomaterials in Water and Relevant Synthetic
Biological Media aiming to provide harmonised approaches for testing solubility and dissolution rate of
nanomaterials via static batch testing and dynamic flow-through methods respectively
In the existing OECD TG 105 (OECD 1995) two methods are described for the determination of
solubility of substances a static batch test and a dynamic test For determining dissolution (rate) of
nanomaterials the same set-up may be used with some modifications In addition the existing OECD GD
29 (OECD 2001) for metals and metal compounds may be applicable to some nanomaterials Scientific
basis for the flow-through method can be found in literature eg in Koltermann-Juelly et al 2018
21 Static Batch Test
Currently a draft TG is in preparation on Dissolution Rate of Nanomaterials in Aquatic Environment
This TG is based on OECD GD 29 (OECD 2001 Guidance Document on TransformationDissolution of
Metals and Metal Compounds in Aqueous Media) while making some nanospecific amendments Care
should be taken regarding the applicability of OECD GD 29 when considering the purpose of testing
solubility and dissolution rate of nanomaterials OECD GD 29 aims to provide supplemental information
for aquatic ecotoxicity testing of metal and metal compounds As indicated in OECD GD 29 ldquoThe intent of
the screening test performed at a single loading is to identify those compounds which undergo either
dissolution or rapid transformation such that their ecotoxicity potential is indistinguishable from soluble
formsrdquo As such the original purpose of OECD GD 29 is not to provide a harmonised approach to determine
solubility or dissolution rate to provide information on environmental fate Some of the pros and cons of a
static batch test as described in GD 29 are discussed in this section
The testing of nanomaterialsrsquo solubility and dissolution rate often goes beyond the scope of GD
29 For example GD 29 asks for testing the smallest available particle of a metal or metal compounds to
achieve maximum concentration of the dissolved ion of an investigated metal Inversely for nanomaterial
the solubility or dissolution rate of a specific nanomaterial under investigation is of interest which can differ
by eg available surface area or surface modification As another example the screening test in GD 29
requires test conditions where a metalmetal compound shows highest solubility For nanomaterials the
2 Testing of solubility and dissolution rate
10 ENVJMMONO(2020)9
Unclassified
testing of solubilitydissolution rate often relates to the question about the nanomaterialrsquos fate under certain
conditions (ie not necessarily the highest solubility)
For testing of solubility and dissolution rate the use of the 24 h screening test of GD 29 can still be
of interest for these questions and can be in principle applied depending on the nanomaterial properties
This seems to work at least for silver nanomaterials (Wasmuth et al 2016) For instance the screening
test can provide solubility limits (maximum amount of a solute that can dissolve in a solvent at a specified
temperature) for all nanomaterials and estimation of dissolution rate for sparingly soluble and slowly
dissolving nanomaterials However for determining dissolution rate the concentration of dissolved ions
needs to be measured over the time with short measuring intervals as long as steady state concentration
is not reached This is of particular importance for such nanomaterials that dissolves very fast ie within
a few hours
GD 29 prescribes a 020 microm filtration method for separating dissolved and non-dissolved
compounds This is not appropriate for nanomaterials that have individual particles or aggregates that are
usually smaller than this size cut-off so further separation is needed ISO 19057 (ISO 2017b) reviews
separation techniques that are applicable for nanomaterials related to in vitro biodurability testing
For the screening test the OECD GD 29 proposes the use of reconstituted standard water with pH
range between 6 to 85 (ie water of known composition for details on media composition see OECD GD
29) However in principle and based on the purpose of the testing the 24 h screening test can be also
performed under different media conditions (eg ecotoxicity media natural water simulated media
according to TG 318) Anyway it is essential to characterise and report test media characteristics as
detailed as possible as media composition influences nanomaterialrsquos dissolution (Misra et al 2012)
Reporting should include at least pH at start after equilibrium time and the end of testing ionic strength if
possible the presence and the concentration of polyvalent ions and the composition and concentration of
DOC (Dissolved Organic Matter eg NOM (Natural Organic Matter)
If the nanomaterial fully dissolves during the test duration the solubility limit of the nanomaterial is
equal or higher than the applied starting concentration Therefore starting concentration of the investigated
nanomaterial has to be high enough to determine the solubility limit If the solubility limit is not reached
within 24h the test duration can be prolonged in principle However this will not change the general
statement about the solubility of a nanomaterial (eg poorly or highly soluble) When performing the batch
test for determination of dissolution rate the following aspects should be considered The ion concentration
in the test media may increase to such an extent that the apparent dissolution rate will reduce This is
caused by a too long observation period (as measuring points will become too far apart and result in a
slow increase of the straight that represents the dissolution rate) Here shorter measurement intervals can
provide a corrective Derivation of dissolution rate is not possible for those nanomaterials that show such
a rapid concentration increase of the dissolved fraction during testing which cannot be resolved by
measurement
Speciation calculations can be useful for the investigated nanomaterial to estimate its general
tendency of dissolution in the used test media eg using the freely available software Phreeqc (The
software PHREEQC (ver 3 from the United States Geological Survey
httpswwwusgsgovsoftwarephreeqc-version-3 or VMinteq (httpsvminteqlwrkthse) When
dissolution tendency is calculated by such software the full characteristic of the test media should be used
As the various existing databases which exhibit data on substance properties specifications and on media
characteristics for calculation have different level of information it should be verified that the chosen
database contains relevant information for the case under consideration However not all nanomaterials
are covered by existing data base entries
Three main methods exist in the literature to separate nanomaterials and their aggregates from
their dissolved fraction ultra-centrifugation dialysis and centrifugal ultrafiltration Research has shown that
filter pore sizes of 01 to 002 μm could be suitable for separation of some nanomaterials from dissolved
ENVJMMONO(2020)9 11
Unclassified
species (Juumlnemann and Dressman 2012) by filtration As retention depends also on the filter material this
should be reported together with filter pores size in case filtering was used for nanomaterial separation To
reveal possible artefacts (eg nanomaterials sticking to filter membranes) mass balance between the
amount of nanomaterial initially introduced the retained and passed fraction can be useful
Ultra-centrifugation is not recommended for several reasons Firstly it is difficult to calculate the
optimal centrifugal settings (speed and time) to guarantee complete centrifugation of nanomaterials
especially for the case of non-spherical particles and when the rotor has no swing-bucket design but is eg
a fixed angle rotor Secondly theoretical optimal centrifugal times are often long relative to the dissolution
rate especially in the case of relatively small nanomaterials or nanomaterials with low density For those
nanomaterials proportionally long centrifugation times are needed to be separated them from their
dissolved ions At the same time they might dissolve faster compared to larger nanomaterials of the same
composition A too slow separation technique thus hampers the determination of relatively fast dissolution
rates Also often the accurate density of the investigated nanomaterial (eg nanomaterials with
coatingligands) is not known and it is difficult to calculate the correct speed settings Finally back-diffusion
of centrifuged nanomaterials into the centrifuge vial during sampling is likely and may cause artefacts of
overestimating dissolution To minimise sampling of back-diffused nanomaterials it is therefore
recommended to sample just below the surface
Dialysis is also not recommended for separating nanomaterials and their dissolved substances In
this technique nanomaterials are suspended in a medium within a dialysis bag Dissolved substances thus
need to diffuse through the dialysis membrane into a second compartment where they can be sampled for
quantification of the dissolution rate This process may again be too slow compared to the dissolution
process itself (see eg Franklin et al 2007) Furthermore it is difficult to determine if any sample gets
stuck to the tubes Thus the sample that finally reaches the dialysis bag might not be the same as
introduced
Centrifugal ultrafiltration is the recommend method for separating nanomaterials and their
dissolved substances taking into consideration specific measures (see paragraph 24) Here a mixture of
nanomaterials and their dissolved substances are injected in centrifugal ultrafiltration devices During
centrifugation nanomaterials and dissolved substances and the test medium are transported towards an
ultrafiltration membrane through which nanomaterials cannot pass while their dissolved substances can
The dissolved substances can then be measured in the filtered media
The pore diameter of ultrafiltration is expressed in terms of molecular weight cut-off (MWCO) ie
the molecular weight of different molecules in the filtration process (usually dextran or polyethylene glycol)
that are retained for 90 by the membrane (Ren et al 2006) There is also a pore size distribution rather
than a single pore size For separation a MWCO between 3-10 kDa is recommended This MWCO value
corresponds with pore sizes between 2-3nm (Ladner et al 2012) However care should be taken as the
use of low MWCO filter membranes can lead to a built up of ions in front of the filter This results into a
measurement of a lower dissolution rate Depending on the properties of the nanomaterials their ions and
the membrane properties adsorption of the nanomaterial andor the ions to the filtering membrane can
occur Furthermore media compounds like NOM can block the membrane In such a case filter with
MWCO values above 10 kDa may be useful considering that individual nanomaterials can pass the
membrane too
The centrifugal speed and time required to drive a sufficient amount of aqueous solution containing
dissolved species to cross the membrane depends on the MWCO and hydrophobicity of the membrane
as well as the chemistry of the medium The centrifugal settings should be optimized to achieve a filtrate
volume sufficient for subsequent measurement Prewashing of the filter membrane by centrifuging
ultrapure water through the membrane is prerequisite for any filtration step to remove dissolved chemicals
that could influence the dissolution process Modifying or pre-treating the membranes can be used if
significant issues are observed eg binding to the membrane (Cornelis et al 2010 Hedberg et al 2011)
12 ENVJMMONO(2020)9
Unclassified
Prior to use a centrifugal filtration device should be evaluated concerning the interaction with the
investigated nanomaterial This can help to assess possible loss of ions and to avoid an underestimation
of dissolution rate (Kennedy et al 2010)
In principle the batch test procedure may also be applicable for testing non-metal nanomaterials
but the current analytical possibilities still limit these options The selection of an analytic method needs to
include considerations of eg the detection limit of the method in relation to the investigated nanomaterial
or the necessary effort to distinguish between the investigated nanomaterial and the media compound
(eg NOM and carbon-based nanomaterials) Therefore the decision on an appropriate analytic method
currently can only be done case-by-case
22 Dynamic testing of dissolution rates
An OECD project under development on the determination of solubility and dissolution rate of
nanomaterials in water and relevant biological media aims to include two different methods both a static
batch test and dynamic dissolution testing by a flow-through system The method applied for a flow-
through dissolution test is based on the amended Continuous Flow System mentioned in ISO TR 19057
(ISO 2017) Here simulated media is continuously pumped from a reservoir through a cell containing a
nanomaterial samples After the media has passed the nanomaterial sample the solute concentration in
the fluid can be measured The method was applied in the past to determine the bio-durability for mineral
fibre and its applicability to nanomaterials was presented by Koltermann-Juelly (2018) for the dissolution
of 24 (nano)forms of 6 substances (Figure 1 below) for various human lung fluids and by Bove et al (2018)
for various gastro fluids
Figure 1 Possible experimental setup for flow-through testing (from Koltermann-Juelly et al (2018))
(UHMWPE = Ultra High Molecular Weight Polyethylene)
In principle the dynamic method can be adapted to measure dissolution rate in environmental
media However depending on the purpose test conditions might need to be adapted for differences in
environmental compared to biological media Apart from differences in test media composition (eg pH
ionic or organic compounds) considerations for adaptation include applied test concentration flow rates
and test duration For instance for the determination of dissolution rate under environmental relevant
ENVJMMONO(2020)9 13
Unclassified
conditions considerably different concentrations (eg media composition temperature) and flow rates (first
suggestion microg and 1 mlmin) should be used compared to those used for the dissolution testing in biological
media (mg and 2 mlh) thus saturation effects are unlikely to occur
The dynamic dissolution test should mimic the condition in a natural water where the nanomaterial
is highly diluted and freely diffusing The dissolution rate of intermediate and highly soluble materials is
among other parameters controlled by the thickness of the boundary layer surrounding the nanomaterial
and the concentration gradient of dissolved ions in the boundary layer For those nanomaterials the
transport of ions away from the particle surface is a limiting factor The flow rate in the experiment should
ideally mimic those conditions With 2 mlh saturation effects have been observed with BaSO4 at 1 mLmin
these effects are reduced but not totally prevented Flow rate and test conditions can be in principle
modified to mimic other specific environmental relevant conditions For comparing the dissolution rate of
different nanomaterials the chosen test conditions for those nanomaterials should be the same
With current scientific knowledge and the co-dependence of the dissolution rate on solubility
thickness of the nanomaterialrsquos boundary layer and specific surface areaparticle size exact cut-off values
for applying a dynamic dissolution test cannot be given From current experiences the dynamic test would
be suggested if the solubility of the nanomaterial is between 01 and 10 mgL For most of these
nanomaterials constant values for dissolution rate were achieved within less than 12 hours Values for
dissolution rate should be determined with sufficient narrow measurement intervals until constant values
are achieved The investigation of nanomaterials with lower solubility is currently limited by the ability to
detect the low concentration of released ions The applicability range of the method may be broadened
when test conditions such as flow rate and amount of material in the test are adapted to the solubility of
the material
In addition the test procedure can be adapted in such a way that the application of the investigated
nanomaterial can be injected directly as a dispersion into the system at a location between the pump and
the filter membrane (MWCO between 3-10 kDa) A schematic overview of the dynamic test system is
presented in Figure 2 Filter membranes with low MWCO can help to avoid the passage of small particles
However care should be taken as the use of low MWCO filter membranes can lead to a built up of ions in
front of the filter This results into a measurement of a lower a dissolution rate (see also paragraph 20 and
24)
Similar to the batch test in principle the flow-through test procedure may also be applicable for
testing of non-metal nanomaterials but the analytical possibilities still limit these options In consequence
the selection of an analytic method also needs to include considerations of eg the detection limit of the
method in relation to the investigated nanomaterial or the necessary effort to distinguish between the
investigated nanomaterial and the media compound (eg NOM and carbon-based nanomaterials) Thus
as for the batch test the decision on an appropriate analytic method currently can only be done case-by-
case
14 ENVJMMONO(2020)9
Unclassified
Figure 2 A draft scheme for dynamic testing of dissolution rate (von der Kammer 2018 personal
communication Stetten et al in preparation) (P = pump IV = Injection Valve)
23 Data evaluation and reporting from dissolution testing
The mass concentration of the dissolved fraction should be measured during the test and plotted
versus time The result of the solubility test has to be expressed as mgL of the ions formed as a
consequence of dissolution Expression of solubility in alone (without also providing results in mgL) is
discouraged as this is difficult to interpret and to compare with other data
For most existing nanomaterials dissolution follows (pseudo-)first order kinetics In a given
medium the determined dissolution rate expressed initially as increase of dissolved ions concentration
per time (mg L-1s-1) will depend on the initial mass of nanomaterial in the test the specific surface area
of the nanomaterial the solubility of the nanomaterial and the test conditions (shaken stirred or not
agitated at all) This can be calculated to the loss of solid nanomaterial over time and expressed as
Equation 1
Dissolution rate =119889m
119889t= minus119896diss ∙ m
where m is mass of the nanomaterial t is time and kdiss is dissolution rate constant The dissolution rate
is of interest in most cases However a value given as mg L-1s-1 is of little use because this value will
depend largely on the initial mass of the nanomaterial in the test system Hence the dissolution rate should
be normalised to either the mass or the surface area of investigated nanomaterial Both have different
characteristics Results normalised to mass would only be valid for the investigated nanomaterial
Dissolution rates normalised to mass cannot be transferred to other forms of the same substance (eg of
different specific surface area or different particle size) For this purpose dissolution rate normalised to
surface area will provide a remedy The dissolution rate should be expressed as mg kg-1s-1 or preferably
when specific surface area of the material is available as mg m-2s-1 Since the dissolution rate is depending
ENVJMMONO(2020)9 15
Unclassified
on the solubility of the nanomaterial the available surface area of the nanomaterial in the test system and
the countering concentration of surrounding dissolved ions of the nanomaterial the rate can be derived by
using the Noyes-Whitney equation
Equation 2
Dissolution rate =119889m
119889t= (D ∙
A
h) ∙ (cS minus c)
where D is the diffusion coefficient of the dissolved species in the medium A is the surface area of the
nanomaterial h is the thickness of the diffusion layer cS is the saturation concentration (solubility limit)
and c is the concentration of dissolved ions in the test medium The thickness of the diffusion layer will be
dependent on the test condition eg the composition of test media or potential agitation of the nanomaterial
during the test performance and can only be estimated what limits the applicability of the approach
It should be noted that there are nanomaterials that might follow zero or second order dissolution
kinetics and thus it has to be reviewed how models relate to nanomaterials of different shape and surface
area Care should be also taken for nanomaterials with broad size distribution as the smaller particles tend
to dissolve faster than the larger ones This could lead to an incorrect choice of fitting models or impede
the application of a correct reaction order at all
Based on the dissolution rate constant halftime (when half of the nanomaterial is left and half is
dissolved) can be estimated (for information on calculation model see eg chapter 115 of ISO 2017b)
Results on solubility and dissolution rate have to be reported together with test conditions like
media composition temperature test duration and characteristics of the investigated nanomaterial (eg
size distribution shape and composition including information on surface coatingmodification) Regarding
environmental exposure modelling one of the important nanomaterial characteristics required is the
dissolution rate constant (kdiss) and not the dissolution rate itself The use of kdiss for exposure modelling is
discussed in Chapter 5
16 ENVJMMONO(2020)9
Unclassified
OECD TG 318 (OECD 2017) describes a method for determining the dispersibility and dispersion
stability of nanomaterials in aqueous media of different yet environmentally relevant hydrochemistry A
prerequisite for the experimental approach was to enable the investigation of the dispersion behaviour in
a small number of relatively simple tests within a time frame suitable for standard laboratory routine The
hydrochemical conditions in the tests cover those parameters and parameter ranges which are (a)
representative for natural waters and (b) are recognized drivers for agglomeration of nanomaterials within
the concentration range of the TG (Monikh et al 2018) Hence the composition of the test media reflects
only those compounds in surface water that are relevant for the agglomeration process and in a
concentration range where they can become relevant
Dispersion stability as measured using TG 318 actually determines homoagglomeration
(attachment of nanomaterial to each other) under consideration of environmental parameters which have
a major influence on the dispersion stability of nanomaterials over a fixed time-span of 6 hours This
enables a direct comparison of nanomaterials with each other and how they will behave in test systems
For comparison with media which differ in composition from the test media in TG 318 the agglomeration-
relevant compounds in the media should be compared These are the concentrations of divalent cations
and anions the pH and the concentration of natural organic matter
The kinetics of the homoagglomeration processes are depending on the number concentration of
the nanomaterials and the progression of agglomeration To be able to directly compare results among
different nanomaterials and also to finish the test over a period of 6 hours the starting concentration must
be set to a fixed particle number concentration In this way the agglomeration process is almost
independent of particle size and density Comparisons have shown that the starting concentration in
particle number of 1012 particlesL should not vary more than one order of magnitude between different
nanomaterials (ie roughly plus or minus half an order of magnitude) To obtain the required mass
concentration of the nanomaterial the mass concentration of the nanomaterial in the stock dispersion has
to be converted into particle number concentration by using the average particle diameter and material
density as described in TG 318 It is acknowledged that especially for nanomaterials with a broad size
distribution the average particle size will not convert correctly into the particle number concentration
However the influence on the test outcome appears to be small (order of magnitude accuracy required)
so that the additional effort for precisely determining the particle size distribution and considering it in the
number calculation appears not necessary However if precise data on the particle size distribution are
available it is advised to use this information For an example see Figure 3
3 Testing of dispersion stability with TG 318
ENVJMMONO(2020)9 17
Unclassified
Figure 3 Example of experimental data over the test period of 6 h for TiO2 NM-105 nanomaterials
under stable (0 mM Ca(NO3)2 open squares) and destabilizing (5 mM Ca(NO3)2 filled circles)
conditions and two different starting particle number concentrations (1010 and 1012 particlesL)
affecting agglomeration kinetics (Monikh et al 2018)
With progressing agglomeration and sedimentation of the agglomerates the concentration in the
supernatant will decrease over time The sedimentation velocity and thus also the removal of nanomaterial
from the supernatant by sedimentation is depending on many factors eg the density of the primary
particles the apparent density of the formed agglomerate the structure of the agglomerate the surface
chemistry and how the water flows around or through the agglomerate To eliminate at least the effect of
density the last step after 6 hours is a centrifugation step where the run conditions of the centrifugation
are set to achieve a size cut-off at gt 1 microm TG 318 describes how to calculate the centrifugation conditions
and an Excel spreadsheet-tool is accompanying TG 318 for those calculations After the centrifugation
step the remaining concentration of the nanomaterials in the supernatant of the dispersion is analysed
The centrifugation step after 6 hours is best suited to compare different materials with each other while
the hourly measurements between 1 to 5 h show the behaviour of the material in a water column
Apart from the intrinsic properties of the nanomaterial the composition of the medium is the driver
for the stabilisation or destabilisation of the dispersions Therefore the test considers the concentration
ranges of the composition of natural waters that are dominating this process and are sufficiently abundant
in natural waters to become relevant in the process ie divalent ions natural dissolved organic matter and
pH (Ottofuelling et al 2011) The concentration ranges of these compounds were set to represent about
95 of the conditions found in natural waters The various effects of different media components on
dispersion stability are listed in Table 1
18 ENVJMMONO(2020)9
Unclassified
Table 1 Role and effect of the selected components in the synthetic water The Table shows representative compounds in natural water that mainly influence nanomaterialrsquos stability in aqueous media Furthermore it highlights the effects of these compounds on the stability of nanomaterials and the strength of these effects as well as the abundance of the compounds in natural water
compound represents effect effect
strength
abundance
Na+ monovalent
cations not
included
destabilisation low medium
Ca2+ divalent cations destabilisation
stabilisation when adsorbing to surfaces of
positively charged materials
medium high
Mg2+ divalent cations
less complexed
by NOM
destabilisation
relevant when NOM is high and complexes
Ca2+
low low
NO3- monovalent
anions
destabilisation
non-adsorbing
non-complexing
low low
SO42- divalent anions destabilisation especially positively charged
particles
medium medium
Al3+ trivalent cations
not included
destabilisation high very low
SR-NOM dissolved organic
matter
stabilisation through surface adsorption with
electrostatic (negative) and steric effect charge
reversal (positive to negative) through
complexation of destabilising cations
destabilising when adsorption to positive
surfaces reduces net charge of surfaces
high medium
A decision tree is presented in the TG 318 to determine whether the nanomaterial of interest
requires only a screening procedure or if an in-depth testing has to be performed The decision tree allows
nanomaterials to be categorised as generally stable in dispersion under all test conditions non-dispersible
or dispersible depending on the hydrochemical conditions The screening test is performed in the presence
of natural organic matter which will generally stabilise most nanomaterials against agglomeration This
will put many nanomaterials into the category ldquodispersible no detailed testing in TG 318 necessaryrdquo
The NOM added to the test vial has three roles in the test (a) it acts as a pH buffer stabilizing the
adjusted pH especially at pH 9 (b) it complexes Ca2+ and reduces thereby the activity of the destabilising
Ca2+ ion (c) it adsorbs to the surface of the nanomaterial and adds to the negative charge density thereby
reducing the net positive charge that can lead to destabilisation If present in sufficient amounts it
eventually may reverse the charge to negative and can increase the magnitude of the negative charge
density The amount of NOM to be used is standardised to 10 mgL DOC in 40 ml (400 microg DOC) and a
calculation tool for the required minimum DOC is provided in the TG 318 It should be considered that
under certain conditions (eg NOM composition) NOM can lead to a destabilisation In addition some
nanomaterials may not adsorb to NOM under surface-water like conditions (Hedberg et al 2017a Hedberg
et al 2017b Pradhan et al 2017)
Applicability of TG 318 for different nanomaterial types should be considered based on the
available data on similar nanomaterials eg based on their size and shape (spherical rod platelets fibre-
like) Three considerations are important to judge a priori if the test can be applied to a nanomaterial (a)
ENVJMMONO(2020)9 19
Unclassified
the nanomaterials density must be gt 1 gcmsup3 (b) the mass concentration calculated for the required particle
number concentration must be at least 10 times above the quantification limit of the analytical method (c)
an analytical method with sufficient sensitivity for the nanomaterial or an equally distributed component is
required The requirement (b) stems from the consideration that even with 90 removal from the water
column the nanomaterial should still be quantifiable in the supernatant Especially for small low density
particles the mass concentration originating from the recommended number concentration might
challenge the ICP-OES based methods and at some point also routinely operated ICP-MS methods The
required quantification limit (10 of initial concentration) for a SiO2-NP of 15 nm would be ~02 microgL (Si)
Regarding the analytical approach to quantify the nanomaterials in the supernatant in principle any
methodinstrument (eg ICP-MS GFAAS polarography) can be applied which offers the required
detection limits for the nanomaterial or a relevant component of it Besides a dispersion stability
measurement zeta potential as calculated from electrophoretic mobility can provide an indicator for
nanomaterial stability Measurement of zeta potential over time could provide indications for heterogenous
nanomaterials (like Figure 7c) However this method will not provide information on the amount and
behaviour of the (un-) stable fraction
As an alternative method to determine dispersion stability TG 318 provides information on the
measurement using UVVIS photometry The continuous monitoring of the agglomerationsettling process
in a UVVIS photometer will yield to quantitative different results compared to the standard test procedure
of TG 318 This is due to a different detection principle a different location of analysis (close to the bottom
of the vial and not at the top of the supernatant) and different test vessel size and geometry Also the
centrifugation step is missing and therefore low-density nanomaterials could agglomerate without being
settled out A direct comparison of quantitative results obtained from both methods is therefore impeded
Changing cuvettes could multiplex the experiment giving the opportunity of several parallel tests
in cuvettes and placing them in the spectrometer one after the other for absorbance determination
However moving the cuvettes can disturb the settling process and introduce errors
The wavelength of the UVVIS signal needs to be in correlation with the properties of the
investigated nanomaterial It should be noted that the change of absorbance can be caused by processes
other than settling-out of agglomerates When the nanomaterial agglomerates the change in size
distribution also changes the optical density and hence the absorbance reading even before settling starts
Dissolution would reduce the absorbance without agglomeration taking place This would underestimate
the stability contrary to the standard test with determination of the remaining fraction in the supernatant
where dissolved ions would lead to an overestimation of stability in case the dissolved fraction is not
quantified Transformation of the nanomaterial might reduce eg the plasmon resonance of metallic
nanomaterials and incorrectly decrease the absorbance reading Therefore it should be evaluated with
care if measuring dispersion stability using UVVIS spectroscopy is an appropriate approach for the
investigated nanomaterial
31 Data presentation and evaluation for TG 318
When the dispersion stability of a nanomaterial is tested according to TG 318 either the screening
test is already sufficient or a full testing is required
There are various ways to present the outcomes of the screening test or to visualize the influence
of electrolyte concentration pH and presence of NOM Examples of data presentation from dispersion
20 ENVJMMONO(2020)9
Unclassified
stability studies using TG 318 are shown in Figure 4 5 and 6 A spreadsheet tool1 is accompanying this
GD to facilitate such a harmonized presentation of the data
Figure 4 shows a schematic example on dispersion stability for results of the screening test with
the three possible outcomes according to the TG 318 decision tree
In Figure 5 the output of the tool for illustrating the full testsrsquo results (following Monikh et al 2018)
is presented Here the results are presented in a three-dimensional matrix considering various
hydrochemical conditions and the resulting dispersion stability Higher colloidal stability (less
agglomerationsedimentation) is reflected by a higher remaining concentration (brighter shade in the plots)
in the dispersion relative to the starting concentration (0-100)
The full test provides information on dispersion stability and the underlying processes leading to
the removal from the water column can be elucidated Figure 6 presents an example of a dispersion
stability plot of the full test for one test condition where the dispersion stability measured at each hour is
plotted over the time Possible interpretations of removal processes based on the removal function are
shown in Figure 7 The interpretations shown here may also help designing testing strategies (Section 4
of this GD)
Besides usual information on test material and test media data reporting from the UVVIS method
should include details of the UVVIS method (instrument type detection wavelength in nm type of cuvette
used) the recorded absorbance over time profile and the remaining fraction after 24h given as absorbance
reading after 24h divided by the absorbance reading at the start of the test
Figure 4 Example outputs from the spreadsheet tool for the screening test at different Ca2+ concentrations (y-axis) and pH-values (x-axis) in the test medium (The numbers in the boxes indicate the of initial concentration of the test material left in the supernatant at the end of the test) Left panel all tests are completed with ge90 of the nominal (initial) concentration left in the supernatant after 6 h (indicating high stability) Middle panel some conditions lead to stable (ge90 ) some to intermediate stability (ge10 and le 90) further testing is required in a full test Right panel all conditions lead to ge 90 sedimentation from the water column (le10 stability) indicating an unstable nanomaterial under tested conditions A green tick indicates those cases where a nanomaterial is highly stable and a red cross where a nanomaterial is unstable under the respective conditions A yellow exclamation mark indicates cases were a nanomaterial shows intermediate stability
1 Link to Excel sheet tool
httpwwwoecdorgchemicalsafetytestingExcel_ENV_JM_MONO(2020)9xlsx
ENVJMMONO(2020)9 21
Unclassified
Figure 5 Dispersion stability regarding different environmental conditions (Ca2+ concentration y-axis pH-value x-axis) Higher stability (less agglomerationsedimentation) is reflected by a higher remaining concentration of test material (brighter shade in the plots) in the dispersion relative to the starting concentration (0-100) The numbers in the boxes represent the percentage of the nanomaterial remaining in the dispersion thus the dispersion stability in (from Monikh et al 2018)
22 ENVJMMONO(2020)9
Unclassified
Figure 6 An example of dispersion stability plot as percentage of nanomaterials remaining in water phase compared to initial concentration (y-axis) against time in hours (x-axis) of the full test for one (here not further specified) test condition The closed data point at 0 hours represents the nominal concentration and the open data point at 0 hours is the measured concentration at the start (evoked by eg incomplete dispersion fast sedimentation or loss to vessel see paragraph 25 of OECD TG 318) The closed data point at 6 hours represents the measured concentration before the centrifugation step while the open point represents the measured concentration after the centrifugation step Differences between the measured concentrations at point 6 hours are caused by density effects (see also Figure 7B) The values are normalised to the nominal concentration at 0 hours
ENVJMMONO(2020)9 23
Unclassified
Figure 7 Possible shapes of the removal function over time and suggested interpretations
32 Alternative test conditions
TG 318 covers only synthetic waters that resemble the bandwidth of agglomeration-relevant
components found in surface waters In principle TG 318 can also be performed with other media than
those used in TG 318 eg ecotoxicological test media When using any other test media it should be
assured that the addition of the nanomaterial to the medium does not significantly change media
conditions eg the pH A good estimate can be drawn from results of TG 318 with synthetic waters if the
agglomeration-relevant components of the test media (sum of divalent cations sulphate) are comparable
with TG 318 conditions (the full test without NOM) When using alternative test conditions compared to
TG 318 it is of utmost importance to characterise and report the test media compositions and conditions
and also to compare those with test media compositions and conditions of TG 318 for the data evaluation
and interpretation This will also enable retrospective analysis of studies compared with new data produced
in the future
TG 318 can be used with natural waters to investigate the dispersion stability and agglomeration
behaviour in these waters To prevent a situation where homo- and heteroagglomeration takes place in an
uncontrolled way the water sample should be filtered over a filter membrane with pore size equal to or
smaller than 01 microm or subjected to ultracentrifugation to remove all sorts of natural particles
microorganisms microm-sized debris colloids and nanomaterials from the sample It should also be taken into
account that the obtained result is a (very precise) descriptive value for this one sample only representing
24 ENVJMMONO(2020)9
Unclassified
a unique and constantly changing situation regarding hydrochemical composition and type and
concentration of NOM Whether it is possible to transfer this one result to the sampled surface waterbody
in general depends on the spatial and temporal variability of the waterbody If the unfiltered sample shall
be tested with TG 318 the presence of natural suspended particulate matter will make it necessary to apply
the variant of TG 318 that deals with heteroagglomeration (see section 33)
The transferability of the data from TG 318 studies to higher tier testing (eg ecotoxicological
studies) should be carefully evaluated as the used simulated environmental media differs from
ecotoxicological test media which aims to promote animal vitality rather than to mimic natural habitats
When possible it would be beneficial to test the dispersion stability with TG 318 using the test media used
in the ecotoxicological test as recommended in the OECD draft GD for Aquatic (and Sediment)
Toxicological Testing of Nanomaterials (WNT project 251) However in many ecotoxicological tests the
test organism will change the test media composition eg by algal exudates or photosynthesis in a 72
hours algae toxicity test according to TG 201 This will result in pH shift various ionic compositions and
different NOM characteristics and thereby lead to changes in dispersion stability as well as dissolution
rates
NOM has an enormous variability in structure molecular weight distribution conformation
composition and purity The type and quality of the used NOM or even NOM in natural waters or test media
with intrinsic NOM will have effects on dispersion stability This should be taken into account for data
evaluation and when choosing test conditions that represent environmental relevant conditions One has
to distinguish between processed commercial products resembling NOM or unprocessed natural NOM as
part of a natural water sample The commercial products are more or less close to reality regarding their
properties and are more likely to enable repeatability of the results In contrast natural NOM might trigger
a behaviour of the nanomaterial (eg formation of ldquoecological coronardquo) that is linked to the composition of
the NOM which might be very unique in time and space and not fully resemble the surface water the NOM
was sampled from In TG 318 2R101N Suwannee River NOM (SRNOM) is recommended as standardised
and purified material Due to differences in the composition of NOM from different sources it is difficult to
compare results obtained by the use of different types of NOM Therefore the alternatively used NOM
should be characterised as much as possible at least the minimum DOC content after properly cleaned
from ions and ash should be determined DOC content and treatment should be reported together with the
test results It is advisable to always test the nanomaterial according to the conditions presented in TG 318
in order to obtain comparative ldquobenchmarkrdquo data
There are nanomaterials that are extremely hydrophobic and thus not miscible with aqueous
media For those nanomaterials the use of a dispersion agent (eg surfactants) could help to enhance the
dispersibility in the stock dispersion However such an approach won`t deliver data on the dispersion
stability of the pristine material Depending on the scope of testing the use of a dispersion agent for the
dispersion stability testing could help to understand the fate of extremely hydrophobic nanomaterial when
entering into the aquatic environment together with a dispersion agent (eg from a product)
33 Testing of heteroagglomeration
The heteroagglomeration of nanomaterials with suspended particulate matter (SPM) which is
ubiquitous in natural surface waters is a crucial process affecting the environmental transport and fate of
nanomaterials (Praetorius et al 2014a Quik et al 2014 Therezien et al 2014 Gao and Lowry 2018)
Many studies report measurements of different endpoints reflecting heteroagglomeration
behaviour (eg agglomeration rate sedimentation attachment efficiency) with diverse nanomaterials
under various conditions (eg Praetorius et al 2014a Labille et al 2015 Velzeboer et al 2014 Huynh
et al 2012 Quik et al 2014 Geitner 2017 Barton et al 2014) However the heteroagglomeration
ENVJMMONO(2020)9 25
Unclassified
attachment efficiency (αhetero for definition see section 34) has been found to be the most suitable
parameter to inform fate modelling and risk assessment (Praetorius et al 2014b)
The need for consideration of heteroagglomeration as an aspect of nanomaterial fate has been
discussed already during the development of TG 318 (Baun et al 2017) TG 318 is in principle fit for
purpose to also investigate heteroagglomeration and roughly estimate αhetero However methods are not
yet progressed enough to develop a fully validated TG for heteroagglomeration testing Thus based on
the available scientific knowledge and methods guidance for heteroagglomeration testing and
presentation of data is provided in this GD Necessary considerations and modifications of the test setup
are explained in the following paragraphs
A major necessary adaptation of TG 318 to test for heteroagglomeration is the addition of SPM as
agglomeration counterpart Due to the complexity and diversity of natural SPM and the number of possible
interaction mechanisms of nanomaterials with it it seems on one hand impossible to decide on a
representative set of SPMs for standardisation On the other hand restricting the types of SPM (eg to a
simple mineral analogue) could lead to disproportional uncertainty in the estimation of αhetero values (Walch
et al in preparation)
Nanomaterial attachment to SPM results in a change of their transport regime (Hofmann and von
der Kammer 2009) and possibly their bioavailability Thus the determined αhetero has to be precise enough
to be able to estimate the necessary timeframe (seconds-hours days-weeks months or more) until the
majority of free nanomaterials has become SPM-attached nanomaterials In most cases an orders-of-
magnitude based category of αhetero (eg ldquolowrdquo ldquomediumrdquo and ldquohighrdquo) will be sufficient to address this
point Such αhetero categories can serve as indicators for the expected half-life (t12) of free nanomaterials
under certain conditions (eg SPM concentrations) An example for CeO2 is shown in Table 2 (Walch et
al 2019) In multimedia fate modelling a similar regime of sensitivity to αhetero for predicted environmental
concentrations is observed (Meesters et al 2019) For further explanation see paragraph 71
Table 2 Relationship of attachment efficiency (αhetero) and expected half-life (t12) of free nanomaterials (5ppb CeO2 d = 25nm) in presence of 1-150ppm SPM (Walch et al 2019)
heteroagglomeration
attachment efficiency
expected free nanomaterial (5 ppb CeO2 d =25 nm) half-life range
for 150 ppm ndash 1 ppm SPM (dn =15 microm ρ =15 gcmsup3)
αhetero asymp 01 - 1 t12 asymp seconds ndash 1 day
αhetero asymp 001 t12 asymp hours ndash days or (few) week(s)
αhetero asymp 0001 t12 asymp day(s) ndash month(s)
αhetero asymp 00001 t12 asymp week(s) ndash (few) year(s)
The hydrochemical background conditions suggested in TG 318 with regards to electrolyte
compositions and concentrations can be equally applied to heteroagglomeration as the mechanistic
principles are the same It is however suggested to use the ldquoalternative mediumrdquo as indicated in TG 318
including SO42- to cover the effects of divalent anions on agglomeration especially if one of the components
(SPM or nanomaterials) is expected to display a positive surface charge
Obviously the introduction of an agglomeration counterpart into the test system is required
Hence selecting suitable SPM analogues is the first crucial step Such analogues need to be stable (for
the test duration) reproducible (among test runs) monodisperse and well characterised in terms of
composition size (size distribution) shape and density (to allow a good approximation of the number-
based SPM concentration needed for estimation of αhetero see section 34 The options may range from
very simple mineral analogues (eg quartz particles) up to the use of well-characterised natural samples
26 ENVJMMONO(2020)9
Unclassified
(eg river waters or sewage sludge) and the choice of a relevant SPM type depends on the aim of the
study
For a general comparative assessment of nanomaterials with regards to their heteroagglomeration
behaviour in freshwaters a simple mineral analogue would be too simplistic whereas natural water
samples do not allow for generalisations Therefore in an EU project ldquoNanomaterial Fate and Speciation
in the Environmentrdquo (NanoFASE) researchers aimed to create a ldquomodel SPMrdquo (complex floc-like SPM
analogues that represent process-relevant characteristics of natural SPM) and a standard procedure for
its production These SPM flocs are composed of naturally occurring minerals selected based on a trade-
off between representing the dominant mineral mass fractions and covering a broad range of
physicochemical surface properties (eg surface charge) in realistic mixing ratios which are typically
encountered in natural freshwater SPM The mix includes quartz illite hematite and organic
macromolecules associated with microbial activity (Walch et al in preparation) This could be one
ldquostandard SPMrdquo to be used in the test with regards to the requirements for suitable SPM analogues
mentioned above
In order to assess the fraction of ldquofreerdquo not heteroagglomerated nanomaterials after a certain or
several (necessary to estimate α values) specified interaction time(s) a separation step needs to be
introduced Separation should be fast and non-intrusive to allow removal of the SPM-attached
nanomaterials from suspension while minimising artefacts on the ldquofreerdquo nanomaterial fraction That can be
achieved by centrifugation at each time interval If the analytical detection limits allow dilution before
centrifugation helps to avoid non-attached nanomaterials being removed via ldquoscreeningrdquo by the SPM during
centrifugation Gravitational separability of nanomaterials and SPM hence becomes a prerequisite
meaning that the size andor density of the SPM needs to exceed that of the tested nanomaterials to an
extent at which (at a selected centrifugation speed and time) the SPM will be removed from suspension
while free nanomaterials will not This can be ensured by employing centrifugation cut-off calculations and
verified by preliminary testing If significant sedimentation of the SPM over the test duration is likely
agitation by shaking or stirring during the reaction time might be necessary However it cannot be ruled
out that shaking and stirring affects the apparent rates of heteroagglomeration Stirring should be effected
in a controlled way to allow at least an approximate calculation of shear forces in the system (shear rate
G) which is needed for collision frequency calculations (see equation 4 in section 34 below) Principles of
stirred batch reactor design (Zlokarnik 2001) can be applied Changes in shear force from ~40-180 s-1 only
had minor impact on the size of mentioned model SPM analogue flocs (results from laboratory pre-tests)
The shear force necessary to avoid sedimentation being the dominant collision mode depends on the
diameters of the nanomaterials and SPM employed and can be calculated using equations 3 (section 34
below)
The selection of the nanomaterial mass concentration needs to be based on the analytical limits
in the matrix (as a rule of thumb the quantification of remaining ldquofreerdquo nanomaterials should be possible
down to ~10 of the initially added nanomaterials) One can quantify either the elemental mass
concentration or the particle number concentration in the supernatant by ICP-MS (after digestion) or single
particle ICP-MS respectively
Next to analytical limitations there are process-determined limitations in selecting nanomaterial
and SPM concentrations to optimise the system for selective heteroagglomeration testing Both homo-
and heteroagglomeration kinetics are driven by the particle number concentration in the system (for
heteroagglomeration more precisely the number ratio of nanomaterials and SPM (Labille et al 2015)) as
well as the collision rate constant which depends on the nanomaterial and SPM size and density and the
G in the system (see equations 3 in section 34) Shear forces are not part of the original TG 318 as
particles in the nm-size range are not affected by shear forces and diffusion is the dominant transport
mechanism (Elimelech 1995) meaning that nanomaterial homoagglomeration is independent of G In the
microm-size range typical for SPM flocs however shear forces start playing a role Since heteroagglomeration
is the process of interest the selection of the nanomaterialSPM number concentrations and shear forces
ENVJMMONO(2020)9 27
Unclassified
needs to ensure that potentially simultaneously occurring homoagglomeration2 remains negligible (in case
of unfavourable hydrochemical conditions for homoagglomeration or very low expected αhomo) or is at least
significantly dominated by heteroagglomeration (in case of homoagglomeration not being negligible) Such
an optimisation of a stirred test system for heteroagglomeration can be based on model calculations (see
equations 3 in chapter 34) depicting the interplay between SPM and nanomaterial sizes and densities
their number concentrations and applied shear forces (Figure 8) Knowing (or approximating) the size3 and
density of both nanomaterial and SPM the mass-corresponding number concentrations can be calculated
assuming (if not known) spherical shape for both To allow defining suitable conditions it is suggested to
take the necessary minimum nanomaterial number concentration determined by analytical limitations as a
starting point and modify the SPM number concentration and the G-value to ldquoworst caserdquo conditions ie
assigning the highest attachment efficiency value of unity for both αhomo and αhetero (where each collision
results in attachment) An example is shown in Figure 8 where homoagglomeration of 5 ppb 30 nm CeO2
is certainly dominated by heteroagglomeration when 45 ppm SPM (d = 6 microm ρ = 15gcmsup3) is used at
stirring which effected a G = 100s-1 Additionally the model gives a first indication of the necessary
temporal resolution
2 Even if homoagglomeration takes place homoagglomerates may be too small to be removed from suspension by
centrifugation
3 Note that eg light-scattering-based size measurements are biased towards larger sizes and applying such particle
diameters may lead to a significant underestimation of the particle number
28 ENVJMMONO(2020)9
Unclassified
In order to support the model calculation and the assumption of negligible loss of nanomaterials
other than by heteroagglomeration an additional control test should be conducted This is done using the
same concentration of nanomaterials in the same background hydrochemistry (pH electrolytes NOM) but
without any SPM Sampling and sample treatment should be performed in the same way as for the
heteroagglomeration test to measure free nanomaterial Digesting the remaining samples (after
centrifugation and sampling supernatant aliquots for free nanomaterial quantification) can serve to close
the mass balance and account for losses to the vessels or tubes
The test duration window needs to capture the nanomaterial removal over time which depends
on the expected αhetero value the nanomaterial and SPM number concentrations and collision frequency
(equations 3 in chapter 34) Hence the selected particle number concentrations test-duration and the
decision if agitation is necessary or not can be optimised Model calculations may also serve to get an
idea about the relevant reaction-time window to be investigated The more complex and heterogeneous
the chosen SPM the more likely it seems that heteroagglomeration is a very fast process Thus it is
recommended to aim for a high time-resolution of the initial agglomeration phase (eg every few minutes
during the first 30 minutes of the test) Intervals can be steadily increased up to eg 6 hours and a final
ldquostablerdquo nanomaterial fraction can be determined after eg 24 hours
Figure 8 Model calculations employing equation 3 (see section 34) to find suitable SPM concentrations at which
heteroagglomeration is dominating over homoagglomeration in case of both αhomo and αhetero being set to one CeO2
has been chosen as example for low analytical limits (ICP-MS) allowing experiments at 5 ppb (10 remaining
would still be gt 5 times limit of quantification) Number concentrations were converted from mass concentrations
assuming spherical shape for both SPM and nanomaterial and the given diameters and densities (CeO2 722
gcmsup3) In both the homo- (red line) and heteroagglomeration case (black lines) the initial nanomaterial
concentrations were 5 ppb With increasing SPM concentrations in the heteroagglomeration case the nanomaterial-
SPM number ratio changes and at 45 ppm SPM the decrease of ldquofreerdquo nanomaterials due to heteroagglomeration
will clearly dominate over homoagglomeration whereas at 15 ppm SPM homoagglomeration might have a similar
share (unless αhomo ltlt αhetero) in total removal of free nanomaterials
ENVJMMONO(2020)9 29
Unclassified
34 Data evaluation and derivation of attachment efficiency
Attachment efficiencies beside the dissolution rate constant are considered an important
parameter for exposure modelling of nanomaterials Recently scientists developed fate models for
nanomaterials that use attachment efficiencies as input parameters to predict nanomaterial concentrations
in environmental compartments (eg SimpleBox4Nano (Meesters et al 2014) models provided by EU
Horizon Project NanoFASE available at httpnanofaseeushowfate-and-exposure-modelling-of-
nanomaterials-the-nanofase-model-catalogue_1963]) These nanospecific models will provide more
reliable and relevant predicted environmental concentrations (PECs) for nanomaterials than the
conventional fate models that rely on equilibrium partitioning and will thus contribute to an improved
nanomaterials risk assessment
Based on Smoluchowskirsquos agglomeration theory (Elimelech1995) the heteroagglomeration
attachment efficiency (depicted as αhetero) can be defined as the fraction of nanomaterial-SPM collisions
resulting in nanomaterial attachment to SPM αhetero can take values from 0 to 1 to modulate the collision
rate constant between nanomaterials and SPM reflecting their physicochemical surface affinity for each
other (under the given hydrochemical conditions) Assuming irreversible attachment the rate of free
nanomaterial removal by heteroagglomeration can be calculated according to equation 1 With a constant
number of SPM particles heteroagglomeration turns out to be a pseudo first-order reaction (nSPM can be
included into khet further on denounced as khet) (Praetorius et al 2012) The collision rate constant (kcoll)
combines the three modes of transport of nanomaterials and SPM towards each other (diffusion
differential sedimentation and advection) assuming spherical nanomaterial and SPM shapes and
rectilinear collisions (Praetorius et al 2012) Transport by advection is incorporated employing the shear
rate or the velocity gradient (G) introduced by Camp and Stein (1943) for stirred vessels It is defined as
the square root of the energy (eg added by stirring) dissipated by turbulence per unit time accounting for
the volume and viscosity of the considered fluid The sensitivity of the system to changes in shear is
relatively low compared to other parameters To avoid sedimentation we suggest a value of G around 40-
100 s-1 for a stirred batch system Shear rates in rivers are typically gt 10 s-1 (Arvidsson et al 2011)
30 ENVJMMONO(2020)9
Unclassified
Equations 3 Rate of ldquofreerdquo nanomaterials removal from suspension due to heteroagglomeration
over time (based on Smoluchowski Praetorius et al 2012)
d119899NM
d119905= minus 119896het 119899NM 119899SPM
khet heteroagglomeration rate constant [msup3s]
nNM number concentration of nanomaterials [1msup3]
nSPM number concentration of SPM [1msup3]
119896het = 120572het 119896coll
αhet attachment efficiency between nanomaterials amp SPM
kcoll collision rate constant between nanomaterials amp SPM [msup3s]
Equations 4 Calculation of collision frequencies due to diffusion (perikinetic) advection
(orthokinetic) and differential sedimentation (DS) assuming spherical particles laminar flow and
straight streamlines (rectilinear collisions)
perikinetic collisions 119896collperikin
=2k119879
3micro
(119903SPM + 119903NM)sup2
119903SPM 119903NM
orthokinetic collisions
119896collorthokin=
4
3119866(119903SPM + 119903NM)sup3
with 119866 = radic120598
120584 = radic
119875
micro119881
collisions due to
differential sedimentation
119896collDS= π(119903SPM + 119903NM)2|120592SPM minus 120592NM|
with 120592SPM NM =2
9
120588SPM NMminus120588L
μg 119903SPM NM
2
summed-up to total collision frequency
119896coll =2k119879
3micro (119903SPM + 119903NM)sup2
119903SPM 119903NM+
4
3119866(119903SPM + 119903NM)3 + π(119903SPM + 119903NM)2|120592SPM minus 120592NM|
k Boltzmannrsquos constant [msup2kgssup2K]
T absolute temperature [K]
micro dynamic viscosity of dispersion medium
[Nsmsup2]
r particleaggregate radius [m]
G shear rate (velocity gradient) [s-1]
g gravity acceleration [mssup2]
ρS density of particles [kgmsup3]
ρL density of liquid [kgmsup3]
υSPM NM settling velocity of SPM or nanomaterials [ms]
ϵ power input per unit mass [Nmskg]
ν kinematic viscosity (microρL) [msup2s]
P power dissipated by liquid turbulence [W]
V volume of liquid [msup3]
These equations may on the one hand be used to design the tests (SPM and nanomaterial number
concentrations test duration and time resolution see above paragraph 73) and on the other hand to
approximate αhetero With heteroagglomeration being a pseudo first-order reaction (in the early
agglomeration phase) the natural logarithm of the particle concentration plotted over time will give a linear
relation (see example in Figure 9) The slope equals the pseudo first-order reaction rate (119896ℎ119890119905lowast =
120572ℎ119890119905 119899119878119875119872 119896119888119900119897119897) and αhetero can be calculated
As there will be many collisions between nanomaterials and SPM only nanomaterials with very
low attachment efficiencies are likely to remain ldquofreerdquo Many results (eg Praetorius et al 2012) have
shown α values (attachment efficiencies) that result in almost immediate nanomaterial-SPM associations
ENVJMMONO(2020)9 31
Unclassified
The exception is if the SPM number concentration is very low In the latter case homoagglomeration will
be dominant (see Figure 8) Assuming pseudo first-order kinetics the half-life of free nanomaterials can be calculated (11990512 = ln(2) 119896ℎ119890119905
lowast) Plotting the expected half-lives at given SPMnanomaterial
concentrations and shear rate over a range of αhetero-values employing three different SPM concentrations
(Figure 10) shows that only starting from small αhetero lt001-0001 significant numbers of free nanomaterials
will remain after just one day except for very low SPM concentrations (5 ppm and lower)
Figure 9 An example of pseudo first-order kinetics of heteroagglomeration
244
246
248
250
252
254
256
0 500 1000 1500 2000 2500 3000 3500
ln(n
NM
)
time [s]
slope (khet) = - 24410-4 s-1
kcoll = 73110-16 s-1
nSPM = 1801012
αhet = 019
32 ENVJMMONO(2020)9
Unclassified
Figure 10 Half-life time of free nanomaterials based on heteroagglomeration model
calculations with the example of 5 ppb CeO2 nanomaterial (30 nm) and three different
concentrations of SPM (5 ppm blue line 45 ppm red line 150 ppm grey line) are shown
against αhetero The number of SPM (nSPM) and kcoll were calculated with the given parameters
assuming spherical shape For half-lives longer than one day (ie those above the horizontal
green line) αhetero needs to be smaller than 01-0001
Based on the considerations above the test duration of 6 hours defined in TG 318 will likely also
work for heteroagglomeration For conditions where heteroagglomeration is the dominant process
transport-relevant αhetero values of 001 and lower are only to be expected if there is a significant fraction
eg 10-20 of nanomaterials remaining after 3 (conservative) to 6 hours With further experimental data
providing proof of principle this relationship between the order of magnitude of αhetero and the test
duration can be further refined for given nanomaterialSPM concentration ratios
If it is aimed to compare heteroagglomeration behaviour of various nanomaterials under same
conditions a tiered approach is suggested that could look as following In a first tier the nanomaterials
which are prone to quickly heteroagglomerate should be identified Those can be assumed to immediately
attach to SPM making kinetic considerations obsolete Other nanomaterials should be subjected to a
second-tier kinetic study to determine αhetero The first tier could consist of two-point measurements
where the free nanomaterial fraction left in the supernatant after centrifugation and removal of the SPM-
attached fraction at t1 is compared to the initial free nanomaterial concentration at t04 If the remaining
4 A comparison to t0 might be substituted by a comparison to a ldquohomoagglomerationrdquo control (containing the same
amount of nanomaterials with the same background hydrochemistry and DOM concentration but without SPM)
However using the t0-heteroagglomeration concentration as reference for comparison ensures that at both time
points the same fraction of free nanomaterials was removed by ldquoscreening-effectsrdquo (SPM will physically catch and
remove some nanomaterials from dispersion during centrifugation) This helps to avoid a misinterpretation of a
screening-induced removal of nanomaterials from suspension as a heteroagglomeration-induced removal However
0001
001
01
1
10
100
1000
10000
100000
0000001 000001 00001 0001 001 01 1
free N
M t
12
[d]
αhetero
5 ppm
45 ppm
150 ppm
SPM d = 6 microm (ρ 15 gcmsup3)5 ppb CeO2 d = 30 nm (ρ 713 gcmsup3)
G = 100 s-1
ENVJMMONO(2020)9 33
Unclassified
nanomaterial fraction at t1 exceeds a selected threshold value indicating a low αhetero and potential stability
of free nanomaterials a kinetic study should be conducted As shown by calculations above correlations
between αhetero t12 and the fraction of free nanomaterials left after a certain time may be used to establish
general threshold values to categorise αhetero values into ldquohighrdquo ldquomediumrdquo and ldquolowrdquo The following
example shall illustrate the principle If less than 10 of the nanomaterials is left after 2 h (meaning fast
heteroagglomeration) an αhetero larger than 01 and t12 less than 1 d is expected if more than 10 are
left after 2 h (meaning slower heteroagglomeration) a kinetic study to determine αhetero should be
conducted These relations are however strongly dependent on the chosen nanomaterialSPM number
concentrations and sizes Thus establishment of threshold values needs to be tied to robust experimental
procedures which still have to be developed and systematically validated A crucial point here is the
selection of t1 (2 h in the example) since the influence of respective nanomaterialSPM number-ratio needs
to be taken into account (see Figure 10) Furthermore setting a threshold for the requirement of a kinetic
study based on the remaining fraction of free nanomaterials (10 in the example) should be done under
careful consideration Studies found that the removal of nanomaterials can reach a plateau leaving a
stable fraction of the initially added nanomaterials (Quik et al 2012 and 2014) This can either be due to a
very stable sub-fraction present in the nanomaterial sample (ie ldquoimpuritiesrdquo exhibiting different intrinsic
surface properties from the bulk) or due to an in-situ stabilisation of a sub-fraction of nanomaterials by
compounds of the test media (eg NOM) Thus a certain remaining fraction after a defined reaction time
does not necessarily indicate slow or fast heteroagglomeration Hence another useful step is the
determination of the ldquofinalrdquo stable fraction (eg after 24 h) to avoid misinterpretation Since this fraction is
unlikely to attach to SPM in the long run it should be considered ldquofreerdquo nanomaterials when it comes to
transport regimes or bioavailability
if heteroagglomeration is very fast a homoagglomeration control might provide a more reliable initial concentration
(but only if the screening effect can be considered negligible eg when very low SPM concentrations are used)
34 ENVJMMONO(2020)9
Unclassified
Both dispersion stability and dissolution (rate) are considered to be endpoints of major importance
for describing environmental behaviour and fate of nanomaterials Thus for fate assessment as well as for
exposure assessment both endpoints need to be taken into account and they will also be key information
for ecotoxicity testing
While TG 318 for dispersion stability has been published (OECD 2017) currently no OECD TG
on solubility and dissolution rate of nanomaterials is available However existing guidance documents
such as the GD 29 (OECD 2001) may provide a basic orientation (see Chapter 2) Other TG and GDs as
well as ongoing WNT projects are also dealing with areas of dissolution (see Chapter 2 and Chapter 6)
There is not just one single optimal strategy on how to determine solubility dissolution and
dispersion stability The initial nanomaterial concentrations the media composition and timeframe that is
relevant to use will always depend on the purpose and objective of testing (see Section 41) Likewise the
testing strategy employed depends on whether the data is needed to inform consideration of what further
ecotoxicity testing is needed as input data for modelling of environmental fate or as basic data on
environmental behaviour (see Section 42)
Validity and correct interpretation of dispersion stability and dissolution rate or solubility
measurements are interdependent For instance the measurement of dissolution in a suspension where
agglomeration and sedimentation has occurred will underestimate dissolution (as
agglomeratedprecipitated material will have less surface available for dissolution) When dissolution has
occurred determination of dispersion stability based on measurement of the remaining particulate fraction
only will underestimate dispersion stability as any nanomaterial missing through dissolution will be
interpreted as precipitated Determination of dispersion stability of dissolving nanomaterial based on
remaining total concentration in the supernatant (as described in TG 318) leads to an overestimation of
dispersion stability in case the dissolved fraction is not quantified Therefore the quantification of the
dissolved fraction of the stable part is required in TG 318 when dissolving nanomaterials are investigated
Further situations where such caution must be shown when interpreting the data and where both types of
data must be viewed in concert are highlighted with some outline application examples in Section 43
41 Purpose
Dissolution (rate) and dispersion stability are relevant triggers needed for the safety assessment
of nanomaterials Regulatory information requirements for solubility dissolution rate and dispersion
stability of nanomaterials exist in some chemical legislation such as REACH (EU 2018) These parameters
are also relevant as triggers for further assessment strategies and decisions Given the current worldwide
development in chemicals regulations to manage nanomaterials it is anticipated that other chemicals
legislations (eg US EPA 2016) meet the same challenges
4 Use of data on dissolution and dispersion
stability for further testing and
assessment strategies
ENVJMMONO(2020)9 35
Unclassified
The understanding of environmental fate and behaviour of nanomaterials is one of the key aspects
for environmental exposure assessment Furthermore it supports the knowledge about uptake by
interaction with and effects on environmental organisms Therefore dissolution (hetero-) agglomeration
and sedimentation are important drivers for environmental fate behaviour and effects of nanomaterials
Furthermore given the numerous manufactured nanomaterials already on the market and many
more expected in future the effort for the individual investigation of hazard and risk would be enormous
and virtually impossible To overcome this challenge grouping and read-across approaches of
nanomaterials has been identified as one critical issue by OECD (OECD 2016) Grouping and read-across
approaches are already established for chemical substances to meet regulatory data requirements by
deviation from the requirements of performing standard tests for years (OECD 2007 2014b) The aim of
these approaches is to predict the physico-chemical toxicological and fate-related properties of chemical
substances based on structural similarities If sufficient evidence for similarity is available between two
chemical forms then it should be possible to transfer available data on the fate or hazard of one chemical
substance to another one These approaches are intended to reduce the amount of testing necessary to
determine the behaviour and effects of all individual members of a group
Grouping and read-across based on molecular structural similarity alone is not sufficient for any
chemical This is of special importance for nanomaterials as nanoforms of the same chemical composition
but deviating in physico-chemical parameters can show differences in effects and behaviour To allow an
adequate assessment of nanomaterials using grouping and read-across further parameters are necessary
to justify such an approach In that context beside chemical composition parameters like morphology
surface properties and shape as well as reactivity and fate descriptors like dissolution rate or dispersion
stability in relevant media are discussed for consideration (eg ECHA Guidance R61 (ECHA 2019))
TG 318 for dispersion stability and the available methods for solubility and dissolution rate can
address the respective endpoints and might be used to compare similarities or differences of nanomaterials
regarding these endpoints at given conditions and thus support the development of grouping and analogue
approaches for nanomaterials as part of integrated testing and assessment approaches (IATAs)
For further (hazard) testing knowledge on dispersion stability and dissolution behaviour can inform
on the test set-up and necessary measurements for exposure characterisation during the testing
Furthermore knowledge on dispersion stability and dissolution behaviour in a test system can facilitate
better interpretation of test results (eg whether effects seen can be attributed to nanomaterials or free
ions only)
42 Testing strategy
Based on the purpose of testing information from solubility dissolution rate and dispersion stability
testing can inform a further testing strategy The suggested approach to do so is outlined in Figure 11 The
approach starts with a screening batch test on dissolution followed by a dynamic dissolution test if needed
The approach furthermore includes the testing of dispersion stability for nanomaterials that do not fully
dissolve within a relevant time scale This approach also provides further information to guide on the effort
needed for appropriate analytics in further testing Before entering into the tiered approach sufficient
characterisation of the investigated nanomaterial (eg chemical composition size distribution morphology
and surface modifications) provides information to prepare the testing and interpret test results
36 ENVJMMONO(2020)9
Unclassified
Figure 11 Overview of a testing strategy building on dissolution and dispersion stability data Potential dissolved fraction is below detection limit Dagger All relevant mass of the investigated nanomaterial is in the dissolved fraction and The evidence takes relevant time scales into account The testing strategy and elements that need to be considered for the development of such a strategy is further explained in section 43 and section 44
Depending on the nanomaterial under investigation and the objective of the testing appropriate
starting concentrations and test durations need to be chosen for the initial screening dissolution batch test
ENVJMMONO(2020)9 37
Unclassified
When addressing triggers for safety assessment and decision making for further testing there might be
the need to test concentrations which are above environmentally relevant concentrations Therefore it is
advisable to test the nanomaterials with test conditions of TG 318 and the upcoming TG for dissolution
respectively to gain comparable and reliable data Furthermore it might be challenging to analytically
verify test concentrations under (mimicked) realistic environmental conditions
In case the batch test gives conclusive evidence for full dissolution (all relevant mass in dissolved
fraction) of the investigated nanomaterial in a relevant time scale (relevant refers to the actual question for
which the test strategy is set up) further dissolution testing by dynamic methods might not be needed In
this case it can also be considered to refrain from nanospecific testing For nanomaterials that show
incomplete dissolution or dissolution below detection limit it should be decided if the information from the
batch test provides sufficient evidence to enable a decision on the dissolution for the purpose defined For
example information on dissolution based on the batch test could provide sufficient supplementary
information for a subsequent ecotoxicity test In contrast information from the batch test might be
insufficient to eg inform exposure relevant testing regimes in which dissolution against an infinitive sink
is of interest Based on the question also the appropriateness of the analytic equipment (eg concerning
sensitivity) should be considered
In case information from the batch test is sufficient to conclude on the dissolution of the
investigated nanomaterial one could directly proceed with further nanospecific testing If the information
from the batch test is insufficient testing of dissolution with a dynamic method should be considered For
nanomaterials that do not fully dissolve in a dynamic dissolution test within a relevant time scale again
further nanospecific testing is needed For further nanospecific testing a first suggested step is testing of
dispersion stability
For testing dispersion stability it is recommended to use OECD TG 318 as it is described
Deviation from test conditions might be possible in order to inform higher tier testing In the latter case it is
suggested to choose appropriate test duration and concentration based on the objective Information from
dispersion stability testing can provide an indication about the analytical needs (monitoring of dissolved
fraction monitoring of dispersion stability) to be performed for or during potential further nanospecific
testing
In addition results from solubility dissolution rate and dispersion stability testing can provide
information to facilitate the choice of appropriate test performance of potential further testing (eg
frequency of water renewal rate (semi)static vs flow-through test conditions) to maintain stable conditions
43 Points to consider when applying information on dispersion stability and
dissolution for potential further testing
The methods presented in this GD will provide relevant data on solubility dissolution rate and
dispersion stability Moreover in principle these methods can also be performed with test media (eg
natural water ecotoxicological test media) that differ from the ones presented in the respective test
guideline or recommended here However as these endpoints are influenced by properties of the
nanomaterial in question as well as interactions between the nanomaterial and its surroundings results
between tests may differ depending on nanomaterial modification(s) and the test media used
Consequently the repeatability reliability and robustness should be taken into account as much
as possible when using alternative test conditions In these cases it is prerequisite to characterise and
report the test media conditions as detailed as possible to enable data evaluation and interpretation of data
(and consider simultaneous testing) This will also enable future analysis of existing studies eg to
compare existing results with new data from new studies
38 ENVJMMONO(2020)9
Unclassified
While information from these methods might be directly applicable for exposure estimation
conclusions for a further testing strategy on hazard should be considered carefully The relevance of the
information as well as the decision how to consider data generated on these endpoints for further testing
will always depend on the individual question and purpose of testing
Solubility and dissolution rate inform about in which state (particulate completely or partly
dissolved) a nanomaterial is present under respective conditions Regarding solubility and dissolution rate
the main question is when it is possible to refrain from nanospecific considerations in hazard assessment
(ie when dissolution is considered complete and fast enough compared to the duration of the
corresponding (eco)toxicity test) For an appropriate decision on the relevant hazard assessment various
aspects need to be considered like the regarded nanomaterial (eg chemical composition) endpoint under
investigation (eg long term vs acute testing) and test performance (eg media type water renewal
frequency) In the evaluation of an aquatic hazard endpoint supporting information from discrete dissolution
testing (solubility dissolution rate) in the respective aquatic test media and with respective concentrations
could help to decide if it might be possible to refrain from nanospecific testing That could be the case if
the nanomaterial under investigation fully dissolves in dissolution testing within a timeframe and for
concentrations relevant for the respective aquatic endpoint The chosen test parameter should allow to
conclude if the contribution of the particulate form to the eco-toxicological impact is insignificant and do not
very likely change the results of the ecotoxicity testing Furthermore hazard test data for the solute needs
to be available
Regarding dissolution it should be considered that the dissolution kinetic of some nanomaterials
(eg certain metals or metal oxides) is sensitive to lightdarkness with generally a greater dissolution at
visible light or UV-irradiated conditions as compared to darkness Therefore the lightdark-conditions
should be reported where relevant (Hedberg et al 2012 Li et al 2014)
OECD TG 318 provides information on how stable a nanomaterial dispersion is in aqueous media
at given conditions There is sufficient evidence that nanomaterials tend to agglomerate and settle out of
the water phase during sufficient long periods and thus sediment sludge and soil are expected to be the
main environmental components in which the nanomaterials end up (Hartmann et al 2014) Thus if
nanomaterials show low stability in the water phase inclusion of data relating to the sediment or soil
compartment into environmental risk assessment of nanomaterials may become relevant
However agglomeration and sedimentation should not be equated per se with lack of exposure in
water column For hazard testing existing data show that agglomeration and sedimentation do not
necessarily prevent availability to the organisms in aquatic test systems Due to the permanently agitated
test system used for testing algae toxicity test organisms also can be affected by nanomaterials unstable
in the test dispersion In addition unstable dispersed nanomaterials can be taken up by pelagic organisms
like daphnia (Botha et al 2016 Tan et al 2016 Hund-Rinke et al 2017) Unstable nanomaterials
furthermore can be available to benthic deposit-feeders and filtering organisms (Tella et al 2014 Kuehr
et al 2020) In case of ion releasing nanomaterials released ions might get back into the water phase
affecting test organisms while the particulate fraction remains deposited at the bottom Strictly speaking
this may not be considered nanomaterial toxicity but by constantly replenishing the ion concentration in
the water phase the particulate fraction strongly influences the outcomes of the test Also under
environmental conditions it is conceivable that deposited or heteroagglomerated nanomaterials are
consumed from biofilms ground or plant surfaces or taken up via sediment or natural suspended matter
respectively (Geitner et al 2018 Perrier et al 2018) In addition to dissolution and agglomeration
bioavailability and uptake of the various nanomaterials by aquatic organisms depends on other aspects of
the nanomaterials like size chemical composition synthesis methods or nature of coating of the
investigated nanomaterial (Lead et al 2018) However the understanding how these aspects influence
bioavailability and uptake is still far from complete
ENVJMMONO(2020)9 39
Unclassified
When using data from dispersion stability and dissolution testing for exposure assessment it has
to be taken into account that not only a single event but also a continuous entry into the environment is of
relevance This can lead to a situation that even if a nanomaterial dissolves relatively fast a mixed exposure
of particulate and dissolved forms can take place
For nanomaterials that release ions or dissolve over a sufficient long period of time it is important
to monitor in-depth the ion concentration in the test system to inform on the amounts of particulate and
dissolved forms being present Depending on the purpose of testing and investigated nanomaterial it can
be also of importance to know how the particulate form changes in surface or core composition or size
distribution Changes in composition might be relevant for eg nanomaterials that consist of various
substances (eg core-shell nanomaterials) with different dissolution behaviour and should be determined
where relevant Knowledge on changes in size distribution (eg loss of smallest particle decrease of
particle size across the distribution formation of new particles) can become relevant to decide on further
hazard and fate testing strategies
The joint consideration of the endpoints determined by the TG 318 and available methods on
solubility and dissolution rate is of expedient importance as these endpoints strongly influence each other
and interpreting one in absence of the other is difficult The dispersion state of a nanomaterial will affect
its dissolution kinetic while ion releasing of the nanomaterial will alter the outcome of dispersion stability
testing for dissolving nanomaterials
Dissolution leads to an increase of ion concentration that subsequently can lead to either an
increased or a decreased dispersion stability Furthermore readily soluble nanomaterials can show a loss
of particles during TG 318 performance Therefore care should be taken when analysing and interpreting
results from TG 318 to not mistake dissolved nanomaterials with stable fraction In TG 318 it is described
how dissolution needs to be evaluated during testing for ion releasing nanomaterials On the other hand
agglomerationsedimentation will lead to a decrease in available surface which in consequence will result
in a decrease in dissolution
Next to (hetero-) agglomeration sedimentation and dissolution potential nanomaterial
transformations (eg sulphidation oxidationreduction reactions and coating transformations) influence the
fate of nanomaterials in the environment and thus should be considered when evaluating the data An
OECD project is under development on transformation of nanomaterials in aquatic environmental media
to provide advice on ways to determine abiotic transformations of nanomaterials in the environment
40 ENVJMMONO(2020)9
Unclassified
Both data from TG 318 and the currently available methods for determining solubility and
dissolution rate may support the derivation of appropriate input parameters for exposure modelling of
nanomaterials As a starting point for environmental fate modelling basic data as collected using TG 318
and adapted test performance of GD 29 might be used as input for deriving screening level estimations of
predicted environmental concentrations (PECs) eg to compare potential exposure of various
nanomaterials This basic data can be a ranking in stable or instable nanomaterial dispersion (Figure 4)
according to TG 318 which can be linked to the degree of agglomeration expected Choosing a low or
high attachment efficiency that coincides with stable or instable conditions can be based on the PEC
sensitivity reported by Meesters et al (2019) Similarly such basic data on the dissolution or transformation
of nanomaterials (eg GD 29) can be used to choose a relevant order of magnitude of this rate constant
based on the PEC sensitivity reported by Meesters et al (2019) For refinement of such data further testing
like using dynamic test designs to determine dissolution (rate) andor alternative media (eg in order to
determine heteroagglomeration with TG 318) will help to improve the PEC estimations in various
environmental compartments
51 Use of data on dissolution rate in exposure modelling
Data on dissolution of nanomaterials is essential in environmental exposure modelling to enable
the distinction between the dissolved and the particulate fraction of a nanomaterial This distinction is
included in current environmental fate models for nanomaterials where dissolution is a process by which
nanomaterials are transformed from the particulate form to the dissolved form (Meesters et al 2019) As
noted in Chapter 2 dissolution data can be used to estimate the dissolution rate constant This is an input
parameter in environmental fate models to calculate the predicted exposure concentration Assuming first
order kinetics the dissolution rate constant can be calculated from experimental data as
Equation 5
119896diss =119897119899(
[NM0]minus([M119899+]minus[M0119899+])
[NM0])
119905
where [NM0] is the nanomaterial concentration in mgL at the start of the experiment (t = 0) [Mn+] is the
dissolved ionic metal concentration in mgL at time t [M0n+] is the dissolved ionic metal concentration in
mgL at the start of the experiment (t = 0) (kdiss) is the dissolution rate constant and t is time of
measurement The dissolved ion concentration is operationally defined as the portion passing a filter of 3
5 Use of data on dispersion stability
solubility and dissolution rate in exposure
modelling
ENVJMMONO(2020)9 41
Unclassified
5 or 10 kDa MWCO at a certain media composition If the medium contains complexing agents such as
NOM and the NOM-metal ion complex can penetrate the membrane the measured dissolved
concentration is composed of the free metal ions and the complexed metal ions In case multiple data
points (ie concentration measurements) in time are available for [Mn+] kdiss can be derived by fitting the
relationship between [Mn+]t and time by using the following equation
Equation 6
As kdiss is only derived from ions appearing in solution over time it is essential that the
measurement technique used enables a distinction of the ionic fraction from the other metal fractions It
should be considered to use the ion concentration in the untreated medium as [M0n+] to ensure that this
value is not influenced by NM0 Some caution is needed where rapid dissolution occurs at the beginning
of the experiment as this may result in artificially low kdiss when measurements do not capture this (eg
when measurements are only available for 0 24 and 48 hours)
[ M n+ ] t = [ M 0 n+ ] - [ NM 0 ] + ( [ NM 0 ] e k diss t )
42 ENVJMMONO(2020)9
Unclassified
Currently there are various OECD projects underway to develop nanospecific TGs and GDs
Solubility dissolution (rate) and dispersion stability are important parameters that need to be considered
in these activities as they influence the outcome of the respective methods (ProSafe 2017) This chapter
will give a short overview on how these parameters are interlinked with the ongoing environmental relevant
OECD projects for nanomaterials as well as existing methods for solubility and dissolution
61 OECD TG 105 - Dissolution in water
TG 105 (OECD 1995) describes a column elution method and a flask method to investigate
solubility of compounds
During the column elution method of TG 105 the solubility of a solid chemical is determined while
attached to an inert substrate in a column The solubility equals the plateau concentration of a chemical
dissolved from the test material reached in the eluate of the column
The flow-through testing for dissolution rate described in this GD is similar to the column elution
method of TG 105 in that sense that the simulated media in contact with the nanomaterials is continuously
refreshed and the concentration of dissolved substances is measured continuously However it is not clear
how nanomaterials could be attached to such a substrate In this GD the nanomaterials are therefore
attached to an ultrafiltration membrane or contained in a compartment formed by ultrafiltration membranes
that are continuously in contact with the medium
The data interpretation in this GD is fundamentally different from that in TG 105 TG 105 describes
how the solubility of compounds can be obtained whereas this GD describes how a dissolution rate can
be obtained
The flask method in TG 105 resembles the static batch test method described in this GD However
TG 105 prescribes that solution and solid material must be separated using centrifugation after 24 hours
of equilibration after which the solubility is measured This GD prescribes using ultrafiltration as a
separation technique because centrifugation does not guarantee separation of nanomaterials and
dissolved substances Moreover this GD encourages dissolved concentrations to be measured at several
time points allowing to fit a kinetic model and calculating the dissolution rate
62 OECD TG 106 - Adsorption - Desorption Using a Batch Equilibrium Method
TG 106 (OECD 2000) describes a batch method where a substrate usually a dried and
homogenised soil is equilibrated with a chemical dissolved in water for a determined time The chemical
then adsorbs to the substrate and this process is quantified in the form of a partitioning coefficient (Kd) In
general TG 106 will not provide reliable results for nanomaterials as they do not establish a thermodynamic
equilibrium with any substrate (Praetorius et al 2014b) This GD does not apply to dissolved chemicals
but to nanomaterials An attachment efficiency is deducted in this GD using a kinetic approach instead of
a partitioning coefficient (see chapter 3)
Finally SPM is recommended as a substrate in this GD whereas a soil is usually used for TG 106
6 Links to other relevant TGs and GDs
ENVJMMONO(2020)9 43
Unclassified
63 OECD GD 23 - Guidance Document on Aquatic Toxicity Testing of Difficult
Substances and Mixtures
OECD GD 23 provides guidance for the testing of chemicals that are difficult to test for the
purposes of determining their aquatic toxicity This includes guidance for the testing for instance of poorly
or sparingly water-soluble substances substances degrading in test system or hydrophobic substances
In paragraph 5 of OECD GD 23 (OECD 2019) it is stated ldquoConsistent with the guidance presented
herein this document is generally not applicable to aquatic tests which include the undissolved phase of
a test chemical except where noted in this guidance for test chemicals which form stable dispersions It
should be noted that specific OECD guidance documents are under development for aquatic toxicity tests
of test chemicals considered as nanomaterials which may include both dissolved and undissolved
fractions in the exposurerdquo
Guidance for testing of nanomaterials in aquatic ecotoxicity can be found in the GD on Aquatic
and Sediment Toxicological Testing of Nanomaterials (see also section 65) while this GD provides
guidance for the testing of the fate endpoints solubility dissolution rate and dispersion stability on basis
of homo- and heteroagglomeration
64 OECD GD 29 - Guidance Document on TransformationDissolution of Metals
and Metal Compounds in Aqueous Media
As in this GD GD 29 (OECD 2001) describes a screening level and one full
dissolutiontransformation test A high loading of a solid compound is equilibrated for 24 hours in a test
medium during the screening test followed by a single measurement
The dissolved fraction is determined in a 020 microm filtrate using GD 29 differing from this GD where
ultrafiltration is used for separation because nanomaterials may pass a 020 m filter Further indications
on adapted needs when considering nanomaterial testing can be found in chapter 2
In the full test described by GD 29 three different concentrations of a solid compound are
equilibrated at times up to 28 days where the test medium is refreshed every 24 hours Refreshing the
medium would not be possible for nanomaterials in this way because they are suspended in the medium
and would be removed during refreshing
This GD recommends continuous refreshing more in line with TG 105 and ISO TR 19057 (ISO
2017b) As in the screening test ultrafiltration is recommended in this GD
65 OECD GD 317 - Aquatic and Sediment Toxicological Testing of Nanomaterials
Information on nanomaterial dissolution and dispersion stability should be used in addition to the
guidance given in the GD on aquatic (and sediment) toxicity testing of nanomaterials in order to interpret
the determined aquatic and sediment toxicity data In the present GD (Chapter 4) a testing strategy is
suggested for solubility dissolution rate and dispersion stability to inform about in which state (particulate
completely or partly dissolved) a nanomaterial is present under conditions of an ecotoxicity study and help
to interpret test results regarding the contribution of dissolved or undissolved fraction to the toxicity
Information on dispersion stability helps to identify the main routes of exposure within the test
system (eg via water phase in case of stable dispersion via possible dietary exposure of unstable
dispersion via sediment)
44 ENVJMMONO(2020)9
Unclassified
In addition results from solubility dissolution rate and dispersion stability testing can provide
information to facilitate to decide on the analytic needs and the choice of appropriate test performance of
potential further testing (eg frequency of water renewal rate (semi)static vs flow through test conditions)
Data on heteroagglomeration obtained using this GD may also support interpretation of
ecotoxicological data of standard test results SPM of different forms are present in high enough
concentrations in some standard tests and can affect the nanomaterial that organisms are exposed to
Attachment to fish feed if it occurs determines how fish are exposed to nanomaterials via gills or via the
gut (Handy et al 2018) Extracellular polymers eg algae exudates may occur in standard aquatic tests
and heteroagglomeration of nanomaterials and such polymers affects the exposure and consequent
toxicity of nanomaterials to the organisms (Yang et al 2018)
Even though tests in soil systems are not included in the GD on aquatic and sediment tests the
recommendations mentioned above also apply to soil organisms Soil pore water is expected to be an
important exposure pathway of nanomaterials to soil organisms Heteroagglomeration and dissolution in
soil pore water is therefore also determining the toxicity to soil organisms Attachment to inorganic particles
such as clays or iron oxides is likely in standard soils (Miglietta et al 2015) and determines whether
organisms are exposed to individual nanomaterials andor to heteroagglomerated nanomaterials which
may affect toxicity (Gupta et al 2017)
To broaden the significance of data on dispersion stability or dissolution for interpretation of
nanomaterial behaviour in ecotoxicity test media the simulated environmental media used in TG 318 and
for dissolution testing may be amended to determine the dispersion and dissolution behaviour directly in
the relevant test media for ecotoxicity testing
Comparing information on dissolution (rate) and dispersion (stability) of different nanoforms of a
substance prior to ecotoxicity testing of those nanoforms can support the development of hypotheses on
expected similar behaviour and thus may guide grouping and read-across
66 OECD TG for Nanomaterial Removal in Wastewater5
This TG aims to provide a standard method for characterising the interaction between
nanomaterials and wastewater treatment sludge In this case the heteroagglomeration is specific biomass
sampled from a wastewater treatment plant
The approach prescribes mixing biomass with nanomaterials for one hour followed by gravitational
settling The test is done at different total nanomaterial concentrations and sorption isotherms are
calculated based on the nanomaterial concentration measured in the supernatant after settling In the case
of this GD we recommend separating free from heteroagglomerated nanomaterials by means of
accelerated sedimentation using centrifugation
The parameter reported from this GD in terms of heteroagglomeration is attachment efficiency
which is a dimensionless parameter that is used in kinetic models thus models that assume equilibrium
do not apply In contrast sorption isotherms reports isothermal trends of partitioning coefficients and the
underlying model of these parameters assume a continuously equilibrium or steady-state situation
Different parameters are thus determined
5 Under development
ENVJMMONO(2020)9 45
Unclassified
67 OECD GD to Assess the Apparent Accumulation Potential of Nanomaterials
during Fish Bioaccumulation Studies6
As described earlier dispersion stability and ion dissolution will affect what the organisms are
exposed to both in standard tests as well as in realistic environments Interpretation of bioaccumulation
testing therefore likewise needs information on dispersion stability heteroagglomeration and dissolution of
the nanomaterial in question as for instance proposed for fish bioaccumulation testing (Handy et al 2018)
A dissolution rate rather than solubility is needed for bioaccumulation testing given the kinetic
nature of bioaccumulation
The information from dissolution dispersion stability and heteroagglomeration could also be used
for decision making prior to testing or bioaccumulation test media could be used in an adapted protocol of
both endpoints in order to investigate dispersion andor dissolution under experimental settings relevant
for bioaccumulation tests
68 OECD GD to support the Use of TG 312 (Leaching in Soil Columns) for
Nanomaterial Safety Testing7
A GD on how to conduct column tests to determine transport of nanomaterials in porous media
based on TG 312 (OECD 2004) includes recommendations on how to calculate a global attachment
efficiency (global) for a specific nanomaterial in a specific soil This GD provides guidance on calculating
the attachment efficiency for interaction between a specific nanomaterial and specific SPM (SPM)
It has to be noted that these attachment efficiencies are not the same even if SPM material is
used that is relevant for the specific soil studied (global is a global parameter grouping many different
processes that reduce transport (and thus increase (global) in soils (Baalousha et al 2016) One of these
processes may be heteroagglomeration with natural SPM in the pore water the rate quantification of which
may occur as described in this GD
6 Under development
7 Under development
46 ENVJMMONO(2020)9
Unclassified
Arvidsson R Molander S Sandeacuten BA Hasselloumlv M 2011 Challenges in Exposure Modeling of
Nanoparticles in Aquatic Environments Human and Ecological Risk Assessment An International Journal
171 245-262
Baalousha M Cornelis G Kuhlbusch T Lynch I Nickel C Peijnenburg W van den Brink N 2016
Modeling Nanomaterial Fate and Uptake in the Environment Current Knowledge and Future Trends
Environmental Science Nano 3 323-345
Barton LE Therezien M Auffan M Bottero J-Y Wiesner MR 2014 Theory and Methodology for
Determining Nanoparticle Affinity for Heteroaggregation in Environmental Matrices Using Batch
Measurements Environmental Engineering Science 31 (7) 7
Baun A Sayre P Steinhaumluser KG Rose J 2017 Regulatory relevant and reliable methods and data
for determining the environmental fate of manufactured nanomaterials NanoImpact 8 1ndash10
Botha TL Boodhia K Wepener V 2016 Adsorption uptake and distribution of gold nanoparticles in
Daphnia magna following long term exposure Aquatic Toxicity 170 194-111
Bove P Malvindi MA Kote SS Bertorelli R Summa M SabellaS 2017 Dissolution test for risk
assessment of nanoparticles a pilot study Nanoscale 9 6315-26
Camp T R and Stein P C 1943 Velocity Gradients and Internal Work in Fluid Motion Journal of Boston
Society of Civil Engineering 30 219-237
Carlander U Midander K Hedberg YS Johanson G Bottai M Karlsson HL 2019 Macrophage-
assisted dissolution of gold nanoparticles ACS Applied Bio Materials 2 1006-1016
Cornelis G Kirby JK Beak D Chittleborough D McLaughlin MJ 2010 A method for determination
of retention of silver and cerium oxide manufactured nanoparticles in soils Environmental Chemistry 7(3)
298-308
ECHA 2019 Guidance on information requirements and chemical safety assessment Chapter R6 QSAR
and grouping of chemicals Available at
httpechaeuropaeudocuments1016213632information_requirements_r6_enpdf
Elimelech M Gregory J Jia X Williams RA 1995 Particle Deposition and Aggregation ndash
Measurement Modelling and Simulation Chapter 6 Modelling of aggregation processes ISBN 978-0-
7506-7024-1
EU 2011 Commission Recommendation on the definition of nanomaterials Available at
httpdataeuropaeuelireco2011696oj
EU 2018 Commission Regulation (EU) 20181881 of 3 December 2018 amending Regulation (EC) No
19072006 of the European Parliament and of the Council on the Registration Evaluation Authorisation
and Restriction of Chemicals (REACH) as regards Annexes I III VI VII VIII IX X XI and XII to address
nanoforms of substances O J L 308 1-20
Franklin NM Rogers NJ Apte SC Batley E Gadd GE Case PS 2007 Comparative Toxicity of
Nanoparticulate ZnO Bulk ZnO and ZnCl2 to a Freshwater Microalga (Pseudokirchneriella subcapitata)
The Importance of Particle Solubility Environmental Science and Technology 41 8484-8490
7 References
ENVJMMONO(2020)9 47
Unclassified
Gao X Lowry G V 2018 Progress towards standardized and validated characterizations for measuring
physicochemical properties of manufactured nanomaterials relevant to nano health and safety risks
NanoImpact9 January 2018 Pages 14-30
Geitner NK OrsquoBrian NJ Turner AA Cummins EJ Wiesner MR 2017 Measuring Nanoparticle
Attachment Efficiency in Complex Systems Environmental Science and Technology 51 13288minus13294
Geitner N K Cooper J L Avellan A Castellon B T Perrotta B G Bossa N Simonin M
Anderson S M Inoue S Hochella M F Jr Richardson C J Bernhardt E S Lowry G V Ferguson
P L Matson C W King R S Unrine J M Wiesner M R Hsu-Kim H 2018 Size-Based Differential
Transport Uptake and Mass Distribution of Ceria (CeO2) Nanoparticles in Wetland Mesocosms
Environmental Science and Technology 52 9768-9776
Gupta GS Senapati VA Dhawan A Shanker R 2017 Heteroagglomeration of zinc oxide
nanoparticles with clay mineral modulates the bioavailability and toxicity of nanoparticle in Tetrahymena
pyriformis Journal of Colloid Interface Science 495 9-18
Handy RD Ahtiainen J Navas JM Goss G Bleeker EAJ von der Kammer F 2018 Positional
Paper ndash Proposal for a tiered dietary bioaccumulation testing strategy for engineered nanomaterials using
fish Environmental Science Nano 5 2030-2046
Hartmann NB Skjolding LM Hansen SF Kjoholt J Gottschalck F Baun A 2014 Environmental
Fate and Behaviour of Nanomaterials New Knowledge on Important Transformation Processes
Environmental Project No 1594 Copenhagen Denmark The Danish Environmental Protection Agency
Hedberg Y Herting G Odnevall Wallinder I 2011 Risks of using membrane filtration for trace metal
analysis and assessing the dissolved metal fraction of aqueous media - A study on zinc copper and nickel
Environmental Pollution 159 1144-1150
Hedberg Y and Odnevall Wallinder I 2012 Transformationdissolution studies on the release of iron and
chromium from particles in synthetic body fluids Materials and Corrosion 63 481-491
Hedberg YS Hedberg J Isaksson S Mei N Blomberg E Wold S Odnevall Wallinder I 2017a
Nanoparticles of WC-Co WC Co and Cu of relevance for traffic wear particles - Particle stability and
reactivity in synthetic surface water and influence of humic matter Environmental Pollution 224 275ndash288
Hedberg J Ekvall M T Cedervall T Hansson L-A Odnevall Wallinder I 2017b Tungsten carbide
nanoparticles in simulated surface water with natural organic matter dissolution agglomeration
sedimentation and interaction with Daphnia magna Environmental Science Nano 4 886 ndash 894
Hofmann T and von der Kammer F 2009 Estimating the relevance of engineered carbonaceous
nanoparticle facilitated transport of hydrophobic organic contaminants in porous media Environmental
Pollution 157(4) 1117ndash1126
Hund-Rinke K Nickel C Kuumlhnel D 2017 Considerations about the relationship of nanomaterialrsquos
physical-chemical properties and aquatic toxicity for the purpose of grouping Project financed by
Environmental Research of the Federal Ministry for the Environment Nature Conservation Building and
Nuclear Safety No (FKZ) 3714 67 417 0 Report No (UBA-FB) 002572ENG
Huynh K A McCaffery JM Chen KL 2012 Heteroaggregation of Multiwalled Carbon Nanotubes and
Hematite Nanoparticles Rates and Mechanisms Environmental Science and Technology 46 5912minus5920
ISO 2010 ISO 927710 Determination of the specific surface area of solids by gas adsorption mdash BET
method
ISO 2017a ISOTR 184012017 Nanotechnologies mdash Plain language explanation of selected terms from
the ISOIEC 80004 series
48 ENVJMMONO(2020)9
Unclassified
ISO 2017b ISOTR 19057 Nanotechnologies - Use and application of acellular in vitro tests and
methodologies to assess nanomaterial biodurability International Organisation for Standardisation
Jiang J Oberdoumlrster G Biswas P 2009 Characterization of size surface charge and agglomeration
state of nanoparticle dispersions for toxicological studies Journal of Nanoparticle Research 11 77ndash89
Juumlnemann D and Dressman J 2012 Analytical methods for dissolution testing of nanosized drugs
Journal of Pharmacy and Pharmacology 64 931-943
Kennedy AK Hull MS Bendar AJ Goss JD Gunter JC Bouldin JL Vikesland PJ Steevens
JA 2010 Fractionating nanosilver Importance for determining toxicity to aquatic test organisms
Environmental Science and Technology 44 9571-9577
Koltermann-Juelly J Keller JG Vennemann A Werle K Muumlller P Ma-Hock L Landsiedel R
Wiemann M Wohlleben W 2018 Abiotic dissolution rates of 24 (nano)forms of 6 substances compared
to macrophage-assisted dissolution and in vivo pulmonary clearance Grouping by biodissolution and
transformation NanoImpact 12 29-41
Kuehr S Meisterjahn B Schroumlder N Knopf B Voumllker D Schwirn K Schlechtriem C 2020 Testing
the bioaccumulation of manufactured nanomaterials in the freshwater bivalve Corbicula fluminea using a
new test method Environmental Science Nano 7 535-553
Labille J Harns C Bottero J-Y Brant J 2015 Heteroaggregation of Titanium Dioxide Nanoparticles
with Natural Clay Colloids Environmental Science and Technology 49 6608-6616
Ladner DA Steele W Weir A Hristovski K Westerhoff P 2012 Functionalized nanoparticle
interactions with polymeric membranes Journal of Harardous Materials 211-212 288-295
Lead J R Batley G E Alvarez P J J Croteau M N Handy R D McLaughlin M J Judy J D
Schirmer K 2018 Nanomaterials in the Environment Behavior Fate Bioavailability and Effects-An
Updated Review Environmental Toxicology Chemistry 37 (8) 2029-2063
Li Y Niu J Shang E Crittenden J 2014 Photochemical Transformation and Photoinduced Toxicity
Reduction of Silver Nanoparticles in the Presence of Perfluorocarboxylic Acids under UV Irradiation (and
Supporting Information) Environmental Science and Technology 48 4946-4953
Meesters J A J Koelmans AA Quik J T K Hendriks A J van der Meent D 2014 Multimedia
Modeling of Engineered Nanoparticles with SimpleBox4nano Model Definition and Evaluation
Environmental Science and Technology 48 5726-5736
Meesters J A J Peijnenburg W J G M Hendriks A J van der Meent D Quik J T K 2019 A
Model Sensitivity Analysis to Determine the Most Important Physicochemical Properties Driving
Environmental Fate and Exposure of Engineered Nanoparticles Environmental Science Nano 6 2049-
2060
Miglietta ML Rametta G Manzo S Salluzo A Rimauro J Di Franci G 2015 Methodological issues
about techniques for the spiking of standard OECD soil with nanoparticles evidence of different
behaviours Journal of Nanoparticle Research 17(7) 312
Misra SK Dybowska A Berhanu D Luoma S N Valsami-Jones E 2012 The complexity of
nanoparticle dissolution and its importance in nanotoxicological studies Science of the Total Environment
438 225ndash232
Monikh AF Praetorius A Schmid A Kozin P Meisterjahn B Makarova E Hofmann Tvon der
Kammer F 2018 Scientific rationale for the development of an OECD test guideline on engineered
nanomaterial stability NanoImpact 11 42-50
ENVJMMONO(2020)9 49
Unclassified
OECD 1995 TG 105 Water solubility OECD Test Guideline for the testing of chemicals Organisation for
Economic Co-operation and Development (OECD) Paris France Available at
httpwwwoecdorgenvehstestingseriesontestingandassessmenttestingforenvironmentalfatehtm
OECD 2000 TG 106 Adsorption - Desorption Using a Batch Equilibrium Method Organisation for
Economic Co-operation and Development (OECD) Paris France Available at
httpwwwoecdorgenvehstestingseriesontestingandassessmenttestingforenvironmentalfatehtm
OECD 2001 OECD Series on Testing and Assessment No 29 Guidance Document on
TransformationDissolution of Metals and Metal Compounds in Aqueous Media Organisation for Economic
Co-operation and Development (OECD) Paris France Available at
httpwwwoecdorgenvehstestingseriesontestingandassessmenttestingforenvironmentalfatehtm
OECD 2004 OECD Guideline for the Testing of Chemicals 312 Leaching in Soil Columns Organisation
for Economic Co-operation and Development (OECD) Paris France OECD Guideline for the Testing of
Chemicals 312 Leaching in Soil Columns Organisation for Economic Co-operation and Development
(OECD) Paris France Available at httpdxdoiorg1017879789264070561-en
OECD 2014a OECD Series on the Safety of Manufactured Nanomaterials No 40 Ecotoxicology and
Environmental Fate of Manufactured Nanomaterials Test Guidelines Expert Meeting Report
ENVJMMONO(2014)1 OECD Paris Available at
httpwwwoecdorgofficialdocumentspublicdisplaydocumentpdfcote=ENVJMMONO(2014)1ampdoclan
guage=en
OECD 2014b Guidance on Grouping of Chemicals second edition Series on Testing amp Assessment No
194 ENVJMMONO(2014)4 Organisation for Economic Co-operation and Development (OECD) Paris
France Available at
httpwwwoecdorgchemicalsafetytestingseriesontestingandassessmentpublicationsbynumberhtm
OECD 2016 OECD Series on the Safety of Manufactured Nanomaterials No 76 Grouping and Read-
Across for the Hazard Assessment of Manufactured Nanomaterials Report from the Expert Meeting
OECD Paris Available at httpwwwoecdorgchemicalsafetynanosafetypublications-series-safety-
manufactured-nanomaterialshtm
OECD 2017 Test Guideline 318 Dispersion Stability of Nanomaterials in Simulated Environmental Media
OECD Test Guidelines for Testing Chemicals Available at httpwwwoecd-ilibraryorgenvironmenttest-
no-318-dispersion-stability-of-nanomaterials-in-simulated-environmental-media_9789264284142-en
OECD 2018 Work plan for the test guidelines programme Organisation for Economic Co-operation and
Development (OECD) Paris France Available at
httpwwwoecdorgenvehstestingENV_JM_WRPR_2019__TGP-work-planpdf
OECD 2019 OECD Series on Testing and Assessment No 23 Guidance Document on Aquatic Toxicity Testing of Difficult Substances and Mixtures Organisation for Economic Co-operation and Development (OECD) Paris France Available at httpswwwoecd-ilibraryorgenvironmentguidance-document-on-aquatic-toxicity-testing-of-difficult-substances-and-mixtures_0ed2f88e-en
OECD 2020 Guidance Document on Aquatic and Sediment Toxicological Testing of Nanomaterials Series on Testing and Assessment No 317 ENVJMMONO(2020)8
Ottofuelling S Von Der Kammer F Hofmann T 2011 Commercial titanium dioxide nanoparticles in
both natural and synthetic water comprehensive multidimensional testing and prediction of aggregation
behavior Environmental Science and Technology 45 10045ndash10052
Perrier F Baudrimont M Mornet S Mesmer-Dudons Lacomme S Etcheverria B Simon O
Feurtet-Mazel A 2018 Gold nanoparticle trophic transfer from natural biofilms to gazer fish Gold Bulletin
51 163-173
50 ENVJMMONO(2020)9
Unclassified
Pradhan S Hedberg J Rosenqvist J Joumlnsson C Wold S Blomberg E Odnevall Wallinder I 2017
Influence of humic acid and dihydroxy benzoic acid on the agglomeration sedimentation and dissolution
of copper manganese aluminum and silica nanoparticles PlosOne 13(2) e0192553
Praetorious A Scheringer M Hungerbuhler K 2012 Development of Environmental Fate Models for
Engineered Nanoparticles - A Case Study of TiO2 Nanoparticles in the Rhine River Environmental Science
and Technology 46 6705minus6713
Praetorius A Scheringer M Hungerbuumlhler K Bottero J-Y 2014a Heteroaggregation of Titanium
Dioxide Nanoparticles with Model Natural Colloids under Environmentally Relevant Conditions
Environmental Science and Technolology 48 10690ndash10698
Praetorius A Tufenkji N Goss KU Scheringer M von der Kammer F Elimelech M 2014b The
road to nowhere equilibrium partition coefficients for nanoparticles Environmental Science Nano 1 317ndash
323
ProSafe 2017 Major International Conference Final Report Available at
httpswwwrivmnlendocumentenprosafe-d5-06-dr-major-international-conference
Quik J T K Velzeboer I Wouterse M Koelmans II van de Meent D 2014 Heteroagglomeration
and sedimentation rates for nanomaterials in natural waters Water Research 48 269-279
Quik J T K Stuart M C Wouterse M Peijnenburg W Hendriks A J van de Meent D2012 Natural
colloids are the dominant factor in the sedimentation of nanoparticles Environmental Toxicology and
Chemistry 31 (5) 1019-1022
Ren J Li Z Wong FS 2006 A new method for the prediction of pore size distribution and MWCO of
ultrafiltration membranes Journal of Membrane Science 279 558-569
Stetten L Mackevica A Tepe N von der Kammer F Tracking geochemical kinetics behavior of
engineered nanomaterials in natural aquatic environments Experimental Concepts for standardization In
preparation
Tan LY Huang B Xu S Wei ZB Yang LY Miao AJ 2016 TiO2 Nanoparticle Uptake by the
Water Flea Daphnia magna via Different Routes is Calcium-Dependent Environmental Science and
Technology 50 7799minus7807
Tella M Auffan M Brousset L Issartel J Kieffer I Pailles C Morel E Santaella C Angeletti B
Artells E Rose J Thieacutery A Bottero J-Y 2014 Transfer Transformation and Impacts of Ceria
Nanomaterials in Aquatic Mesocosms Simulating a Pond Ecosystem Environmental Science and
Technology 48 9004minus9013
Therezien M Thill A Wiesner MR 2014 Importance of heterogeneous aggregation for NP fate in
natural and engineered systems Science of The Total Environment485ndash486 309-318
US EPA 2016 Toxic Substances Control Act (TSCA) US EPA US Gov Available at
httpswwwepagovchemicals-under-tsca
Velzeboer I Quik JTK van de MeentD Koelmans II 2014 Rapid settling of nanoparticles due to
heteroaggregation with suspended sediment Environmental Toxicology and Chemistry33 (8) 1766ndash1773
Walch H Praetorius A von der Kammer F Hofmann T 2019 A tale of an engineered nanoparticleacutes
affection for natural suspended particulate matter in freshwaters Poster presentation at Environmental
Nanotechnology Gordon Research Conference Newry USA available at
httpsucrisunivieacatportaldepublicationsa-tale-of-an-engineered-nanoparticles-affection-for-
natural-suspended-particulate-matter-in-freshwaters(152dfb67-cc25-4d11-9469-540eb3d38a9e)html
ENVJMMONO(2020)9 51
Unclassified
Walch H Praetorius A von der Kammer F Hofmann T A Simple Approach to a Complex (Suspended
Particulate) Matter (SPM) Conceptual Framework for Reproducible Generation of Freshwater SPM
Analogues for Fate Studies of Particulate Contaminants In preparation
Wasmuth C Rudel H During RA Klawonn T 2016 Assessing the suitability of the OECD 29 guidance
document to investigate the transformation and dissolution of silver nanoparticles in aqueous media
Chemosphere 144 2018-2023
Yang Y Hou J Wang P Wang C Wang X You G 2018 Influence of extracellular polymeric
substances on cell-NPs heteroagglomeration process and toxicity of cerium dioxide NPs to Microcystis
aeruginosa Environmental Pollution 242 1206-1216
Zlokarnik M 2001 Stirring ndash Theory and Practice Ullmanns Encyclopedia of Industrial Chemistry Wiley‐
VCH Weinheim Germany
52 ENVJMMONO(2020)9
Unclassified
One important issue is the harmonization of terminology and definitions in various TGs and
GDs for environmental fate testing of nanomaterials Currently the published OECD TG 318 (OECD 2017)
for dispersion stability already contains agreed and adopted terminology and this should be taken into
account when future TGs and GDs are developed in case applicable
Agglomeration ndash Process of contact and adhesion whereby dispersed particles are held together by weak
physical interactions ultimately leading to enhanced sedimentation by the formation of particles
(agglomerates) of larger than colloidal size In contrast to aggregation where particles held by strong bonds
like sinter bridges agglomeration is a reversible process
Attachment Efficiency ndash Fraction of nanomaterial-SPM collisions resulting in nanomaterial attachment to
SPM
BET ndash Gas-adsorption method commonly using nitrogen (N2) gas to determine the specific surface area
of powders according to the BrunauerndashEmmettndashTeller theory (ISO 2010)
Concentrations ndash Concentrations of the particles and NOM in the samples are given in grams per litre
(gL) milligrams per litre (mgL) and micrograms per litre (μgL) In case of NOM it is given in mgL of DOC
Concentrations of electrolytes (Ca(NO3)2 and NaHCO3) present in the samples are given in millimole per
litre (mML)
DOC ndash Dissolved Organic Carbon the organic bound carbon in a water sample which passes a 045 microm
filter a part of dissolved organic matter (DOM) DOM in the form of humic substances have ~50 DOC
Dispersibility ndash is the condition of particular material of being dispersible or a measure to which extent it
is dispersible in a dispersing medium or continuous phase Dispersion stability refers to the ability of a
dispersion to resist change in its properties over time
Dissolution ndash Process under which a substance dissolves
Dissolution rate ndash The amount of substance dissolved (solute) into a solvent over time
Heteroagglomeration ndash Agglomeration of particles (here nanomaterials) with other particles (synthetic or
natural)
Homoagglomeration ndash Agglomeration of particles (here nanomaterials) with each other
MWCO - pore diameter of ultrafiltration is expressed in terms of molecular weight cut-off (MWCO) ie the
molecular weight of different molecules in the filtration process that are retained for 90 by the membrane
NOM ndash Natural organic matter the organic substances present in surface or ground water NOM covers
humic and non-humic fractions as eg polysaccharides NOM is operationally divided into Dissolved
Organic Matter (DOM) and Particulate Organic Matter (POM) DOM passes a 045 microm filter POM is
retained by the same filter POM as defined herein should not be confused with purgeable organic carbon
8 Terminology definitions and
abbreviations
ENVJMMONO(2020)9 53
Unclassified
Shear rate (G) ndash The shear rate or the velocity gradient (G) was introduced by Camp and Stein (1943) for
stirred vessels It is defined as the square root of the energy (eg added by stirring) dissipated by
turbulence per unit time accounting for the volume and viscosity of the considered fluid
Size ndash Size of the particles aggregates or agglomerates is given in micrometres (μm) or nanometres (nm)
Particle size usually refers to the particle size distribution The method for particle size determination and
relevant parameters of the particle size average should be reported
Solubility - The quantity of solute that dissolves in a given quantity of solvent to form a saturated solution
SPM ndash Suspended particulate matter finely divided solids dispersed in an aqueous environment
SRNOM ndash Suwannee River NOM a standard surface water NOM material of the International Humic
Substance Society (IHSS) isolated from the Suwannee River (US) by reverse osmosis and purified
according to the procedures of the IHSS The material can be purchased from the IHSS
- Foreword
- 1 Introduction
- 2 Testing of solubility and dissolution rate
-
- 21 Static Batch Test
- 22 Dynamic testing of dissolution rates
- 23 Data evaluation and reporting from dissolution testing
-
- 3 Testing of dispersion stability with TG 318
-
- 31 Data presentation and evaluation for TG 318
- 32 Alternative test conditions
- 33 Testing of heteroagglomeration
- 34 Data evaluation and derivation of attachment efficiency
-
- 4 Use of data on dissolution and dispersion stability for further testing and assessment strategies
-
- 41 Purpose
- 42 Testing strategy
- 43 Points to consider when applying information on dispersion stability and dissolution for potential further testing
-
- 5 Use of data on dispersion stability solubility and dissolution rate in exposure modelling
-
- 51 Use of data on dissolution rate in exposure modelling
-
- 6 Links to other relevant TGs and GDs
-
- 61 OECD TG 105 - Dissolution in water
- 62 OECD TG 106 - Adsorption - Desorption Using a Batch Equilibrium Method
- 63 OECD GD 23 - Guidance Document on Aquatic Toxicity Testing of Difficult Substances and Mixtures
- 64 OECD GD 29 - Guidance Document on TransformationDissolution of Metals and Metal Compounds in Aqueous Media
- 65 OECD GD 317 - Aquatic and Sediment Toxicological Testing of Nanomaterials
- 66 OECD TG for Nanomaterial Removal in Wastewater
- 67 OECD GD to Assess the Apparent Accumulation Potential of Nanomaterials during Fish Bioaccumulation Studies
- 68 OECD GD to support the Use of TG 312 (Leaching in Soil Columns) for Nanomaterial Safety Testing
-
- 7 References
- 8 Terminology definitions and abbreviations
-