guelph & district real estate market report: 2
TRANSCRIPT

GUELPH & DISTRICT REAL ESTATE MARKET REPORT: 2
ND QUARTER 2016
GUELPH AND DISTRICT REAL ESTATE MARKET REPORT: 2
ND QUARTER 2016
Overview: Record-Breaking Year-To-Date, Quarterly And June Sales!
2016’s year-to-date (YTD) dollar sales of $856,285,624 and units sales of 2009 are up 28%
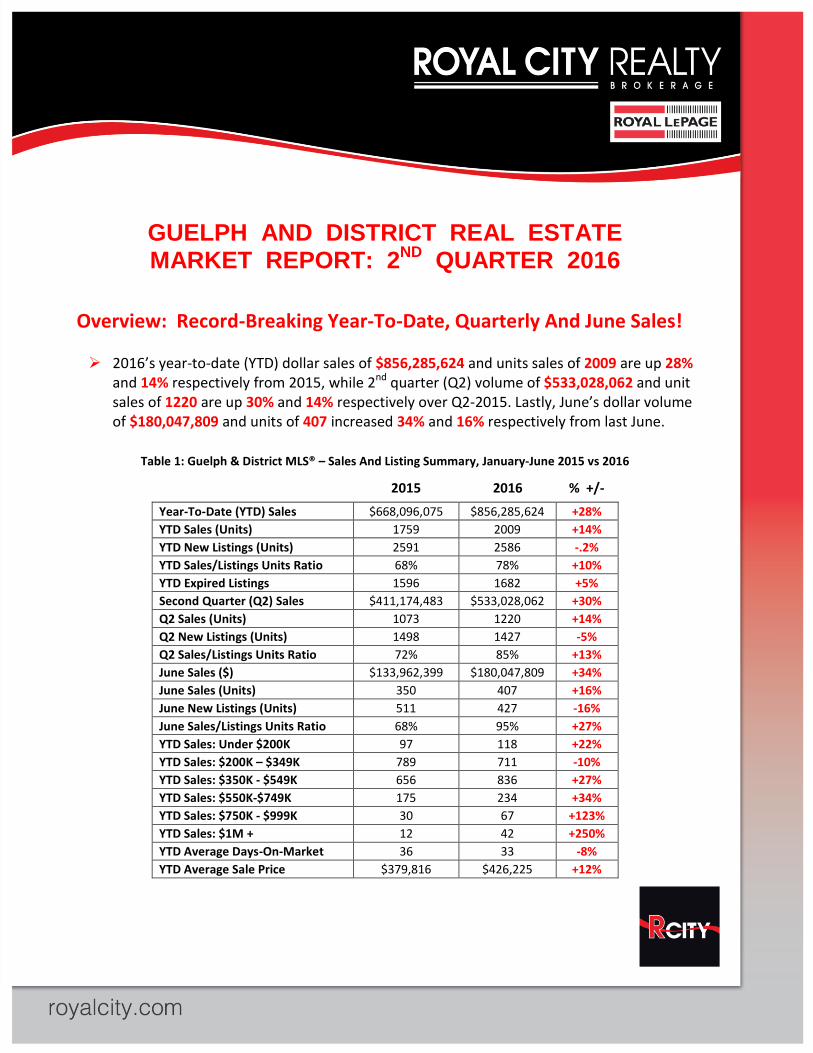
and 14% respectively from 2015, while 2nd quarter (Q2) volume of $533,028,062 and unit sales of 1220 are up 30% and 14% respectively over Q2-2015. Lastly, June’s dollar volume of $180,047,809 and units of 407 increased 34% and 16% respectively from last June.
Table 1: Guelph & District MLS® – Sales And Listing Summary, January-June 2015 vs 2016
2015 2016 % +/-
Year-To-Date (YTD) Sales $668,096,075 $856,285,624 +28%
YTD Sales (Units) 1759 2009 +14%
YTD New Listings (Units) 2591 2586 -.2%
YTD Sales/Listings Units Ratio 68% 78% +10%
YTD Expired Listings 1596 1682 +5%
Second Quarter (Q2) Sales $411,174,483 $533,028,062 +30%
Q2 Sales (Units) 1073 1220 +14%
Q2 New Listings (Units) 1498 1427 -5%
Q2 Sales/Listings Units Ratio 72% 85% +13%
June Sales ($) $133,962,399 $180,047,809 +34%
June Sales (Units) 350 407 +16%
June New Listings (Units) 511 427 -16%
June Sales/Listings Units Ratio 68% 95% +27%
YTD Sales: Under $200K 97 118 +22%
YTD Sales: $200K – $349K 789 711 -10%
YTD Sales: $350K - $549K 656 836 +27%
YTD Sales: $550K-$749K 175 234 +34%
YTD Sales: $750K - $999K 30 67 +123%
YTD Sales: $1M + 12 42 +250%
YTD Average Days-On-Market 36 33 -8%
YTD Average Sale Price $379,816 $426,225 +12%
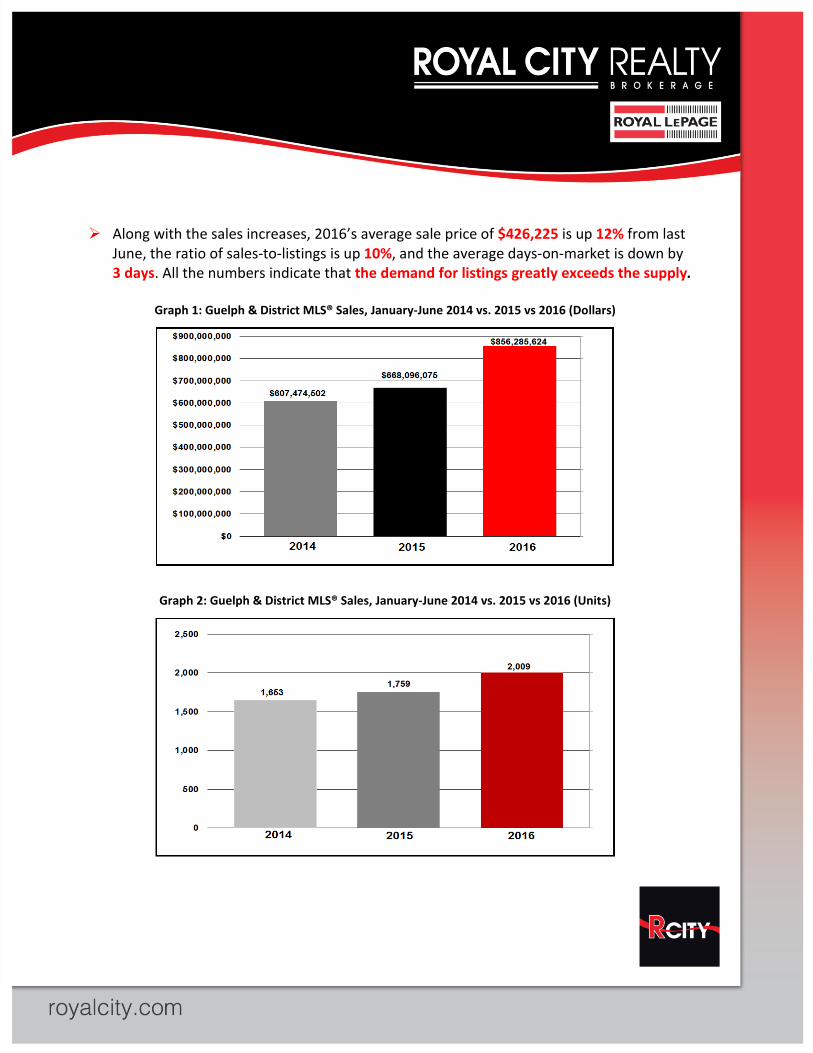
Along with the sales increases, 2016’s average sale price of $426,225 is up 12% from last
June, the ratio of sales-to-listings is up 10%, and the average days-on-market is down by 3 days. All the numbers indicate that the demand for listings greatly exceeds the supply.
Graph 1: Guelph & District MLS® Sales, January-June 2014 vs. 2015 vs 2016 (Dollars)
Graph 2: Guelph & District MLS® Sales, January-June 2014 vs. 2015 vs 2016 (Units)

As Graphs 3 and 4 show, 2016’s sales gains translate directly into the month-to-month
dollar and unit totals. Although sales flattened throughout Q2, each month was a record breaker and well above 2015’s numbers.
Graph 3: Guelph & District Monthly MLS® Sales, 2015 vs 2016 (Dollars)
Graph 4: Guelph & District Monthly MLS® Sales, 2015 vs 2016 (Units)
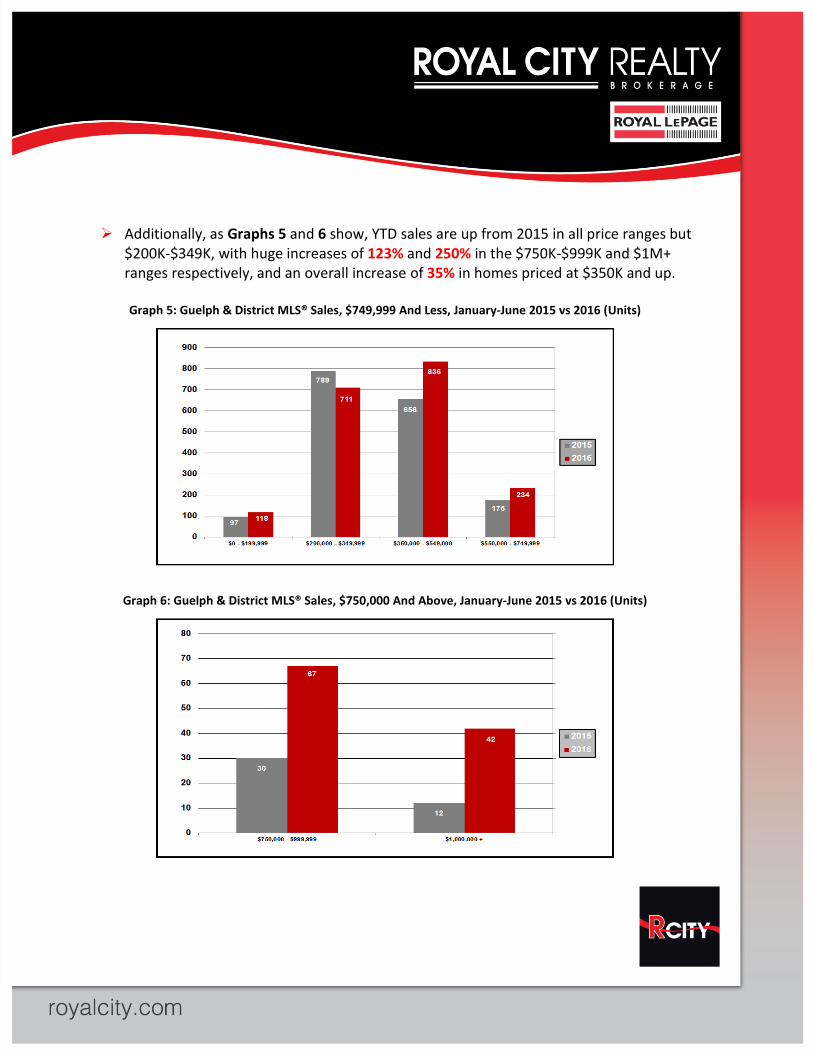
Additionally, as Graphs 5 and 6 show, YTD sales are up from 2015 in all price ranges but
$200K-$349K, with huge increases of 123% and 250% in the $750K-$999K and $1M+ ranges respectively, and an overall increase of 35% in homes priced at $350K and up.
Graph 5: Guelph & District MLS® Sales, $749,999 And Less, January-June 2015 vs 2016 (Units)
Graph 6: Guelph & District MLS® Sales, $750,000 And Above, January-June 2015 vs 2016 (Units)

Lastly, as Graph 7 shows, 2016’s unit sales of freehold homes, condominiums and
vacant lots are up 12%, 4% and 123% from from the first half of 2015.
Graph 7: Guelph & District MLS® Sales By Type, January-June 2015 vs 2016 (Units)
Freehold Homes
2016’s record-breaking dollar and unit sales are up 27% and 12% respectively over 2015, while Q2 dollar and unit sales are up 30% and 15% respectively over Q2 of last year.
The year-to-date average sale price of $455,823 is up 13% from a year ago. All indicators suggest that the demand for listings greatly exceeds the supply.
Table 2: Guelph & District MLS® Freehold Home Summary, January-June 2015 vs 2016
2015 2016 % +/-
YTD Sales ($) $536,572,601 $680,087,845 +27%
YTD Sales (Units) 1330 1492 +12%
Q2 Sales ($) $338,675,145 $439,720,672 +30%
Q2 Sales (Units) 813 938 +15%
YTD Average Sale Price $403,438 $455,823 +13%

As Graphs 8 and 9 show, 2016’s dollar sales of freehold homes are up each month from
2015, while unit sales are up every month but January. Although sales have flattened a little throughout Q2, each month was a record breaker and well above 2015’s numbers.
Graph 8: Guelph & District MLS® Monthly Freehold Home Sales, 2015 vs 2016 (Dollars)
Graph 9: Guelph & District MLS® Monthly Freehold Home Sales, 2015 vs 2016 (Unit)

Condominiums
2016’s record-breaking dollar and unit sales are up 10% and 4% respectively over 2015. Q2 dollar sales are up 7% over Q2-2015, but units sales are down 3%. The year-to-date average sale price of $286,804 is up a healthy 6% from a year ago. All indicators suggest that the demand for listings still exceeds the supply.
Table 3: Guelph & District MLS® Condominium Summary, January-June 2015 vs 2016
2015 2016 % +/-
YTD Sales ($) $114,927,474 $125,906,814 +10%
YTD Sales (Units) 423 439 +4%
Q2 Sales ($) $63,745,838 $67,915,025 +7%
Q2 Sales (Units) 241 234 -3%
YTD Average Sale Price $271,696 $286,804 +6%
As Graphs 10 and 11 show, 2016’s dollar sales are up every month but February, while
unit sales, after rising to a peak in April, are slightly down from 2015 in May and June.
Graph 10: Guelph & District MLS® Monthly Condominium Sales, 2015 vs 2016 (Dollars)
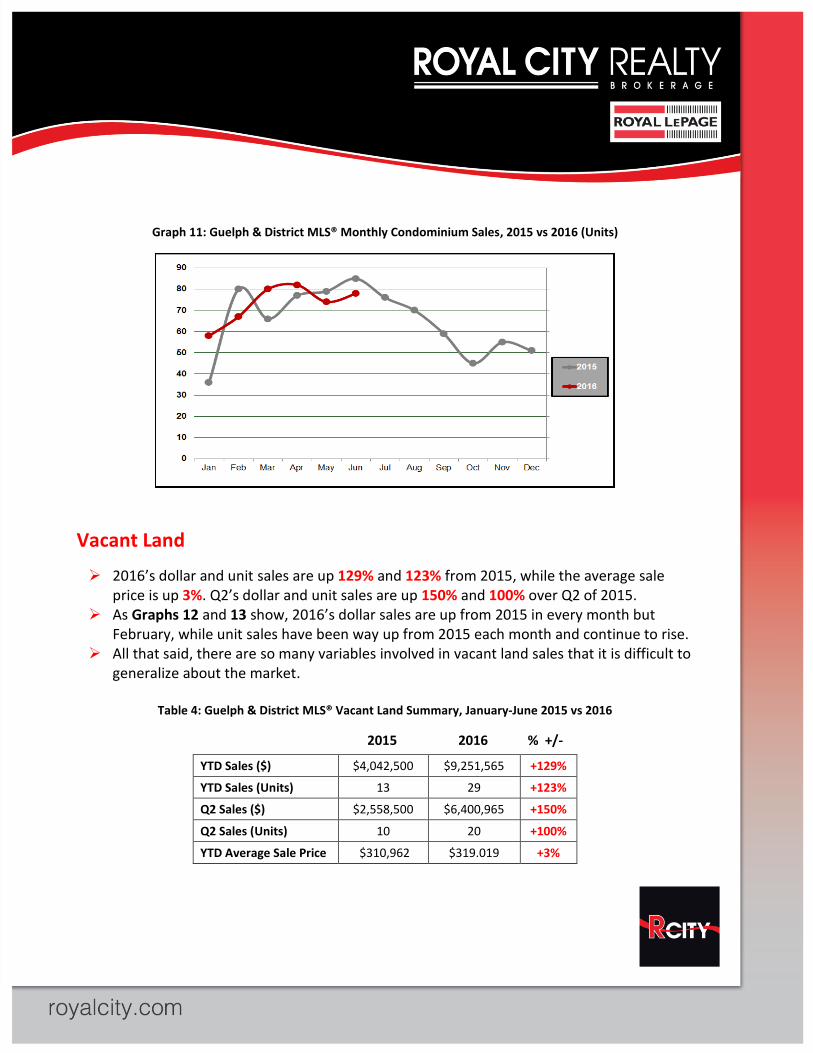
Graph 11: Guelph & District MLS® Monthly Condominium Sales, 2015 vs 2016 (Units)
Vacant Land
2016’s dollar and unit sales are up 129% and 123% from 2015, while the average sale price is up 3%. Q2’s dollar and unit sales are up 150% and 100% over Q2 of 2015.
As Graphs 12 and 13 show, 2016’s dollar sales are up from 2015 in every month but February, while unit sales have been way up from 2015 each month and continue to rise.
All that said, there are so many variables involved in vacant land sales that it is difficult to generalize about the market.
Table 4: Guelph & District MLS® Vacant Land Summary, January-June 2015 vs 2016
2015 2016 % +/-
YTD Sales ($) $4,042,500 $9,251,565 +129%
YTD Sales (Units) 13 29 +123%
Q2 Sales ($) $2,558,500 $6,400,965 +150%
Q2 Sales (Units) 10 20 +100%
YTD Average Sale Price $310,962 $319.019 +3%
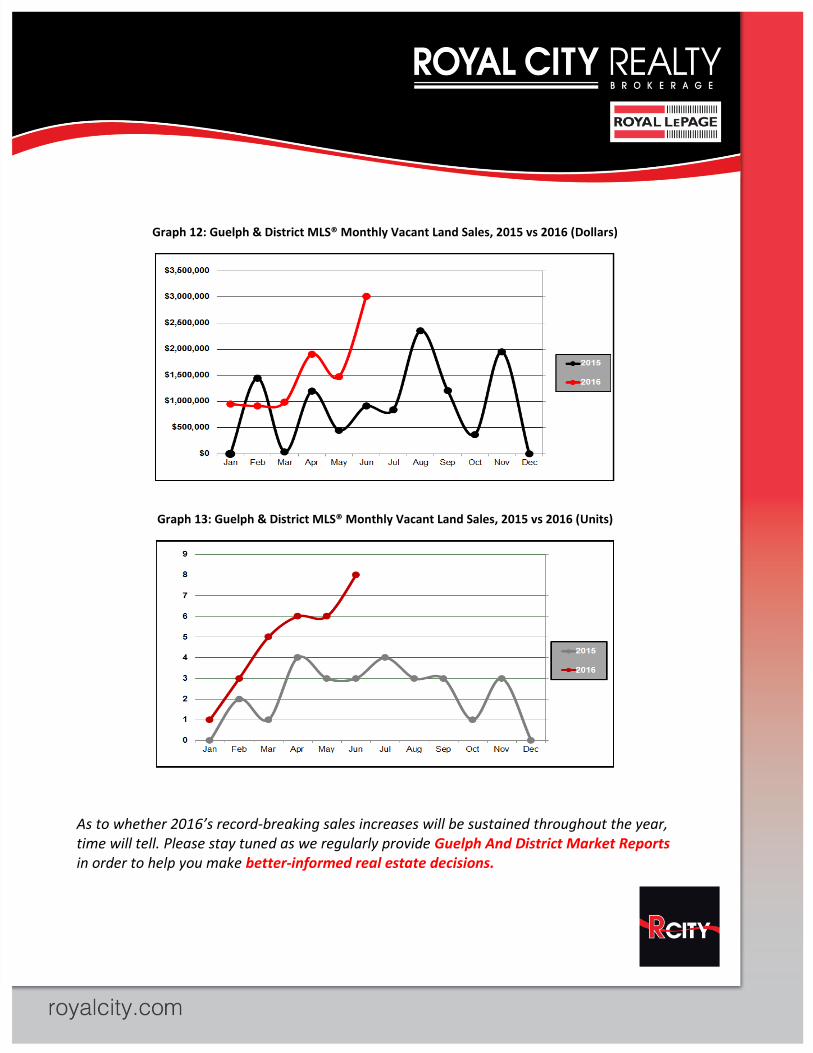
Graph 12: Guelph & District MLS® Monthly Vacant Land Sales, 2015 vs 2016 (Dollars)
Graph 13: Guelph & District MLS® Monthly Vacant Land Sales, 2015 vs 2016 (Units)
As to whether 2016’s record-breaking sales increases will be sustained throughout the year, time will tell. Please stay tuned as we regularly provide Guelph And District Market Reports in order to help you make better-informed real estate decisions.
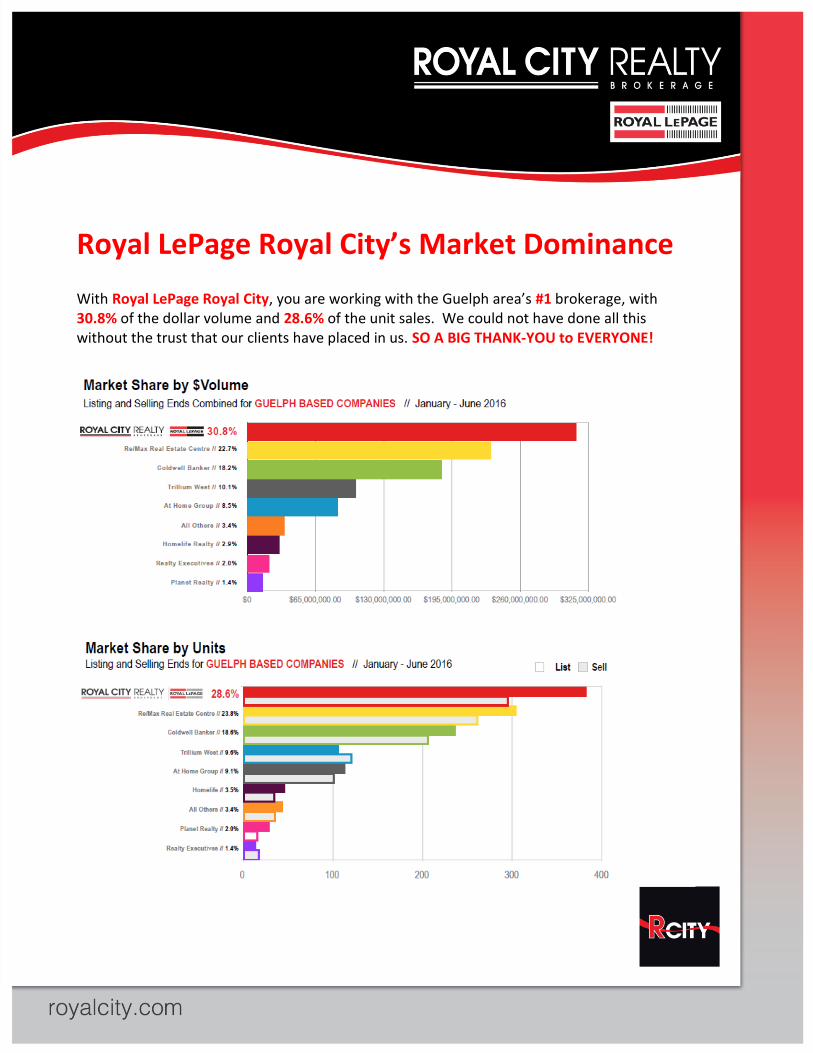
Royal LePage Royal City’s Market Dominance With Royal LePage Royal City, you are working with the Guelph area’s #1 brokerage, with 30.8% of the dollar volume and 28.6% of the unit sales. We could not have done all this without the trust that our clients have placed in us. SO A BIG THANK-YOU to EVERYONE!
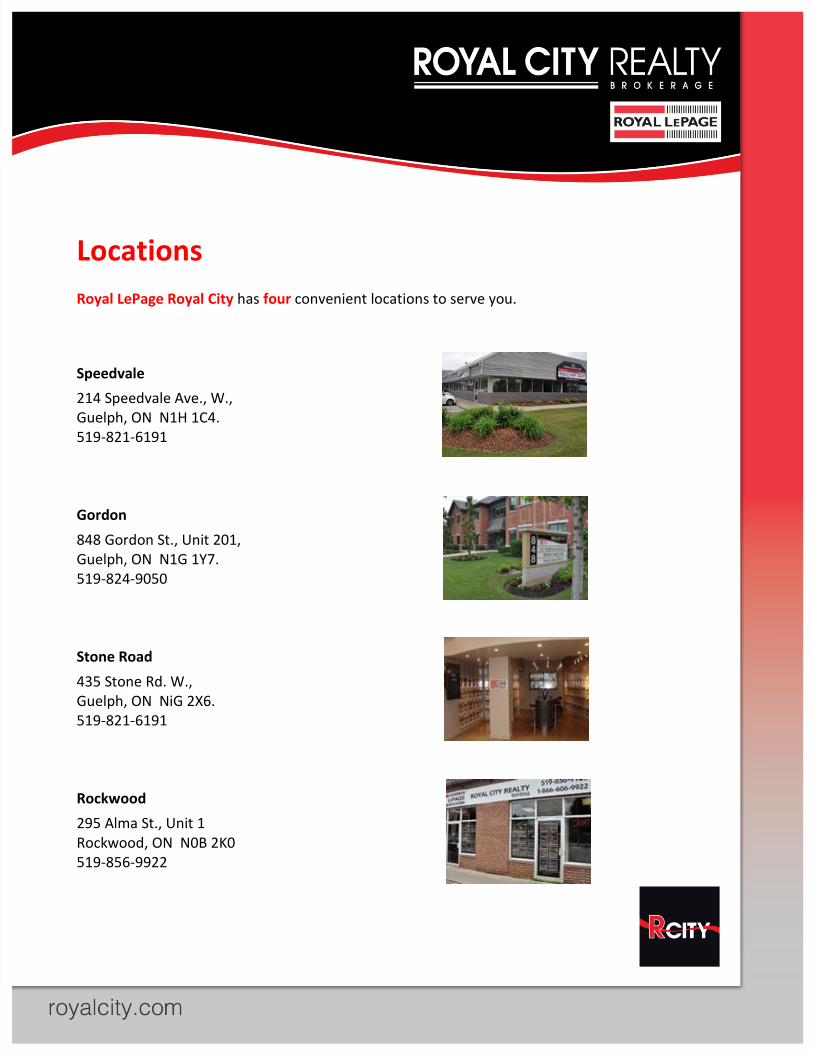
Locations Royal LePage Royal City has four convenient locations to serve you.
Speedvale
214 Speedvale Ave., W., Guelph, ON N1H 1C4. 519-821-6191 Gordon
848 Gordon St., Unit 201, Guelph, ON N1G 1Y7. 519-824-9050 Stone Road
435 Stone Rd. W., Guelph, ON NiG 2X6. 519-821-6191 Rockwood
295 Alma St., Unit 1 Rockwood, ON N0B 2K0 519-856-9922