guanidinium based anion exchange membranes for …
TRANSCRIPT

GUANIDINIUM BASED ANION EXCHANGE MEMBRANES FOR
SOLID POLYMER ALKALINE FUEL CELL APPLICATIONS
by
SYED DAWAR SAJJAD
Presented to the Faculty of the Graduate School of
The University of Texas at Arlington in Partial Fulfillment
of the Requirements
for the Degree of
DOCTOR OF PHILOSOPHY
THE UNIVERSITY OF TEXAS AT ARLINGTON
December 2015

ii
Copyright © by Syed Dawar Sajjad 2015
All Rights Reserved

iii
Acknowledgements
First and foremost I would like to express my sincere gratitude towards my
supervisor Dr. Fuqiang Liu, for his encouragement, academic and moral support
throughout the rough road of completing this research. At various stages of this
program, I was faced with some daunting times and it was his compassion and
reassurance which kept me going in those testing days. I am particularly grateful to
him for his genuine kindness and support.
My thesis committee remained a great source of guidance during my
research. I am grateful to Dr. Yi Hong, Dr. Pranesh Aswath, Dr. Yaowu Hao and
Dr. Kyungsuk Yum for their invaluable teachings and words of wisdom.
I want to recognize the Department of Materials Science and Engineering
for permitting me to benefit from all their facilities and for providing me the
opportunity to carry out my research without any hindrance. I also want to thank
all the department staff, particularly Jennifer and Beth for all their help and support.
I am highly indebted to my lab mates for their assistance over the years. A
special mention to Dr. Chiajen Hsu, Dr. Dong Liu, Dr. Noor, Zi, Amir and Yi for
their wonderful support.
I am most grateful to my beloved wife Ghazal for her unwavering support
and the confidence she instilled in me. It is due to the sacrifices she made for me
that I have been able to achieve this milestone. I am grateful to my family members,

iv
especially my mother for her unbelievable faith in me and her countless prayers for
my well-being and success. My father has sacrificed a lot for my education. I thank
him for always being my biggest source of inspiration. I would also like to mention
my brother for having my back and supporting me whenever I have needed him. I
also thank my father-in-law and mother-in-law for their continuous motivation and
prayers as well as my Aunt Shahnaz for being my home away from home.
However, lastly I would like to thank Allah for letting this opportunity come
my way and for always showing me light whenever the night was dark.
In the words Ali ibn Abi Talib (A.S), “Knowledge gives life to the soul”
November 19, 2015

v
Abstract
GUANIDINIUM BASED ANION EXCHANGE MEMBRANES FOR
SOLID POLYMER ALKALINE FUEL CELL APPLICATIONS
Syed Dawar Sajjad, PhD
The University of Texas at Arlington, 2015
Supervising Professor: Fuqiang Liu
Fuel Cells and low temperature traditional PEM Fuel Cells in particular
suffer from the acute yet long standing issues of cost and performance. This has
severely hindered the commercialization of fuel cells but Alkaline Anion Exchange
Membrane Fuel Cells (AAEMFCs) pose as a breakthrough technology by offering
improved conversion efficiency (a virtue of fast kinetics in the alkaline media) and
lower costs (from the prospect of using non-noble metal catalysts). However, before
systematic testing of non-noble metal catalysis is tested on this system, it is
imperative to develop a reliable anion exchange membrane which lies at the heart
of the fuel cell and solve their inherent problems of low conductivity and fast
degradation.

vi
In this work, a series of novel AEMs are developed based on the
guanidinium functional group. A bottom-up approach is taken starting with the
synthesis of the prepolymer. The guanidine polymer is synthesized through a
polycondensation reaction between a guanidinium salt and two different diamines.
The guanidinium functional group is attached directly to the polymer backbone to
enhance both ionic conductivity and durability. As a result of this configuration and
the resonance stabilized structure of guanidinium, it exhibited superior stability
compared to commercial quaternary ammonium AEMs after being exposed in
extreme conditions of 5 M KOH solution at 55°C for 50 h. This prepolymer is then
subject to minor post modification such as crosslinking or tethering a lipophilic
element to its main chain for suitable physio-chemical and mechanical properties.
In addition, to achieve these optimum properties along with the required
electrochemical performance, the membranes are eventually fabricated using two
different approaches.
The composite membrane is fabricated by incorporating guanidinium based
polymer solution into a porous polytetrafluoroethylene (PTFE) film. Polymer
crosslinking helped reinforce the mechanical strength of the membranes and
interlock the guanidinium moieties to the porous PTFE. The hybrid blend
membranes were obtained by blending the prepolymer with chitosan, another
strengthening agent. Whereas the composite membrane displayed an outstanding
ionic conductivity 80 mS cm-1 (at 20°C in deionized water), the hybrid blend

vii
membranes exhibited relatively lower values due to the effect from the blend
components. However, the selectivity (ratio of ionic conductivity to methanol
permeability) of the hybrid blend membranes is found to be superior even when
compared to commercial membranes. Similarly, when used in a direct methanol
alkaline fuel cells (DMAFCs) it fared even better than a commercial AEM
reference reaching to an OCV of 0.69 V compared to the 0.47V of Tokuyama A201
at room temperature. Overall, the developed membranes demonstrate superior
performance and therefore pose great promise for direct methanol anion exchange
fuel cell (DMAFC) applications.
Furthermore, through an experimental micro/nano phase analysis backed by
simulation, the hydroxide transport process is highlighted which before now has
not been well understood or experimentally probed in the past. The hydroxide
transport is hypothesized to take place through the development of an alternating
nanoscale ravine-ridged structure with increase in hydration of the membranes.
This mechanism be transferrable to other guanidinium based membranes and
extendible to other types of AEMs as well.

viii
Table of Contents
Acknowledgements ................................................................................................ iii
Abstract ................................................................................................................... v
List of Illustrations ............................................................................................... xiii
List of Tables ..................................................................................................... xviii
Introduction ............................................................................................ 1
Background & Objective of Study ......................................................... 8
2.1 Literature Review for AEMFCs .................................................................... 8
2.1.1 Evolution of Alkaline Fuel Cells ............................................................ 8
2.1.2 PEMFCs Vs AEMFCs .......................................................................... 10
2.1.3 Direct Alkaline Methanol Fuel Cells .................................................... 13
2.1.4 Kinetics of AEMFCs & Non-Noble Catalysts ..................................... 14
2.2 Literature Review of AEMs ........................................................................ 18
2.2.1 Anion Exchange Functional Groups ........................................................ 19
2.2.1.1 Efficacy of guanidinium as ion exchange groups .............................. 21
2.2.2 Classification of AEMs ............................................................................ 23
2.2.2.1 Heterogeneous membranes ................................................................ 24
2.2.2.2 Interpenetrating Polymer Network .................................................... 25

ix
2.2.2.3 Homogeneous Membranes ................................................................ 26
2.2.3 Stability of the ion exchange group.......................................................... 26
2.3 Hydroxide Conductivity Mechanism .......................................................... 31
2.3.1 Grotthuss Mechanism ........................................................................... 32
2.3.2 Diffusive Transport............................................................................... 33
2.3.3 Convection ............................................................................................ 33
2.3.4 Surface site hopping ............................................................................. 33
2.4 Objective of Study ....................................................................................... 35
Synthesis of Prepolymer & Fabrication of AEMs ............................... 37
3.1 Introduction ................................................................................................. 37
3.2 Synthesis of Guanidinium based prepolymer.............................................. 38
3.2.1 Mechanism of Polycondenstation reaction ........................................... 40
3.3 Fabrication of Composite Membranes ........................................................ 41
3.4 Fabrication of Hybrid Blended Gu-Chi Membranes ................................... 43
3.4.2 Hybrid (Gu-Chi) Blend membranes (Scheme 2a) ................................ 45
3.4.3 Hybrid Lipophilic [Gu(L)-Chi] blend membranes (Scheme 2b) .......... 46
3.5 Conclusion ................................................................................................... 48
Structural & Chemical Study ............................................................... 50

x
4.1 Introduction ................................................................................................. 50
4.2 Experimental Setup ..................................................................................... 51
4.2.1 FTIR...................................................................................................... 51
4.2.2 NMR ..................................................................................................... 51
4.2.3 SEM ...................................................................................................... 51
4.2.4 Raman ................................................................................................... 51
4.2.5 Mechanical Strength of Membranes ..................................................... 52
4.2.6 Thermal Analysis .................................................................................. 52
4.3 Characterization of Guanidinium Prepolymer ............................................ 52
4.4 Characterization of Composite Membrane ................................................. 55
3.5 Characterization of Blended Membranes .................................................... 65
3.6 Chemical (Hydroxide) Stability: ................................................................. 71
3.7 Conclusion ................................................................................................... 77
Electrochemical Study of AEMs .......................................................... 78
5.1 Introduction ................................................................................................. 78
5.2 Experimental Setup ..................................................................................... 79
2.5.4 Anionic Conductivity, Water/Alkali uptake & Dimensional Stability . 79
2.5.5 Methanol Permeability & Selectivity ................................................... 82

xi
5.3 Membrane Properties .................................................................................. 84
5.3.1 Anionic Conductivities & Water Uptake of Composite membrane ..... 84
5.3.2 Anionic Conductivies & Water Uptake of Hybrid Blend Membranes . 88
5.3.3 Study of Membrane Permeability ......................................................... 93
5.4 MEA Fabrication ......................................................................................... 99
5.5 Methanol Fuel Cell Study ......................................................................... 100
5.6 Conclusion ................................................................................................. 104
Micro/Nano Phase Analysis of Guanidinium based AEMs ............... 106
6.1 Introduction ............................................................................................... 106
6.2 Microstructure Raman Chemical Mapping ............................................... 108
6.3 Nanostructure AFM Study ........................................................................ 113
6.3.1 Experimental Setup............................................................................. 114
6.3.2 Results & Discussion .......................................................................... 114
6.4 Numerical Study of Transport Channels ................................................... 119
6.4.1 Setup for Simulation ........................................................................... 119
6.4.2 Simulating Ionic Transport Channels ................................................. 120
6.4.3 Simulated Ionic Conductivities .......................................................... 123
6.5 Conclusion ................................................................................................. 126

xii
Conclusion .......................................................................................... 130
7.1 Future Work .............................................................................................. 134
Appendix A Code for Simulating Membrane Structure ..................................... 136
Appendix B Simulated Structures ....................................................................... 145
References ........................................................................................................... 149
Biographical Information .................................................................................... 163
xiii
List of Illustrations
Figure 1-1: Simplified Ragone plot of the energy storage domains [1] ................. 2
Figure 2-1: Comparison of reactions that occur in various fuel cell systems [1] ... 8
Figure 2-2: The alkaline fuel cell system as used on the space shuttles [3] ........... 9
Figure 2-3: Differences between PEMFC & AEMFCs [6] .................................. 11
Figure 2-4: General scheme for O2 reduction in alkaline solutions. [9] ............... 16
Figure 2-5: Chemical structures of common anion-exchange sites [26]. ............. 20
Figure 2-6: The electron delocalization in the guanidinium group ....................... 21
Figure 2-7: The reaction for the proposed guanidine polymer with network
structure................................................................................................................. 23
Figure 2-8: Tree diagram of different AEMs [37] ................................................ 24
Figure 2-9: Degradation mechanisms for quaternary-ammonium AEMs ............ 27
Figure 2-10: Guanidinium AEM materials: (l) poly(arylene ether sulfone) with
tethered pentamethylguanidine [41], & (r) hexaalkylguanidinium groups anchored
on poly(aryl ether sulofone) [47] .......................................................................... 30
Figure 2-11: Schematic representation of the different transport mechanisms that
may be observed in an AEM [52] ......................................................................... 34
Figure 3-1: Overview of the polymer synthesis and fabrication process for
different membranes ............................................................................................. 37
Figure 3-2: Structures of the two diamines used in the polymerization ............... 38

xiv
Figure 3-3: Experimental setup for synthesis of the polymer ............................... 40
Figure 3-4 Impregnation of PTFE substrate with polymer ionomer solution ....... 43
Figure 3-5: Scheme for making the hybrid blended Gu-Chi membranes ............. 44
Figure 3-6: Thin film deposition through use of doctor blade .............................. 45
Figure 3-7: (a) Dry non-activated Gu-Chi5; (b) Activated wet Gu-Chi5.6 .......... 46
Figure 3-8: a) Lipophilic treated guanidine water dissolved in water (l) with
chitosan dissolved in 1% acetic acid solution b) The two solutions in ‘a’ mixed to
yield milky white blend which is mechanically stirred & heated at 60 oC .......... 48
Figure 4-1: Overview of the experimental tasks for meeting the objectives of the
proposal ................................................................................................................. 50
Figure 4-2: 1H-NMR spectra of (i) AEE monomer, (ii) HMDA monomer, (iii)
GHCl monomer, (iv) AEE based polymer and (v) HMDA based guanidine
polymer [49].......................................................................................................... 54
Figure 4-3: 13C-NMR spectra of (i) AEE based polymer and (ii) HMDA based
polymer [49].......................................................................................................... 55
Figure 4-4: (a) FTIR and (b) Raman spectra of the porous PTFE- and HMDA-
based composite membrane [49] .......................................................................... 57
Figure 4-5: SEM images of membranes: a) Porous PTFE substrate, b) Partially
penetrated composite membrane, AGM1, using 15% AEE-based polymer
solution. c) Fully impregnated and crosslinked membrane, HGMC, using 7.5%

xv
HMDA-based polymer solution, and d) Fully impregnated and crosslinked
membrane, AGMC, using 7.5% AEE-based polymer solution. [49].................... 59
Figure 4-6: Tensile tests of Porous PTFE and composite Gu-PTFE membrane .. 61
Figure 4-7: (a) TGA and (b) DTG curves for different polymers (*: crosslinked)
[49] ........................................................................................................................ 64
Figure 4-8: FTIR spectra of different membranes and their starting materials: 1)
non-activated Gu-Chi5.6 polymer, 2) activated Gu-Chi5.6 polymer, 3) Gu
prepolymer, 4) Gu(L) polymer, and 5) Chitosan. Gu, Chi, and (L) stand for
guanidinium, Chitosan, and lipophilic, respectively ............................................. 66
Figure 4-9: SEM micrographs of blend membranes, a) Gu-Chi2.2 b) Gu-Chi5.6 c)
Gu(L)-Chi2.5 ........................................................................................................ 69
Figure 4-10: Tensile test results of various blended membranes .......................... 70
Figure 4-11: Raman spectra of a) AEE and b) HMDA-based guanidinium
polymers exposed to 5 M aq. KOH at 55°C for different time intervals [49] ...... 72
Figure 4-12: FTIR spectra of a) AEE-based guanidinium polymer, b) HMDA-
based guanidinium polymer, and c) commercial Tokuyama A201 after exposure
to 5 M aq. KOH at 55°C for different time intervals [49] .................................... 75
Figure 5-1: Important membrane properties for good fuel cell performance ....... 78
Figure 5-2: Four-probe membrane conductivity measurement: (a) experiment
setup and (b) Nyquist plots to measure σ for Nafion 112 & HGMC (thickness =
50.8 & 25.4 µm respectively) ............................................................................... 81

xvi
Figure 5-3: Schematic (l) & actual (r) setup of the permeability test ................... 84
Figure 5-4: (top) Water uptake (%) and (bottom) Conductivity (S m-1) for various
crosslinked and noncrosslinked membranes ......................................................... 87
Figure 5-5: a) Conductivity and b) water/alkali uptake and swelling results of
different blend membranes [84] ............................................................................ 90
Figure 5-6: Guanidinium-Chitosan Blend interactions & intermolecular forces .. 93
Figure 5-7: Permeability of methanol in different membranes at a) 22 oC and b) 55
oC [84] ................................................................................................................... 97
Figure 5-8: Relative Selectivity factor of different membranes at room
temperature (*relative to Nafion N117) [84] ........................................................ 98
Figure 5-9: Schematic of direct methanol fuel cell ............................................. 100
Figure 5-10: Cell Polarization & OCV changes with chitosan content ii) Power
Density curves comparing fuel cell performance of different blended AEMs with
commercial A201 membrane. The thickness of Gu-Chi2.2 and Gu-Chi5.6 are 55
and 75 μm, respectively [84]............................................................................... 103
Figure 6-1: Raman Spectrographs of Guanidinium based polymer and chitosan
starting materials ................................................................................................. 108
Figure 6-2: Raman Mapping of hybrid blend Gu-Chi5.6 membrane; a) step size =
250µm x250µm & scan area = 1000µmx750µm b) step size = 125 µmx125µm &
scan size = 500 µm*375 µm c) step size = 25µm*25 µm and scan size = 100 µm
*75 µm ................................................................................................................ 112

xvii
Figure 6-3: Raman mapping of guanidinium based prepolymer: 25µmx25µm and
scan size = 100µmx75µm ................................................................................... 113
Figure 6-4: AFM images of Prepolymer; a) Wet; b) Semi Wet; c) Dry ............. 115
Figure 6-5: (3D view of) AFM images of Prepolymer; a) Wet; b) Semi Wet; c)
Dry ...................................................................................................................... 116
Figure 6-6: AFM images of hybrid Gu-Chi2.5 membrane; a) Wet; b) Semi Wet c)
Dry ...................................................................................................................... 117
Figure 6-7: Threshold grain detection of wet prepolymer film .......................... 118
Figure 6-8: Ionic flux simulated for membrane with Vc= 61, N=90; View: a) right
side b) top c) front d) isometric ........................................................................... 121
Figure 6-9: Isometric generated structures for membranes with a) Vc = 20; N=1;
b) Vc = 20; N=34; Vc = 61; N=90 ...................................................................... 123
Figure 6-10: Ionic Conductivity vs N for different Vc ........................................ 124
Figure 6-11: Ionic Conductivity vs Vc for different N ....................................... 125
Figure 6-12: Schematic of micro and nanostructure of prepolymer film. .......... 126
Figure 6-13: Summary of findings at nanoscale for guanidinium membrane .... 128
xviii
List of Tables
Table 1-1: Advantages & disadvantages of using fuel cells compared with other
mainstream technologies ......................................................................................... 4
Table 2-1: Advantages &disadvantages incurred by using AEMFCs instead of
PEMFCs ................................................................................................................ 12
Table 2-2: Fuels for AEM fuel cells with standard thermodynamic voltages and
energy densities. [6, 8] .......................................................................................... 13
Table 3-1: Solubility of different polymer material in water, alkali and methanol.
The ‘ticks’ denote soluble while ‘crosses’ denote insoluble ................................ 47
Table 4-1: EDX results for pristine PTFE substrate and fully impregnated AEE
based composite membrane (AGMC) [49] ........................................................... 60
Table 4-2: Temperature (oC) of mass changes (∆m) for different samples
calculated from TGA curves. (*: crosslinked samples) [49] ................................ 65
Table 4-3: Summary of mechanical properties for different membranes from the
tensile tests ............................................................................................................ 71
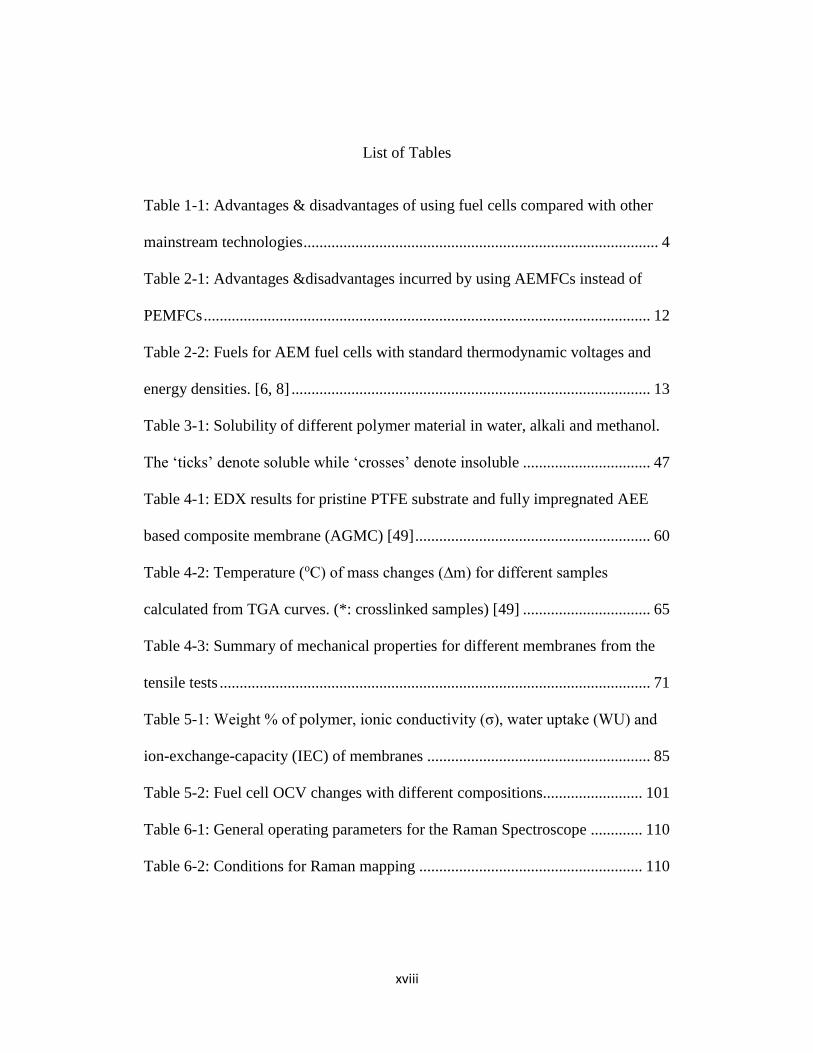
Table 5-1: Weight % of polymer, ionic conductivity (σ), water uptake (WU) and
ion-exchange-capacity (IEC) of membranes ........................................................ 85
Table 5-2: Fuel cell OCV changes with different compositions......................... 101
Table 6-1: General operating parameters for the Raman Spectroscope ............. 110
Table 6-2: Conditions for Raman mapping ........................................................ 110

xix
Table 6-3: Grain data of wet prepolymer film from threshold analysis ............. 118
Table 6-4: Summary of data from AFM grain analysis ...................................... 119

1
Introduction
Energy consumption that relies on combustion of fossil fuels is forecast to
have a severe impact on both future world economics and ecology. Electrochemical
energy devices are under serious consideration as alternative energy/power sources
because they are potentially sustainable, environmentally friendly and
economically competitive. The best candidate for electrochemical energy storage
and conversion are namely batteries, fuel cells, and electrochemical capacitors
(ECs). All three of them consist of two electrodes in contact with an electrolyte and
they thus share the same common feature, i.e., the electrochemical reactions
processes taking place at the boundary of the electrode/electrolyte interface and
separated electron and ion transport. However, their principle and actual
mechanisms of energy storage and conversion are different. In batteries and fuel
cells, electrical energy is generated by conversion of chemical energy via redox
reactions at the anode and cathode while electrochemical capacitors
(supercapacitors) in contrast, may have energy not delivered via redox reactions,
but double-layer charging/discharging
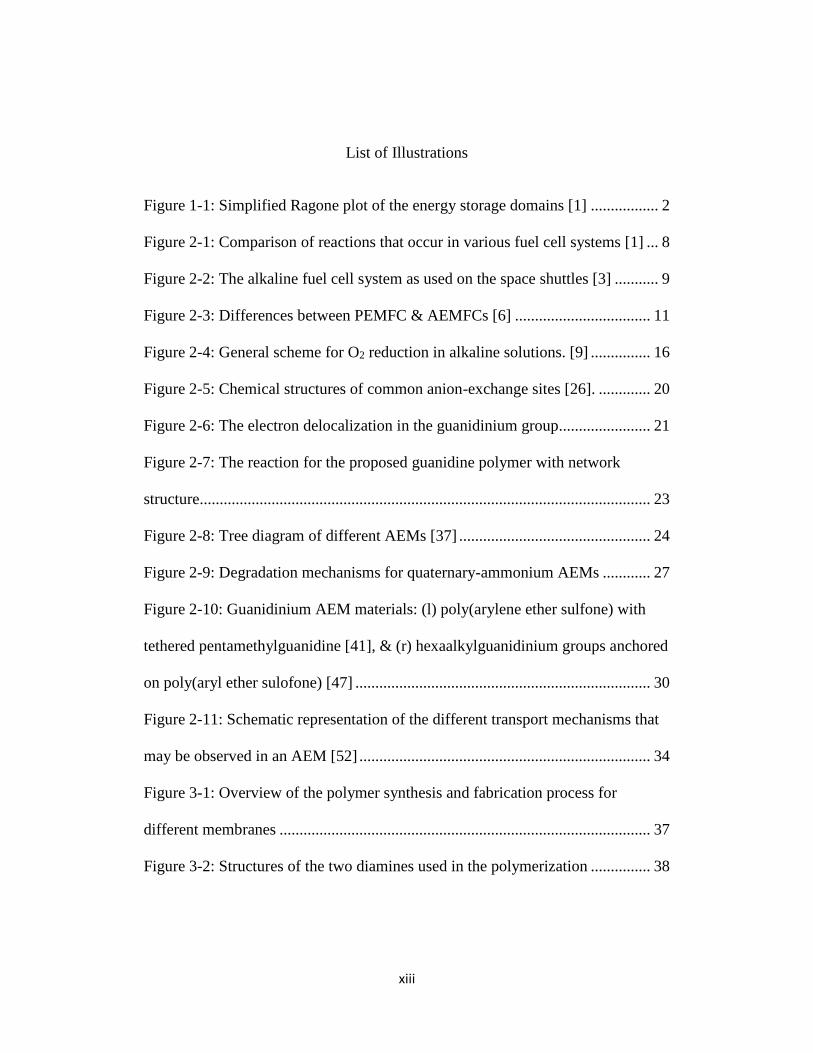
The Ragone plot in Figure 1-1 is used to compare the usefulness and
applications of these three electrochemical devices. The units for the “specific
energy” or “energy density” on the horizontal axis are watt-hours per kilogram

2
(Wh/kg)] and watt-hours per liter (Wh/L)] respectively. Supercapacitors being
limited to high-power systems have found applications in niche markets as memory
protection in several electronic devices. Fuel cells on the other hand are considered
high-energy systems and have been considered for several stationary and mobile
applications like their competing batteries which possess intermediate energy and
power characteristics.
Figure 1-1: Simplified Ragone plot of the energy storage domains [1]
The difference between batteries and fuel cells is related to the locations of
energy storage and conversion. Batteries are closed systems. They are sealed
devices so that their materials can be protected from degradation reactions with
moisture and air. They are comprised of an anode and cathode being the charge-

3
transfer medium and they are the ones that take an active role in the redox reaction
as “active masses”. Hence, energy storage and conversion occur in the same
compartment. In contrast a fuel cell is a reactor where reactants have to be
continuously provided and products are removed constantly. Fuel cells are hence,
open systems where the anode and cathode are just charge-transfer media and the
active masses undergoing the redox reaction are delivered from outside the cell.
The active masses are thus provided either from a tank for example, fuels such as
hydrogen and hydrocarbons or from the environment, for example, oxygen from
air. This means that energy storage (in the tank) and energy conversion (in the fuel
cell) are thus locally separated.
The main impetus to develop fuel cells is that they offer the cleanest power
generation possible. They also operate quietly and can be located close to the
application. Compared to gasoline engines or thermal power plants, they produce
much less greenhouse emissions and can be more efficient in conversion of the
energy in a fuel into power. Fuel cells are best suited as a steady energy sources
and are an ideal power source for remote site locations and places where an assured
uninterrupted electrical supply is required. However, they can also be used for
applications that require varying power demands, such as automotive applications
in hybrid configurations. Table 1-1 below compares the various pros and cons
associated with use of fuel cells.

4
Table 1-1: Advantages & disadvantages of using fuel cells compared with
other mainstream technologies
Advantages Disadvantages
efficient energy
conversion
complex to operate
modular construction best as primary energy source
nonpolluting impurities in gas stream shorten life
low maintenance pulse demands shorten cell life
silent expensive
safe limited availability
high energy density low durability; low power density per
volume
In addition the chemical energy stored in hydrogen and several hydrocarbon
fuels is significantly higher than that found in common battery materials. This fact
provides strong motivation to develop fuel cells for a variety of applications. For
example, the direct conversion of methanol fuel cells (5-25 W) are proposed for
portable electronics as a replacement for Li ion and Ni-MH batteries. The more
promising commercial applications of fuel cells appear to be as a stationary power
source for central and distributed power stations (megawatts) and as mobile power
for portable electronic devices and automobiles.
5
Direct methanol fuel cells for portable electronic devices such as notebook
computers seem close to commercial reality and will compete with batteries for this
market. The key challenge for each will be to meet the cost-performance barrier in
a small size as well as governmental regulations. It is estimated that the fuel cell
market for distributed power and demonstration projects and contracts amounted to
about $100 million for 2003[2]. Research and development contracts to develop
fuel cells for automotive propulsion and stationary energy storage are an order of
magnitude larger.
Fuel cells, which originally were intended to replace combustion engines
and combustion power sources due to possible higher energy conversion
efficiencies and lower environmental impacts, are now under development to
replace batteries to power cellular telephones and notebook computers and for
stationary energy storage. The motivation for fuel cells to enter the battery market
is simple. With operation times of typically <3000 h and, at least to an order of
magnitude, similar costs, batteries are less strong competitors for fuel cells.
However despite all this research and development, fuel cells find it difficult
to compete with gas/steam turbines and combustion engines because of inferior
power and energy performance, much higher costs and insufficient stability
(durability and lifetime). All these factors hinge upon the catalyst and membrane
components of the fuel cell which are the most important functionally and also the
most expensive. Hence, this study aims to utilize the relatively newer alkaline

6
anion exchange membrane fuel cells (AAEMFCs) which have the ability to at least
theoretically by-pass these barriers. It can combat these large pitfalls which have
restricted other types of fuel cells mainly because of the anion exchange membrane
used here. The anion exchange membrane used in alkaline environment offers the
best kinetics amongst all other types of fuel cells granting better performance to the
system. Equally important is the possibility of using cheaper non-noble metal
catalysts which will not only lower the cost of fabrication significantly but also
ensure better stability in the alkaline environment.
This study uses this type of fuel cells (AAEMFCs) with guanidinium as the
functional material in the base polymer for fabricating the anion exchange
membranes. Guanidinium by virtue of its high basicity has exhibited one of the best
anionic conductivity values and long term durability due to its resonance-
stabilization promises greater. Hence, this polymer is uniquely modified to create
novel anion exchange membranes in search of breakthrough in fuel cell technology
in this work.
This PhD dissertation begins with a broad description of polymer electrolyte
membrane based fuel cells and the anion exchange type (hydroxide conducting) in
particular along with their selection criteria. It discusses and justifies the
importance of implementing AEMFCs and compares the superiority of the
guanidinium group with other functional head groups in literature. The last part of

7
the background in Chapter 2 talks about relevant fundamentals in membrane
transport and discusses the proposed functional mechanism of AEMs.
Chapter 3-5 covers the experimental methodologies in fabricating the
membranes and their structural as well as electrochemical characterizations. This
also includes a concluding fuel cell study to test their performance in end
application
Chapter 6 covers a Micro/Nano Phase Analysis of the membranes and
guanidinium based prepolymer. It also includes a numerical study supported by
AFM images to understand the mechanism of hydroxide transport through
Guanidinium based AEMs. This is essential because the literature on this subject is
still not mature as AEMs are still in a developing phase compared to their analogue
PEMs which are highly developed and commercialized and their transport
phenomena are well understood. Lastly, Chapter 7 summarizes the key findings of
this work and proposes future work to build upon this study.

8
Background & Objective of Study
2.1 Literature Review for AEMFCs
2.1.1 Evolution of Alkaline Fuel Cells
Fuel Cells are a fairly old technology and their invention is attributed to Sir
William Grove in as early as 1839. Performance and costs issues compounded by
tough competition from fossil based fuels prompted the evolution of this basic
concept into a number of different fuel cells illustrated in Figure 2-1.
Figure 2-1: Comparison of reactions that occur in various fuel cell systems
[1]

9
Out of these, alkaline fuel cells (AFCs) have the best performance (for
temperatures lower than 200oC) by virtue of their superior electro-kinetics. In fact
one of the first poignant application of fuel cells (Figure 2-2) was undertaken by
NASA in their space missions using AFCs as a source of reliable with low volume
and weight, at virtually unconstrained cost.
Figure 2-2: The alkaline fuel cell system as used on the space shuttles [3]
But a big drawback is that unless ultra-pure oxygen can be supplied,
traditional AFCs undergo electrolyte electrode degradation caused by the formation
of carbonate/bicarbonate (CO32-/ HCO3
-) in the liquid alkaline electrolyte on
reaction of OH- ions with CO2 contamination in the oxidant gas stream [4, 5]. The
solid carbonate or bicarbonate crystals form in the electrolyte-filled pores of the
electrodes thus blocking them and also mechanically disrupt and destroy the active
layers. The formation of carbonate/bicarbonate reactions is described as:
CO2 + 2OH- → CO32- + H2O
CO2 + OH- → HCO3-

10
This has severely limited the applications of AFCs. However, this issue
caused by carbonate precipitates on the electrodes can be avoided in utilizing a new
generation of alkaline fuel cells called the alkaline anion exchange membrane fuel
cells (AEMFCs). This type of fuel cell uses a membrane electrode assembly
utilizing a solid polymer electrolyte membrane (instead of liquid aq. KOH) similar
to proton exchange membrane fuel cells (PEMFCs). However, the membrane
conducts anions instead of protons as used in PEMFCs. Hence, AEMFCs likely
combine two important advantages: the solid polymer electrolyte doesn’t offer any
cation in the liquid phase to take part in the formation carbonates, yet facile kinetics
of the AFCs can still be used.
2.1.2 PEMFCs Vs AEMFCs
Figure 2-3 shows the difference in the schematics of PEMFCs and
AEMFCs. The make-up of the membrane electrode assembly is similar but the main
difference is in the actual polymer electrolyte membranes. The membrane in the
PEMFC is proton-conducting while the membrane in the AEMFC is hydroxide-
conducting. Hence, there is a difference in their respective electrode reactions as
shown below:
(a) PEMFC:
Anode: H2 2H+ + 2e-
Cathode: ½ O2 + 2H+ + 2e- H2O
(b) AAEMFC:

11
Anode: 2H2 + 4OH- → 4H2O + 4e-
Cathode: (3/2) O2 + 3H2O + 6e- → 6OH-
Figure 2-3: Differences between PEMFC & AEMFCs [6]
This change in transport of hydroxide ions instead of protons in AEMFCs,
though seemingly a small difference, it leads to a serious of both positive and
negative repercussions on the entire fuel cell system. These are listed in Table 2-1.

12
Table 2-1: Advantages & disadvantages incurred by using AEMFCs
instead of PEMFCs
Advantages of AEMFCs: Disadvantages for AEMFCs
Fuel crossover is reduced Inherent mobility of OH- is lower than a H+
Choice of larger variety of fuels AEMs have degradations and long term
stability issues
Superior kinetics
Non-noble metal catalysts potential
The immediate advantage that is incurred by switching from PEMFCs to
AEMFCs as already highlighted is the more facile oxygen reduction reaction
(ORR) in alkaline environments than in acidic environments. The alkaline
environment leads to a further two pronged effect by facilitating the use of less
expensive non-noble metal catalysts with high stability in alkaline environments
[7] and enhancing the electro-oxidation kinetics for many liquid fuels (including
non-conventional choices such as sodium borohydride) in the alkaline environment
[6]. Hence, the flexibility in terms of fuel and catalyst choice widens and allows
selection of better highly selective catalysts that are more tolerant to fuel crossover.
To add to this effect, due to hydroxide flow from the cathode to anode, now the
electroosmotic drag associated with this ion transport opposes the crossover of

13
liquid fuel in AEMFCs, thereby permitting the use of more concentrated liquid
fuels.
2.1.3 Direct Alkaline Methanol Fuel Cells
These can be considered a subset of AEMFCs. The use of AEMS in what are
traditionally called Direct Methanol Fuel Cells (DMFCs) may solve several
problems PEMs struggled for with decades, while still allowing the electro-kinetic
advantages of AFCs. The utility of DMFCs stems mainly from the higher
volumetric energy density and reversible efficiencies of methanol compared with
liquid hydrogen (see Table 2-2). Another factor is the relative ease of conversion
of the current petroleum distribution networks to methanol compared with the
costly whole new distribution structure and infrastructure required for hydrogen.
Table 2-2: Fuels for AEM fuel cells with standard thermodynamic
voltages and energy densities. [6, 8]
Fuel Eo/V We/kWhkg-1 We/kWh dm-3 ηrev
Hydrogen 1.23 39 2.6 (liquid
hydrogen)
0.83
Methanol 1.21 6.1 4.8 0.97
Ethanol 1.15 8 6.3 0.97
Propanol 1.07 8.6 6.8 0.93
Ethylene Glycol 1.22 5.3 5.9 0.99

14
The use of AEMs in DMFCs allows other advantages. The ion transport
within the membrane will be from the cathode to the anode, opposing the direction
of, and hence reducing the level of, methanol crossover from anode to cathode. In
reality, water will actually be electro-osmotically transported from the cathode to
the anode, which is the reverse of the situation found with PEM-based DMFCs. As
the water is now produced at the anode and consumed at the cathode, the water
management regime is hence drastically improved. The two factors above avert the
long standing problem of catastrophic flooding at the cathode from electro-osmosis
of water in PEM-based DMFCs, reducing mass-transport-derived voltage losses.
Finally, DMFCs are amenable to a great number of portable applications as
well by virtue of the good energy density of liquid methanol, even when compared
to most state of the art batteries (5–10 times that of batteries). Another benefit of
using DMFCs instead of batteries is ‘‘instant’’ refueling when utilizing a plug-in
methanol cartridge. Hence, in this study we have chosen DMFCs as the fuel cell
system to test our fabricated AEMs. However, there is a need to address the two
problems stated in table before these membranes can be successfully utilized in
high demand applications such as fuel cell. The next section which is a detailed
literature review on AEMs discusses these problems and their solutions.
2.1.4 Kinetics of AEMFCs & Non-Noble Catalysts
Superior cathode kinetics and ohmic polarization just two of the numerous
advantages AEMFCs bring over their competing PEMFCs. It is however, important

15
to discuss how these inherently fast kinetics of oxygen reduction reactions in
particular are obtained. In doing so we first need to discuss the nature of the oxygen
reduction reaction.
The oxygen reduction in aqueous alkaline media is a complicated multistep
electrocatalytic reaction with many proposed intermediates such as O, OH, O2-, and
HO2-. This leads to a great number of possible pathways as illustrated by the model
in Figure 2-4. It shows the general scheme that can explain the observed ORR
behavior in alkaline media. The model looks seemingly complicated but the
pathways can be divided into three groups. Two of these lead to OH- as the final
product signifying complete reduction, with transfer of four electrons and one leads
to peroxide signifying partial reduction, with transfer of two electrons. Hence, they
are correspondingly described as ‘direct’ and ‘series’ pathways. In the latter,
hydrogen peroxide is produced (HO2- in alkaline media) as an intermediate which
is eventually reduced to OH-. It is widely accepted that proton transfer to O2,
producing adsorbed HO2 or HO2-, occurs before cleavage of the O–O bond during
the ORR on Pt-group metals. Formation of an intermediate adsorbed HO2 species
is likely in both two- and four-electron pathways, but the interpretation of this
species is different in alkaline media than in acidic media. In alkaline conditions,
the much lower working potential of an ORR electrode is likely to facilitate
desorption of HO2 as the HO2- ion. However, in acidic media desorption becomes
much more difficult due to its higher working potential. HO2 desorption is restricted

16
so that further protonation (to produce H2O2) is required in order for peroxide
desorption to finally occur.
Figure 2-4: General scheme for O2 reduction in alkaline solutions. [9]
The pH is considered to play a remarkable role in electro-kinetics since a
long time but the fundamental reason remained elusive. Also according to the
Nernst equation, the working potential range shifts by -59 mV for every increase of
1 pH unit while the working potential range when measured on an absolute scale
such as the standard hydrogen electrode (SHE) it shifts by nominally 0.83 V as a
result of a change from a 1 N solution of strong acid to a 1 N solution of strong base
[10]. This changes the local double layer structure and the electric field at the
electrode–electrolyte interface, leading to changes in adsorption & desorption

17
strengths even for neutral species (hinted at in the previous paragraph). The effect
of pH was aptly exhibited in a reference where the effect of pH on the oxygen
electro-reduction of Ag (111) surface, by comparing the ORR activity in 0.1 M
KOH and 0.1 M HClO4 solutions (pH difference = 12 units) was investigated [11].
The authors would attribute their results to the influence of adsorbed anions from
the supporting electrolyte not directly involved in the oxygen electroreduction
reaction (spectator species). Their inhibiting effect is manifested by blocking the
active sites required for adsorption onto Platinum surface of oxygen electro-
reduction reaction intermediates. Spendelow & Wieckowski covered the same
reasoning in an excellent review [10] on the subject again stating that the enhanced
activity in alkaline media is attributed to the lack of specifically adsorbing spectator
ions in alkaline solutions, and the higher coverage of adsorbed OH at low potential
(a requirement for methanol oxidation). The effect of the alkaline media in terms
of kinetics cannot however be denied. Tripković et al. exemplify this by achieving
kinetics much higher in alkaline than in acid solution. The kinetics were improved
by a factor of 30 for Pt (and 20 for Pt2Ru3) at 333 K and 0.5 V [12]. Again, the pH
effect is attributed to the pH competitive adsorption of oxygenated species with
anions from supporting electrolytes.
Combined with the less corrosive nature of the alkaline environment,
AEMFCs promise not only greater longevity but also use of non-noble catalysts.
Hence, alkaline direct methanol direct fuel cells have been established using non-

18
precious metals, such as silver catalysts [13] and perovskite-type oxides [14]. In
addition, a variety of catalytic materials have been investigated for application as
oxygen cathodes in alkaline media. These include carbon, various transition metals,
coinage metals, metal macrocycles, including porphyrins, and phthalocyanines, and
metal oxides, including manganese dioxide as well as various spinels [12].
Individual details will not be provided here as the focus of this dissertation is the
AEM and not the electro-catalyst.
2.2 Literature Review of AEMs
Utilizing AEMs in fuel cell application place certain material requirements
on the membranes particularly with regard to their performance, structural integrity
and longevity. The basic requirements for developing AEMs for fuel cell
application are summarized below:
1) Efficient hydroxyl transport & high ionic conductivity
2) Correct selectivity for the active ions
3) Outstanding chemical stability in alkaline conditions
4) Good barrier to electrons to provide effective separation between anode and
cathode
5) Thin membranes (<100 µm) in order to keep good mechanical stability
when immersed in water and also to decrease the cost of the system

19
6) Good mechanical and thermal integrity during both manufacturing and
operation
7) Low cost
The first set of requirements relate to the properties of the ion exchange
group while the second relate to how these ion exchange groups are incorporated
in the bulk composition and the method of fabricating the membrane. These two
criteria are respectively discussed in sections 2.2.1-3.
2.2.1 Anion Exchange Functional Groups
Historically, AEMs have been used mainly in electrodialysis for the
desalination of brackish water and for the production of table salt from seawater.
However, development of AEM materials has been a subject of extensive research
activities in the last decade. The ion exchange group, chemical structure,
crosslinking, and polymer chain flexibility of AEMs are all believed to play
important roles in both conductivity and durability. Among the recent development
of different kinds of AEMs [15-25], a number of ion exchange groups have been
investigated and are illustrated in Figure 2-5. From left to right in the top row these
are pyridinium, ammonium, phosphonium and sulfonium and in the bottom row
these are guanidinium and imidazolium.

20
Figure 2-5: Chemical structures of common anion-exchange sites [26].
However, the majority of the research involves the use of quaternary
ammonium as anion exchange sites [27-29]. These membranes generally exhibit a
much lower conductivity at the same ion exchange capacity (IEC) when compared
to proton exchange membranes (PEMs). The mobility of hydroxide anions is
generally considered to be nearly half of that of protons which contributes
significantly to this loss in conductivity [30, 31]. Despite this, great strides have
been made to significantly improve conductivity values by enhancing micro-phase
separation as demonstrated by Hickner et al. [24]. Zhang et al. [18] also employed
this approach through a non-choromethylation and pre-quaternary-amination route
to fabricate membranes which displayed conductivities between 65–87 mS cm-1 at
20–60 oC. However, their membranes showed extensive swelling and doubtful

21
chemical stability which highlights the underlying needs for future AEM
development.
2.2.1.1 Efficacy of guanidinium as ion exchange groups
Recently, investigation of guanidinium moieties as anion exchange sites
[31-34] has yielded promising results to overcome the above-mentioned technical
difficulties. The high basicity of guanidinium has led to conductivity values as high
as 67 mS cm-1 at 20oC and 74 mS cm-1 at 60 oC [32]. Besides, membrane stability
can be potentially improved due to the inherent charge delocalization from the π-
electron conjugated system of the resonance structure shown in Figure 2-6 [32,
35]. However, guanidinium moieties as ion-exchange groups have been mostly
attempted as side-chain groups in AEMs [32, 33, 36].
N+
N N
N
N N+
OH-
OH- N
N+
N
OH-
Figure 2-6: The electron delocalization in the guanidinium group
We propose to study integrated network membranes containing
guanidinium moieties in polymer backbone to enhance both membrane

22
conductivity and durability. Considering the branched nature of the moieties, the
polymer electrolyte with guanidinium groups (Figure 2-7) tethered to the polymer
backbone potentially provides a higher IEC and better polymer integrity, improving
both membrane conductivity and chemical/electrochemical stability. Due to the
simple nature of the starting monomers and their proposed polymer structure, the
resulting findings may also be extrapolated for other guanidinium based systems
thus acting as a model for guanidinium ion exchange groups and proving the
feasibility of these materials as promising AEM materials in alkaline fuel cells.
Furthermore, to the best knowledge of the investigators, no modification to the
guanidine polymers has been done to meet the comprehensive requirements in an
alkaline fuel cell MEA, e.g., solubility, conductivity, and mechanical properties.

23
Figure 2-7: The reaction for the proposed guanidine polymer with network
structure
2.2.2 Classification of AEMs
Once the preferred ion exchange groups have been shortlisted, they still
have to be incorporated into robust membranes for utilization in high-end
applications such as fuel cells. This is another area which has impeded AEM
progress. Whereas for PEMs Nafion and other sulfonated polymers represent strong
and stable membranes enabling their commercialization, AEMs have
comparatively struggled in the synthesis and fabrication process. This has not
+
NH2
NH2 NH2
Cl
NH3
NH2H2N
R
n n
-
NH2
NH NH
Cl
Rn
n
NH
NH NH
Cl
R
R
RNH
NH
NH Cl
R
NH
HN
NH
Cl
R R
HN
HN
NH
Cl
R
R
R

24
stopped researchers from trying and the combination of different materials and
techniques used has led to the following classifications for AEMs. Looking at
Figure 2-8, there are three broad classification namely interpenetrated polymer
networks, heterogeneous and homogenous membranes.
Figure 2-8: Tree diagram of different AEMs [37]
2.2.2.1 Heterogeneous membranes
Heterogenous membranes have the ion exchange group embedded in an
inert material. This type of membrane is further divided into two types: ion
solvating membrane and hybrid ones, depending on the nature of the inert material.
If the inert material is in the form of a salt it is called ion solvating. Ion solvating
membranes usually comprise of a matrix (water soluble polymer), a hydroxide salt
(mostly KOH) and some plasticizer. The alkaline salt is responsible for the
electrochemical properties while the polymer matrix contributes towards the

25
mechanical properties. The ionic conductivity is dependent on the interactions
between the hydroxide salt and cations.
The hybrid membrane on the other hand has the inert compound in the form
of an inorganic material. Hence they are usually composed of organic and inorganic
segments. The organic part provides the electrochemical properties and the
inorganic part (siloxane or silane) contributes to the mechanical properties of the
membrane. These membranes are mostly formed through the sol-gel process;
although, other methods like intercalation, blending etc. can also be used.
2.2.2.2 Interpenetrating Polymer Network
IPN or Interpenetrating Polymer Network is a combination of two polymers
in network form of which at least one polymer is synthesized or cross-linked in the
immediate presence of the other without any covalent bonds between them. One of
the polymers is conductive while the other is hydrophobic (doesn’t swell when in
contact with water). The combination of having conductive polymer transports
anions and hydrophobic polymer providing good chemical, thermal and mechanical
properties leads to strong membranes with an excellent mixture of said properties.
These membranes which are usually heterogeneous blends often swell in solvents
without dissolving in them. [8].

26
2.2.2.3 Homogeneous Membranes
Having the simplest concept, the most extensive work and research has been
done on these type of AEMs. They can be considered as one phase systems. The
cationic charges are covalently bound to the polymer backbone as sidegroups and
to maintain the electro-neutrality of the polymer a mobile counter ion is associated
with each ionic functional group. The further three sub-classifications simply are
related to the method of fabricating the membrane.
2.2.3 Stability of the ion exchange group
The main cause of the degradation of the various cationic groups at the
anion-exchange sites (Figure 2-9) is the basicity of the medium [20]. Among these
different species, quaternary ammonium groups are more chemically and thermally
stable than quaternary phosphonium and tertiary sulfonium groups. It has been
shown that these cations tend to degrade under aqueous conditions at high pH, due
to the hydroxide counter ions, following two main degradation pathways (Figure
2-9) when temperature increases: elimination [38] and nucleophilic substitution
mechanisms [39].

27
Figure 2-9: Degradation mechanisms for quaternary-ammonium AEMs
The extent of both elimination [38] and nucleophilic substitution [26]
degradation mechanisms is determined by the nature of the ion exchange functional
groups (in this and in most cases quaternary ammonium since they are the ones
most deeply investigated up till now). The E2 elimination reaction known as
“Hofmann Elimination” occurs when a substituent in the β-position of the nitrogen
atom has at least one hydrogen atom. The alkalized quaternary ammonium group
is correspondingly cleaved yielding an amine and an olefin as part of the
degradation products. The nucleophilic substitution route for degradation
Direct nucleophilic
substitution-pathway 1
C
C
HH
H
H
N+Me3 C
C
H
H
H
NMe3+ + HOH
Me2+N
C
H
H H
Me2N
+ MeOH
CH
H
N+Me2C
HHO
H
NMe3+OH-Direct nucleophilic
substitution-pathway 2
Hoffman elimination reaction

28
corresponds to two SN2 reactions between an OH− anion and a carbon atom in the
α-position of the ammonium group. Again two products are generated: an amine
and this time an alcohol. As mentioned, several factors inherent to the structure of
the polymer allow the competition between these mechanisms. Thus, on the one
hand, if no hydrogen is located on the α-carbon, the degradation mainly consists in
a SN2 substitution. On the other hand, highly nucleophilic or hindered bases and the
presence of a carbon atom in β-position of the ammonium preferentially lead to an
E2 elimination reaction.
Hence, chemical degradation of AEMs stems largely from nucleophilic
attack of hydroxide ions on the fixed cationic sites, which results directly in a loss
of ion-exchange groups, and a subsequent decrease in OH- conductivity.
Degradation mechanisms of AEMS have virtually always been studied on
quaternary-ammonium groups, even though research on new ion exchange groups
has increased dramatically [17, 40-43]. Though recent membrane degradation
studies [23, 44, 45] on quaternary ammonium groups have provided some
fundamental understandings that may be applied to other types of AEMs, but with
considerable limitation. For example, membrane conditions that lead to poor
solvation of OH- ions may enhance chemical degradation of the cations. Chemical
stability is less dependent on modification of the alkyl groups that attach to the
cationic moieties [46]. Of course, the above statements may be valid for non-

29
quaternary-ammonium AEMs in some sense, as the nucleophilic attack by OH- ions
contributes to the chemical degradation in most of cases.
The stability of the guanidinium groups due to their inherent charge
delocalization is expected to surpass that of the quaternary ammonium groups.
Indeed early studies in literature do point towards greater stability. For example,
when guanidinium moieties were inserted onto poly (arylene ether sulfone) (PES)
[41], higher ionic conductivity was observed due to their higher basicity and
hydrophilicity. In addition, the decrease in this ionic conductivity was negligible
when chemical stability tests were performed on the membrane. Finally they also
showed better thermal stability compared to their ammonium bearing equivalents
[41, 47].
However, it is well known from studies on quaternary ammonium based
AEMs that ion exchange groups acting in pendent positions may not be very stable.
For example, guanidinium groups anchored to polymer side chains (as in the above
references) may be easily lost if the single bond attached to the base polymers is
cleaved by hydroxide ion attack, as shown in Figure 2-10.

30
Figure 2-10: Guanidinium AEM materials: (l) poly(arylene ether sulfone)
with tethered pentamethylguanidine [41], & (r) hexaalkylguanidinium groups
anchored on poly(aryl ether sulofone) [47]
This is because when ion exchange groups are tethered in the polymer
backbone, chemical degradation due to either Hoffman elimination or direct
nucleophilic substitution [48] is not possible. We propose to study integrated
network membranes containing guanidinium moieties in polymer backbone to by-
pass these degradation mechanisms. This coupled with the high basicity, resonance
stabilization of the π-system and the “Y-delocalization” of the guanidinium group
is expected to enhance both membrane conductivy and durability. Indeed our
preliminary chemical durability experiments (Chapter 4.3.6) [49] under harsh
alkaline conditions corroborated this hypothesis. Guanidinium integrated network
membranes showed superior hydroxide resistance compared to the commercialized
quaternary ammonium based Tokuyama A201.
Although the studies cited in this section have made important contributions
toward developing guanidinium AEMs, the full range of possible application owing

31
to the desirable properties of guanidine-based polymer materials, especially those
related to high hydroxide ion conductivity and chemical stability, remains uncertain
in an alkaline AEM fuel cell environment. The knowledge gained from this work
will provide a greater understanding of the fundamental aspects of hydroxide
conduction and AEM degradation, and could open up new opportunities in the
synthesis of novel membrane electrode materials in alkaline AEM fuel cells.
2.3 Hydroxide Conductivity Mechanism
An AEMFC works by allowing passage of anions usually hydroxide ions to
pass through its anion exchange membrane. This conduction and mobility of the
hydroxide ions through the membrane is hence an underlying principal of AEMFC
operation. The importance of investigation in this area can be summarized by the
following arguments:
i. There is very little prior study on any possible mechanisms and hence our
understanding of this subject is inadequate
ii. Understanding of hydroxide conductivity is key to developing AEMs with
higher conductivities
iii. It may help in designing AEMs with better secondary properties such as
degree of swelling & mechanical integrity
iv. It may also help in tuning reaction parameters to get better performance
from the AEMs
32
The present literature on the mechanism for hydroxide ion transport is still
in its infancy. However, many simulations and experiments have been conducted
to establish reliable models for proton exchange through H3O+ in water. Given the
similar dependence of ionic conductivity values for both PEMs and AEMs on
experimental conditions such as temperature, degree of hydration etc, it is
reasonable to deduce that they would share some combination of the same
mechanism. The mechanisms are namely: Grotthuss mechanism, diffusive
transport, convection and surface hopping.
2.3.1 Grotthuss Mechanism
The Grotthuss mechanism by virtue of the transport rates it can provide is
thought to be the most dominating mechanism for proton transport. Since OH-
exhibits Grotthuss behavior in aqueous solutions comparable to protons [50, 51], it
is assumed that this behavior is responsible for transporting the majority of the OH-
[52].
The mechanism however is different than transfer of protons. It is
postulated that the hydroxyl anions tend to have stable solvation shells that re-
organize the solvent molecules and disturb the hydrogen bond network (whereas in
contrast, the hydrogen ions are naturally integrated into the hydrogen bonding
network of water). Basically, the hydroxyl ions are transported through the
membrane along a chain of water molecules through hydrogen bond formation and
cleavage of the hydrogen bond. In fact, it is claimed that the transfer of hydrated

33
hydroxyl ion is accompanied by a hyper-coordinating water molecule. It has been
proposed [51] that the movement of the hydrated hydroxyl ion is accompanied by
a hyper-coordinating water molecule. The subsequent arrival of another electron-
donating water molecule leads to hydrogen bond rearrangements, re-orientations
and hydrogen ion transfer resulting in the formation of a fully tetrahedrally
coordinated water molecule.
2.3.2 Diffusive Transport
This type of transport occurs in the presence of a concentration and/or
electrical potential gradient. Due to their similar molecular weights comparable en
masse diffusion coefficients can be anticipated for both OH− and H3O+ in water
[52].
2.3.3 Convection
Convection occurs via permeation and osmotic drag. Convective flow of
water molecules across the membrane appears as hydroxides moving through the
membrane, drag water molecules with them through the membrane.
2.3.4 Surface site hopping
Surface site hopping of hydroxyl anions occurs on the ion exchange
functional groups (e.g. quaternary ammonium groups) present on the membrane
and is generally thought of a secondary transport process [37]. The reason for this
is on the basis of length scales in the system while also considering coulombic
interactions between the functional groups and their OH− carriers that will try to
34
promote the electroneutrality. The water present in the system acts as a permanent
dipole and interacts with the fixed charges of the membrane. This strong
coordination of water molecules around the ion exchange functional groups imparts
a reduction of the possibility of the ionic species to interact with the ion exchange
functional groups on the membrane.
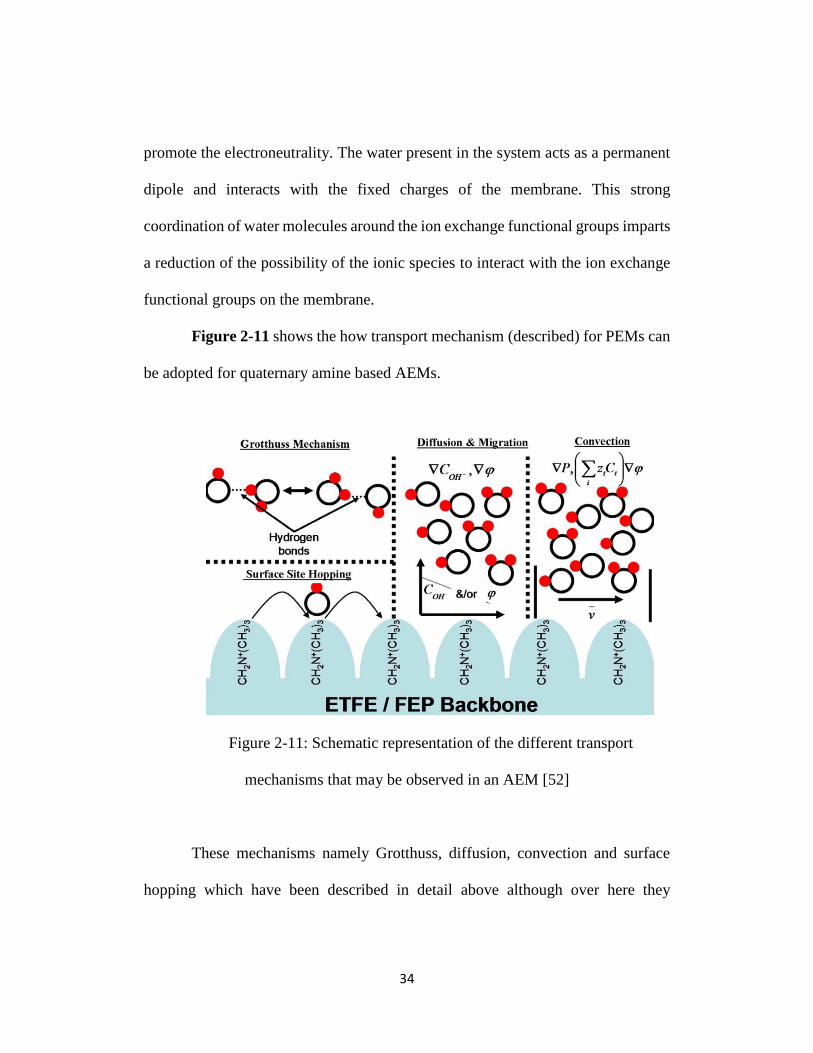
Figure 2-11 shows the how transport mechanism (described) for PEMs can
be adopted for quaternary amine based AEMs.
Figure 2-11: Schematic representation of the different transport
mechanisms that may be observed in an AEM [52]
These mechanisms namely Grotthuss, diffusion, convection and surface
hopping which have been described in detail above although over here they

35
illustrated with reference to quaternary ammonium groups, they can be applied to
guanidinium functional groups as well both depend on hydroxide conductivity.
Hence, the aim of this chapter is to understand the fundamental nature of hydroxide
conduction through the guanidinium functionlized membranes used in this
dissertation supported by the mechanisms and theories of both other AEMs and
PEMs reported in literature. To accomplish this task the structure of the AEMs are
studied at the nanoscale using atom force microscope (AFM) under different
hydration conditions and this is followed by a computer simulation to recreate these
structures whilst estimating the contributing hydroxide conductivities.
2.4 Objective of Study
The objective of this research is to develop a family of robust anion
exchange membranes with guanidinium moieties incorporated in the polymer
backbones for high performance alkaline fuel cells. The strong basic nature and
resonance structure of the guanidinium functional group would lead to high
hydroxide conductivities and superior thermal and chemical stability.
To test this hypothesis, a bottom-up approach is taken starting with
successful synthesis of said guanidinium based polymers and their modifications
for fabricating versatile anion exchange membranes and including development for
the end-product fuel cell applications.
36
Development of these anion exchange membranes represent and will help
achieve a breakthrough technology for fuel cells which have been strongly impeded
by constraints of performance and cost. By utilizing the more facile kinetics of the
alkaline media and prospects of using cheaper non-noble catalysts, this study hopes
to remove these two-pronged problems which have plagued the fuel industry since
its inception.
In addition, there is far little information known regarding the hydroxide
transport mechanism through anion-exchange membranes. This dissertation
includes a fundamental study by microstructure analysis coupled with meaningful
simulation to gauge a better understanding of this process. Understanding the
transport properties of guandinium based membranes and anion exchange
membranes in particular will contribute greatly to the tailoring of ionic conductivity
and design of superior performing yet stronger future membrane.

37
Synthesis of Prepolymer & Fabrication of AEMs
3.1 Introduction
A bottom-up approach is taken where the polymer material is first
synthesized from scratch with the monomers via polycondensation. This
prepolymer is used as is or modified through crosslinking/blending etc before being
used to fabricate the anion exchange membranes. Because the prepolymer is
mechanically weak by itself, it is therefore supported by a PTFE substrate to make
a composite membrane (Scheme 1) or blended with a stronger polymer (chitosan)
to yield hybrid blended membranes (Scheme 2). Figure 3-1 illustrates this:
Scheme 1: Composite (Gu-PTFE) Membrane
Scheme 2a: Blended (Gu-Chi) Membrane
Scheme 2b: Lipophilic Blended (Gu(L)-Chi) Membrane
Film deposition
Condensation Polymerization
Porous PTFE substrate ----> Gu-PTFE composite membrane
NHR
NHC
NH2
+
n
Cl-
O
NH2OH
OO
OHNH2
OH OH
n
via direct evaporation & Doctor Blade Blended Gu-Chi membrane
Figure 3-1: Overview of the polymer synthesis and fabrication process for
different membranes

38
The polymer synthesis parameters and mechanism along with the
membrane fabrication procedure are detailed in length in the following sections.
3.2 Synthesis of Guanidinium based prepolymer
Guanidinium-based polymers were synthesized through a condensation
reaction between guanidine hydrochloride salt (GHCl) and two different diamines
(HMDA and AEE) as shown in Figure. 3-1. While Figure 3-2 shows structure of
the two diamines which are different to serve as a good comparison but similar
enough as an effective control agent to each other.
Hexamethylenediamine, HMDA:
CH2
CH2
CH2
CH2
CH2
CH2NH2
NH2
1, 2- Bis(2-aminoethoxy) ethane, AEE:
CH2
CH2
O
CH2
CH2
ONH2
CH2
CH2
NH2
Figure 3-2: Structures of the two diamines used in the polymerization
Equimolar mixture of the diamines and GHCl was first put into a flask
equipped with a reflux condenser. A heating mantle was hooked with a PID

39
controller and the arrangement is shown in Figure The mixture was mechanically
stirred while the reaction was conducted at 100°C for 1 h, 140°C for 2h, and then
180°C for 4h, before it was allowed to cool down. At 140 oC, the flask was attached
to a vacuum to suck and accelerate the removal of ammonia in order to facilitate
the condensation reaction. While at 180 oC, the reaction flask was purged by a slow
flow of Argon to maintain an inert atmosphere and prevent polymer degradation.
The weight of the polymer product is obtained by measuring the mass of
the final flask (with the polymer product) and subtracting it with the weight of the
empty flask prior to adding any reagents.
The polymer is hard to extract manually. But since it is water soluble, it is
therefore dissolved in water and removed from the flask. This polymer solution was
slowly heated over a hot plate with temperature kept at approximately 50 oC. Since
the total polymer product is known, the polymer/water ratio can be calculated at
any time by measuring the total weight of the solution. Required amounts of
polymer solution are then extracted for various modifications such as crosslinking
and polymer blending in order to eventually fabricate anion exchange membranes.

40
Figure 3-3: Experimental setup for synthesis of the polymer
3.2.1 Mechanism of Polycondenstation reaction
Hexamethylene diamine (HMDA) and guanidine hydrochloride (GHCl)
react to form polyhexamethyleneguanidine hydrochloride (PHMGHC) and
ammonia. The synthesis route was derived and modified from references [53, 54]
albeit for antimicrobial applications. It is also water-soluble as discussed previously
and possesses pronounced antiseptic and fungicidal properties.
The starting materials, GHCl & HMDA however, due to the presence of
amino groups are strong bases capable of binding even with weak acid. GHCl has
been described as a complex compound, in which a positive charge is delocalized
over nitrogen atoms and the chlorine anion is bound electrostatically [55].

41
However, according to an alternative concept, a positive charge is localized on the
carbon atom of the GHCl molecule, which is proved by the absence of absorption
bands in the ammonium region of 2700–2250 cm–1 of the GHCl IR spectrum [56].
Furthermore, quantum chemical calculations of GHCl by the semi empirical
method or semi-rule of thumb also shows the presence of positive charge on the
carbon atom in contrast to positive charge delocalized on nitrogen atoms [57].
Therefore, the mechanism of HMDA and GHCl polycondensation was suggested;
it represents transamination reaction and realizes as nucleophylic substitution
mechanism [57, 58].
3.3 Fabrication of Composite Membranes
The synthesized polymers were dissolved in an aqueous solution with 5wt%
of DMSO and subsequently transferred to a beaker. The polymer solution was then
mixed vigorously for five minutes prior to being transferred to a porous PTFE film
(kindly supplied from Phillips Scientific Inc. with porosity of 90% and thickness of
25.4 µm). For some polymer samples, solution viscosity increased more
dramatically during the bulk condensation polymerization process, thus inhibiting
further growth of polymer chains. In order to increase the molecular weight as
reported elsewhere [53], EP was added to the polymer solution (in equimolar ratio
to the initial monomers) prior to transferring to the porous PTFE substrate. In this

42
way, impregnation into the porous substrate and crosslinking of the polymers could
occur simultaneously.
The setup for adding the polymer solution to the porous PTFE and forming
the composite membrane is illustrated in Figure 3-4, according to our previous
reports [59, 60]. The PTFE with the polymer solution was heat-treated on a hot
plate. The temperature increased slowly to ensure evaporation of the solvents
without forming bubbles. After being maintained at 100 oC for 12 hours, the
membranes were transferred to a vacuum oven where they were heated to 130 oC
for 24 hours. After cooling down to room temperature, the membranes were
thoroughly washed and submerged in 1 M KOH for 48 hours to allow sufficient
time for hydroxide ion exchange and functionalization of the membranes.

43
Transferring solution to
opaque porous PTFE
Heat treatment for evaporating excess
solvents and polymer impregnation leading
to transparant composite membrane
Transparant
Composite Membrane
Porous Membrane
Opaque
Figure 3-4 Impregnation of PTFE substrate with polymer ionomer solution
3.4 Fabrication of Hybrid Blended Gu-Chi Membranes
In scheme 2, Chitosan is blended with the guanidinium based prepolymer
to improve the mechanical integrity of the final membrane. Chitosan is chosen as a
suitable blend material for several reasons:
1) It has high molecular weight and so good strength
2) It has excellent film making properties and hence is conducive to
make membranes
3) It is stable and has previously been used for AEMs
4) It is a cheap and abundant material

44
In addition, lipophilic blended Guanidinium-chitosan membranes were also
made. This includes the additional step of incorporating a long chained stearate
group to the structure. The rationale for doing this is again an improvement in the
membrane mechanical properties and changing its dissolution properties. The
details of this and of the blending process illustrated in Figure 3-5 are discussed in
the following sections.
Scheme 2b: Lipophilic Blended (Gu(L)-Chi) Membrane
NHR
NHC
NH2+
n
Cl-
O
NH2OH
OO
OHNH2
OH OH
n
Scheme 2a: Blended (Gu-Chi) Membrane
NHR
NHC
NH2+
n
Cl-
+80 °C
In DI water solutionNH
RNH
C
NH2+
n
A-
ANa +
Where: A = CH3(CH2)16COO
R = (CH2)602
Figure 3-5: Scheme for making the hybrid blended Gu-Chi membranes

45
3.4.2 Hybrid (Gu-Chi) Blend membranes (Scheme 2a)
5.6 g of guanidinium polymer was blended in a solution comprising of
different amount of chitosan (5.6 g and 2.2 g). Initially the guanidinium polymer
and chitosan were separately dissolved in deionized water and a slightly acidic
solution (~1% acetic acid), respectively. After being completely dissolved, they
were mixed and mechanically blended via a mechanical stirrer at approx. 70 oC as
shown in Figure 3-5. With the evaporation of most of the solvent, the blend formed
sticky slurry which was used to cast membranes on a flat glass slab by a doctor
blade (see Figure 3-6). The casted membranes were then heat treated in an oven at
70 oC for 6 h before putting it in a vacuum oven at 110 oC for 10 h.
Figure 3-6: Thin film deposition through use of doctor blade
The membranes were then thoroughly washed and submerged in 1 M KOH
(aq) for 48 h to allow for complete hydroxide ion exchange and functionalization
of the membranes. Afterwards they were subsequently washed and stored in

46
deionized water for at least 24 h before use in a fuel cell or other characterization
tests.
Figure 3-7: (a) Dry non-activated Gu-Chi5; (b) Activated wet Gu-Chi5.6
3.4.3 Hybrid Lipophilic [Gu(L)-Chi] blend membranes (Scheme 2b)
This type of membrane was fabricated to further modify and in particular
improve the integrity of the membrane, which would decrease its fuel permeability.
Also, the precipitation reaction with sodium stearate yielded the polymer insoluble
in water and soluble in methanol instead (Table 3-1). This promises a route for
future ionomer and membrane development as dissolution and swelling of the
materials in MEAs are considered to result in primarily loss of mechanical strength,
increasing fuel crossover, and eventually failure of fuel cells.
a b

47
Table 3-1: Solubility of different polymer material in water, alkali and
methanol. The ‘ticks’ denote soluble while ‘crosses’ denote insoluble
Material Water Alkali Methanol
Guanidine
Prepolymer
Gu-PTFE
Gu-Chi
Gu(L)
Gu(L)-Chi
An equal mass of sodium stearate and guanidinium polymer was dissolved
in water and then mixed with each other (Scheme 2b of Figure 3-5). The
temperature of the mixture was raised to 70 oC while continuously mixing the
solution to allow the precipitation reaction (color of the mixture changes abruptly
as shown in Figure 3-8) to occur until most of the solvent has evaporated. The
remaining white solid was insoluble in water and had no odor. After it was
separated and dried, 5.6g of this lipophilic guanidinium polymer was dissolved in
methanol and added to a solution of water containing 2.5g of chitosan. The mixture
was again blended at 70 oC, but this time the membrane film was achieved by slow
evaporation of excess solvent as the blend proved too viscous under application of
a doctor blade. Finally, the same heat treatment and hydroxide functionalization
procedure to the one described in the previous section was applied.

48
Figure 3-8: a) Lipophilic treated guanidine water dissolved in water (l)
with chitosan dissolved in 1% acetic acid solution b) The two solutions in ‘a’
mixed to yield milky white blend which is mechanically stirred & heated at 60 oC
3.5 Conclusion
A series of novel composite and hybrid blended AEMs are synthesized by
incorporating guanidinium-based polymers into a porous polytetrafluoroethylene
(PTFE) film. The guanidinium-based polymers are polymerized using a simple
condensation process between a guanidinium salt and two different diamines so
that the guanidinium cations are attached directly to the polymer backbone to
enhance both conductivity and durability.
Two diverse yet straightforward techniques are used to fabricate the AEMs.
The composite membrane is supported by a porous PTFE substrate. The prepared
solution based on the guanidinium prepolymer is used to penetrate these pores.
Crosslinking is also attempted to obtain better interlocking with the substrate.
a b

49
Similarly, the prepolymer is blended with chitosan and this slurry is used to
obtain hybrid blended membranes. Chitosan is used as the mechanical
reinforcement while the prepolymer contains the ion exchange group.

50
Structural & Chemical Study
4.1 Introduction
Research is designed to develop a new family of AEMs – integrated
network membranes with guanidinium moieties as ion-exchange groups in the
polymer backbone. The membranes are then subject to structural, chemical and
electrochemical characterization as required for AEMFC applications. The figure
below gives an overview of the necessary tasks to meet the research aims of this
project. They include polymer synthesis, membrane fabrication and
characterization followed by fuel cell and electrochemical studies including
stability assessments:
Figure 4-1: Overview of the experimental tasks for meeting the objectives
of the proposal

51
4.2 Experimental Setup
4.2.1 FTIR
FTIR spectra of the blend membranes and starting materials were
recorded using Thermo Nicolet 6700 FTIR Spectrometer in ATR mode with a
resolution of 16 cm−1 within the range of 800-4000 cm-1.
4.2.2 NMR
The polymers were initially dried in vacuum at 60oC for 16 h as well as
freeze dried to remove any trace of DI water. 1H and 13C NMR spectra for the
different monomers and resulted polymers were measured at 300 MHz on a JNM
ECS 300 spectrometer (JEOL, Tokyo, Japan) to verify their chemical structures.
DMSO-d6 was used as the solvent, and tetramethylsilane was used as an internal
standard.
4.2.3 SEM
The morphology and microstructure of all the membranes were observed by
means of a scanning electron microscope (Hitachi S-3000N Variable Pressure
SEM). The samples were sputtered with silver before studying them under the
SEM.
4.2.4 Raman
Studies using Raman spectroscopy were performed on a Thermo Scientific
DXR Raman microscope at a wavelength of 780 nm and 100 mW in the range of
200-3400 cm-1.
52
4.2.5 Mechanical Strength of Membranes
Mechanical properties such as tensile strength, total elongation and fracture
strength were measured with a MTS advantageTM tension tester at room
temperature. A programmed elongation rate of 10 mm/min was adopted until break.
Membrane sample dimensions were approximately of 3 mm x 14.5 mm.
4.2.6 Thermal Analysis
TGA/DTA from TA Instruments (SDT Q600) with heating rate 10 oC min-
1 under N2 flow rate of 60 ml min-1 was used to assess the thermal stability of the
guanidine polymers.
4.3 Characterization of Guanidinium Prepolymer
1H NMR spectra for the monomers were shown in Figure 4-2 i-ii). The two
diamines, AEE (Figure 4-2i) and HMDA (Figure 4-2ii), showed their
characteristic peaks at δ =3.46 ppm (peak 4) and δ=1.23 ppm (peak 8), respectively.
These peaks are attributed to the protons in their amine groups. Upon
polymerization, these peaks should disappear and be replaced by the guanidino
peaks similar to the one shown by the GHCl in Figure 4-2iii (peak 9 at δ=7.162
ppm). This is indeed demonstrated by the spectra of the resulting polymers in
Figure 4-2 iv and v. The broad peaks for the AEE based polymer (peak 13) and the
HMDA based polymer (peak 17) are attributed to the guanidino group (H1 on
C=NH2+) in the range of 6.20-8.20 ppm. The reason that these two peaks showed a

53
low-intensity appearance and broadening may be due to relaxation of nitrogen and
slow exchange rate of the proton on C=NH2+ with other protons [61]. In order to
further prove our proposed chemical structure of the guanidinium functionalized
polymers, C13 NMR was performed on both polymers. The peaks 21 and 25 (Figure
4-3i and ii) at δ=156.3-157.9 ppm were the corresponding peaks for the guanidino
group. They were relatively stronger here and again matched well with similar
structures in literature [41] illustrating the presence of the guanidinium group
within our synthesized polymers.

54
14 12 10 8 6 4 2 0
14 12 10 8 6 4 2 0
14 12 10 8 6 4 2 0
14 12 10 8 6 4 2 0
14 12 10 8 6 4 2 0
1
23
4
8
5
7
6
9
12
11
10
13
141516
17
4-2 i) AEE monomer
4-2 ii) HMDA monomer
4-2 iii) GHCl monomer
4-2 iv) AEE based polymer
4-2 v) HMDA based polymer
DMSO-d6
DMSO-d6
DMSO-d6water
DMSO-d6
DMSO-d6
water
Chemical Shift, ppm
NH2
CH2
CH2
O
CH2
CH2
O
CH2
CH2
NH2
NH2
CH2
CH2
CH2
CH2
CH2
CH2
NH2
C
NH2
NH2
+
NH2
NH
CH2
CH2
CH2
CH2
CH2
CH2
NH
C
NH2
+
1 2
3
5
6
7
9
14
15
16
17 n
CH2
CH2
O
O CH2
CH2 CH2
CH2 NH
NH C
NH2
+Cl
-
10
11
12
13 n
Cl-
Cl-
4
8
Figure 4-2: 1H-NMR spectra of (i) AEE monomer, (ii) HMDA monomer,
(iii) GHCl monomer, (iv) AEE based polymer and (v) HMDA based guanidine
polymer [49]

55
2 0 0 1 5 0 1 0 0 5 0 0
2 0 0 1 5 0 1 0 0 5 0 0
4-3 i) AEE based polymer
201819
21
2223
24
25
DMSO-d6
DMSO-d6
Chemical Shift, ppm
4-3 ii) HMDA based polymer
19
20CH2
CH2
O
O CH2
CH2 CH2
CH2 NH
NH C
NH2
+
n18
Cl-
22
23
24NH
CH2
CH2
CH2
CH2
CH2
CH2
NH
C
NH2
+Cl
-
n
21
25
Figure 4-3: 13C-NMR spectra of (i) AEE based polymer and (ii) HMDA
based polymer [49]
4.4 Characterization of Composite Membrane
The FTIR spectra of the pristine porous PTFE substrate and the impregnated
composite membranes were shown in Figure 4-4a. Compared with the pristine
PTFE membrane, the composite membranes showed two new peaks at 3320 and
1630 cm-1. The broad band at 3320 cm-1 was associated with stretching vibration of
the N-H bonds, and the one at 1630 cm-1 was assigned to vibrations of C=N in the
guanidinium groups. The peak at 1200 cm−1 associated with the underlying C–F
group in the PTFE was observed in all the samples. The results show that successful

56
incorporation of the guanidinium moieties into the porous PTFE substrate has been
achieved.
The above result was further confirmed by the Raman Spectra in Figure 4-
4b. Raman peaks obtained from the pristine PTFE membrane were compared to
those from the top and bottom surfaces of the HMDA based composite membrane.
In agreement with the literature [54], Figure 4-4b clearly indicated the
characteristic Raman peaks for the guanidine polymer against the background of
the underlying PTFE. The broad band between 3100 and 3450 cm-1 were attributed
to -NH2 stretching vibrations while the large peak at around 2910 cm-1 was denoted
to aliphatic C-H symmetric stretching bands. The peak at 1610 cm-1 was attributed
to -NH vibrations, while both the bands at 1310 and 1450 cm-1 were assigned to the
bending vibrations of the -CH2 groups on the alky chains. The top surface of the
composite membrane showed a higher intensity for all of these peaks probably
indicating that a polymer surface layer which was understandably slightly thicker
than the layer on the bottom surface.
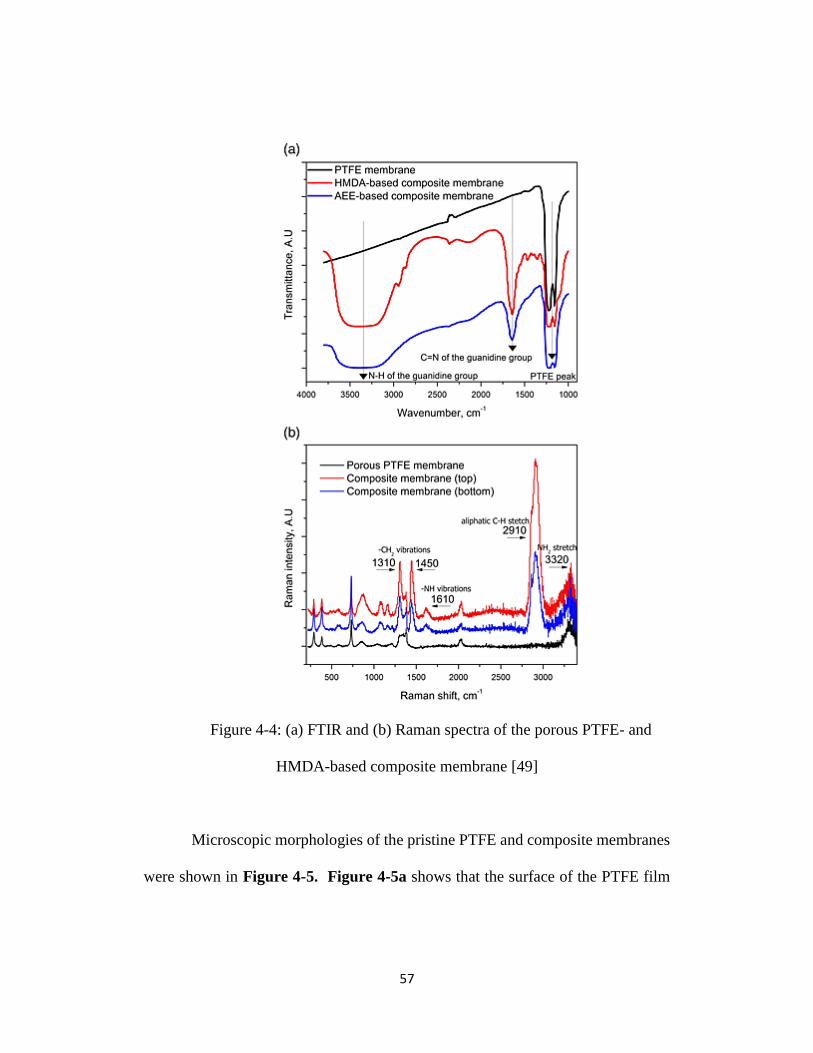
57
Figure 4-4: (a) FTIR and (b) Raman spectra of the porous PTFE- and
HMDA-based composite membrane [49]
Microscopic morphologies of the pristine PTFE and composite membranes
were shown in Figure 4-5. Figure 4-5a shows that the surface of the PTFE film
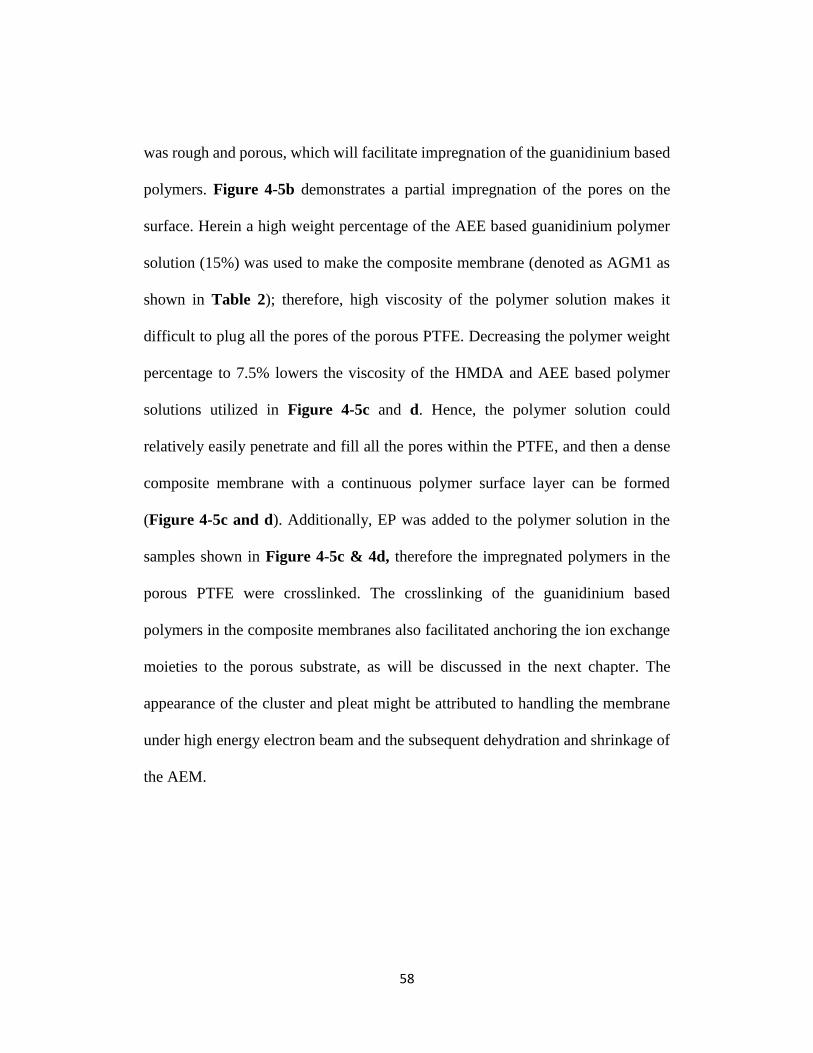
58
was rough and porous, which will facilitate impregnation of the guanidinium based
polymers. Figure 4-5b demonstrates a partial impregnation of the pores on the
surface. Herein a high weight percentage of the AEE based guanidinium polymer
solution (15%) was used to make the composite membrane (denoted as AGM1 as
shown in Table 2); therefore, high viscosity of the polymer solution makes it
difficult to plug all the pores of the porous PTFE. Decreasing the polymer weight
percentage to 7.5% lowers the viscosity of the HMDA and AEE based polymer
solutions utilized in Figure 4-5c and d. Hence, the polymer solution could
relatively easily penetrate and fill all the pores within the PTFE, and then a dense
composite membrane with a continuous polymer surface layer can be formed
(Figure 4-5c and d). Additionally, EP was added to the polymer solution in the
samples shown in Figure 4-5c & 4d, therefore the impregnated polymers in the
porous PTFE were crosslinked. The crosslinking of the guanidinium based
polymers in the composite membranes also facilitated anchoring the ion exchange
moieties to the porous substrate, as will be discussed in the next chapter. The
appearance of the cluster and pleat might be attributed to handling the membrane
under high energy electron beam and the subsequent dehydration and shrinkage of
the AEM.
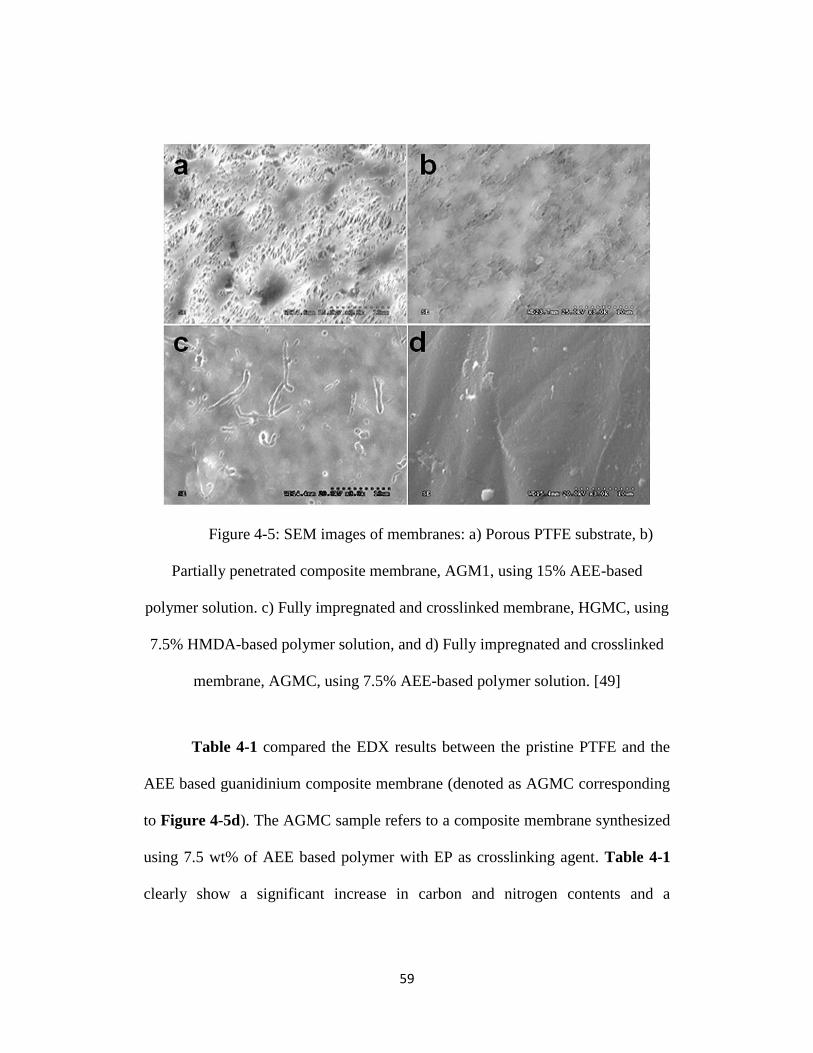
59
Figure 4-5: SEM images of membranes: a) Porous PTFE substrate, b)
Partially penetrated composite membrane, AGM1, using 15% AEE-based
polymer solution. c) Fully impregnated and crosslinked membrane, HGMC, using
7.5% HMDA-based polymer solution, and d) Fully impregnated and crosslinked
membrane, AGMC, using 7.5% AEE-based polymer solution. [49]
Table 4-1 compared the EDX results between the pristine PTFE and the
AEE based guanidinium composite membrane (denoted as AGMC corresponding
to Figure 4-5d). The AGMC sample refers to a composite membrane synthesized
using 7.5 wt% of AEE based polymer with EP as crosslinking agent. Table 4-1
clearly show a significant increase in carbon and nitrogen contents and a
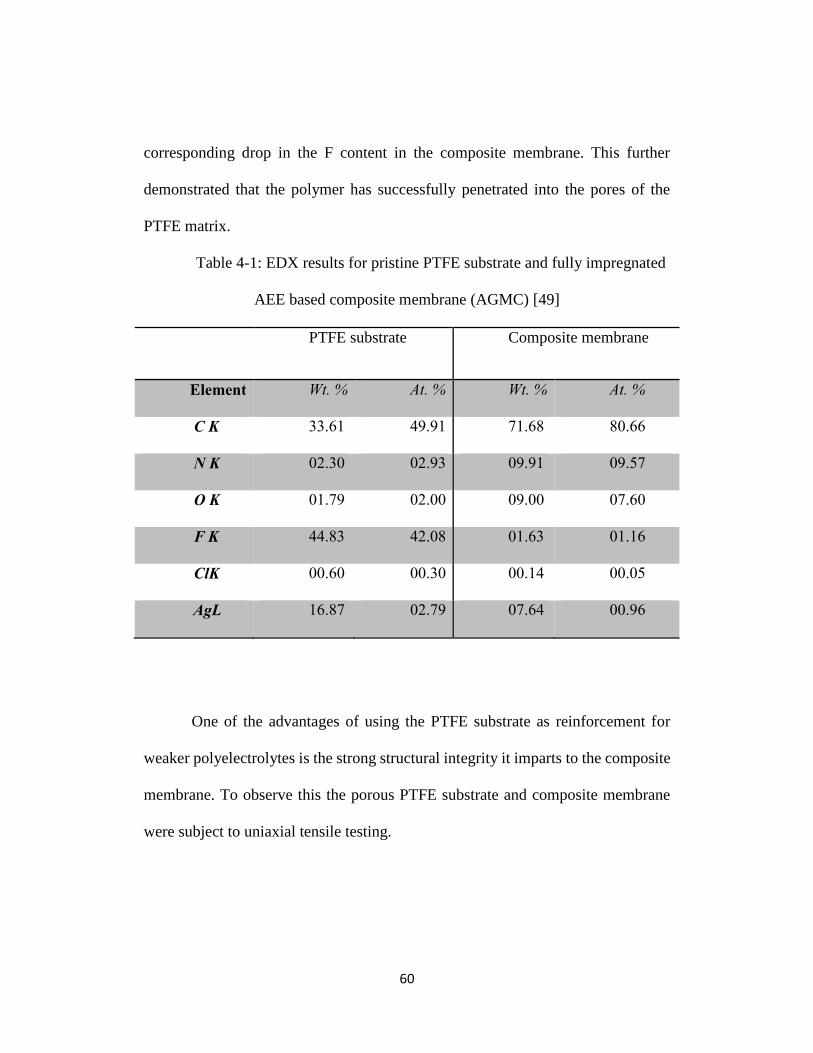
60
corresponding drop in the F content in the composite membrane. This further
demonstrated that the polymer has successfully penetrated into the pores of the
PTFE matrix.
Table 4-1: EDX results for pristine PTFE substrate and fully impregnated
AEE based composite membrane (AGMC) [49]
PTFE substrate Composite membrane
Element Wt. % At. % Wt. % At. %
C K 33.61 49.91 71.68 80.66
N K 02.30 02.93 09.91 09.57
O K 01.79 02.00 09.00 07.60
F K 44.83 42.08 01.63 01.16
ClK 00.60 00.30 00.14 00.05
AgL 16.87 02.79 07.64 00.96
One of the advantages of using the PTFE substrate as reinforcement for
weaker polyelectrolytes is the strong structural integrity it imparts to the composite
membrane. To observe this the porous PTFE substrate and composite membrane
were subject to uniaxial tensile testing.

61
The PTFE substrate in Figure 4-6 imparts a greater amount of total strain
to the membrane but incorporation of crosslinked guanidinium based polymer to its
porous network reduces this by making the membrane stronger and increasing its
peak stress from 7.5 MPa to 13.8 MPa. The composite membrane is stronger by
virtue of the crosslinked membrane embedded in the substrates pores, yet as enough
elasticity from the PTFE for use in the membrane electrode assembly of fuel cells.
0 50 100 150 200 250
0
1
2
3
4
5
6
7
8
9
10
11
12
13
14
Str
ess, M
Pa
Strain, %
Porous PTFE substrate
Gu-PTFE membrane
Figure 4-6: Tensile tests of Porous PTFE and composite Gu-PTFE
membrane
62
Thermo-gravimmetric analysis (TGA) and differential thermo-gravimmetric
analysis (DTG) were conducted to assess the short term thermal stability of the
guanidinium based polymers and membranes. Starting from low temperatures,
almost all the TGA curves (except for the PTFE film) in Figure 4-7a show an initial
weight loss due to absorbed water, and then followed by a slow degradation region.
This is particularly evident for the non-crosslinked polymers. Since the heating rate
was high (10 oC min-1) and the guanidinium groups in the polymers could retain
water due to their strong hydrophilicity, further removal of the absorbed water
could be delayed to higher temperatures. Therefore, the slow degradation region
also included a major contribution from the remaining absorbed moisture. The
above two-stage of water removal, particularly for the non-crosslinked based
polymers, may indicate a commensurate variety of water “states” in the membranes.
Different water states have been proposed to exist in Nafion membranes [62],
corresponding to different internal environments. For our membranes, water
molecules that do not interact strongly with the polymer matrix exhibit liquid-water
dynamics corresponding to the initial or first-stage water loss in the TGA analysis,
whereas water bound to the polymer hydrophilic groups, those located at the
polymer/liquid-water interface or trapped within the polymer chains, exhibit slower
dynamics within the slow degradation region.
Upon further increasing the temperature, the polymers encounter degradation
of the quaternary guanidinium groups which began at ca. 325 oC and matched well

63
with reported values [31, 34]. For the AEE based polymer samples, this eventually
leads to complete decomposition. The HMDA based guanidinium polymers
showed better heat stability and their macromolecule breakdown started at a much
higher temperature, ca. 445 oC. The existence of these two plateaus and the shape
of the curves for the two HMDA based guanidinium polymer samples agreed well
with literature [61]. The same profile was presented by the HGMC* composite
membrane followed by an additional PTFE decomposition. Table 4-2 showed the
crosslinked samples and membranes generally experienced lesser weight loss. For
example, a look at the ∆m =20% column clearly showed that the non-crosslinked
samples reach this mass loss at much lower temperatures, indicating poor thermal
stability. Also, the composite membrane (HGMC*) had by far the greatest thermal
stability owing to the presence of the stable PTFE substrate.
The DTA curves in Figure 4-7b were used to reveal more details about the
decomposition regions of the crosslinked HMDA based polymer and composite
membrane. They clearly illustrated at least two minima. The first sharp minimum,
pertaining to the above mentioned guanidinium functional group degradation, took
place between 300-400 oC, suggesting good short term thermal stability. Figure 4-
7b further showed convincing amounts of polymer impregnation in the composite
membrane because its DTA curve matched well with the underlying polymer curve.
The last (third) minimum point was attributed to the PTFE degradation and was
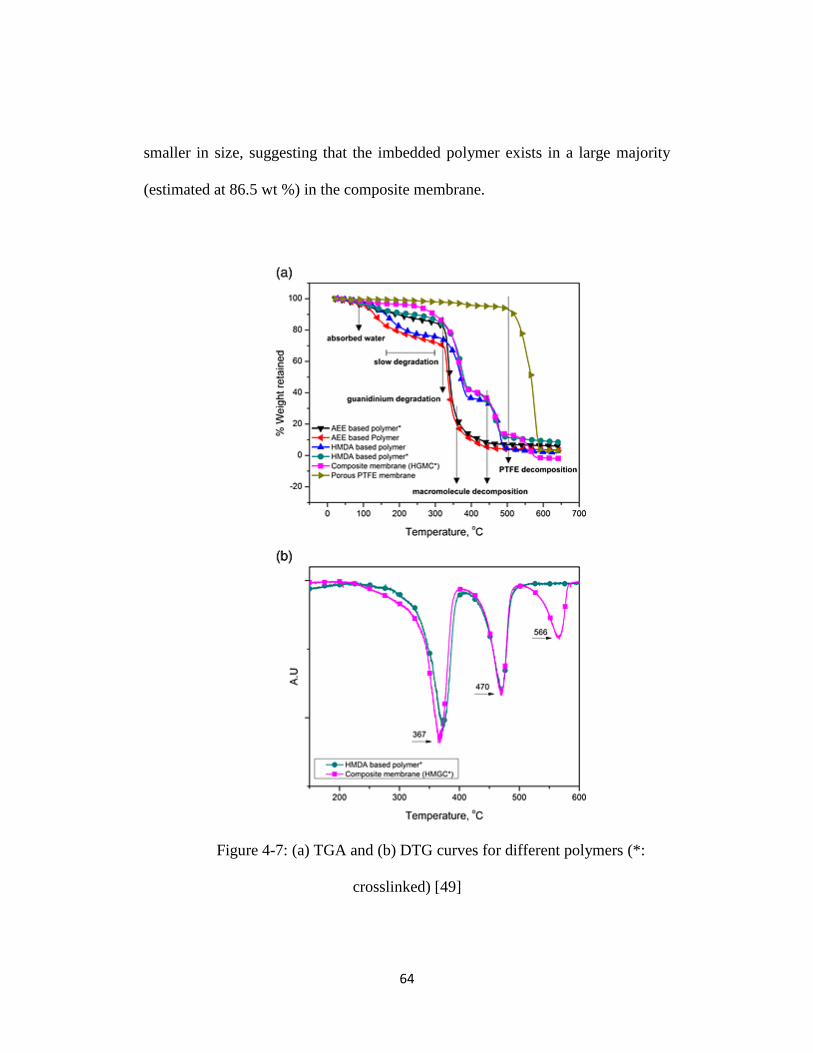
64
smaller in size, suggesting that the imbedded polymer exists in a large majority
(estimated at 86.5 wt %) in the composite membrane.
Figure 4-7: (a) TGA and (b) DTG curves for different polymers (*:
crosslinked) [49]

65
Table 4-2: Temperature (oC) of mass changes (∆m) for different samples
calculated from TGA curves. (*: crosslinked samples) [49]
Sample ∆m = 2% ∆m = 5% ∆m = 10% ∆m = 20% ∆m = 50%
AEE based polymer* 65.27 110.1 194.7 325.8 340.1
AEE based Polymer 64.74 107.9 130.1 189.2 335.2
HMDA based polymer 91.74 132.6 161.0 216.5 371.1
HMDA based polymer* 80.76 122.1 236.1 336.1 378.7
Composite membrane (HGMC*) 113.2 250.2 296.6 337.7 374.5
Porous PTFE membrane 297.3 463.5 518.2 538.1 566.3
3.5 Characterization of Blended Membranes
FTIR spectra of the synthesized blend polymers and some of the starting
materials are illustrated in Figure 4-8. The main peak (Peak 1) of the guanidinium
group is at 1564 cm-1 (C=N vibrations) and the broad band (Peak 2) due to the
stretching vibration of N-H bonds appears at 3300 cm-1. The broadband (Peak 2) is
often interchangeably denoted as N-H or OH- for many AEM materials in literature.
Hence we find that activation of the material in aq. KOH augments the intensity of
Peak 2, causing the ratio of Peak 2: Peak 1 to rise by a factor of almost 2. Similarly,
chitosan curve also had a peak around 3300 cm-1 attributed to its –OH group [63].
In addition, the peak at 2878 cm-1 is attributed to -CH3 which is the strongest for

66
the sample modified with sodium stearate (sample 4). The other sharp peak of the
Gu(L) polymer is at 1560 cm-1 from the band of νаСОО- [64] in the stearate.
1000 1500 2000 2500 3000 3500
5
4
2
Peak 2Peak 1
Tra
nsm
itta
nce
, A
.U
Wavenumber, cm-1
1
3
Figure 4-8: FTIR spectra of different membranes and their starting
materials: 1) non-activated Gu-Chi5.6 polymer, 2) activated Gu-Chi5.6 polymer,
3) Gu prepolymer, 4) Gu(L) polymer, and 5) Chitosan. Gu, Chi, and (L) stand for
guanidinium, Chitosan, and lipophilic, respectively
SEM microstructures of different blend membranes are taken to understand
phase mixing in the blend membranes. Figure 4-9 (a-c), corresponding to different
guanidinium-chitosan blend membranes, show that certain periodic troughs were

67
present on the membrane surface. However, they appear only as surface defects
confirmed by very low methanol permeability values discovered in the next section.
These could in fact be the result of domains of the dispersing phase brought about
by Ostwald ripening or coalescence (through Brownian motion), or combination of
the two mechanisms [65]. The microstructures are further exacerbated by uneven
dehydration and shrinkage of the polymer components, particularly at the chitosan-
guanidinium interface in the polymer blend, under the high energy electron beam
in the SEM chamber. The general size of the dispersed chitosan rich domains
marked by the yellow dotted circles becomes smaller and less spherical yet the
quantity seems greater for the highest chitosan content, i.e., Gu-Chi5.6 (Figure 4-
9b), which might signify greater shear forces while blending due to the higher
chitosan content. In Figure 4-9a the domain size (diameter) is around 10 µm while
in Figure 4-9b the domains reduce to around 6 µm albeit their numbers increase
dramatically reflecting the higher quantity of chitosan. One reason for using
chitosan was because of its superior film making properties, and increase in the
number of chitosan anchoring domains could provide a stronger (greater strength,
Figure 4-10) and tighter structure (lower permeability, Figure 7). However, they
would serve as ‘relatively’ inactive sites and cause a reduction in the ionic
conductivity. Reaction of sodium stearate with the prepolymer seems to improve
the structure in Figure 4-9c leading to uniform spherical domains but with the
highest domain size (ranging to slightly lower than 15 µm). However, this time the

68
bulk material also incorporates the inactive sodium stearate component (for better
strength) and we envision that it will exhibit lower ionic conductivity as confirmed
in the next section.

69
Figure 4-9: SEM micrographs of blend membranes, a) Gu-Chi2.2 b) Gu-
Chi5.6 c) Gu(L)-Chi2.5

70
To study mechanical properties of the blend membranes, tensile tests were
conducted. The results for the three blend polymers are shown in Figure 4-10 and
are further compiled in Table 4-3. As expected, increasing chitosan content to the
blend drastically increased the tensile strength of the membranes from approx. 4
MPa for Gu-Chi2.2 to approx. 25 MPa for Gu-Chi5.6. This was essentially six times
increase in strength by only 2-3 times increase in mass of chitosan. The modified
prepolymer with sodium stearate had the same effect; however, it also rendered the
membrane a greater deal of rigidity demonstrated by the much higher modulus but
yet smaller strain (Table 4-3).
0 10 20
0
5
10
15
20
25
Str
ess,
MP
a
Strain, %
Gu-Chi2.2
Gu-Chi5.6
Gu(L)-Chi2.5
Figure 4-10: Tensile test results of various blended membranes

71
Table 4-3: Summary of mechanical properties for different membranes
from the tensile tests
Sample
membrane
Peak Load
N
Peak Stress
MPa
Strain At
Break %
Modulus
MPa
Gu-Chi2.2 0.321 4.3 18.4 105.95
Gu-Chi5.6 3.112 25.2 11.3 790.17
Gu(L)-Chi2.5 1.778 25.4 2.8 1339.58
Porous PTFE 0.624 7.5 269.7 8.31
Gu-PTFE 1.927 13.8 132 19.91
3.6 Chemical (Hydroxide) Stability:
Small pieces of the crosslinked guanidinium functionalized polymers were
studied by immersing them in 5 M aq. KOH at 55 oC. They were taken out at regular
time intervals, washed with DI water, wiped dry with tissue paper, and then studied
using complementary techniques of Raman (Figure 4-11) and FTIR (Figure 4-12)
spectroscopy to detect any degradation or changes in chemical structures. During
the test, all of the samples appeared to lose some weight. They also became a little
lighter in color and less transparent. The Raman spectra for the AEE and HMDA
based guanidinium functionalized polymers were presented in Figure 4-11a and
b, respectively. The results exhibit similar peaks to the composite membranes

72
shown in Fig. 3b. They also showed no significant change in peak positions or their
relative intensities even after an exposure of 30 h to 5M KOH at 55oC.
Figure 4-11: Raman spectra of a) AEE and b) HMDA-based guanidinium
polymers exposed to 5 M aq. KOH at 55°C for different time intervals [49]

73
FTIR spectra of both AEE (Figure 4-12a) and HMDA based polymers
(Figure 4-12b) did not show any remarkable change either, even though the
exposure time has been extended to 50 h. The peak at ca. 1630 cm-1 corresponding
to δNH showed a trend of decreasing intensity for both polymers relative to the N-H
stretch broad band at 3320 cm-1. For the HMDA type in Figure 4-12b, a new peak
appeared at ca. 2400 cm-1 and had a trend of slowly increasing in intensity with
exposure time. It lies in the frequency range of characteristic C-N stretch. This
implies that there was some amount of degradation with the amine groups but the
main guanidinium carbon atom is still stable. These stability results are substantial
especially if compared to the commercial Tokuyama A201 membrane in Figure 4-
12c which was exposed to the same conditions for the purpose of establishing a
reference. There was an evident change from exposure time 30 to 50 h. The peaks
ca. at 1359 cm-1 and 1442 cm-1 increased in intensity and a new broad peak at
around 3100 cm-1 instead of the twin peaks at 2800 cm-1 and 2910 cm-1 appeared.
The commercial A201 membrane was composed of a linear hydrocarbon backbone
with quaternary ammonium group [66]. Key modes of degradation of the
quaternary-ammonium groups are either through the Hoffman elimination reaction
[48] or direct nucleophilic displacement at the cationic sites [46, 67]. The former
involves the attack of hydroxyl ions on the beta-hydrogen of the ammonium, while
the latter can occur on the carbon located in the alpha or beta position of the
ammonium. Both degradation mechanisms lead to formation of alkenes [37] which

74
were exactly ascribed to the new peak at ca. 3100 cm-1 in Figure 4-12c. This
observation confirms the above-mentioned degradation mechanism of quaternary
ammonium groups.

75
Figure 4-12: FTIR spectra of a) AEE-based guanidinium polymer, b)
HMDA-based guanidinium polymer, and c) commercial Tokuyama A201 after
exposure to 5 M aq. KOH at 55°C for different time intervals [49]

76
Chemical degradation of AEMs stems largely from nucleophilic attack of
hydroxide ions on the fixed cationic sites, which results directly in a loss of ion-
exchange groups, and a subsequent decrease in OH- conductivity. Degradation
mechanisms of AEMS have virtually always been studied on quaternary-
ammonium groups, even though research on new ion exchange groups has
increased dramatically [17, 40-43]. Though recent membrane degradation studies
[23, 44, 45] on quaternary ammonium groups have provided some fundamental
understandings that may be applied to other types of AEMs, but with considerable
limitation. For example, membrane conditions that lead to poor solvation of OH-
ions may enhance chemical degradation of the cations. Chemical stability is less
dependent on modification of the alkyl groups that attach to the cationic moieties
[46]. Of course, the above statements may be valid for non-quaternary-ammonium
AEMs in some sense, as the nucleophilic attack by OH- ions contributes to the
chemical degradation in most of cases. However in our membranes, due to
remarkable charge delocalization (over one carbon and three nitrogen atoms) and
disappearance of hydrogen attached to the three nitrogen atoms in the fully
crosslinked polymers (Figure 3-1), it appeared that either the Hoffman elimination
or direct nucleophilic displacement reactions would not likely occur during
membrane degradation.
This charge delocalization in the guanidinium hydroxides also provides a
high degree of thermal and basic stability [35, 41]. Hence, the results demonstrated
77
that the guanidinium group by virtue of its resonance stabilization of the π-system
and its “Y-delocalization” resulted in stabilization comparable to cyclic aromatics
such as benzene [68] and their chemical stability was superior to ammonium based
AEMs such as the A201.
3.7 Conclusion
The fabricated composite and hybrid blended AEMs are analyzed in this
chapter. The condensation polymerization to obtain the base guanidine polymer is
successfully performed as indicated by the NMR results. This prepolymer is then
used to fabricate composite and hybrid blended membranes.
This prepolymer is then dissolved in solution and is used to penetrate the
pores of the PTFE substrate for the composite membrane. SEM/EDX and
spectroscopic analysis show complete impregnation was achieved. Similarly, the
prepolymer blended with chitosan resulted in dense hybrid blended membranes.
The PTFE base and chitosan blend components play essential part in strengthening
the obtained AEMs.
The polymer and hence membranes also show exceptional thermal and
chemical stability. The chemical stability especially is promising considering the
extreme conditions used for testing. The synthesized guanidinium material infact
performed better than the Tokuyama A201 commercial AEM.

78
Electrochemical Study of AEMs
5.1 Introduction
The first step for characterization of newly developed AEMs is to test their
chemical, thermal and mechanical properties. Having done that successfully in the
previous chapter, they can be confidently applied to a fuel cell system. Having said
that it is still important to investigate how good the electrochemical properties of
the AEMs are, otherwise performance in a fuel cell might not be optimum. Some
of these properties are illustrated in Figure 5-1 below:
Figure 5-1: Important membrane properties for good fuel cell performance

79
5.2 Experimental Setup
2.5.4 Anionic Conductivity, Water/Alkali uptake & Dimensional Stability
After activation to their hydroxide form, the membranes were repeatedly
washed and submerged in DI water for 2 d to remove any traces of residual KOH
so that the anionic conductivity measured wasn’t affected by it. Strictly speaking,
the conductivity may not be solely due from the guanidinium cations as the
hydroxide form of the membrane would react with CO2 in the air during the
impedance experiment. Thus conductivity values recorded are likely to be a result
from a mixture of alkaline anions (OH- and either HCO3-/CO3
2-) [69, 70].
The anion conductivities of the AEM strips (approx. 5 cm x 2 cm, DI water,
20 oC) were estimated from AC impedance spectroscopy data by the commonly
employed four point probe technique [71] using the PARSTAT 2273 frequency
response analyzer. Electrochemical impedance spectroscopy (EIS) was performed
by imposing a small sinusoidal (AC signal) voltage, 10 mV, across the membrane
sample at frequencies between 1 milli Hz to 1 kHz and measuring the resultant
current response. The real impedance value at the real intercept in the Nyquist plot
was taken as the resistance of the membrane [71-73]. This was then used to
calculate the anionic conductivity, σ, by employing the following formula:
AZre
L

80
where L is the length between sense electrodes (1 cm), Zre is the real impedance
response at high frequency, and A is the membrane area available for anion
conduction (thickness x width). Sample Nyquist plots are illustrated in Fig 2b. For
purpose of reference, Nyquist plot of Nafion 112 (in DI water, 20 oC) was also
plotted and was used to obtain a conductivity value of 10.2 mS cm-1 which is
comparable to that found in literature [74].

81
1000 1500 2000 2500 3000 3500 4000 4500
-100
0
100
200
300
400
500
600
700
800
Zim
Zre
Nafion 112, = 10.2 Sm-1
Crosslinked HMDA based Gu. membrane, = 8.5 Sm-1
Figure 5-2: Four-probe membrane conductivity measurement: (a)
experiment setup and (b) Nyquist plots to measure σ for Nafion 112 & HGMC
(thickness = 50.8 & 25.4 µm respectively)
b

82
Similarly, dry strips of membranes were taken and their weight was
measured before they were immersed for 48 h in deionized water for measurement
of water uptake (Wu) and in 1M KOH for alkali uptake (Au). The water and alkali
uptake of the membranes was thus calculated based on the weight gain as seen
widely in literature [75-77]. Besides, the dimensional change (∆L) in both water
and alkali were also recorded by tracking the change in distance specified positions
before (L1) and after (L2) the samples were soaked in deionized water or 1M KOH
for 48 h.
Mo
MoMwWu
Mo
MoMaAu
100
1
12%
L
LLL
where, Mo is weight of the dry membrane while Mw and Au are the weights of the
corresponding water and alkali swollen membranes respectively.
2.5.5 Methanol Permeability & Selectivity
Methanol permeability measurement is based on the Gasa method [78]
which employed a permeation cell derived from Walker et al [79]. 25g of methanol
was sealed inside a permeation cell and was only allowed to diffuse through a
circular opening of a membrane (diameter = 0.6 cm). Figure 5-2 shows the
schematic and actual setup of the permeability test. One set of measurements were
conducted at room temperature (22 oC). For an elevated temperature (60 oC) the
cell was kept inside an oven. The oven had an internal volume of 0.3 m3 and
convective air flow was created by a fan inside the oven to ensure constant

83
concentration difference for methanol to permeate through the membrane. The
mass of methanol inside the vials as a function of time was measured and the
equation below was adopted from J. Zhou et al. [75] for easy comparison with
literature of the permeability (P) of the various membranes:
tAVP
lNP
where N = number of moles of methanol lost (moles), l = thickness of the
membrane, VP=saturated vapor pressure of methanol at 22 oC or 60 oC (Pa), A =
membrane area for methanol permeation (cm2), and t = time (days).
The selectivity of the membranes was tabulated according to the following
relations:
PSm
;
Sn
SmSr
where Sm = selectivity of each membrane, σ = anionic conductivity, P = methanol
permeability, Sr = relative selectivity factor, and Sn = permeability of Nafion
(N117).

84
Figure 5-3: Schematic (l) & actual (r) setup of the permeability test
5.3 Membrane Properties
5.3.1 Anionic Conductivities & Water Uptake of Composite membrane
The properties of three AEE based (AGM) and two HMDA (HGM) based
composite membranes were shown in Table 5-1. AGM1 were prepared from a
polymer solution with a larger weight percentage (15%, shown in Fig. 4-5b) with
a higher viscosity. This reduced the effectiveness of the polymer infiltration process
leading to a lower anionic conductivity (30.7 mS cm-1) when compared to AGM2
(56.6 Sm-1) fabricated using a dilute polymer solution (7.5wt%).
Methanol vapor
Membrane over hollow cap
Methanol liquid
Mass flux b

85
Table 5-1: Weight % of polymer, ionic conductivity (σ), water uptake
(WU) and ion-exchange-capacity (IEC) of membranes
Sample Wt% of polymer
in solution
σ, mS cm-1 WU % IEC,
mmoles/g
AGM1 15 30.7 38.67 0.143
AGM2 7.5 56.6 54.18 0.303
AGMC* 7.5 78.9 63.21 0.239
HGM1 7.5 27.7 48.21 0.118
HGMC* 7.5 84.7 62.48 0.458
(AGM: AEE based composite guanidinium membrane; HGM: HMDA
based composite membrane; C*: crosslinked samples) [49]
According to our previous studies [59, 60], fabrication of the composite
membranes relies on surface tension to drag polymer solution into the pores and
then impregnate the PTFE films. Hence, an appropriate viscosity is essential for
successful membrane fabrication. AGMC (corresponding to Figure 4-5d) prepared
from the crosslinked AEE based guanidinium polymer exhibited interesting
outcomes. Compared to AGM2, it showed higher conductivity (78.9 mS cm-1). The
crosslinked HMDA based guanidinium membrane, HGMC (corresponding to
Figure 4-5c), also showed a substantial increase in conductivity (84.7 mS cm-1)
compared to the noncrosslinked HGM1 (27.2 mS cm-1). These are very impressive
values considering that our crosslinked structures did not provide substantial

86
increase in charge concentration (see Figure 3-1 for structures). Strictly speaking,
the conductivity is not solely due from the OH- ions as the membrane in hydroxide
form may react with CO2 in the air during the impedance experiment. Thus
conductivity values recorded are likely to be a combined result from a mixture of
alkaline anions (OH- and either HCO3-/CO3
2-).
Our initial attempt for using crosslinking was to reduce membrane swelling
and provide mechanical integrity across the porous substrate. The surprisingly
higher conductivity may result from more effective impregnation and retention of
the polymer into the pores of the PTFE substrate. For example, it was estimated
from the TGA curve (Figure 4-7a) that the amount of crosslinked polymer HGMC
impregnated into the PTFE substrate was ca. 86.5wt% of the whole composite
membrane. We propose that the crosslinking process aids the polymer
impregnation due to the following three reasons: 1) Crosslinking agent affects the
viscosity of the polymer solution to be deposited and helps by better wetting of the
PTFE substrate; 2) Crosslinking helps in anchoring the polymer with guanidinium
moieties to the pores of the PTFE film; 3) Crosslinking also prevents loss of
polymers during the process of alkalization and repeated washing after that.
Hence it is believed that the higher ionic conductivity of the crosslinked
membranes is mainly due to optimum impregnation of the polymers to the PTFE
substrate. This is more prominent for the HMDA based membranes. For example,
the HGMC has the highest IEC value which supports our argument. Its water uptake

87
value is also high even though it was crosslinked, implying a higher content of
polymer was incorporated. During the synthesis, the HMDA based polymer was
found to easily wet the PTFE substrate and therefore yield better impregnation. The
AGMC seems to follow the same trend particularly in ionic conductivity and water
uptake although the effect is less pronounced. Figure 5-4 further illustrates these
observations.
Figure 5-4: (top) Water uptake (%) and (bottom) Conductivity (S m-1) for
various crosslinked and noncrosslinked membranes
noncrosslinked
crosslinked
0
20
40
60
80
100
HGMAGM
noncrosslinked
crosslinked
0
2
4
6
8
10
HGMAGM

88
It should be noted, however, that the IEC values are generally lower when
compared to those found in literature because of the presence of the PTFE substrate.
However, IEC was not a decisive factor in membrane conductivity since Nafion
has a low IEC (0.91 mmol g-1 [80]) but a good conductivity at 20 oC (100 mS cm-
1) [74]. Membrane conductivity is also highly dependent on the basicity of ion
exchange groups. Strong basic groups lead to an augmentation of both the number
of dissociated hydroxides and water uptake, thus facilitating ion conductivity under
otherwise similar conditions. The strong basicity offered by the guanidinium
groups in our membranes serves the same purpose.
5.3.2 Anionic Conductivies & Water Uptake of Hybrid Blend Membranes
Ionic conductivity of the blend membranes was measured using a four-
probe AC method. In Figure 5-5a, amongst the three blend membranes, Gu-Chi2.2
with the greatest proportion of guanidinium ion exchange group shows the highest
conductivity at 21 mS cm-1, followed by Gu-Chi5.6 at 15 mS cm-1. The lipophilic
Gu(L)-Chi2.5 expectantly yields only 12 mS cm-1 because of the presence of both
the stearate group and chitosan. The values, albeit a little low, are reasonable
considering the lower guanidinium content by virtue of the other blend components,
but also because of the slower migration rate of OH- ions (generally taken as nearly
half of H+ ion migration rates [81, 82]). In fact the conductivity value for the
commercial Tokuyama A201 was the lowest at 11 mS cm-1. The reason for these
consistently low values may be related to the process of CO2 quickly equilibrating

89
with the AEMs, which could be critically dependent on atmospheric CO2
concentration and temperature [69, 70]. To verify this we also tested a previously
fabricated [83] Guanidinium-PTFE composite membrane (Gu-PTFE) and the
conductivity value proved to be at least 30% lower than the last reported results.
Thus strictly speaking, conductivity values recorded herein are likely to be affected
by the presence of carbonate (either HCO3−/CO3
2−) anions. Despite the 30% drop,
the conductivity of the Gu-PTFE is understandably the highest since it primarily
includes the guanidinium-based polymer impregnated over a highly porous PTFE
substrate (porosity value > 85%) and is devoid of any other blending additions.
However, apart from taking repeated readings for a sense of reproducibility, care
was taken to use the same handling conditions for the 4-probe conductivity
measurements in order to make a fair comparison.

90
Figure 5-5: a) Conductivity and b) water/alkali uptake and swelling results
of different blend membranes [84]
30
21
15
1211
0
5
10
15
20
25
30
35
Gu-PTFE Gu-Chi2.2 Gu-Chi5.6 Gu(L)-Chi2.5 a201
Co
nd
ucti
vit
y, m
S c
m-1
0.0
10.0
20.0
30.0
40.0
50.0
60.0
70.0
Alkali
Uptake %
Water
Uptake %Alkali
∆L%
Water
∆L%
Gu-Chi2.2 33.3 28.0 17.5 18.3
Gu-Chi5.6 67.2 62.4 8.2 10.4
Gu(L)-2.5 60.5 62.4 14.8 12.5
% C
han
ge
b
a

91
Higher water uptake is known to facilitate hydroxide transport [85] by
generating solvated ionic species and broadening associated ion transfer channels,
thereby facilitating their migration. However, in these blend membranes along with
the guanidinium ion exchange group, the chitosan and sodium stearate components
are also thought to participate in absorbing water. This was seen as soon as they’re
added to aqueous solutions. They form a thick suspension and slightly swell up in
solution while they were vigorously mechanically stirred for a few hours. Hence,
it is found in Figure 5-5b that Gu-Chi5.6 and Gu(L)-Chi2.5 show higher alkali and
water uptake values without appreciable rise in their anionic conductivities. Gu-
Chi2.2 on the other hand shows lesser, yet still significant, water and alkali uptake
(approx. 30%), and has the highest anionic conductivity amongst the blend
membranes. Due to the different polymer structures and chemistry, the blend
elements would exhibit different degrees of swelling while larger amounts of the
main ion exchange groups are known for contributing to the most significant
swelling in membranes [34]. This explains the case for Gu-Chi2.2 which has the
largest proportion of guanidinium and thus the highest conductivity (21 mS cm-1 in
Figure 5-5a), but also suffers from the greatest swelling (around 18% elongation
in Figure 5-5b) among the three blend membranes.
To understand the observed combined membrane properties, the
supramolecular interactions of the functional groups used in this study and the
hydroxide conduction mechanism are illustrated in Figure 5-6. Hydroxide

92
conduction is postulated to occur mainly through the Grotthuss mechanism by the
formation and cleavage of the bonds as it diffuses through the hydrogen-bonded
network of water molecules [86]. The hydroxyl groups on chitosan, especially the
highly solvated guanidinium ion exchange groups, are believed to lead to a further
increase in the formation and cleavage of bonds of the diffusing hyper-coordinating
water molecule when it is in close proximity to these groups due to their strong
electronegativity. In the same way, surface site hopping of hydroxyl anions
facilitated by the hydration shell around the guanidinium groups in the membrane
is also shown by the purple arrows. These claims are supported by the fact that
more chitosan component (Figure 5-5b) leads to increased water/alkali uptake and
a reasonable anionic conductivity (Figure 5-5a) despite diluting the main
guaindinium ion exchange groups. Lastly, chitosan is capable of making not only
intramolecular hydrogen bonds with itself but also intermolecular bonds with the
guanidinium-based polymer chains (shown in Figure 5-6), thus providing
invaluable integrity to the blend membranes demonstrated by the tensile testing
results in the previous section. These strong intermolecular bonds are also
important to reduce dissolution and swelling of membrane materials while a fuel
cell is in operation as proven by the membrane swelling data in Figure 5-5b.

93
Figure 5-6: Guanidinium-Chitosan Blend interactions and intermolecular
forces
5.3.3 Study of Membrane Permeability
Further studies were conducted to understand the methanol permeability
through the membranes and the mass loss of methanol (for duration of around 48
h) was used to estimate the amount of methanol permeated through various
membranes. Figure 5-7a & b compare the permeability of different membranes at
22 oC and 55 oC, respectively. Two commercial samples, namely Nafion 117 and
the Tokuyama A201, were used as references for comparison and to validate the
experimental results. The Guanidinium-PTFE (Gu-PTFE) membrane was again
used for comparison of permeability. Indeed, the highest permeability was
demonstrated by the two commercial references (Nafion N117 at room temperature
94
and Tokuyama A201 at 55oC). This just reiterates the problem of fuel crossover
using Nafion for direct methanol fuel cells, despite their high proton conductivity.
Another reason for using Nafion was to check experimental values with Zhou et al.
[75] who used a Nafion reference in their report as well. The permeability value of
the Nafion sample is in good agreement with the reported values [75], and its
temperature dependence is less abrupt than the blend membranes. Nevertheless, the
permeability values of the blend membranes fabricated in this work are
approximately an order lower than those of Nafion. For instance all the fabricated
membranes, both composite and blended, allowed lesser moles of methanol through
them thereby exhibiting lower methanol permeability. This difference is made
further obvious at 55 oC in Figure 5-7b where all the permeability values are
understandably augmented because of the higher temperature. For the blends, the
presence of the two components of chitosan and guandinium groups, yielding a
possible domain structure illustrated in the SEM images (Figure 4-9), leads to
sharper increase in permeability with a rise in temperature compared to Nafion.
Each constituent depending on their nature would respond differently upon being
exposed to heat leading to a less tight structure. However, their permeability values
are still better than both Nafion and the composite membrane suggesting the
polymer blend membranes are more homogenous than the Gu-PTFE composite
membrane even at higher temperatures. Another observation was the slight
reduction in methanol permeability from Gu-Chi2.2 to Gu-Chi5.6 at both the 22 oC

95
and 55 oC ranges. It seems increasing the blend portion of the higher molecular
weight and stronger chitosan additive would slowly lead to a more homogenous
blend. This can be inferred by looking at domain size reduction for Gu-Chi5.6 in
the SEM microstructures (Figure 4-9). On the other hand, the lipophilic membrane,
Gu(L)-Chi2.5, shows the smallest permeability values at both 22 oC and 55 oC.
Also, activated Gu-Chi5.6 (hydroxide form) was also tested and showed a similar
permeability especially at 22 oC (but slightly increases at 55 oC) to the non-activated
counterpart, demonstrating that the activation process is not too detrimental to
membrane tightness.
The selectivity factor (ionic conductivity/methanol permeability) is an
important parameter often used to evaluate the potential of ion exchange
membranes for application in direct methanol fuel cells [75, 87]. The relative
selectivity, a ratio of each membrane’s selectivity factor to that of Nafion N117, is
plotted in Figure 5-8 together with that of Nafion membrane. All the blend Gu-Chi
membranes and the composite Gu-PTFE membrane show higher selectivity than
Nafion and Tokuyama A201, except for Gu-Chi2.2 which is also comparable to
A201. The composite Gu-PTFE membrane shows the best selectivity by virtue of
the dominant effect of its much higher ionic conductivity. Even for the blended
membranes fabricated in this study, the results imply that their lower methanol
permeability, not only would potentially solve one of the underlying problems
associated with direct methanol fuel cells, but would also compensate their lower
96
anionic conductivities. Among the blends, Gu(L)-Chi2.5 turns out to have the best
selectivity due to its very low methanol permeability. The reason is addition of the
long alkyl chains of the stearate group to the base polymer. This provides integrity
and homogeneity to the matrix and is corroborated by the higher strength in Figure
4-10 and lower permeability in Figure 5-7. These results are further supported by
the strengthened matrix in Figure 4-9c, which was punctuated by spherically
uniform dispersed chitosan rich phase possessing excellent intrinsic film forming
properties leading to a very leak-proof Gu(L)-Chi2.5 membrane.
A comparative analysis of Figures 4-10, 5-5, and 5-7, 5-8 suggests that the
blend membranes, Gu-Chi2.2 and Gu-Chi5.6, display a desirable combination of
mechanical and electrochemical properties; therefore, further fuel cell test was
conducted using these two membranes. On the other hand, in Gu(L)-Chi2.5 though
the stearate group helps increase the molecular weight of the prepolymer giving a
slightly more homogenous blend demonstrated by lesser surface defects on the
microstructure (Figure 4-9c); however, the membrane is more rigid (Figure 4-10),
which may lead to brittleness. In addition, according to Figure 5-5, the Gu(L)-
Chi2.5 sample shows the lowest conductivity among all the blend membranes. Its
conductivity value is only about 50% of that of the Gu-Chi2.2 even if they have
similar weight fractions of chitosan. Hence, no further fuel cell test was performed
on this membrane.

97
Gu-PTFE
A201N117
GuChi2.2
GuChi5.6
GuChi5.6 activated
Gu(L)Chi2.5
0.0
5.0x10⁻⁸
1.0x10⁻⁷
1.5x10⁻⁷
2.0x10⁻⁷
2.5x10⁻⁷
3.0x10⁻⁷
3.5x10⁻⁷
P,
mo
l c
m c
m-2 d
ay
-1 P
a-1
A
Gu-PTFE
A201N117
GuChi2.2
GuChi5.6
GuChi5.6 activated
Gu(L)Chi2.5
0.0
2.0x10⁻⁶
4.0x10⁻⁶
6.0x10⁻⁶
8.0x10⁻⁶
1.0x10⁻⁵
1.2x10⁻⁵
1.4x10⁻⁵
1.6x10⁻⁵
P, m
ol c
m c
m-2 d
ay
-1 P
a-1
Figure 5-7: Permeability of methanol in different membranes at a) 22 oC
and b) 55 oC [84]
a
b

98
Gu-PTFE
Gu-Chi2.2
Gu-Chi5.6
Gu(L)-C
hi2.5a201
N117
0.0
0.5
1.0
1.5
2.0
Re
lati
ve S
ele
cti
vit
y
Figure 5-8: Relative Selectivity factor of different membranes at room
temperature (*relative to Nafion N117) [84]
99
5.4 MEA Fabrication
The ionomer solution (5 wt%) was prepared by dissolving our own
formulated prepolymer synthesized in Section 2.1 in a mixed solvents of ethanol
and DI water. Catalyst inks were prepared by mixing TKK Pt/C catalyst (46.7% Pt)
with the ionomer solution in a mass ratio of 3 (Pt):100 (polymer). Subsequently,
the Pt/C-ionomer slurry was sprayed onto a Toray 090 carbon paper to achieve a Pt
loading of 1 mg cm-2. The solvent was allowed to evaporate and the electrodes were
placed in an oven at 80 ◦C for 1 h. After washing with DI water, the ionomer in the
electrodes were converted to OH- form by immersing in 1 M KOH (aq) for 48 h.
The prepared electrodes (active area = 1 x 1 cm2) together with a membrane were
sandwiched between two gaskets (thickness = 0.15 mm) and assembled into a
graphite fuel cell fixture with parallel flow fields.
A Lab Alliance pulse-free pump was used to supply the fuel cell with 3M
methanol together with 1M KOH at 1 mL min-1 into the anode and oxygen as an
oxidant into the cathode. The produced current was monitored using a Princeton
Applied Research PARSTAT 2273 potentiostat. All the fuel cells were conducted
at room temperature.

100
5.5 Methanol Fuel Cell Study
The schematic for the DMAFC operation is illustrated in Figure 5-9 and
the results for evaluating different membranes are shown in Figure 5-10. Methanol
at the anode releases six protons along with six electrons and CO2. The released
electrons pass through an external circuit to reach the cathode. Simultaneously, the
OH- diffuses through the membrane to the cathode to react with oxygen and the
returning electron. At the cathode, CO2 and water are the products.
Figure 5-9: Schematic of direct methanol fuel cell
Table 5-2 shows that the incorporation of lesser amounts of chitosan yields
better open circuit voltage (OCV) for the fuel cell. This is understandable since it
implies a higher proportion of the active guanidinium ion exchange group.
Similarly incorporation of the sodium stearate group to the structure produces the
same effect. GuChi2.2 produced the highest OCV (0.69V), even much higher than
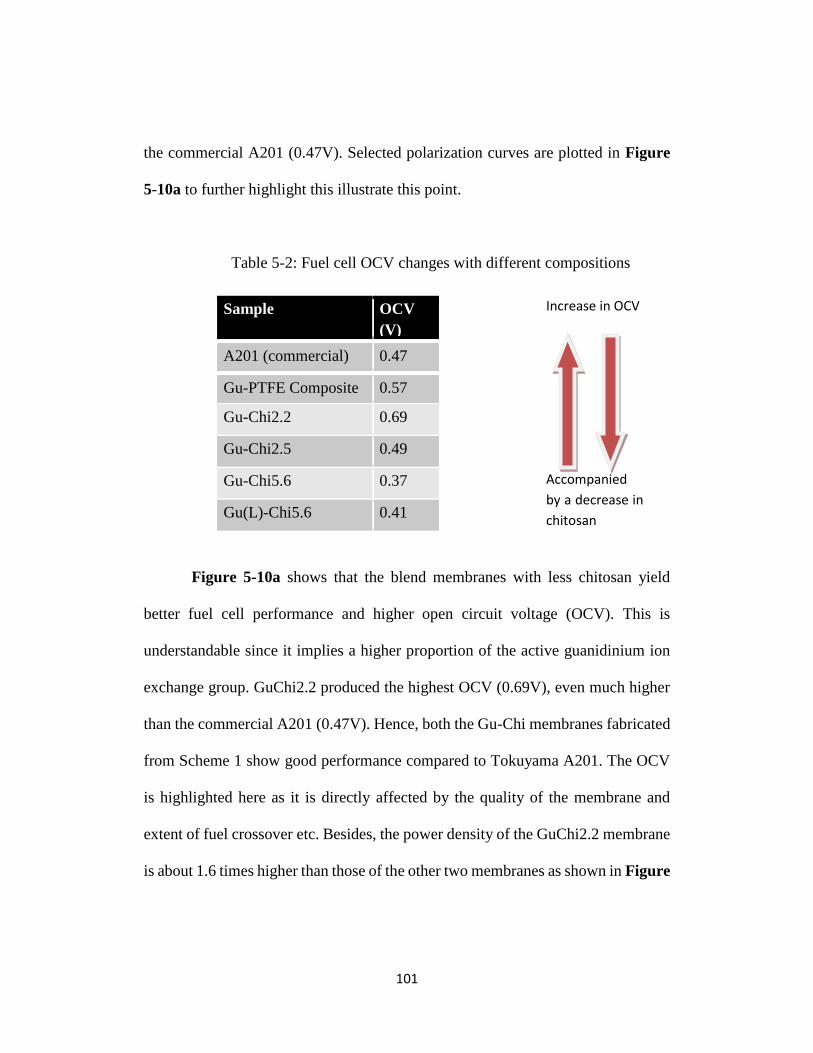
101
the commercial A201 (0.47V). Selected polarization curves are plotted in Figure
5-10a to further highlight this illustrate this point.
Table 5-2: Fuel cell OCV changes with different compositions
Figure 5-10a shows that the blend membranes with less chitosan yield
better fuel cell performance and higher open circuit voltage (OCV). This is
understandable since it implies a higher proportion of the active guanidinium ion
exchange group. GuChi2.2 produced the highest OCV (0.69V), even much higher
than the commercial A201 (0.47V). Hence, both the Gu-Chi membranes fabricated
from Scheme 1 show good performance compared to Tokuyama A201. The OCV
is highlighted here as it is directly affected by the quality of the membrane and
extent of fuel crossover etc. Besides, the power density of the GuChi2.2 membrane
is about 1.6 times higher than those of the other two membranes as shown in Figure
Sample OCV
(V)
A201 (commercial) 0.47
Gu-PTFE Composite 0.57
Gu-Chi2.2 0.69
Gu-Chi2.5 0.49
Gu-Chi5.6 0.37
Gu(L)-Chi5.6 0.41
Accompanied
by a decrease in
chitosan
content
Increase in OCV

102
5-10b. It is admitted that the fuel cell performance is fairly low since no
optimization has been conducted on the triple phase boundary of catalyst layers,
MEAs, cell hardware, and even the operation conditions (i.e., methanol
concentration, fuel and oxygen flow rate, temperature etc.). Besides, pure Pt
catalysts, instead of Pt alloys, were employed in the anode for methanol oxidation,
which could cause additional overpotential. The exact dominating factor that
contributes to the observed fuel cell performance in Figure 5-10 may be beyond
the scope of this study; however, relatively to the Tokuyama A201, the synthesized
guanidinium based AEMs show a better combination of low fuel crossover, ionic
conductivity, and mechanical strength, therefore appearing as a good alternative to
current commercial membranes.
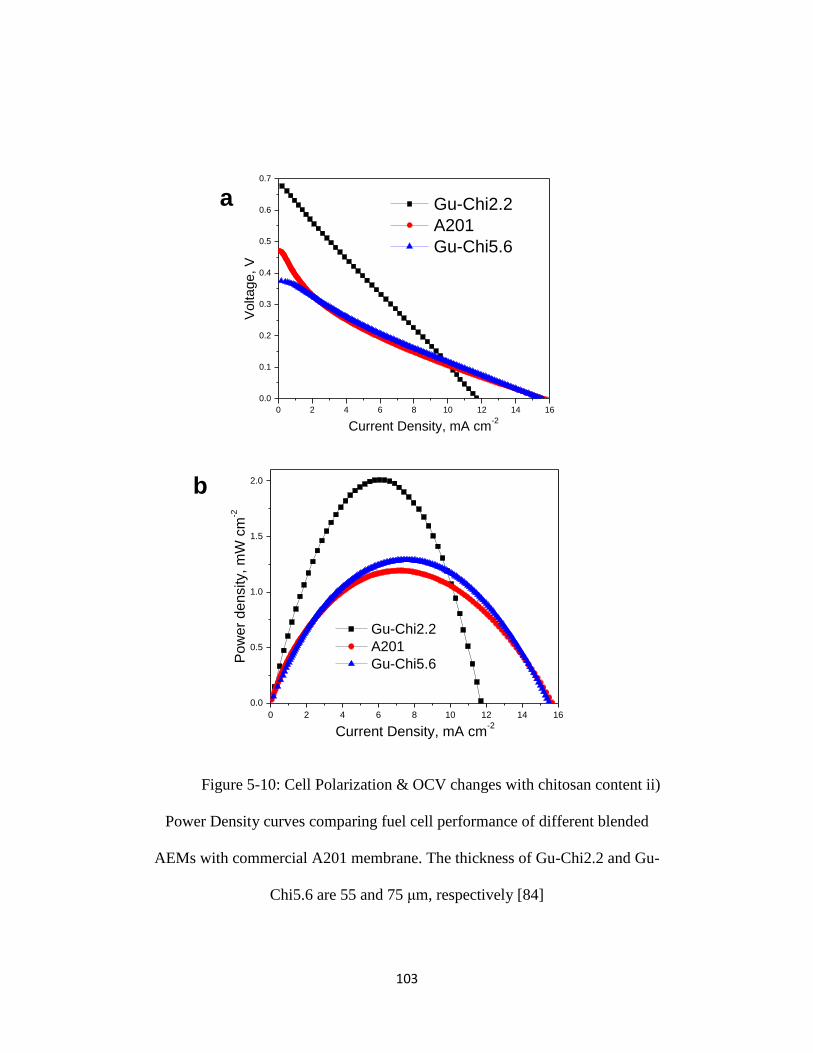
103
0 2 4 6 8 10 12 14 16
0.0
0.1
0.2
0.3
0.4
0.5
0.6
0.7
Gu-Chi2.2
A201
Gu-Chi5.6V
olta
ge
, V
Current Density, mA cm-2
0 2 4 6 8 10 12 14 16
0.0
0.5
1.0
1.5
2.0
Gu-Chi2.2
A201
Gu-Chi5.6Po
we
r d
en
sity,
mW
cm
-2
Current Density, mA cm-2
Figure 5-10: Cell Polarization & OCV changes with chitosan content ii)
Power Density curves comparing fuel cell performance of different blended
AEMs with commercial A201 membrane. The thickness of Gu-Chi2.2 and Gu-
Chi5.6 are 55 and 75 μm, respectively [84]
a
b
104
We envision more enhancements in performance by quaternizing the
chitosan in the membranes [88] thereby augmenting the already high hydroxide
conductivity provided by the guanidinium anion exchangers. The process would
involve crosslinking which would also boost the mechanical properties of the
membranes and reduce the membrane swelling/dissolution. In addition, the
mechanism of hydroxide transport is still not that well understood for AEMs in
general and for guanidinium in particular. Further investigation is already under
way to assess the long term stability and work is near completion to probe the micro
and nanoscale phase changes with guanidinium acting as an anion exchanger.
5.6 Conclusion
All the guanidinium based membranes show high anionic conductivity due
to the strong basic nature and resonance structure of guanidinium group. The
composite membranes especially showed the highest anionic conductivity values.
It shows that the guanidinium prepolymer forms a well-connected network through
the cross-section of the porous PTFE substrate. The high water uptake values also
facilitates hydroxide conduction aided by the crosslinking effect. The crosslinked
samples in particular exhibit ionic conductivities (78.9-84.7 mS cm-1) comparable
to Nafion at room temperature. In addition, the composite membranes do not suffer

105
from any rule of mixtures as the guanidinium polymer is not mixed with another
polymer as in the case of the hybrid blended membranes.
However, due to the difficulty of fabricating composite membranes of
larger sizes because of the extremely hydrophobic nature of PTFE, Guanidinium-
Chitosan blend AEMs are also tested. They reveal decent performance
demonstrated by their use in DMAFCs. They prove to be a promising alternative to
the existing commercial membranes because of their ease of fabrication and
versatility. In these membranes, chitosan has excellent film forming properties and
can provide the much needed reinforcement to the blend membranes while the
guanidinium groups act as the ion exchange group. Furthermore, modifying the
membranes with the stearate groups could lead to better integrity and lower fuel
crossover. Hence, the performance of all the fabricated membranes was found to
be comparable to the commercial Tokoyama A201 membrane, with the GuChi2.2
actually better in the DMAFC. This is promising because our preliminary work [83]
on their chemical stability has shown that the guanidinium group used in the
backbone of the polymer structure significantly enhances the membrane stability
against chemical attack of hydroxyl groups. Therefore, the developed membranes
pose great promise for DMAFC applications.

106
Micro/Nano Phase Analysis of Guanidinium based AEMs
6.1 Introduction
The role of an AEM is to conduct hydroxyl ions from the cathode to the
anode where reduction and oxidation of O2 and methanol occur. This transport of
hydroxyl ions has to be at very high rates and should also be highly selective. If this
is not the case, then the corresponding fuel cell will not exhibit performance of any
practical significance. As it is, the conduction of large bulky anion is slower than
those of hydronium ions in PEMs. Hence, there is an urgent need to understand the
mechanism of hydroxide transport through AEMs in order to tune their respective
hydroxide conductivities accordingly. This chapter proposes to probe the
membranes on the micro and nano levels using Raman spectroscopy and AFM
techniques to see if there is any preexisting or in-situ phase network to facilitate
such hydroxide transport for fuel cell applications.
Since the development and commercialization of AEMs especially for high
end applications such as fuel cells are relatively new, there are only a few studies
on this subject. Hence with the limited number of analytic or numeric models
currently in literature, debates concerning the exact mechanism for hydroxide
transport are at large. Most of our understanding comes from analogies with proton
exchange membranes.
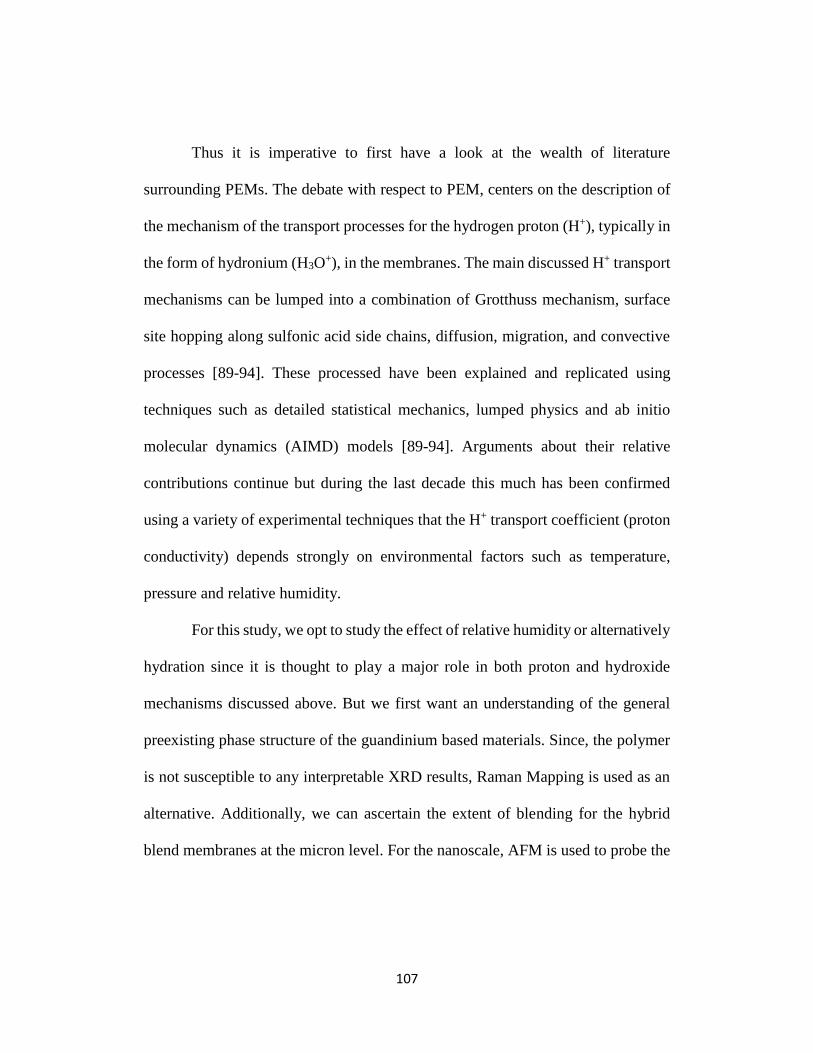
107
Thus it is imperative to first have a look at the wealth of literature
surrounding PEMs. The debate with respect to PEM, centers on the description of
the mechanism of the transport processes for the hydrogen proton (H+), typically in
the form of hydronium (H3O+), in the membranes. The main discussed H+ transport
mechanisms can be lumped into a combination of Grotthuss mechanism, surface
site hopping along sulfonic acid side chains, diffusion, migration, and convective
processes [89-94]. These processed have been explained and replicated using
techniques such as detailed statistical mechanics, lumped physics and ab initio
molecular dynamics (AIMD) models [89-94]. Arguments about their relative
contributions continue but during the last decade this much has been confirmed
using a variety of experimental techniques that the H+ transport coefficient (proton
conductivity) depends strongly on environmental factors such as temperature,
pressure and relative humidity.
For this study, we opt to study the effect of relative humidity or alternatively
hydration since it is thought to play a major role in both proton and hydroxide
mechanisms discussed above. But we first want an understanding of the general
preexisting phase structure of the guandinium based materials. Since, the polymer
is not susceptible to any interpretable XRD results, Raman Mapping is used as an
alternative. Additionally, we can ascertain the extent of blending for the hybrid
blend membranes at the micron level. For the nanoscale, AFM is used to probe the

108
structure along with any effects from the degree of hydration. Finally a simulation
is attempted to better understand the experimental findings.
6.2 Microstructure Raman Chemical Mapping
Raman spectrographs and mapping are conducted using a Thermo Scientific
DXR Raman Spectroscope. Initially, the guanidinium prepolymer and chitosan
starting material are examined to mark their main functional peaks. These are
illustrated in Figure 6-1.
3000 2500 2000 1500 1000 500
-100
0
100
200
300
400
500
Main Chitosan peak
Ra
ma
n In
ten
sity, A
.U
wavenumber cm-1
Guanidinium based polymer
Chitosan
Main Guanidinium peak
Figure 6-1: Raman Spectrographs of Guanidinium based polymer and
chitosan starting materials

109
The maps are then correspondingly obtained by using a ratio of these peaks.
Initially the blended polyelectrolyte is examined with a certain step size. The step
size refers to the movement in distance (x.y) directions of the laser to reach its next
scan location for collecting the spectra. When specifying the step size, it is
important to keep the aperture in mind. It is a good idea to keep the step size equal
to the aperture size (25 µm). In fact, it is also possible to ‘over step’ the map to
obtain an even smoother profile. For the maps presented in this dissertation, each
are obtained with a total of 20 spectra. That is, the sample is scanned 20 times, and
each scan location is separated by the selected step size for that map. This complete
movement for the 20 spectra separated by the step size gives the total map area.
Table 6-1 shows the general operating parameters of the Raman spectroscope and
Table 6-2 gives the individual conditions for each map, especially the relation of
step size with total scan area.

110
Table 6-1: General operating parameters for the Raman Spectroscope
Exposure time: 2.00 sec
Number of exposures: 3
Laser: 780 nm
Laser power level: 50.0 mW
Grating: 400 lines/mm
Spectrograph aperture: 25 µm slit
Number of spectra for mapping: 20
Table 6-2: Conditions for Raman mapping
Figure # Sample Step Size (x.y) Map size (x.y)
6-3a Hybrid Blended
Gu-Chi5.6
250x250 µm 1000x750 µm
6-3b 1250x125 µm 500x350 µm
6-3c 25x25 µm 100x70 µm
6-4 Guanidinium
Prepolymer
25x25 µm 100x70 µm
After the complete 20 spectra are collected from the scan area, this whole
area is then mapped with the area ratio of Main Guanidinium peak/Main
Chitosan peak labelled in Figure 6-1. Hence, this gives a map corresponding to
the ratio of these two peaks.

111
Thus, the maps are actually telling us how effective the homogeneity of the
polymer blend in the membrane is. This effectiveness which is actually the value
of the ratio pointed out in the preceding paragraph, is represented on the scale bar
at the bottom of each Figure 6-2 a-c. The left box is a 2D map and this is
reproduced on the right in 3D with the intensity of the ratio as the z-axis.
The results in Figure 6-2 show that overall the blending is homogenous
with regions of slight gradients marked in the map. This is reasonable as small
differences of the peak area intensities are not only reflective of slight changes in
blended composition on the microscopic scale but also indicative of experiment
artifacts related to the sample surface flatness and fluorescence for example. In
addition there are minor circular regions of higher percentage of guandinium main
peak signal (violet) and also higher percentage of chitosan main peak signal (grey).
These are attributed to the domain structures detected in the SEM images.

112
Figure 6-2: Raman Mapping of hybrid blend Gu-Chi5.6 membrane; a) step
size = 250µm x250µm & scan area = 1000µmx750µm b) step size = 125
µmx125µm & scan size = 500 µm*375 µm c) step size = 25µm*25 µm and scan
size = 100 µm *75 µm
a
b
c
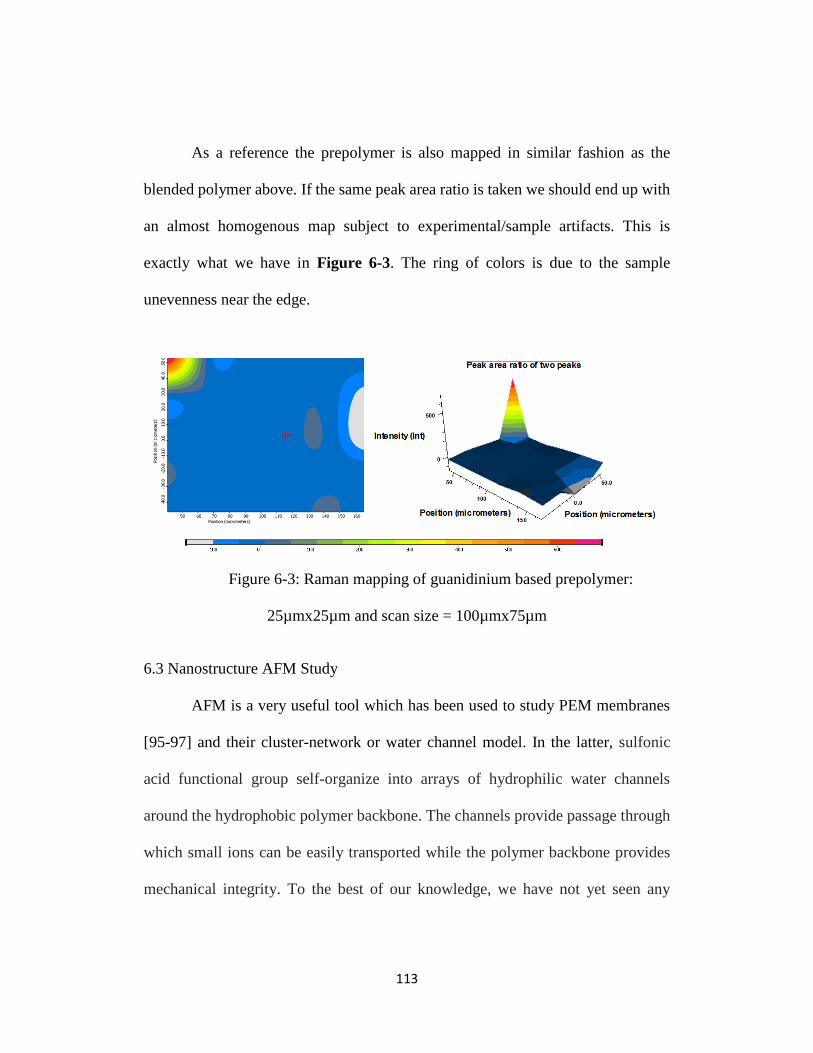
113
As a reference the prepolymer is also mapped in similar fashion as the
blended polymer above. If the same peak area ratio is taken we should end up with
an almost homogenous map subject to experimental/sample artifacts. This is
exactly what we have in Figure 6-3. The ring of colors is due to the sample
unevenness near the edge.
Figure 6-3: Raman mapping of guanidinium based prepolymer:
25µmx25µm and scan size = 100µmx75µm
6.3 Nanostructure AFM Study
AFM is a very useful tool which has been used to study PEM membranes
[95-97] and their cluster-network or water channel model. In the latter, sulfonic
acid functional group self-organize into arrays of hydrophilic water channels
around the hydrophobic polymer backbone. The channels provide passage through
which small ions can be easily transported while the polymer backbone provides
mechanical integrity. To the best of our knowledge, we have not yet seen any
114
detailed AFM study of AEMs particularly in conditions similar to here where the
membrane structure is probed with drastic changes in their hydration levels.
6.3.1 Experimental Setup
A Park XE 70 AFM was used in non-contact mode. Images were generated
in topography, error signal, amplitude and phase mode.
Two set of samples were tested. One was a film from guanidinium based
prepolymer and the other was the Guanidinium-Chitosan hybrid blend membrane
(Gu-Chi2.2). The sample were fully hydrated under water and then extracted.
Immediately afterwards their surface was quickly examined under the microscope.
After taking out the samples and affixing them to the sample holder assembly and
setting up the microscope approximately 15 minutes passed before the image was
obtained. This represents the fully hydrated or wet condition, fresh out of water.
The samples are then reexamined after a gap of 25 minutes putting the total time
after extraction from water to 40 minutes. The images obtained at this stage
represent the semi-hydrated condition. Finally the samples are dried over night at
50 oC and examined under the AFM to study their structure in the dry state.
6.3.2 Results & Discussion
The images for the guanidinium polymer are shown below in Figure 6-4
and their 3D morphology are illustrated below them in Figure 6-5. The
nanostructure for the wet sample is visibly inundated by long parallel channels. The
3D structure shows that these channels separated by height differences which pose

115
as their boundaries. We envision the ravines or glens separated and bordered by
ridges as the channels responsible for anionic conduction. This hypothesis is not
much different from the water channel model in PEMs. Indeed, this is supported by
the image of the semi-hydrated membrane. After sometime (40 minutes), the
number of these ravines decrease giving a reasonable explanation to the loss of
conductivity with a drop in humidity in several studies. These results are not hence,
just extendable to other guanidinium based material and AEMs but also to PEM
(save for the difference in the nature of conducting ions being hydronium in that
case).
Figure 6-4: AFM images of Prepolymer; a) Wet; b) Semi Wet; c) Dry
b a c

116
Figure 6-5: (3D view of) AFM images of Prepolymer; a) Wet; b) Semi
Wet; c) Dry
Finally with the dry sample, it is noticed that the columnar patterns and
ravines coalesce and disappear to give way to a more random equiaxed granular
structure. Hence, the dry membrane displayed random structure; however,
increasing membrane water uptake produced aligned channels, which are attributed
to water-assisted π-stacking of the planar shaped guanidinium groups [98]. The
diameters of the channels are ca. 27 – 30 nm and 15 – 23 nm, respectively, at water
take of 50% and 25%. This face-to-face alignment of guanidinium plans offers
facilitated charge transport as well as great stabilizing effects (as shown by the
results in Chapter 5).
The repeatability of this change from highly orientated channels to random
granular structure with loss of hydration is again demonstrated in Figure 6-6 for
the hybrid blended Gu-Chi2.2 membrane.
a b c

117
Figure 6-6: AFM images of hybrid Gu-Chi2.5 membrane; a) Wet; b) Semi
Wet c) Dry
We go a step further and use the XEI software on the AFM to do a
quantitative study of the conducting channels in the guandininum based polymer
film. A ‘Threshold grain detection algorithm’ is used. In this method, a group of
pixels surrounded by the other pixels are larger (or smaller) than the upper (or
lower) Threshold values are recognized as grains. This is demonstrated for the wet
sample in Figure 6-7 and the grain information which in this case are the ravens of
conducting channels is collected in Table 6-3. Similar analysis are carried out on
the semi-hydrated and dry samples and data from these three is summarized in
Table 6-4.
a b c

118
Figure 6-7: Threshold grain detection of wet prepolymer film
Table 6-3: Grain data of wet prepolymer film from threshold analysis
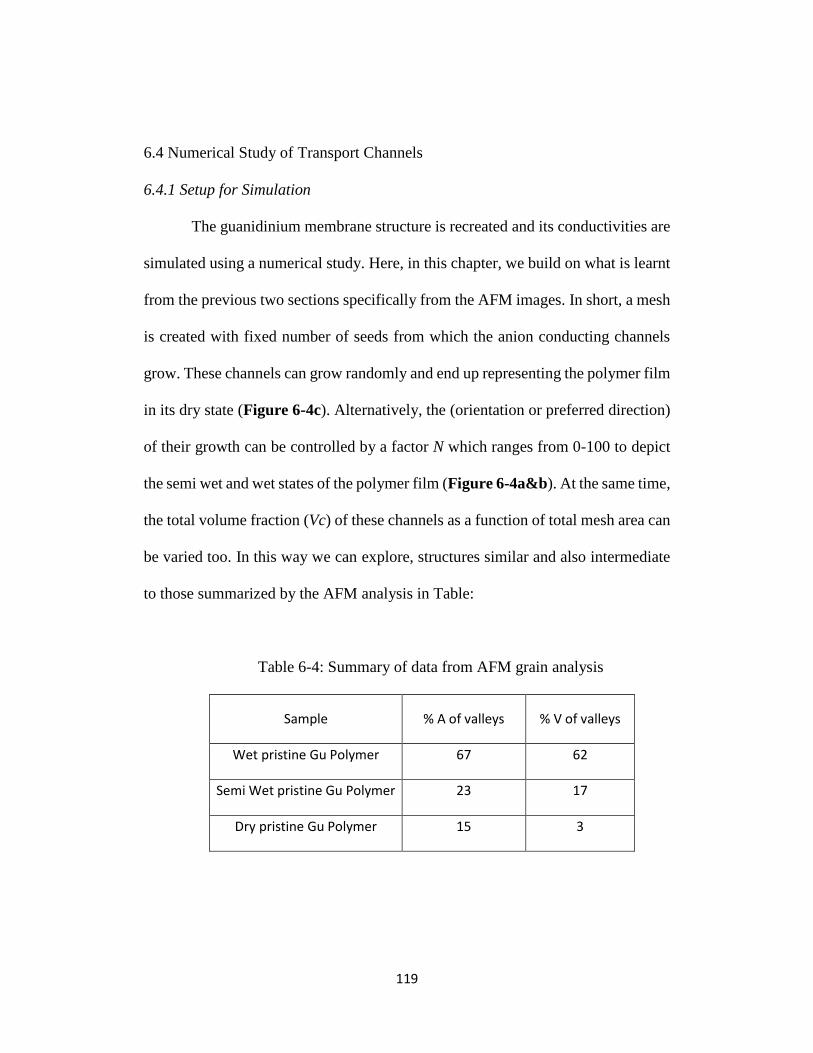
119
6.4 Numerical Study of Transport Channels
6.4.1 Setup for Simulation
The guanidinium membrane structure is recreated and its conductivities are
simulated using a numerical study. Here, in this chapter, we build on what is learnt
from the previous two sections specifically from the AFM images. In short, a mesh
is created with fixed number of seeds from which the anion conducting channels
grow. These channels can grow randomly and end up representing the polymer film
in its dry state (Figure 6-4c). Alternatively, the (orientation or preferred direction)
of their growth can be controlled by a factor N which ranges from 0-100 to depict
the semi wet and wet states of the polymer film (Figure 6-4a&b). At the same time,
the total volume fraction (Vc) of these channels as a function of total mesh area can
be varied too. In this way we can explore, structures similar and also intermediate
to those summarized by the AFM analysis in Table:
Table 6-4: Summary of data from AFM grain analysis
Sample % A of valleys % V of valleys
Wet pristine Gu Polymer 67 62
Semi Wet pristine Gu Polymer 23 17
Dry pristine Gu Polymer 15 3

120
A commercial computational fluid dynamics (CFD) software was used to
simulate the single particle phase transition for different particle size and
morphology. The codes used in the CFD software to describe the equations and
properties of the material are described in detail in Appendix A.
The simulation of electrochemical reaction based on a single-domain,
control-volume approach was performed on the reconstructed 3D domain. Since
the reconstructed membrane structures automatically tracks the interfaces between
different phases; physical equations describing transport properties in different
phases are easily implemented. Transport of hydroxyl is driven by gradient of ionic
potential ( ) in the following equation:
0k
k is the effective ionic conductivity which is dependent on the micro-
morphology of the membrane structure. At the two boundaries perpendicular to the
transport direction (i.e., the left and right boundaries), one layer of transport cells
is added to the computational domain, for ease of implementation of the boundary
conditions. Fixed overpotential values were applied as the boundary conditions.
6.4.2 Simulating Ionic Transport Channels
Figure 6-8 shows an example of the ionic flux which is used to simulate the
polymer channel structures in Figure 6-9.

121
Figure 6-8: Ionic flux simulated for membrane with Vc= 61, N=90; View:
a) right side b) top c) front d) isometric
a
b
c
d

122
Only the three simulated structures which resemble the conditions of the
AFM images in Figure are reproduced here in isometric view. The front, right and
top views of each are included in appendix B for a closer examination. The
structures use the same parameters of Vc as noted in Table for the actual
guanidinium polymer film. The orientation bias N is chosen qualitatively by
inferring the AFM images again; with N=90 corresponding to the well-defined
channeled wet polymer structure, N=34 corresponding to the moderately orientated
semi-wet structure and n=1 going to the random dry polymer structure. Indeed the
simulated and actual polymer structures do resemble each other especially for the
wet and semi wet conditions. For the dry conditions, it is difficult to simulate
meaningful structures with Vc = 3 which is why Vc was taken as 20 but N was kept
low alternatively.

123
Figure 6-9: Isometric generated structures for membranes with a) Vc = 20;
N=1; b) Vc = 20; N=34; Vc = 61; N=90
6.4.3 Simulated Ionic Conductivities
Using different combinations of N and Vc a number of structures (omitted
here to avoid redundancy) were generated. These structures were used to calculate
the ionic conductivity. Ionic conduction was obtained by simulating a potential
a b
c

124
difference between the two ends of the mesh. Refer to appendix A for the exact
code.
0 20 40 60 80 100
0
10
20
30
40
50
60
70
80 20%
40%
50%
62%
80%
Co
nd
uctivity, m
S/c
m
Preferred Orientation
Figure 6-10: Ionic Conductivity vs N for different Vc
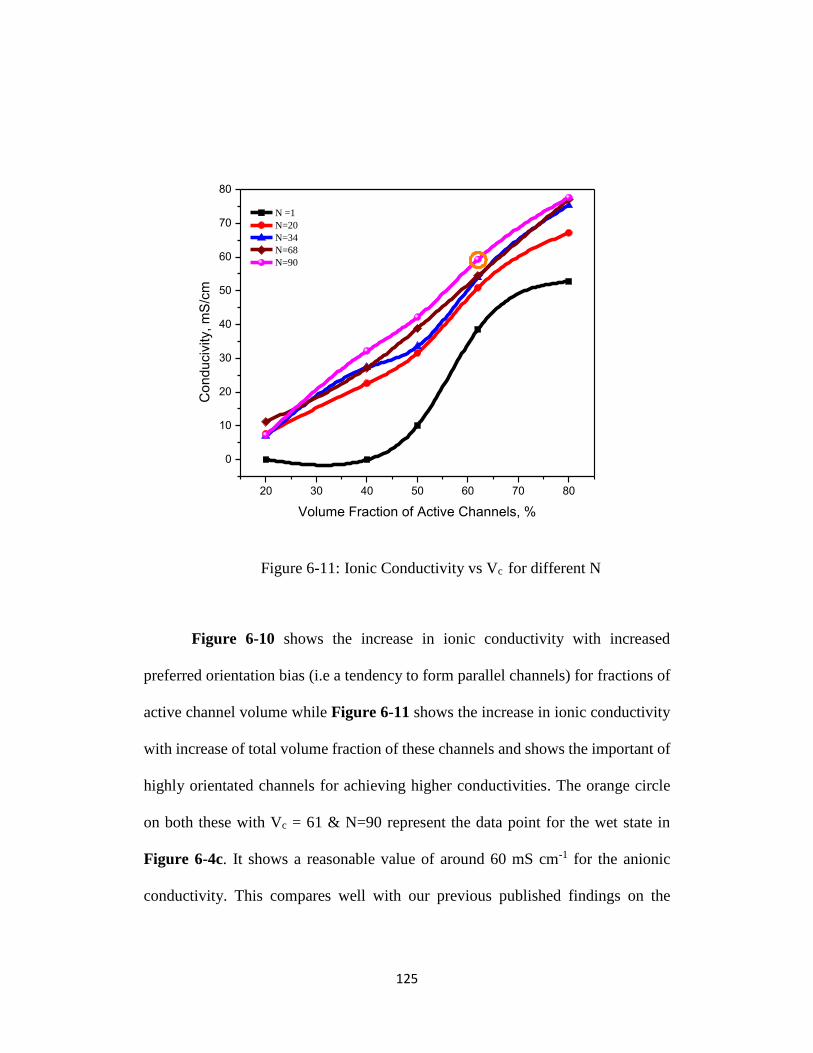
125
20 30 40 50 60 70 80
0
10
20
30
40
50
60
70
80
N =1
N=20
N=34
N=68
N=90
Co
nd
uciv
ity, m
S/c
m
Volume Fraction of Active Channels, %
Figure 6-11: Ionic Conductivity vs Vc for different N
Figure 6-10 shows the increase in ionic conductivity with increased
preferred orientation bias (i.e a tendency to form parallel channels) for fractions of
active channel volume while Figure 6-11 shows the increase in ionic conductivity
with increase of total volume fraction of these channels and shows the important of
highly orientated channels for achieving higher conductivities. The orange circle
on both these with Vc = 61 & N=90 represent the data point for the wet state in
Figure 6-4c. It shows a reasonable value of around 60 mS cm-1 for the anionic
conductivity. This compares well with our previous published findings on the
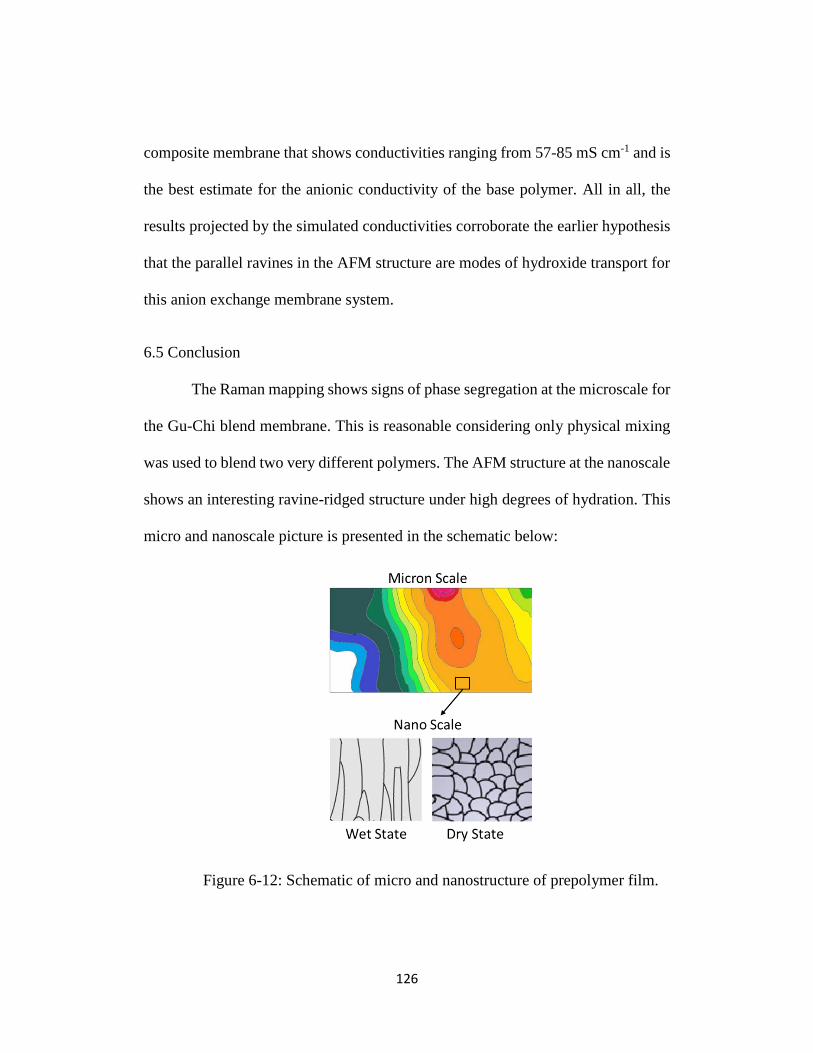
126
composite membrane that shows conductivities ranging from 57-85 mS cm-1 and is
the best estimate for the anionic conductivity of the base polymer. All in all, the
results projected by the simulated conductivities corroborate the earlier hypothesis
that the parallel ravines in the AFM structure are modes of hydroxide transport for
this anion exchange membrane system.
6.5 Conclusion
The Raman mapping shows signs of phase segregation at the microscale for
the Gu-Chi blend membrane. This is reasonable considering only physical mixing
was used to blend two very different polymers. The AFM structure at the nanoscale
shows an interesting ravine-ridged structure under high degrees of hydration. This
micro and nanoscale picture is presented in the schematic below:
Figure 6-12: Schematic of micro and nanostructure of prepolymer film.
127
Figure 6-13 summarizes the findings for the nanoscale study of the
channels and simulations. It is found that similar channels besides existing in PEMs
also exist in some systems of nature. Figure 6-13 relates the nanostructure of the
membranes to the tree trunks. A (250nm x 250nm) AFM scan of the wet prepolymer
film is overlapped with a microstructure of the sapwood section of a tree log or
trunk and it almost perfectly matches. The analogy is clear: Sapwood is that outer
section of the tree that is alive and transports the water and nutrients similar to the
channels in our wet membrane which transport the ions for the fuel cell reaction to
generate energy. Towards the inner side (heartwood) this transport quickly ceases
and eventually the driest (pith) section of the trunk does not help any transport
process but only provides the function of mechanical support. Similarly our ‘dry’
membranes also provide negligible anionic conduction through the EIS process.

128
Figure 6-13: Summary of findings at the nanoscale for the guanidinium
membrane
The simulated structures and reasonable conductivities thus obtained
support the claim that these channels are crucial to hydroxide transport. It may be
beneficial to discuss the guandinium functional group for a better understanding of
how and why these channels form in the first place. Guanidinium is a planer ion
[96] that is well known to form weak hydrogen bonds around its edge. However, it
also known to form strongly-held hydrogen-bonded ion pairs to protein carboxylate
groups. It also possesses a hydrophobic face and hence the orientation of the ion is
important for its interaction with water and other species. It could be argued that it

129
is this preferred orientation that leads to the channel rearrangements seen in the
simulations and AFM structures in wet conditions.

130
Conclusion
One of the main motivations to develop fuel cells is that they offer the
cleanest power generation possible. Besides other advantages such as quiet
operation and efficient energy conversion for steady interrupted electrical supply
they can also be used in hybrid configurations to provide varying power demands
such as automotive applications. However, they have faced serious constraints in
terms of cost and performance. This dissertation has attempted to by-pass these
constraints by adopting and modifying the AFC fuel cells system known to possess
the fastest kinetics under 200 oC.
In essence, the fuel cell system used here is called the Alkaline Anion
Exchange Membrane Fuel Cell. This is able to use the fast kinetics of AFCs by
virtue of their superior electro-kinetics. The guanidinium functional group plays a
key role in the AEMs described in this dissertation. The prepolymer which forms
the basis of the AEMs has the guanidinium group incorporated directly into its
polymer backbone through a polycondensation reaction between a guanidine salt
and two different diamines. This is to ensure maximum stability. Our hypothesis is
confirmed when we compare it against a commercial Tokuyama A201 membrane
which is based on the traditional quaternary ammonium group. Vibrational
spectroscopy showed that under extreme conditions of 5 M KOH solution at 55°C
131
for 50 h. our synthesized material exhibited superior stability compared to the
commercial quaternary ammonium A201. The reason is attributed to the
remarkable charge delocalization (over one carbon and three nitrogen atoms) and
disappearance of hydrogen attached to the three nitrogen atoms in the fully
crosslinked polymers, which makes both Hoffman elimination or direct
nucleophilic displacement reactions unlikely to occur during membrane
degradation. This charge delocalization in the guanidinium hydroxides also
provides a high degree of thermal and basic stability [35, 41]. Hence, the results
demonstrate that the guanidinium group by virtue of its resonance stabilization of
the π-system and its “Y-delocalization” result in stabilization comparable to cyclic
aromatics such as benzene [67].
A series of two contrasting types of AEMs are fabricated from the guanidine
based prepolymer after it is subject to minor post modification such as crosslinking
or tethering a lipophilic element to its main chain for suitable physio-chemical and
mechanical properties. In addition, to achieve these optimum properties along with
the required electrochemical performance, the membranes are eventually fabricated
using two different approaches.
The composite membrane is fabricated by incorporating guanidinium based
polymer solution into a porous polytetrafluoroethylene (PTFE) film. Polymer
crosslinking helps reinforce the mechanical strength of the membranes and
interlock the guanidinium moieties to the porous PTFE. SEM, FTIR & Raman

132
convincingly show complete impregnation of the microporous pores of the PTFE
substrate by the prepared polymer solution.
The hybrid blend membranes were obtained by blending the prepolymer
with chitosan, another strengthening agent. Chitosan is chosen for not just its
compatibility with the prepolymer but also its excellent film forming abilities.
Hence, a polymer slurry which is obtained with the evaporation of most of the
solvent is effectively deposited as film through the application of a doctor blade
and subsequent heat treatment.
Whereas the composite membrane displayed an outstanding ionic
conductivity 80 mS cm-1 (at 20°C in deionized water), the hybrid blend membranes
exhibited relatively lower values due to the effect from the blend components.
These values are slightly below those recorded for the PEM Nafion and are
exceptional considering the difference in the relative transport coefficients of DH+
(9.3 x 10⁻⁹ m2/s) and DOH- (5.3 x 10⁻⁹ m2/s) in liquid water at 25°C [96]. It should
be noted, however, that the IEC values are generally lower when compared to those
found in literature because of the presence of the PTFE substrate. However, IEC is
not a decisive factor in membrane conductivity since Nafion has a low IEC (0.91
mmol g-1 [79]) but a good conductivity at 20 oC (100 mS cm-1) [73]. Membrane
conductivity is also highly dependent on the basicity of ion exchange groups.
Strong basic groups lead to an augmentation of both the number of dissociated
hydroxides and water uptake, thus facilitating ion conductivity under otherwise

133
similar conditions. The strong basicity offered by the guanidinium groups in our
membranes serves the same purpose. Hence, even the drop of ionic conductivities
for the blend membranes is not significant considering the amount and effect of the
blend components.
However, the selectivity (ratio of ionic conductivity to methanol
permeability) of the hybrid blend membranes is found to be superior even when
compared to commercial membranes. Similarly, when used in a direct methanol
alkaline fuel cells (DMAFCs) it fared even better than a commercial AEM
reference reaching to an OCV of 0.69 V compared to the 0.47V of Tokuyama A201
at room temperature. Overall, the developed membranes demonstrate superior
performance and therefore pose great promise for direct methanol anion exchange
fuel cell (DMAFC) applications.
The blend membrane along with the base guanidinium prepolymer film was
thus subject to a final micro and nanophase analysis to gauge a better understanding
of the hydroxide conduction process which is not that well established in literature
so far. Additionally Raman mapping was used to get an idea of the blend
homogeneity as well. Together with AFM for nanoscale imaging we were able to
get a better understanding of the structure of the membranes. Furthermore, the
hydroxide transport process is highlighted when studied for effect of degree of
hydration. It is postulated by studying AFM images that there is phase separation
before under wet conditions leading to formation of thin ravines or hydroxide

134
conducting channels similar to those previously studied and modelled with PEM
membranes. These channels are also studied for better understanding and backing
with the help of a simulation. The mechanism hypothesized may be transferrable to
other guanidinium based membranes and extendible to other types of AEMs as
well.
7.1 Future Work
The concentration of this dissertation of aimed towards developing a series
of high performance stable AEMs. This was adequately demonstrated in Chapters
3 to 6.However, despite various polymer strengthening methods used here, there is
still room to improve the mechanical properties of the polymer and subsequent
membranes made from them. It is recommended to test higher reinforcements
(chitosan) proportions in blend the blend ratios and to perhaps use some stronger
engineering polymers to strengthen the blend e.g. Polysulfones. However, these
strong high molecular weight polymers are usually soluble in only a very small
range of solvents and their compatibility with the guanidine prepolymer must be
assessed before they can be physically or chemically combined with it.
Also on the device development side, namely the direct alkaline methanol
fuel cell could not be optimized as it requires a detail study on the membrane
electrode assembly (MEA) which is beyond the scope of this dissertation. This

135
optimization itself would open several research avenues which should be
investigated in the future. These are summarized below:
Optimizing the Pt or Pt alloy catalyst. This includes making the catalyst
slurry with appropriate guandinium based ionomer content to establish the
best triple phase boundary during fuel cell operation. The deposition and
heat treatment of this slurry over the electrodes must also be determined in
the most repeatable manner.
Along with optimization of the MEA, its incorporation and sealing within
the fuel cell assembly should be done via hot pressing to enable long term
operation.
Once, the perfect fuel cell assembly is accomplished, the effect of operating
variables such as catalyst loading, oxygen and methanol flow rates and
temperature should be investigated
The fuel cell test should be run for longer time periods to assess the stability
in-situ stability of the membranes.
Lastly, when adequate performance is obtained through Pt catalysts, the use
of cheaper non-noble catalysts should be investigated which is one of the
important implications of this work.

136
Appendix A
Code for Simulating Membrane Structure

137
#include "global_var.h" # include "udf.h" # include "id.h" # include "mem.h" # include "sg.h" # include <stdio.h> # include <stdlib.h> # include <time.h> #define n_seed 15 /* LiFePO4 seeds*/ #define a_length 10.0e-9 /* length of side in a unit cell 1*/ #define lx 100.0 /* mesh # along x direction */ #define ly 50.0 /* mesh # along y direction */ #define lz 50.0 /* mesh # along y direction */ #define par_diff 0.50e-7 /* assumed membrane conductivity */ #define wt_c 0.10 /* carbon weight percentage */ #define wt_active 0.80 /* active material weight percentage */ #define wt_binder 0.10 /* binder weight percentage */ #define porosity 0.50 /* electrode porosity */ #define c_coating 0.08 /* carbon coating fraction on LiFePO4 */ #define e_carbon 0.85 /* porosity of carbon */ #define Rho_c 2.2 /* density of carbon in g/cm3 */ #define Rho_active 3.6 /* density of active materials in g/cm3 JES 154(5) A389 2007*/ #define Rho_binder 1.76 /* density of binder in g/cm3 , Journal of The Electrochemical Society, 158(1) A51-A57 (2011)*/ /* C_UDSI(c,t,0) seed position */ /* C_UDSI(c,t,1) Beta, 2 phase (LiFePO4) volume fraction */ /* C_UDSI(c,t,2) index to dishtinguish components */ /* C_UDSI(c,t,3) electrolyte */ /* C_UDSI(c,t,4) phai_e */

138
/* C_UDSI(c,t,5) electrons */ /* C_UDSI(c,t,6) d2ce/dx2, second derivative */ /* C_UDSI(c,t,7) d2ce/dy2, second derivative */ /* C_UDSI(c,t,8) seeds */ /* C_UDSI(c,t,9) before treatment of LiFePO4*/ /* C_UDSI(c,t,10) after treatment of LifePO4 */ /* C_UDSI(c,t,11) after adding carbon coating */ /* C_UDSI(c,t,12) after adding carbon and binder */ /* C_UDSI(c,t,16) two layer of C_UDSI(c,t,9) */ /* C_UDSI(c,t,17) two layer of C_UDSI(c,t,10)*/ /* C_UDSI(c,t,18) two layer of C_UDSI(c,t,11)*/ /* C_UDSI(c,t,19) two layer of C_UDSI(c,t,12)*/ /* C_UDSI(c,t,20) particles */ /* C_UDSI(c,t,21) particles diffusivity */ /********************************************************/ DEFINE_INIT(init,d) { cell_t c; Thread *t; FILE *fUDS0,*fUDS1,*fUDS4; int n,i,j,ip_up,ip_op,k,kkk,ip,ky,iii,kx,jj,kz,ii,xx,yy,zz,i_dd,i_up,n_part,i_tt; int nnn=90; /* value that controls orientation */ int c_up[599000],c_op[250000],i_a[250001],i_b[250001]; double rr,sum_r,i_c[250001],xxx,yyy,zzz; int active_total_occupied,n_carbon_total_occupied,i_lifepo4,i_ccoat,tt; int r=5; active_total_occupied=50000; /* # of polymer unit cells */ n=(int)(lx)*(int)(ly)*(int)(lz);
139
for (i=0;i<=(n-1);i++) {i_a[i]=0;i_b[i]=0;c_op[i]=0;c_up[i]=0;} /* set cell initial values to zero */ /******************************************** putting seeds **********************************************/ srand(time(NULL)); for (j=0;j<=(n_seed-1);j++) {iii=(int)(n*(real)(rand())/((real)(RAND_MAX)+1.0e-10)); i_a[iii]=12;} /* end of putting LiFePO4 seeds */ thread_loop_c(t,d) {begin_c_loop_all(c,t) {C_UDSI(c,t,0)=i_a[c];} /* record seed position */ end_c_loop_all(c,t)} /*********************************************** grows polymers on seeds ****************************************/ ip_op=0; /* ocupied cells numbers */ for (k=0;k<=(n-1);k++) {if (i_a[k]==12) {c_op[ip_op]=k;ip_op++;} } /* record the cell # of occupied cells*/ for (j=0;j<=(active_total_occupied-1-n_seed);j++) { ip_up=0; /* un_ocupied cell numbers */ for (kkk=0;kkk<=(ip_op-1);kkk++) { ky=c_op[kkk]/(int)(ly)/(int)(lx); kz=(c_op[kkk]-ky*(int)(ly)*(int)(lx))/(int)(lx); kx=c_op[kkk]-ky*(int)(ly)*(int)(lx)-kz*(int)(lx); ip=(kx-1)+(kz)*(int)(lx)+(ky)*(int)(ly)*(int)(lx); if (((kx-1)>=0)&&(i_a[ip]==0)) {for (k=1;k<=nnn;k++) {c_up[ip_up]=ip; ip_up++;}} ip=(kx+1)+(kz)*(int)(lx)+(ky)*(int)(ly)*(int)(lx); if (((kx+1)<=((int)(lx)-1))&&(i_a[ip]==0)) {for (k=1;k<=nnn;k++) {c_up[ip_up]=ip; ip_up++;}}

140
ip=(kx)+(kz-1)*(int)(lx)+(ky)*(int)(ly)*(int)(lx); if (((kz-1)>=0)&&(i_a[ip]==0)) {c_up[ip_up]=ip; ip_up++;} ip=(kx)+(kz+1)*(int)(lx)+(ky)*(int)(ly)*(int)(lx); if (((kz+1)<=((int)(lz)-1))&&(i_a[ip]==0)) {c_up[ip_up]=ip; ip_up++;} ip=(kx)+(kz)*(int)(lx)+(ky-1)*(int)(ly)*(int)(lx); if (((ky-1)>=0)&&(i_a[ip]==0)) {c_up[ip_up]=ip; ip_up++;} ip=(kx)+(kz)*(int)(lx)+(ky+1)*(int)(ly)*(int)(lx); if (((ky+1)<=((int)(ly)-1))&&(i_a[ip]==0)) {c_up[ip_up]=ip; ip_up++;} } /* end of kkk */ iii=c_up[(int)((ip_up-1)*(real)(rand())/((real)(RAND_MAX)+1.0e-10))]; i_a[iii]=12; c_op[ip_op]=iii; ip_op++; } /* end of j */ thread_loop_c(t,d) {begin_c_loop_all(c,t) {C_UDSI(c,t,1)=i_a[c];} end_c_loop_all(c,t)} /*************************************************** particle orientation above ***********************************/ } /*************** DEFINE_on_demand - remove unmeaningful cells after complet simulation **********************/ DEFINE_ON_DEMAND(left_right_boudries) { Domain *domain; cell_t c; Thread *t; int kx,ky,kz;

141
domain= Get_Domain(1); thread_loop_c(t,domain) { begin_c_loop_all(c,t) { ky=c/(int)(ly)/(int)(lx); kz=(c-ky*(int)(ly)*(int)(lx))/(int)(lx); kx=c-ky*(int)(ly)*(int)(lx)-kz*(int)(lx); if ((kx==0)||(kx==((int)(lx)-1))) {C_UDSI(c,t,1)=5;} } end_c_loop_all(c,t) } thread_loop_c(t,domain) { begin_c_loop_all(c,t) { if ((C_UDSI(c,t,1)==12)||(C_UDSI(c,t,1)==5)) C_UDSI_DIFF(c,t,2)=par_diff; else C_UDSI_DIFF(c,t,2)=1.0e-30; } end_c_loop_all(c,t) } } /*******************************************************************************/ DEFINE_DIFFUSIVITY(diff_UDS2,c,t,i) { double diff; if ((C_UDSI(c,t,1)==12)||(C_UDSI(c,t,1)==5)) diff=par_diff;
142
else diff=0.0*1.0e-30; return diff; } /* end of define */ /************************************************** ********************************************/ DEFINE_ON_DEMAND(new_app_diff_cal) { Domain *domain; cell_t c; Thread *t; real i_a[250002],i_c[250002]; int kz,ky,kx,nlx,nly,nlz,iii; real ionic1,ionic2; real x[ND_ND]; FILE *fUDS0; fUDS0=fopen("app_diff_new.txt","w"); nlx=(int)(lx); nly=(int)(ly); nlz=(int)(lz); domain= Get_Domain(1); /******************************** substitute C-UDSI(c,t,1) with i_a(i) *********************************/ thread_loop_c(t,domain) { C_CENTROID(x,0,t); begin_c_loop_all(c,t) { i_a[c]=C_UDSI(c,t,2); /* ionic*/ i_c[c]=C_UDSI_DIFF(c,t,2); /* ionic diff*/ } end_c_loop_all(c,t) }

143
/**********************************************************************************************/ kx=0; ionic1=0.0; /* flux */ for (kz=0;kz<=(nlz-1);kz++) for (ky=0;ky<=(nly-1);ky++) { iii=kx+kz*nlx+ky*nly*nlx; ionic1=ionic1+ a_length* a_length*i_c[iii]*(i_a[iii]-0.0)/x[0]; } /*end for kz*/ kx=(nlx-1); ionic2=0.0; for (kz=0;kz<=(nlz-1);kz++) for (ky=0;ky<=(nly-1);ky++) { iii=kx+kz*nlx+ky*nly*nlx; ionic2=ionic2+ a_length* a_length*i_c[iii]*(i_a[iii]-1.0)/x[0]; } /*end for kz*/ fprintf(fUDS0,"ionic1 flux %12.8e\n",ionic1); fprintf(fUDS0,"ionic2 flux %12.8e\n",ionic2); fprintf(fUDS0,"conducivity@left %18.9e\n",ionic1/(nly*nlz* a_length* a_length)*nlx* a_length/1.0); fprintf(fUDS0,"conducivity@right %18.9e\n", ionic2/(nly*nlz* a_length* a_length)*nlx* a_length/1.0); fclose(fUDS0); } /* end*/ /**********************************************************************************************/

144
DEFINE_SOURCE(uds2,c,t,dS,eqn) { real x[ND_ND]; real source; if ((C_UDSI(c,t,1)==12)||(C_UDSI(c,t,1)==5)) source=dS[eqn]=0.0; else {source=-1.0e30*C_UDSI(c,t,2)+1.0e30*0.0; dS[eqn]=-1.0e30; } return source; }

145
Appendix B
Simulated Structures

146
Top View
Vc = 20; N=1 Vc = 20; N=1 Vc = 20; N=34
Vc = 61; N=90

147
Right Side View
Vc = 20; N=1 Vc = 20; N=34
Vc = 61; N=90

148
Front View
Vc = 20; N=1 Vc = 20; N=34
Vc = 61; N=90

149
References
1. Winter, M. and R.J. Brodd, What Are Batteries, Fuel Cells, and
Supercapacitors? Chemical Reviews, 2004. 104(10): p. 4245-4270.
2. Graziano, G., Contrasting the denaturing effect of guanidinium chloride
with the stabilizing effect of guanidinium sulfate. Physical Chemistry
Chemical Physics, 2011. 13(25): p. 12008-12014.
3. http://www.fuelcell.no/principle_history_eng.htm
4. Yan, J. and M.A. Hickner, Anion Exchange Membranes by Bromination of
Benzylmethyl-Containing Poly(sulfone)s. Macromolecules, 2010. 43(5): p.
2349-2356.
5. ARGES, et al., The chalkboard: Anion exchange membrane fuel cells. Vol.
19. 2010, Pennington, NJ, ETATS-UNIS: Electrochemical Society. 5.
6. Varcoe, J.R. and R.C. Slade, Prospects for Alkaline Anion‐Exchange
Membranes in Low Temperature Fuel Cells. Fuel Cells, 2005. 5(2): p. 187-
200.
7. Gasteiger, H.A., et al., Activity benchmarks and requirements for Pt, Pt-
alloy, and non-Pt oxygen reduction catalysts for PEMFCs. Applied
Catalysis B: Environmental, 2005. 56(1–2): p. 9-35.
8. de Leon, C.P., et al., Direct borohydride fuel cells. Journal of Power
Sources, 2006. 155(2): p. 172-181.

150
9. Anastasijević, N.A., V. Vesović, and R.R. Adžić, Determination of the
kinetic parameters of the oxygen reduction reaction using the rotating ring-
disk electrode. Journal of Electroanalytical Chemistry and Interfacial
Electrochemistry, 1987. 229(1): p. 305-316.
10. Spendelow, J.S. and A. Wieckowski, Electrocatalysis of oxygen reduction
and small alcohol oxidation in alkaline media. Physical Chemistry
Chemical Physics, 2007. 9(21): p. 2654-2675.
11. Blizanac, B.B., P.N. Ross, and N.M. Markovic, Oxygen electroreduction on
Ag(1 1 1): The pH effect. Electrochimica Acta, 2007. 52(6): p. 2264-2271.
12. Tripković, A.V., et al., Methanol electrooxidation on supported Pt and PtRu
catalysts in acid and alkaline solutions. Electrochimica Acta, 2002. 47(22–
23): p. 3707-3714.
13. Matsuoka, K., et al., Alkaline direct alcohol fuel cells using an anion
exchange membrane. Journal of Power Sources, 2005. 150: p. 27-31.
14. Yeung, K. and A. Tseung, The Reduction of Oxygen on Teflon‐Bonded
Perovskite Oxide Electrodes. Journal of The Electrochemical Society, 1978.
125(6): p. 878-882.
15. Guo, M., et al., Synthesis and characterization of novel anion exchange
membranes based on imidazolium-type ionic liquid for alkaline fuel cells.
Journal of Membrane Science, 2010. 362(1–2): p. 97-104.

151
16. Hosseini, S.M., S.S. Madaeni, and A.R. Khodabakhshi, Preparation and
characterization of ABS/HIPS heterogeneous anion exchange membrane
filled with activated carbon. Journal of Applied Polymer Science, 2010.
118(6): p. 3371-3383.
17. Gu, S., et al., A Soluble and Highly Conductive Ionomer for High-
Performance Hydroxide Exchange Membrane Fuel Cells. Angewandte
Chemie International Edition, 2009. 48(35): p. 6499-6502.
18. Wang, J., et al., Synthesis of Soluble Poly(arylene ether sulfone) Ionomers
with Pendant Quaternary Ammonium Groups for Anion Exchange
Membranes. Macromolecules, 2009. 42(22): p. 8711-8717.
19. Robertson, N.J., et al., Tunable High Performance Cross-Linked Alkaline
Anion Exchange Membranes for Fuel Cell Applications. Journal of the
American Chemical Society, 2010. 132(10): p. 3400-3404.
20. Bauer, B., H. Strathmann, and F. Effenberger, Anion-exchange membranes
with improved alkaline stability. Desalination, 1990. 79(2): p. 125-144.
21. Sata, T., et al., Change of anion exchange membranes in an aqueous sodium
hydroxide solution at high temperature. Journal of Membrane Science,
1996. 112(2): p. 161-170.
22. Hwang, G.-J. and H. Ohya, Preparation of anion-exchange membrane
based on block copolymers: Part 1. Amination of the chloromethylated
copolymers. Journal of Membrane Science, 1998. 140(2): p. 195-203.

152
23. Komkova, E.N., et al., Anion-exchange membranes containing diamines:
preparation and stability in alkaline solution. Journal of Membrane
Science, 2004. 244(1-2): p. 25-34.
24. Hibbs, M.R., et al., Transport Properties of Hydroxide and Proton
Conducting Membranes. Chemistry of Materials, 2008. 20(7): p. 2566-
2573.
25. Li, L. and Y. Wang, Quaternized polyethersulfone Cardo anion exchange
membranes for direct methanol alkaline fuel cells. Journal of Membrane
Science, 2005. 262(1-2): p. 1-4.
26. Couture, G., et al., Polymeric materials as anion-exchange membranes for
alkaline fuel cells. Progress in Polymer Science, 2011. 36(11): p. 1521-
1557.
27. Tanaka, M., et al., Anion Conductive Aromatic Ionomers Containing
Fluorenyl Groups. Macromolecules, 2010. 43(6): p. 2657-2659.
28. Xiong, Y., et al., Performance of organic–inorganic hybrid anion-exchange
membranes for alkaline direct methanol fuel cells. Journal of Power
Sources, 2009. 186(2): p. 328-333.
29. Pan, J., et al., High-Performance Alkaline Polymer Electrolyte for Fuel Cell
Applications. Advanced Functional Materials, 2010. 20(2): p. 312-319.

153
30. Lee, S.H. and J.C. Rasaiah, Proton transfer and the mobilities of the H[sup
+ ] and OH[sup - ] ions from studies of a dissociating model for water. The
Journal of Chemical Physics, 2011. 135(12): p. 124505-10.
31. Lin, X., et al., Alkali resistant and conductive guanidinium-based anion-
exchange membranes for alkaline polymer electrolyte fuel cells. Journal of
Power Sources, 2012. 217(0): p. 373-380.
32. Wang, J., S. Li, and S. Zhang, Novel Hydroxide-Conducting Polyelectrolyte
Composed of an Poly(arylene ether sulfone) Containing Pendant
Quaternary Guanidinium Groups for Alkaline Fuel Cell Applications.
Macromolecules, 2010. 43(8): p. 3890-3896.
33. Kim, D.S., et al., Guanidinium-Functionalized Anion Exchange Polymer
Electrolytes via Activated Fluorophenyl-Amine Reaction. Chemistry of
Materials, 2011. 23(17): p. 3795-3797.
34. Qu, C., et al., A high-performance anion exchange membrane based on bi-
guanidinium bridged polysilsesquioxane for alkaline fuel cell application.
Journal of Materials Chemistry, 2012. 22(17): p. 8203-8207.
35. Mateus, N.M.M., et al., Synthesis and properties of tetra-alkyl-
dimethylguanidinium salts as a potential new generation of ionic liquids.
Green Chemistry, 2003. 5(3): p. 347-352.

154
36. Zhang, Q., S. Li, and S. Zhang, A novel guanidinium grafted poly(aryl ether
sulfone) for high-performance hydroxide exchange membranes. Chemical
Communications, 2010. 46(40): p. 7495-7497.
37. Merle, G., M. Wessling, and K. Nijmeijer, Anion exchange membranes for
alkaline fuel cells: A review. Journal of Membrane Science, 2011. 377(1):
p. 1-35.
38. Cope, A.C. and A.S. Mehta, Mechanism of the Hofmann elimination
reaction: an ylide intermediate in the pyrolysis of a highly branched
quaternary hydroxide. Journal of the American Chemical Society, 1963.
85(13): p. 1949-1952.
39. Varcoe, J., S. Poynton, and R. Slade, Alkaline anion‐exchange membranes
for low‐temperature fuel cell application. Handbook of Fuel Cells, 2010.
40. Zhang, F., et al., PTFE based composite anion exchange membranes:
thermally induced in situ polymerization and direct hydrazine hydrate fuel
cell application. Journal of Materials Chemistry, 2010. 20(37): p. 8139-
8146.
41. Liu, Y.-L., et al., Preparation and applications of Nafion-functionalized
multiwalled carbon nanotubes for proton exchange membrane fuel cells.
Journal of Materials Chemistry, 2010. 20(21): p. 4409-4416.
155
42. Matsumoto, K., et al., Very High Performance Alkali Anion-Exchange
Membrane Fuel Cells. Advanced Functional Materials, 2011. 21(6): p.
1089-1094.
43. Jung, M.-s.J., C.G. Arges, and V. Ramani, A perfluorinated anion exchange
membrane with a 1,4-dimethylpiperazinium cation. Journal of Materials
Chemistry, 2011. 21(17): p. 6158-6160.
44. Brian, R.E., et al., Stability of Cations for Anion Exchange Membrane Fuel
Cells. ECS Transactions, 2007. 11(1): p. 1173-1180.
45. Zhou, J., et al., Anionic polysulfone ionomers and membranes containing
fluorenyl groups for anionic fuel cells. Journal of Power Sources, 2009.
190(2): p. 285-292.
46. Chempath, S., et al., Mechanism of Tetraalkylammonium Headgroup
Degradation in Alkaline Fuel Cell Membranes. The Journal of Physical
Chemistry C, 2008. 112(9): p. 3179-3182.
47. Zhang, Q., S. Li, and S. Zhang, A novel guanidinium grafted poly (aryl ether
sulfone) for high-performance hydroxide exchange membranes. Chemical
Communications, 2010. 46(40): p. 7495-7497.
48. Varcoe, J.R. and R.C.T. Slade, Prospects for Alkaline Anion-Exchange
Membranes in Low Temperature Fuel Cells. Fuel Cells, 2005. 5(2): p. 187-
200.
156
49. Sajjad, S.D., Y. Hong, and F. Liu, Synthesis of guanidinium‐based anion
exchange membranes and their stability assessment. Polymers for
Advanced Technologies, 2014. 25(1): p. 108-116.
50. Agmon, N., Mechanism of hydroxide mobility. Chemical Physics Letters,
2000. 319(3): p. 247-252.
51. Tuckerman, M.E., D. Marx, and M. Parrinello, The nature and transport
mechanism of hydrated hydroxide ions in aqueous solution. Nature, 2002.
417(6892): p. 925-929.
52. Grew, K.N. and W.K. Chiu, A dusty fluid model for predicting hydroxyl
anion conductivity in alkaline anion exchange membranes. Journal of the
Electrochemical Society, 2010. 157(3): p. B327-B337.
53. Qian, L., et al., Modified guanidine polymers: synthesis and antimicrobial
mechanism revealed by AFM. Polymer, 2008. 49(10): p. 2471-2475.
54. Rogalskyy, S., et al., Fabrication of new antifungal polyamide-12 material.
Polymer International, 2012. 61(5): p. 686-691.
55. Nakanishi, K., Infrared Absorption Spectroscopy, Tokyo: Nankido
Company, 1962.
56. Goto, T., K. Nakanishi, and M. Ohashi, An account on the infrared
absorption of guanidiniums. Bulletin of the Chemical Society of Japan,
1957. 30(7): p. 723-725.

157
57. Stel’Mah, S., L. Bazaron, and D. Mognonov, On the mechanism of the
hexamethylenediamine and guanidine hydrochloride polycondensation.
Russian Journal of Applied Chemistry, 2010. 83(2): p. 342-344.
58. Stel’makh Sergey Aleksandrovich, G.e., et al., Synthesis and pH-Sensitivity
of Guanidine Containing Hydrogels. 2012.
59. Liu, F., et al., Development of novel self-humidifying composite membranes
for fuel cells. Journal of Power Sources, 2003. 124(1): p. 81-89.
60. Liu, F., et al., Nafion/PTFE composite membranes for fuel cell applications.
Journal of Membrane Science, 2003. 212(1–2): p. 213-223.
61. Zhang, Y., J. Jiang, and Y. Chen, Synthesis and antimicrobial activity of
polymeric guanidine and biguanidine salts. Polymer, 1999. 40(22): p. 6189-
6198.
62. Kreuer, K.-D., et al., Transport in Proton Conductors for Fuel-Cell
Applications: Simulations, Elementary Reactions, and Phenomenology.
Chemical Reviews, 2004. 104(10): p. 4637-4678.
63. Fernandes, L.L., et al., Cytocompatibility of chitosan and collagen-chitosan
scaffolds for tissue engineering. Polímeros, 2011. 21: p. 1-6.
64. Kovalenko, V.I., D.N. Gayfutdinova, and V.L. Furer, Ionic layers of
potassium and sodium stearates at liquid-crystal transitions according to
the data from infra-red spectroscopy. Physicochem Investig, 2002. 2(6): p.
37.

158
65. Tao, Y., J. Kim, and J.M. Torkelson, Achievement of quasi-nanostructured
polymer blends by solid-state shear pulverization and compatibilization by
gradient copolymer addition. Polymer, 2006. 47(19): p. 6773-6781.
66. Kenji Fukuta, AMFC Workshop,Tokuyama Corporation, May 8th 2011.
67. Arges, C.G., V. Ramani, and P.N. Pintauro, Anion Exchange Membrane
Fuel Cells. The Electrochemical Society Interface, 2010. Summer: p. 31-
35.
68. Even, U. and J. Jortner, Spectroscopy of Large Molecules in Supersonic
Expansions: Isolated Ultracold Porphyrins, in Intramolecular Dynamics, J.
Jortner and B. Pullman, Editors. 1982, Springer Netherlands. p. 227-240.
69. Kiss, A.M., et al., Carbonate and bicarbonate ion transport in alkaline
anion exchange membranes. Journal of The Electrochemical Society, 2013.
160(9): p. F994-F999.
70. Pivovar, B., 2011 Alkaline Membrane Fuel Cell Workshop Final Report.
Contract, 2012. 303: p. 275-3000.
71. Robertson, N.J., et al., Tunable High Performance Cross-Linked Alkaline
Anion Exchange Membranes for Fuel Cell Applications. Journal of the
American Chemical Society, 2010. 132(10): p. 3400-3404.
72. Fujimoto, C.H., et al., Ionomeric Poly(phenylene) Prepared by Diels−Alder
Polymerization: Synthesis and Physical Properties of a Novel
Polyelectrolyte. Macromolecules, 2005. 38(12): p. 5010-5016.
159
73. Jeong, M.-H., K.-S. Lee, and J.-S. Lee, Cross-Linking Density Effect of
Fluorinated Aromatic Polyethers on Transport Properties.
Macromolecules, 2009. 42(5): p. 1652-1658.
74. Slade, S., et al., Ionic Conductivity of an Extruded Nafion 1100 EW Series
of Membranes. Journal of The Electrochemical Society, 2002. 149(12): p.
A1556-A1564.
75. Zhou, J., et al., Crosslinked, epoxy-based anion conductive membranes for
alkaline membrane fuel cells. Journal of Membrane Science, 2010. 350(1–
2): p. 286-292.
76. Qiu, B., et al., Alkaline imidazolium- and quaternary ammonium-
functionalized anion exchange membranes for alkaline fuel cell
applications. Journal of Materials Chemistry, 2012. 22(3): p. 1040-1045.
77. Wan, Y., et al., Anion-exchange membranes composed of quaternized-
chitosan derivatives for alkaline fuel cells. Journal of Power Sources, 2010.
195(12): p. 3785-3793.
78. Gasa, J.V., R. Weiss, and M.T. Shaw, Ionic crosslinking of ionomer
polymer electrolyte membranes using barium cations. Journal of Membrane
Science, 2007. 304(1): p. 173-180.
79. Walker, M., et al., Barrier properties of plasma-polymerized thin films.
Surface and Coatings technology, 1999. 116: p. 996-1000.

160
80. Miyatake, K., H. Zhou, and M. Watanabe, Proton Conductive Polyimide
Electrolytes Containing Fluorenyl Groups: Synthesis, Properties, and
Branching Effect. Macromolecules, 2004. 37(13): p. 4956-4960.
81. Lee, S.H. and J.C. Rasaiah, Proton transfer and the mobilities of the H+
and OH- ions from studies of a dissociating model for water. Journal of
Chemical Physics, 2011. 135(12).
82. Lin, X.C., et al., Alkali resistant and conductive guanidinium-based anion-
exchange membranes for alkaline polymer electrolyte fuel cells. Journal of
Power Sources, 2012. 217: p. 373-380.
83. Sajjad, S.D., Y. Hong, and F. Liu, Synthesis of guanidinium-based anion
exchange membranes and their stability assessment. Polymers for
Advanced Technologies, 2014. 25(1): p. 108-116.
84. Sajjad, S.D., et al., Guanidinium based blend anion exchange membranes
for direct methanol alkaline fuel cells (DMAFCs). Journal of Power
Sources, 2015. 300: p. 95-103.
85. Ye, Y.-S., et al., Alkali doped polyvinyl alcohol/graphene electrolyte for
direct methanol alkaline fuel cells. Journal of Power Sources, 2013. 239(0):
p. 424-432.
86. Grew, K.N. and W.K.S. Chiu, A Dusty Fluid Model for Predicting Hydroxyl
Anion Conductivity in Alkaline Anion Exchange Membranes. Journal of The
Electrochemical Society, 2010. 157(3): p. B327-B337.

161
87. Kim, D.S., et al., Copoly(arylene ether)s Containing Pendant Sulfonic Acid
Groups as Proton Exchange Membranes† † NRCC Publication No. 50899.
Macromolecules, 2009. 42(4): p. 957-963.
88. Xiong, Y., et al., Synthesis and characterization of cross-linked quaternized
poly (vinyl alcohol)/chitosan composite anion exchange membranes for fuel
cells. Journal of Power Sources, 2008. 183(2): p. 447-453.
89. Choi, P., N.H. Jalani, and R. Datta, Thermodynamics and proton transport
in Nafion II. Proton diffusion mechanisms and conductivity. Journal of The
Electrochemical Society, 2005. 152(3): p. E123-E130.
90. Commer, P., et al., The effect of water content on proton transport in
polymer electrolyte membranes. Fuel Cells, 2002. 2(3‐4): p. 127-136.
91. Marx, D., Proton transfer 200 years after von Grotthuss: Insights from ab
initio simulations. ChemPhysChem, 2006. 7(9): p. 1848-1870.
92. Paddison, S.J. and R. Paul, The nature of proton transport in fully hydrated
Nafion®. Physical Chemistry Chemical Physics, 2002. 4(7): p. 1158-1163.
93. Paddison, S.J., R. Paul, and T.A. Zawodzinski, A statistical mechanical
model of proton and water transport in a proton exchange membrane.
Journal of The Electrochemical Society, 2000. 147(2): p. 617-626.
94. Thampan, T., et al., Modeling of conductive transport in proton‐exchange
membranes for fuel cells. Journal of The Electrochemical Society, 2000.
147(9): p. 3242-3250.

162
95. Aleksandrova, E., et al., Electrochemical atomic force microscopy study of
proton conductivity in a Nafion membrane. Physical Chemistry Chemical
Physics, 2007. 9(21): p. 2735-2743.
96. Aleksandrova, E., et al., Spatial distribution and dynamics of proton
conductivity in fuel cell membranes: potential and limitations of
electrochemical atomic force microscopy measurements. Journal of
Physics: Condensed Matter, 2011. 23(23): p. 234109.
97. James, P.J., et al., Hydration of Nafion® studied by AFM and X-ray
scattering. Journal of Materials Science, 2000. 35(20): p. 5111-5119.
98. Wang, X., et al., A Terphenyl Scaffold for π-Stacked Guanidinium
Recognition Elements. Organic Letters, 2007. 10(2): p. 297-300.

163
Biographical Information
Syed Dawar Sajjad was born in Karachi, Pakistan and got his primary
education there. He received his Bachelor of Science (BS) degree in Metallurgy
and Materials Engineering from Ghulam Ishaq Institute of Engineering Sciences &
Technology at Topi, Swabi in 2009. He later joined NED University in Karachi as
a lecturer for a full year and played a pioneering role in developing the new
Materials Science Engineering Department there.
In 2010 he joined The University of Texas at Arlington to pursue his
doctoral degree and worked under supervision of Dr. Fuqiang Liu of Materials
Science and Engineering and received his Ph.D. degree in 2015. His primary
research area during his doctoral study was science, engineering and technology of
guanidinium based anion exchange membrane fuel cells for polymer alkaline fuel
cells, while he also worked on PEM fuel cell catalyst, vanadium redox flow battery
and lithium ion battery materials.
He plans to work in the industry to gain more practical experience and
diversify his research interests. He plans to start a business in future in the
developing countries. But mostly he is keen on using his academic and research
experience to give back to the society.