gtc - iac · horus on gtc will bring several years of exclusive access to planets provided by space...
TRANSCRIPT
INSTITUTO DE ASTROFISICA DE CANARIAS38200 La Laguna (Tenerife) - ESPAÑA - Phone (922)605200 - Fax (922)605210
IAC TECHNOLOGY DIVISION
Document Code
HORUS_GTC.DOC
April 3, 2011
Project Ref.:
PROJECT / DESTINATION:
GTC
TITLE:
HORUS
A HIGH OPTICAL RESOLUTION ULTRA-STABLESPECTROGRAPH
DOCUMENT TITLEPage: 2 of 47
Date: April 3, 2012
Code: Document Code File: HORUS_GTC.DOC
AUTHOR LIST
Name Function
Carlos Allende Prieto (IAC) Project Scientist
Basil Blank (PulseRay) Mechanical Engineer
Juan Calvo Tovar (IAC) Project Manager
Ramón García López (IAC) Principal Investigator
Félix Gracia Témich (IAC) Optical Engineer
Chuck Henderson (Cornell University, PulseRay) Mechanical Engineer
APPROVAL CONTROL
Control Name Function
Revised by:
Approved by:
Authorised by:
DOCUMENT CHANGE RECORD
Issue Date Change Description
V1.0 April 3, 2012 Issued
DOCUMENT TITLEPage: 3 of 47
Date: April 3, 2012
Code: Document Code File: HORUS_GTC.DOC
SUMMARY
We propose a new visiting instrument for GTC based on the Utrech Echelle Spectrograph,
formerly at the WHT. By insulating the instrument from thermal and pressure variations,
and sharing the focal plane with OSIRIS, the newly conceived spectrograph will be in
position to make a profound impact in the fields of exoplanets, stellar astrophysics, and
stellar populations. This document describes the science driver, the instrument’s design
and its coupling to GTC, and a working plan including a budget estimate.
DOCUMENT TITLEPage: 4 of 47
Date: April 3, 2012
Code: Document Code File: HORUS_GTC.DOC
TABLE OF CONTENTS
1. INTRODUCTION...........................................................................................................6
2. SCIENCE GOALS. SPECIFICATIONS .....................................................................7
3. SPECTROGRAPH DESIGN.........................................................................................8
3.1 UES COMPONENTS.......................................................................................................83.2 DESIGN MODIFICATIONS: FROM UES TO HORUS ...................................................13
4. PRE-OPTICS.................................................................................................................15
4.1 FIBER LINK..................................................................................................................154.2 COUPLING TO THE TELESCOPE...................................................................................164.3 INTERFACE FIBERS-SPECTROGRAPH..........................................................................174.4 HORUS-OSIRIS INTERFACE.....................................................................................204.5 SCRAMBLER............................................................................................................22
5. INSTRUMENT CALIBRATION................................................................................23
6. INSTRUMENT PERFORMANCE.............................................................................24
6.1 THROUGHPUT .............................................................................................................246.2 IMAGE QUALITY. SPECTRAL RESOLUTION................................................................25
7. ENVIRONMENT ..........................................................................................................27
7.1 INSULATING BOX........................................................................................................277.2 VACUUM CHAMBER ...................................................................................................297.3 OPTICAL BENCH .........................................................................................................307.4 CCD CAMERA.............................................................................................................32
8. PLACEMENT AT GTC...............................................................................................33
9. DATA REDUCTION AND ANALYSIS SOFTWARE ............................................36
9.1 DATA REDUCTION ......................................................................................................369.2 ANALYSIS ...................................................................................................................36
10. TASKS AND SCHEDULE...........................................................................................37
11. ESTIMATED BUDGET...............................................................................................39
A. LIST OF REFERENCE DOCUMENTS....................................................................41
B. QUOTES.........................................................................................................................41
DOCUMENT TITLEPage: 5 of 47
Date: April 3, 2012
Code: Document Code File: HORUS_GTC.DOC
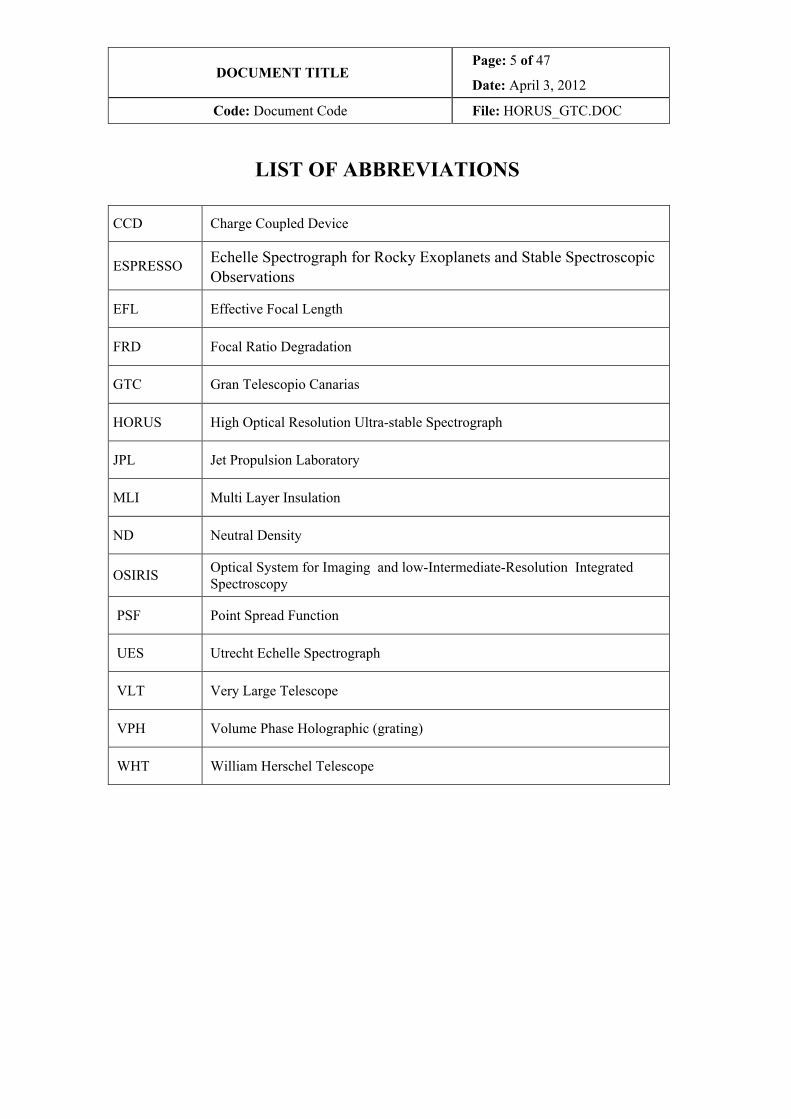
LIST OF ABBREVIATIONS
CCD Charge Coupled Device
ESPRESSO Echelle Spectrograph for Rocky Exoplanets and Stable SpectroscopicObservations
EFL Effective Focal Length
FRD Focal Ratio Degradation
GTC Gran Telescopio Canarias
HORUS High Optical Resolution Ultra-stable Spectrograph
JPL Jet Propulsion Laboratory
MLI Multi Layer Insulation
ND Neutral Density
OSIRIS Optical System for Imaging and low-Intermediate-Resolution IntegratedSpectroscopy
PSF Point Spread Function
UES Utrecht Echelle Spectrograph
VLT Very Large Telescope
VPH Volume Phase Holographic (grating)
WHT William Herschel Telescope
DOCUMENT TITLEPage: 6 of 47
Date: April 3, 2012
Code: Document Code File: HORUS_GTC.DOC
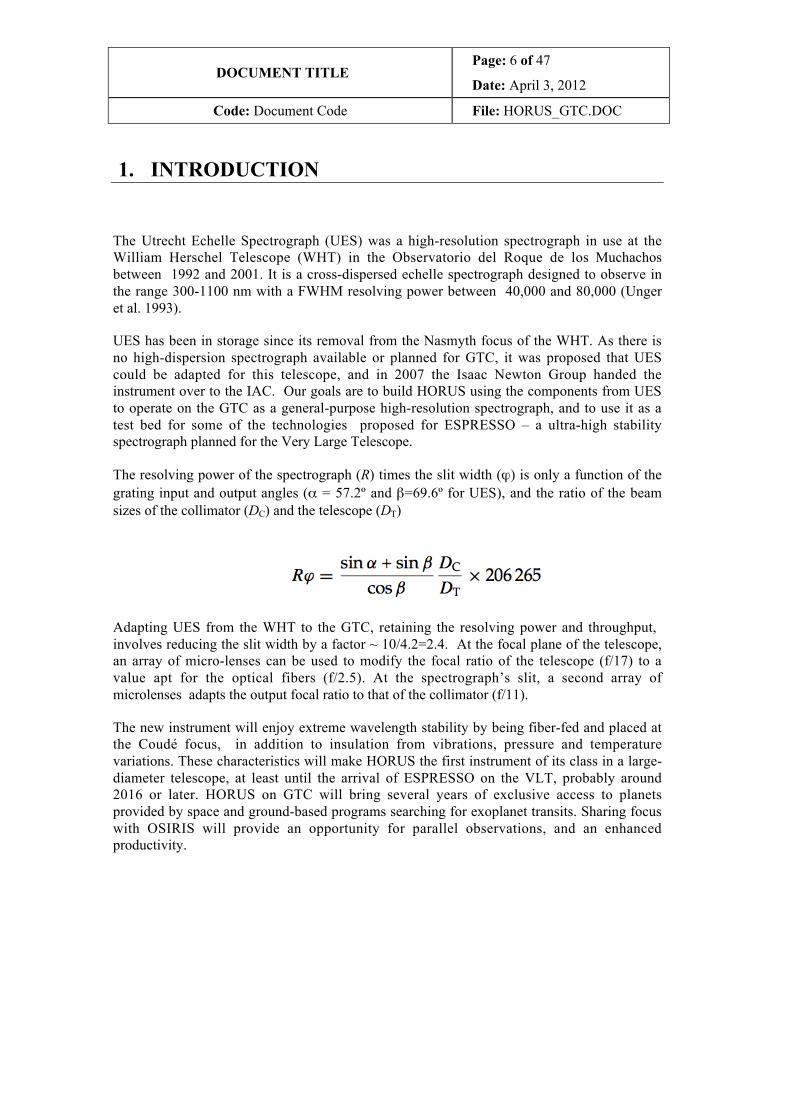
1. INTRODUCTION
The Utrecht Echelle Spectrograph (UES) was a high-resolution spectrograph in use at theWilliam Herschel Telescope (WHT) in the Observatorio del Roque de los Muchachosbetween 1992 and 2001. It is a cross-dispersed echelle spectrograph designed to observe inthe range 300-1100 nm with a FWHM resolving power between 40,000 and 80,000 (Ungeret al. 1993).
UES has been in storage since its removal from the Nasmyth focus of the WHT. As there isno high-dispersion spectrograph available or planned for GTC, it was proposed that UEScould be adapted for this telescope, and in 2007 the Isaac Newton Group handed theinstrument over to the IAC. Our goals are to build HORUS using the components from UESto operate on the GTC as a general-purpose high-resolution spectrograph, and to use it as atest bed for some of the technologies proposed for ESPRESSO – a ultra-high stabilityspectrograph planned for the Very Large Telescope.
The resolving power of the spectrograph (R) times the slit width (ϕ) is only a function of thegrating input and output angles (α = 57.2º and β=69.6º for UES), and the ratio of the beamsizes of the collimator (DC) and the telescope (DT)
Adapting UES from the WHT to the GTC, retaining the resolving power and throughput, involves reducing the slit width by a factor ~ 10/4.2=2.4. At the focal plane of the telescope,an array of micro-lenses can be used to modify the focal ratio of the telescope (f/17) to avalue apt for the optical fibers (f/2.5). At the spectrograph’s slit, a second array ofmicrolenses adapts the output focal ratio to that of the collimator (f/11).
The new instrument will enjoy extreme wavelength stability by being fiber-fed and placed atthe Coudé focus, in addition to insulation from vibrations, pressure and temperaturevariations. These characteristics will make HORUS the first instrument of its class in a large-diameter telescope, at least until the arrival of ESPRESSO on the VLT, probably around2016 or later. HORUS on GTC will bring several years of exclusive access to planetsprovided by space and ground-based programs searching for exoplanet transits. Sharing focuswith OSIRIS will provide an opportunity for parallel observations, and an enhancedproductivity.
DOCUMENT TITLEPage: 7 of 47
Date: April 3, 2012
Code: Document Code File: HORUS_GTC.DOC
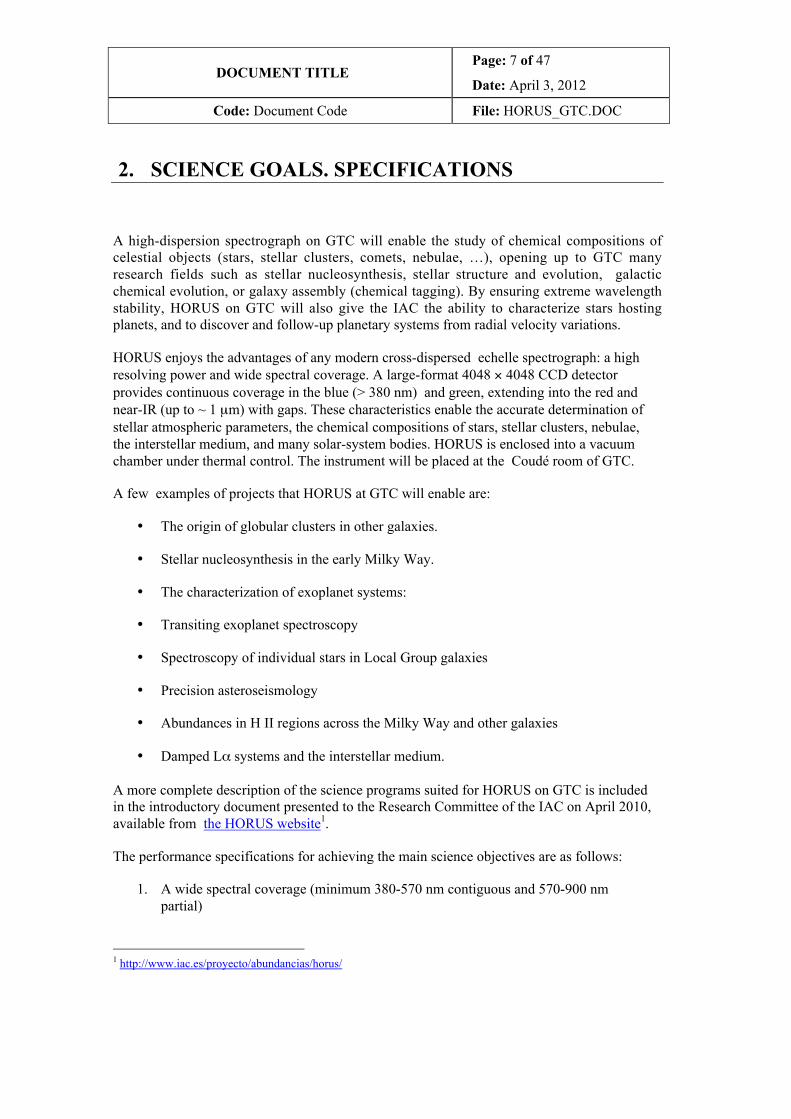
2. SCIENCE GOALS. SPECIFICATIONS
A high-dispersion spectrograph on GTC will enable the study of chemical compositions ofcelestial objects (stars, stellar clusters, comets, nebulae, …), opening up to GTC manyresearch fields such as stellar nucleosynthesis, stellar structure and evolution, galacticchemical evolution, or galaxy assembly (chemical tagging). By ensuring extreme wavelengthstability, HORUS on GTC will also give the IAC the ability to characterize stars hostingplanets, and to discover and follow-up planetary systems from radial velocity variations.
HORUS enjoys the advantages of any modern cross-dispersed echelle spectrograph: a highresolving power and wide spectral coverage. A large-format 4048 × 4048 CCD detectorprovides continuous coverage in the blue (> 380 nm) and green, extending into the red andnear-IR (up to ~ 1 µm) with gaps. These characteristics enable the accurate determination ofstellar atmospheric parameters, the chemical compositions of stars, stellar clusters, nebulae,the interstellar medium, and many solar-system bodies. HORUS is enclosed into a vacuumchamber under thermal control. The instrument will be placed at the Coudé room of GTC.
A few examples of projects that HORUS at GTC will enable are:
• The origin of globular clusters in other galaxies.
• Stellar nucleosynthesis in the early Milky Way.
• The characterization of exoplanet systems:
• Transiting exoplanet spectroscopy
• Spectroscopy of individual stars in Local Group galaxies
• Precision asteroseismology
• Abundances in H II regions across the Milky Way and other galaxies
• Damped Lα systems and the interstellar medium.
A more complete description of the science programs suited for HORUS on GTC is includedin the introductory document presented to the Research Committee of the IAC on April 2010,available from the HORUS website1.
The performance specifications for achieving the main science objectives are as follows:
1. A wide spectral coverage (minimum 380-570 nm contiguous and 570-900 nmpartial)
1 http://www.iac.es/proyecto/abundancias/horus/
DOCUMENT TITLEPage: 8 of 47
Date: April 3, 2012
Code: Document Code File: HORUS_GTC.DOC
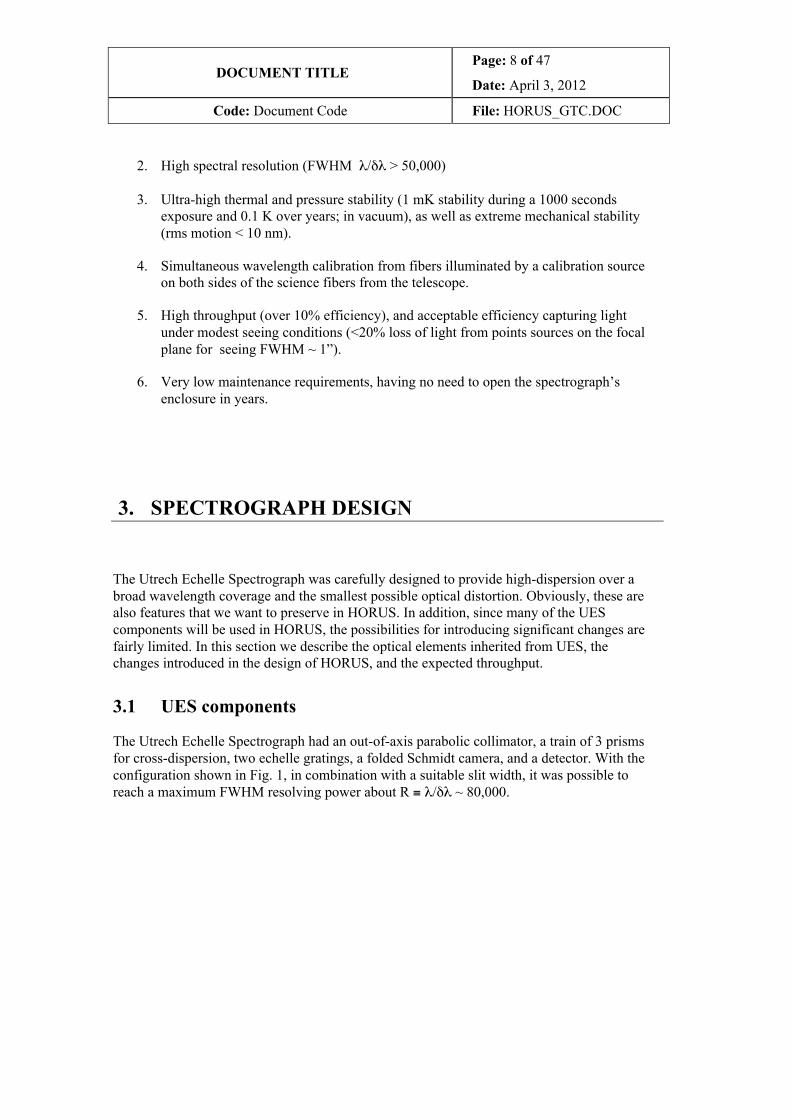
2. High spectral resolution (FWHM λ/δλ > 50,000)
3. Ultra-high thermal and pressure stability (1 mK stability during a 1000 secondsexposure and 0.1 K over years; in vacuum), as well as extreme mechanical stability(rms motion < 10 nm).
4. Simultaneous wavelength calibration from fibers illuminated by a calibration sourceon both sides of the science fibers from the telescope.
5. High throughput (over 10% efficiency), and acceptable efficiency capturing lightunder modest seeing conditions (<20% loss of light from points sources on the focalplane for seeing FWHM ~ 1”).
6. Very low maintenance requirements, having no need to open the spectrograph’senclosure in years.
3. SPECTROGRAPH DESIGN
The Utrech Echelle Spectrograph was carefully designed to provide high-dispersion over abroad wavelength coverage and the smallest possible optical distortion. Obviously, these arealso features that we want to preserve in HORUS. In addition, since many of the UEScomponents will be used in HORUS, the possibilities for introducing significant changes arefairly limited. In this section we describe the optical elements inherited from UES, thechanges introduced in the design of HORUS, and the expected throughput.
3.1 UES components
The Utrech Echelle Spectrograph had an out-of-axis parabolic collimator, a train of 3 prismsfor cross-dispersion, two echelle gratings, a folded Schmidt camera, and a detector. With theconfiguration shown in Fig. 1, in combination with a suitable slit width, it was possible toreach a maximum FWHM resolving power about R ≡ λ/δλ ~ 80,000.
DOCUMENT TITLEPage: 9 of 47
Date: April 3, 2012
Code: Document Code File: HORUS_GTC.DOC
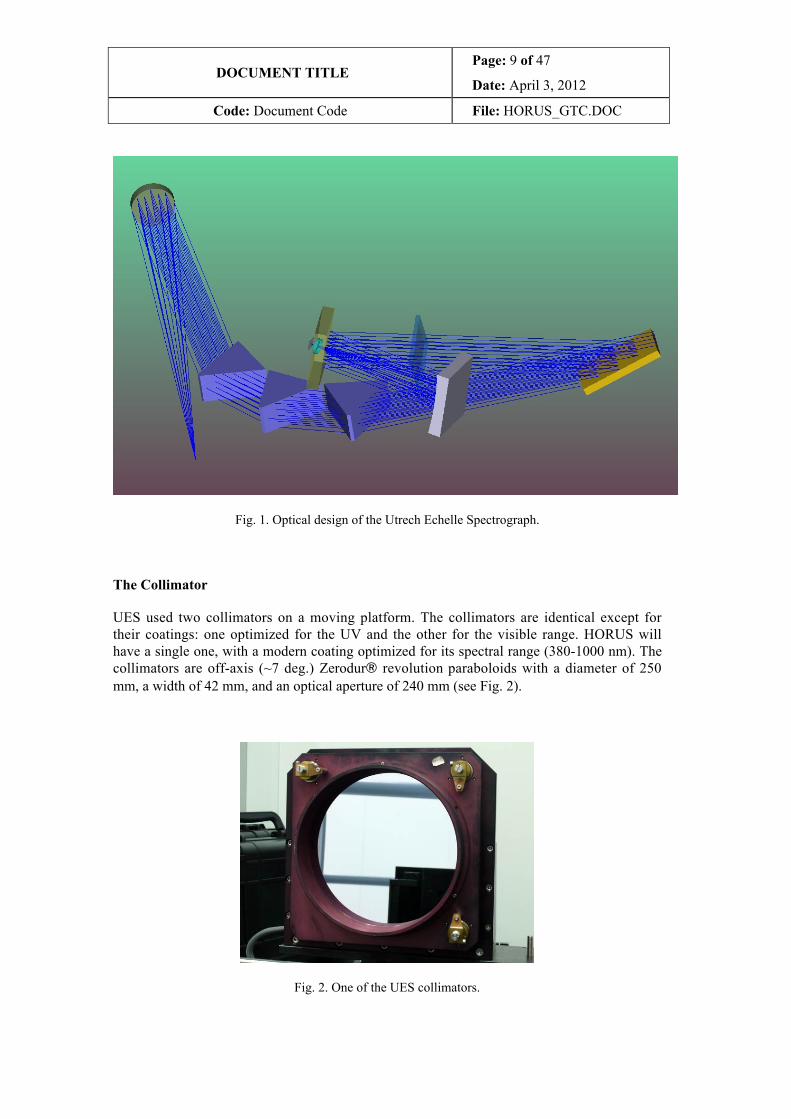
Fig. 1. Optical design of the Utrech Echelle Spectrograph.
The Collimator
UES used two collimators on a moving platform. The collimators are identical except fortheir coatings: one optimized for the UV and the other for the visible range. HORUS willhave a single one, with a modern coating optimized for its spectral range (380-1000 nm). Thecollimators are off-axis (~7 deg.) Zerodur® revolution paraboloids with a diameter of 250mm, a width of 42 mm, and an optical aperture of 240 mm (see Fig. 2).
Fig. 2. One of the UES collimators.
DOCUMENT TITLEPage: 10 of 47
Date: April 3, 2012
Code: Document Code File: HORUS_GTC.DOC
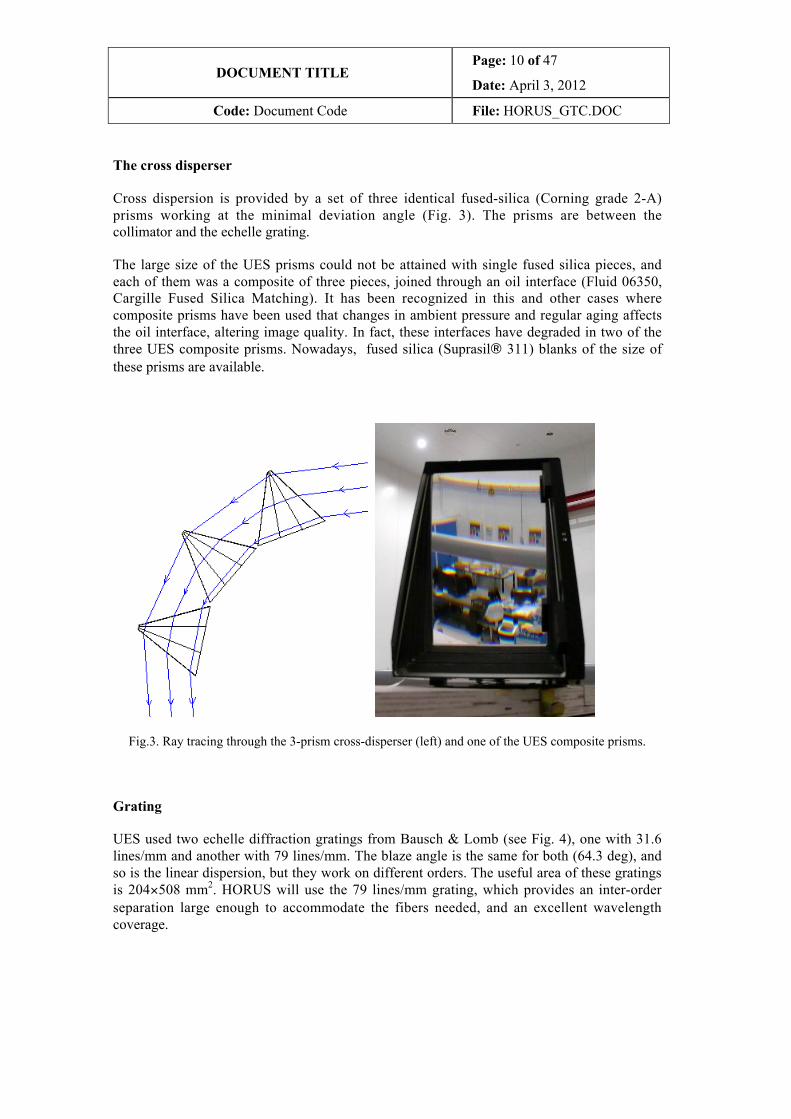
The cross disperser
Cross dispersion is provided by a set of three identical fused-silica (Corning grade 2-A)prisms working at the minimal deviation angle (Fig. 3). The prisms are between thecollimator and the echelle grating.
The large size of the UES prisms could not be attained with single fused silica pieces, andeach of them was a composite of three pieces, joined through an oil interface (Fluid 06350,Cargille Fused Silica Matching). It has been recognized in this and other cases wherecomposite prisms have been used that changes in ambient pressure and regular aging affectsthe oil interface, altering image quality. In fact, these interfaces have degraded in two of thethree UES composite prisms. Nowadays, fused silica (Suprasil® 311) blanks of the size ofthese prisms are available.
Fig.3. Ray tracing through the 3-prism cross-disperser (left) and one of the UES composite prisms.
Grating
UES used two echelle diffraction gratings from Bausch & Lomb (see Fig. 4), one with 31.6lines/mm and another with 79 lines/mm. The blaze angle is the same for both (64.3 deg), andso is the linear dispersion, but they work on different orders. The useful area of these gratingsis 204×508 mm2. HORUS will use the 79 lines/mm grating, which provides an inter-orderseparation large enough to accommodate the fibers needed, and an excellent wavelengthcoverage.
DOCUMENT TITLEPage: 11 of 47
Date: April 3, 2012
Code: Document Code File: HORUS_GTC.DOC
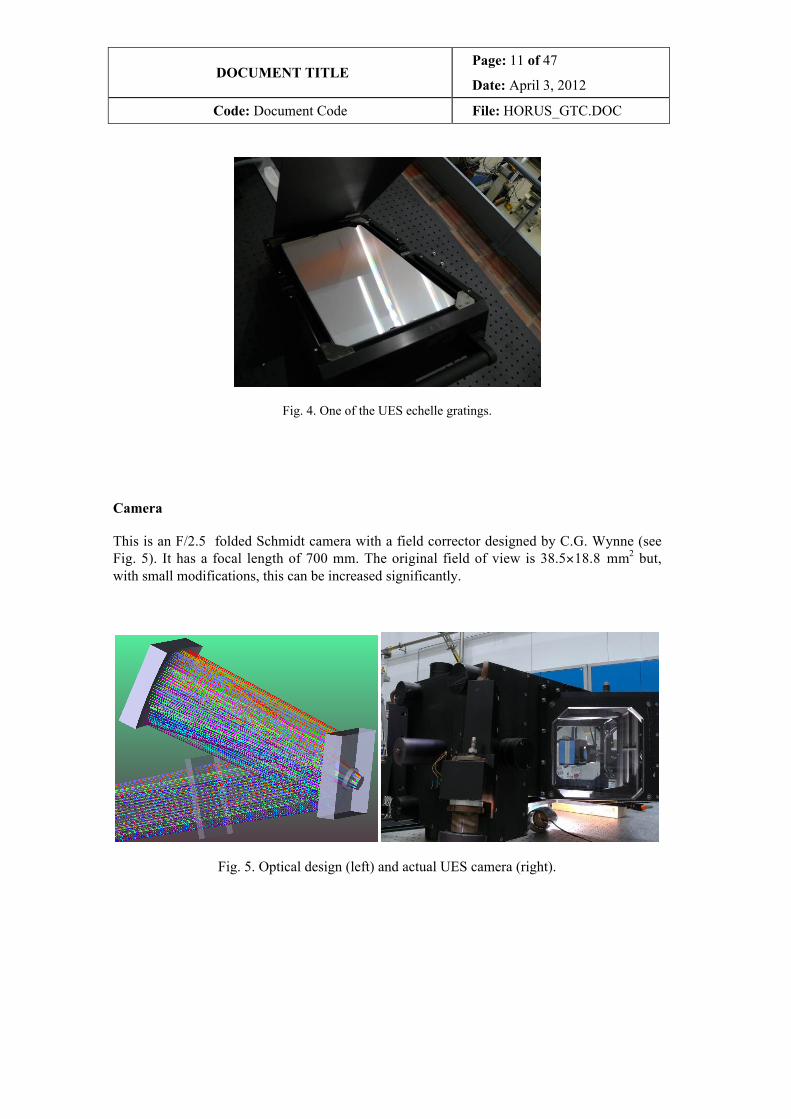
Fig. 4. One of the UES echelle gratings.
Camera
This is an F/2.5 folded Schmidt camera with a field corrector designed by C.G. Wynne (seeFig. 5). It has a focal length of 700 mm. The original field of view is 38.5×18.8 mm2 but,with small modifications, this can be increased significantly.
Fig. 5. Optical design (left) and actual UES camera (right).
DOCUMENT TITLEPage: 12 of 47
Date: April 3, 2012
Code: Document Code File: HORUS_GTC.DOC
Detector
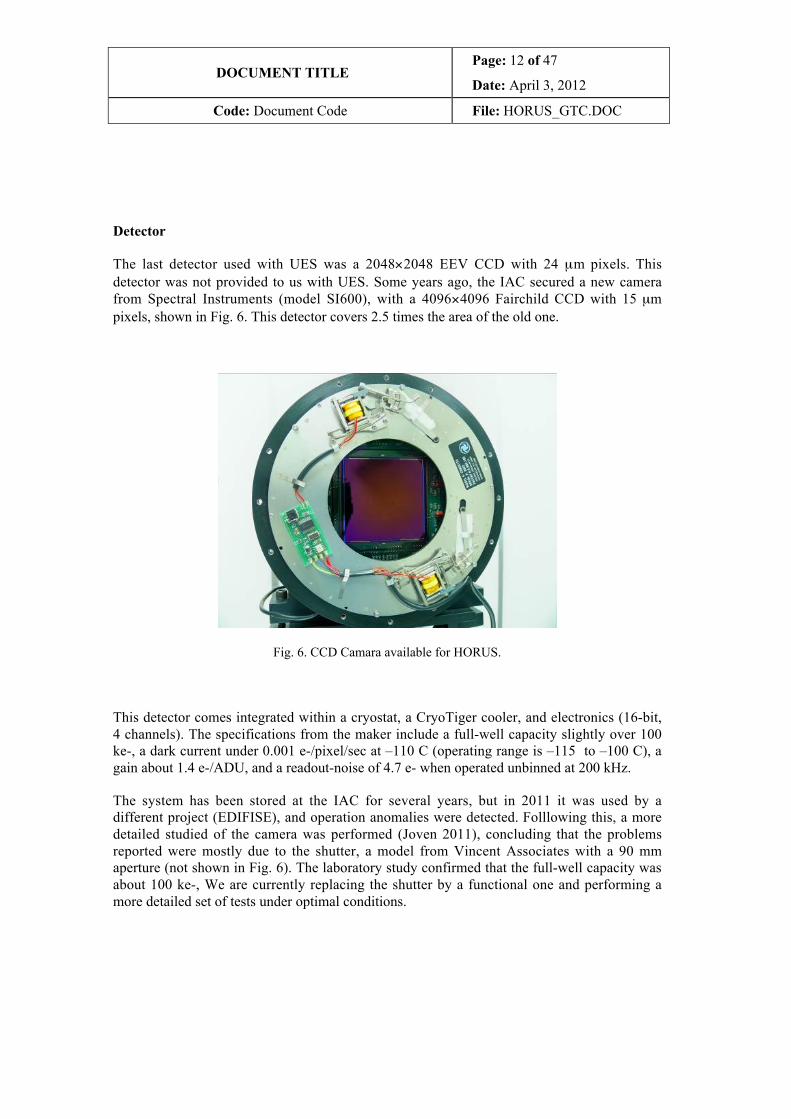
The last detector used with UES was a 2048×2048 EEV CCD with 24 µm pixels. Thisdetector was not provided to us with UES. Some years ago, the IAC secured a new camerafrom Spectral Instruments (model SI600), with a 4096×4096 Fairchild CCD with 15 µmpixels, shown in Fig. 6. This detector covers 2.5 times the area of the old one.
Fig. 6. CCD Camara available for HORUS.
This detector comes integrated within a cryostat, a CryoTiger cooler, and electronics (16-bit,4 channels). The specifications from the maker include a full-well capacity slightly over 100ke-, a dark current under 0.001 e-/pixel/sec at –110 C (operating range is –115 to –100 C), again about 1.4 e-/ADU, and a readout-noise of 4.7 e- when operated unbinned at 200 kHz.
The system has been stored at the IAC for several years, but in 2011 it was used by adifferent project (EDIFISE), and operation anomalies were detected. Folllowing this, a moredetailed studied of the camera was performed (Joven 2011), concluding that the problemsreported were mostly due to the shutter, a model from Vincent Associates with a 90 mmaperture (not shown in Fig. 6). The laboratory study confirmed that the full-well capacity wasabout 100 ke-, We are currently replacing the shutter by a functional one and performing amore detailed set of tests under optimal conditions.
DOCUMENT TITLEPage: 13 of 47
Date: April 3, 2012
Code: Document Code File: HORUS_GTC.DOC
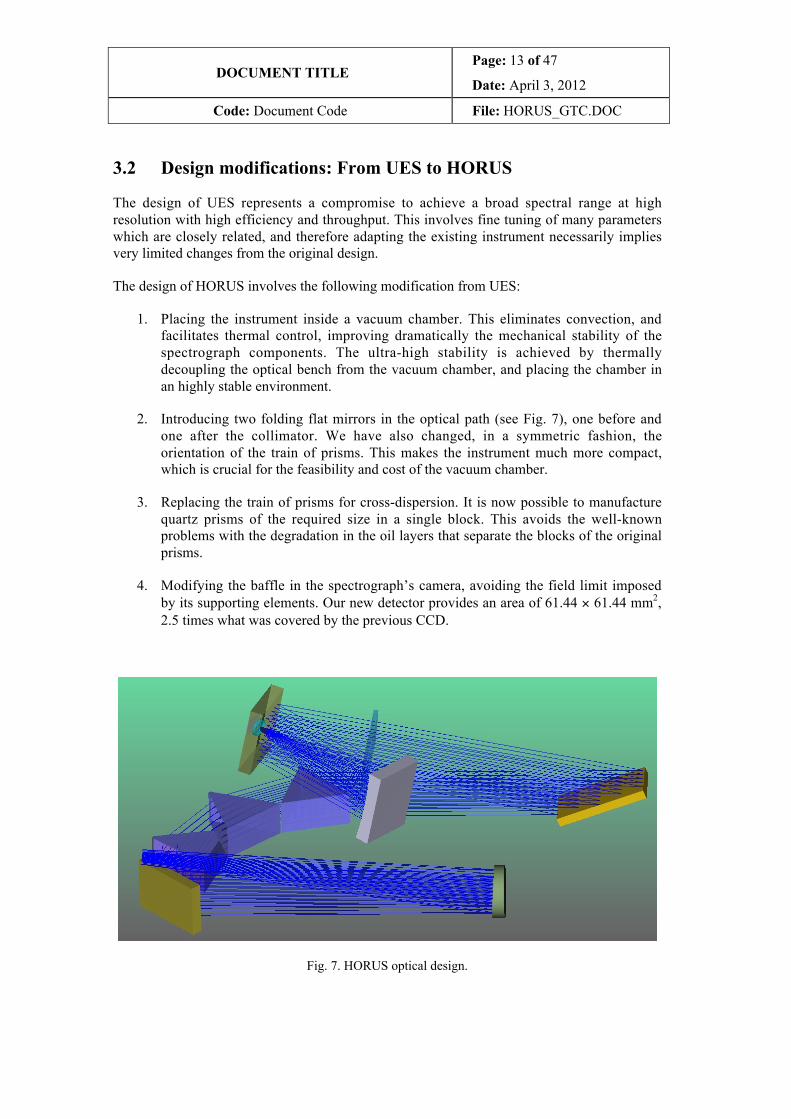
3.2 Design modifications: From UES to HORUS
The design of UES represents a compromise to achieve a broad spectral range at highresolution with high efficiency and throughput. This involves fine tuning of many parameterswhich are closely related, and therefore adapting the existing instrument necessarily impliesvery limited changes from the original design.
The design of HORUS involves the following modification from UES:
1. Placing the instrument inside a vacuum chamber. This eliminates convection, andfacilitates thermal control, improving dramatically the mechanical stability of thespectrograph components. The ultra-high stability is achieved by thermallydecoupling the optical bench from the vacuum chamber, and placing the chamber inan highly stable environment.
2. Introducing two folding flat mirrors in the optical path (see Fig. 7), one before andone after the collimator. We have also changed, in a symmetric fashion, theorientation of the train of prisms. This makes the instrument much more compact,which is crucial for the feasibility and cost of the vacuum chamber.
3. Replacing the train of prisms for cross-dispersion. It is now possible to manufacturequartz prisms of the required size in a single block. This avoids the well-knownproblems with the degradation in the oil layers that separate the blocks of the originalprisms.
4. Modifying the baffle in the spectrograph’s camera, avoiding the field limit imposedby its supporting elements. Our new detector provides an area of 61.44 × 61.44 mm2,2.5 times what was covered by the previous CCD.
Fig. 7. HORUS optical design.
DOCUMENT TITLEPage: 14 of 47
Date: April 3, 2012
Code: Document Code File: HORUS_GTC.DOC
The enhanced field of view of HORUS camera and the corresponding increase in spectralcoverage is a significant improvement. With UES, access to different spectral windows wasaccomplished by tilting both the grating and the train of prisms. A larger field of view alsoinvolves images much farther away from the optical axis. We have carefully checked theimage quality with ZEMAX calculations, and it is quite good (see Section 5.2).
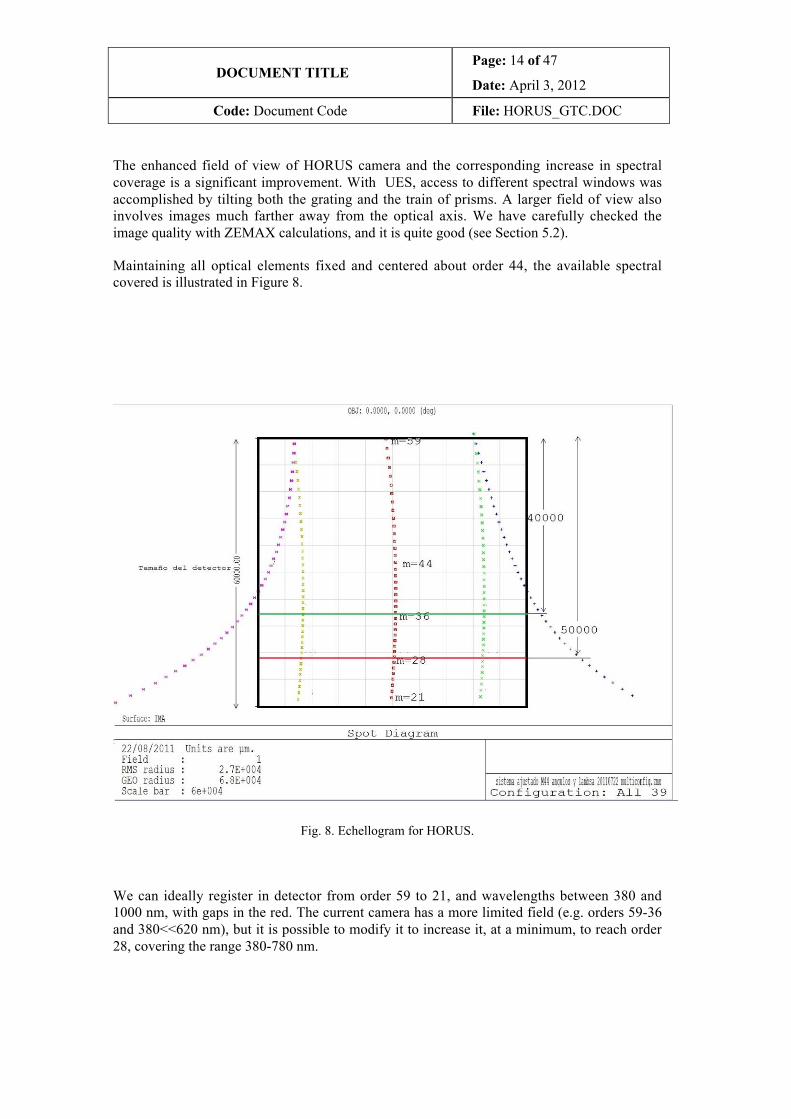
Maintaining all optical elements fixed and centered about order 44, the available spectralcovered is illustrated in Figure 8.
Fig. 8. Echellogram for HORUS.
We can ideally register in detector from order 59 to 21, and wavelengths between 380 and1000 nm, with gaps in the red. The current camera has a more limited field (e.g. orders 59-36and 380<<620 nm), but it is possible to modify it to increase it, at a minimum, to reach order28, covering the range 380-780 nm.
DOCUMENT TITLEPage: 15 of 47
Date: April 3, 2012
Code: Document Code File: HORUS_GTC.DOC
The throughput estimates available for UES optics, essentially identical to that for theUCLES spectrograph at the AAT, indicate a 40% throughput on the blaze at 500 nm (DiegoQuintana 1988). We are currently setting up the instrument in the clean room inside the AIVarea at the IAC to perform actual throughput measurements.
4. PRE-OPTICS
The simplest way to adapt HORUS to GTC is using optical fibers in combination withmicrolenses to efficiently couple the focal ratios of telescope (f/17) and spectrograph (f/11).This also has the advantage of minimizing losses associated with the inter-fiber space in theoptical fiber bundle.
4.1 Fiber link
In order to achieve extreme stability, HORUS must be placed on the most stable environmentavailable. The spectrograph itself is on a vacuum chamber, the vacuum chamber issurrounded by a insulating enclosure, and the enclosure will be placed at the GTC Coudéroom, two floors below the telescope. A detailed long-term study of the thermal mecanicalconditions in the Coudé room is planned, but from the information currently available to us,this is the best possible location for the spectrograph.
Since HORUS will be fed by optical fibers, from the same focus as OSIRIS, this currentlyimplies a fiber length of about 80 meters from the Nasmyth platform to the Coudé room.This distance may be reduced when OSIRIS is changed to the Cassegrain focus.
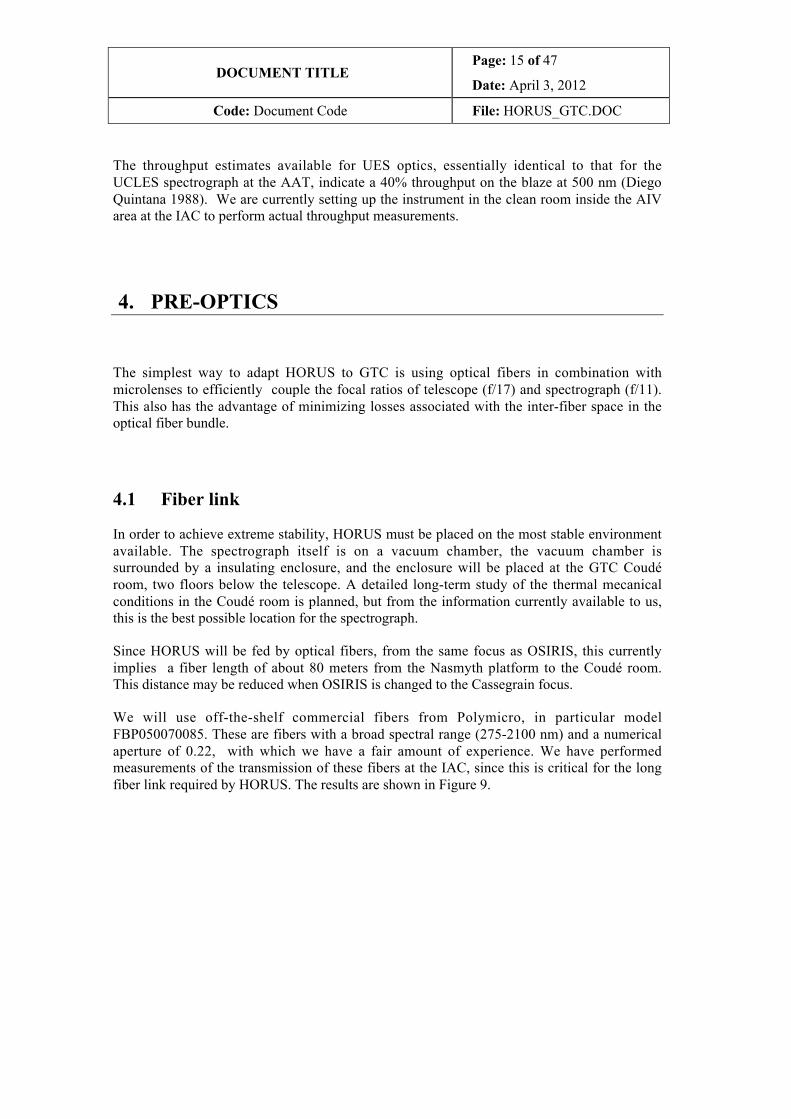
We will use off-the-shelf commercial fibers from Polymicro, in particular modelFBP050070085. These are fibers with a broad spectral range (275-2100 nm) and a numericalaperture of 0.22, with which we have a fair amount of experience. We have performedmeasurements of the transmission of these fibers at the IAC, since this is critical for the longfiber link required by HORUS. The results are shown in Figure 9.
DOCUMENT TITLEPage: 16 of 47
Date: April 3, 2012
Code: Document Code File: HORUS_GTC.DOC
Fig. 9. Transmitance for the fiber selected for HORUS.
For practical reasons, these measurements were made with a 100µm fiber, instead of the 50µm fiber that will be used on HORUS, but no significant differences are expected since,according to Polymicro, the two fibers are made from the same material using the samemanufacturing process. The fiber’s transmission is fairly flat in the near-IR, reaching 80% at800 nm, and decreases to the blue. The measurements for the longest fiber were performedwith the fiber on a reel.
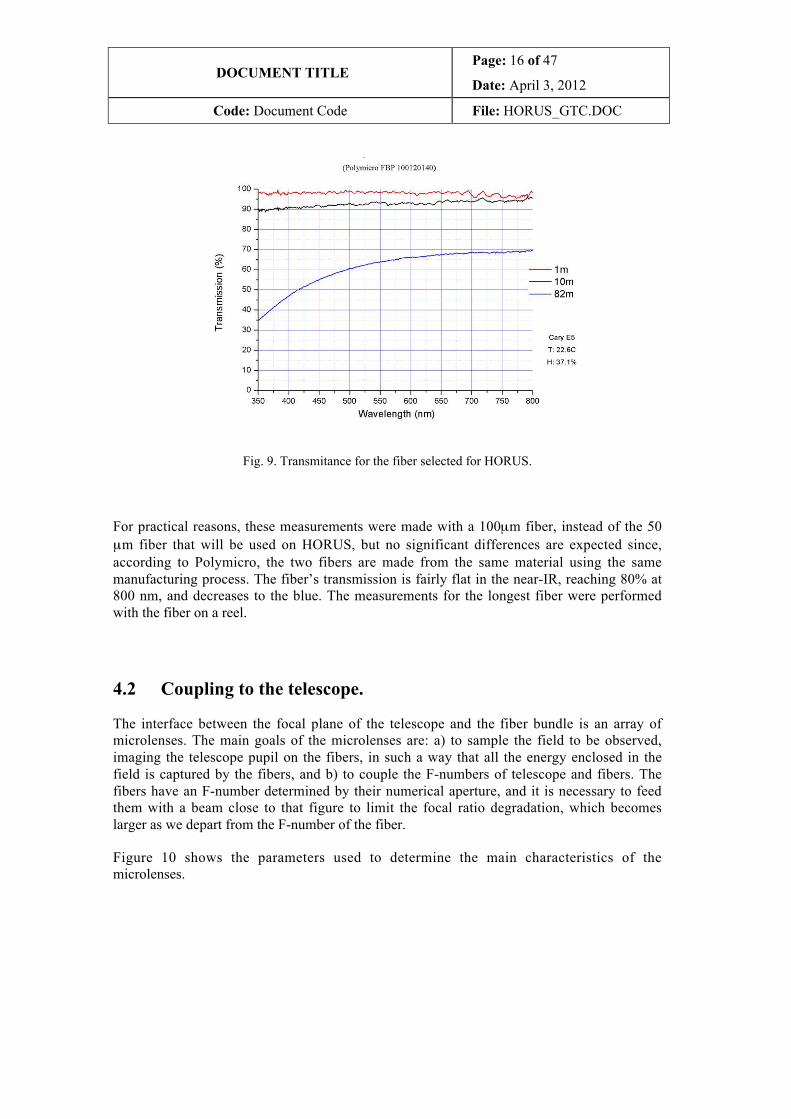
4.2 Coupling to the telescope.
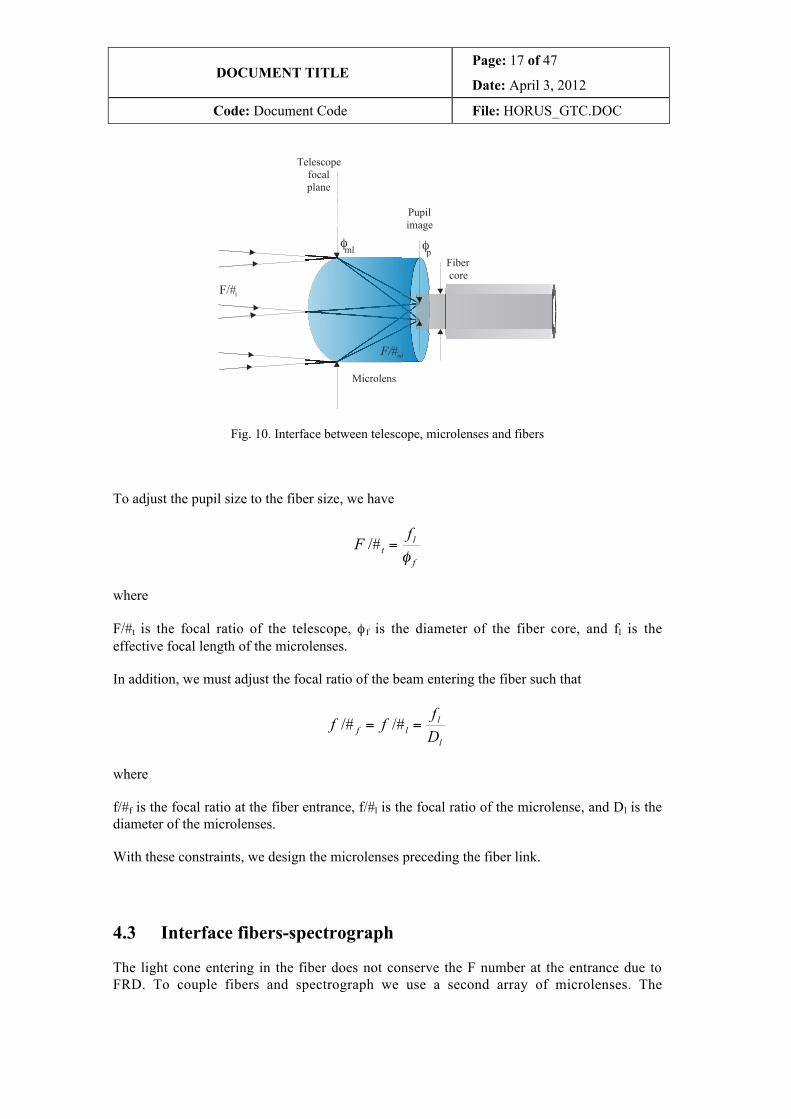
The interface between the focal plane of the telescope and the fiber bundle is an array ofmicrolenses. The main goals of the microlenses are: a) to sample the field to be observed,imaging the telescope pupil on the fibers, in such a way that all the energy enclosed in thefield is captured by the fibers, and b) to couple the F-numbers of telescope and fibers. Thefibers have an F-number determined by their numerical aperture, and it is necessary to feedthem with a beam close to that figure to limit the focal ratio degradation, which becomeslarger as we depart from the F-number of the fiber.
Figure 10 shows the parameters used to determine the main characteristics of themicrolenses.
DOCUMENT TITLEPage: 17 of 47
Date: April 3, 2012
Code: Document Code File: HORUS_GTC.DOC
Telescope focalplane
Fiber core
Pupil image
Microlens
φml φp
F/# t
F/#ml
Fig. 10. Interface between telescope, microlenses and fibers
To adjust the pupil size to the fiber size, we have
f
lt
fFφ
=/#
where
F/#t is the focal ratio of the telescope, φ f is the diameter of the fiber core, and fl is theeffective focal length of the microlenses.
In addition, we must adjust the focal ratio of the beam entering the fiber such that
l
llf D
fff == /#/#
where
f/#f is the focal ratio at the fiber entrance, f/#l is the focal ratio of the microlense, and Dl is thediameter of the microlenses.
With these constraints, we design the microlenses preceding the fiber link.
4.3 Interface fibers-spectrograph
The light cone entering in the fiber does not conserve the F number at the entrance due toFRD. To couple fibers and spectrograph we use a second array of microlenses. The
DOCUMENT TITLEPage: 18 of 47
Date: April 3, 2012
Code: Document Code File: HORUS_GTC.DOC
parameters for these microlenses are calculated in a similar way as for those preceding thefibers. This configuration creates a pseudo-slit at a distance fl from the microlense, where fl isits focal length, with a width equal to its diameter.
IFU format
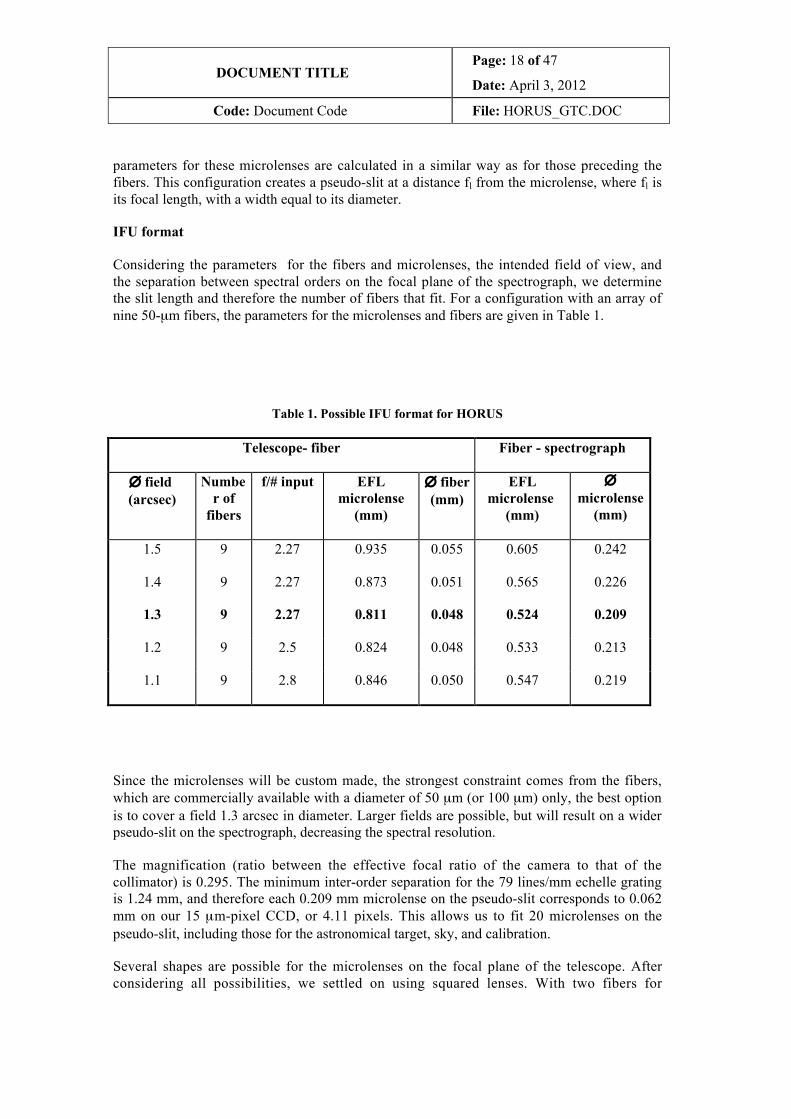
Considering the parameters for the fibers and microlenses, the intended field of view, andthe separation between spectral orders on the focal plane of the spectrograph, we determinethe slit length and therefore the number of fibers that fit. For a configuration with an array ofnine 50-µm fibers, the parameters for the microlenses and fibers are given in Table 1.
Table 1. Possible IFU format for HORUS
Telescope- fiber Fiber - spectrograph
∅ field (arcsec)
Number of
fibers
f/# input EFLmicrolense
(mm)
∅ fiber(mm)
EFLmicrolense
(mm)
∅microlense
(mm)
1.5
1.4
1.3
9
9
9
2.27
2.27
2.27
0.935
0.873
0.811
0.055
0.051
0.048
0.605
0.565
0.524
0.242
0.226
0.209
1.2 9 2.5 0.824 0.048 0.533 0.213
1.1 9 2.8 0.846 0.050 0.547 0.219
Since the microlenses will be custom made, the strongest constraint comes from the fibers,which are commercially available with a diameter of 50 µm (or 100 µm) only, the best optionis to cover a field 1.3 arcsec in diameter. Larger fields are possible, but will result on a widerpseudo-slit on the spectrograph, decreasing the spectral resolution.
The magnification (ratio between the effective focal ratio of the camera to that of thecollimator) is 0.295. The minimum inter-order separation for the 79 lines/mm echelle gratingis 1.24 mm, and therefore each 0.209 mm microlense on the pseudo-slit corresponds to 0.062mm on our 15 µm-pixel CCD, or 4.11 pixels. This allows us to fit 20 microlenses on thepseudo-slit, including those for the astronomical target, sky, and calibration.
Several shapes are possible for the microlenses on the focal plane of the telescope. Afterconsidering all possibilities, we settled on using squared lenses. With two fibers for
DOCUMENT TITLEPage: 19 of 47
Date: April 3, 2012
Code: Document Code File: HORUS_GTC.DOC
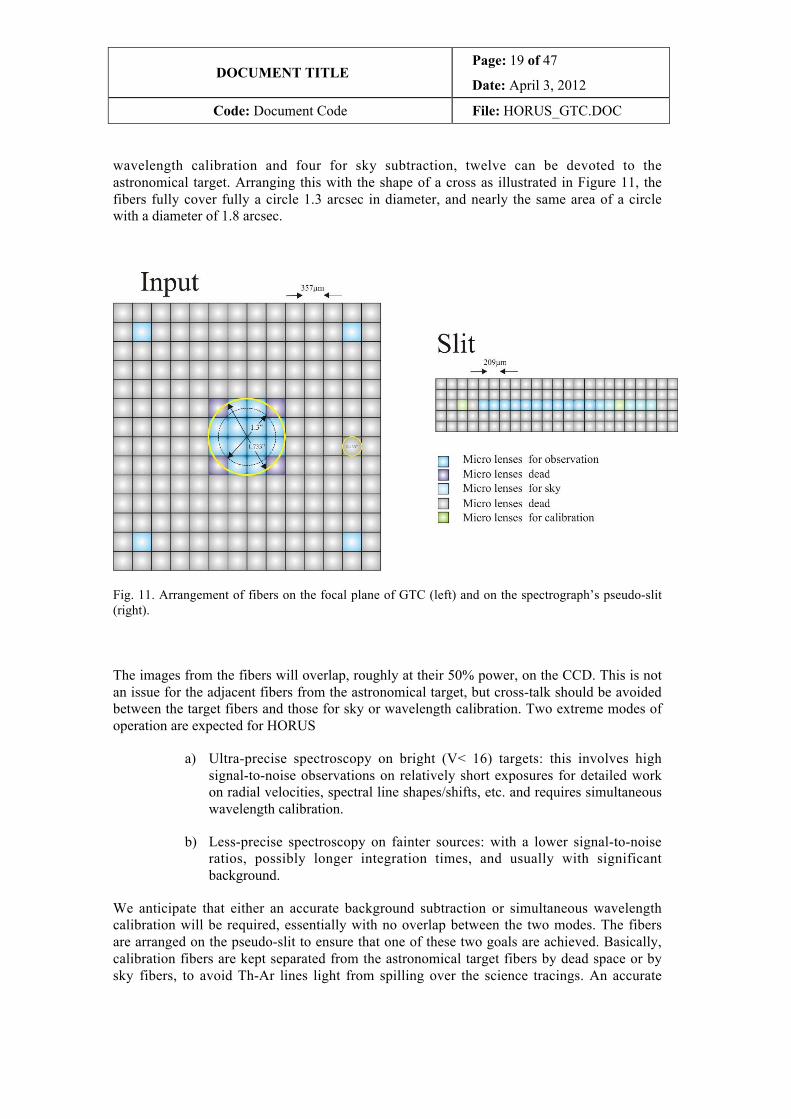
wavelength calibration and four for sky subtraction, twelve can be devoted to theastronomical target. Arranging this with the shape of a cross as illustrated in Figure 11, thefibers fully cover fully a circle 1.3 arcsec in diameter, and nearly the same area of a circlewith a diameter of 1.8 arcsec.
Fig. 11. Arrangement of fibers on the focal plane of GTC (left) and on the spectrograph’s pseudo-slit(right).
The images from the fibers will overlap, roughly at their 50% power, on the CCD. This is notan issue for the adjacent fibers from the astronomical target, but cross-talk should be avoidedbetween the target fibers and those for sky or wavelength calibration. Two extreme modes ofoperation are expected for HORUS
a) Ultra-precise spectroscopy on bright (V< 16) targets: this involves highsignal-to-noise observations on relatively short exposures for detailed workon radial velocities, spectral line shapes/shifts, etc. and requires simultaneouswavelength calibration.
b) Less-precise spectroscopy on fainter sources: with a lower signal-to-noiseratios, possibly longer integration times, and usually with significantbackground.
We anticipate that either an accurate background subtraction or simultaneous wavelengthcalibration will be required, essentially with no overlap between the two modes. The fibersare arranged on the pseudo-slit to ensure that one of these two goals are achieved. Basically,calibration fibers are kept separated from the astronomical target fibers by dead space or bysky fibers, to avoid Th-Ar lines light from spilling over the science tracings. An accurate
DOCUMENT TITLEPage: 20 of 47
Date: April 3, 2012
Code: Document Code File: HORUS_GTC.DOC
background subtraction is achieved when simultaneous Th-Ar calibration is not needed, from4 independent fibers sampling four 0.46 arcsec windows on the sky. This configuration isillustrated in Figure 11.
4.4 HORUS-OSIRIS interface
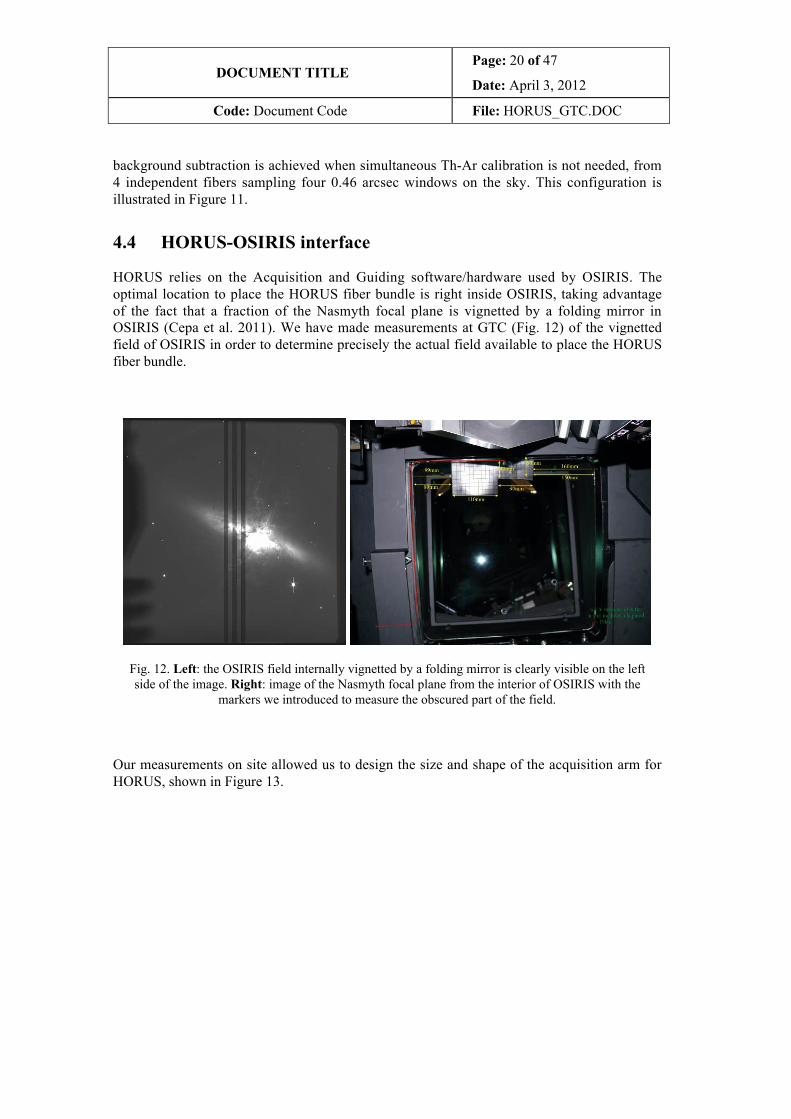
HORUS relies on the Acquisition and Guiding software/hardware used by OSIRIS. Theoptimal location to place the HORUS fiber bundle is right inside OSIRIS, taking advantageof the fact that a fraction of the Nasmyth focal plane is vignetted by a folding mirror inOSIRIS (Cepa et al. 2011). We have made measurements at GTC (Fig. 12) of the vignettedfield of OSIRIS in order to determine precisely the actual field available to place the HORUSfiber bundle.
Fig. 12. Left: the OSIRIS field internally vignetted by a folding mirror is clearly visible on the leftside of the image. Right: image of the Nasmyth focal plane from the interior of OSIRIS with the
markers we introduced to measure the obscured part of the field.
Our measurements on site allowed us to design the size and shape of the acquisition arm forHORUS, shown in Figure 13.
DOCUMENT TITLEPage: 21 of 47
Date: April 3, 2012
Code: Document Code File: HORUS_GTC.DOC
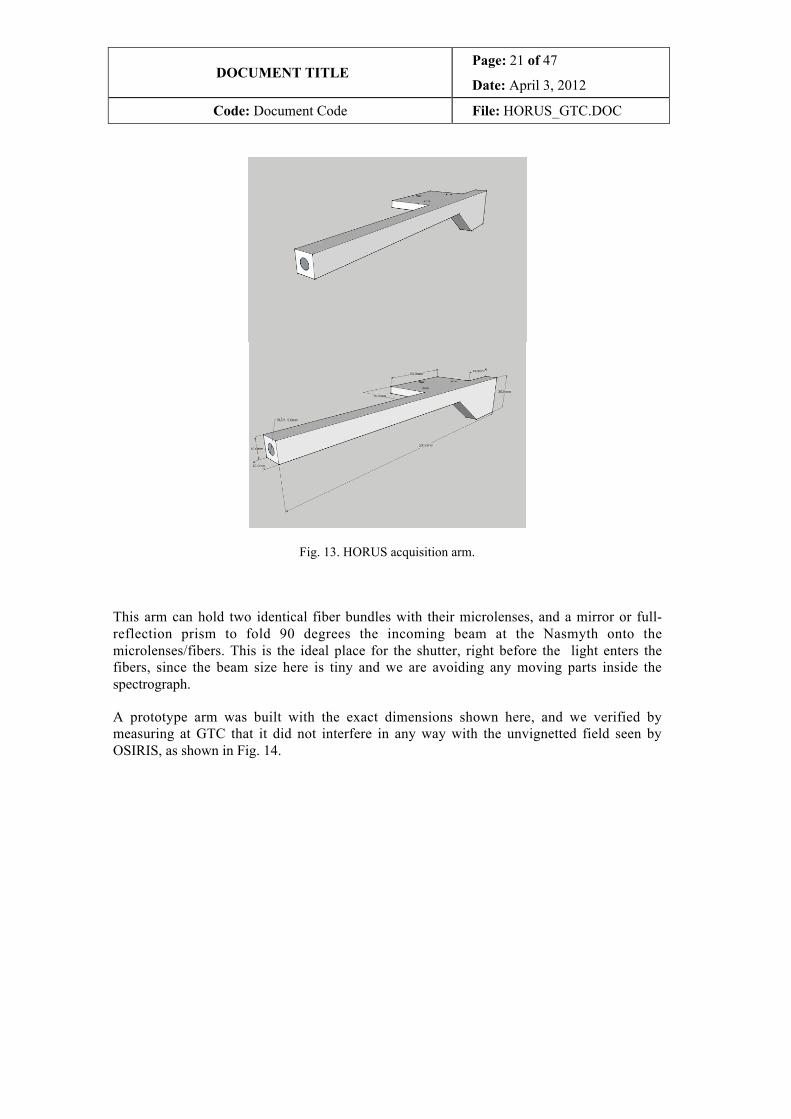
Fig. 13. HORUS acquisition arm.
This arm can hold two identical fiber bundles with their microlenses, and a mirror or full-reflection prism to fold 90 degrees the incoming beam at the Nasmyth onto themicrolenses/fibers. This is the ideal place for the shutter, right before the light enters thefibers, since the beam size here is tiny and we are avoiding any moving parts inside thespectrograph.
A prototype arm was built with the exact dimensions shown here, and we verified bymeasuring at GTC that it did not interfere in any way with the unvignetted field seen byOSIRIS, as shown in Fig. 14.
DOCUMENT TITLEPage: 22 of 47
Date: April 3, 2012
Code: Document Code File: HORUS_GTC.DOC
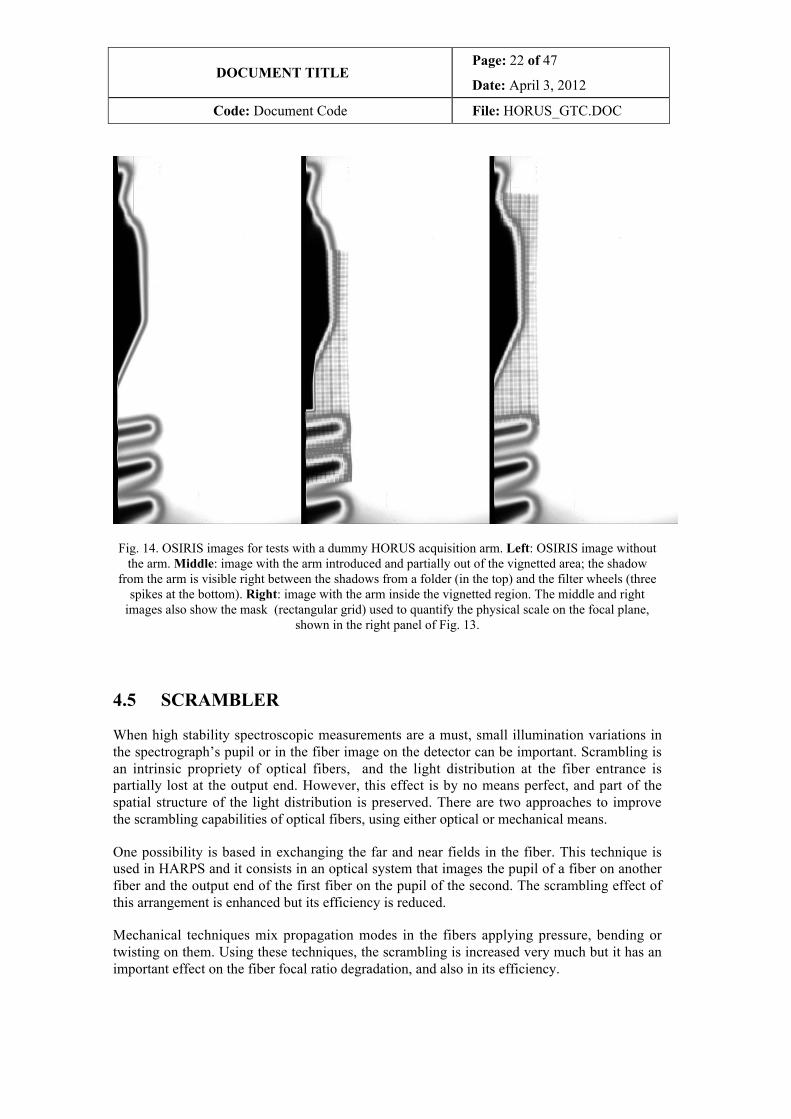
Fig. 14. OSIRIS images for tests with a dummy HORUS acquisition arm. Left: OSIRIS image withoutthe arm. Middle: image with the arm introduced and partially out of the vignetted area; the shadow
from the arm is visible right between the shadows from a folder (in the top) and the filter wheels (threespikes at the bottom). Right: image with the arm inside the vignetted region. The middle and right
images also show the mask (rectangular grid) used to quantify the physical scale on the focal plane,shown in the right panel of Fig. 13.
4.5 SCRAMBLER
When high stability spectroscopic measurements are a must, small illumination variations inthe spectrograph’s pupil or in the fiber image on the detector can be important. Scrambling isan intrinsic propriety of optical fibers, and the light distribution at the fiber entrance ispartially lost at the output end. However, this effect is by no means perfect, and part of thespatial structure of the light distribution is preserved. There are two approaches to improvethe scrambling capabilities of optical fibers, using either optical or mechanical means.
One possibility is based in exchanging the far and near fields in the fiber. This technique isused in HARPS and it consists in an optical system that images the pupil of a fiber on anotherfiber and the output end of the first fiber on the pupil of the second. The scrambling effect ofthis arrangement is enhanced but its efficiency is reduced.
Mechanical techniques mix propagation modes in the fibers applying pressure, bending ortwisting on them. Using these techniques, the scrambling is increased very much but it has animportant effect on the fiber focal ratio degradation, and also in its efficiency.
DOCUMENT TITLEPage: 23 of 47
Date: April 3, 2012
Code: Document Code File: HORUS_GTC.DOC
Fibers with new core geometries are being developed. Square, rectangular and octagonal corefibers are beginning to be manufactured and this kind of fibers present better scramblingcapabilities that the standard circular core fibers. We have not yet decided on the optimalway to enhance scrambling for HORUS, but we will take advantage of the developments forESPRESSO, since the IAC is in charge of this subsystem for the ESPRESSO Consortium.
5. INSTRUMENT CALIBRATION
A stable and accurate source for wavelength calibration is required for HORUS. The broadspectral range and high spectral resolution impose very stringent limits on the possibilities,with ThAr hollow cathode lamps being the traditional choice. Recently, we have seenspectacular progress in the use of laser combs and interferometers for improved accuracy andstability, but these are not yet commercially available, and their cost is very high. HORUSwill see first light with a ThAr hollow-cathode, perhaps inherited from the IACUBspectrograph.
Simultaneous observation of the astronomical target and the ThAr hollow-cathode lamp willensure that light from the latter tracks the changes in the instrument, and in particular the PSFseen by light from the former. The lamp will be enclosed in a calibration unit in the Coudéroom, next to HORUS, and two fibers from the calibration unit will join the bundle from thetelescope right before all fibers enter into the HORUS enclosure. These two fibers willprovide control of shifts and PSF variations on both sides of the spectra from theastronomical target.
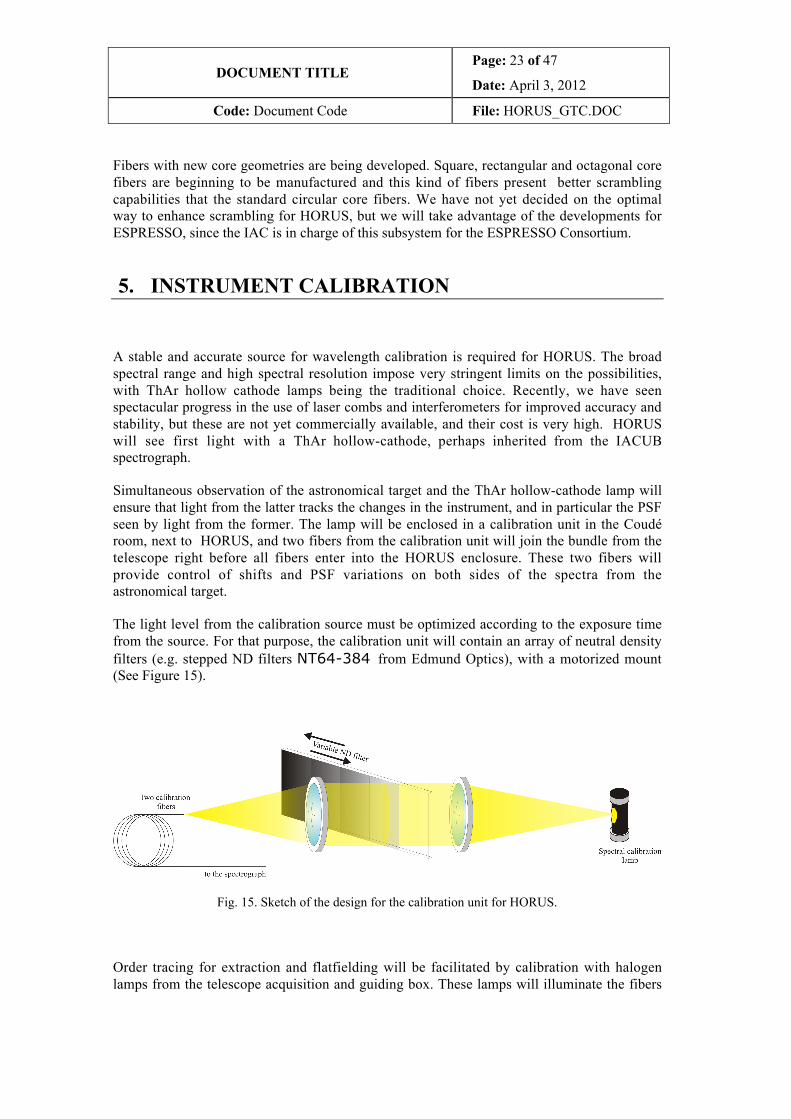
The light level from the calibration source must be optimized according to the exposure timefrom the source. For that purpose, the calibration unit will contain an array of neutral densityfilters (e.g. stepped ND filters NT64-384 from Edmund Optics), with a motorized mount(See Figure 15).
Fig. 15. Sketch of the design for the calibration unit for HORUS.
Order tracing for extraction and flatfielding will be facilitated by calibration with halogenlamps from the telescope acquisition and guiding box. These lamps will illuminate the fibers
DOCUMENT TITLEPage: 24 of 47
Date: April 3, 2012
Code: Document Code File: HORUS_GTC.DOC
at the Nasmyth focus in a similar way as the astronomical source, and their light will followthe same optical path as that from the astronomical source, all the way from the Nasmythfocus to the HORUS detector.
The calibration unit will incorporate a shutter just before the fibers. This is to besynchronized with the shutter for the fibers from the astronomical target, placed on theacquisition arm, and the CCD.
6. INSTRUMENT PERFORMANCE
6.1 Throughput
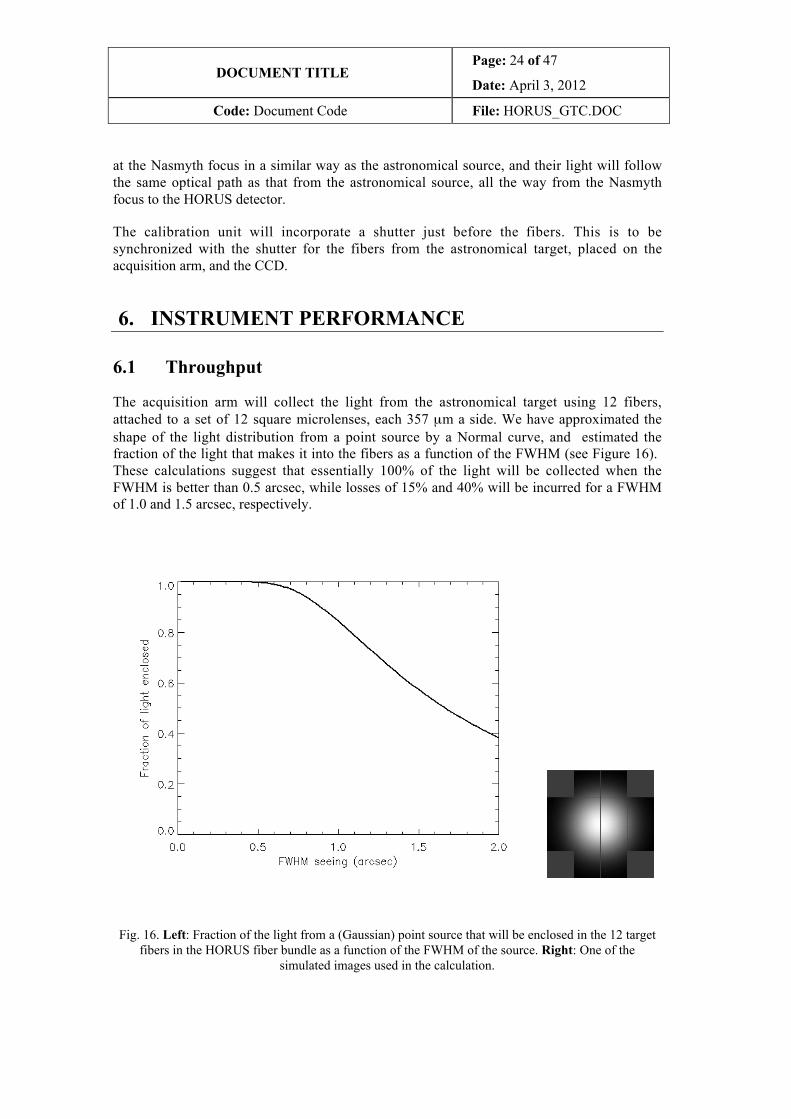
The acquisition arm will collect the light from the astronomical target using 12 fibers,attached to a set of 12 square microlenses, each 357 µm a side. We have approximated theshape of the light distribution from a point source by a Normal curve, and estimated thefraction of the light that makes it into the fibers as a function of the FWHM (see Figure 16). These calculations suggest that essentially 100% of the light will be collected when theFWHM is better than 0.5 arcsec, while losses of 15% and 40% will be incurred for a FWHMof 1.0 and 1.5 arcsec, respectively.
Fig. 16. Left: Fraction of the light from a (Gaussian) point source that will be enclosed in the 12 targetfibers in the HORUS fiber bundle as a function of the FWHM of the source. Right: One of the
simulated images used in the calculation.
DOCUMENT TITLEPage: 25 of 47
Date: April 3, 2012
Code: Document Code File: HORUS_GTC.DOC
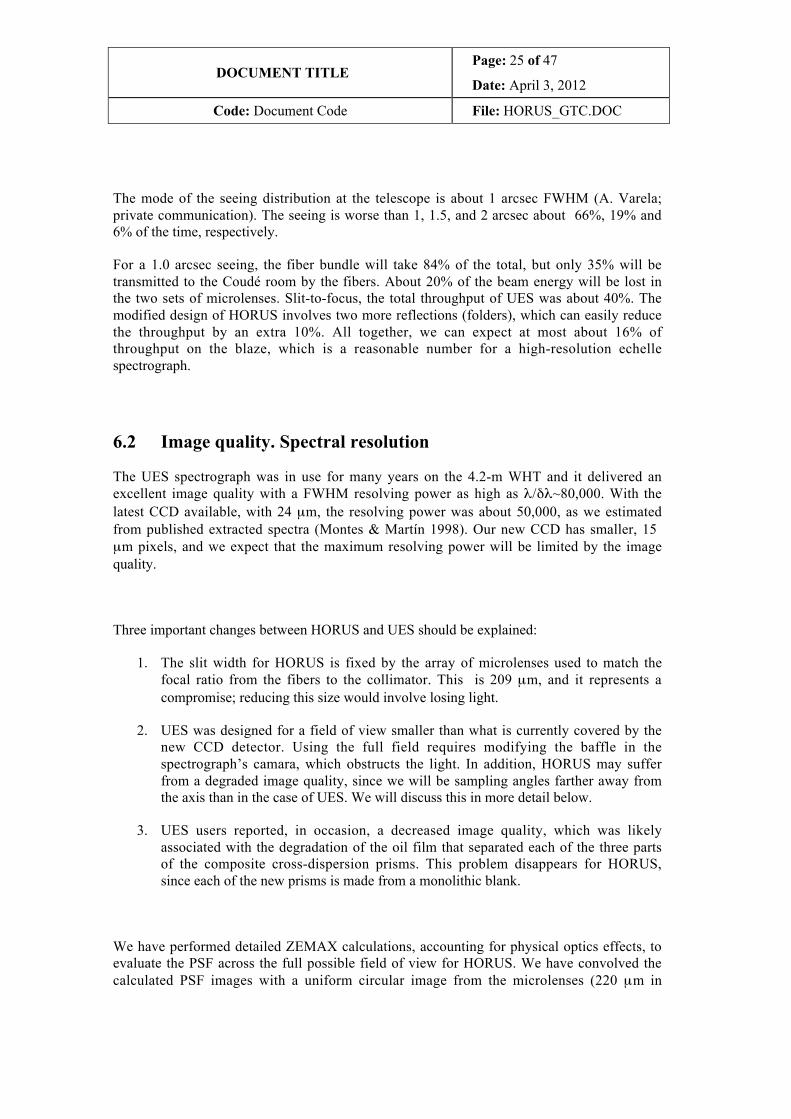
The mode of the seeing distribution at the telescope is about 1 arcsec FWHM (A. Varela;private communication). The seeing is worse than 1, 1.5, and 2 arcsec about 66%, 19% and6% of the time, respectively.
For a 1.0 arcsec seeing, the fiber bundle will take 84% of the total, but only 35% will betransmitted to the Coudé room by the fibers. About 20% of the beam energy will be lost inthe two sets of microlenses. Slit-to-focus, the total throughput of UES was about 40%. Themodified design of HORUS involves two more reflections (folders), which can easily reducethe throughput by an extra 10%. All together, we can expect at most about 16% ofthroughput on the blaze, which is a reasonable number for a high-resolution echellespectrograph.
6.2 Image quality. Spectral resolution
The UES spectrograph was in use for many years on the 4.2-m WHT and it delivered anexcellent image quality with a FWHM resolving power as high as λ/δλ~80,000. With thelatest CCD available, with 24 µm, the resolving power was about 50,000, as we estimatedfrom published extracted spectra (Montes & Martín 1998). Our new CCD has smaller, 15 µm pixels, and we expect that the maximum resolving power will be limited by the imagequality.
Three important changes between HORUS and UES should be explained:
1. The slit width for HORUS is fixed by the array of microlenses used to match thefocal ratio from the fibers to the collimator. This is 209 µm, and it represents acompromise; reducing this size would involve losing light.
2. UES was designed for a field of view smaller than what is currently covered by thenew CCD detector. Using the full field requires modifying the baffle in thespectrograph’s camara, which obstructs the light. In addition, HORUS may sufferfrom a degraded image quality, since we will be sampling angles farther away fromthe axis than in the case of UES. We will discuss this in more detail below.
3. UES users reported, in occasion, a decreased image quality, which was likelyassociated with the degradation of the oil film that separated each of the three partsof the composite cross-dispersion prisms. This problem disappears for HORUS,since each of the new prisms is made from a monolithic blank.
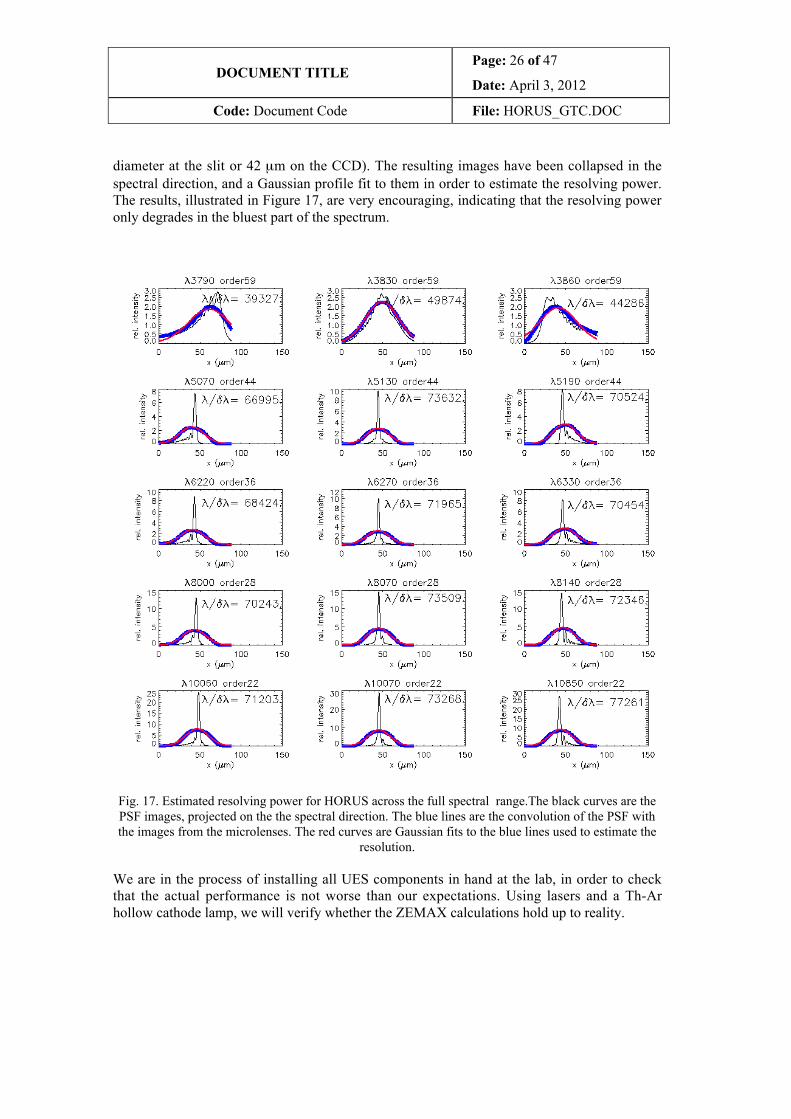
We have performed detailed ZEMAX calculations, accounting for physical optics effects, toevaluate the PSF across the full possible field of view for HORUS. We have convolved thecalculated PSF images with a uniform circular image from the microlenses (220 µm in
DOCUMENT TITLEPage: 26 of 47
Date: April 3, 2012
Code: Document Code File: HORUS_GTC.DOC
diameter at the slit or 42 µm on the CCD). The resulting images have been collapsed in thespectral direction, and a Gaussian profile fit to them in order to estimate the resolving power.The results, illustrated in Figure 17, are very encouraging, indicating that the resolving poweronly degrades in the bluest part of the spectrum.
Fig. 17. Estimated resolving power for HORUS across the full spectral range.The black curves are thePSF images, projected on the the spectral direction. The blue lines are the convolution of the PSF withthe images from the microlenses. The red curves are Gaussian fits to the blue lines used to estimate the
resolution.
We are in the process of installing all UES components in hand at the lab, in order to checkthat the actual performance is not worse than our expectations. Using lasers and a Th-Arhollow cathode lamp, we will verify whether the ZEMAX calculations hold up to reality.
DOCUMENT TITLEPage: 27 of 47
Date: April 3, 2012
Code: Document Code File: HORUS_GTC.DOC
7. ENVIRONMENT
In order to achieve the high spectral stability planned for the HORUS spectrograph, allcomponents from the slit to the CCD camera must remain isothermal. This is challenging,given the size of the spectrograph. Any transfer of energy through conduction is proportionalto the area of the conductor over the length to conduct. The size of the system makes itimperative that no micro climates occur in the system causing a transfer of energy from anygiven component into the rest of the system. For instance, the mount for the fiber slit is 0.43m tall and 0.02 m2 in area. For 6061 Aluminum, which has good conductivity (167 W/m/K),a difference of a degree between the top plate and the table only transfers about 125×10-3 W. Under these conditions, the slit would be 24 µm/m/K × 0.43 m × 0.5 K (average) ≈ 5µmcloser to the optical table. For this reason, no components of the spectrograph shouldtransfer energy.
7.1 Insulating box
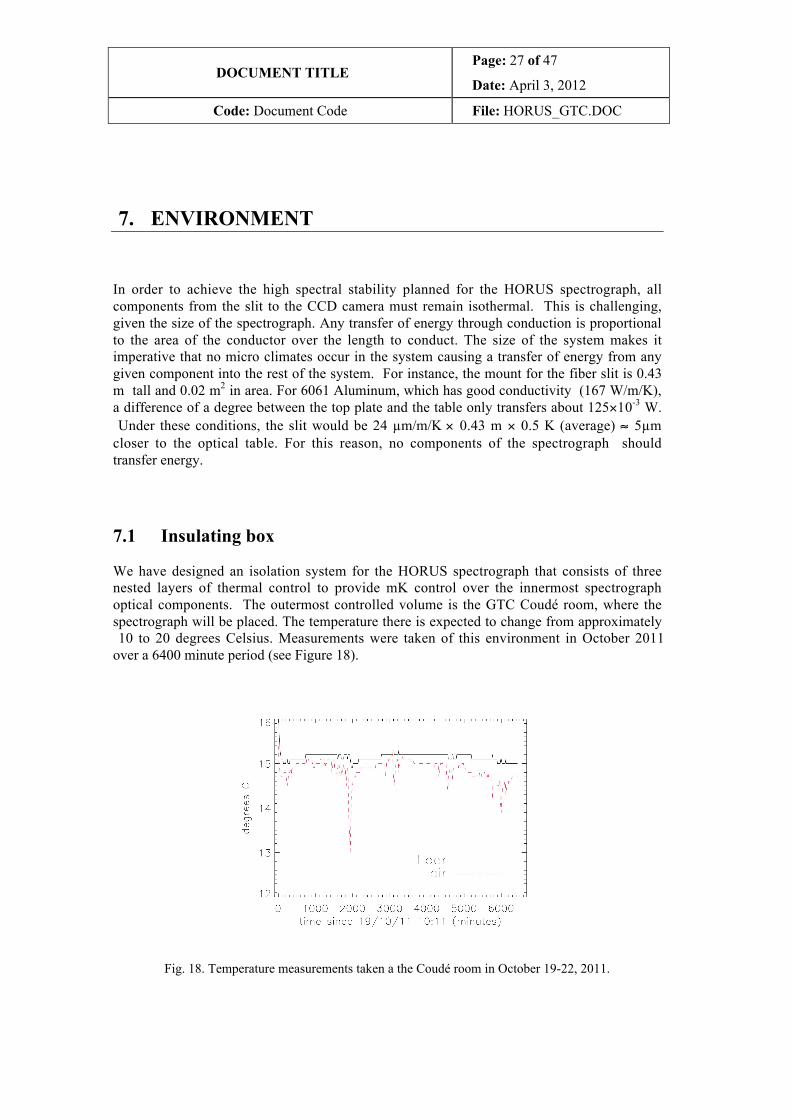
We have designed an isolation system for the HORUS spectrograph that consists of threenested layers of thermal control to provide mK control over the innermost spectrographoptical components. The outermost controlled volume is the GTC Coudé room, where thespectrograph will be placed. The temperature there is expected to change from approximately 10 to 20 degrees Celsius. Measurements were taken of this environment in October 2011over a 6400 minute period (see Figure 18).
Fig. 18. Temperature measurements taken a the Coudé room in October 19-22, 2011.
DOCUMENT TITLEPage: 28 of 47
Date: April 3, 2012
Code: Document Code File: HORUS_GTC.DOC
While the floor is stable to 0.3 K, it will be experiencing long term variations that moreclosely match the night time temperature at the GTC. These data illustrate that a high thermalmass object such as the floor damps out the room air variations by a factor of about five.
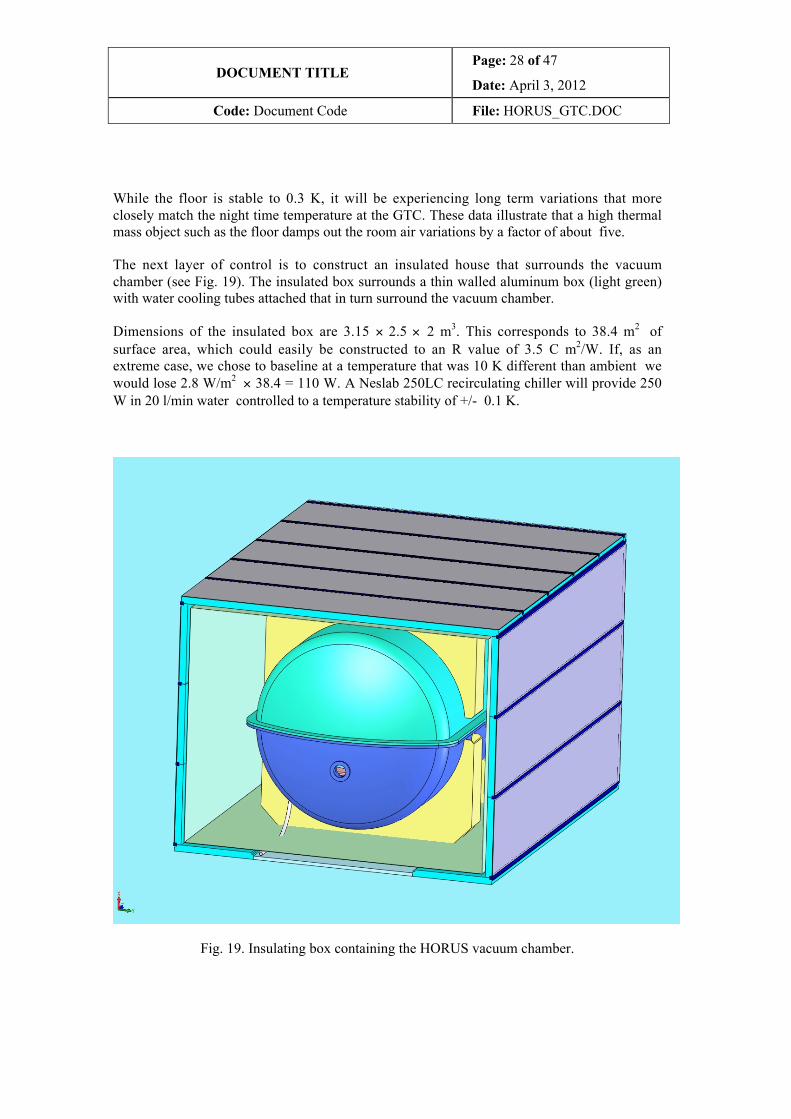
The next layer of control is to construct an insulated house that surrounds the vacuumchamber (see Fig. 19). The insulated box surrounds a thin walled aluminum box (light green)with water cooling tubes attached that in turn surround the vacuum chamber.
Dimensions of the insulated box are 3.15 × 2.5 × 2 m3. This corresponds to 38.4 m2 ofsurface area, which could easily be constructed to an R value of 3.5 C m2/W. If, as anextreme case, we chose to baseline at a temperature that was 10 K different than ambient wewould lose 2.8 W/m2 × 38.4 = 110 W. A Neslab 250LC recirculating chiller will provide 250W in 20 l/min water controlled to a temperature stability of +/- 0.1 K.
Fig. 19. Insulating box containing the HORUS vacuum chamber.
DOCUMENT TITLEPage: 29 of 47
Date: April 3, 2012
Code: Document Code File: HORUS_GTC.DOC
Extensive knowledge of long-term ambient conditions should be reviewed in deciding whatthe target temperature of the system will be. For that purpose, we have installed sensors inthe Coudé room providing continuous temperature and humidity measurements sinceFebruary 2012. The smallest temperature difference with ambient will use the least energyand put out the smallest amount of waste heat into the GTC building. However, it would notbe prudent choose a temperature so low that in other seasons the cooling plates are below thedew point.
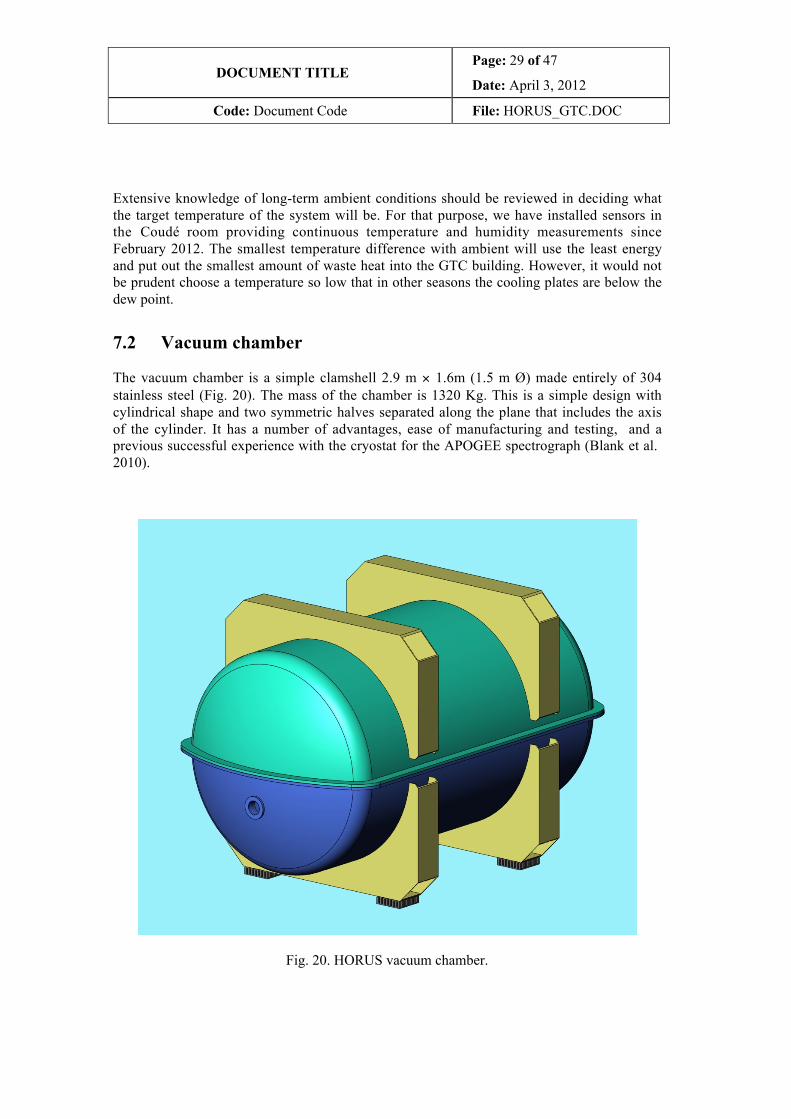
7.2 Vacuum chamber
The vacuum chamber is a simple clamshell 2.9 m × 1.6m (1.5 m Ø) made entirely of 304stainless steel (Fig. 20). The mass of the chamber is 1320 Kg. This is a simple design withcylindrical shape and two symmetric halves separated along the plane that includes the axisof the cylinder. It has a number of advantages, ease of manufacturing and testing, and aprevious successful experience with the cryostat for the APOGEE spectrograph (Blank et al. 2010).
Fig. 20. HORUS vacuum chamber.
DOCUMENT TITLEPage: 30 of 47
Date: April 3, 2012
Code: Document Code File: HORUS_GTC.DOC
Placed on 25 mm high stainless steel pads under the four Isomat vibration dampers, theconduction can be shown to be 16 W/m/K × 0.15 m2/0.025m = 96 W/K. Convection on the14 m2 surface could be as high as 140 W/K (10 W/m2/K × 14 m2). Radiant q = 5.67 -8 W/ m 2
K 4 × 14 m 2 × (293 4 – 292 4 ) / 1./0.04 + 14 m 2 / 37.8 m 2 × (1./0.02 – 1). Radiative transferbetween the chamber and the surrounding aluminum box is 2 W/K. The total transfer ratefrom the controlled box to the vacuum chamber is 238 W/K.
The vacuum chamber will try to follow the +/- 0.1 K variability in the water temperaturecontrolled outer box. The time constant τ = 510 J/Kg/K (stainless steel) × 1320 Kg / (238W/K) = 2773 sec (0.77 hr).
Since ΔT/T0 ≈ e-0.081/0.77 = 0.900, unless the variation in the water temperature remains 0.1 Kaway from the desired temperature for longer than 0.081 hours (5 min.), the vacuum chamberwill be stable to 10 % of the variation in the controlled outer box. Therefore the vacuumchamber will be stable to 0.01 K.
7.3 Optical bench
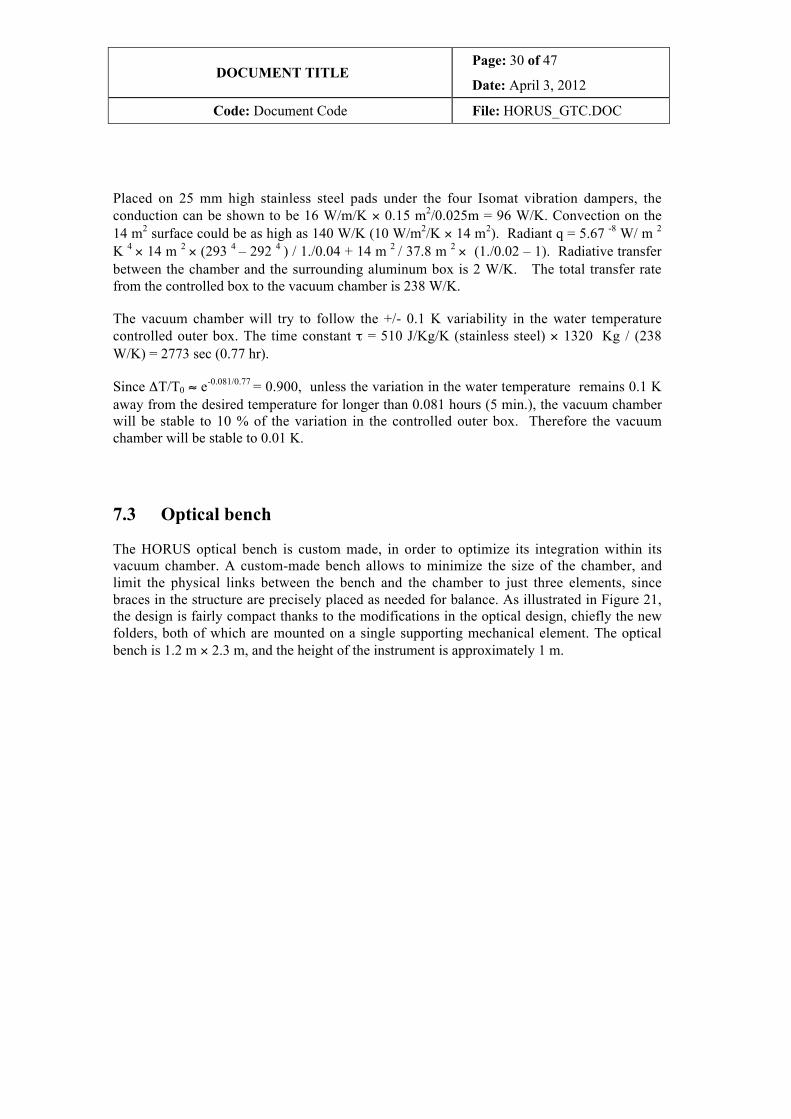
The HORUS optical bench is custom made, in order to optimize its integration within itsvacuum chamber. A custom-made bench allows to minimize the size of the chamber, andlimit the physical links between the bench and the chamber to just three elements, sincebraces in the structure are precisely placed as needed for balance. As illustrated in Figure 21,the design is fairly compact thanks to the modifications in the optical design, chiefly the newfolders, both of which are mounted on a single supporting mechanical element. The opticalbench is 1.2 m × 2.3 m, and the height of the instrument is approximately 1 m.
DOCUMENT TITLEPage: 31 of 47
Date: April 3, 2012
Code: Document Code File: HORUS_GTC.DOC
Fig. 21. HORUS mechanical design.
The fiber link penetrates into the vacuum chamber and the pseudo slit is mounted on top ofthe (blue) baffle shown in Figure 21 on the nearest right part of the bench. The light beambounces on the first folder, the collimator, and second folder, which leads the light to thetrain of three prisms, the echelle grating, the spectrograph’s camera and, finally, the detector(left top in the Figure).
The table is suspended from three stainless steel A-frame hangers. The conduction can beshown to be 16 W/m/K × 0.15 m2 / 0.003m = 0.05 W/K. Other conductive paths from wiringand cold straps could be estimated at 5 W/K due to the fact that they are usually copper orsome other high conductivity alloy. Convection is eliminated by evacuating the chamber.Any vacuum below 200 mTorr is sufficient as the mean free path of the gas molecules islarger than the chamber dimensions. Radiative transfer between the optics and thesurrounding vacuum chamber is 0.7 W/K. The total transfer rate from the controlled box tothe vacuum chamber is 6 W/K.
The optics and table will try to follow the +/- 0.01 K variation of the vacuum chamber. Thetime constant τ = 900 J/Kg/K (aluminum) × 750 Kg / (6 W/K) ≈ 112,500 sec (31 hours).
ΔT/T0 ≈ e-1.4/31 = 0.956, so unless the variation In the vacuum chamber remains 0.01 K awayfrom the desired temperature for longer than 1.4 hours, the optics and table will be stable to 5% of the variation in the vacuum chamber. Therefore the optics will be stable to 0.001 K.
DOCUMENT TITLEPage: 32 of 47
Date: April 3, 2012
Code: Document Code File: HORUS_GTC.DOC
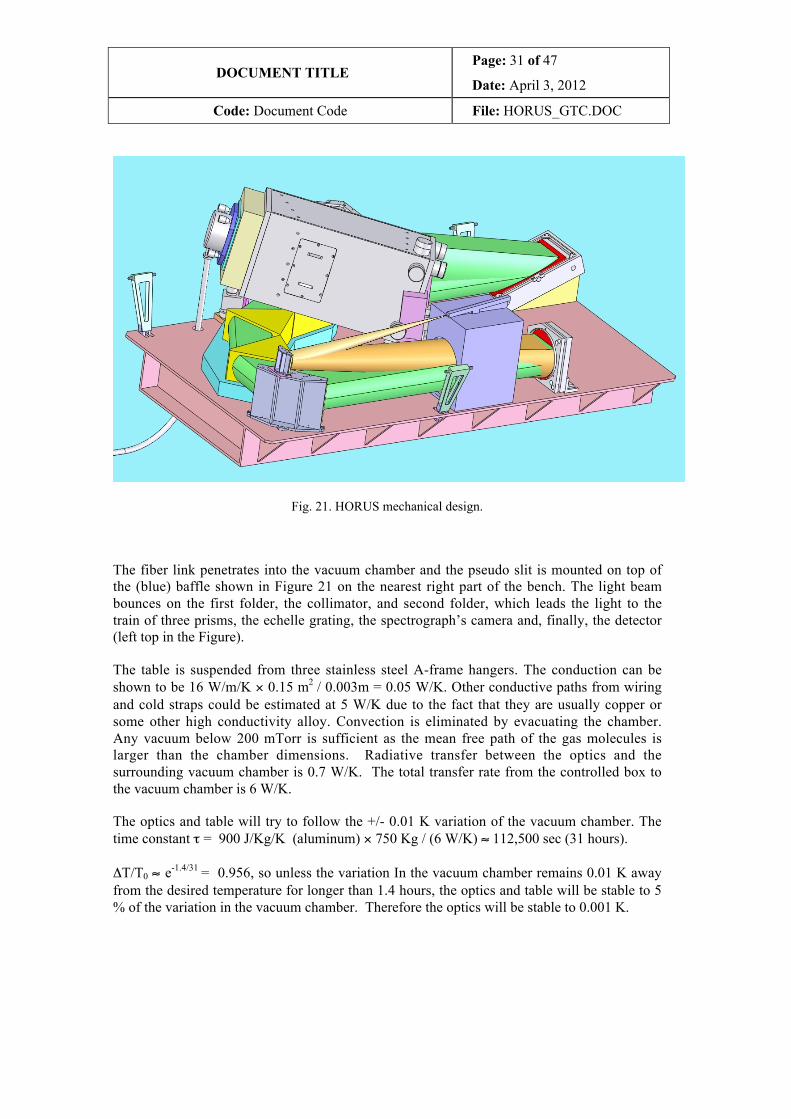
7.4 CCD camera
Great care must be taken to ensure that the various forms of heating and cooling supplied tothe CCD do not destabilize the rest of the optical system. This will best be accomplished by thermally isolating the detector from the optics and then controlling its energy balance asprecisely as possible. It will be shown that the CCD does not require the mK control that therest of the optical train has in order to achieve the desired spectral stability. This design willbe based on the Fairchild CCD 486 BI currently in hand.
Fig. 22. CCD mounted on the back of the HORUS camera.
The CCD will be mounted by a stainless steel cup (shown in orange in Figure 22) connectedto the front flange of the detector, and then through three re-entrant stainless mounts toprovide a mechanically stable, thermally insulating mount. Conductive coupling to the opticsis q= 16 W/K × 1/(1/.352in + 1/.0917 in ) / 39.37 in/m= 0.03 W/K.
DOCUMENT TITLEPage: 33 of 47
Date: April 3, 2012
Code: Document Code File: HORUS_GTC.DOC
Radiant transfer is a little problematic as the factory finish on the outside of the CCD isblack, ie. high emissivity . This can be reduced by judicious use of MLI to bring theeffective emissivity to .02. Radiant q = 5.67 -8 W/ m2 K 4 × 0.2 m2 x (293 4 – 292 4 ) / 1/0.02 +0.2 m2 / 14 m2 × (1/0.02 – 1) = 0.022 W/K.
The estimated total CCD to optics transfer is 0.052 W/K. This is less than 1/100 the transferrate between the outer chamber and the optics. This implies that the CCD thermal controlcould be +/- 0.1 K as long as it does not affect the position of the CCD focal plane. It shouldbe measured that the “window” heater that controls the outer shell temperature of the CCDcreates only a small thermal gradient across the mounting face. This may mean amodification to the window heater that will distribute the heat annularly around the front faceof the detector. Because this heater will see a vacuum inside and out, it will no longer be setto defrost the window, but instead to balance the cooling effect of the silicon CCD andmaintain the CCD shell at the temperature of the optics.
Presently, cooling of the CCD is provided by a CryoTiger system. We will use a coppercooling line attached to the base of a 500 liter storage dewar. Temperature control will beaccomplished by the same control heater presently implemented. The cross sectional area ofa copper cooling wire to maintain the CCD at -100° C (173 K) with an input of 0.5 W is A = 0.5 W × 300 cm / 400 W/m/K × 173 K –77 K = 3.9× 10⁻³ cm2. A copper wire with adiameter of 0.07 cm to a dewar 3 meters away will provide an excellent cold sink using 0.25liter/day of liquid nitrogen.
8. PLACEMENT AT GTC
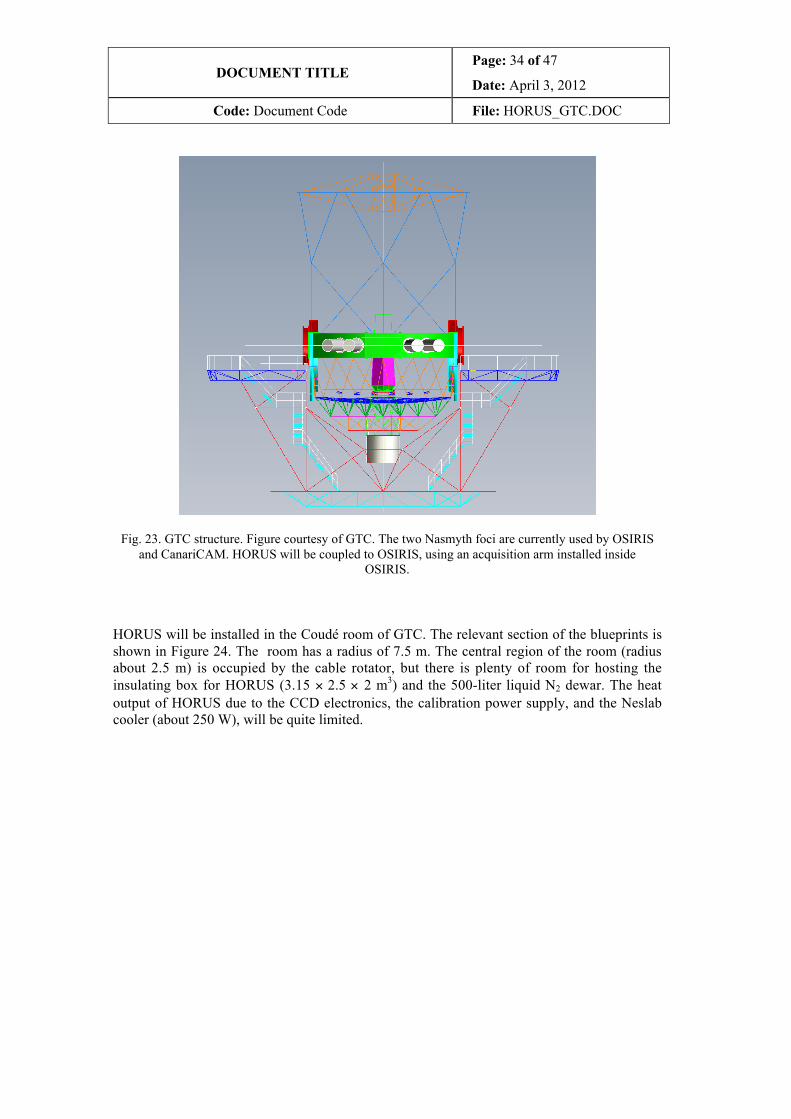
HORUS will be fed via optical fibers that will acquire the light from the acquisition arminside OSIRIS, currently at the Nasmyth platform of GTC (see Figure 23). All theconnections for OSIRIS pass through the cable rotator. The total length for the fiber linkfrom the Nasmyth focus to the Coudé room is approximately 80 m.
DOCUMENT TITLEPage: 34 of 47
Date: April 3, 2012
Code: Document Code File: HORUS_GTC.DOC
Fig. 23. GTC structure. Figure courtesy of GTC. The two Nasmyth foci are currently used by OSIRISand CanariCAM. HORUS will be coupled to OSIRIS, using an acquisition arm installed inside
OSIRIS.
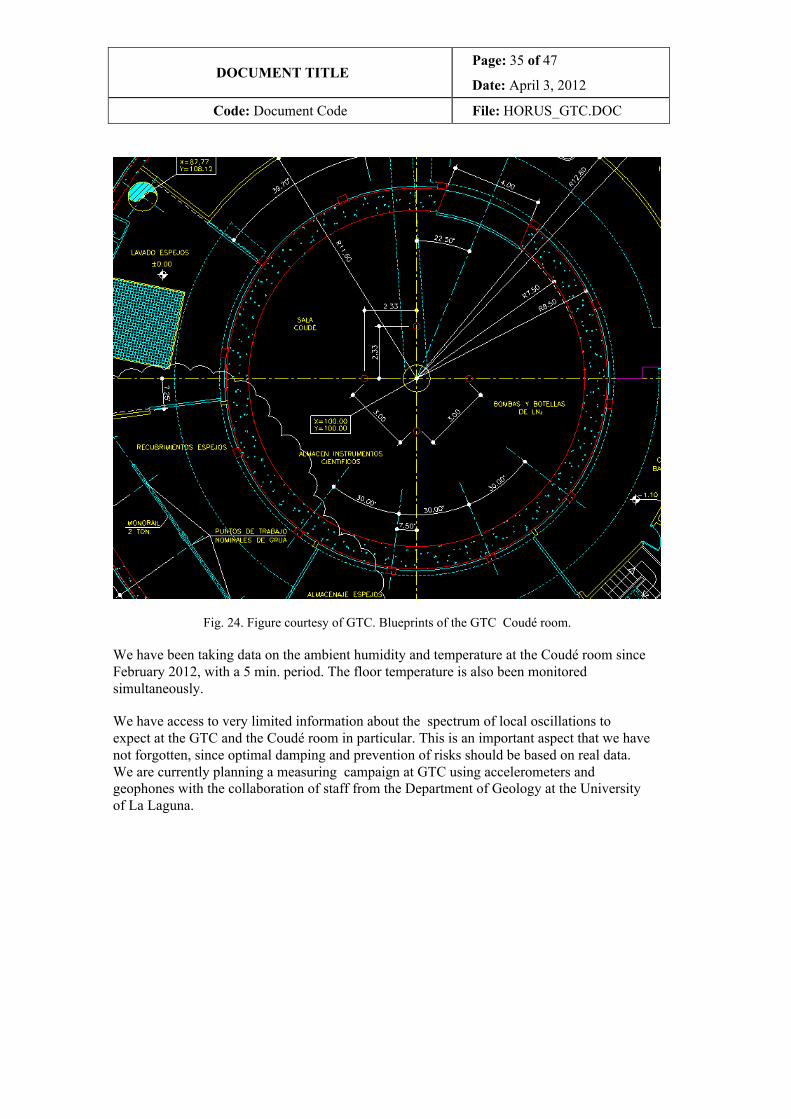
HORUS will be installed in the Coudé room of GTC. The relevant section of the blueprints isshown in Figure 24. The room has a radius of 7.5 m. The central region of the room (radiusabout 2.5 m) is occupied by the cable rotator, but there is plenty of room for hosting theinsulating box for HORUS (3.15 × 2.5 × 2 m3) and the 500-liter liquid N2 dewar. The heatoutput of HORUS due to the CCD electronics, the calibration power supply, and the Neslabcooler (about 250 W), will be quite limited.
DOCUMENT TITLEPage: 35 of 47
Date: April 3, 2012
Code: Document Code File: HORUS_GTC.DOC
Fig. 24. Figure courtesy of GTC. Blueprints of the GTC Coudé room.
We have been taking data on the ambient humidity and temperature at the Coudé room sinceFebruary 2012, with a 5 min. period. The floor temperature is also been monitoredsimultaneously.
We have access to very limited information about the spectrum of local oscillations toexpect at the GTC and the Coudé room in particular. This is an important aspect that we havenot forgotten, since optimal damping and prevention of risks should be based on real data.We are currently planning a measuring campaign at GTC using accelerometers andgeophones with the collaboration of staff from the Department of Geology at the Universityof La Laguna.
DOCUMENT TITLEPage: 36 of 47
Date: April 3, 2012
Code: Document Code File: HORUS_GTC.DOC
9. DATA REDUCTION AND ANALYSIS SOFTWARE
The productivity of an instrument such as HORUS will largely depend on the availability ofreliable, fully-automated, software that will provide extracted, wavelength calibrated spectra,fundamental atmospheric parameters, and high-precision radial velocities.
9.1 Data reduction
Since HORUS has no moving parts and it is in an ultra-stable environment, the repeatabilityof the spectral setting is also guaranteed. This makes the design of the data reductionsoftware simpler and more robust.
The usual steps performed in the reduction of cross-dispersed echelle spectra will befollowed, applying to the data, in this order: bias/overscan correction, flatfielding, scatteredlight correction, order tracing, and optimal extraction. We will explore the use of 2D-optimized extraction techniques (Bolton & Schlegel 2009). The spectra will be calibrated inwavelength using high signal-to-noise ratio Th-Ar spectra taken each day, and linear or low-order corrections applied based on the simultaneous observation of the calibration source,accounting for spatial variations along the slit, as tracked by our two calibration fibers.
The automated data-reduction pipeline will also be extremely useful to perform qualityassurance on the science data, and to monitor the instrument’s health and stability over time.
9.2 Analysis
Extracting the highest possible accuracy in radial velocity requires an optimized analysistechnique. Despite the high stability, much care has to be exercised to weight appropriatelythe different parts of the spectrum, as well as to accommodate the many distortionsintroduced by the instrument, such as the spectral response, which is highly dependent on theparticular spectral order. Telluric absorption has to be properly masked.
The actual radial velocities will be derived by two methods: a masked cross-correlation andtemplate matching. In both cases an optimal template needs to be built in multiple steps,starting with model spectra to derive initial offsets, and ending with an optimally co-addedspectrum of the source obtained with HORUS. Correcting for the motion of the observerrelative to the solar system barycentre is crucial at this level of precision. This requires thebest available ephemerides from JPL (DE405).
Knowing the fundamental parameters of the targets is an important preliminary step forfurther analysis, and needed to select an appropriate theoretical template. Based onexperience for S4N, and the APOGEE projects (Allende Prieto 2004, 2008), we will writesoftware that automatically provides effective temperature, surface gravity, metallicity andthe alpha-to-iron abundance ratio.
DOCUMENT TITLEPage: 37 of 47
Date: April 3, 2012
Code: Document Code File: HORUS_GTC.DOC
10. TASKS AND SCHEDULE
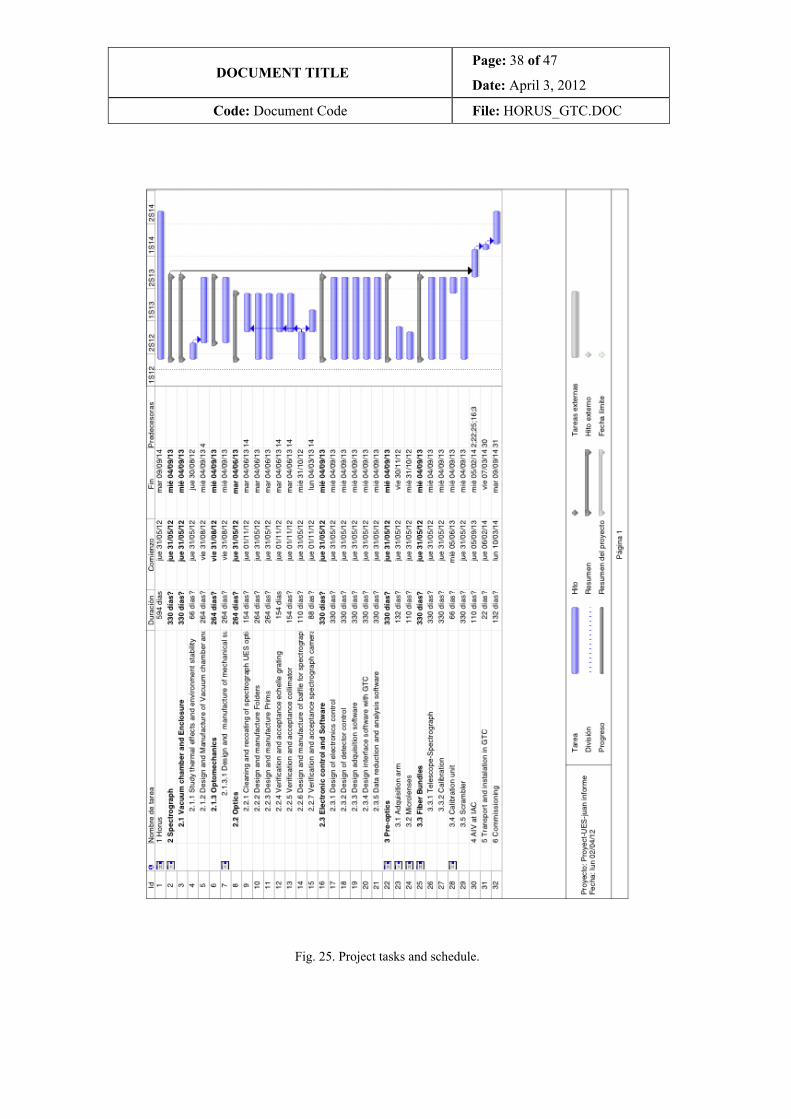
The design and construction of HORUS is an atypical project in that most components areavailable right from the start. This implies an unusually small budget and short time scales,as tentatively sketched in Fig. 25.
The optical design of HORUS involves only minor changes in the spectrograph relative toUES: two new folders make the instrument more compact, and it is now placed inside avacuum chamber to enhance its stability. The main changes are related to the coupling to thetelescope, which is made using optical fibers. This allows us to separate most of the workinto two branches, which can be carried out in parallel: the vacuum chamber, optical benchand enclosure on one side (Task 2.1) and the work needed to complete the optics, electronicsand pre-optics (Tasks 2.2, 2.3 and 3). We provide below more details.
I. The construction of the vacuum chamber and its insulating box will be outsourced toan external company. This is the highest risk item in the project, and for that reasonwe have contacted a team with significant experience. The company PulseRay Inc.,based in New York State, designed and successfully built the cryostat for APOGEE(Blank et al. 2011), a 300-fiber H-band spectrograph used in the Sloan Digital SkySurvey (Eisenstein et al. 2011) with very similar dimensions to HORUS. We alreadyhave a preliminary design in hand, described in Section 7, and anticipate that thecomplete design and construction will take slightly over year. Spanish law requiresto have a public call for offers, which could take place as early as summer 2012.
II. The optical table for HORUS is fully integrated into the vacuum chamber,customized to achieve perfect balance from only three supporting points. It will bedesigned and delivered together with the vacuum chamber as part of the samecontract and timescale (Task 2.1).
III. The pre-optics include the acquisition arm, microlenses, and fibers. The acquisitionarm will be done in Zerodur®. after completion of its design (Task 3.1). Apreliminary design is described in Section 4.4. It includes a full-reflection prism, anda shutter. We expect that building this arm will take about 6 months, with part of thework subcontracted to a company.
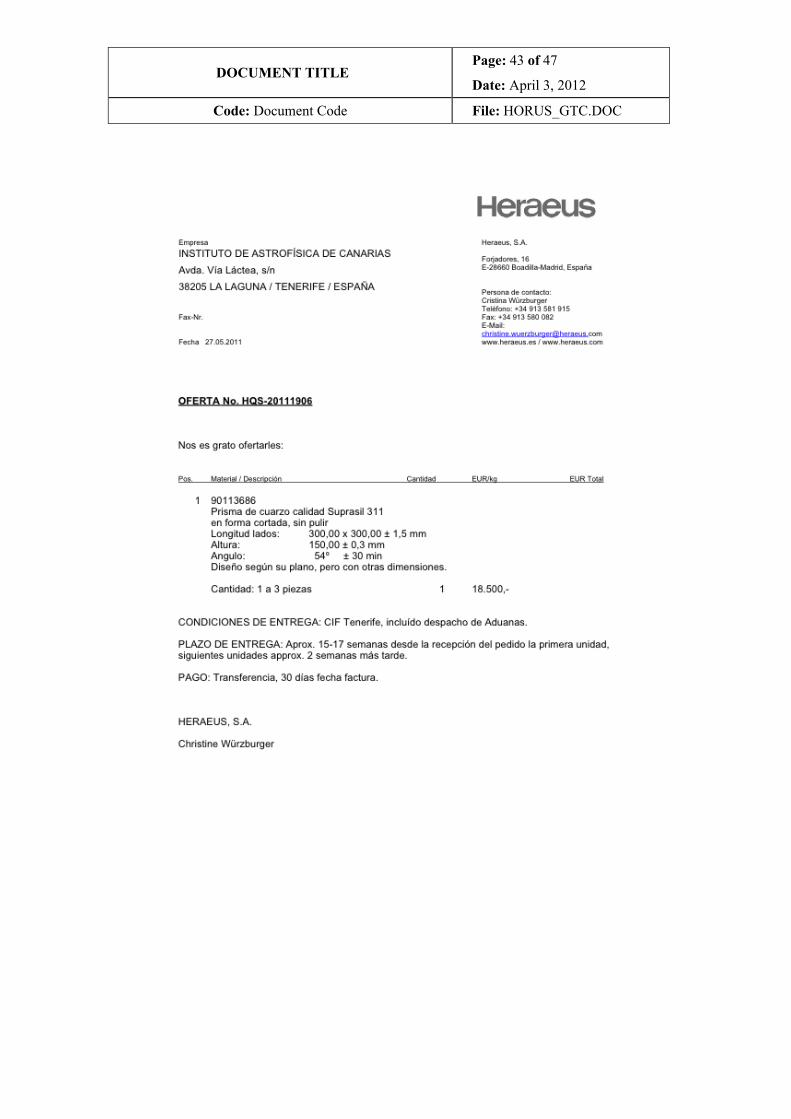
IV. The design of HORUS includes two new folders and prisms for cross-dispersion.Once the blanks for the prisms are ordered, they may be delivered in about 20 weeks(see attached quote in Annex B), and a similar timescale can be expected for thelarge folder (F2). Polishing will be subcontracted, and it is anticipated will take anadditional 20 weeks. The smaller folder is available off-the-shelf.
DOCUMENT TITLEPage: 38 of 47
Date: April 3, 2012
Code: Document Code File: HORUS_GTC.DOC
Fig. 25. Project tasks and schedule.
DOCUMENT TITLEPage: 39 of 47
Date: April 3, 2012
Code: Document Code File: HORUS_GTC.DOC
V. The calibration unit involves a hollow-cathode Th-Ar lamp and a ND filter array on amotorized mount. This is external to the HORUS vacuum chamber and insulatingbox. The ND filters and the mount are available off-the-self. The unit also has ashutter, which is identical to that used on the acquisition arm; both are synchronized.This shutter is very small (few cm) and it is adapted from a photographic camera.The design and integration will be performed at the IAC. We expect this will takeabout 3 months to complete (Task 3.4).
VI. HORUS includes no moving parts, but the synchronized shutter operation must becontrolled by the software control used for the CCD. We expect this involvesdedicated work by a software engineer at the IAC during 10 months (Task 2.3).
VII. The spectrograph’s camera baffle needs to be redesign to avoid vignettingthe field of view. This task and and gluing the microlenses to the fibers will beoccupy Gracia about 5 months (Task 2.2.6).
VIII. The existing optical components must be checked, cleaned, and tested invacuum (Tasks 2.2.1, 2.2.4., 2.2.5, and 2.2.7). This will take an optical engineer(Gracia) about 7 additional months.
The most time-consuming part of the project is connected with items I and II, and those willbe outsourced. Items III and IV will also be mostly outsourced and therefore can beperformed in parallel. Items V-VIII will be mostly done at the IAC, taking about 12 months.Therefore all items are doable in a period of about 1 year.
Integration and commissioning could take up to one additional year, six months for each task
11. ESTIMATED BUDGET
Our estimates indicate that total cost in will be in the vicinity of 360 k€, split as follows:
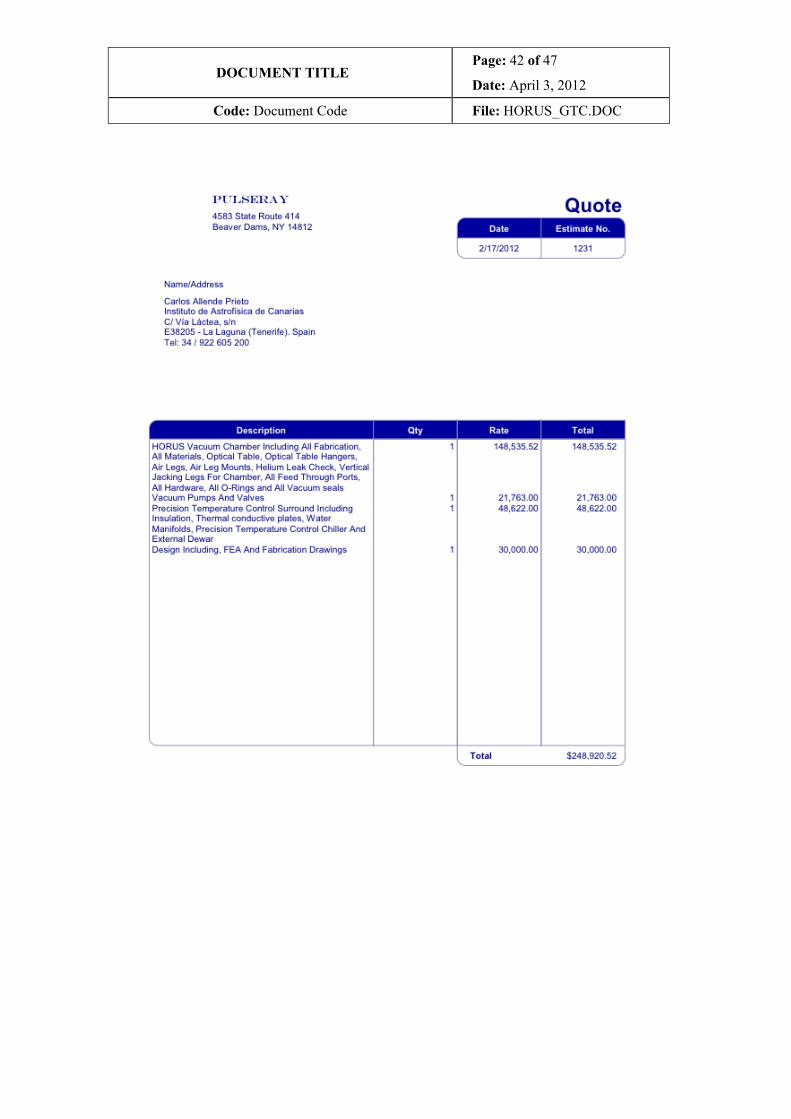
1. Vacuum chamber and insulating box (including vacuum pumps, anti-vibration legs,cooling hardware): 190 k€
2. Transportation and insurance: 20 k€
3. blanks for prisms (60 k€), and polishing work (30 k€): 90 k€
4. folding mirrors (F1 0.5 k€ and F2 9.5 k€): 10 k€
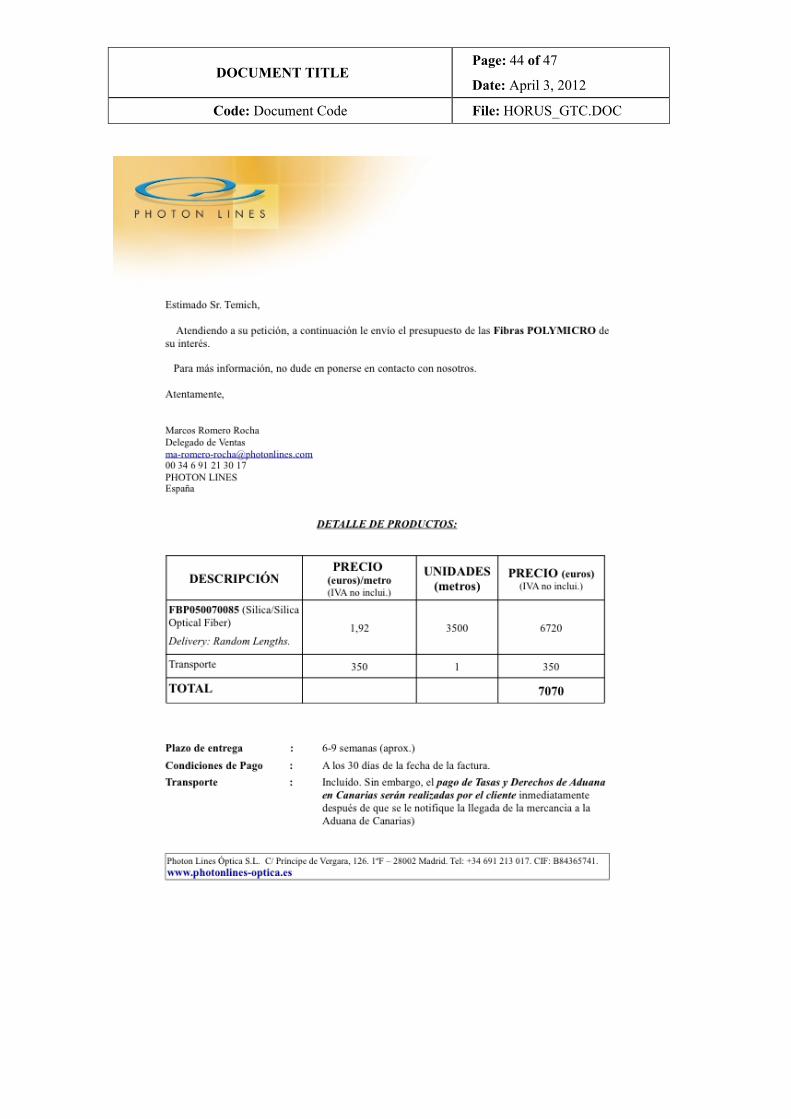
5. fibers (7 k€), microlenses (13 k€), acquisition arm prism (0.5 k€), neutral densityfilters (0.5 k€), shutters (2 k€), filter mechanism (2 k€): 25 k€
6. control electronics: 20 k€
DOCUMENT TITLEPage: 40 of 47
Date: April 3, 2012
Code: Document Code File: HORUS_GTC.DOC
7. calibration source (Th-Ar hollow cathode lamp and power supply from, e.g.,Cathodeon): 5 k€.
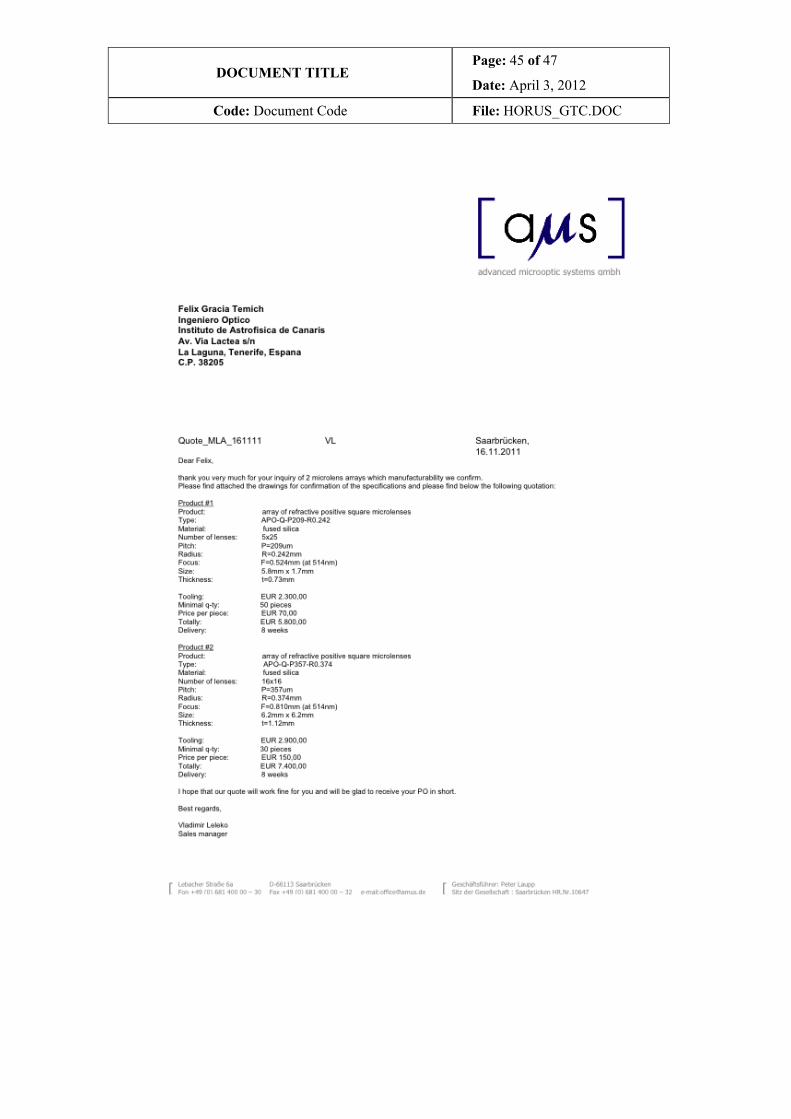
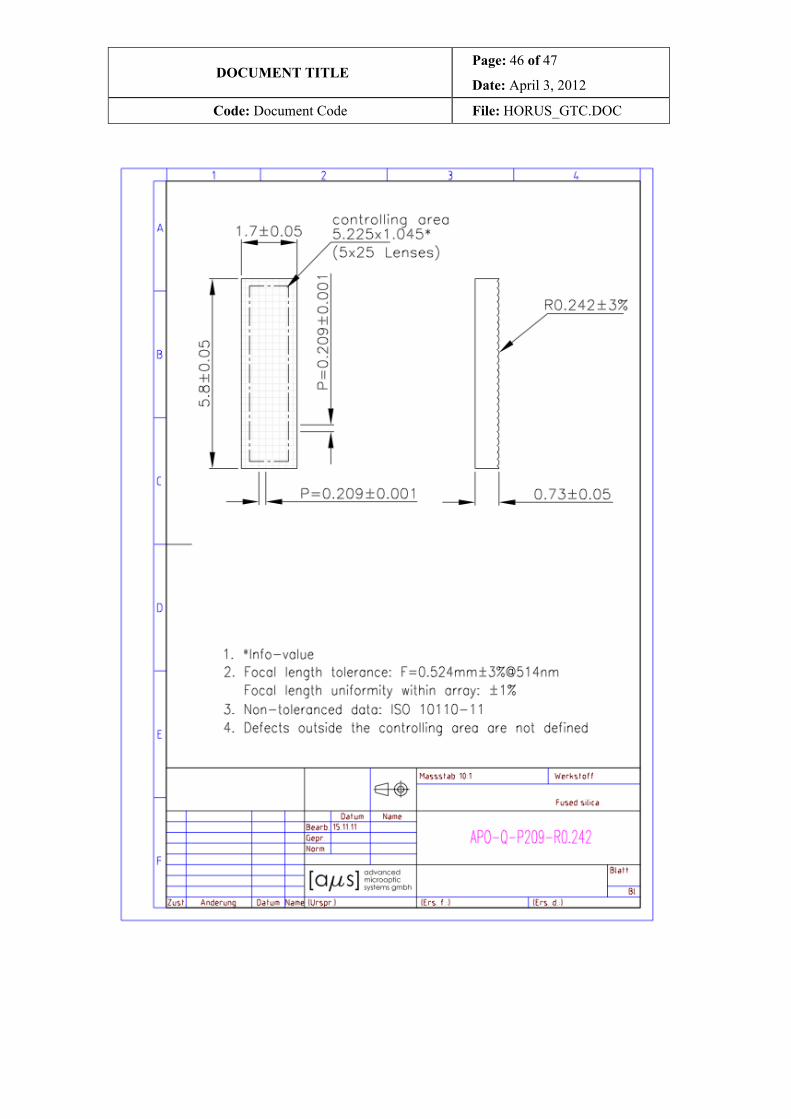
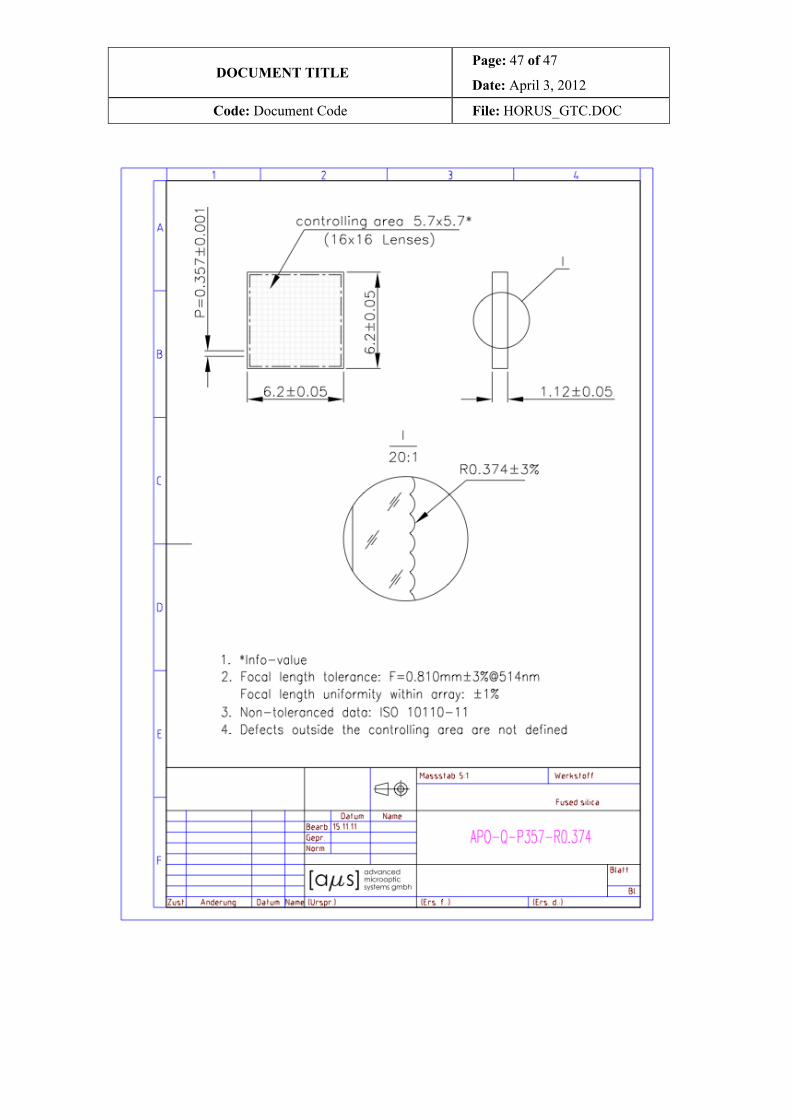
Detailed budget estimates from PulseRay (vacuum chamber and enclosure), Heraeus (cross-dispersing prism blanks), Photon Lines (fibers), and AMS (microlenses), are included inAnnex B.
This cost estimate includes hardware, labor and transportation in the case of the vacuumchamber, enclosure, and the cross-dispersion prisms, but only hardware for the tasks to becarried out at the IAC.
INSTITUTO DE ASTROFISICA DE CANARIAS38200 La Laguna (Tenerife) - ESPAÑA - Phone (922)605200 - Fax (922)605210
ANNEXES
A. LIST OF REFERENCE DOCUMENTS
Allende Prieto et al. 2004, 420, 183
Allende Prieto et al. 2008, AN, 329, 1018
Bolton, A. S. & Schlegel, D. J. 2010, PASP
Blank, B. et al. 2010, Ground-based and Airborne Instrumentation for AstronomyIII. Proceedings of the SPIE, Vol. 7735, pp. 773569-773569-8
Cepa, J. et al. 2011, OSIRIS User Manual, v1.1, IAC Technology Division
Diego Quintana, F. de A., 1988, UCL Echelle Spectrograph for the Coudé Focusof the Anglo-Australian Telescope, PhD Thesis, University College London
Eisenstein, D. J. et al. 2011, AJ, 142, 72
Joven, E. 2011, Pruebas en LISA de la Cámara de HORUS, IAC Instrumentación
Montes, D. & Martín, E. L. 1998, A&AS, 128, 485
Unger, S., Walton, N., Pettini, M. & Tinbergen, J. 1993, UES User’s Manual
B. QUOTES
DOCUMENT TITLEPage: 42 of 47
Date: April 3, 2012
Code: Document Code File: HORUS_GTC.DOC
DOCUMENT TITLEPage: 43 of 47
Date: April 3, 2012
Code: Document Code File: HORUS_GTC.DOC
DOCUMENT TITLEPage: 44 of 47
Date: April 3, 2012
Code: Document Code File: HORUS_GTC.DOC
DOCUMENT TITLEPage: 45 of 47
Date: April 3, 2012
Code: Document Code File: HORUS_GTC.DOC
DOCUMENT TITLEPage: 46 of 47
Date: April 3, 2012
Code: Document Code File: HORUS_GTC.DOC
DOCUMENT TITLEPage: 47 of 47
Date: April 3, 2012
Code: Document Code File: HORUS_GTC.DOC