gs report ofs jan 2010
TRANSCRIPT
8/7/2019 GS Report OFS Jan 2010
http://slidepdf.com/reader/full/gs-report-ofs-jan-2010 1/37

8/7/2019 GS Report OFS Jan 2010
http://slidepdf.com/reader/full/gs-report-ofs-jan-2010 2/37
January 7, 2010 Americas: Energy: Oil Services
Goldman Sachs Global Investment Research 2
Table of contents
2010 outlook: firing on all cylinders; favor structural winners, both “oily” and “gassy” 3
(1) Drilling activity is on an upswing globally – budgets suggest +10% growth with $70 oil 7(2) Pricing power (and growth) passes to the service companies from the offshore drillers 11
(3) Increasing service intensity is key – advantage goes to diversified service companies 13
North America – Increased activity in the shales will drive service intensity 13
International – Service intensity on the rise driven by increased offshore and reservoir complexity 17
Views on the stocks: Favor structural winners, both “oily” and “gassy” 19
Halliburton: Upgrading to Conviction Buy from Neutral 19
Cameron International: Downgrading to Neutral from Conviction Buy 21
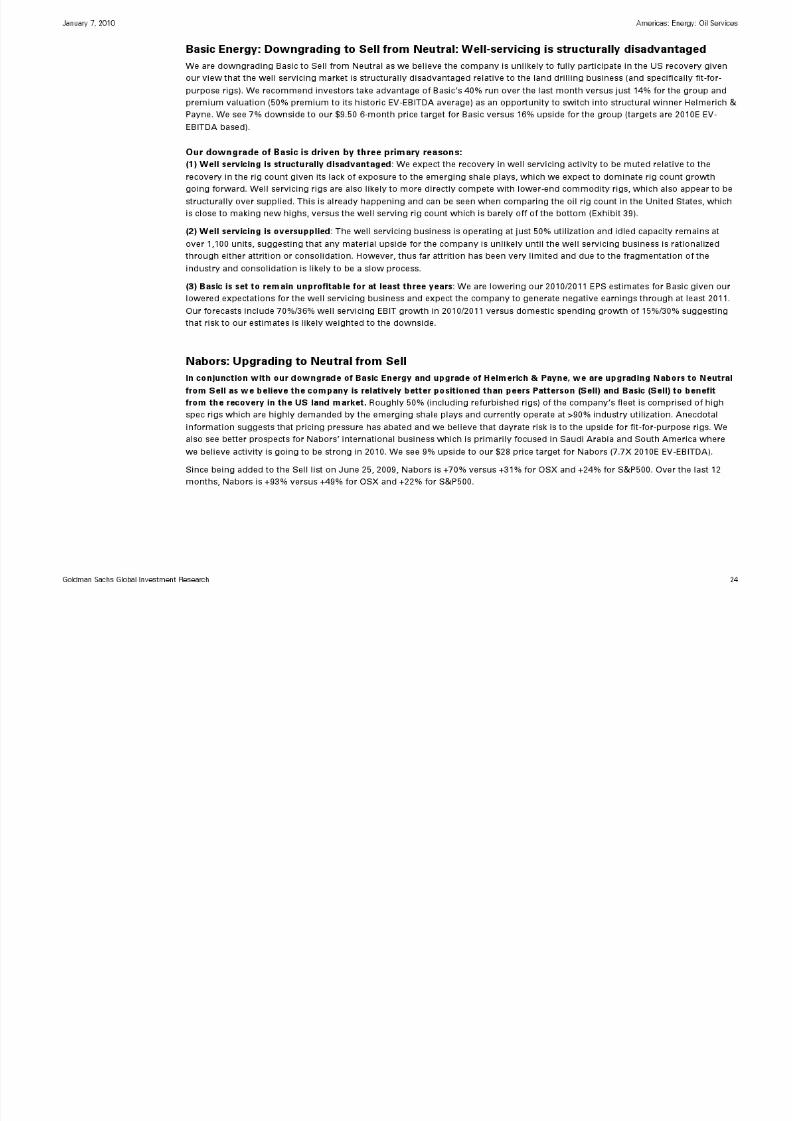
Basic Energy: Downgrading to Sell from Neutral: Well-servicing is structurally disadvantaged 24
Nabors: Upgrading to Neutral from Sell 24
Tenaris (CL Buy) remains a Conviction List favorite 25
Schlumberger (Buy) continues to be a leading international franchise 26
Offshore Drillers: Ensco, Noble and Transocean are Buy-rated favorites 26
Appendix 1: E&P capex announcements 28
Appendix 2: Stock performance 29
Appendix 3: Stock price performance while on Investment Lists 31
Disclosures 34
The prices in the body of this report are based on the market close of January 6, 2010.
We would like to thank Kapil Chauhan for his contribution to this report.
8/7/2019 GS Report OFS Jan 2010
http://slidepdf.com/reader/full/gs-report-ofs-jan-2010 3/37
January 7, 2010 Americas: Energy: Oil Services
Goldman Sachs Global Investment Research 3
2010 outlook: firing on all cylinders; favor structural winners, both “oily” and “gassy”
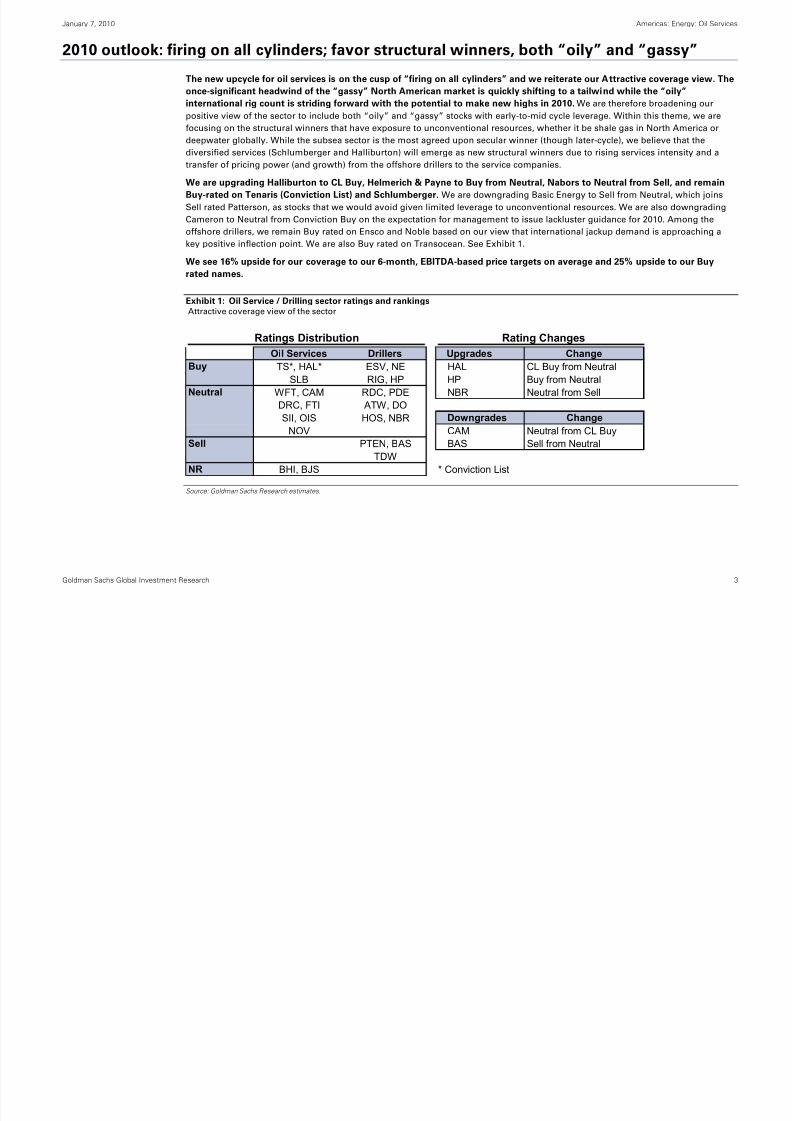
The new upcycle for oil services is on the cusp of “firing on all cylinders” and we reiterate our Attractive coverage view. The
once-significant headwind of the “gassy” North American market is quickly shifting to a tailwind while the “oily”
international rig count is striding forward with the potential to make new highs in 2010. We are therefore broadening ourpositive view of the sector to include both “oily” and “gassy” stocks with early-to-mid cycle leverage. Within this theme, we are
focusing on the structural winners that have exposure to unconventional resources, whether it be shale gas in North America or
deepwater globally. While the subsea sector is the most agreed upon secular winner (though later-cycle), we believe that the
diversified services (Schlumberger and Halliburton) will emerge as new structural winners due to rising services intensity and a
transfer of pricing power (and growth) from the offshore drillers to the service companies.
We are upgrading Halliburton to CL Buy, Helmerich & Payne to Buy from Neutral, Nabors to Neutral from Sell, and remain
Buy-rated on Tenaris (Conviction List) and Schlumberger. We are downgrading Basic Energy to Sell from Neutral, which joins
Sell rated Patterson, as stocks that we would avoid given limited leverage to unconventional resources. We are also downgradingCameron to Neutral from Conviction Buy on the expectation for management to issue lackluster guidance for 2010. Among the
offshore drillers, we remain Buy rated on Ensco and Noble based on our view that international jackup demand is approaching a
key positive inflection point. We are also Buy rated on Transocean. See Exhibit 1.
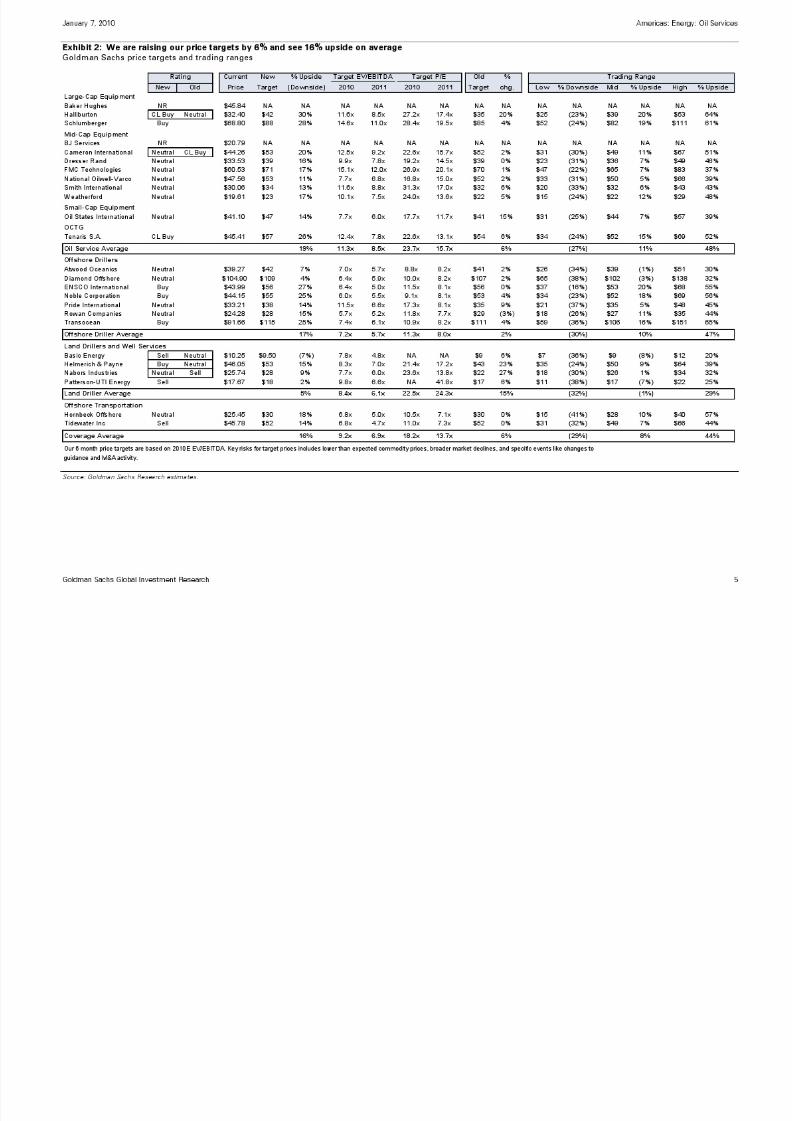
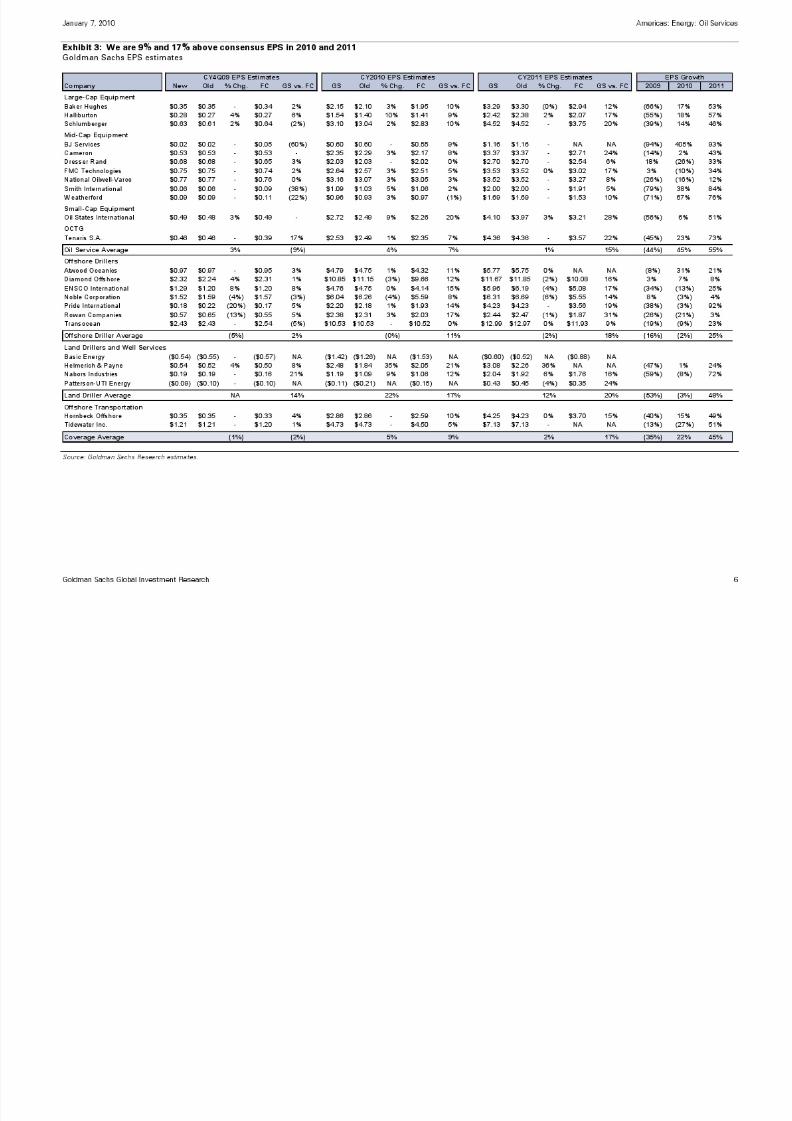
We see 16% upside for our coverage to our 6-month, EBITDA-based price targets on average and 25% upside to our Buy
rated names.
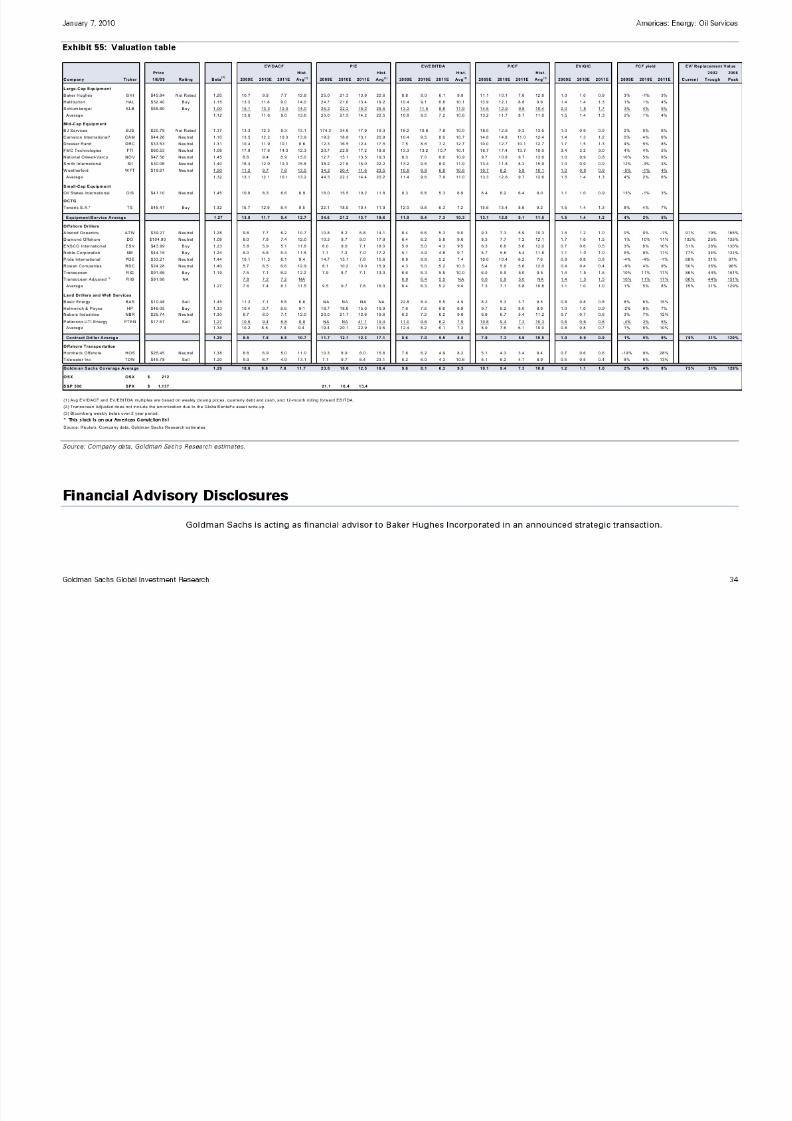
Exhibit 1: Oil Service / Drilling sector ratings and rankings
Attractive coverage view of the sector
Ratings Distribution Rating Changes
Oil Services Drillers Upgrades Change
Buy TS*, HAL* ESV, NE HAL CL Buy from Neutral
SLB RIG, HP HP Buy from Neutral
Neutral WFT, CAM RDC, PDE NBR Neutral from Sell
DRC, FTI ATW, DO
SII, OIS HOS, NBR Downgrades ChangeNOV CAM Neutral from CL Buy
Sell PTEN, BAS BAS Sell from Neutral
TDW
NR BHI, BJS * Conviction List
Source: Goldman Sachs Research estimates.

8/7/2019 GS Report OFS Jan 2010
http://slidepdf.com/reader/full/gs-report-ofs-jan-2010 4/37
8/7/2019 GS Report OFS Jan 2010
http://slidepdf.com/reader/full/gs-report-ofs-jan-2010 5/37
8/7/2019 GS Report OFS Jan 2010
http://slidepdf.com/reader/full/gs-report-ofs-jan-2010 6/37
8/7/2019 GS Report OFS Jan 2010
http://slidepdf.com/reader/full/gs-report-ofs-jan-2010 7/37

8/7/2019 GS Report OFS Jan 2010
http://slidepdf.com/reader/full/gs-report-ofs-jan-2010 8/37
January 7, 2010 Americas: Energy: Oil Services
Goldman Sachs Global Investment Research 8
Exhibit 4: Accelerating activity should lead to the return of pricing power…International and US horizontal rig count months after the peak
Exhibit 5: …as higher budgets continue to call for more drillingRecently announced 2010 spending plans for select companies ($ in mm)
(45%)
(40%)
(35%)
(30%)
(25%)
(20%)
(15%)
(10%)
(5%)
0%
0 1 2 3 4 5 6 7 8 9 10 11 12 13 14 15 16 17
Months after the peak (% change in rig count)
US horizontal rig count International rig count
… while the
horizontal drilling inthe US is only 12%
below the peak...
The international rig count isapproaching peak drilling
activity...
…which indicates higher E&P
capex and the return of pricingpower to oil service companiesstarting with the international
markets as service capacitytightens
+ 53%
+ 8%
Announced International E&P Capex Budgets
2009E 2010E % Chg.
Chevron(1)
$11,600 $13,200 14%
ConocoPhillips(2)
6,950 5,600 (19%)Ecopetrol 3,764 4,509 20%Pemex 16,177 17,197 6%TNK-BP 3,000 3,400 13%All others that annouced budgets thus far 7,285 9,809 35%Total $48,776 $53,715 10%
Announced North America E&P Capex Budgets
2009E 2010E % Chg.
Chesapeake(3)
$3,388 $4,688 38%Chevron 3,600 4,100 14%
ConocoPhillips 3,300 4,100 24%Devon 3,300 3,925 19%All others that annouced budgets thus far 7,774 9,616 24%Total $21,362 $26,429 24%
(1) 2009 CVX international capex excludes $2.3 billion extenstion of concession payment which we view to be
non-activity related.
(2) ConocoPhillips is in the process of divesting a portion of its international assets making year-on-year comparisons difficult.
(3) Drilling and geophysical capex only.
Source: Baker Hughes, Goldman Sachs Research. Source: Company data, Platts, Goldman Sachs Research.
Exhibit 6: The industry is set to increase major project sanctioning
Top230 oil and gas reserves that maturing to the FID each year
Exhibit 7: We expect continued reacceleration in the rig count
Goldman Sachs Baker Hughes North America and International rig count forecast
0
5,000
10,000
15,000
20,000
25,000
2002 2003 2004 2005 2006 2007 2008 2009 2010 2011 2012
mn b
oe
$0
$20
$40
$60
$80
$100
$120
US$/
bbl
Oil Gas Oil price (GS estimates post 2008)
800
1,000
1,200
1,400
1,600
1,800
2,000
2,200
2,400
2,600
1
Q07A
2
Q07A
3
Q07A
4
Q07A
1
Q08A
2
Q08A
3
Q08A
4
Q08A
1
Q09A
2
Q09A
3
Q09A
4
Q09E
1
Q10E
2
Q10E
3
Q10E
4
Q10E
1
Q11E
2
Q11E
3
Q11E
4
Q11E
North America rig count
900
950
1,000
1,050
1,100
1,150
1,200
1,250
1,300
International rig count
North America InternationalForecast
Source: Goldman Sachs Research Top230 Projects report. Source: Baker Hughes, Goldman Sachs Research.
8/7/2019 GS Report OFS Jan 2010
http://slidepdf.com/reader/full/gs-report-ofs-jan-2010 9/37
January 7, 2010 Americas: Energy: Oil Services
Goldman Sachs Global Investment Research 9
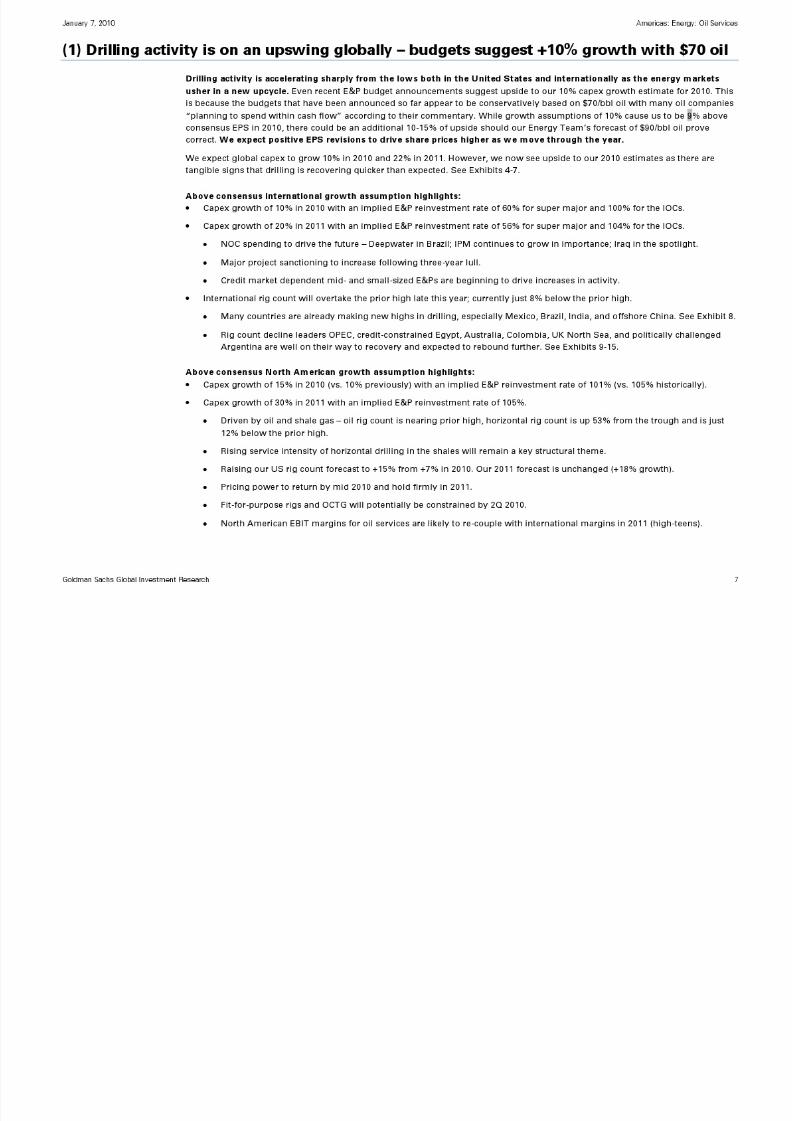
Exhibit 8: Many countries are already achieving new highs in drilling…Change in int’l rig count since recent high point in September 2008
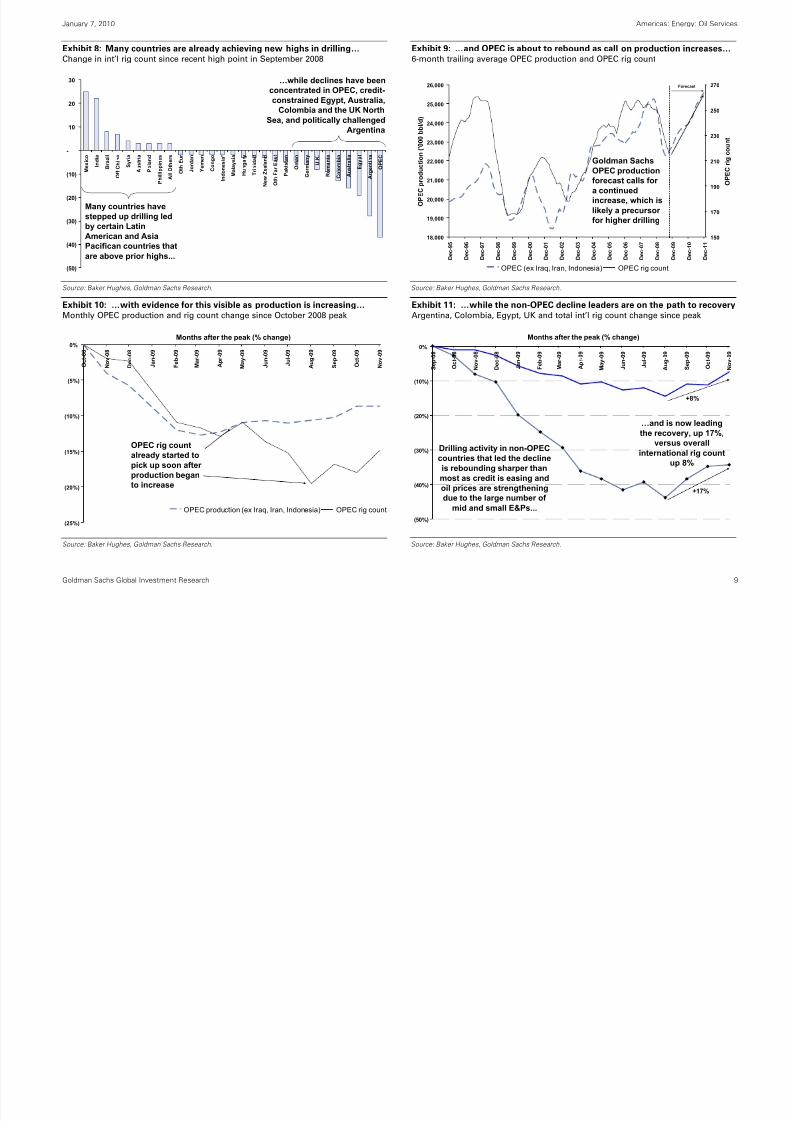
Exhibit 9: …and OPEC is about to rebound as call on production increases…6-month trailing average OPEC production and OPEC rig count
(50)
(40)
(30)
(20)
(10)
-
10
20
30
Mexico
India
Brazil
Off China
Syria
Austria
Poland
Phillippines
All Others
Oth Eur
Jordan
Yemen
Congo
Indonesia*
Malaysia
Hungary
Trinidad
New Zealand
Oth Far East
Pakistan
Oman
Germany
U.K.
Romania
Colombia
Australia
Egypt
Argentina
OPEC
Many countries havestepped up drilling ledby certain LatinAmerican and AsiaPacifican countries thatare above prior highs...
…while declines have beenconcentrated in OPEC, credit-constrained Egypt, Australia,
Colombia and the UK NorthSea, and politically challenged
Argentina
18,000
19,000
20,000
21,000
22,000
23,000
24,000
25,000
26,000
Dec-95
Dec-96
Dec-97
Dec-98
Dec-99
Dec-00
Dec-01
Dec-02
Dec-03
Dec-04
Dec-05
Dec-06
Dec-07
Dec-08
Dec-09
Dec-10
Dec-11
OPEC production ('000 bbl/d)
150
170
190
210
230
250
270
OPEC rig count
OPEC (ex Iraq, Iran, Indonesia) OPEC rig count
Goldman SachsOPEC productionforecast calls for a continuedincrease, which is
likely a precursor for higher drilling
Forecast
Source: Baker Hughes, Goldman Sachs Research. Source: Baker Hughes, Goldman Sachs Research.
Exhibit 10: …with evidence for this visible as production is increasing…
Monthly OPEC production and rig count change since October 2008 peak
Exhibit 11: …while the non-OPEC decline leaders are on the path to recovery
Argentina, Colombia, Egypt, UK and total int’l rig count change since peak
(25%)
(20%)
(15%)
(10%)
(5%)
0%
Oct-08
Nov-08
Dec-08
Jan-09
Feb-09
Mar-09
Apr-09
May-09
Jun-09
Jul-09
Aug-09
Sep-09
Oct-09
Nov-09
Months after the peak (% change)
OPEC production (ex Iraq, Iran, Indonesia) OPEC rig count
OPEC rig countalready started topick up soon after production beganto increase
(50%)
(40%)
(30%)
(20%)
(10%)
0%
Sep-08
Oct-08
Nov-08
Dec-08
Jan-09
Feb-09
Mar-09
Apr-09
May-09
Jun-09
Jul-09
Aug-09
Sep-09
Oct-09
Nov-09
Months after the peak (% change)
…and is now leadingthe recovery, up 17%,
versus overallinternational rig count
up 8%
+17%
Drilling activity in non-OPECcountries that led the declineis rebounding sharper thanmost as credit is easing andoil prices are strengtheningdue to the large number of
mid and small E&Ps...
+8%
Source: Baker Hughes, Goldman Sachs Research. Source: Baker Hughes, Goldman Sachs Research.

8/7/2019 GS Report OFS Jan 2010
http://slidepdf.com/reader/full/gs-report-ofs-jan-2010 10/37
8/7/2019 GS Report OFS Jan 2010
http://slidepdf.com/reader/full/gs-report-ofs-jan-2010 11/37

8/7/2019 GS Report OFS Jan 2010
http://slidepdf.com/reader/full/gs-report-ofs-jan-2010 12/37
January 7, 2010 Americas: Energy: Oil Services
Goldman Sachs Global Investment Research 12
Exhibit 16: Offshore rig spending will lag global spending growth in 2010/11Global Offshore spending versus strip oil prices
Exhibit 17: Offshore rig revenues have massively outpaced service growthyoy revenue growth for service and offshore rig revenue
0
5,000
10,000
15,000
20,000
25,000
30,000
35,000
40,000
45,000
1996
1997
1998
1999
2000
2001
2002
2003
2004
2005
2006
2007
2008
2009
2010
2011
2012
Globa
l Offshore rig spending ($ millions)
$0
$20
$40
$60
$80
$100
$120
Strip oil price ($bbl)
Global offshore rig spending growth:
2006A +52%2007A +53%
2008A +31%2009E +8%2010E +0% (vs. global E&P capex growth of 10%)2011E +12% (vs. global E&P capex growth of 20%)
Strip Oil Price
Offshore rigspending
6%
14%
-9%
9%
18%
-7%
31%
52% 53%
31%
8%
0%
21%
26% 27%
20%
12%
1%
-20%
-10%
0%
10%
20%
30%
40%
50%
60%
2003A 2004A 2005A 2006A 2007A 2008A 2009E 2010E 2011E
YOY change in revenue
Big 3 - International service revenue
Offshore rig revenue, ex US GOM
Offshore rig revenues havemassively outpaced service
company growth 2005-2009
due to capacityconstraints
Service companies are
now in a better position to
out grow the "market" dueto increased rig supply
Source: Company data, ODS-Petrodata, Goldman Sachs Research estimates.
Exhibit 18: Rig shortages led to greater pricing power for offshore drillers
Offshore driller and oil service EBIT margins
Exhibit 19: Rising offshore exploration suggests higher demand for services
Tenders for seismic vessels by month in square kilometers
0%
5%
10%
15%
20%
25%
30%
35%
40%
45%
50%
1997A 1998A 1999A 2000A 2001A 2002A 2003A 2004A 2005A 2006A 2007A 2008A 2009E 2010E 2011E
Operating M
argin
Offshore Driller
Oil Service
Oil Service: SLB, HAL, BHI
Offshore Driller: ATW, DO, ESV, NE, PDE, RDC, RIG
January
February
March
April
May
June
July
August
S
eptember
October
November
December
S
i
ze
i
n
SQ
KM
The spike in offshore seismic tendersover the past several months indicates
increased exploration activity andultimately higher demand for services
Source: Company data, Goldman Sachs Research estimates. Source: Polarcus, Goldman Sachs Research estimates.
8/7/2019 GS Report OFS Jan 2010
http://slidepdf.com/reader/full/gs-report-ofs-jan-2010 13/37

8/7/2019 GS Report OFS Jan 2010
http://slidepdf.com/reader/full/gs-report-ofs-jan-2010 14/37
January 7, 2010 Americas: Energy: Oil Services
Goldman Sachs Global Investment Research 14
supply, we expect the market to become OCTG constrained by mid-2010 as demand recovers, supply declines and much of the low-
end Chinese inventory is deemed unusable. This is still our favorite way to gain exposure to the recovery in North America and
Tenaris is the most compelling vehicle to gain leverage to this theme, in our view. See Exhibits 24-25.
Exhibit 20: Service intensity rig count is down just 24% from the prior high
versus 41% for the overall rig count suggesting service capacity is tighterthan initially appearsBHI rig count and BHI rig count adjusted for service intensity
Exhibit 21: Halliburton’s service intensity is driven by the growing horizontal
rig countNorth America horizontal rig count as percentage of total and HAL’s revenue perrig
500
1,000
1,500
2,000
2,500
3,000
3,500
1Q07A
2Q07A
3Q07A
4Q07A
1Q08A
2Q08A
3Q08A
4Q08A
1Q09A
2Q09A
3Q09A
4Q09E
Current
US rig count
50
150
250
350
450
550
650
750
Horizontal rig count
US rig count US rig count - Service intensity adjusted Horizontal
BHI rig count isdown 41% fromthe peak ...
... But the service intensityadjusted rig count is down
just 24% - driven by theincrease in horizontals
Horizontal
US rig count -service intensityadjusted
$1.5
$2.0
$2.5
$3.0
$3.5
$4.0
$4.5
$5.0
2001A
2002A
2003A
2004A
2005A
2006A
2007A
2008A
2009E
2010E
2011E
HAL's revenue per
rig
0%
5%
10%
15%
20%
25%
30%
35%
40%
45%
50%
Horizontal as a % of US rig count
HAL's NorthAmericarevenue/rig
Horizontalrig count
Source: Baker Hughes, Goldman Sachs Research. Source: Baker Hughes, company data, Goldman Sachs Research.

8/7/2019 GS Report OFS Jan 2010
http://slidepdf.com/reader/full/gs-report-ofs-jan-2010 15/37
January 7, 2010 Americas: Energy: Oil Services
Goldman Sachs Global Investment Research 15
Exhibit 22: Barnett Shale is losing share to more service intensive shalesPercentage of horizontal rig count
Exhibit 23: “newer” shale plays can be up to 1.6X more service intensiveAnnual services opportunity per rig in each basin ($ in mm)
0%
10%
20%
30%
40%
50%
60%
Oct-08
Nov-08
Dec-08
Jan-09
Feb-09
Mar-09
Apr-09
May-09
Jun-09
Jul-09
Aug-09
Sep-09
Oct-09
Nov-09
Dec-09
Barnett Haynesville (La.) Marcellus
$18$22 $23
$25
$58$18
$24 $25
$32
$-
$10
$20
$30
$40
$50
$60
$70
Barnett- CHK Haynesvillle - CHK Fayetteville- CHK Haynesvillle - XCO Marcellus- CHK
Annual Spend ($'000,000s)
Annual Completion Spend
Annual Dilling Spend (ex rig dayrate)
1.3X more
service intensity
than the Barnett
1.3X more
service intensity
than the Barnett
1.6X more
service intensity
than the Barnett
1.6X more
service intensity
than the Barnett
Source: Land rig newsletter, Goldman Sachs Research. Source: Company data, Goldman Sachs Research.
Exhibit 24: We think consumption troughed in 3Q09 and should rise sharply
Quarterly US OCTG consumption (tons in ‘000s)
Exhibit 25: We expect inventories to enter bullish territory in late 2010
OCTG inventories vs. price ($/ton); assumes 15% of inventory is scrapped
400
600
800
1,000
1,200
1,400
1,600
1,800
1Q02
3Q02
1Q03
3Q03
1Q04
3Q04
1Q05
3Q05
1Q06
3Q06
1Q07
3Q07
1Q08
3Q08
1Q09
3Q09
1Q10
3Q10
1Q11
3Q11
Forecast
Average = ~900
$500
$1,000
$1,500
$2,000
$2,500
$3,000
$3,500
1Q01
3Q01
1Q02
3Q02
1Q03
3Q03
1Q04
3Q04
1Q05
3Q05
1Q06
3Q06
1Q07
3Q07
1Q08
3Q08
1Q09
3Q09
1Q10
3Q10
1Q11
3Q11
2.0
4.0
6.0
8.0
10.0
12.0
14.0
Prices tend to increasewhen inventories decline
below 5 months of supply,which we expect to see in
late 2010 & 2011
PipeLogix
price
Months of
supply
inventory
Source: OCTG Situation Report, Goldman Sachs Research estimates. Source: OCTG Situation Report, PipeLogix, Goldman Sachs Research estimates.
J 20 0 A i E Oil S i
8/7/2019 GS Report OFS Jan 2010
http://slidepdf.com/reader/full/gs-report-ofs-jan-2010 16/37
January 7, 2010 Americas: Energy: Oil Services
Goldman Sachs Global Investment Research 16
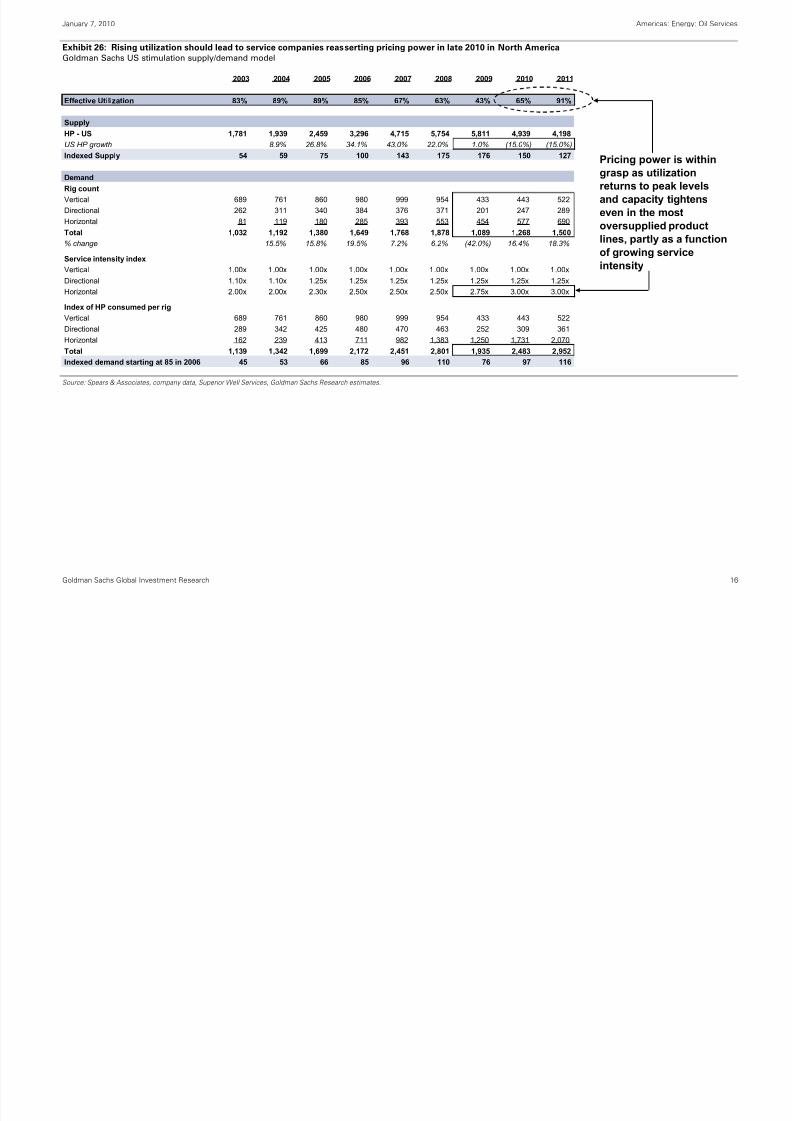
Exhibit 26: Rising utilization should lead to service companies reasserting pricing power in late 2010 in North AmericaGoldman Sachs US stimulation supply/demand model
2003 2004 2005 2006 2007 2008 2009 2010 2011
Effective Utilization 83% 89% 89% 85% 67% 63% 43% 65% 91%
Supply
HP - US 1,781 1,939 2,459 3,296 4,715 5,754 5,811 4,939 4,198
US HP growth 8.9% 26.8% 34.1% 43.0% 22.0% 1.0% (15.0%) (15.0%)
Indexed Supply 54 59 75 100 143 175 176 150 127
Demand
Rig count
Vertical 689 761 860 980 999 954 433 443 522
Directional 262 311 340 384 376 371 201 247 289Horizontal 81 119 180 285 393 553 454 577 690
Total 1,032 1,192 1,380 1,649 1,768 1,878 1,089 1,268 1,500
% change 15.5% 15.8% 19.5% 7.2% 6.2% (42.0%) 16.4% 18.3%
Service intensity index
Vertical 1.00x 1.00x 1.00x 1.00x 1.00x 1.00x 1.00x 1.00x 1.00x
Directional 1.10x 1.10x 1.25x 1.25x 1.25x 1.25x 1.25x 1.25x 1.25x
Horizontal 2.00x 2.00x 2.30x 2.50x 2.50x 2.50x 2.75x 3.00x 3.00x
Index of HP consumed per rig
Vertical 689 761 860 980 999 954 433 443 522Directional 289 342 425 480 470 463 252 309 361
Horizontal 162 239 413 711 982 1,383 1,250 1,731 2,070
Total 1,139 1,342 1,699 2,172 2,451 2,801 1,935 2,483 2,952
Indexed demand starting at 85 in 2006 45 53 66 85 96 110 76 97 116
Pricing power is within
grasp as utilizationreturns to peak levels
and capacity tightens
even in the mostoversupplied product
lines, partly as a function
of growing service
intensity
Source: Spears & Associates, company data, Superior Well Services, Goldman Sachs Research estimates.

8/7/2019 GS Report OFS Jan 2010
http://slidepdf.com/reader/full/gs-report-ofs-jan-2010 17/37
January 7 2010 Americas: Energy: Oil Services
8/7/2019 GS Report OFS Jan 2010
http://slidepdf.com/reader/full/gs-report-ofs-jan-2010 18/37
January 7, 2010 Americas: Energy: Oil Services
Goldman Sachs Global Investment Research 18
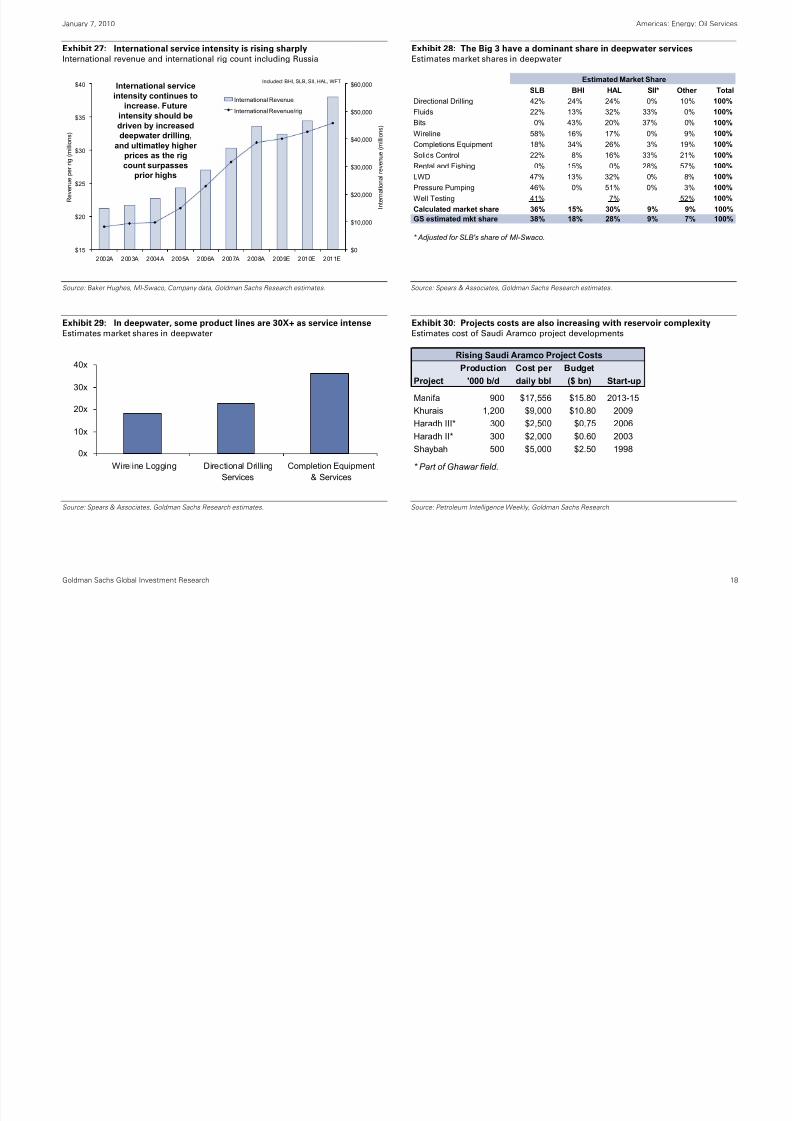
Exhibit 27: International service intensity is rising sharplyInternational revenue and international rig count including Russia
Exhibit 28: The Big 3 have a dominant share in deepwater servicesEstimates market shares in deepwater
$15
$20
$25
$30
$35
$40
2002A 2003A 2004A 2005A 2006A 2007A 2008A 2009E 2010E 2011E
Revenue per rig (millions)
$0
$10,000
$20,000
$30,000
$40,000
$50,000
$60,000
International revenue (millions)
International Revenue
International Revenue/rig
International serviceintensity continues to
increase. Futureintensity should bedriven by increaseddeepwater drilling,
and ultimatley higher prices as the rigcount surpasses
prior highs
Included: BHI, SLB, SII, HAL, WFT Estimated Market Share
SLB BHI HAL SII* Other Total
Directional Drilling 42% 24% 24% 0% 10% 100%
Fluids 22% 13% 32% 33% 0% 100%
Bits 0% 43% 20% 37% 0% 100%
Wireline 58% 16% 17% 0% 9% 100%
Completions Equipment 18% 34% 26% 3% 19% 100%
Solids Control 22% 8% 16% 33% 21% 100%
Rental and Fishing 0% 15% 0% 28% 57% 100%
LWD 47% 13% 32% 0% 8% 100%
Pressure Pumping 46% 0% 51% 0% 3% 100%
Well Testing 41% 7% 52% 100%
Calculated market share 36% 15% 30% 9% 9% 100%
GS estimated mkt share 38% 18% 28% 9% 7% 100%
* Adjusted for SLB's share of MI-Swaco.
Source: Baker Hughes, MI-Swaco, Company data, Goldman Sachs Research estimates. Source: Spears & Associates, Goldman Sachs Research estimates.
Exhibit 29: In deepwater, some product lines are 30X+ as service intenseEstimates market shares in deepwater
Exhibit 30: Projects costs are also increasing with reservoir complexityEstimates cost of Saudi Aramco project developments
0x
10x
20x
30x
40x
Wireline Logging Directional Drilling
Services
Completion Equipment
& Services
Rising Saudi Aramco Project Costs
Production Cost per Budget
Project '000 b/d daily bbl ($ bn) Start-up
Manifa 900 $17,556 $15.80 2013-15
Khurais 1,200 $9,000 $10.80 2009
Haradh III* 300 $2,500 $0.75 2006Haradh II* 300 $2,000 $0.60 2003
Shaybah 500 $5,000 $2.50 1998
* Part of Ghawar field.
Source: Spears & Associates, Goldman Sachs Research estimates. Source: Petroleum Intelligence Weekly, Goldman Sachs Research.
January 7 2010 Americas: Energy: Oil Services
8/7/2019 GS Report OFS Jan 2010
http://slidepdf.com/reader/full/gs-report-ofs-jan-2010 19/37
January 7, 2010 Americas: Energy: Oil Services
Goldman Sachs Global Investment Research 19
Views on the stocks: Favor structural winners, both “oily” and “gassy”
We are positioned in traditional early-to-mid cycle stocks which we deem to be structural winners over the course of the
cycle due to the industry’s inability to grow crude oil supply and shift towards more complex reservoirs such as shale gas.
We see 25% upside on average in our Buy-rated stocks.
Halliburton: Upgrading to Conviction Buy from Neutral
With North America finally becoming a tailwind for oil service stocks at the same time that the deepwater market is heating
up, we are upgrading Halliburton to Conviction Buy from Neutral and see 30% upside to our $42, 6-month EBITDA-based
target. Halliburton has one of the strongest franchises in North America due to its market expertise, solid execution and diverse
product lines that allow it to effectively bundle products and services. Internationally, the company is growing and executing well
with the second highest market share in the lucrative deepwater market.
As the North American market recovers, Halliburton is among the best companies to own due to its large and high quality
pressure pumping fleet which complements its other product offerings. The company’s ability to bundle these offering and to
take share has resulted in growing revenue per rig in North America and one of the best growth rates in among peers. See Exhibits
31 and 32. As the market recovers, service intensity grows, utilizations increase, and pricing power returns, Halliburton’s margins
are set to rise sharply. See Exhibit 33. In an upside case scenario, Halliburton could also continue to gain share due to its ability to
bundle, but we are currently not assuming this in our estimates. We are 9% and 17% above consensus in 2010 and 2011 and think
that EPS revisions will drive the shares higher. We have raised estimates in 2010 and 2011 by 10% and 2% to $1.54 and $2.42,
respectively.
Halliburton’s balance sheet also gives it significant fire power to buy back stock and to do accretive acquisitions. With $3.2 billion
cash on the balance sheet, there is significant flexibility to complement shareholder value creation.
On valuation, the shares are trading at 2010/2011 P/E of 21.0X/13.4X and EV/EBITDA of 9.1X/6.8X versus full cycle average multiples
of 19.2X/10.1X suggesting that there is upside on 2011 estimate as we move though the cycle.
January 7, 2010 Americas: Energy: Oil Services

8/7/2019 GS Report OFS Jan 2010
http://slidepdf.com/reader/full/gs-report-ofs-jan-2010 20/37
y , gy
Goldman Sachs Global Investment Research 20
Exhibit 31: HAL has growth revenue per rig in N.A. the fastest…Revenue per rig in North America for HAL and SLB, and US/Mexico PP for BJS
Exhibit 32: …as ability to bundle has helped it grow the fastestY-o-Y revenue growth in North America
$0.0
$0.5
$1.0
$1.5
$2.0
$2.5
$3.0
$3.5
$4.0
$4.5
$5.0
2002A 2003A 2004A 2005A 2006A 2007A 2008A 2009E 2010E 2011E
($ in mm)
BJS HAL SLB
2004-2009E CAGR:HAL = 13%
SLB = 7%BJS = 4%
-25%
-20%
-15%
-10%
-5%
0%
5%
10%
15%
20%
25%
2002A 2003A 2004A 2005A 2006A 2007A 2008A 2009E 2010E 2011E
BJS HAL SLB
HAL is a marketshare "winner"
A strong pressurepumping market
helped BJS
A weak pressure pumpingmarket and inability to bundle
has since hurt BJS
Source: Company data, Baker Hughes, Goldman Sachs Research. Source: Company data, Goldman Sachs Research estimates.
Exhibit 33: …as ability to bundle has helped it grow the fastestYoY revenue growth in North America
40%
50%
60%
70%
80%
90%
100%
2003 2004 2005 2006 2007 2008 2009 2010 2011
US stimulation utilization
0%
5%
10%
15%
20%
25%
30%
35%
40%
HAL N.A C&
P margin
US stimulation utilization (lhs)
HAL N.A. C&P margin (rhs)
Expect pricingpower to return inlate 2010/early 2011as capacity tightens
Source: Spears & Associates, company data, Goldman Sachs Research estimates.
January 7, 2010 Americas: Energy: Oil Services

8/7/2019 GS Report OFS Jan 2010
http://slidepdf.com/reader/full/gs-report-ofs-jan-2010 21/37
Goldman Sachs Global Investment Research 21
Cameron International: Downgrading to Neutral from Conviction Buy
We are tactically downgrading Cameron International to Neutral from Conviction Buy as we expect management to issue its typical
overly conservative guidance for 2010 when the company reports 4Q2009 results. We note that historically, the shares struggle to
outperform the oil service index at the onset of the year as management has historically set conservative guidance that tends to
disappoint investors on the day of the announcement. We do not expect this year to be any different based on recent conversations
with management. See Exhibits 34 and 35. While we continue to like the company’s strong leverage to all segments of the energy
value chain and its strong subsea franchise, we prefer to tactically shift away from the stock as the company prepares to give
guidance. As we continue to like the stock for the longer term, we will look to revisit the story post 1Q results and as we get closer
to potential large subsea projects awards which we do not expect to see until later in 2010. We now see 20% upside to our $53 6-
month price target, which is similar to group average upside of 16%.
Since being added to the Conviction Buy list on June 25, 2009, Cameron is +53% versus +31% for OSX and +24% for S&P500. Over
the last 12 months, Cameron is +74% versus +49% for OSX and +22% for S&P500.
Exhibit 34: Cameron management tends to give disappointing guidancewhich causes shares to trade in-line with the OSX initially…CAM annual EPS guidance versus consensus and stock performance over the next3 months
Exhibit 35: …but the stock outperforms meaningfully as guidance proves tobe conservative; this suggest that one should revisit the stock in 2Q10CAM annual EPS guidance versus reported EPS in each year and shareperformance month 3 though 6 after initial guidance
(30%)
(25%)
(20%)
(15%)
(10%)
(5%)
0%
5%
10%
2004 2005 2006 2007 2008 2009
Guidance vs. consensus expectations
3 months post guidance performance vs. OSX
(10%)
0%
10%
20%
30%
40%
50%
60%
2004 2005 2006 2007 2008 2009
Reported EPS vs. initial guidance
Month 3-6 post guidance performance vs. OSX
Source: FactSet, Company data, Goldman Sachs Research. Source: FactSet, Company data, Goldman Sachs Research.

8/7/2019 GS Report OFS Jan 2010
http://slidepdf.com/reader/full/gs-report-ofs-jan-2010 22/37
January 7, 2010 Americas: Energy: Oil Services
8/7/2019 GS Report OFS Jan 2010
http://slidepdf.com/reader/full/gs-report-ofs-jan-2010 23/37
Goldman Sachs Global Investment Research 23
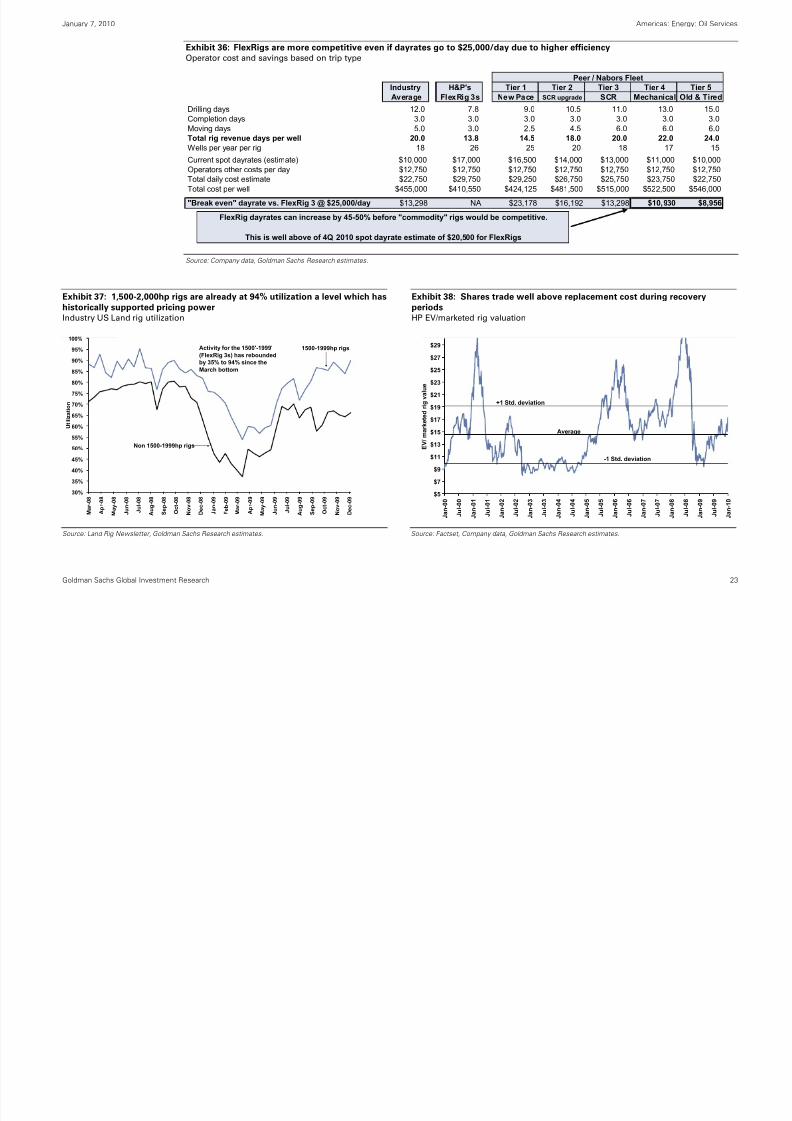
Exhibit 36: FlexRigs are more competitive even if dayrates go to $25,000/day due to higher efficiencyOperator cost and savings based on trip type
Peer / Nabors FleetIndustry H&P's Tier 1 Tier 2 Tier 3 Tier 4 Tier 5
Average FlexRig 3s New Pace SCR upgrade SCR Mechanical Old & Tired
Drilling days 12.0 7.8 9.0 10.5 11.0 13.0 15.0 Completion days 3.0 3.0 3.0 3.0 3.0 3.0 3.0 Moving days 5.0 3.0 2.5 4.5 6.0 6.0 6.0 Total rig revenue days per well 20.0 13.8 14.5 18.0 20.0 22.0 24.0 Wells per year per rig 18 26 25 20 18 17 15
Current spot dayrates (estimate) $10,000 $17,000 $16,500 $14,000 $13,000 $11,000 $10,000Operators other costs per day $12,750 $12,750 $12,750 $12,750 $12,750 $12,750 $12,750Total daily cost estimate $22,750 $29,750 $29,250 $26,750 $25,750 $23,750 $22,750
Total cost per well $455,000 $410,550 $424,125 $481,500 $515,000 $522,500 $546,000
"Break even" dayrate vs. FlexRig 3 @ $25,000/day $13,298 NA $23,178 $16,192 $13,298 $10,930 $8,956
FlexRig dayrates can increase by 45-50% before "commodity" rigs would be competitive.
This is well above of 4Q 2010 spot dayrate estimate of $20,500 for FlexRigs
Source: Company data, Goldman Sachs Research estimates.
Exhibit 37: 1,500-2,000hp rigs are already at 94% utilization a level which hashistorically supported pricing power
Industry US Land rig utilization
Exhibit 38: Shares trade well above replacement cost during recoveryperiods
HP EV/marketed rig valuation
30%
35%
40%
45%
50%
55%
60%
65%
70%
75%
80%
85%
90%
95%
100%
Mar-08
Apr-08
May-08
Jun-08
Jul-08
Aug-08
Sep-08
Oct-08
Nov-08
Dec-08
Jan-09
Feb-09
Mar-09
Apr-09
May-09
Jun-09
Jul-09
Aug-09
Sep-09
Oct-09
Nov-09
Dec-09
Utilization
Non 1500-1999hp rigs
1500-1999hp rigsActivity for the 1500'-1999'
(FlexRig 3s) has reboundedby 35% to 94% since the
March bottom
$5
$7
$9
$11
$13
$15
$17
$19
$21
$23
$25
$27
$29
Jan-00
Jul-00
Jan-01
Jul-01
Jan-02
Jul-02
Jan-03
Jul-03
Jan-04
Jul-04
Jan-05
Jul-05
Jan-06
Jul-06
Jan-07
Jul-07
Jan-08
Jul-08
Jan-09
Jul-09
Jan-10
EV/ mark
eted rig value
+1 Std. deviation
Average
-1 Std. deviation
Source: Land Rig Newsletter, Goldman Sachs Research estimates. Source: Factset, Company data, Goldman Sachs Research estimates.
8/7/2019 GS Report OFS Jan 2010
http://slidepdf.com/reader/full/gs-report-ofs-jan-2010 24/37
January 7, 2010 Americas: Energy: Oil Services
8/7/2019 GS Report OFS Jan 2010
http://slidepdf.com/reader/full/gs-report-ofs-jan-2010 25/37
Goldman Sachs Global Investment Research 25
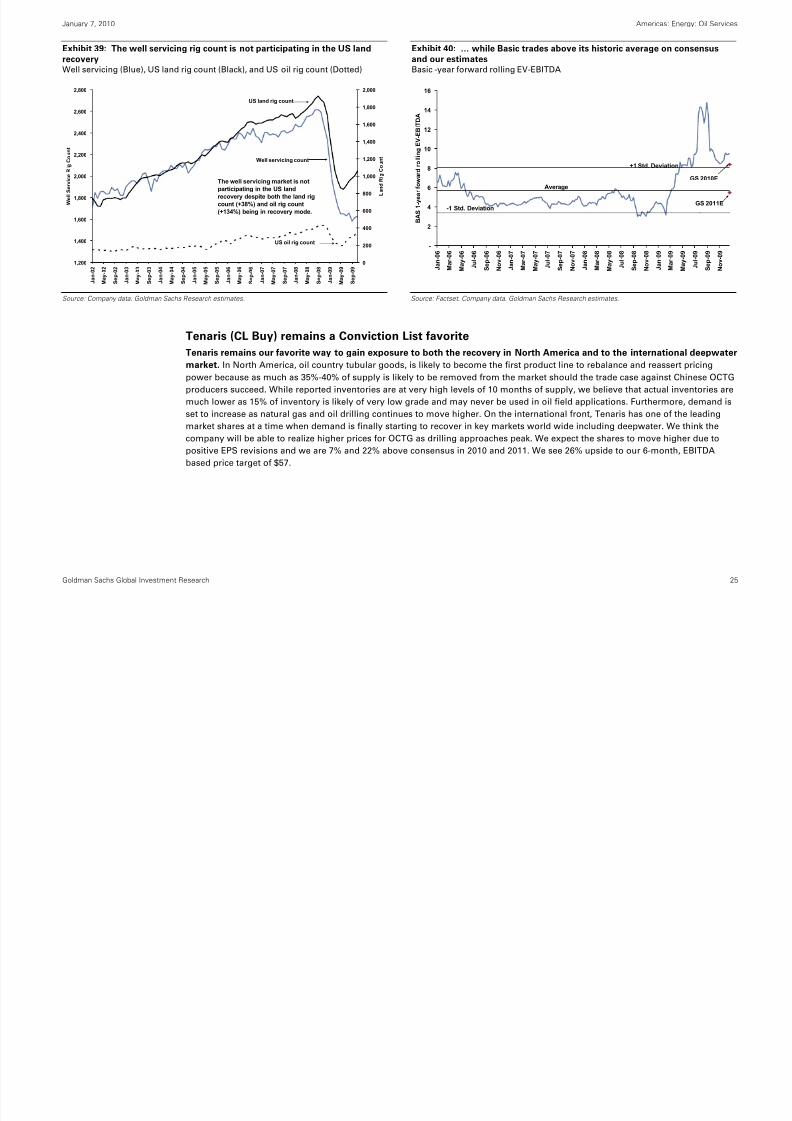
Exhibit 39: The well servicing rig count is not participating in the US landrecoveryWell servicing (Blue), US land rig count (Black), and US oil rig count (Dotted)
Exhibit 40: … while Basic trades above its historic average on consensusand our estimatesBasic -year forward rolling EV-EBITDA
1,200
1,400
1,600
1,800
2,000
2,200
2,400
2,600
2,800
Jan-02
May-02
Sep-02
Jan-03
May-03
Sep-03
Jan-04
May-04
Sep-04
Jan-05
May-05
Sep-05
Jan-06
May-06
Sep-06
Jan-07
May-07
Sep-07
Jan-08
May-08
Sep-08
Jan-09
May-09
Sep-09
Well Service Rig Count
0
200
400
600
800
1,000
1,200
1,400
1,600
1,800
2,000
Land Rig Count
Well servicing count
US land rig count
The well servicing market is notparticipating in the US landrecovery despite both the land rigcount (+38%) and oil rig count(+134%) being in recovery mode.
US oil rig count
-
2
4
6
8
10
12
14
16
Jan-06
Mar-06
May-06
Jul-06
Sep-06
Nov-06
Jan-07
Mar-07
May-07
Jul-07
Sep-07
Nov-07
Jan-08
Mar-08
May-08
Jul-08
Sep-08
Nov-08
Jan-09
Mar-09
May-09
Jul-09
Sep-09
Nov-09
BA
S 1-year foward rolling EV-EBITDA
GS 2010E
GS 2011E
+1 Std. Deviation
-1 Std. Deviation
Average
Source: Company data, Goldman Sachs Research estimates. Source: Factset, Company data, Goldman Sachs Research estimates.
Tenaris (CL Buy) remains a Conviction List favorite
Tenaris remains our favorite way to gain exposure to both the recovery in North America and to the international deepwater
market. In North America, oil country tubular goods, is likely to become the first product line to rebalance and reassert pricing
power because as much as 35%-40% of supply is likely to be removed from the market should the trade case against Chinese OCTG
producers succeed. While reported inventories are at very high levels of 10 months of supply, we believe that actual inventories are
much lower as 15% of inventory is likely of very low grade and may never be used in oil field applications. Furthermore, demand is
set to increase as natural gas and oil drilling continues to move higher. On the international front, Tenaris has one of the leading
market shares at a time when demand is finally starting to recover in key markets world wide including deepwater. We think thecompany will be able to realize higher prices for OCTG as drilling approaches peak. We expect the shares to move higher due to
positive EPS revisions and we are 7% and 22% above consensus in 2010 and 2011. We see 26% upside to our 6-month, EBITDA
based price target of $57.
8/7/2019 GS Report OFS Jan 2010
http://slidepdf.com/reader/full/gs-report-ofs-jan-2010 26/37
January 7, 2010 Americas: Energy: Oil Services

8/7/2019 GS Report OFS Jan 2010
http://slidepdf.com/reader/full/gs-report-ofs-jan-2010 27/37
Goldman Sachs Global Investment Research 27
Exhibit 41: International jackup tendering (bidding) is up 30%....International jackup outstanding tenders
Exhibit 42: … suggesting that demand is at an inflection pointInternational jackup supply/demand forecast
85
90
95
100
105
110
115
120
7/28/09
8/4/09
8/11/09
8/18/09
8/25/09
9/1/09
9/8/09
9/15/09
9/22/09
9/29/09
10/6/09
10/13/09
10/20/09
10/27/09
11/3/09
11/10/09
11/17/09
11/24/09
12/1/09
12/8/09
12/15/09
12/22/09
12/29/09
Outstanding international jackup tend
ers
International jackuptendering activity hasincreased 30% since mid-summer.
250
265
280
295
310
325
340
355
370
385
400
Jan-07
Mar-07
May-07
Jul-07
Sep-07
Nov-07
Jan-08
Mar-08
May-08
Jul-08
Sep-08
Nov-08
Jan-09
Mar-09
May-09
Jul-09
Sep-09
Nov-09
Jan-10
Mar-10
May-10
Jul-10
Sep-10
Nov-10
Jan-11
Mar-11
May-11
Jul-11
Sep-11
Nov-11
International jackup supply/demand
75%
80%
85%
90%
95%
100%
International jackup utilization
Demand forecast(Left)
Utilization(Right)
Supply forecast (Left)(based on planned
newbuilds)
Source: ODS-Petrodata, Goldman Sachs Research estimates. Source: ODS-Petrodata, Company data, Goldman Sachs Research estimates.
January 7, 2010 Americas: Energy: Oil Services

8/7/2019 GS Report OFS Jan 2010
http://slidepdf.com/reader/full/gs-report-ofs-jan-2010 28/37
Goldman Sachs Global Investment Research 28
Appendix 1: E&P capex announcements
Exhibit 43: Global E&P capex announcements suggest 14% growth in 2010, which is in excess of our 10% forecast2010 capex budgets announced up to date
E&P capex budget announcements thus far
2009E 2010E % Chg.
North America E&P Capex
Berry Petroleum $132 $240 82%
Chesapeake(1) 3,388 4,688 38%
Cabot Oil & Gas 600 585 (3%)
Chevron 3,600 4,100 14%
ConocoPhillips 3,300 4,100 24%
Devon 3,300 3,925 19%
EXCO Resources 400 471 18%
Frontier Oil 190 100 (47%)
Hess 1,125 1,700 51%
Husky Energy 1,485 1,770 19%
Mariner Energy 575 660 15%
Pioneer Natural Resources 300 850 183%
SandRidge Energy 767 750 (2%)
Southwestern Energy 1,800 2,100 17%
Quicksilver Resources 400 390 (3%)
Total North American E&P capex $21,362 $26,429 24%
International E&P Capex
Chevron(2) $11,600 $13,200 14%
ConocoPhillips(3) 6,950 5,600 (19%)
Devon 1,300 1,325 2%
Ecopetrol 3,764 4,509 20%
Hess 1,935 2,150 11%
Husky Energy(4) 458 626 37%
Nexen(4) 1,458 1,501 3%
Pemex(4) 16,177 17,197 6%
Pertamina
(4) (5) 2,134 4,207 97%
TNK-BP 3,000 3,400 13%
Total International E&P capex $48,776 $53,715 10%
Total International E&P capex (ex-Conoco) $41,826 $48,115 15%
Global E&P capex $70,137 $80,144 14%
(1) Drilling and geophysical capex only.
(2) 2009 CVX international capex excludes $2.3 billion extenstion of concession payment which we view to be
non-activity related.
(3) ConocoPhillips is in the process of divesting a portion of its international assets making year-on-year comparisons difficult.
(4) 2009 based on average exchange rate that year and 2010 is based on spot exchange rate.
(5) Includes non-E&P capex.
Source: Company data, Platts, Goldman Sachs Research.
January 7, 2010 Americas: Energy: Oil Services

8/7/2019 GS Report OFS Jan 2010
http://slidepdf.com/reader/full/gs-report-ofs-jan-2010 29/37
Goldman Sachs Global Investment Research 29
Appendix 2: Stock performance
Exhibit 44: Oil services sub-sector performance for 2009 Exhibit 45: Individual stock performance for 2009
104%
94%
64%
56%
46%
31%
0%
20%
40%
60%
80%
100%
120%
Equipment Deepwater Land Dril lers Jackups Diversif iedServices
OSV
2009 Sub-sector Performance
0%
10%
20%
30%
40%
50%
60%
70%
80%
90%
100%
110%
120%
130%140%
150%
FTI
ATW
OIS
CAM T
S
PDE
DRC
NBR
NOV
HP
RIG D
O
WFT
HAL
BJS
SLB
HOS
RDC
ESV
PTEN
BHI
TDW S
II
2009 Stock Price Performance
Source: FactSet Source: FactSet
Exhibit 46: Oil Services sub-sector performance since trough (Mar 9, 2009) Exhibit 47: Stock performance since individual trough (Jan – Mar 2009)
134%
123%
108%
90%86%
71%
0%
20%
40%
60%
80%
100%
120%
140%
160%
Equipment Land Drillers Deepwater Jackups OSV DiversifiedServices
Performance since recent trough
0%
65%
130%
195%
260%
OIS T
S
ATW
CAM
PDE
BJS
FTI
NBR
PTEN
HOS
HAL
WFT
HP
SLB
RIG
RDC
ESV
DO
DRC
NOV
BHI
TDW S
II
Stock Performance since trough
Source: FactSet. Source: FactSet.
January 7, 2010 Americas: Energy: Oil Services

8/7/2019 GS Report OFS Jan 2010
http://slidepdf.com/reader/full/gs-report-ofs-jan-2010 30/37
Goldman Sachs Global Investment Research 30
Exhibit 48: Oil Services sub-sector performance since peak (July 2008) Exhibit 49: Stock performance since individual peak (May – Jul 2009)
(30%)
(35%)
(39%)
(44%)
(50%)(51%)
(60%)
(50%)
(40%)
(30%)
(20%)
(10%)
0%
Equipment Deepwater OSV Jackups Land Drillers Diversif iedServices
Performance since prior peak
(70%)
(60%)
(50%)
(40%)
(30%)
(20%)
(10%)
0%
TDW
DRC
CAM
FTI
DO
PDE
OIS
SLB
ATW T
S
HAL
BJS
HP
RIG
ESV
NOV
RDC
NBR
BHI
PTEN
HOS
WFT
SII
Stock Performance since prior p
eak
Source: FactSet. Source: FactSet.
Exhibit 50: Oil Services sub-sector upside to prior high (July 2008) Exhibit 51: Stock performance to individual highs (May – Jul 2008)
102%
81% 79%
57%
47%
118%
0%
20%
40%
60%
80%
100%
120%
DiversifiedServices
Land Drillers OSV Jackups Deepwater Equipment
Upside to prior peak
0%
40%
80%
120%
160%
200%
SII
WFT
HOS
PTEN
BHI
NBR
RDC
NOV
ESV
RIG H
P
BJS
HAL
TS
ATW
SLB
OIS
PDE
DO
FTI
CAM
DRC
TDW
Upside to prior peak
Source: FactSet. Source: FactSet.
January 7, 2010 Americas: Energy: Oil Services
A di S k i f hil I Li
8/7/2019 GS Report OFS Jan 2010
http://slidepdf.com/reader/full/gs-report-ofs-jan-2010 31/37
Goldman Sachs Global Investment Research 31
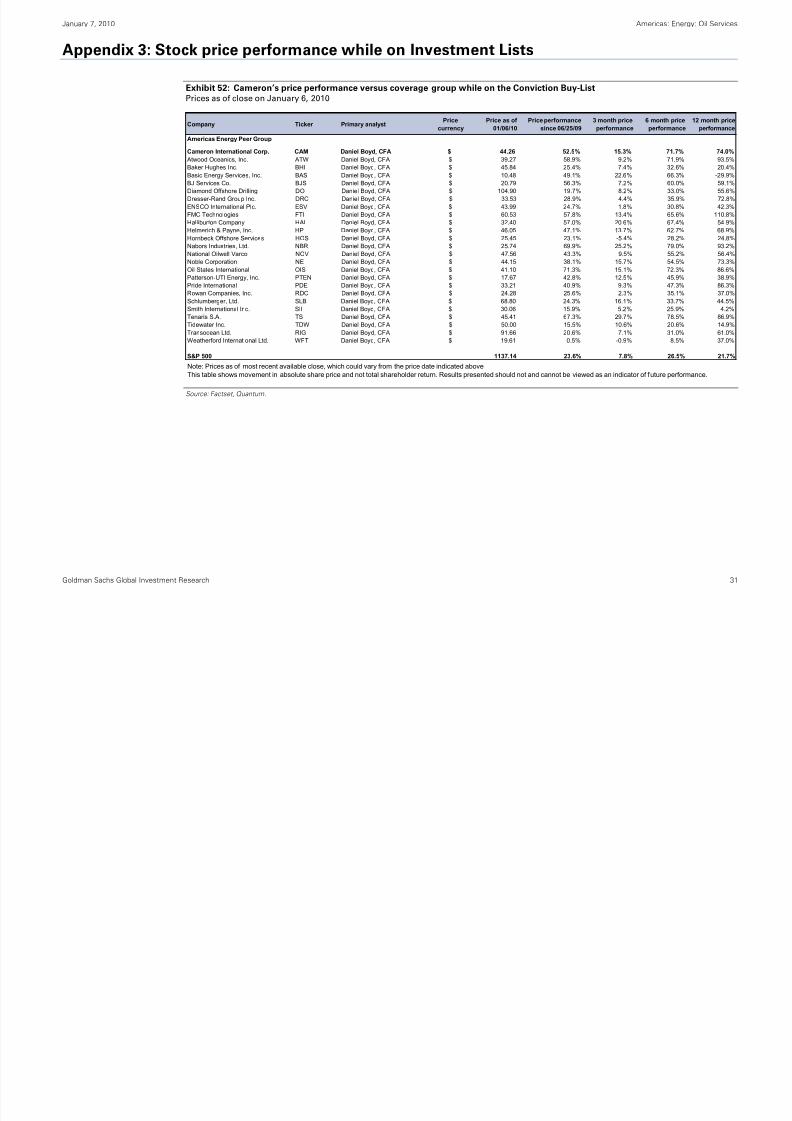
Appendix 3: Stock price performance while on Investment Lists
Exhibit 52: Cameron’s price performance versus coverage group while on the Conviction Buy-ListPrices as of close on January 6, 2010
Company Ticker Primary analystPrice
currency
Price as of
01/06/10
Price performance
since 06/25/09
3 month price
performance
6 month price
performance
12 month price
performance
Americas Energy Peer Group
Cameron International Corp. CAM Daniel Boyd, CFA $ 44.26 52.5% 15.3% 71.7% 74.0%
Atwood Oceanics, Inc. ATW Daniel Boyd, CFA $ 39.27 58.9% 9.2% 71.9% 93.5%
Baker Hughes Inc. BHI Daniel Boyd, CFA $ 45.84 25.4% 7.4% 32.6% 20.4%
Basic Energy Services, Inc. BAS Daniel Boyd, CFA $ 10.48 49.1% 22.6% 66.3% -29.9%
BJ Services Co. BJS Daniel Boyd, CFA $ 20.79 56.3% 7.2% 60.0% 59.1%
Diamond Offshore Drilling DO Daniel Boyd, CFA $ 104.90 19.7% 8.2% 33.0% 55.6%
Dresser-Rand Group Inc. DRC Daniel Boyd, CFA $ 33.53 28.9% 4.4% 35.9% 72.8%
ENSCO International Plc. ESV Daniel Boyd, CFA $ 43.99 24.7% 1.8% 30.8% 42.3%
FMC Technologies FTI Daniel Boyd, CFA $ 60.53 57.8% 13.4% 65.6% 110.8%Halliburton Company HAL Daniel Boyd, CFA $ 32.40 57.0% 20.6% 67.4% 54.9%
Helmerich & Payne, Inc. HP Daniel Boyd, CFA $ 46.05 47.1% 13.7% 62.7% 68.9%
Hornbeck Offshore Services HOS Daniel Boyd, CFA $ 25.45 23.1% -5.4% 28.2% 24.8%
Nabors Industries, Ltd. NBR Daniel Boyd, CFA $ 25.74 69.9% 25.2% 79.0% 93.2%
National Oilwell Varco NOV Daniel Boyd, CFA $ 47.56 43.3% 9.5% 55.2% 56.4%
Noble Corporation NE Daniel Boyd, CFA $ 44.15 38.1% 15.7% 54.5% 73.3%
Oil States International OIS Daniel Boyd, CFA $ 41.10 71.3% 15.1% 72.3% 86.6%
Patterson-UTI Energy, Inc. PTEN Daniel Boyd, CFA $ 17.67 42.8% 12.5% 45.9% 38.9%
Pride International PDE Daniel Boyd, CFA $ 33.21 40.9% 9.3% 47.3% 86.3%
Rowan Companies, Inc. RDC Daniel Boyd, CFA $ 24.28 25.6% 2.3% 35.1% 37.0%
Schlumberger, Ltd. SLB Daniel Boyd, CFA $ 68.80 24.3% 16.1% 33.7% 44.5%
Smith International Inc. SII Daniel Boyd, CFA $ 30.06 15.9% 5.2% 25.9% 4.2%
Tenaris S.A. TS Daniel Boyd, CFA $ 45.41 67.3% 29.7% 78.5% 86.9%
Tidewater Inc. TDW Daniel Boyd, CFA $ 50.00 15.5% 10.6% 20.6% 14.9%Transocean Ltd. RIG Daniel Boyd, CFA $ 91.66 20.6% 7.1% 31.0% 61.0%
Weatherford International Ltd. WFT Daniel Boyd, CFA $ 19.61 0.5% -0.9% 8.5% 37.0%
S&P 500 1137.14 23.6% 7.8% 26.5% 21.7%
Note: Prices as of most recent available close, which could vary from the price date indicated aboveThis table shows movement in absolute share price and not total shareholder return. Results presented should not and cannot be viewed as an indicator of future performance.
Source: Factset, Quantum.

8/7/2019 GS Report OFS Jan 2010
http://slidepdf.com/reader/full/gs-report-ofs-jan-2010 32/37

8/7/2019 GS Report OFS Jan 2010
http://slidepdf.com/reader/full/gs-report-ofs-jan-2010 33/37
8/7/2019 GS Report OFS Jan 2010
http://slidepdf.com/reader/full/gs-report-ofs-jan-2010 34/37

8/7/2019 GS Report OFS Jan 2010
http://slidepdf.com/reader/full/gs-report-ofs-jan-2010 35/37
8/7/2019 GS Report OFS Jan 2010
http://slidepdf.com/reader/full/gs-report-ofs-jan-2010 36/37

8/7/2019 GS Report OFS Jan 2010
http://slidepdf.com/reader/full/gs-report-ofs-jan-2010 37/37